communications at , k and v bands i t - semantic … · 2 ieee communications surveys &...
TRANSCRIPT

IEEE Communications Surveys & Tutorials • Third Quarter 20042
n the past decade, new and demanding satellite applica-tions evolved, leading to spectral congestion of the con-ventional frequency bands allocated for satellite services,
namely L (1/2GHz), S (2/4GHz), and C (4/6GHz). Amongthe recent developments in the satellite industry, one cansingle out the proliferation of VSAT/USAT (very/ultrasmall aperture terminals) systems destined primarily fordata applications, the provision of direct-to-home (DTH)services by Direct Broadcast Satellite (DBS) systems, andthe extension of satellite communications to non-geosta-tionary (NGSO) orbit constellations. All the above systems,including the conventional geostationary (GSO) satellitesystems belonging to the Fixed Satellite Service (FSS),gradually tend to employ higher frequency bands to satisfythe growing capacity requirements. Therefore, besidesoperation at the Ku band (12/14GHz), the Ka band(20/30GHz) and the V band (40/50GHz) have been investi-gated or even adopted in satellite systems recently put intooperation.
However, crossing the 10GHz frequency limit gives rise tosignal fading due to physical phenomena related to the propa-gation of radiowaves through the atmosphere [1]. The fademargin, that is, the system gain insuring the necessary Qualityof Service (QoS) against various transmission and otherimpairments, must be significantly increased to compensatefor the severe signal fading occurring at frequencies above10GHz. The larger fade margins required are not feasibleeither technically or economically. Under these conditions, itis more difficult for satellite systems to satisfy the availability
and QoS specifications recommended by the Radiocommuni-cations Sector of the International TelecommunicationsUnion (ITU-R) [2].
To make operation of modern satellite systems feasible atfrequencies above 10GHz, an appropriate fade mitigationtechnique (FMT) must be adopted. Apart from satisfyingavailability and QoS specifications, enhancing a satellite sys-tem with a FMT leads to realistic fade margins both economi-cally and technically.
The purpose of this article is to overview the latest devel-opments of FMTs for satellite communication systems operat-ing in the 10GHz to 50GHz spectral region. Specifically,FMTs are categorized with respect to their applications andinvestigated with emphasis on modeling, prediction methods,experimental work done in the past, and future trends. Thearticle also discusses the physical phenomena concerning thepropagation of radiowaves through the atmosphere at the fre-quency bands under consideration, as well as how they aremodeled in the recent literature.
PROPAGATION PHENOMENA AND MODELING
The propagation phenomena concerning earth-space linksmainly originate in the troposphere and the ionosphere.Respectively, propagation effects are separated into two cate-gories [3]: ionospheric effects, influencing systems operatingbelow 3GHz, and tropospheric effects, influencing systemsoperating above 3GHz. Since this article deals only with the
I
S U R V E Y SI E E E C O M M U N I C A T I O N S
T h e E l e c t r o n i c M a g a z i n e o f O r i g i n a l P e e r - R e v i e w e d S u r v e y A r t i c l e s
ATHANASIOS D. PANAGOPOULOS, PANTELIS-DANIEL M. ARAPOGLOU, AND PANAYOTIS G. COTTIS,NATIONAL TECHNICAL UNIVERSITY OF ATHENS
ABSTRACTThis article surveys the alternative fade mitigation techniques for satellite
communication systems operating at Ku, Ka and V frequency bands. The specificphenomena influencing the propagation of radiowaves on Earth-space links are alsooverviewed. Emphasis is placed on modeling, experimental work carried out in the
past, and practical implementations related to each mitigation technique.
SATELLITE COMMUNICATIONS ATKU, KA, AND V BANDS:
PROPAGATION IMPAIRMENTS ANDMITIGATION TECHNIQUES
THIRD QUARTER 2004, VOLUME 6, NO. 3
www.comsoc.org/pubs/surveys

IEEE Communications Surveys & Tutorials • Third Quarter 2004 3
frequency spectrum above 10GHz, it will focus on the tropo-spheric effects. The most important tropospheric phenomenaaffecting satellite communication systems at frequencies above10GHz are summarized as follows.
Attenuation Due to Precipitation: When propagatingthrough rain, snow, hail, or ice droplets, radiowaves sufferfrom power loss due to hydrometeor scattering (Fig. 1).Although hydrometeor scattering is the major limiting factorin the EHF band (>30GHz), hydrometeor absorption is thedominant phenomenon causing power loss in the lower spec-tral part between 10GHz and 30GHz. The combined effect ofhydrometeor scattering and absorption results in a power lossproportional in dB to the square of the frequency [4]. Thisconstitutes the main disadvantage of operating at the Ku, Ka,or V frequency bands. As far as satellite systems are con-cerned, the depth of rain fades also depends on the elevationand polarization angles. On the other hand, as rain attenua-tion depends unfavorably on the rainfall rate and the raindropsize distribution, it affects heavily tropical and subtropicalregions. An indicative picture of rain fades is obtained fromFig. 2, which illustrates a typical fade incident with a peakvalue of 14dB. A variety of models exists for the prediction ofthe average rain attenuation on an annual basis: Rec. ITU-RP.618-7 [5], Leitao-Watson [6], Lin [7], Morita and Higuti [8],
and the EXCELL [9] model, all of them performing satisfac-torily on a global scale. The methodology usually followed tohandle propagation phenomena involves the representation ofthe fade depths as a function of time percentage and results incalculating the time occurrence of outages for a given attenu-ation level. For example, in Fig. 3 the ITU-R model predict-ing the annual exceedance probability of rain attenuation isimplemented for the downlink frequency of the bands underconsideration, and for a hypothetical satellite link operating inAthens, Greece.
Gaseous Absorption: Besides hydrometeor absorption,gaseous absorption, mostly from oxygen and water vapor, con-tributes to the total attenuation of radiowaves, especially inthe case of low elevation angles. However, the contribution ofgaseous absorption to the total attenuation is small comparedto the attenuation due to rain. In Fig. 4 the frequency depen-dence of oxygen and water vapor absorption is presented interms of specific attenuation. One may observe that watervapor is the main contributor to gaseous attenuation in thefrequency range just below 30GHz due to a maximum occur-ring at 22.5GHz. Moreover, other maxima that occur at183GHz, 320GHz for water vapor and at 60GHz, 119GHz foroxygen absorption lie outside the spectral region consideredin this article. The attenuation due to oxygen absorptionexhibits an almost constant behavior for different climatic
nnnn FIGURE 1. A satellite slant path affected by propagation impair-ments.
nnnn FIGURE 2. Typical picture of attenuation fluctuations due to rainand scintillations.
Time (hour)16
0
2
Att
enua
tion
(dB
)
4
6
8
10
12
14
17 1815141312111098
nnnn FIGURE 3. Rain attenuation vs. percentage of total time for asatellite link operating in Athens, Greece (elevation angle = 30°,vertical polarization).
Percentage of total time
10.010
5
Att
enua
tion
due
to
rain
(dB
)
10
15
20
25
30
35
40
45
50
0.1 10
Ku band downlink frequency (12GHz) Ka band downlink frequency (20GHz) V band downlink frequency (40GHz)
nnnn FIGURE 4. Specific attenuation vs. frequency [12]. Curve A:mean global reference atmosphere 7.5gr/m3; curve B: dry atmo-sphere.
Frequency, f(GHz)
010-3
10-2
52
Spec
ific
att
enu
atio
n (
dB/
km)
10-1
52
152
1052
102
52
103
52
104
52
52
105
100 200 300 400 500 600 700 800 900 1000
A
B

IEEE Communications Surveys & Tutorials • Third Quarter 20044
conditions, whereas the attenuation due to water vapor varieswith temperature and absolute humidity. A complete methodfor calculating gaseous attenuation is given in Annex 1 of Rec.ITU-R P.676-4 [10].
Cloud Attenuation: The liquid water content of clouds isthe physical cause of cloud attenuation. Prediction models forthis particular attenuation factor have been developed withinthe framework of ITU-R [11] and elsewhere [12]. Figure 5depicts attenuation values due to clouds and fog exceeded fora certain range of probabilities. The ITU-R model was select-ed as the underlying prediction method for generating thesecurves, which correspond to the three frequency bands exam-ined in this survey.
Melting Layer Attenuation: At a certain height aboveground level, called the effective rain height, snow and iceprecipitation are converted into rain precipitation. The regionaround this height is called the melting layer. During periodsof light rain and for low elevation angles, the melting layercontributes significantly to the total slant path attenuation, asverified by the relevant prediction model [13].
Sky Noise Increase: As attenuation increases, so doesemission noise (see Rec. ITU-R P.618-7). The same factorspreviously mentioned, i.e. scatter/emission from precipitationhydrometeors, contribute to noise increase, which is moreimportant than attenuation when earth stations with low noisefront ends are considered.
Signal Depolarization: Differential phase shift and differ-ential attenuation caused by nonspherical scatterers (e.g.,raindrops and ice crystals) cause signal depolarization.Although this phenomenon does not affect single polarizedsatellite systems, its effect becomes significant for systemsreusing frequency by transmitting two orthogonally polarizedsignals for optimum RF spectrum utilization. In this case,depolarization results in cross-polar interference, i.e. part ofthe transmitted power in one polarization interferes with theorthogonally polarized signal [14, 15]. In Fig. 6 the relevantITU-R method [5] has been employed to demonstrate thelong-term statistics of hydrometeor induced cross-polariza-tion in the Athens, Greece area. The cross-polarization dis-crimination (XPD) not exceeded for various percentages oftime is shown only at the Ku and Ka bands, since validityissues arise for the proposed model at frequencies above35GHz.
Tropospheric Scintillations: Variations in the magnitudeand the profile of the refractive index of the troposphere lead
to amplitude fluctuations known as scintillations. These fluc-tuations increase with frequency and depend upon the lengthof the slant path decreasing with the antenna beamwidth.Amplitude fluctuations are also accompanied by a phase fluc-tuation. Returning to Fig. 2, apart from the apparent singlefade event, the fluctuations on the received signal are obvious.Models estimating the effects of scintillations on the receivedsignal can be found in [5, 16] and [17].
Intersystem Interference: Interference may occur betweena satellite system and terrestrial systems, or between twosatellite systems whenever a frequency band is shared oradjacent orbital positions are used. During clear sky condi-tions, intersystem interference is mainly caused by the side-lobes of the antennas and is reflected on the clear skycarrier-to-interference ratio (C/I)nom. However, from thepropagation impairments perspective, intersystem interfer-ence is aggravated by potential differential rain attenuation,∆A, whenever the desired signal undergoes a large rainattenuation, while at the same time the undesired signalfrom an adjacent satellite experiences a lower level of atten-uation [18–22]. In this case, the carrier-to-interference ratiomust be properly modified to account for the effect of rainas follows
where AC, AI (expressed in dB) are the rain attenuation val-ues on the intended and the interfering satellite path, respec-tively. To evaluate the time occurrence of such an event, i.e.the percentage of total time the C/I is not exceeded due todifferential rain attenuation, the methodology described in[18] yields the results presented in Fig. 7. In this figure, opera-tion under (C/I)nom = 25dB and an aperture angle of 2°between the two satellites are assumed. Furthermore, to gen-erate the three curves, a fade margin equal to 15dB has beenadopted.
To conclude, several ITU-R Recommendations exist forthe prediction of the effects of most of the propagation phe-nomena. The methods recommended are widely used, easy toapply, and agree satisfactorily with experimental results in var-ious geographical regions. Still, due to the rare propagation
CI
CI
ACI
A Anom nom
c I=
− =
− −∆ ( )
nnnn FIGURE 5. Cloud plus fog attenuation vs. percentage of totaltime for a satellite link operating in Athens, Greece (elevationangle = 30°).
Percentage of total time
0.10
0.2
Att
enu
atio
n d
ue
to c
lou
ds
and
fo
g (
dB)
1 10 100
0.4
0.6
0.8
1
1.2
1.4
1.6
1.8Ku band downlink frequency (12GHz) Ka band downlink frequency (20GHz) V band downlink frequency (40GHz)
nnnn FIGURE 6. Cross-polarization vs. percentage of total time for asatellite link operating in Athens, Greece (elevation angle = 30°,vertical polarization).
Percentage of total time
0.10.00125
30.
Cro
ss-p
olar
izat
ion,
XPD
(dB
)
35
40
45
50
0.01 1
Ku band downlink frequency (12GHz) Ka band downlink frequency (20GHz)

IEEE Communications Surveys & Tutorials • Third Quarter 2004 5
measurements above 30GHz, the validity of only a few propa-gation models presented above has been tested.
PREDICTION OF COMBINED PROPAGATION EFFECTS
Although prediction models for specific propagation phenom-ena perform satisfactorily, the simultaneous occurrence ofsuch phenomena, a strong possibility at the Ka band andabove [23], imposes the use of prediction models that takeinto account the combined effect of attenuation factors. Themain problem encountered by researchers is the extent ofinterdependence between separate propagation effects. Forexample, the melting layer is associated with low intensityrain, while gaseous absorption increases during rain eventsdue to the increased water vapor content in the atmosphere[24].
Until recently, two different modeling approaches havebeen considered. The first approach considers all attenuationeffects as being correlated, i.e. the total attenuation is givenby
Atot = AO2 + AH2O + AC + AR + AML + AS
where AO2 , AH2O , AC , AR , AML , and AS stand for the attenua-tion due to oxygen, water vapor, cloud, rain, melting layer,and scintillation, respectively.
The second approach treats attenuation effects as beingpartially uncorrelated; therefore, RMS summing is adoptedfor the total attenuation:
A combination method that reflects the interdependenceof the various attenuation factors better considers some of thepropagation effects uncorrelated [5, 25]. The correspondingITU-R recommendation adopts the following formula:
Finally, a propagation model taking into account thecomplex refractive index of the neutral atmosphere predict-ing path loss and delay for frequencies up to 1THz has beendeveloped [26]. The contributions from dry air, haze, fog,
clouds, and rain are incorporated. This model can be uti-lized for radio communications and remote sensing applica-tions.
FADE MITIGATION TECHNIQUES
The majority of the atmospheric phenomena discussed in theprevious section exhibit a stochastic behavior both in time andspace and, therefore, differ from all other deterministic fac-tors (e.g., free space loss) that affect the satellite link underclear sky link conditions. Since propagation impairments havea significant impact only for less than one percent of the timeduring a year, the system gain must be enhanced through anadditional fade margin carefully estimated to satisfy thedesired availability and QoS specifications.
For a satellite system, availability is defined as the timepercentage in a year during which the bit error ratio (BER)is lower than a certain threshold, beyond which an outage ofthe system occurs [27], whereas the fade margin is properlydefined as the difference in dB between the precipitationinduced attenuation leading to an outage and the attenua-tion under clear sky conditions. To elaborate on the conceptof availability, Fig. 8 illustrates the conversion from the rainattenuation distribution shown in Fig. 3 to the correspond-ing BER distribution, assuming a clear sky bit energy tonoise power density ratio Eb/N0 of 12dB and a QPSK modu-lation scheme. From Fig. 8 it is deduced that if, for exam-ple, a BER threshold higher than 10 –7 renders the systemunavailable, the outage percentage for this specific satellitelink will be 0.060 percent at the Ku band, 0.096 percent atthe Ka band, and 0.205 percent at the V band. In terms ofmin/year this event takes place, the corresponding outagetimes are 315.4min/year, 504.6min/year, and 1077.5min/year,respectively.
However, for satellite systems operating above 10GHz ingeographical regions characterized by heavy rainfall, thesimultaneous occurrence of different attenuation causes isstrongly possible and, consequently, the fade margin requiredis large. Therefore, the use of a fade mitigation technique [28]to permit operation under lower fade margins is imperative.
Based on the different design approaches concerning miti-
A A A A A Atot O H O C R S= + + +( ) +2 2
2 2
A A A A A A Atot O H O C R ML S= + + + + +2 2
2 2 2 2 2 2
nnnn FIGURE 7. Carrier-to-interference ratio vs. percentage of totaltime for a satellite link operating in Athens, Greece (elevationangle = 30°, (C/I)nom = 25 dB, aperture angle between the ser-vicing and interfering satellite = 2°, fade margin = 15dB).
Percentage of total time10.001
23
23.2
Car
rier
-to-
inte
rfer
ence
rat
io (
dB)
23.4
23.6
23.8
24
24.2
24.4
24.6
24.8
25
0.10.01 10
Ku band downlink frequency (12GHz) Ka band downlink frequency (20GHz) V band downlink frequency (40GHz)
nnnn FIGURE 8. BER vs. percentage of total time for a satellite linkoperating in Athens, Greece (elevation angle = 30°, verticalpolarization, Eb/N0 = 12dB).
Percentage of total time0.10.01
10-7
10-8
BER
10-6
10-5
10-4
10-3
10-2
1
Ku band downlink frequency (12GHz) Ka band downlink frequency (20GHz) V band downlink frequency (40GHz)

IEEE Communications Surveys & Tutorials • Third Quarter 20046
gation of signal impairments due to atmospheric propagation,FMTs can be classified into three major categories:• EIRP control techniques• Adaptive transmission techniques• Diversity protection schemes
Despite their differences, to maximize link availabilitysome of the above FMTs usually perform the following seriesof common functions [29]:a) Observe/monitor link quality by performing continuous
measurements of propagation conditions.b) Provide a short-term estimation/prediction of the behav-
ior and the relevant duration of the next state of thesatellite channel.
c) Set/change the parameters of the system based on theabove short-term estimate.Considering the above repetitive procedure, (a) can be car-
ried out by measuring BER at the output of the receiver, fromwhich the corresponding Eb/N0 is calculated. This indirectmethod of impairment detection requires the observation of asufficient number of errors before determining the fade level.This imposes extra time delays before implementing mitiga-tion. Another drawback of this indirect method is that theBER increases very abruptly when the propagation conditionsdeteriorate. Therefore, the use of direct estimation of fadesthrough carrier-to-noise measurements seems to be more suit-able for propagation impairment detection.
On the other hand, real-time estimation of fades is a farmore difficult task due to the random nature of the variousphysical phenomena. This happens because all the previousprediction models, combined or not, refer to long-term andyearly averaged statistics. As a result, the current trend con-cerning the prediction algorithms for the behavior of satellitechannels is the use of specific fade characteristics such as fadedepth, slope, duration or fade envelope, and fading rate incombination with appropriate sampling of measured data. Forfurther information on the dynamic characteristics of rainfades the reader is referred to [30–35] and to the recentlyreleased ITU-R recommendation P.1623 [36]. A crucial aspectduring real-time estimation of the attenuation during the nextstate of the channel is the ability to distinguish the differentpropagation impairments, so that the control algorithmresponds accordingly to each of them. In this course, frequencydomain separation (or frequency decomposition) of propaga-tion factors can be effectively employed, based on the factthat lower frequency components of the attenuation powerspectrum are associated with gaseous absorption, mid fre-quencies with clouds and rain, and higher frequencies withscintillations. Thus, the necessary separation is achievedthrough appropriate filtering [37].
Furthermore, in many of the proposedshort-term prediction models, some kind offrequency scaling is incorporated. Frequencyscaling [5, 38] is applied whenever the raininduced attenuation is measured at a fre-quency different than the frequency of thecommunication link under consideration. Acharacteristic application of frequency scal-ing is when measurements of a downlinkbeacon signal are used to predict the rainattenuation on the uplink.
Frequency scaling and all the other oper-ations mentioned above for thedetection/estimation of fades are usuallyincorporated in a control loop, similar to theone presented in Fig. 9, obtained from [39].Although the operation of the systemdescribed in [39] takes place at the Ka band,
a 12.5GHz beacon signal is used to predict the fade depth.The beacon signal is first lowpass filtered (frequency domainseparation) to separate scintillations from rain fades. Theneach component of the 12.5GHz signal is scaled to the corre-sponding Ka band frequency so that a prediction for eachphenomenon can be made.
EIRP CONTROL TECHNIQUES
EIRP (effective isotropic radiated power) is the product ofthe transmitted power and the antenna gain, usually expressedin dBw. EIRP control consists of varying either the carrierpower or the antenna gain in order to compensate for thepower losses due to propagation effects. The adjustment ofthe carrier power can be accomplished either at the earth sta-tion (uplink power control (ULPC)) or on-board the satellite(downlink power control (DLPC)), called earth station EIRPcontrol or satellite EIRP control, respectively. The advantagesand disadvantages of both techniques will be reviewed in alater section. Moreover, the adjustment of the antenna gaincarried out on-board the satellite, a technique referred to asspot beam shaping (SBS), may be viewed as another type ofsatellite EIRP control.
In principle, power control may be implemented in twoways:• As an open loop power control system, in which the trans-
mitted power is adjusted based on measurements ofrecently received power either from a pilot frequency orfrom the information signal itself.
• As a closed loop power control system, in which the trans-mitted power is adjusted based on reported power mea-surements over the channel.In closed loop power control systems the transmitter (earth
station or satellite) decides whether or not to vary the outputpower after receiving feedback information from the receiverand not based on estimates of the attenuation only. This theo-retically results in a much more comprehensive control sys-tem. In practice, however, when applied to satellite systemsthe closed loop system must cope with propagation delays oftwice the round trip time between the earth station and thesatellite for regenerative satellites, or four times the roundtrip time for transparent satellites. For GSO satellite systems,the propagation delay almost cancels the possibility of aclosed loop system responding to channel changes, particular-ly since the most aggravating atmospheric phenomena (deeprain fades, scintillations) have short durations.
Uplink Power Control — ULPC [40, 41] is achieved by vary-
nnnn FIGURE 9. FMT control loop flow chart in [39].
Fade predictor
FIFO-2 samples
12.5GHz beacon signal
Filter
Fade slope
Frequency scaling
of rain fade
1 second ahead rain
fade prediction
Standard deviation
FIFO-21 samples
Frequency scaling
of scintillation*
1.96

IEEE Communications Surveys & Tutorials • Third Quarter 2004 7
ing the transmit power of an earth station in order to keep theflux density at the satellite input from falling below a certainlevel. Adopting the open loop principle for the rest of thissection, the adjusting of the high power amplifier (HPA) ofthe earth station is based only on attenuation measurements,without resorting to any feedback from the receiver. In thecase of transparent satellite repeaters, the adjustment of thecarrier power from the transmitting earth station aims to con-trol both the uplink and downlink power levels, by compensat-ing not only for propagation impairments on the uplink, butalso possible propagation impairments on the downlink.
A possible problem caused by ULPC is adjacent channelinterference [42], when part of the energy of the satellite signalfalls into adjacent channels. When the control system predictsa deep fade in the next channel state, the HPA output back-off(i.e. the margin between the operation point and the satura-tion point) is decreased to compensate for the uplink attenua-tion. The result is the partial restoration of the sidelobes ofthe signal spectrum and the creation of interference into adja-cent channels.
Adjacent satellite interference is a type of intersystem inter-ference due to ULPC. The rapid growth of satellite communi-cations in the past two decades has led to congestion on thegeostationary orbit, where the majority of commercial satellitesystems exist. Nowadays, satellites are separated by 2–3degrees on the geostationary orbit and, therefore, an increaseof an earth station transmit power may impair the operationof adjacent satellite systems.
Despite the drawbacks mentioned above, ULPC consti-tutes an effective countermeasure against signal fading and ispreferred today by many satellite operators. Its main prerequi-site is the availability of extra back-off under clear sky condi-tions, so that the margin necessary for ULPC under fadingconditions may be provided.
Downlink Power Control — DLPC [43] is achieved byincreasing the transmit power of a satellite. Unlike ULPC, itis very difficult to implement DLPC due to limitations relatedto the satellite size and weight, as well as to the limited abilityof controlling the satellite operation. Specifically, the satellitesize and weight limit the use of TWTA (traveling wave tubeamplifiers), which must operate at a small output back-off.Apart from the possible adjacent channel interference, DLPCmay also create intermodulation interference [42], a type ofinterference caused by intermodulation products generated bythe nonlinear amplification of multiple carriers. The choice ofthe multiple access scheme is significant, with single-carrier-per-transponder TDMA (Time Division Multiple Access) sys-tems being less affected. This tolerance to interference is oneof the main reasons why TDMA schemes have become prefer-able in recent years compared to FDMA (Frequency DivisionMultiple Access) schemes.
Finally, DLPC also contributes to intersystem interference.A significant increase of satellite power to overcome severesignal degradations could create interference with spectrallyoverlapping terrestrial networks as local multipoint distribu-tion systems and violate the regulations concerning power fluxdensity. This drawback of DLPC is even more pronouncedwhen the adaptive control loop allocates the extra power inef-fectively due to the occurrence of false alarms or its applica-tion longer than required.
Spot Beam Shaping — When the service area of a GSOsatellite is confined within a country or a certain geographicalregion, the coverage is provided by spot beams, so that there isno waste of satellite EIRP and the spectrum is efficientlyused. A spot beam produces a higher satellite EIRP than a
global one, since the antenna beamwidth reduction increasesits gain.
The SBS technique consists of appropriately shaping thesatellite antenna pattern so that the power received on theground remains nearly constant, even under rainfall condi-tions. In a study conducted by the European Space Agency(ESA) [44], a multi-feed antenna with a beam forming net-work and a Cassegrain antenna with a single feed and twoshaped reflectors were evaluated as possible solutions forimplementing SBS. The conclusion of this study is that thefirst solution is more flexible and allows higher adaptive gains.
A major advantage of SBS is that real-time or instanta-neous estimates of the attenuation, a requirement that consti-tutes the most difficult function of an FMT control loop, arenot needed since compensation is carried out over the entirecoverage area rather than for a single site. Short-term weatherpredictions termed as nowcasting and obtained through satel-lite imagery could be used in order to analyze the evolution ofthe meteorological situation and forecast the propagation con-ditions [45]. Another significant advantage of SBS comparedto power control is that compensation for rain attenuation isachieved by shaping the antenna pattern and not by reducingthe output back-off of the amplifiers. Thus, the undesirableeffects of intermodulation interference due to amplifier oper-ation near saturation are minimized.
The significant advantages of SBS indicate a wide interestin future satellite systems. Nevertheless, its use to date hasbeen limited because the relevant technology is immature andresearch is in its initial stages. Specifically, the use of largeactive antennas on-board the satellite and the feasibility ofreshaping spot beams without penalizing the global coverageare some of the imposed limitations. SBS is a subset of thewider concept of on-board processing (OBP) and its feasibilityis directly connected to the advancements in this specific field.OBP aims at enhancing the processing capabilities of satellitetransponders to provide user oriented services, such as nar-rowcasting/multicasting, TCP/IP, and point-to-point or point-to-multipoint services on demand. Thus, the additionalequipment intended for OBP contains on-boardmodulators/demodulators, a baseband switch to accommodateend user applications, and a system controlling the directionand the coverage of spot beams.
ADAPTIVE TRANSMISSION TECHNIQUES
Techniques belonging to this category focus on modifying themanner in which signals are processed/transmitted by thenodes of a satellite network (earth stations, satellites) whenev-er the link quality is degraded. The different types of signalprocessing are available to more than one earth station ondemand. Therefore, adaptive transmission techniques are con-sidered to be resource-shared FMTs. They can be further clas-sified into three categories: hierarchical coding (HC),hierarchical modulation (HM), and data rate reduction(DRR).
Hierarchical Coding — Coding is adopted by satellite sys-tems for the detection and correction of bit errors, by addingredundancy to the information signal. As the redundancyincreases, the error probability is decreased but, at the sametime, the bandwidth required also increases. Thus, error cor-rection coding may be seen as a trade-off between bandwidthand power requirements to achieve a certain error probability.
Considering the open and closed loop control alternatives,in many satellite communication applications the decodingprocedure is performed at the receiver without having toresort to any feedback from the transmitter. This type of error

IEEE Communications Surveys & Tutorials • Third Quarter 20048
correction coding is called FEC (forward error correction). Inanother type of error correction coding called ARQ (automat-ic repeat request), error detection and correction is achievedby retransmitting the erroneous blocks of bits. ARQ is widelyimplemented in satellite packet communications under themain limitation of the large propagation delays involved.Therefore, ARQ schemes are best suited for data applica-tions, as in the case of VSAT/USAT networks.
Error correcting codes were initially designed for useagainst randomly spaced errors, i.e. those caused by thermalnoise. However, after the emergence of satellite links operat-ing above 10GHz, where fading caused by precipitation isthe main reason for signal degradation, errors occur inbursts and not independently. Therefore, the availability of asatellite link can be preserved by varying the rate of codesmore resistant to bursts. A technique known as interleaving iseffective at minimizing the effect of burst errors by spread-ing each message in time [46]. The rationale behind thistechnique is to apply coding to the columns of a shift regis-ter arranged as a matrix and then transmit the coded wordrow-wise, so that after descrambling the errors are spreadand can be considered independent. However, interleavingproves efficient only against very short fades, particularlyagainst scintillation.
Whenever the link suffers from severe propagation impair-ments, more efficient coding schemes that may be employedwithin the scope of HC may originate from concatenatedcodes [46], i.e. combinations of block codes with convolution-al codes. For the rest of the time, a less complex codingscheme may be used. An example of concatenated codeswidely used in practice to combat error bursts is to combinethe Reed Solomon outer code and use convolutional codingas the inner code together with Viterbi decoding at thereceiver. Finally, a quite recent development in the area ofcoding is the parallel concatenated convolutional codes withinterleaving, widely known as turbo codes [46]. Despite thedecoding delay and computational complexity involved, thesignificant coding gain produced by turbo codes has drawnthe interest of satellite communications, even leading to thestandardization of these codes in small terminal satellite net-works.
Hierarchical Modulation — HM decreases the ratio Eb/N0required for a certain BER level by reducing the spectral effi-ciency (in bps/Hz) when the carrier-to-noise power ratio C/N
at the input of the demodulator decreases due to propagationeffects. During heavy rainfall events, HM techniques exchangespectral efficiency for power requirements, whereas the EIRPcontrol techniques previously examined react to this aggravat-ing situation by adjusting the carrier power.
The most commonly used modulation scheme in satellitecommunications is PSK (phase shift keying) modulation. Toobtain higher spectral efficiency, that is, to transmit morebits per second without requiring more RF bandwidth, HMemploys higher-order PSK schemes such as QPSK, 8-PSK, 16-PSK, and 64-PSK, leading to 4, 8, 16, and 64 phasestates, respectively. It is also possible to vary carrier phaseand amplitude simultaneously. The resulting type of modu-lation is called QAM (quadrature amplitude modulation).In general, as the order M of an M-ary PSK or M-ary QAMscheme increases, the spectral efficiency of the communica-tion link becomes higher. On the other hand, since the sep-aration between consecutive amplitude and/or phase statesis reduced, these higher-order modulation schemes becomemore susceptible to errors. As a result, a HM system utilizeshighly efficient modulation schemes such as 16-PSK, 64-PSK, or 256-QAM under clear sky conditions and morerobust modulation schemes such as BPSK or QPSK underheavy meteorological conditions [47]. A performance com-parison of three modulation schemes taking into accountthe annual rain attenuation is given in Fig. 10, where therelevant model in [27] is used. The percentages of outageconsidering a typical 10 – 3 voice circuit BER are 0.036 per-cent, 0.058 percent, and 0.073 percent for QPSK, 8-PSK,and rectangular 16-QAM, respectively. Figure 10 clearlyshows that it is almost impossible for a HM system underfading conditions to operate using higher-order modulationschemes, and that the transition to a lower modulation, suchas BPSK or QPSK, is necessary.
HM is preferably implemented as a closed loop FMT,where the receiving earth station communicates with thetransmitting station through a terrestrial return link in lowtransmission rates. For open loop HM, a modem that adaptsto the changing modulation orders must be available. In anycase, the use, if possible, of either closed loop or open loopHM is better suited for localized satellite systems such asVSAT systems, excluding its implementation in large gatewaystations.
Data Rate Reduction — This signal processing techniqueinvolves the reduction of the information data rate wheneverthe control system monitoring the next channel state foreseespossible deep fading. A DRR technique using this principle tocounteract propagation fading has been designed in theframework of the OLYMPUS project [47] and in a simulationof a Ka-band VSAT videoconferencing system [48]. In bothcases, the information data rate (2.048 Mb/s) under clear skyconditions is decreased by a factor of 2, 4, or 8 according tothe channel quality. The gain obtained from this data ratereduction in terms of the margin over the required Eb/N0 is3dB, 6dB, and 9dB, respectively. The bandwidth and the syn-chronization BER threshold at the receiver are kept constantby combining the information data rate with a pseudo-randomdata sequence of appropriate rate. This procedure results indata spreading with higher processing gains corresponding tohigher spreading factors.
The use of HC and HM in multiple access systems imposeslonger bursts in the same frame (TDMA), or larger band-width (FDMA) for the user utilizing the link most affected bypropagation impairments. Therefore, the rest of the usershave limited access to the shared resources of the FMT sys-tem (more efficient coding schemes, modulation of higher
nnnn FIGURE 10. BER vs. percentage of total time for a Ka bandsatellite downlink (20GHz) operating in Athens, Greece (eleva-tion angle = 30°, vertical polarization, Eb/N0 = 12dB).
Percentage of total time0.10.01
10-4
10-5
BER
10-3
10-2
10-1
100
1
QPSK 8-PSK 16-QAM

IEEE Communications Surveys & Tutorials • Third Quarter 2004 9
order). In contrast, the DRR results only in a decrease of therequired C/N ratio when the link experiences fading.
Although DRR exhibits the advantage of equally distribut-ing the satellite resources (bandwidth, burst length) to everyuser, its applicability depends on how services can tolerate asignificant reduction of information rate. For example, videoor data transmission can be carried out successfully since theydo not depend strongly on the information data rate, in whichcase the upper network layers are left unaffected, though thisis not the case for voice transmission.
DIVERSITY PROTECTION SCHEMES
Diversity protection schemes are countermeasures orientedagainst rain fades. As such, they constitute the most efficientFMTs, since rain induced attenuation is the main factor dete-riorating the availability and performance of a satellite linkoperating above 10GHz. The set of diversity techniques con-sists of site diversity (SD), orbital diversity (OD), frequencydiversity (FD), and time diversity (TD). The first two tech-niques take advantage of the spatial structure of the rainfallmedium, whereas FD and TD are based on the spectral andthe temporal dependence of rain, respectively.
There are two factors widely used to describe diversity per-formance: the diversity gain G and the diversity improvement I[49]. The former is defined as the difference between the sin-gle site attenuation (without diversity reception) and the jointattenuation (with diversity reception) both expressed in dB forthe same probability level. The latter is defined as the ratio ofthe single site exceedance probability to the joint one, for thesame attenuation value.
Site Diversity — Depending on the seasonal characteristicsand the location, rain takes the form of either stratiform rainor convective rain. In the case of stratiform rain, the rainfallrate ranges from low to medium and exhibits great spatialhomogeneity. On the other hand, convective rain consists ofraincells having a diameter of up to 5km, within which highrainfall rates occur. The raincells are surrounded by widerareas of stratiform rain. The inhomogeneity of rainfall withinthe raincells, where most of the fading occurs, leads to adecorrelation of the attenuation of signals following differentpaths. Consequently, if the signal is received via differentpaths, it is quite likely that a deep fade will occur only on oneof them, leaving the others less affected by it.
SD takes advantage of this characteristic of convective rainby engaging either two (double site diversity) or three (triplesite diversity) earth stations to ensure that the probability ofattenuation occurring simultaneously on the alternative earth-
space paths is significantly less than the relevant probabilityoccurring on either individual path. Then the signals receivedat each earth station are sent to a master station where theyare further processed based on a certain criterion (switchedcombining, selection combining, or maximal ratio combining)to improve the carrier-to-noise power ratio C/N [50]. Inswitched combining the switching procedure between the sta-tions occurs only when the C/N ratio at some station exceedsthe corresponding ratio at the other stations by more than thehysteresis margin. By selection combining the best C/N ratioat any time is selected, whereas the maximal ratio combiningsynthesizes the available signals in a weighted manner.
Experimental work on SD has been carried out since theearly 1970s, a fact that confirms the maturity and effectivenessof this technique. Furthermore, there exist many predictionmodels estimating the performance of a SD scheme. They areclassified into two major categories: empirical models andphysical models. The first category includes methods proposingsimple formulas with parameters that appropriately fit existingdata. Physical models are based on the understanding of thephysical mechanisms causing attenuation and use experimen-tal data for validation purposes only. Representative of thiscategory are the models proposed in [51–53].
The most important factor affecting the diversity gainoffered by SD systems is the separation distance D betweenthe earth stations (Fig. 11). Larger values of D result in sur-passing intense raincells producing diversity gains up to 30dB,a value that is the highest gain achieved by any FMT. Thedependence of a double SD system on the separation distanceD in terms of the exceeded BER is presented in Fig. 12 [27]for different values of D. QPSK modulation, operation at theKa band downlink frequency (20GHz), and clear sky Eb/N0 =12dB are assumed.
Orbital Diversity — Even though SD can be considered asthe most efficient diversity scheme from a technical perspec-tive, its cost effectiveness is under investigation given that SDrequires at least two earth station installations along with aterrestrial connection. This led to the development of orbitaldiversity (or satellite diversity) which allows earth stations tochoose between multiple satellites. Similarly to SD, OD alsoadopts a re-route strategy for the network and, therefore, canbe applied only for FSS [54].
nnnn FIGURE 11. Double-site diversity.
D
nnnn FIGURE 12. BER vs. percentage of total time for a Ka bandsatellite downlink operating in Athens, Greece (elevation angle= 30°, vertical polarization, Eb/N0 = 12dB).
Percentage of total time0.10.01
10-7
10-8
BER
10-6
10-5
10-4
10-3
10-2
1
Single siteDouble site (D=10km)Double site (D=20km)

IEEE Communications Surveys & Tutorials • Third Quarter 200410
OD is implemented more economically compared to SD,since switching and all the other diversity operations can becarried out in a single earth station, with backup satellitesalready considered in orbit. However, as far as the produceddiversity gain is concerned, the superiority of SD comes fromthe fact that the separation of the alternative slant paths isgreater than the separation found in OD systems. In fact, themain geometrical parameter affecting the performance of ODis the angular separation θ between the satellites (Fig. 13). Asmaller decorrelation of rain attenuation on the alternativeslant paths is obtained through OD systems compared to thedecorrelation achieved by SD systems with large values of theseparation distance D. This point was investigated by a recent-ly proposed model [55] that correlates the two basic geometri-cal parameters of SD and OD to obtain the optimum technicalsolution between the two diversity alternatives. Figure 14shows an application of this model and demonstrates the rela-tionship between D and θ so that SD and OD achieve thesame diversity gain.
Experimental data coming from OD experiments are farless than relevant data concerning SD systems. In this con-text, important information on OD performance resultedfrom experiments employing the GSO satellites SIRIO andOTS operating at the Ku frequency band [56] and thoseemploying the GSO satellites OLYMPUS and ITALSAToperating at the Ka frequency band [57]. Finally, among theprediction methods concerning the performance of OD, thesimple model proposed by Panagopoulos et al. [58] and theanalytical model proposed by Matricciani [59] should bestated.
Frequency Diversity — In general, as the frequency ofoperation increases, a satellite link suffers more from precip-itation (fading, scintillation, depolarization, etc). Therefore,since most satellites have available on-board repeaters oper-ating at various frequency bands, the lower bands may beutilized when deep fades occur. This technique, known asfrequency diversity (FD), employs the use of high frequencybands (Ka or EHF) during normal operation and switchesover to spare channels at lower frequency bands (C or Ku)when the attenuation due to rain exceeds a certain threshold[60]. To emphasize the possible gains that may be achievedby FD, Fig. 3 may be employed. An outage percentage of 0.1percent requires a fade margin of 19 dB for operation in theV band, while the corresponding fade margin required foroperation at the Ku band is only 2dB, resulting in a FD gainof 17dB.
Although for the implementation of FD the space segmentof a satellite system does not require any additional equip-
ment, specific RF hardware and an extra antenna must beprovided for every earth station. Another drawback in the useof FD is associated with capacity allocation. In the 20/30GHzband, large bandwidths are available, whereas at lower fre-quencies the capacity is limited, excluding services demandinglarge bandwidth.Time Diversity — TD is a relatively new FMT applicable toservices that can tolerate time delays, since it involves therepeated transmission of data corrupted by strong fading. Thedifference between TD and ARQ is that the former does notuse a fixed or random retransmission period. Instead, retrans-mission is related to the propagation phenomenon and isdetermined through an estimate of its duration. It is evidentthat the performance of a TD scheme is closely related tofade duration, and more specifically, to time intervals betweenfades. An illustration of the behavior of these parameters inan equatorial climate is given in [61], where it is pointed outthat the most damaging cases of fading (i.e. fades above10dB)exhibit an interfade interval between 4min and 8min. There-fore, the iterative procedure of TD must, in this case, operatewith a frame length less than this time period. Video ondemand, multimedia, and data applications can tolerate timedelayed repetitions and, therefore, are compatible with TD.
COMPARISON OFFADE MITIGATION TECHNIQUES
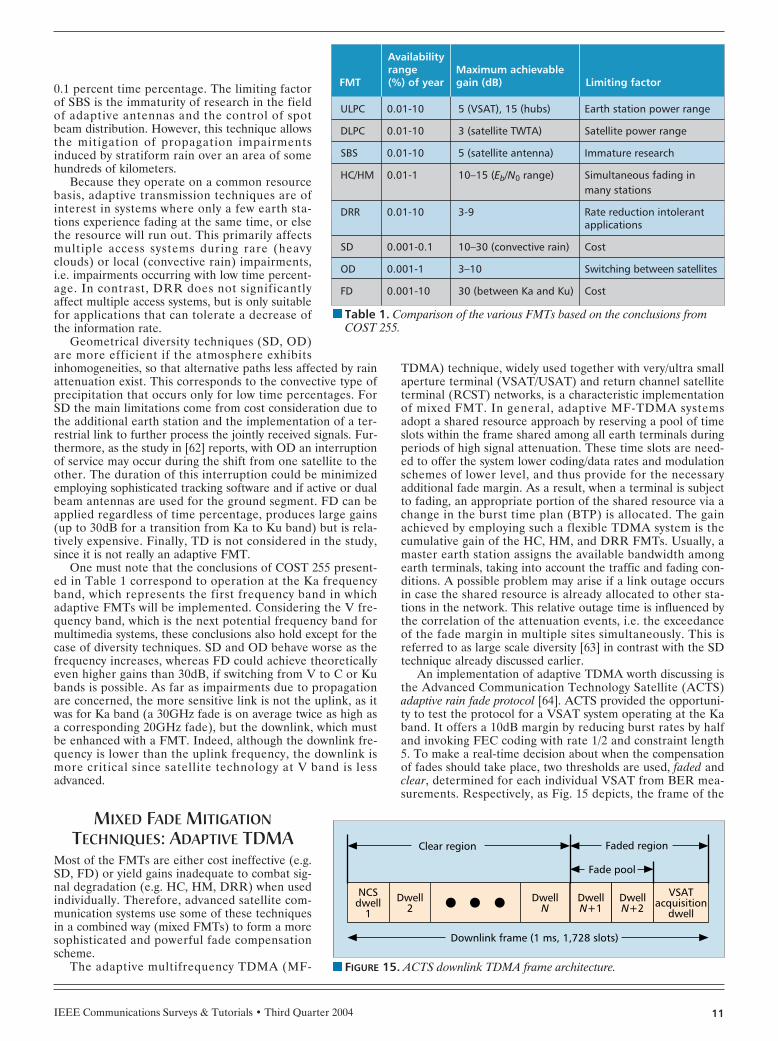
In the framework of the COST 255 campaign [62], some veryuseful conclusions were drawn about the FMTs presented inthe previous sections. Based on the results of this study, theseconclusions are summarized in Table 1, listing the availabilityrange of each FMT, the maximum gain in dB, and the mainlimiting factor for its implementation.
To elaborate on these conclusions, ULPC only adjusts theearth station power and, therefore, can be implemented formost of the time, resulting in a very flexible technique. Apartfrom the limitations of the satellite amplifier, the same is truefor DLPC. ULPC and DLPC are sufficient to counteract onlyfor a fraction of the total attenuation, such as weak precipita-tion and the effect of clouds, events that are bounded by the
nnnn FIGURE 13. Double-orbital diversity.
θ
nnnn FIGURE 14. Site separation D in SD vs. angular separation θ inOD yielding the same diversity gain for a satellite link operatingin Athens, Greece (elevation angle for SD = 30°, second eleva-tion angle for OD = 50°, rain fade depth = 8dB).
Angular separation in OD (deg)80 9020
2
2.5
Site
sep
arat
ion
in S
D (
km)
3
3.5
4
4.5
5
5.5
6
7060504030
Ku band downlink frequency (12GHz) Ka band downlink frequency (20GHz) V band downlink frequency (40GHz)
IEEE Communications Surveys & Tutorials • Third Quarter 2004 11
0.1 percent time percentage. The limiting factorof SBS is the immaturity of research in the fieldof adaptive antennas and the control of spotbeam distribution. However, this technique allowsthe mitigation of propagation impairmentsinduced by stratiform rain over an area of somehundreds of kilometers.
Because they operate on a common resourcebasis, adaptive transmission techniques are ofinterest in systems where only a few earth sta-tions experience fading at the same time, or elsethe resource will run out. This primarily affectsmultiple access systems during rare (heavyclouds) or local (convective rain) impairments,i.e. impairments occurring with low time percent-age. In contrast, DRR does not significantlyaffect multiple access systems, but is only suitablefor applications that can tolerate a decrease ofthe information rate.
Geometrical diversity techniques (SD, OD)are more efficient if the atmosphere exhibitsinhomogeneities, so that alternative paths less affected by rainattenuation exist. This corresponds to the convective type ofprecipitation that occurs only for low time percentages. ForSD the main limitations come from cost consideration due tothe additional earth station and the implementation of a ter-restrial link to further process the jointly received signals. Fur-thermore, as the study in [62] reports, with OD an interruptionof service may occur during the shift from one satellite to theother. The duration of this interruption could be minimizedemploying sophisticated tracking software and if active or dualbeam antennas are used for the ground segment. FD can beapplied regardless of time percentage, produces large gains(up to 30dB for a transition from Ka to Ku band) but is rela-tively expensive. Finally, TD is not considered in the study,since it is not really an adaptive FMT.
One must note that the conclusions of COST 255 present-ed in Table 1 correspond to operation at the Ka frequencyband, which represents the first frequency band in whichadaptive FMTs will be implemented. Considering the V fre-quency band, which is the next potential frequency band formultimedia systems, these conclusions also hold except for thecase of diversity techniques. SD and OD behave worse as thefrequency increases, whereas FD could achieve theoreticallyeven higher gains than 30dB, if switching from V to C or Kubands is possible. As far as impairments due to propagationare concerned, the more sensitive link is not the uplink, as itwas for Ka band (a 30GHz fade is on average twice as high asa corresponding 20GHz fade), but the downlink, which mustbe enhanced with a FMT. Indeed, although the downlink fre-quency is lower than the uplink frequency, the downlink ismore critical since satellite technology at V band is lessadvanced.
MIXED FADE MITIGATIONTECHNIQUES: ADAPTIVE TDMA
Most of the FMTs are either cost ineffective (e.g.SD, FD) or yield gains inadequate to combat sig-nal degradation (e.g. HC, HM, DRR) when usedindividually. Therefore, advanced satellite com-munication systems use some of these techniquesin a combined way (mixed FMTs) to form a moresophisticated and powerful fade compensationscheme.
The adaptive multifrequency TDMA (MF-
TDMA) technique, widely used together with very/ultra smallaperture terminal (VSAT/USAT) and return channel satelliteterminal (RCST) networks, is a characteristic implementationof mixed FMT. In general, adaptive MF-TDMA systemsadopt a shared resource approach by reserving a pool of timeslots within the frame shared among all earth terminals duringperiods of high signal attenuation. These time slots are need-ed to offer the system lower coding/data rates and modulationschemes of lower level, and thus provide for the necessaryadditional fade margin. As a result, when a terminal is subjectto fading, an appropriate portion of the shared resource via achange in the burst time plan (BTP) is allocated. The gainachieved by employing such a flexible TDMA system is thecumulative gain of the HC, HM, and DRR FMTs. Usually, amaster earth station assigns the available bandwidth amongearth terminals, taking into account the traffic and fading con-ditions. A possible problem may arise if a link outage occursin case the shared resource is already allocated to other sta-tions in the network. This relative outage time is influenced bythe correlation of the attenuation events, i.e. the exceedanceof the fade margin in multiple sites simultaneously. This isreferred to as large scale diversity [63] in contrast with the SDtechnique already discussed earlier.
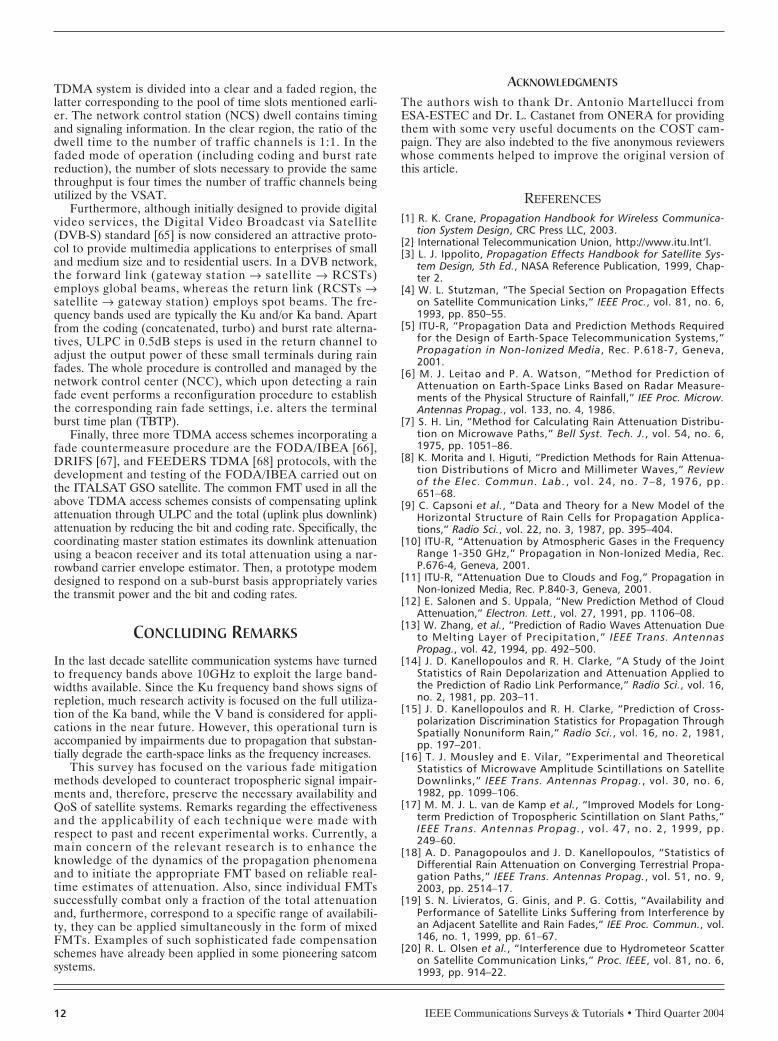
An implementation of adaptive TDMA worth discussing isthe Advanced Communication Technology Satellite (ACTS)adaptive rain fade protocol [64]. ACTS provided the opportuni-ty to test the protocol for a VSAT system operating at the Kaband. It offers a 10dB margin by reducing burst rates by halfand invoking FEC coding with rate 1/2 and constraint length5. To make a real-time decision about when the compensationof fades should take place, two thresholds are used, faded andclear, determined for each individual VSAT from BER mea-surements. Respectively, as Fig. 15 depicts, the frame of the
nnnn Table 1. Comparison of the various FMTs based on the conclusions fromCOST 255.
ULPC 0.01-10 5 (VSAT), 15 (hubs) Earth station power range
DLPC 0.01-10 3 (satellite TWTA) Satellite power range
SBS 0.01-10 5 (satellite antenna) Immature research
HC/HM 0.01-1 10–15 (Eb/N0 range) Simultaneous fading inmany stations
DRR 0.01-10 3-9 Rate reduction intolerantapplications
SD 0.001-0.1 10–30 (convective rain) Cost
OD 0.001-1 3–10 Switching between satellites
FD 0.001-10 30 (between Ka and Ku) Cost
Availabilityrange Maximum achievable
FMT (%) of year gain (dB) Limiting factor
nnnn FIGURE 15. ACTS downlink TDMA frame architecture.
Clear region Faded region
Fade pool
Downlink frame (1 ms, 1,728 slots)
NCS dwell
1Dwell
2Dwell
NDwell N+1
Dwell N+2
VSAT acquisition
dwell
IEEE Communications Surveys & Tutorials • Third Quarter 200412
TDMA system is divided into a clear and a faded region, thelatter corresponding to the pool of time slots mentioned earli-er. The network control station (NCS) dwell contains timingand signaling information. In the clear region, the ratio of thedwell time to the number of traffic channels is 1:1. In thefaded mode of operation (including coding and burst ratereduction), the number of slots necessary to provide the samethroughput is four times the number of traffic channels beingutilized by the VSAT.
Furthermore, although initially designed to provide digitalvideo services, the Digital Video Broadcast via Satellite(DVB-S) standard [65] is now considered an attractive proto-col to provide multimedia applications to enterprises of smalland medium size and to residential users. In a DVB network,the forward link (gateway station → satellite → RCSTs)employs global beams, whereas the return link (RCSTs →satellite → gateway station) employs spot beams. The fre-quency bands used are typically the Ku and/or Ka band. Apartfrom the coding (concatenated, turbo) and burst rate alterna-tives, ULPC in 0.5dB steps is used in the return channel toadjust the output power of these small terminals during rainfades. The whole procedure is controlled and managed by thenetwork control center (NCC), which upon detecting a rainfade event performs a reconfiguration procedure to establishthe corresponding rain fade settings, i.e. alters the terminalburst time plan (TBTP).
Finally, three more TDMA access schemes incorporating afade countermeasure procedure are the FODA/IBEA [66],DRIFS [67], and FEEDERS TDMA [68] protocols, with thedevelopment and testing of the FODA/IBEA carried out onthe ITALSAT GSO satellite. The common FMT used in all theabove TDMA access schemes consists of compensating uplinkattenuation through ULPC and the total (uplink plus downlink)attenuation by reducing the bit and coding rate. Specifically, thecoordinating master station estimates its downlink attenuationusing a beacon receiver and its total attenuation using a nar-rowband carrier envelope estimator. Then, a prototype modemdesigned to respond on a sub-burst basis appropriately variesthe transmit power and the bit and coding rates.
CONCLUDING REMARKS
In the last decade satellite communication systems have turnedto frequency bands above 10GHz to exploit the large band-widths available. Since the Ku frequency band shows signs ofrepletion, much research activity is focused on the full utiliza-tion of the Ka band, while the V band is considered for appli-cations in the near future. However, this operational turn isaccompanied by impairments due to propagation that substan-tially degrade the earth-space links as the frequency increases.
This survey has focused on the various fade mitigationmethods developed to counteract tropospheric signal impair-ments and, therefore, preserve the necessary availability andQoS of satellite systems. Remarks regarding the effectivenessand the applicability of each technique were made withrespect to past and recent experimental works. Currently, amain concern of the relevant research is to enhance theknowledge of the dynamics of the propagation phenomenaand to initiate the appropriate FMT based on reliable real-time estimates of attenuation. Also, since individual FMTssuccessfully combat only a fraction of the total attenuationand, furthermore, correspond to a specific range of availabili-ty, they can be applied simultaneously in the form of mixedFMTs. Examples of such sophisticated fade compensationschemes have already been applied in some pioneering satcomsystems.
ACKNOWLEDGMENTS
The authors wish to thank Dr. Antonio Martellucci fromESA-ESTEC and Dr. L. Castanet from ONERA for providingthem with some very useful documents on the COST cam-paign. They are also indebted to the five anonymous reviewerswhose comments helped to improve the original version ofthis article.
REFERENCES[1] R. K. Crane, Propagation Handbook for Wireless Communica-
tion System Design, CRC Press LLC, 2003.[2] International Telecommunication Union, http://www.itu.Int’l.[3] L. J. Ippolito, Propagation Effects Handbook for Satellite Sys-
tem Design, 5th Ed., NASA Reference Publication, 1999, Chap-ter 2.
[4] W. L. Stutzman, “The Special Section on Propagation Effectson Satellite Communication Links,” IEEE Proc., vol. 81, no. 6,1993, pp. 850–55.
[5] ITU-R, “Propagation Data and Prediction Methods Required for the Design of Earth-Space Telecommunication Systems,”Propagation in Non-Ionized Media, Rec. P.618-7, Geneva,2001.
[6] M. J. Leitao and P. A. Watson, “Method for Prediction ofAttenuation on Earth-Space Links Based on Radar Measure-ments of the Physical Structure of Rainfall,” IEE Proc. Microw.Antennas Propag., vol. 133, no. 4, 1986.
[7] S. H. Lin, “Method for Calculating Rain Attenuation Distribu-tion on Microwave Paths,” Bell Syst. Tech. J., vol. 54, no. 6,1975, pp. 1051–86.
[8] K. Morita and I. Higuti, “Prediction Methods for Rain Attenua-tion Distributions of Micro and Millimeter Waves,” Review of the Elec. Commun. Lab., vol. 24, no. 7–8, 1976, pp. 651–68.
[9] C. Capsoni et al., “Data and Theory for a New Model of theHorizontal Structure of Rain Cells for Propagation Applica-tions,” Radio Sci., vol. 22, no. 3, 1987, pp. 395–404.
[10] ITU-R, “Attenuation by Atmospheric Gases in the FrequencyRange 1-350 GHz,” Propagation in Non-Ionized Media, Rec.P.676-4, Geneva, 2001.
[11] ITU-R, “Attenuation Due to Clouds and Fog,” Propagation inNon-Ionized Media, Rec. P.840-3, Geneva, 2001.
[12] E. Salonen and S. Uppala, “New Prediction Method of CloudAttenuation,” Electron. Lett., vol. 27, 1991, pp. 1106–08.
[13] W. Zhang, et al., “Prediction of Radio Waves Attenuation Dueto Melting Layer of Precipitation,” IEEE Trans. AntennasPropag., vol. 42, 1994, pp. 492–500.
[14] J. D. Kanellopoulos and R. H. Clarke, “A Study of the JointStatistics of Rain Depolarization and Attenuation Applied tothe Prediction of Radio Link Performance,” Radio Sci., vol. 16,no. 2, 1981, pp. 203–11.
[15] J. D. Kanellopoulos and R. H. Clarke, “Prediction of Cross-polarization Discrimination Statistics for Propagation ThroughSpatially Nonuniform Rain,” Radio Sci., vol. 16, no. 2, 1981,pp. 197–201.
[16] T. J. Mousley and E. Vilar, “Experimental and TheoreticalStatistics of Microwave Amplitude Scintillations on SatelliteDownlinks,” IEEE Trans. Antennas Propag., vol. 30, no. 6,1982, pp. 1099–106.
[17] M. M. J. L. van de Kamp et al., “Improved Models for Long-term Prediction of Tropospheric Scintillation on Slant Paths,”IEEE Trans. Antennas Propag., vol. 47, no. 2, 1999, pp.249–60.
[18] A. D. Panagopoulos and J. D. Kanellopoulos, “Statistics ofDifferential Rain Attenuation on Converging Terrestrial Propa-gation Paths,” IEEE Trans. Antennas Propag., vol. 51, no. 9,2003, pp. 2514–17.
[19] S. N. Livieratos, G. Ginis, and P. G. Cottis, “Availability andPerformance of Satellite Links Suffering from Interference byan Adjacent Satellite and Rain Fades,” IEE Proc. Commun., vol.146, no. 1, 1999, pp. 61–67.
[20] R. L. Olsen et al., “Interference due to Hydrometeor Scatteron Satellite Communication Links,” Proc. IEEE, vol. 81, no. 6,1993, pp. 914–22.

IEEE Communications Surveys & Tutorials • Third Quarter 2004 13
[21] ITU-R, “Propagation Data Required for the Evaluation ofInterference between Stations in Space and Those on the Sur-face of the Earth,” Propagation in Non-Ionized Media, Rec.P.619-1, Geneva.
[22] J. D. Kanellopoulos and A. D Panagopoulos, “Ice Crystals andRaindrop Canting Angle Affecting the Performance of a SatelliteSystem Suffering from Differential Rain Attenuation and Cross-Polarization,” Radio Sci., vol. 36, no. 5, 2001, pp. 927–40.
[23] B. R. Arbesser-Rastburg and A. Paraboni, “European Researchon Ka-band Slant Path Propagation,” Proc. IEEE, vol. 85, no. 6,1997, pp. 843–52.
[24] A. Dissanayake, J. Allnutt, and F. Haidara, “A PredictionModel that Combines Rain Attenuation and Other PropagationImpairments along Earth-Satellite Paths,” IEEE Trans. AntennasPropag., vol. 45, no. 10, 1997, pp. 1546–58.
[25] L. Castanet et al., “Comparison of Various Methods for Com-bining Propagation Effects and Predicting Loss in Low-Avail-ability Systems in the 20-50 GHz Frequency Range,” Int’l. J.Satell. Commun., vol. 19, 2001, pp. 317–34.
[26] H. J. Liebe, ”MPM, An Atmospheric Millimeter-Wave Propaga-tion Model,” Int’l. J. Infrar. Mill. Waves, vol. 10, no. 6, 1989,pp. 631–50.
[27] S. N. Livieratos and P. G. Cottis, “Availability and Perfor-mance of Single/Multiple Site Diversity Satellite Systems underRain Fades,” European Trans. Telecommun., vol. 12, no. 1,2001, pp. 55–65.
[28] L. Castanet, J. Lemorton, and M. Bousquet, “Fade MitigationTechniques for New SatCom Services at Ku-band and Above: AReview,” 4th Ka-band Utilization Conf., Venice, Italy, 2–4 Nov.1998.
[29] A. Malygin, M. Filip, and E. Vilar, “Neural Network Implemen-tation of a Fade Countermeasure Controller for a VSAT Link,”Int’l. J. Satell. Commun., vol. 20, 2002, pp. 79–95.
[30] A. Paraboni and C. Riva, “A New Method for the Predictionof Fade Duration Statistics in Satellite Links above 10 GHz,”Int’l. J. Satell. Commun., vol. 12, 1994, pp. 387–94.
[31] D. G. Sweeney and C. W. Bostian, “The Dynamics of Rain-Induced Fades,” IEEE Trans. Antennas Propag., vol. 40, no. 3,1992, pp. 275–78.
[32] A. D. Panagopoulos and J. D. Kanellopoulos, “On the RainAttenuation Dynamics: Spatial-Temporal Analysis of RainfallRate and Fade Duration Statistics,” Int’l. J. Satell. Commun.Net., vol. 21, no. 6, 2003, pp. 595–611.
[33] T. Maseng and P. M. Bakken, “A Stochastic-Dynamic Modelof Rain Attenuation,” Int’l. J. Satell. Commun., vol. 29, no. 5,1981, pp. 660–69.
[34] R. M. Manning, “A Unified Statistical Rain-Attenuation Modelfor Communication Link Fade Predictions and Optimal Stochas-tic Fade Control Design Using a Location-Dependent Rain-Statistics Database,” Int’l. J. Satell. Commun., vol. 8, no. 1,1990, pp. 11–30.
[35] M. M. J. L. van de Kamp, “Statistical Analysis of Rain FadeSlope,” IEEE Trans. Antennas Propag., vol. 51, no. 8, 2003, pp.1750–59.
[36] ITU-R, “Prediction Method of Fade Dynamics on Earth-SpacePaths,” Propagation in Non-Ionized Media, Rec. P.1623, Gene-va, 2003.
[37] E. Matricciani, “Effects of Filtering on Rate of Change ofRain-Induced Attenuation,” Electr. Lett., vol. 18, no. 11, 1982,pp. 477–78.
[38] J. D. Laster and W. L. Stutzman, “Frequency Scaling of RainAttenuation for Satellite Communication Links,” IEEE Trans.Antennas Propag., vol. 43, no. 11, 1995, pp. 1207–16.
[39] L. Castanet, M. Bousquet, and D. Mertens, “Simulation of thePerformance of a Ka-band VSAT Videoconferencing Systemwith Uplink Power Control and Data Rate Reduction to Miti-gate Atmospheric Propagation Effects,” Int’l. J. Satell. Com-mun., vol. 20, 2002, pp. 231–49.
[40] A. W. Dissanayake, “Application of Open-Loop Uplink PowerControl in Ka-band Satellite Links,” Proc. IEEE, vol. 85, no. 6,1997, pp. 959–69.
[41] D. G. Sweeney and C. W. Bostian, “Implementing AdaptivePower Control as a 30/20-GHz Fade Countermeasure,” IEEETrans. Antennas Propag., vol. 47, no. 1, 1999, pp. 40–46.
[42] R. N. Ghose, Interference Mitigation, Theory and Application,
IEEE Press, 1996.[43] P. M. Bakken and T. Maseng, “Adaptive-Control of Satellite
EIRP to Reduce Outage Caused by Fading,” IEEE Trans. Com-mun., vol. 31, no. 5, 1983, pp. 726–34.
[44] P. P. Baptista and A. Paraboni, “Active Compensation Tech-niques for Spacecraft Antennas,” ESA publication, Preparingfor the Future, vol. 5, no. 1, Mar. 1995.
[45] P. F. Hartigan and A. P. Gallois, “The Use of Satellite Imageryfor Forecasting Rain Attenuation,” 8th ICAP, Edinburgh, UK,Mar.-Apr. 1993.
[46] J. G. Proakis, Digital Communications, McGraw Hill, 4th Ed.,2001, Chapter 8.
[47] M. Filip and E. Vilar, “Adaptive Modulation as a Fade Coun-termeasure, An OLYMPUS Experiment,” Int’l. J. Satell. Com-mun., vol. 8, 1990, pp. 31–41.
[48] K. Kerschat et al., “A Variable Spread-Spectrum Fade Coun-termeasure System for the DICE Video Conference System,”Proc. OLYMPUS Util. Conf., Seville, Spain, Apr. 1993.
[49] D. B. Hodge, “An Improved Model for Diversity Gain onEarth-Space Propagation Paths,” Radio Sci., vol. 17, no. 6,1982, pp. 1393–99.
[50] A. V. Bosisio and C. Riva, “A Novel Method for the StatisticalPrediction of Rain Attenuation in Site Diversity Systems: Theoryand Comparative Testing against Experimental Data,” Int’l. J.Satell. Commun., vol. 16, 1998, pp. 47–52.
[51] C. Capsoni, F. Fedi, and A. Paraboni, “A ComprehensiveMeteorologically Oriented Methodology for the Prediction ofWave Propagation Parameters in Telecommunication Applica-tions Beyond 10 GHz,” Radio Sci., vol. 22, no. 3, 1987, pp.387–93.
[52] J. Mass, “A Simulation Study of Rain Attenuation and Diversi-ty Effects on Satellite Links,” Comsat Tech. Review, vol. 17, no.1, 1987, pp. 159–86.
[53] J. D. Kanellopoulos et al., “Rain Attenuation Problems Affect-ing the Performance of Microwave Communication Systems,”Ann. Telecommun., 45, no. 7-8, 1990, pp. 437–51.
[54] E. Matricciani, “Orbital Diversity in Resource-Shared SatelliteCommunication Systems above 10 GHz,” IEEE JSAC, vol. 5, no.4, 1987, pp. 714–23.
[55] A. D. Panagopoulos, P.-D. M. Arapoglou, and P. G. Cottis,“Site vs. Orbital Diversity: Performance Comparison Based onPropagation Characteristics at the Ku Band and Above,”accepted for publication in IEEE Antennas Wirel. Propag. Lett., 2004.
[56] C. Capsoni, E. Matricciani, and M. Mauri, “SIRIO-OTS 12 GHzOrbital Diversity Experiment at Fucino,” IEEE Trans. AntennasPropag., vol. 38, no. 6, 1990, pp. 777–82.
[57] E. Matricciani and M. Mauri, “ITALSAT-OLYMPUS 20-GHzOrbital Diversity Experiment at Spino d’ Adda,” IEEE Trans.Antennas Propag., vol. 43, no. 1, 1995, pp. 105–07.
[58] A. D. Panagopoulos and J. D. Kanellopoulos, “A SimpleModel for Orbital Diversity Gain on Earth-Space PropagationPaths,” IEEE Trans. Antennas Propag., vol. 51, no. 6, 2003, pp.1403–05.
[59] E. Matricianni, “Prediction of Orbital Diversity Performance inSatellite Communication Systems Affected by Rain Attenua-tion,” Int’l. J. Satell. Commun., vol. 15, 1997, pp. 45–50.
[60] M. Luglio, “Application of Frequency Diversity for Dimension-ing a Ka-band Satellite System,” Int’l. J. Satell. Commun., vol.14, 1996, pp. 53–62.
[61] A. F. Ismail and P. A. Watson, “Characteristics of Fading andFade Countermeasures on a Satellite-Earth Link Operating inan Equatorial Climate, with Reference to Broadcast Applica-tions,” IEE Proc. Microw. Antennas Propag., vol. 147, no. 5,2000, pp. 369–73.
[62] COST Project 255, “Radiowave Propagation Modeling for Sat-com Services at Ku Band and Above,” Final Report, ESA Publi-cation Division, ISBN 92-9092-608-2, 2002.
[63] M. Luglio et al., “Large-Scale Site Diversity for Satellite Com-munication Networks,” Int’l. J. Satell. Commun., vol. 20, 2002,pp. 251–60.
[64] T. Coney, “Advanced Communications Technology Satellite(ACTS) Very Small Aperture Terminal (VSAT) Network ControlPerformance,” AIAA, 16th Inter. Commun. Satel. SystemsConf., Mar., 1996.
[65] ETSI EN 301 790 V1.2.2 (2000-12), “Digital Video Broadcasting
IEEE Communications Surveys & Tutorials • Third Quarter 200414
(DVB): Interaction Channel for Satellite Distribution Systems.”[66] N. Celandroni et al., “FODA/IBEA: A Flexible Fade Counter-
measure System in User Oriented Networks,” Int’l. J. Satell.Commun., vol. 10, no. 6, 1992, pp. 309–23.
[67] N. Celandroni, E. Ferro, and F. Potorti, “DRIFS-TDMA: A Pro-posal for a Satellite Access Distributed-Control Algorithm forMultimedia Traffic in a Faded Environment,” Int’l. J. Satell.Commun., vol. 15, 1997, pp. 227–35.
[68] N. Celandroni, E. Ferro, and F. Potorti, “FEEDERS-TDMA: ADistributed-Control Algorithm for Satellite Channel CapacityAssignment in a Mixed Traffic and Faded Environment,” Int’l.J. Satell. Commun., vol. 15, 1997, pp. 185–95.
BIOGRAPHIESATHANASIOS D. PANAGOPOULOS ([email protected]) receivedthe diploma degree in electrical and computer engineering (cumlaude) and the dr. engineering degree from National TechnicalUniversity of Athens (NTUA) in July 1997 and April 2002, respec-tively. From May 2002 to July 2003 he served in the TechnicalCorps of the Hellenic Army. In September 2003 he joined theSchool of Pedagogical and Technological Education as assistantprofessor. He is also a research assistant in the Wireless Commu-nications Laboratory of NTUA. He has published more than 50papers in international journals and conference proceedings. Hisresearch interests include microwave communication systemdesign, satellite communications, and the propagation effects onmultiple access systems and on communication protocols. He is amember of the IEEE and a member of the Technical Chamber ofGreece.
PANTELIS-DANIEL ARAPOGLOU ([email protected]) received thediploma degree in electrical and computer engineering from theNational Technical University Athens (NTUA), Greece, in 2003 andis currently working toward his Ph.D. at the NTUA. His researchinterests include the effect of propagation impairments on varioussatellite systems and protocols. He is the recipient of the 2004Ericsson Award of Excellence for his diploma thesis and is a stu-dent member of the IEEE.
PANAYOTIS G. COTTIS ([email protected]) received the dipl.(mechanical and electrical engineering) and dr. eng. degrees fromthe National Technical University of Athens (NTUA), Greece, in1979 and 1984, respectively, and the M.Sc. degree from the Uni-versity of Manchester, (UMIST), Manchester, U.K., in 1980. In1986 he joined the Department of Electrical and Computer Engi-neering, National Technical University of Athens (NTUA), Greece,where he is currently a professor. His research interests includemicrowave theory and applications, wave propagation inanisotropic media, electromagnetic scattering, and wireless andsatellite communications. Since September 2003 he has been theVice Rector of NTUA.