communication landscape in the republic of … communication landscape in the republic of serbia...
TRANSCRIPT

COMMUNICATION LANDSCAPE
IN THE REPUBLIC OF SERBIA
REGULATORY DEVELOPMENTS TOWARDS
BROADBAND DEPLOYMENT
Milan Janković, Ph.D.EE Director
SEE Digital Conference, Brussels, December 2011
• to create the conditions for further development of electronic communications through cutting-edge ICSs, as well as the balanced development within the whole territory of the Republic of Serbia
• to create the conditions for the equal and non-discriminatory
operation of all market participants in both technological
(network neutrality) and economic (market economy) terms
• to ensure further development of electronic communications
through mechanisms for enhancing competition (ex ante) and
where necessary, market regulation as well (ex post)
• to ensure overall protection of rights of all market participants,
end-users especially, with the aim of providing modern, high-
quality and cost-based services.
Facts about RATEL … mission
SEE Digital Conference, Brussels, December 2011 2

3
SECTOR REVENUES
- GDP share of the telecom sector
Source: RATEL
SEE Digital Conference, Brussels, December 2011
7,2 %5,6 %
4,7 % 4,87 % 4,76 % 4,98 %
0
200
400
600
800
1000
1200
1400
1600
1800
2005 2006 2007 2008 2009 2010
Revenues (millions of EUR)

4
INVESTMENTS IN
THE SECTOR
Source: RATEL
2005 2006 2007 2008 2009 2010
Investments (millions of EUR) 350 190 899 362 284 274
0
100
200
300
400
500
600
700
800
900
1000
SEE Digital Conference, Brussels, December 2011

5
TRAFFIC
Source: RATEL
0
5
10
15
20
25
2005 2006 2007 2008 2009 2010
Fixed network traffic (billions of minutes)
Mobile network traffic (billions of minutes)
SEE Digital Conference, Brussels, December 2011

6
PENETRATION
Source: RATEL
33.7%
41.48%
73.5%
132.24%
10%
32.11%
7%
16.63%
SEE Digital Conference, Brussels, December 2011

7
ICT DEVELOPMENT INDEX – IDI
This Index combines 11 indicators
divided into three sub-indices:
• ICT infrastructure and access
• ICT use (primarily by individuals,
but also households and
undertakings) and the intensity of
use
• ICT skills (or human capacity
necessary for the effective use of
ICTs)
Year IDI Index value for Serbia Rank (total of 159 countries)
2008 4.23 53
2010 5.11 50
Source: RATEL
SEE Digital Conference, Brussels, December 2011

HOW INVESTING IN BROADBAND
CAN BOOST ECONOMIES
8
0.0
0.2
0.4
0.6
0.8
1.0
1.2
1.4
1.6
Fixed Mobile Internet Broadband
High-income economies
Low- and middle- income
economies
Th
e v
erti
cal
ax
is i
s th
e p
erce
nta
ge
rise
in
eco
no
mic
gro
wth
per
10
% r
ise
in p
enet
rati
on
Source: ITU (2011)
SEE Digital Conference, Brussels, December 2011

9
STRATEGIC GOALS - SERBIA
• Enhancement of competition within the electronic communications
market
• Implementation of new technologies
• Digital television –ASO
• 4G mobile technology – LTE
• Fiber To The Home – FTTH, etc.
• The aim of the Strategy for the Development of Broadband in the Republic
of Serbia until 2012 is a 20% broadband penetration rate
(the total of 1.2 million connections)
• 4Mb/s in fixed networks
• 512kb/s in mobile networks
• Efficient management of the radio frequency spectrum (digital dividend)
SEE Digital Conference, Brussels, December 2011

The Report has been published:
in English, French, Spanish, Russian,
Chinese and Arab language by the
International Telecommunication Union
(ITU) and UNESCO
in Serbian language by the Republic
Agency for Electronic Communication
SEE Digital Conference, Brussels, December 2011 10

11
INFORMATION SOCIETY
KNOWLEDGE -BASED SOCIETY
A developed Information Society implies:
• e-Administration
• e-Commerce
• e-Justice
• e-Health
• e-Education, etc.
• An open, available and quality-based Internet access is a
prerequisite for the development of the Information Society
SEE Digital Conference, Brussels, December 2011

Access Network Requirements
• Broadband access has become a basic provision in homes and business
12 SEE Digital Conference, Brussels, December 2011
1. All IP Service Support
• IP service awareness.
• IMS/NGN functionality.
• Superior reliability & QoS.
• End to end management of network.
2. “Unlimited” Bandwidth
• Advances in “last mile” connection (i.e. VDSL, FTTH).
• Higher speed platform.
• Smart outside plant solution.
• High bandwidth in-building technologies.
3. Triple Play – Broadband for All
• Standards and open interfaces.
• Full range of CPE solution across technologies.
• Zero-touch provisioning and assurance.
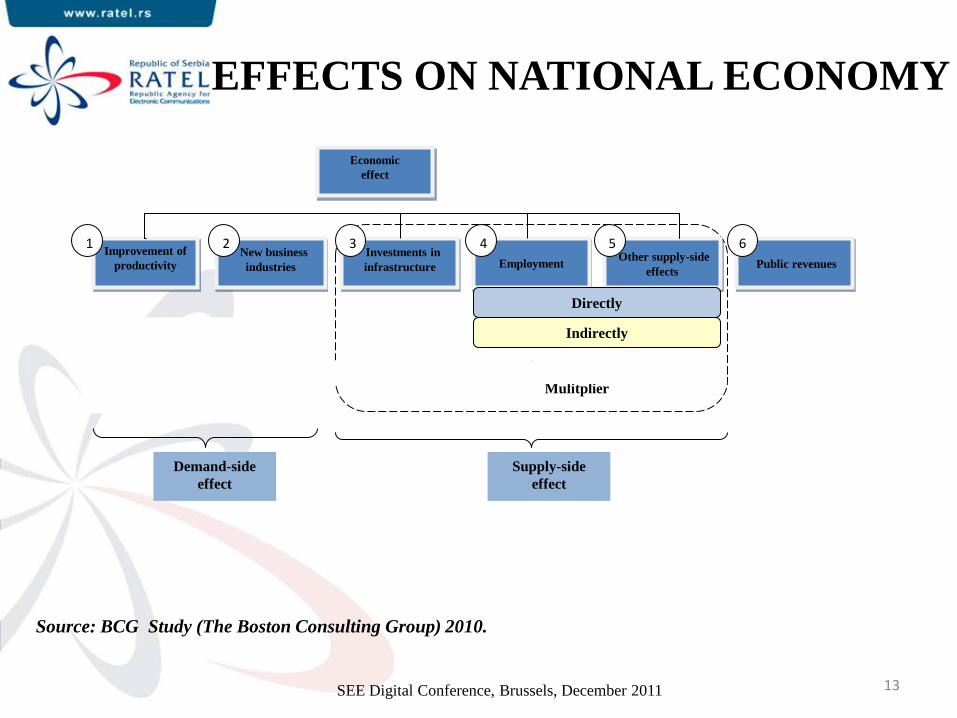
EFFECTS ON NATIONAL ECONOMY
Source: BCG Study (The Boston Consulting Group) 2010.
Economic
effect
Improvement of
productivity New business
industries
Investments in
infrastructure Employment Other supply-side
effects Public revenues
Demand-side
effect
Supply-side
effect
Indirectly
Mulitplier
1 2 3 4 5 6
Directly
SEE Digital Conference, Brussels, December 2011 13

PROJECTED
ECONOMIC BENEFIT IN 2020
Source: BCG Study (The Boston Consulting Group) 2010.
70
94
Serbia
Number of new job
openings (thousands)
2015
2020
17
Serbia
New business industries
(thousands)
3.5
1.1
0.3
0.3
Services
Production
Agriculture
New business
industries
Internet share in GDP (5.2%)
Serbia
SEE Digital Conference, Brussels, December 2011 14

TELECOM MARKET 2005-2010
15 SEE Digital Conference, Brussels, December 2011
Market Analysis (1)
After July 2010
RATEL submitted the following for public
consultations :
• Decision on relevant markets susceptible to
ex ante regulation (adopted)
• Market analyses
SEE Digital Conference, Brussels, December 2011 16

Market Analysis (2)
The following markets have been analyzed: • Market 1 - Access to the public telephone network
• Market 2 - Call origination on the public fixed network at a fixed location
• Market 3 - Call termination on the public fixed network at a fixed location
• Market 4 - Wholesale unbundled access (including shared or fully unbundled
access) to the local loop at a fixed location
• Market 5 - Wholesale broadband access
• Market 6 - Wholesale terminating segments of leased lines
• Market 7 - Call termination on public mobile telephone network
• Market 8 - Media content distribution
• Market 9 - Publicly available telephone services provided at a fixed location
SEE Digital Conference, Brussels, December 2011 17

Opening of fixed and mobile telecoms markets
In determining the price for access to telecommunications
infrastructure, a one-off fee for the unbundled access to the local
loop (full or shared access) and a monthly fee for the unbundled
access to the local loop (full or shared) was determined by the
benchmarking method – by comparing the data obtained from
the countries in the region.
Fully tariff rebalancing is done (local call and interconnection) performed on
the cost accounting principle.
Telecom Networks and Services
SEE Digital Conference, Brussels, December 2011 18
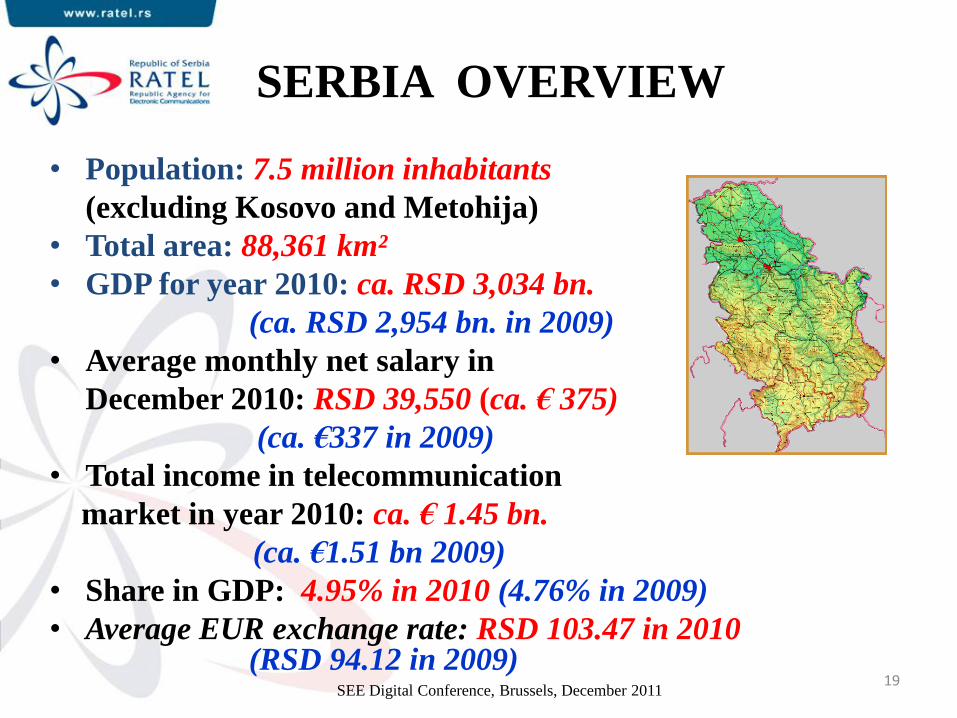
SERBIA OVERVIEW
• Population: 7.5 million inhabitants
(excluding Kosovo and Metohija)
• Total area: 88,361 km²
• GDP for year 2010: ca. RSD 3,034 bn.
(ca. RSD 2,954 bn. in 2009)
• Average monthly net salary in
December 2010: RSD 39,550 (ca. € 375)
(ca. €337 in 2009)
• Total income in telecommunication
market in year 2010: ca. € 1.45 bn.
(ca. €1.51 bn 2009)
• Share in GDP: 4.95% in 2010 (4.76% in 2009)
• Average EUR exchange rate: RSD 103.47 in 2010 (RSD 94.12 in 2009)
19 SEE Digital Conference, Brussels, December 2011

MAEKET OVERVIEW
20
2008 2009 2010
Number
(thousands)
Penetration
(%)
Number
(thousands)
Penetration
(%)
Number
(thousands)
Penetration
(%)
Number
of
operators
Fixed - lines 3 084.9 41.14 3 105.7 41.42 3 110.3 41.48 4
Mobile - users 9 618.8 128.27 9 912.3 132.20 9 915.3 132.24 3
Internet -
subscribers 1 619.7 21.60 1 705.7 22.75 2 407.4 32.11 192
CATV
subscribers 922.3 12 1 080.9 14.42 1 247.2 16.63 80
SEE Digital Conference, Brussels, December 2011

Internet (1)
2005 2006 2007 2008 2009 2010
Number of
subscribers
(3G subscribers
included)
758,680 1,005,200 1,201,201 1,629,387 1,705,716 2,407,390
Penetration (%) 10.12 13.28 16.92 21.60 22.75 32.11
Number of ISPs 66 150 159 197 199 192
Revenues from
Internet
services (EUR
million)
19.30 26.60 59.30 107.58 117.56 130.66
Source: RATEL, on December 31
SEE Digital Conference, Brussels, December 2011 21
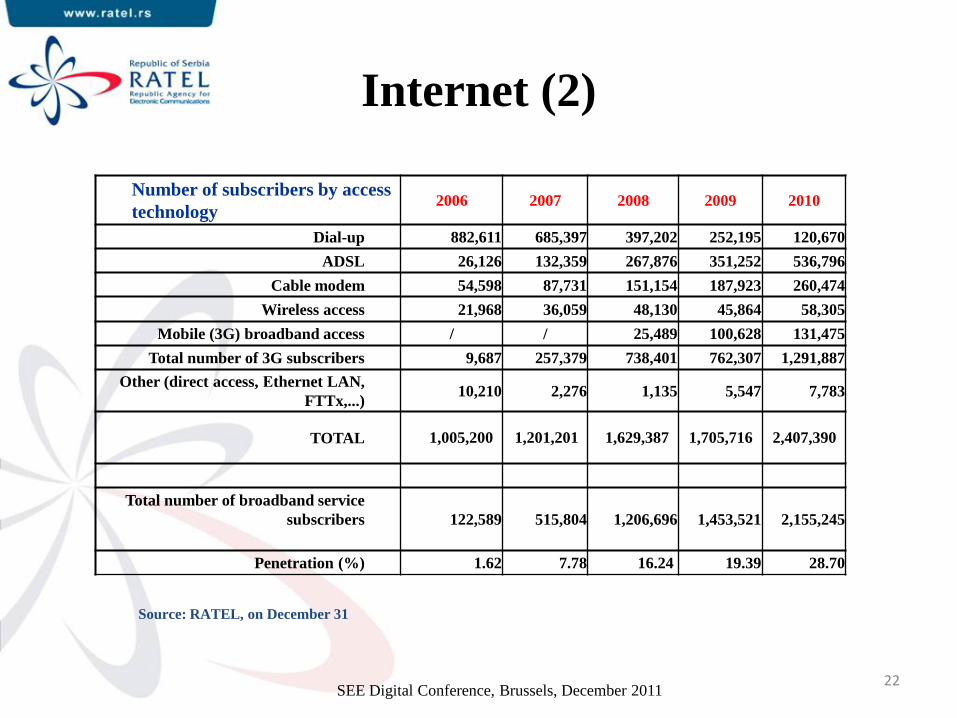
Internet (2)
Number of subscribers by access
technology 2006 2007 2008 2009 2010
Dial-up 882,611 685,397 397,202 252,195 120,670
ADSL 26,126 132,359 267,876 351,252 536,796
Cable modem 54,598 87,731 151,154 187,923 260,474
Wireless access 21,968 36,059 48,130 45,864 58,305
Mobile (3G) broadband access / / 25,489 100,628 131,475
Total number of 3G subscribers 9,687 257,379 738,401 762,307 1,291,887
Other (direct access, Еthernet LAN,
FTTx,...) 10,210 2,276 1,135 5,547 7,783
TOTAL 1,005,200 1,201,201 1,629,387 1,705,716 2,407,390
Total number of broadband service
subscribers
122,589 515,804 1,206,696 1,453,521 2,155,245
Penetration (%) 1.62 7.78 16.24 19.39 28.70
Source: RATEL, on December 31
SEE Digital Conference, Brussels, December 2011 22
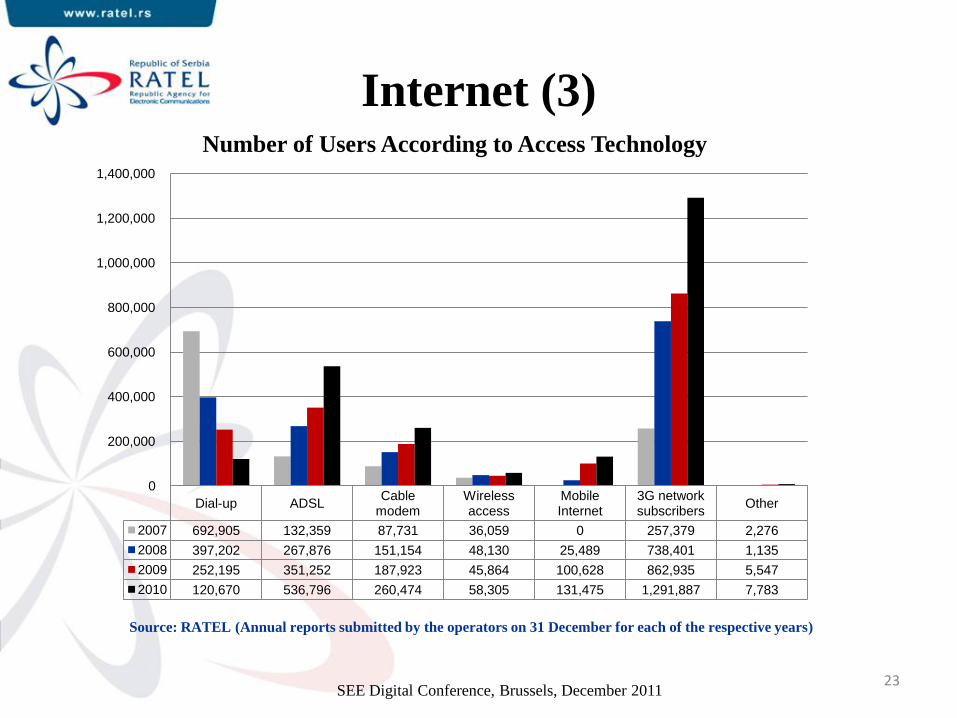
Internet (3)
Dial-up ADSL Cable
modem Wireless access
Mobile Internet
3G network subscribers
Other
2007 692,905 132,359 87,731 36,059 0 257,379 2,276
2008 397,202 267,876 151,154 48,130 25,489 738,401 1,135
2009 252,195 351,252 187,923 45,864 100,628 862,935 5,547
2010 120,670 536,796 260,474 58,305 131,475 1,291,887 7,783
0
200,000
400,000
600,000
800,000
1,000,000
1,200,000
1,400,000
Number of Users According to Access Technology
Source: RATEL (Annual reports submitted by the operators on 31 December for each of the respective years)
SEE Digital Conference, Brussels, December 2011 23
KEY SPECTRUM MANAGEMENT
CHALLENGES
AND
ACTIVITIES IN THE COMMING FEW
YEARS
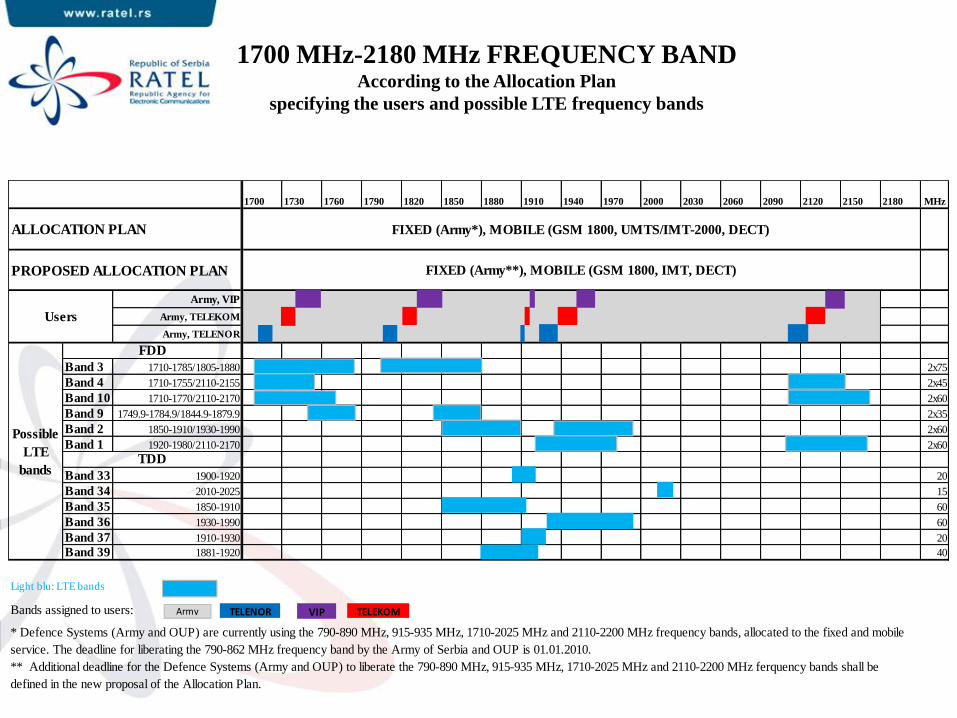
1700 MHz-2180 MHz FREQUENCY BAND According to the Allocation Plan
specifying the users and possible LTE frequency bands
1700 1730 1760 1790 1820 1850 1880 1910 1940 1970 2000 2030 2060 2090 2120 2150 2180 MHz
Army, VIP
Army, TELEKOM
Army, TELENOR
Band 3 1710-1785/1805-1880 2x75
Band 4 1710-1755/2110-2155 2x45
Band 10 1710-1770/2110-2170 2x60
Band 9 1749.9-1784.9/1844.9-1879.9 2x35
Band 2 1850-1910/1930-1990 2x60
Band 1 1920-1980/2110-2170 2x60
Band 33 1900-1920 20
Band 34 2010-2025 15
Band 35 1850-1910 60
Band 36 1930-1990 60
Band 37 1910-1930 20
Band 39 1881-1920 40
Bands assigned to users:
ALLOCATION PLAN
* Defence Systems (Army and OUP) are currently using the 790-890 MHz, 915-935 MHz, 1710-2025 MHz and 2110-2200 MHz frequency bands, allocated to the fixed and mobile
service. The deadline for liberating the 790-862 MHz frequency band by the Army of Serbia and OUP is 01.01.2010.
** Additional deadline for the Defence Systems (Army and OUP) to liberate the 790-890 MHz, 915-935 MHz, 1710-2025 MHz and 2110-2200 MHz ferquency bands shall be
defined in the new proposal of the Allocation Plan.
FIXED (Army*), MOBILE (GSM 1800, UMTS/IMT-2000, DECT)
Users
Light blu: LTE bands
FIXED (Army**), MOBILE (GSM 1800, IMT, DECT)PROPOSED ALLOCATION PLAN
Possible
LTE
bands
FDD
TDD
VIP TELEKOMTELENORArmy

Graphic Of The Measured Level Of Signal
For LTE 1800 Base Station
SEE Digital Conference, Brussels, December 2011 26

2500 MHz-2690 MHz FREQUENCY BAND According to the Allocation Plan
specifying the users and possible LTE frequency bands
2500 2520 2540 2560 2570 2580 2600 2620 2640 2660 2670 2690 MHz
FIXED,
MO BILE
(UMTS/I
MT-2000)
FIXED,
MO BILE
(UMTS/I
MT-2000)
MO BILE
(IMT),
Fixed
MO BILE
(IMT),
Fixed
Band 7 2500-2570/2620-2690 2 x 70
Band 38 2570-2620 50
Light blue: LTE bands
Possible LTE
bands
FIXED (Army), MOBILE (UMTS/IMT-2000), SATELLITE
BROADCASTING, Radio Astronomy
Defence Systems - ArmyUSERS
PROPOSED ALLOCATION PLAN
FIXED (Army),
MOBILE (IMT, SAP/SAB),
SATELLITE BROADCASTING, Radio Astronomy
ALLOCATION PLAN
FDD DL
TDD
FDD UL
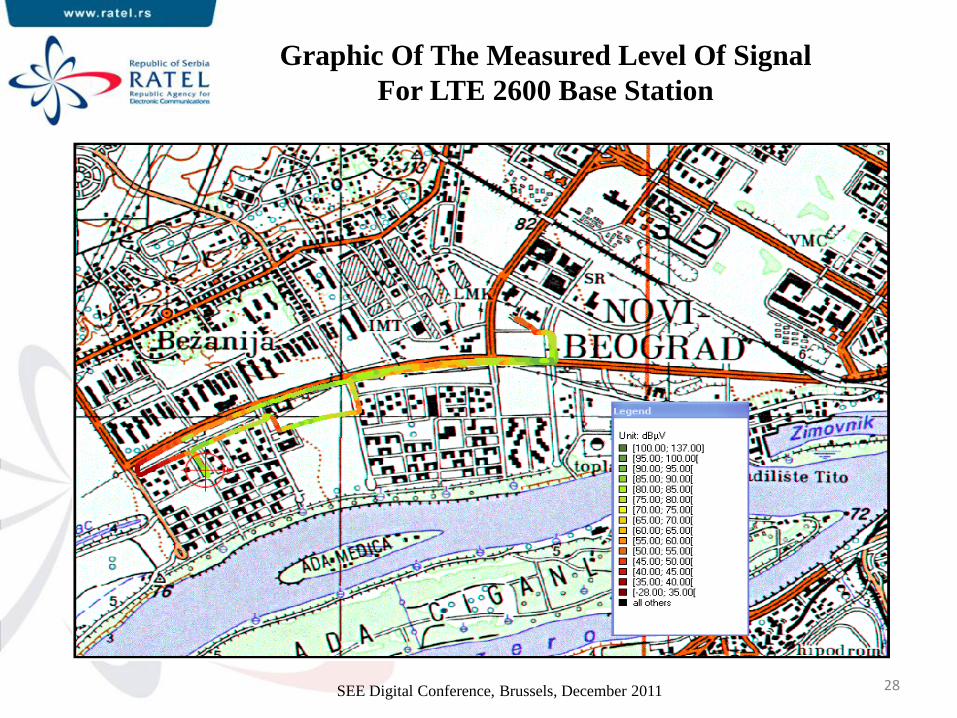
Graphic Of The Measured Level Of Signal
For LTE 2600 Base Station
SEE Digital Conference, Brussels, December 2011 28

790 MHz-960 MHz FREQUENCY BAND According to the Allocation Plan
specifying the users and possible LTE frequency bands
790 862 880 890 900 910 920 930 940 950 960MHz
2x4.2
2x9.6
2x9.6
Band 20 832-862/791-821 2x30
Band 18 815-830/860-875 2x15
Band 5 824-849/869-894 2x25
Band 19 830-845/875-890 2x15
Band 8 880-915/925-960 2x35
Light blue: LTE bands
Bands assigned to users:
BROADCASTING
(Television), FIXED
(Army*), MOBILE
Broadcasting Companies
Army and OUP
Users
ALLOCATION PLAN
Possible LTE
bands
PROPOSED ALLOCTION PLAN
BROADCASTING
(Television), FIXED
(Army**), MOBILE
FIXED
(Army*),
MO BILE
(EGSM)
Army
** Additional deadline for the Defence Systems (Army, OUP) to liberate the790-890 MHz, 915-935 MHz, 1710-2025 MHz and 2110-
2200 MHz frequency bands shall be defined in the new proposal of the Allocation Plan.
FIXED (Army*),
MOBILE (GSM, EGSM)
FIXED
(Army**),
MO BILE (GSM-R, EGSM)
FIXED (Army**),
MOBILE (GSM, GSM-R, EGSM)
* Defence Systems (VSCG, OUP) are currently using 790-890 MHz, 915-935 MHz, 1710-2025 MHz and 2110-2200 MHz frequncy
bands, allocated to fixed and mobile service. The deadline for liberatig the 790-862 MHz frequency band by the Army of Serbia and
OUP is 01.01.2010.
VIP TELEKOMTELENORBroadcasting Companies Army

ELECTRIC POWER INDUSTRY OF SERBIA (EPS),
PUBLIC ENTERPRISE
30 SEE Digital Conference, Brussels, December 2011
Optical Network New Telecommunication Network
Locations and Capacities

ELECTRIC ENERGY TRANSMISSION AND
TRANSMISSION
SYSTEM CONTROL (EMS), PUBLIC ENTERPRISE
31 SEE Digital Conference, Brussels, December 2011
EMS Optical Telecommunications
System (end of 2010) Electronic Highway (Backbone Connections)

SERBIAN RAILWAYS, PUBLIC ENTERPRISE
32 SEE Digital Conference, Brussels, December 2011
Telecommunication Transmission System Circuit-Switching Network

ACADEMIC NETWORK OF THE
REPUBLIC OF SERBIA - AMRES
33 SEE Digital Conference, Brussels, December 2011
Leased Intercity Optical Links – Current State Optical Intercity Links Infrastructure – SEELight Project

CONCLUDING REMARKS
The Electronic Communications Law, aligned with EU 2003, 2007 and 2009
Directives, represents the basis for the further development of the telecom
market.
The implementation of the provisions of this Law will lead to benefits
resulting from the economic effects of market liberalisation which will be
illustrated by:
– market transparency,
– gradual elimination of barriers to entry,
– market appeal in terms of new investments,
– an increase in the number of users of certain services,
– introduction and implementation of new services,
– increased service quality,
– a decrease in prices and enhancement of market competition.
SEE Digital Conference, Brussels, December 2011 34

35 SEE Digital Conference, Brussels, December 2011

THANK YOU!
Republic Agency for Electronic
Communications (RATEL) Višnjićeva 8
11000 Belgrade Republic of Serbia
Contact center & fax:
011/ 3242 673 Fax: 011/ 3232 537
www.ratel.rs
Dr Milan Janković
36 SEE Digital Conference, Brussels, December 2011