communication between uav’sand ground control …€¦ · communication between uav’sand ground...
TRANSCRIPT
COMMUNICATION BETWEEN UAV’S AND GROUND CONTROL STATIONS USING ESRI
VISIBILITY ANALYSIS TOOL
PRESENTED BY: CHAD COCHRAN
PROBLEM STATEMENT
•What is the area within which a UAV can maintain communication with ground control beacons without disruption in high relief terrain?

PROJECT OBJECTIVES
•Define Inverse Azimuthal Viewshed (Visibility Corridor)
•Creation of methodology for Inverse Azimuthal Viewshed
•Demonstrate the utility of Inverse Azimuthal Viewshed

PROJECT PARAMETERS
•Altitude maximum of 400 feet or 133 meters (FAA Mandate)
•Elevation data over United States High Desert (Basin and Range region)
•1115 minimum \ 2634 maximum
•UAV Range \ Radius of 27 Kilometers
•Static ground control communication point
•Fixed wing UAV
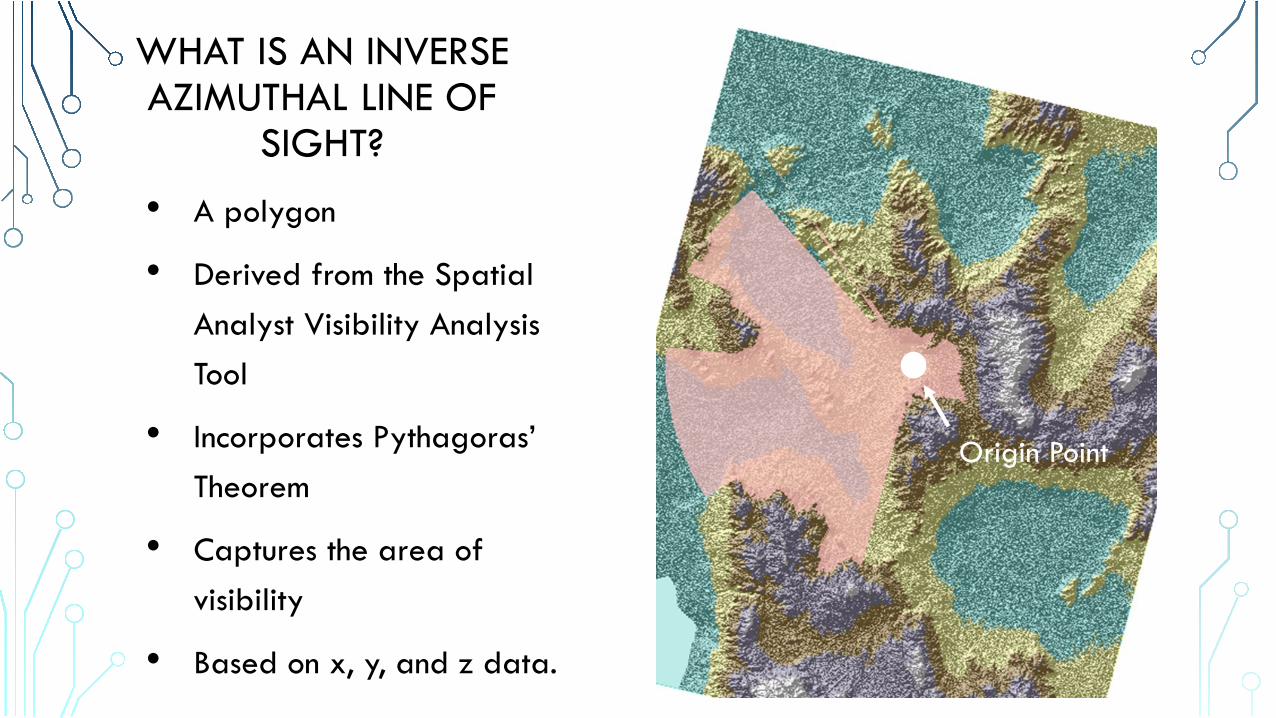
WHAT IS AN INVERSE AZIMUTHAL LINE OF
SIGHT?
• A polygon
• Derived from the Spatial Analyst Visibility Analysis Tool
• Incorporates Pythagoras’ Theorem
• Captures the area of visibility
• Based on x, y, and z data.
Origin Point
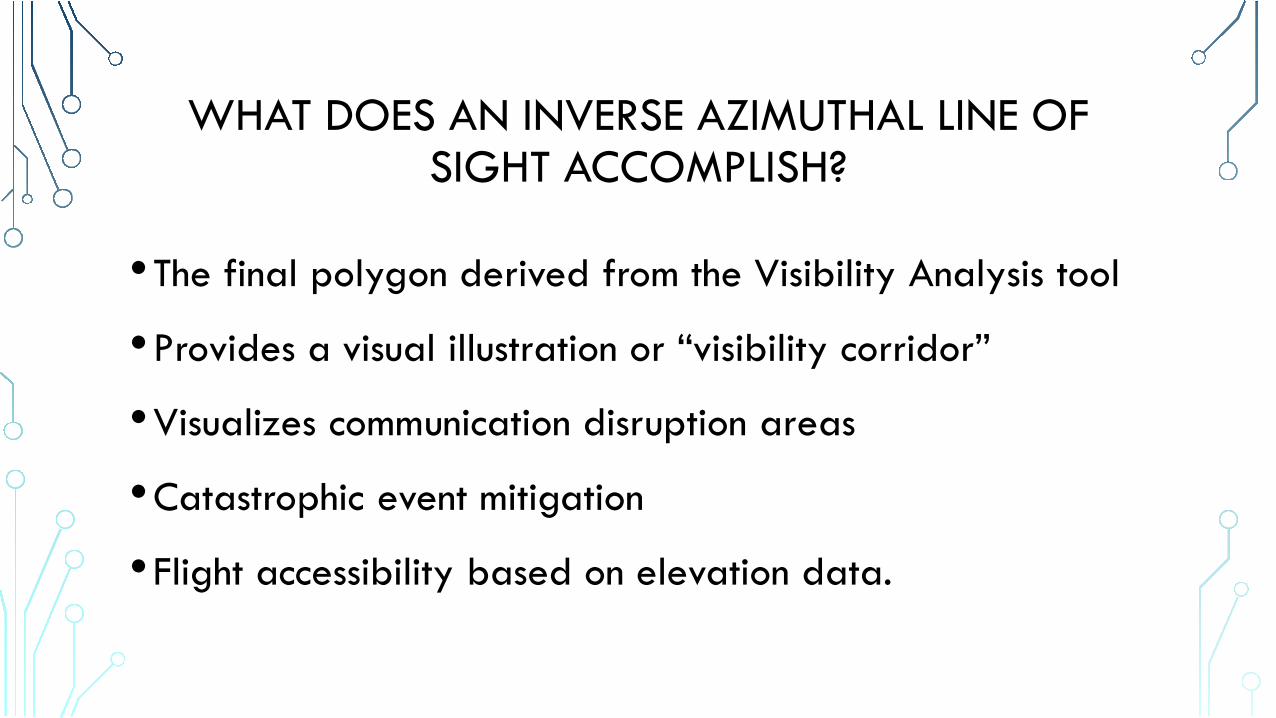
WHAT DOES AN INVERSE AZIMUTHAL LINE OF SIGHT ACCOMPLISH?
•The final polygon derived from the Visibility Analysis tool
•Provides a visual illustration or “visibility corridor”
•Visualizes communication disruption areas
•Catastrophic event mitigation
•Flight accessibility based on elevation data.
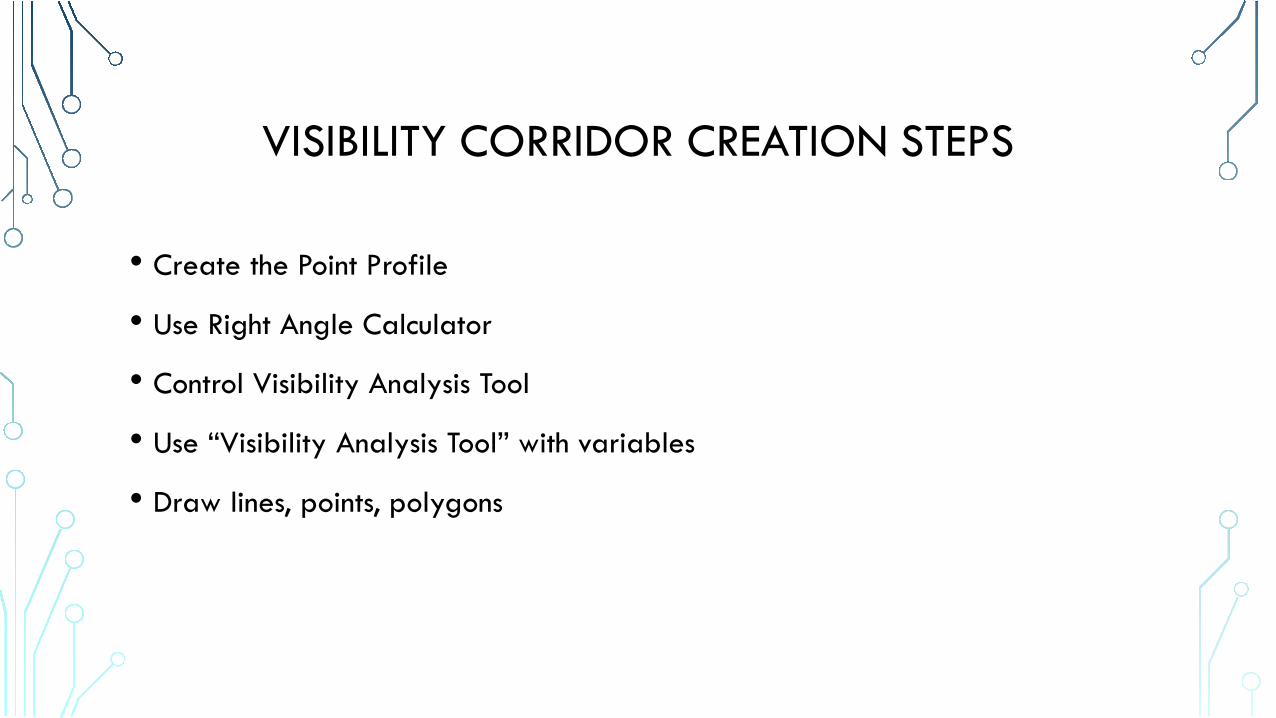
VISIBILITY CORRIDOR CREATION STEPS
• Create the Point Profile
• Use Right Angle Calculator
• Control Visibility Analysis Tool
• Use “Visibility Analysis Tool” with variables
• Draw lines, points, polygons
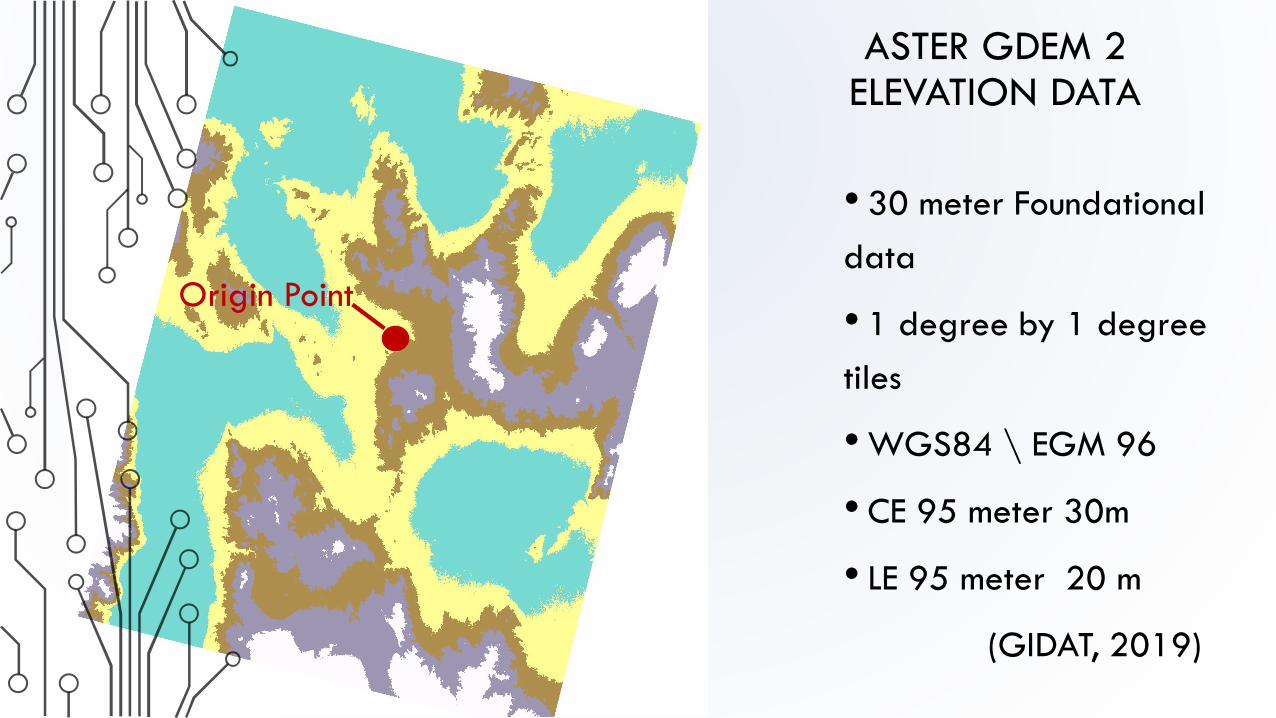
ASTER GDEM 2ELEVATION DATA
• 30 meter Foundational data
• 1 degree by 1 degree tiles
• WGS84 \ EGM 96
• CE 95 meter 30m
• LE 95 meter 20 m
(GIDAT, 2019)
Origin Point
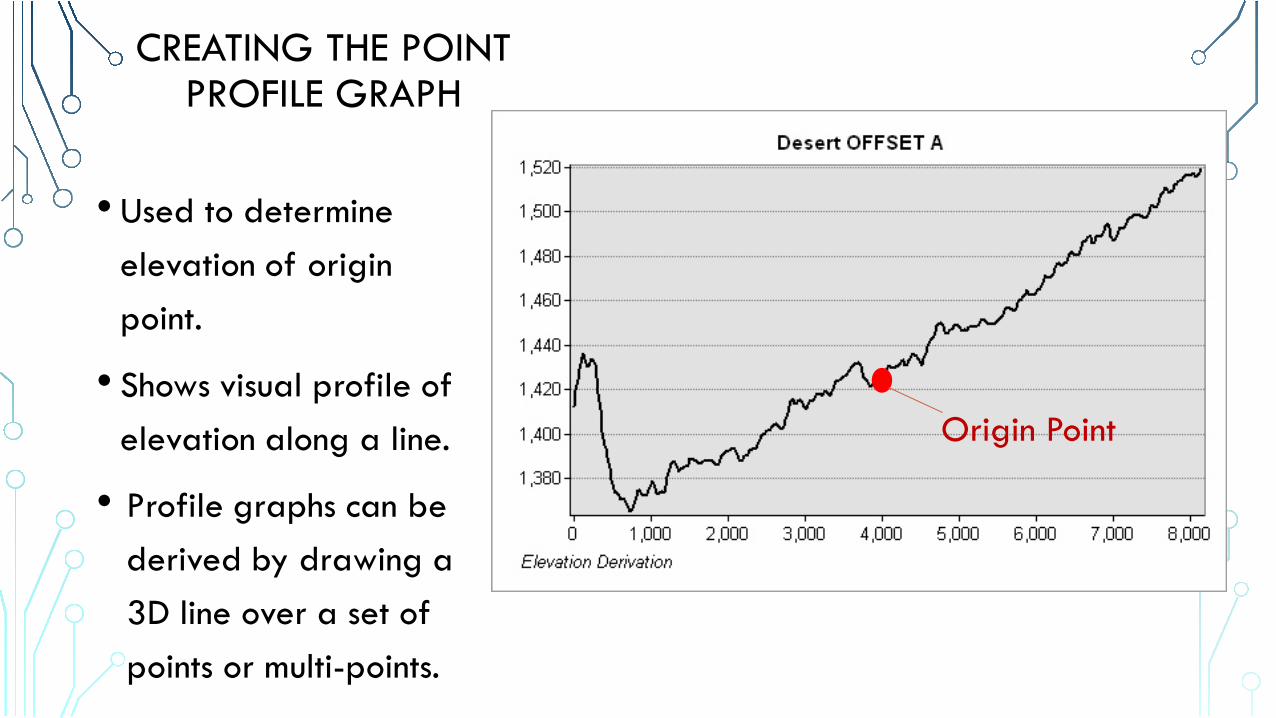
CREATING THE POINT PROFILE GRAPH
• Used to determine elevation of origin point.
• Shows visual profile of elevation along a line.
• Profile graphs can be derived by drawing a 3D line over a set of points or multi-points.
Origin Point

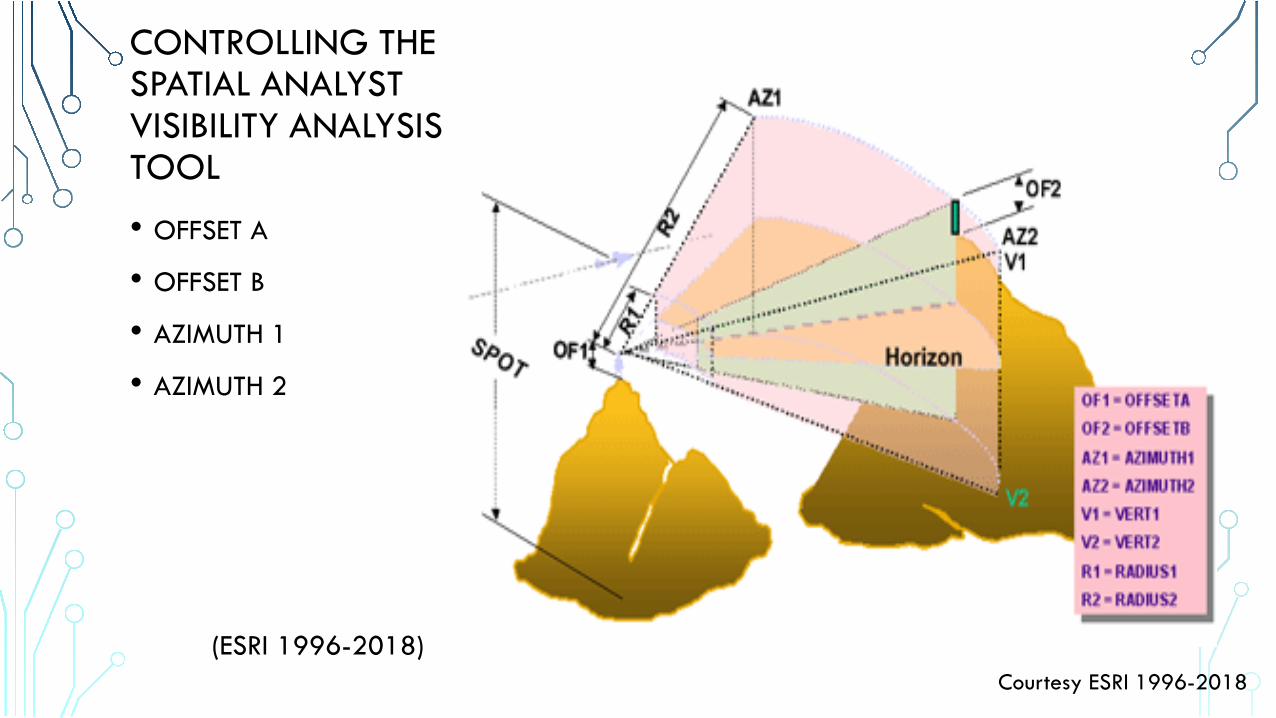
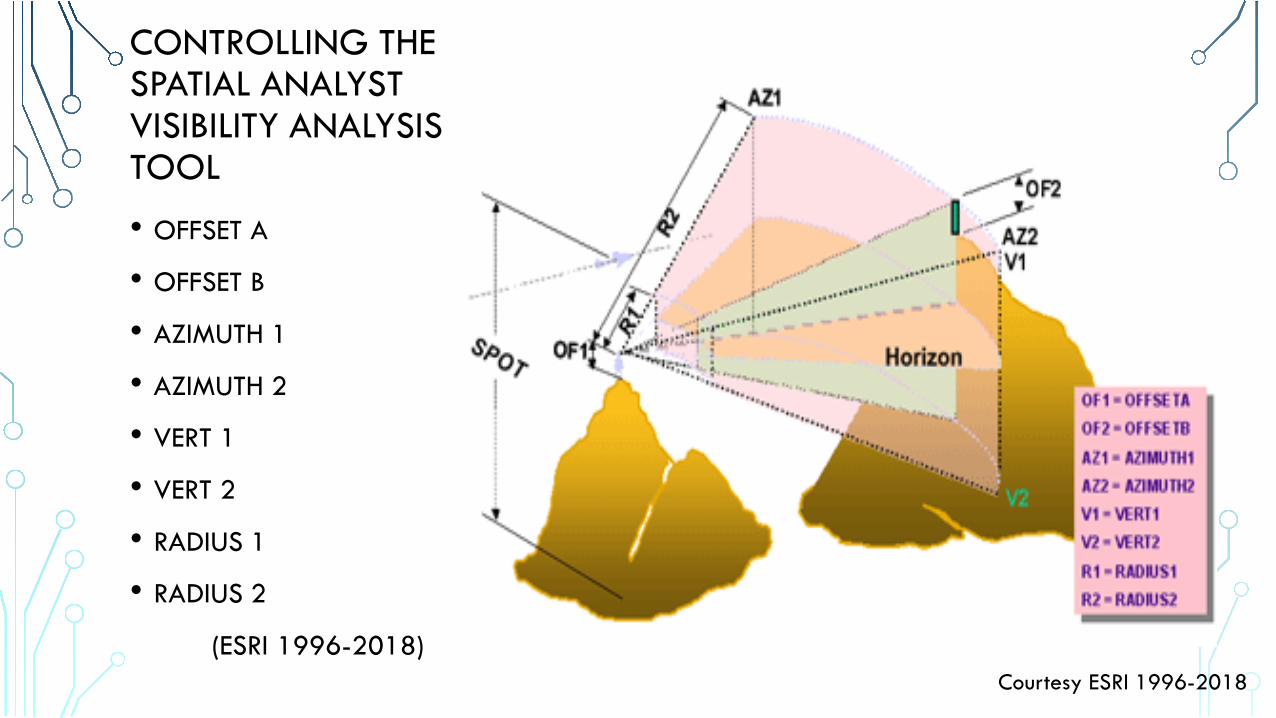
CONTROLLING THE SPATIAL ANALYST VISIBILITY ANALYSIS TOOL

CONTROLLING THE CONTROLLING THE SPATIAL ANALYST VISIBILITY ANALYSIS TOOLATIAL ANALYST VISIBILITY ANALYSIS• OFFSET A
• OFFSET B
• AZIMUTH 1
• AZIMUTH 2
• VERT 1
• VERT 2
• RADIUS 1
• RADIUS 2
(ESRI 1996-2018))Courtesy(ESRI 1996-2018

CONTROLLING THE CONTROLLING THE SPATIAL ANALYST VISIBILITY ANALYSIS TOOLATIAL ANALYST VISIBILITY ANALYSIS• OFFSET A
(ESRI 1996-2018))Courtesy(ESRI 1996-2018

CONTROLLING THE CONTROLLING THE SPATIAL ANALYST VISIBILITY ANALYSIS TOOLATIAL ANALYST VISIBILITY ANALYSIS• OFFSET A
• OFFSET B
(ESRI 1996-2018))Courtesy(ESRI 1996-2018

CONTROLLING THE CONTROLLING THE SPATIAL ANALYST VISIBILITY ANALYSIS TOOLATIAL ANALYST VISIBILITY ANALYSIS• OFFSET A
• OFFSET B
• AZIMUTH 1
(ESRI 1996-2018))Courtesy(ESRI 1996-2018
CONTROLLING THE CONTROLLING THE SPATIAL ANALYST VISIBILITY ANALYSIS TOOLATIAL ANALYST VISIBILITY ANALYSIS• OFFSET A
• OFFSET B
• AZIMUTH 1
• AZIMUTH 2
(ESRI 1996-2018))Courtesy(ESRI 1996-2018

CONTROLLING THE CONTROLLING THE SPATIAL ANALYST VISIBILITY ANALYSIS TOOLATIAL ANALYST VISIBILITY ANALYSIS• OFFSET A
• OFFSET B
• AZIMUTH 1
• AZIMUTH 2
• VERT 1
(ESRI 1996-2018))Courtesy(ESRI 1996-2018

CONTROLLING THE CONTROLLING THE SPATIAL ANALYST VISIBILITY ANALYSIS TOOLATIAL ANALYST VISIBILITY ANALYSIS• OFFSET A
• OFFSET B
• AZIMUTH 1
• AZIMUTH 2
• VERT 1
• VERT 2
(ESRI 1996-2018))Courtesy(ESRI 1996-2018

CONTROLLING THE CONTROLLING THE SPATIAL ANALYST VISIBILITY ANALYSIS TOOLATIAL ANALYST VISIBILITY ANALYSIS• OFFSET A
• OFFSET B
• AZIMUTH 1
• AZIMUTH 2
• VERT 1
• VERT 2
• RADIUS 1
(ESRI 1996-2018))Courtesy(ESRI 1996-2018
CONTROLLING THE CONTROLLING THE SPATIAL ANALYST VISIBILITY ANALYSIS TOOLATIAL ANALYST VISIBILITY ANALYSIS• OFFSET A
• OFFSET B
• AZIMUTH 1
• AZIMUTH 2
• VERT 1
• VERT 2
• RADIUS 1
• RADIUS 2
(ESRI 1996-2018))Courtesy(ESRI 1996-2018
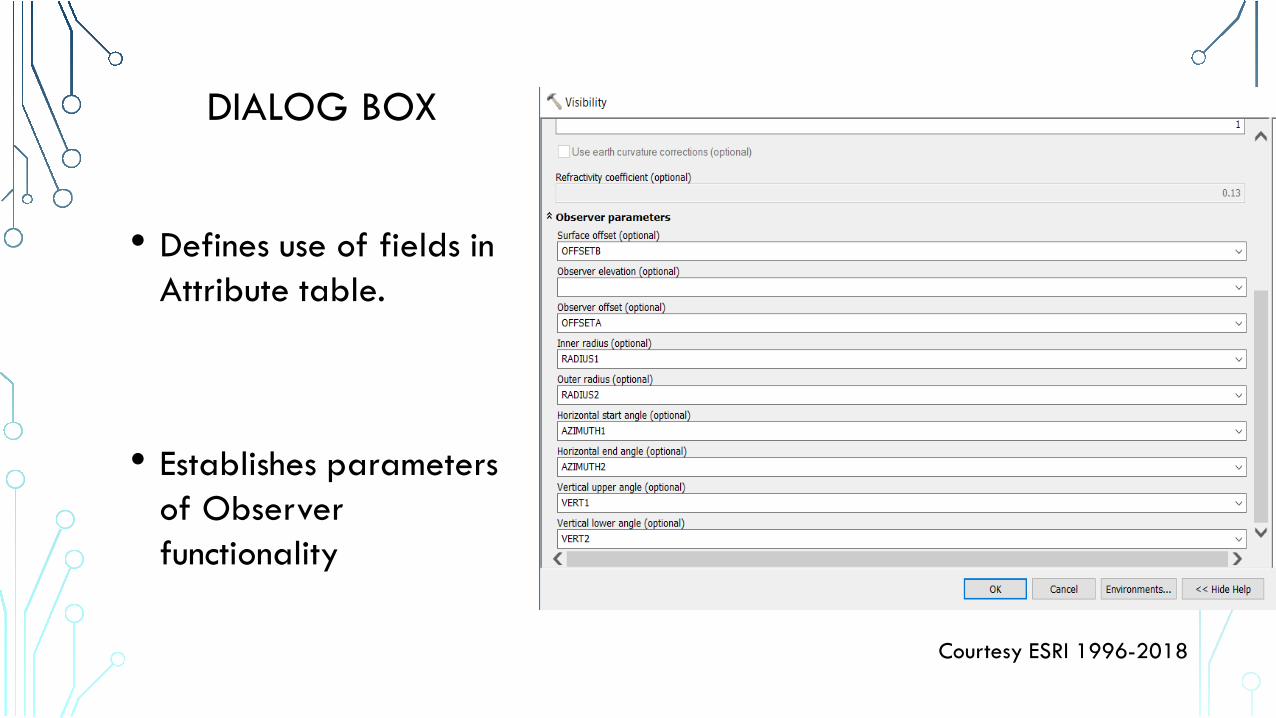
DIALOG BOX
• Defines use of fields in Attribute table.
• Establishes parameters of Observer functionality
Courtesy ESRI 1996-2018

ATTRIBUTE TABLE
• 8 fields identical to “Observer Parameters”• Created for ease of use• Multiple dataset utility
Courtesy(ESRI 1996-2018)

USING THE RIGHT ANGLE CALCULATOR TO DERIVE A “VERT 2”
VERT 2
OFFSET ARADIUS
OFFSET B BVERT2
OBSTRUCTION
a
B
C b
h
A
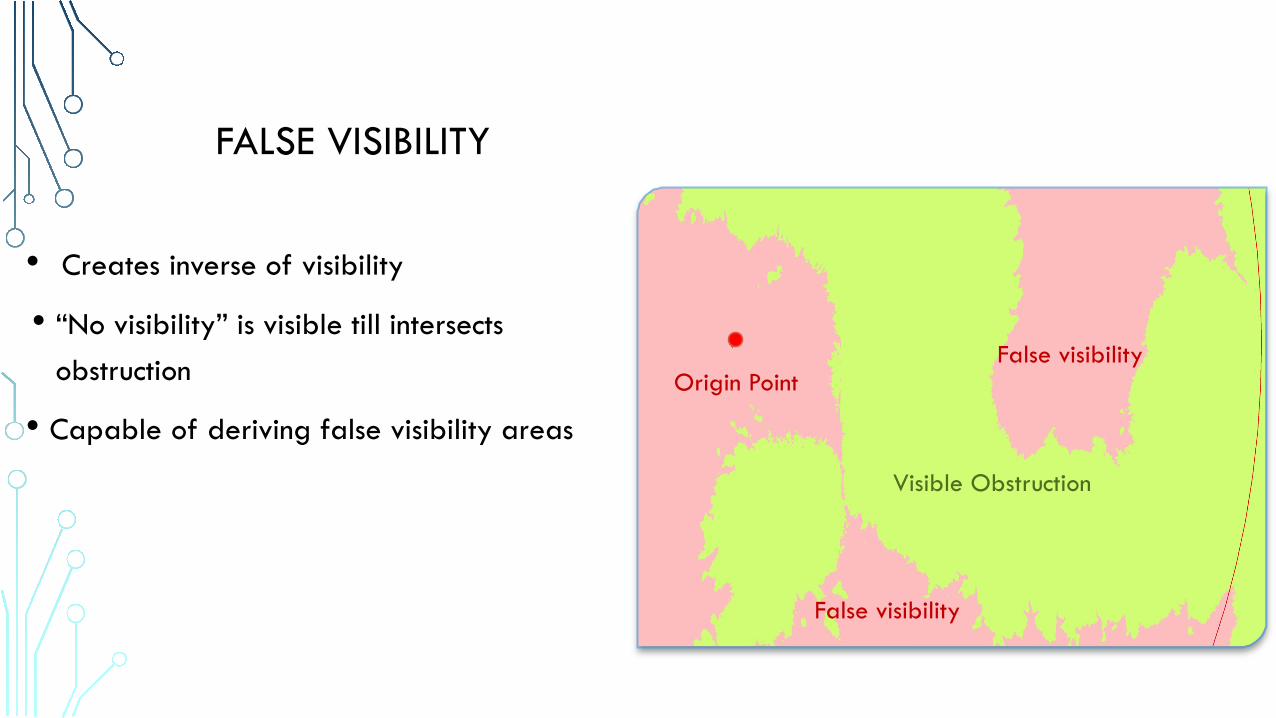
FALSE VISIBILITY
• Creates inverse of visibility
• “No visibility” is visible till intersects obstruction
• Capable of deriving false visibility areas
Origin PointFalse visibility
False visibility
Visible Obstruction
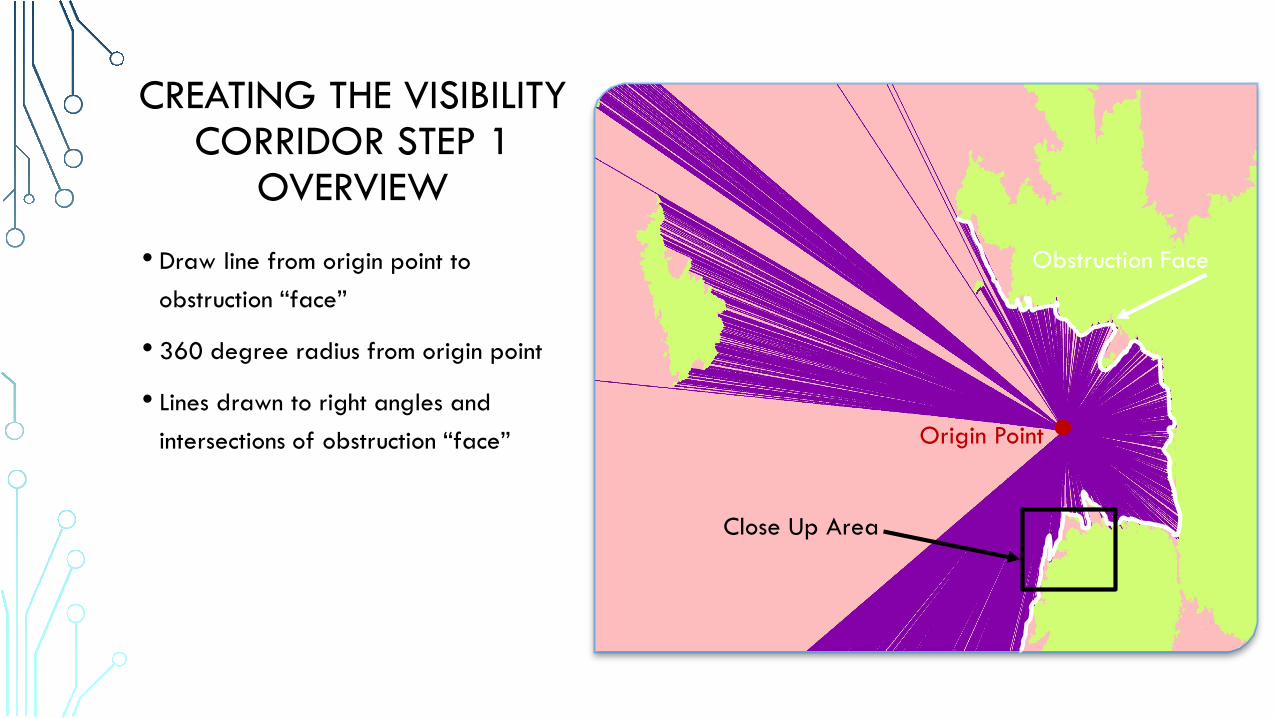
CREATING THE VISIBILITY CORRIDOR STEP 1
OVERVIEW
• Draw line from origin point to obstruction “face”
• 360 degree radius from origin point
• Lines drawn to right angles and intersections of obstruction “face”
Obstruction Face
Origin Point
Close Up Area

CREATING THE VISIBILITY CORRIDOR STEP 1.1
CLOSE UP
Radius extent of UAV
Intersection
Right Angle
Points
• Drawn to right angle of Visible area derived by Visibility Analysis Tool
• Drawn to intersection of Visible area
• Drawn to extent of range \ radius of UAV

CREATING THE VISIBILITY CORRIDOR STEP 2
• Points added to line end points
• Missing lines can be corrected using additional point
• Can be used as a QC \ QA for lines

CREATING THE VISIBILITY CORRIDOR STEP 3
• Polygon is created manually by snapping to points in clockwise direction
• Polygon is the “Visibility Corridor”

RESULTS
• Desert terrain utility of concept
• 30 percent visibility within 27 kilometers
• 1515 points manually plotted
• Manually intensive
SUMMARY AND CONCLUSIONS
•Defined Inverse Azimuthal Viewshed (Visibility Corridor)
•Created methodology for Inverse Azimuthal Viewshed
•Positive utility of Inverse Azimuthal Viewshed
FUTURE CONSIDERATIONS
• Script and Model creation
• Use more precise elevation data
• Use of grid for flight path

REFERENCES• ESRI, ArcMap10.4.2, 1996-2018
• Federal Aviation Administration. Summary of Small Unmanned Aircraft Rule (Part 107), 21 June 2016. https://www.faa.gov/uas/media/Part_107_Summary.pdf. Accessed 26 January 2019.
• GIDAT, ASTER, http://www.gisat.cz/content/en/products/digital-elevation-model/aster-gdem, Accessed 01 January 2019.
• Google, Pythagoras’s Theorem Angle Calculator, http://analyzemath.com\geometry-calculators\right-triangle-calculator, Accessed on 20 January 2019.
• U.S. Department of the Interior, U.S. Geological Survey, ASTER Global DEM, Version 2, NASA EOSDIS Land Processes DAAC, USGS Earth Resources Observation and Science (EROS) Center, Sioux Falls, South Dakota (https://lpdaac.usgs.gov), accessed 26 JAN 2019, at http:// dx.doi.org/ Desert https://gdex.cr.usgs.gov/geoportal_data_cache/20190126210039_238536868.tif