communicating quantitative information everybody to take the psat homework: look up reports on...
TRANSCRIPT

Communicating Quantitative Information
Everybody to take the PSATHomework: Look up reports on school test scores, especially trends. Assess reports.
Quiz Wednesday – Short Answer on Definitions
Quick Review
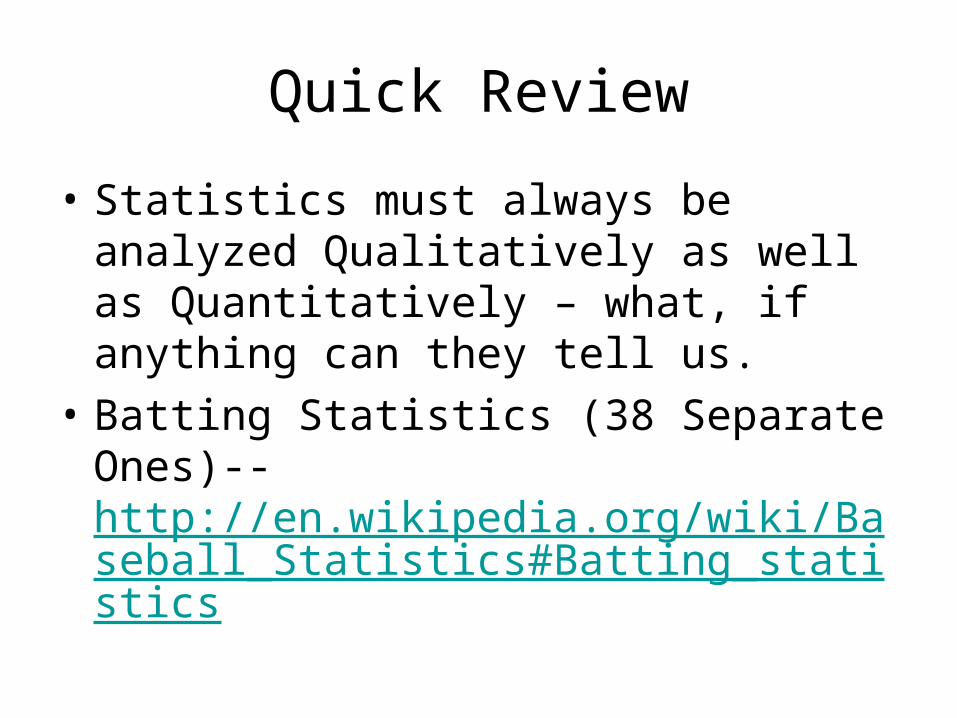
• Statistics must always be analyzed Qualitatively as well as Quantitatively – what, if anything can they tell us.
• Batting Statistics (38 Separate Ones)-- http://en.wikipedia.org/wiki/Baseball_Statistics#Batting_statistics

Quick Review II• Purchase College Potential
• Growth Ann. Increase 0.05 Year Population
• 2001 4000
• 2002 4200
• 2003 4410
• 2004 4631
• 2005 4862
• 2006 5105
• 2007 5360
• 2008 5628
• 2009 5910
• 2010 6205
• 2011 6516
• 2012 6841
• 2013 7183
• 2014 7543
• 2015 7920

Quick Review III• Purchase College Potential Growth Ann. (show formulae -- <ctrl ~>
• Increase 0.05 Year Population
• 2001 4000
• =A6+1 =B6*1.05
• =A7+1 =B7*1.05
• =A8+1 =B8*1.05
• =A9+1 =B9*1.05
• =A10+1 =B10*1.05
• =A11+1 =B11*1.05
• =A12+1 =B12*1.05
• =A13+1 =B13*1.05
• =A14+1 =B14*1.05
• =A15+1 =B15*1.05
• =A16+1 =B16*1.05
• =A17+1 =B17*1.05
• =A18+1 =B18*1.05
• =A19+1 =B19*1.05
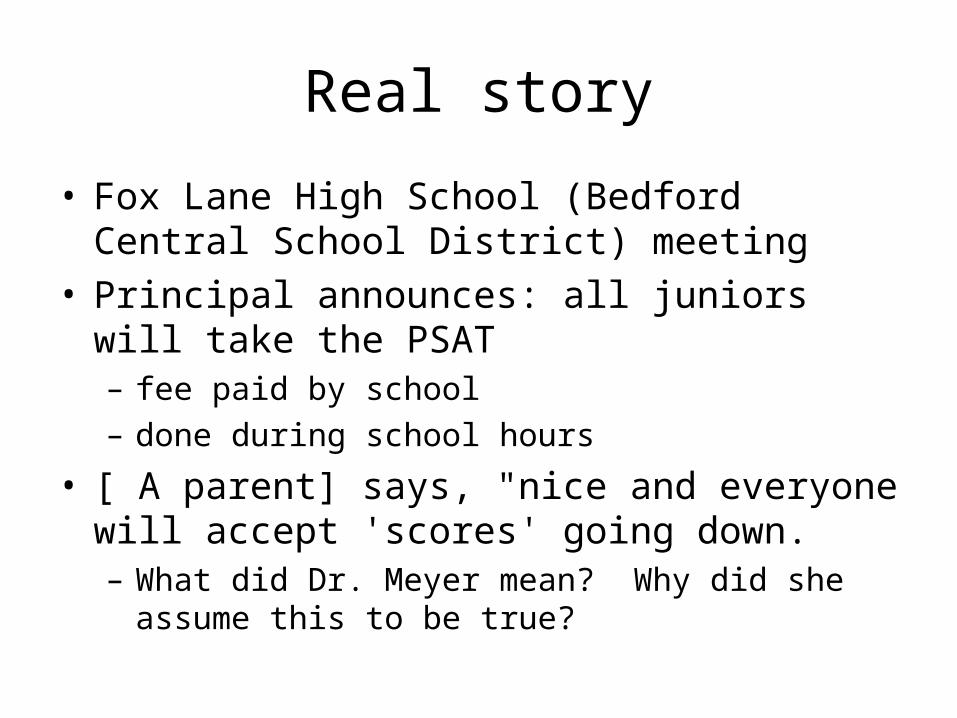
Real story
• Fox Lane High School (Bedford Central School District) meeting
• Principal announces: all juniors will take the PSAT– fee paid by school– done during school hours
• [ A parent] says, "nice and everyone will accept 'scores' going down.– What did Dr. Meyer mean? Why did she assume this
to be true?
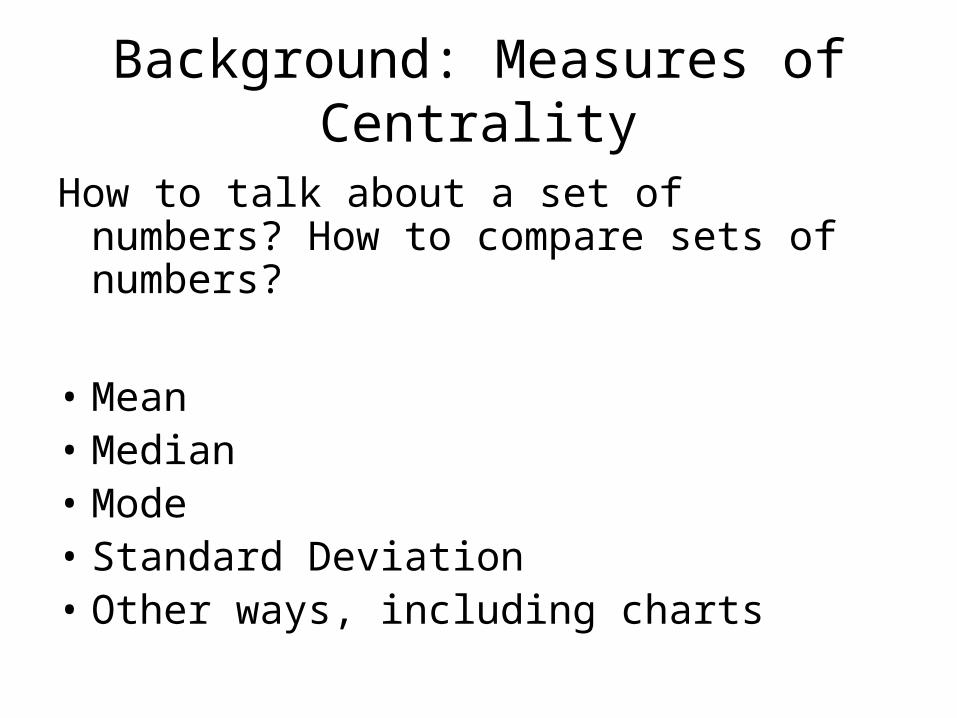
Background: Measures of Centrality
How to talk about a set of numbers? How to compare sets of numbers?
• Mean• Median• Mode• Standard Deviation• Other ways, including charts

Mode
• value that occurs the most times2, 4, 4, 4, 6, 7, 8, 9The mode is 4
• can have multiple values2, 2, 4, 4, 6, 7, 8, 9modes 2 and 4
• Our little examples may not have a unique mode—no instance repeated means each value is a mode.
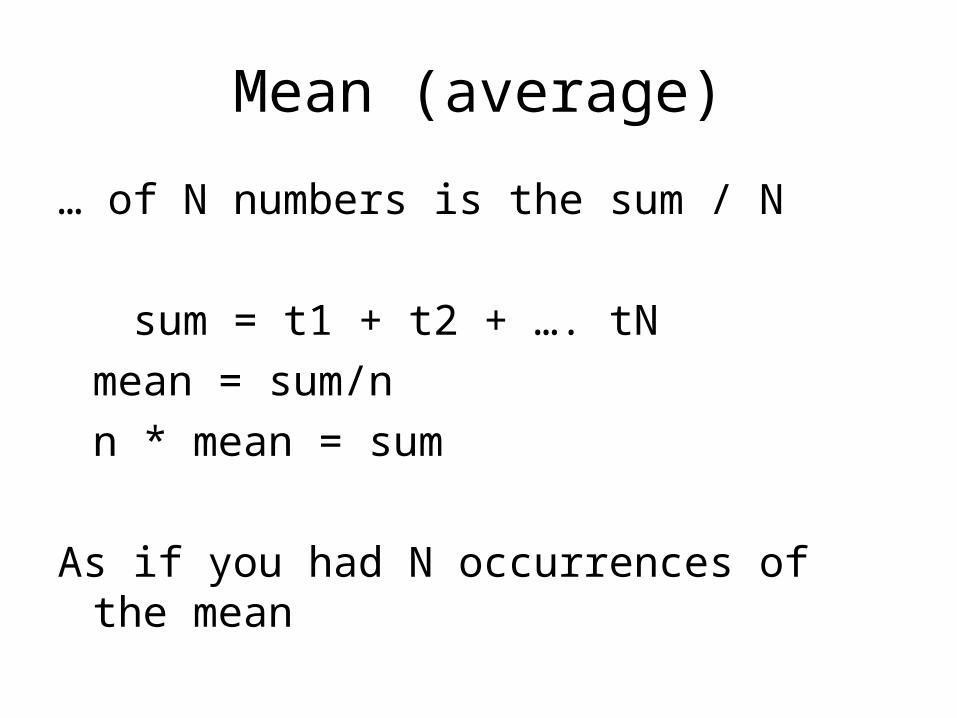
Mean (average)
… of N numbers is the sum / N
sum = t1 + t2 + …. tN
mean = sum/n
n * mean = sum
As if you had N occurrences of the mean

Examples
• What is the mean of: 30, 66, 78, 90?
• Same as the mean of:• 60, 66, 78, 60• 66, 66, 66, 66
• Do same for 48, 55, 75, 92

Mean, continued
• 30, 66, 78, 90 situation (mean is 66)
• If these are class grades (assuming equal weighting) and you make 70 on the next project, will your average go up, down or stay the same? By how much?
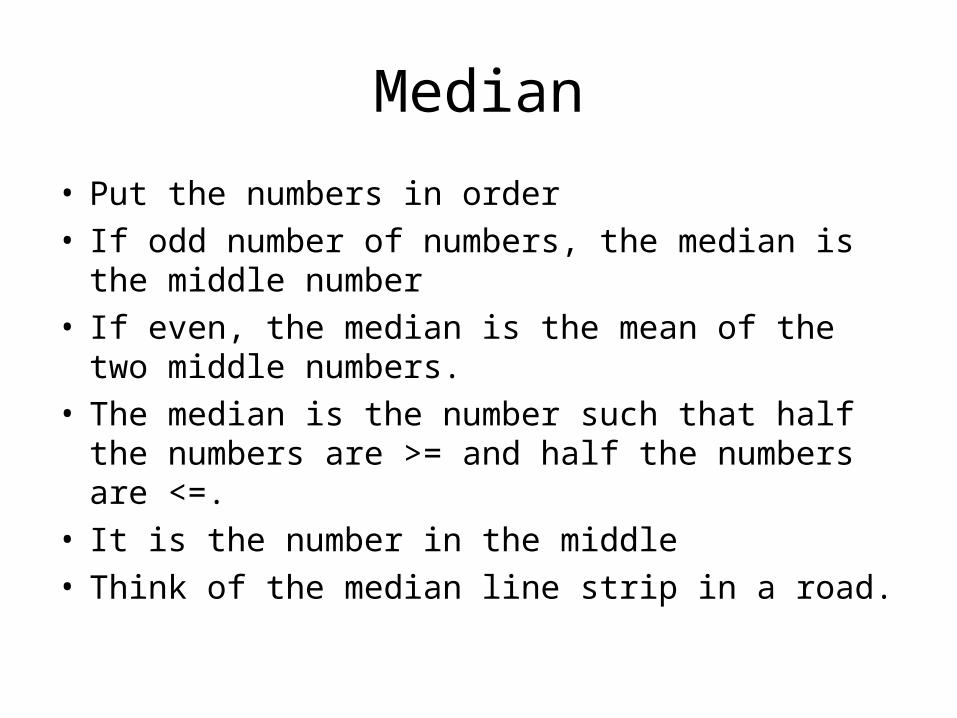
Median
• Put the numbers in order• If odd number of numbers, the median is the
middle number• If even, the median is the mean of the two
middle numbers.• The median is the number such that half the
numbers are >= and half the numbers are <=.• It is the number in the middle• Think of the median line strip in a road.

Median calculations
• 30, 66, 78, 90?
• The median is– mean (average) of 66 and 78 is 72 (72 is 6
more than 66 and 6 less than 78)
• Median of 30, 66, 70, 78, 90 is 70
• Median of– 66000, 120000, 450000, 478000, 1000000– 800000, 450000, 1000000, 356000, 560000

Median vs Mean vs Mode
• No fixed relationship
• In so-called normal distribution, median, mean and mode are the same– The value that occurs the most (mode) is the
average value and is the value in the middle when the values are sorted.
– Normal distribution also is a certain shape
Housing prices
• Median is preferred measurement.
• Why?
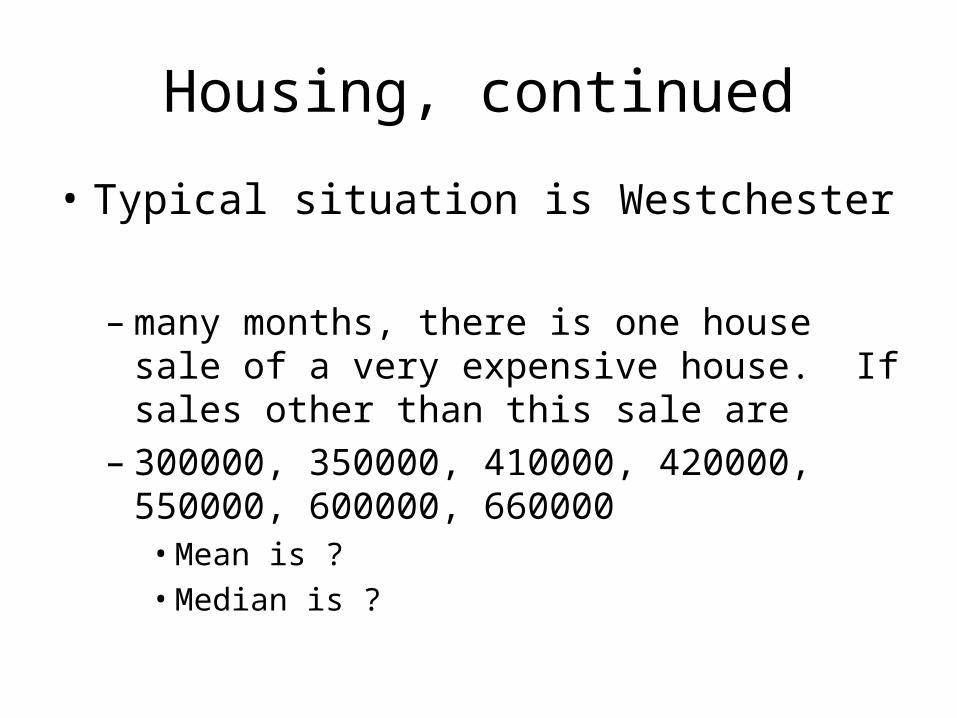
Housing, continued
• Typical situation is Westchester
– many months, there is one house sale of a very expensive house. If sales other than this sale are
– 300000, 350000, 410000, 420000, 550000, 600000, 660000
• Mean is ?• Median is ?
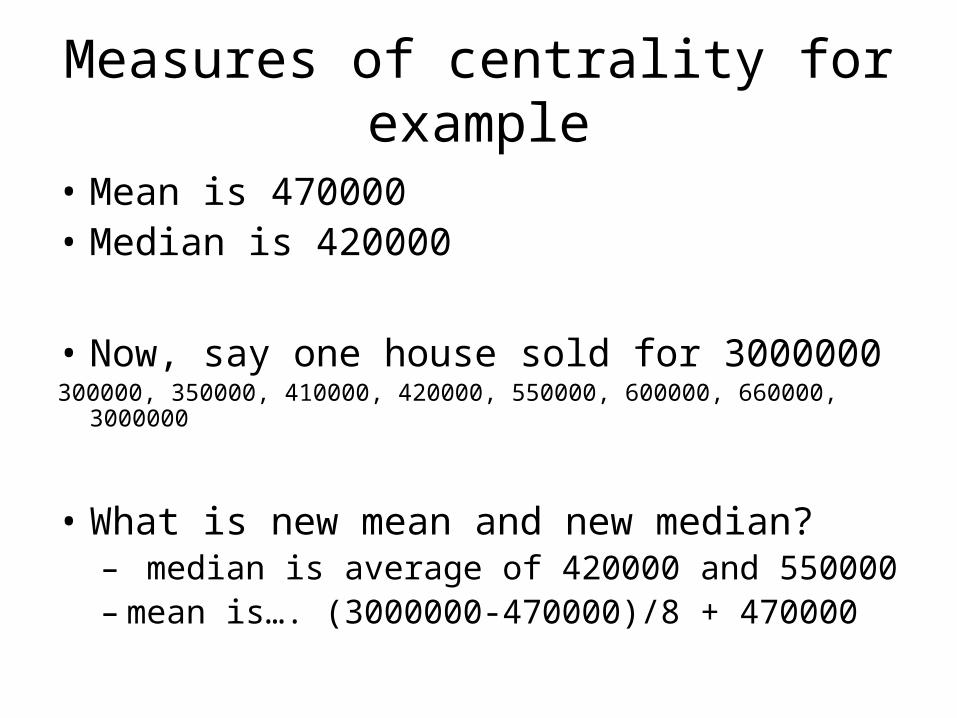
Measures of centrality for example
• Mean is 470000• Median is 420000
• Now, say one house sold for 3000000300000, 350000, 410000, 420000, 550000, 600000, 660000, 3000000
• What is new mean and new median?– median is average of 420000 and 550000– mean is…. (3000000-470000)/8 + 470000
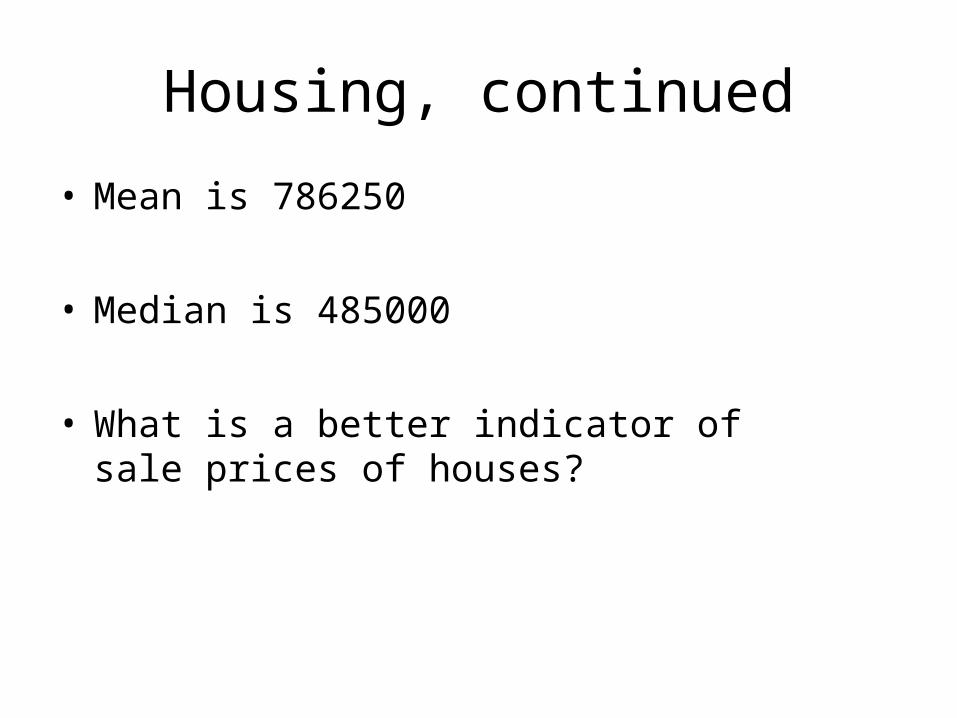
Housing, continued
• Mean is 786250
• Median is 485000
• What is a better indicator of sale prices of houses?
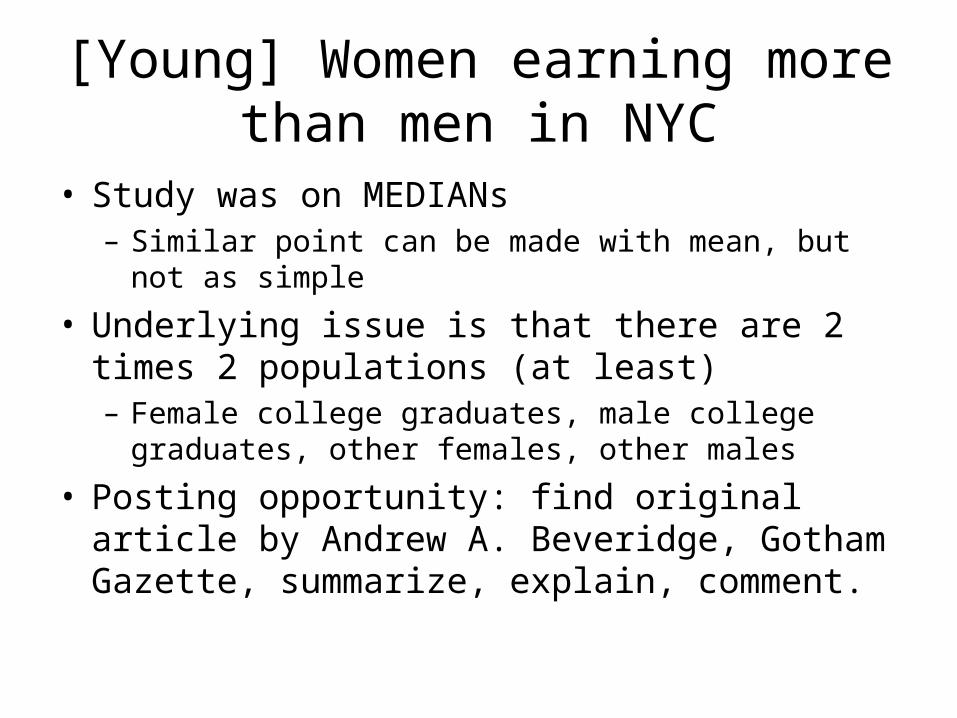
[Young] Women earning more than men in NYC
• Study was on MEDIANs– Similar point can be made with mean, but not as
simple
• Underlying issue is that there are 2 times 2 populations (at least)– Female college graduates, male college graduates,
other females, other males
• Posting opportunity: find original article by Andrew A. Beveridge, Gotham Gazette, summarize, explain, comment.
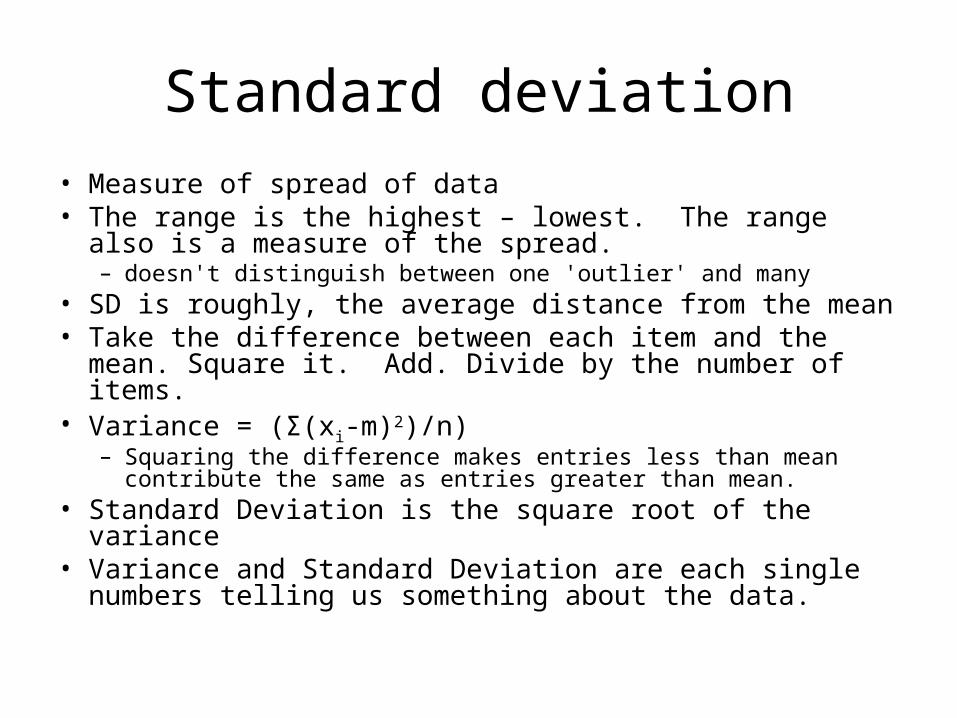
Standard deviation
• Measure of spread of data• The range is the highest – lowest. The range also is a
measure of the spread.– doesn't distinguish between one 'outlier' and many
• SD is roughly, the average distance from the mean• Take the difference between each item and the mean.
Square it. Add. Divide by the number of items.• Variance = (Σ(xi-m)2)/n)
– Squaring the difference makes entries less than mean contribute the same as entries greater than mean.
• Standard Deviation is the square root of the variance• Variance and Standard Deviation are each single
numbers telling us something about the data.

Standard Deviation Example
• Two Sets of Data
• 1,2,3,4,5 1,3,3,3,5
• Range (highest – lowest)
• 5 – 1 = 4 5 – 1 = 4
• Median
• 15 / 5 = 3 15 / 5 = 3
• Yet the data is quite different
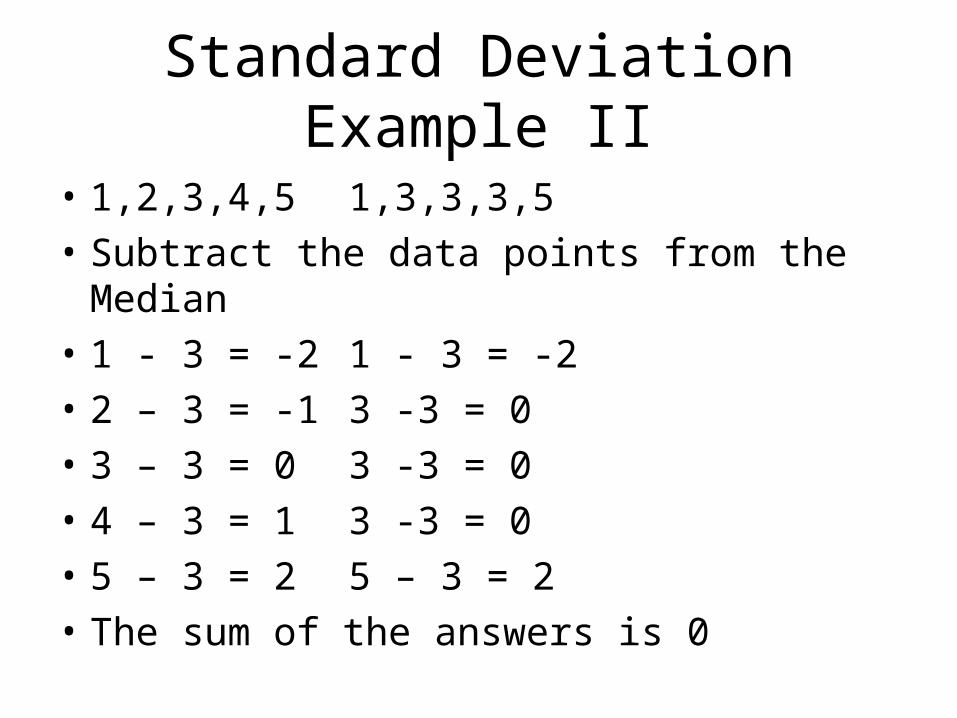
Standard Deviation Example II
• 1,2,3,4,5 1,3,3,3,5
• Subtract the data points from the Median
• 1 - 3 = -2 1 - 3 = -2
• 2 – 3 = -1 3 -3 = 0
• 3 – 3 = 0 3 -3 = 0
• 4 – 3 = 1 3 -3 = 0
• 5 – 3 = 2 5 – 3 = 2
• The sum of the answers is 0

Standard Deviation Example III
• So we need another way – we square the answers
• 1 - 3 = -2 = 4 1 - 3 = -2 = 4
• 2 – 3 = -1 = 1 3 -3 = 0 = 0
• 3 – 3 = 0 = 0 3 -3 = 0 = 0
• 4 – 3 = 1 = 1 3 -3 = 0 = 0
• 5 – 3 = 2 = 4 5 – 3 = 2 = 4

Standard Deviation Example IV
• The “Sum of the Squares” / n (the number of items) is the Variance 10 / 5 = 2 8 / 5 = 1.6
• The Standard Deviation is the Square Root of the Variance (Excel function: =SQRT (cell reference)
• Square Root of 2 = 1.414213562;of 1.6 = 1.264911064

Standard Deviation Example V
• The Variance formula used (The “Sum of the Squares” / n (the number of items)) is when the entire population is being analyzed; if it is a sample (more on that later), the formula is The “Sum of the Squares” / (n – 1) (one less than the number of items)

Standard Deviation Calculation
• Calculating Standard Deviation -- http://www.youtube.com/watch?v=pFGcMIL2NVo
• With Excel -- http://www.youtube.com/watch?v=efdRmGqCYBk&feature=related
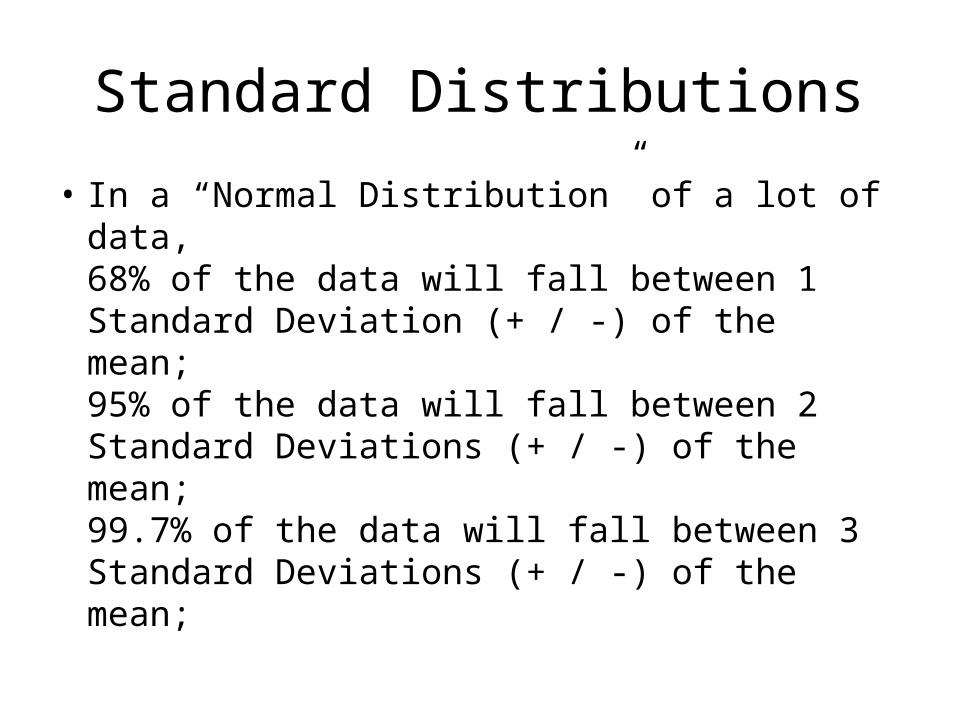
Standard Distributions
• In a “Normal Distribution” of a lot of data,68% of the data will fall between 1 Standard Deviation (+ / -) of the mean;95% of the data will fall between 2 Standard Deviations (+ / -) of the mean;99.7% of the data will fall between 3 Standard Deviations (+ / -) of the mean;
Distributions
• go back to looking at all the data
A distribution keeps track of how many occurrences of each number (or each of a set of ranges).
Class exercise?
• Height
• Hours watching TV since last class– Reporting error?
• Number of CDs
• Change
• ??
Class exercise, continued
• Determine unit or range
• Chart graph

Normal distribution
• Many things but not everything! are distributed normally
Median is mean is mode
Dip (inflection point)

Normal distributions
• Can be fat or thin ….
Smaller variance/std deviation
Larger variance/std deviation
These are continuous curves as if there were quantities at every X point
Distributions
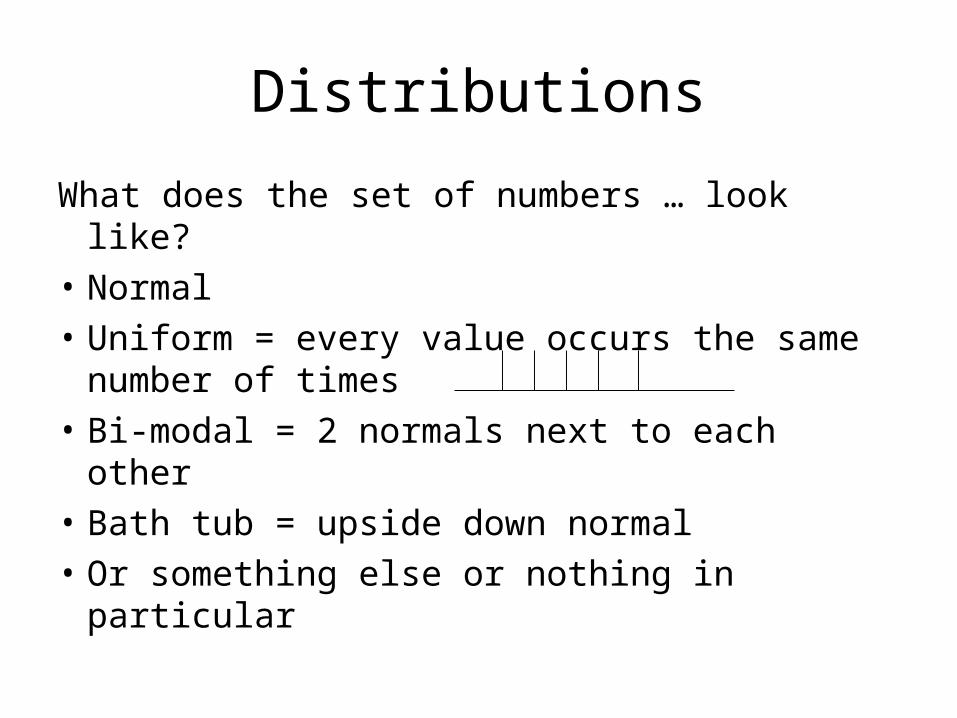
What does the set of numbers … look like?
• Normal
• Uniform = every value occurs the same number of times
• Bi-modal = 2 normals next to each other
• Bath tub = upside down normal
• Or something else or nothing in particular

Two distributions
• 100000, 100000, 100000, 500000, 500000, 500000– What is mean? What is median?
• 300000, 300000, 300000, 300000, 300000, 300000– What is mean? What is median?

….two distributions
• Same 2 measures but very different distributions

Back to the PSAT story
• Why did I say…scores would go down?
• It is/was not definite, but pretty likely…
• Population that chose to take the PSAT when it was harder to take was more likely to be better prepared.
• New procedure added….more at low end, more 'low outliers'….

General principle
• Sample versus (whole) population
• The juniors who took the test when it was an individual choice were a sample of the population. The new policy was to include the whole population.
• How can you characterize the (old) sample?– more partial to going to college….
Questions to ask
• What is the denominator: Is this a whole population or a sample?
• If a sample, what are factors controlling the sample?

Real story: Library bond
• In the run-up to election day (Nov 8, 2005) for a bond resolution– Village of Mt. Kisco to borrow money to build new
library
• Issue: what will the cost be to the taxpayer to re-pay the bond?
• Answer: depends on [your home] assessment– For example, home assessed at $33,000 (which is the
median assessment) would pay $124.– If your home is assessed at more, you would pay
proportionately more, if less, you would pay less

Problem
• Definition and context• Mt. Kisco has two systems of assessments:
Village and Town.• Village is less than Town and both are much,
much less than 'market value'• The $33,000 figure caused real confusion!• Attempted to get reporter to either omit the
number OR say more in the article. Not sucessful.
• Did succeed in getting costs of the status quo (not building a new library) into news, publicity.
• www.mtklibraryfoundation.org
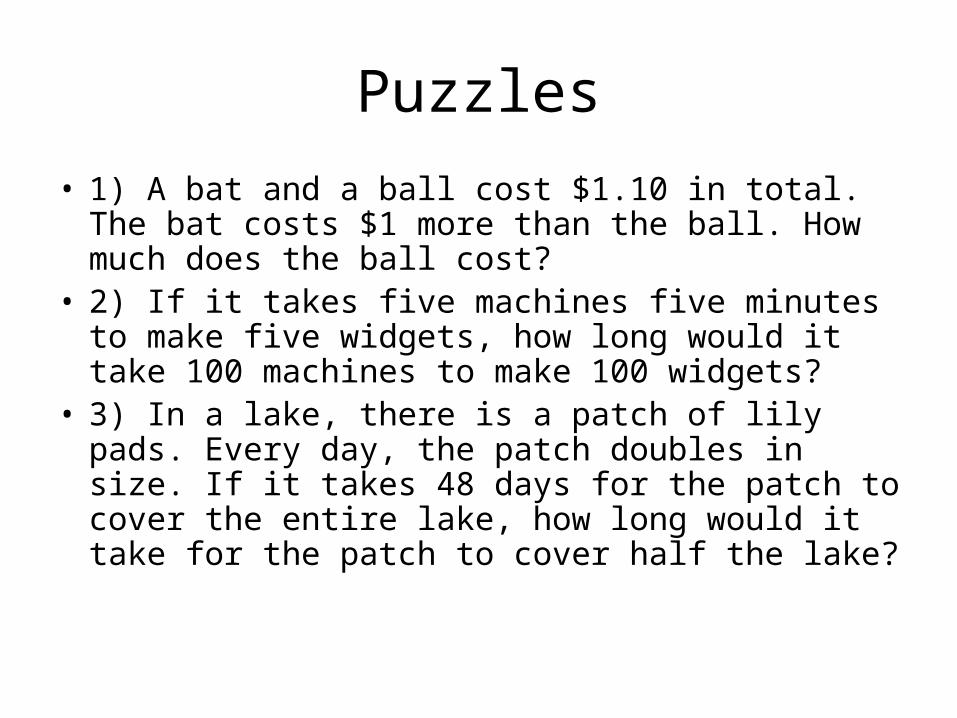
Puzzles
• 1) A bat and a ball cost $1.10 in total. The bat costs $1 more than the ball. How much does the ball cost?
• 2) If it takes five machines five minutes to make five widgets, how long would it take 100 machines to make 100 widgets?
• 3) In a lake, there is a patch of lily pads. Every day, the patch doubles in size. If it takes 48 days for the patch to cover the entire lake, how long would it take for the patch to cover half the lake?

Puzzles from study on risk
• New York Times article by Virginia Postrelhttp://www.nytimes.com/2006/01/26/business/26scene.html?_r=1about study by Shane Frederickmit.edu/people/shanefre/publications.htm
Getting answers right (in one study among college students) correlated with willingness to take riskNot clear if distinction was made regarding level of risk.
Puzzle
• Sock drawer holds: 10 white socks, 10 black socks and 1 gray sock. What is the maximum number of socks that can be removed until getting a matching pair?(a sample of size X guarantees a pair)
Puzzle
• 32 cards are dealt from a well-shuffled deck of 52 cards. The deck contains 26 red and 26 black cards. What is the difference between the number of black cards among the 32 dealt and the red cards remaining in the deck?
Homework
• Study Definitions for Quiz
• Keep up with postings.– Find multiple sources on same topic
• Look up SAT or PSAT or other educational tests and comment.