commonwealth of pennsylvania state employees’ · pdf file2016 - 2017 strategic...
TRANSCRIPT

2016 - 2017 Strategic Investment Plan
Commonwealth of PennsylvaniaState Employees’ Retirement System
Prepared by SERS’ Investment Office – in consultation with the State Employees’ Retirement Board (“SERS board”) and its investment consultants. Adopted by SERS’ board on December 9, 2015.
The framework to SERS’ 2016 – 2017 Strategic Investment Plan was developed under the assumption that the employer will contribute the full contribution prescribed by Pennsylvania Law (Act 2010-120).
Comprehensive Annual Financial ReportFor the year ended December 31, 2013
Commonwealth of PennsylvaniaState Employees’ Retirement System
A Component Unit of the Commonwealth of Pennsylvania
Prepared by the staff of thePennsylvania State Employees’ Retirement System
David E. DurbinExecutive Director
Anthony J. FaiolaChief Financial Officer
State Employees’ Retirement System30 N 3rd St, Suite 150Harrisburg, PA 17101-17161.800.633.5461www.SERS.state.pa.us
201
3


30 NORTH 3RD STREET, SUITE 150 | HARRISBURG, PA 17101-1716
P: 1.717.787.9008 | F: 717.772.3741 | www.SERS.pa.gov
December 09, 2015
Dear SERS’ Board Members:
On behalf of SERS’ investment office, I am pleased to provide the board with the 2016 – 2017 Strategic
Investment Plan (“Investment Plan”). The board’s consultants and staff collaborated extensively and fully
support this Investment Plan and target asset allocation portfolios under consideration.
SERS’ outstanding long-term and post crisis track record was a result of the board’s historical adherence
to a consistently executed strategic asset allocation planning process, which has been in place for over 20
years. Several key points include:
SERS’ historical, long-term investment returns (net-of-fees) have exceeded its actuarial targets
over 20-year (+8.8%), 25-year (+8.7%), and 30-year (+9.6%) periods (ending December 31,
2014);1
10.7% return (net-of-fees) since the great financial crisis while ranking in the top 5th percentile of
peer funds in terms of its low risk profile (April 1, 2009 to June 30, 2015); and
$73 million reduction in annual total investment costs from 2009 to 2014, a 28% reduction in fees
over the past five years.
Note: Fee reduction calculated by subtracting total investment expenses of $260 million (SERS 2009
CAFR) from $187 million (SERS 2014 CAFR).
As previously indicated, SERS takes a long–term strategic approach to its investment decision–making
process. SERS’ Investment Plan is based on careful analysis of the long–term outlook for the capital
markets and major qualitative and quantitative factors including the unique needs, preferences, objectives
and constraints of SERS. This detailed investment plan manifests itself in the development of an asset
allocation framework designed to achieve the ongoing commitment to diversification and provide
1 SERS uses calendar year returns for longer-term performance reporting as provided in SERS’ 2014 CAFR.
2009 $260 million
2014 $187 million
$73 million annual reduction
SERS Annual Total Investment Costs

30 NORTH 3RD STREET, SUITE 150 | HARRISBURG, PA 17101-1716
P: 1.717.787.9008 | F: 717.772.3741 | www.SERS.pa.gov
guidance in the investment decision–making process including advancing investment strategies, the hiring
and monitoring of external investment managers, and meeting liquidity needs.
The majority of initiatives and enhancements in the updated 2016 – 2017 Strategic Investment Plan are
based on input from the board during several asset class reviews at board meetings over the past year.
While a complete list of initiatives and enhancements to the investment program are included in the
Investment Plan, the most significant of these are:
1. Performing a review of all investment manager fees to determine if fees are aligned with SERS’
best interests and are reasonable relative to market rates for comparable strategies in each
investment asset class.
2. Clarifying Real Estate’s role by reestablishing Real Estate as a stand-alone asset class. Real
Estate is already comprised of complex, labor intensive public and private market assets. As a
stand-alone asset class, Real Estate is now a more narrowly-defined portfolio which enables more
focus when considering investment opportunities, clarifies consultant accountability, and
leverages the skill sets of SERS’ investment professionals from other asset classes.
3. Improving Real Estate’s risk/return profile by establishing clear long-term target allocations
designed to increase the expected return, liquidity, diversification, and inflation hedging, while
decreasing expected risk.
4. Establishing an annual pacing range of new commitments for Real Estate between $100 million
to $200 million to less liquid non-core closed-end Real Estate funds. Real Estate investment
opportunities other than non-core closed-end funds will be evaluated on a case-by-case basis.
5. Target Real Estate fund commitments ranging from $50 million to $100 million in best-in-class
funds to build long-term strategic partnerships, improve operational efficiency by reducing the
number of funds, and improve SERS’ leverage to negotiate lower management fees.
6. Increasing the annual pacing of new commitments for Private Equity (Alternative Investments) to
$750 million (currently at $500 million) to meet the base-case long-term target allocation of 16%.
7. Targeting individual Private Equity fund commitments of approximately $100 million or greater,
in best-in-class funds to build long-term strategic partnerships, improve operational efficiency by
reducing the number of funds, and improve SERS’ leverage to negotiate lower management fees.

30 NORTH 3RD STREET, SUITE 150 | HARRISBURG, PA 17101-1716
P: 1.717.787.9008 | F: 717.772.3741 | www.SERS.pa.gov
In 2014 and 2015, SERS selected Private Equity funds launched by general partners with a
historical average net return (IRR) of approximately 24% and an average net multiple (TVM) of
1.7x.2
8. Providing three long-term target asset allocation scenarios for the board’s consideration using
RVK’s updated capital market assumptions.
9. Improving transparency and efficiency of managing assets by eliminating SERS’ specific
terminology and renaming assets according to common industry conventions with similar
risk/return profiles (Private Equity, Buyouts, Hedge Funds, Core Real Estate, Non-Core Real
Estate, and Cash).
10. Assessing the impact on the investment planning process and potential increase in employee
contributions from the Shared Risk provisions from Act 2010-120.
Under the supervision and guidance of the board, please be assured that SERS’ investment staff, as
fiduciaries to over 230,000 members, will carry out its duties prudently, act solely in the interest and for
the exclusive purpose of members, and act in accordance with law and plan documents.
Please contact me if you have any comments.
Sincerely,
Thomas F. Brier
Chief Investment Officer
2 Source: StepStone Group. Return is IRR and Multiple is Total Value Multiple based on “since-inception” of funds.
TVM, or Total Value Multiple, is a performance metric that measures total value created by the Portfolio relative to
capital invested, without consideration for time. TVM is calculated as Total Value, which is comprised of Market
Value plus Distributed Capital, divided by Contributed Capital. Fund benchmark data provided by Burgiss Private
iQ as of March 31, 2015.
10%
15%
20%
25%
30%
1.0 1.1 1.2 1.3 1.4 1.5 1.6 1.7 1.8 1.9 2.0
Ne
t IR
R
Net TVM
Historical Performance of General Partners Selected by SERS (2014-2015)
2014 Average 2015 Average
Burgiss Private iQ 10-Year All Private Equity = 11%


Table of Contents
Investment Plan Purpose 1
Challenging Liquidity Requirements 3
Shared Risk – Potential Impact on Employee Contributions 4
A Well-Defined Investment Philosophy and Process 5
Key Objectives 7
Forward Vision 8
Asset Liability Study 11
Asset Allocation Policy 11
Asset Classes 15
Private Equity 15
Global Public Equity 18
Real Estate 19
Hedge Funds 22
Fixed Income 23
Cash 24
Benchmarks 25
Appendix 1-3 28


Pennsylvania State Employees’ Retirement System 2016 – 2017 Strategic Investment Plan 1
Investment Plan Purpose
SERS’ Statement of Investment Policy established two objectives for SERS’ investment
program. The two investment objectives are:1
Achieve a net total return equivalent to the actuarial interest rate assumption, or
preferably, in excess of this rate in order to improve the funded ratio of the fund through
investment earnings and favorably impact future employer and employee contribution
rates.
Achieve a net, total long-term return that meets or exceeds an appropriate composite plan
benchmark index on a five to ten-year rolling time horizon. The composite benchmark
index will be based on the asset allocation set forth in the Strategic Investment Plan
approved by the board.
The 2016 – 2017 Strategic Investment Plan (“Investment Plan”) provides a clear strategic
direction for SERS’ investment program. The State Employees’ Retirement Board seeks to
pursue five key objectives in this Investment Plan.
1. Formulate an asset allocation policy that provides a high expected probability of
achieving SERS’ long-term actuarially assumed rate of return, consistent with the board’s
tolerance for risk, while continuing to meet obligations to beneficiaries.
2. Define the primary strategic objectives that are central to a successful investment
program for the total SERS fund at this point in time.
3. Define, in general terms, the strategies and methods to be pursued at both the total fund
and individual asset class levels to achieve those objectives.
4. Provide a tool for integrating key aspects of SERS’ pension plan attributes with the
investment strategy and, similarly, for integrating board decisions and staff execution
with that strategy.
5. Embed the pursuit of fund returns in a comprehensive risk monitoring and mitigation
program which emphasizes transparency in both the execution of investment policy and
the outcomes in varying capital market environments encountered over time.
SERS’ investment office staff, in consultation with its board and investment consultants, updates
the Investment Plan every other year. If economic, fiscal, or capital market conditions change
significantly, SERS’ investment office staff and consultants may recommend changes to the
1 SERS Statement of Investment Policy (amended 10/29/2014) (p.8).

Pennsylvania State Employees’ Retirement System 2016 – 2017 Strategic Investment Plan 2
Investment Plan for the board’s approval on an interim basis. Approval of this Investment Plan
by SERS’ board authorizes SERS’ investment office staff to:
Execute the current asset class changes;
Strive towards asset allocation policy targets; and
Begin to research and implement initiatives.
SERS’ investment office staff will report its recommendations to SERS’ board for consideration.

Pennsylvania State Employees’ Retirement System 2016 – 2017 Strategic Investment Plan 3
Challenging Liquidity Requirements
SERS is a mature pension plan with negative cash flows – retirement benefit payments are
greater than contributions from employees and employers. Over the past decade, SERS paid over
$24 billion in retirement benefits to over 100,000 members and their families. During the same
period, SERS received contributions of $3.4 billion from employees and $4.2 billion from
employers.2
Over the next 10 years, SERS projected monthly retirement benefit payments will increase from
just under $100 million to $140 million (net of contributions from employees and employers
under Act 2010-120 assumptions). 3
A critical risk factor to consider is the potential for prolonged suppressed cash payments from
employers during difficult state government budget cycles. Over the next 10 years, the average
annual employer contribution is expected to increase to approximately 28% of payroll. Figure 1
shows the average monthly cash outflows from SERS after employee and employer
contributions.
Figure 1
2 10-years ending December 31, 2014. 3 SERS’ 2014 Actuarial Report (p.31), Projection of Expected Contributions and Benefits – Reflecting Act 2010-120
Collars.
($180)
($140)
($100)
($60)
($20)
20
05
20
06
20
07
20
08
20
09
20
10
20
11
20
12
20
13
20
14
20
15
20
16
20
17
20
18
20
19
20
20
20
21
20
22
20
23
20
24
20
25
Average Monthly Cash Outflows from SERS' Fund - Shown by Year(After Employee and Employer Contributions)
Projections
$ In Millions
Pennsylvania State Employees’ Retirement System 2016 – 2017 Strategic Investment Plan 4
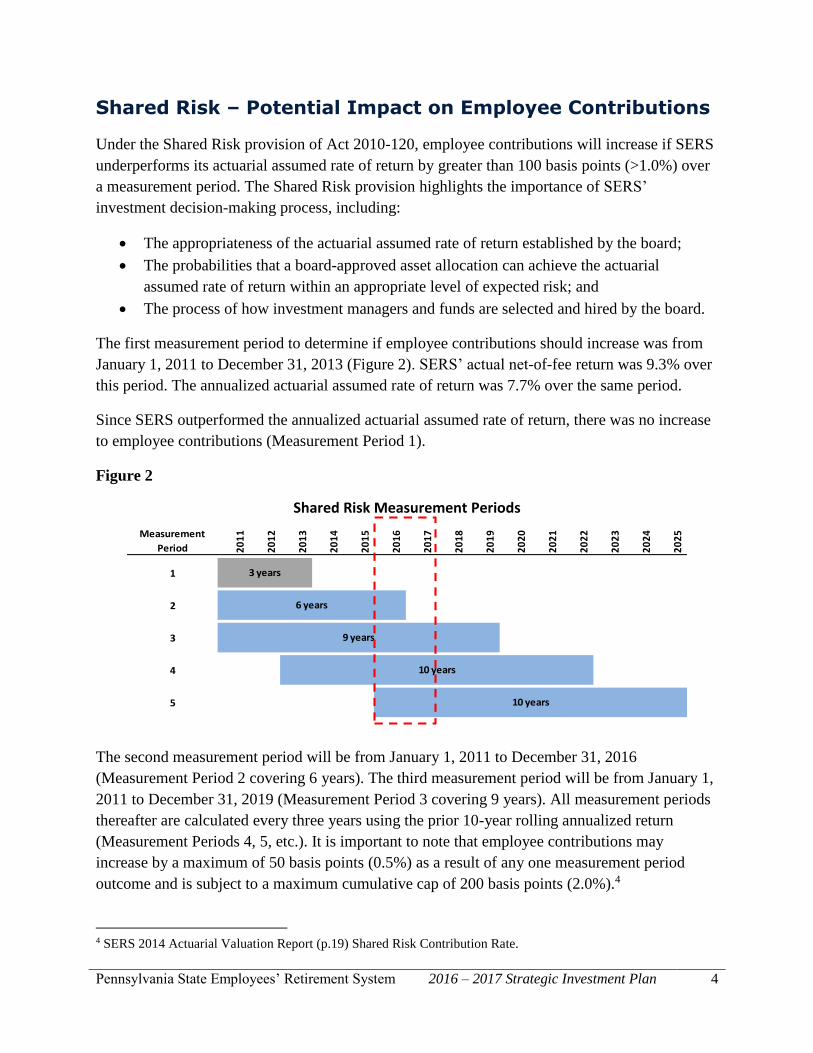
Shared Risk – Potential Impact on Employee Contributions
Under the Shared Risk provision of Act 2010-120, employee contributions will increase if SERS
underperforms its actuarial assumed rate of return by greater than 100 basis points (>1.0%) over
a measurement period. The Shared Risk provision highlights the importance of SERS’
investment decision-making process, including:
The appropriateness of the actuarial assumed rate of return established by the board;
The probabilities that a board-approved asset allocation can achieve the actuarial
assumed rate of return within an appropriate level of expected risk; and
The process of how investment managers and funds are selected and hired by the board.
The first measurement period to determine if employee contributions should increase was from
January 1, 2011 to December 31, 2013 (Figure 2). SERS’ actual net-of-fee return was 9.3% over
this period. The annualized actuarial assumed rate of return was 7.7% over the same period.
Since SERS outperformed the annualized actuarial assumed rate of return, there was no increase
to employee contributions (Measurement Period 1).
Figure 2
Shared Risk Measurement Periods
Measurement
Period 20
11
20
12
20
13
20
14
20
15
20
16
20
17
20
18
20
19
20
20
20
21
20
22
20
23
20
24
20
25
1
2
3
4
5
3 years
6 years
9 years
10 years
10 years
The second measurement period will be from January 1, 2011 to December 31, 2016
(Measurement Period 2 covering 6 years). The third measurement period will be from January 1,
2011 to December 31, 2019 (Measurement Period 3 covering 9 years). All measurement periods
thereafter are calculated every three years using the prior 10-year rolling annualized return
(Measurement Periods 4, 5, etc.). It is important to note that employee contributions may
increase by a maximum of 50 basis points (0.5%) as a result of any one measurement period
outcome and is subject to a maximum cumulative cap of 200 basis points (2.0%).4
4 SERS 2014 Actuarial Valuation Report (p.19) Shared Risk Contribution Rate.

Pennsylvania State Employees’ Retirement System 2016 – 2017 Strategic Investment Plan 5
A Well-Defined Investment Philosophy and Process
SERS’ board, investment office staff, and external consultants spend a considerable amount of
time evaluating liquidity, shared risk, capital markets, expected returns, and expected risks. With
these factors in mind, SERS’ investment program has a critical requirement to pay retirement
benefits in perpetuity and may be subject to prolonged periods of market decline. To avoid a
permanent loss of capital during such a period, SERS’ investment program has a continuing
commitment to ensure that:
The fund is diversified which serves as a foundation of risk management;
Investment strategies embrace risk in order to achieve returns since a risk-free
investment strategy does not exist;
A disciplined process to rebalancing is executed to adhere as closely as possible to the
board’s chosen target asset allocation;
Every dollar invested must align to an initiative or an asset class structure of the board-
approved Strategic Investment Plan; and
Every dollar invested must have the potential to add exceptional value relative to its
competing investment opportunities with similar risk/return, fee and liquidity profiles.
SERS’ investment program has a continuing commitment to conduct thorough due diligence,
intensive manager monitoring, and continuously enhancing its disciplined investment decision-
making process. Although it requires extensive time and resources, the goals of SERS’
disciplined investment process are to:
Improve the probability of achieving long-term expected return objectives;
Ensure confidence that all investment opportunities recommended by investment staff
and consultants are the best available opportunities; and
Enhance accountability of investment decisions from investment office staff.
SERS’ investment program is structured with a long-term focus and is based on a combination of
academic theory, market and economic assumptions, and state budgetary assumptions. The
theoretical framework relies on a mean-variance optimization analysis which combines expected
returns, volatility, and covariance of investment combinations. A long-term asset allocation
target policy is constructed to provide a high probability of achieving SERS’ long-term

Pennsylvania State Employees’ Retirement System 2016 – 2017 Strategic Investment Plan 6
actuarially assumed rate of return, consistent with the board’s tolerance for risk, while continuing
to meet retirement benefit payment obligations in perpetuity.
SERS’ investment program endeavors to maintain an appropriate level of cash to pay benefits
through prolonged periods of market and economic decline.

Pennsylvania State Employees’ Retirement System 2016 – 2017 Strategic Investment Plan 7
Key Objectives
After assessing the current status of the pension plan, the fund’s existing structure, and the
studies/recommendations of SERS’ staff, general consultant, and specialist consultants, the board
adopts four key objectives.
Objective #1
Pursue the highest returns possible at the level of risk deemed prudent by the board.
The board takes note of its current long-term assumed fund rate of return of 7.5% in both setting
its asset allocation—the largest determinant of both risk and return in the fund—as well as in
executing each investment in each asset class. The board recognizes that at any point in time,
however, depending on market conditions and the board’s assessment of risk, the probability of
achieving the assumed rate will vary.
Objective #2
Reduce gradually the percentage of fund assets committed to long-term illiquid
investments.
After reviewing the system’s increasing maturity, the results of the asset/liability study, and the
risks associated with the forced sale of liquid assets at undesirably low valuations in market
declines, the board has determined that a steady decline in illiquid investments to a level better
aligned with the system’s current and evolving structure is appropriate.
Objective #3
Continue to maintain vigorous and highly transparent performance monitoring and board
education programs.
The challenges facing fiduciaries in responsibly managing the prudent investment of more than
$27 billion across multiple asset classes, scores of investment mandates, and thousands of
individual securities and other assets are immense. To this end, the board, working with SERS’
staff and consultants, will work to maintain—and enhance, where possible—the ongoing
monitoring program as well as the board’s understanding of institutional investing via a series of
educational sessions.
Objective #4
Continue to maintain a comprehensive risk monitoring and mitigation program.
It is crucial to focus on the risks that are likely to have the largest effect on the fund’s assets and,
in turn, the fund’s ability to ensure payment of current and future benefits.

Pennsylvania State Employees’ Retirement System 2016 – 2017 Strategic Investment Plan 8
Forward Vision
Although significant accomplishments to improve returns and reduce fees have been achieved,
SERS’ investment program strives for continuous improvement to utilize best practices to
achieve or exceed its expected return, while controlling costs.
As a long-term investor, SERS remains committed to utilizing best practices in governance, asset
allocation, and risk management. Accordingly, SERS will continue to enhance its efficiency,
while simultaneously allocating resources to low-cost passive strategies or best-in-class actively
managed opportunities where the board, investment office, and external consultants have the
highest conviction that the opportunities can generate excess return.
All of the 2016 – 2017 Strategic Investment Plan initiatives listed below focus on achieving
SERS’ long-term expected return of 7.5%.
Strategic Initiatives
Private Equity and Real Estate
1. Increase the annual pacing of new commitments for Private Equity (Alternative Investments)
to $750 million (currently at $500 million) to meet the base-case long-term target allocation
of 16%.
2. Target Private Equity fund commitments of approximately $100 million or greater, in best-
in-class funds to build long-term strategic partnerships, improve operational efficiency by
reducing the number of funds, and improve SERS’ leverage to negotiate lower management
fees.
3. Establish an annual pacing range of new commitments for Real Estate between $100 million
to $200 million to less liquid non-core closed-end Real Estate funds. Real Estate investment
opportunities other than non-core closed-end funds will be evaluated on a case-by-case basis.
4. Target Real Estate fund commitments ranging from $50 million to $100 million in best-in-
class funds to build long-term strategic partnerships, improve operational efficiency by
reducing the number of funds, and improve SERS’ leverage to negotiate lower management
fees.
5. Research third-party Private Equity programs to consolidate and administer SERS’ non-core
Private Equity funds.
6. Clarify Real Estate’s role by reestablishing Real Estate as a stand-alone asset class. Real
Estate is already comprised of complex, labor intensive public and private market assets. As

Pennsylvania State Employees’ Retirement System 2016 – 2017 Strategic Investment Plan 9
a stand-alone asset class, Real Estate is now a more narrowly-defined portfolio which enables
more focus when considering investment opportunities, clarifies consultant accountability,
and leverages the skill sets of SERS’ investment professionals from other asset classes.
7. Improve Real Estate’s risk/return profile by establishing clear long-term target allocations
designed to increase the expected return, liquidity, diversification, and inflation hedging,
while decreasing expected risk.
8. Further diversify SERS’ Real Estate program by expanding Core Real Estate investments,
and new initiatives in Timber and Agriculture.
9. Research the viability of reinstituting / implementing an in-state Real Estate separate account
investment program focused on investing exclusively within the Commonwealth of
Pennsylvania.
Hedge Funds
10. Recommend and implement an optimal structure for SERS’ Hedge Fund program (fund-of-
hedge funds or direct investments structure).
Global Public Equity and Fixed Income
11. Research and implement optimal active and passive allocations within SERS’ Global Public
Equity and Fixed Income programs.
12. Research optimal structures to enhance global mandate and emerging market equity
investment opportunities.
13. Research optimal inflation protection exposure levels and strategies.
14. Research the viability of implementing an emerging investment manager program for public
equities.
Total Fund Level
15. Perform a review of all investment manager fees to determine if fees are aligned with SERS’
best interests and are reasonable relative to market rates for comparable strategies in each
investment asset class.

Pennsylvania State Employees’ Retirement System 2016 – 2017 Strategic Investment Plan 10
16. Improve transparency and efficiency of managing assets by eliminating SERS’ specific
terminology and renaming assets according to common industry conventions with similar
risk/return profiles (Private Equity, Buyouts, Hedge Funds, Core Real Estate, Non-Core Real
Estate, and Cash).
17. Continue to build a world-class investment organization and plan for succession of
investment professionals.
18. Enhance investment-related governance policies (e.g. Statement of Investment Policies,
Investment Advisor Monitoring Policy, Rebalancing Policy, Proxy Voting Policies,
Derivatives Policy, etc.).
19. Identify and implement enhancements to the disciplined investment decision-making process.
20. Enhancing SERS’ due diligence practices, in collaboration with SERS’ legal team.
21. Provide SERS’ board with educational opportunities to discuss global market and economic
conditions and their impact on SERS’ investment program.

Pennsylvania State Employees’ Retirement System 2016 – 2017 Strategic Investment Plan 11
Asset Liability Study
SERS performs a comprehensive asset liability study every three years to examine the probable
future consequences, over extended periods of time, of applying alternative asset allocation
strategies to SERS’ investment assets in order to fund the liabilities created by the benefit
provisions of the pension plan. Asset liability studies are unique in their ability to combine, in a
single analysis, the three critical factors that drive the financial health of the pension plan: 1)
benefit policy (liabilities), 2) contribution policy, and 3) investment strategy (asset allocation).
The results of the 2015 Asset Liability Study indicate that SERS is currently underfunded but
improvements in financial health are possible. SERS can best meet its objectives through the
continued use of a well-diversified investment portfolio. However, positive outcomes are
extremely dependent on the employer contribution policy.5
Asset Allocation Policy
Asset allocation is widely accepted as the primary determinant of any pension plan’s long-term
return and risk. It is substantially more influential than the mandates deployed in individual asset
classes, the managers selected to implement them, or tactical asset allocation decisions. A
significant and often-cited study on this topic demonstrates that asset allocation explained 93.6%
of the variation in quarterly returns for a typical large pension fund (Brinson, Hood, and
Beebower, “Determinants of Portfolio Performance,” Financial Analysts Journal, July/August
1986).
SERS’ historical adherence to its asset allocation process generated investment returns that
added 70% of the assets to its portfolio over the past decade. The remaining 30% of the portfolio
was a result of employee contributions adding 13%, and employer contributions adding 17%.6
In developing long-term asset allocation policy targets, SERS’ investment team must consider:
Maintaining an appropriate level of cash to pay retirement benefits and covenants during
prolonged periods of market decline and potential state budgetary constraints;
Improving the liquidity profile of the total fund to align with the projected increase in
retirement benefit payments; and
Pursuing the highest returns possible at the level of risk deemed prudent by
SERS’ board.
5 RVK Asset Liability Study Executive Summary dated September 16, 2015. 6 SERS 2014 CAFR (p.6).

Pennsylvania State Employees’ Retirement System 2016 – 2017 Strategic Investment Plan 12
SERS’ asset allocation structure was developed and weighted by considering each asset classes’
expected return, volatility, and correlation with other asset classes. SERS’ investment office
staff, in consultation with its board and external investment consultants, combines asset classes
in such a way to provide the highest expected return for a given level of risk, subject to the
fundamental liquidity and diversification constraints.
SERS’ updated asset allocation is positioned to maintain the current liquidity profile of the total
fund, improve staff, consultant, and investment manager accountability, leverage staff and
consultant skill sets, and improve transparency. The board selected Target Allocation 2 as the 10-
year target asset allocation policy (Figure 3).
Figure 3
SERS 2016 – 2017 Strategic Asset Allocation Policy7
Current Exposure
6/30/2015
2016 – 2017 Strategic Asset
Allocation Policy Target Allocation 2
Policy Ranges
Private Equity 19% 16%
Global Equity 39% 43%
Total Equity 58% 59% +/- 5%
Real Estate 10% 12% +/- 3%
Hedge Funds 8% 12% +/- 3%
Fixed Income 19% 14% +/- 3%
Cash 5% 3% +/- 3%
Total 100% 100%
Expected Return 7.31% 7.50%
Risk (Standard Deviation) 13.65% 14.15%
RVK Liquidity Metric 60 60
7 Source: SERS’ Investment Office and RVK
Pennsylvania State Employees’ Retirement System 2016 – 2017 Strategic Investment Plan 13
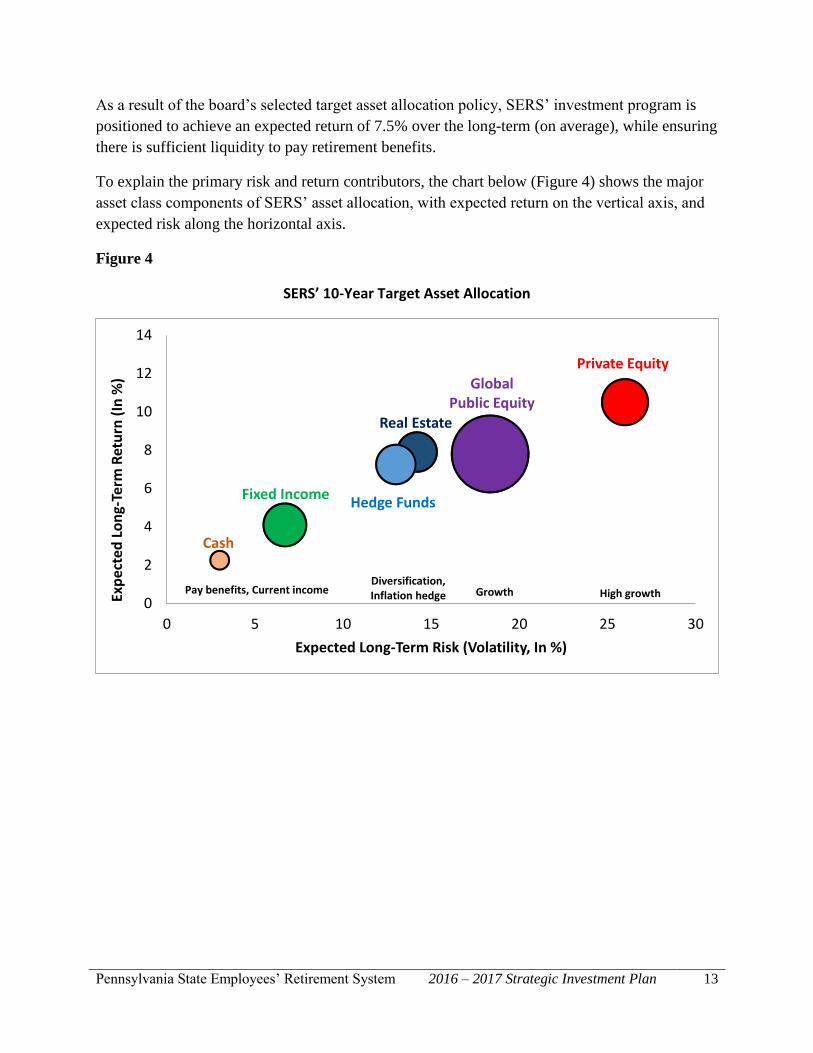
As a result of the board’s selected target asset allocation policy, SERS’ investment program is
positioned to achieve an expected return of 7.5% over the long-term (on average), while ensuring
there is sufficient liquidity to pay retirement benefits.
To explain the primary risk and return contributors, the chart below (Figure 4) shows the major
asset class components of SERS’ asset allocation, with expected return on the vertical axis, and
expected risk along the horizontal axis.
Figure 4
SERS’ 10-Year Target Asset Allocation
0
2
4
6
8
10
12
14
0 5 10 15 20 25 30
Exp
ecte
d L
on
g-Te
rm R
etu
rn (
In %
)
Expected Long-Term Risk (Volatility, In %)
Fixed Income
Cash
Pay benefits, Current incomeDiversification, Inflation hedge Growth High growth
Private Equity
Global Public Equity
Hedge Funds
Real Estate

Pennsylvania State Employees’ Retirement System 2016 – 2017 Strategic Investment Plan 14
Figure 5 below depicts a range of possible distribution of returns over one, three, five, and ten-
year horizons. Note that the dispersion of possible returns narrows significantly as the length of
time covered by the analysis increases; extreme returns in any given year may tend to offset each
other over a longer timeframe.
Figure 5
Potential Dispersion of Returns by Percentile for Target Allocation Policy8
8 Source: SERS’ Investment Office and RVK
-15%
-10%
-5%
0%
5%
10%
15%
20%
25%
30%
1- Year 3-Year 5-Year 10-Year
Exp
ect
ed
Re
turn
Monte Carlo Simulations -Expected Return by Percentile
7.5%

Pennsylvania State Employees’ Retirement System 2016 – 2017 Strategic Investment Plan 15
Asset Classes
Private Equity
(former name: Alternative Investments)
Role: SERS’ Private Equity program seeks the highest return and growth opportunities which
capture market inefficiencies through active management in the private markets.
Objective: The objective of the Private Equity program is to generate annualized net-of-fee
returns that exceed the total return of public equity markets by at least 3% (illiquidity premium)
and exceed the mean return for the asset class over a seven- to ten-year period (see Benchmarks
section of Investment Plan).
Structure: Investments in Private Equity are in the form of closed-end limited partnership
interests. As an investor, SERS is a limited partner and does not have control of distributions in
Private Equity investments. The investment horizon is typically seven or more years. SERS’
Private Equity program endeavors to continue to build long-term strategic partnerships by
investing in world class top-quartile funds. Private equity investments require commitments
greater than seven years and therefore, must offer premium returns to compensate for illiquidity
and risks.
SERS’ Private Equity program is subject to the investment pacing established by this Investment
Plan to help manage the liquidity profile of the total fund to align with the projected increase in
retirement benefit payments.

Pennsylvania State Employees’ Retirement System 2016 – 2017 Strategic Investment Plan 16
The 2016 – 2017 Strategic Investment Plan sets the Private Equity investment annual pacing
target at $750 million. Figure 6 shows the 10-year (Year 2025) expected allocation to Private
Equity as a percent of the total fund from 11.2% to 19.1% at multiple annual commitment pacing
levels.
Figure 6
As shown in the chart below, long-term projections indicate that the expected allocation to
Private Equity in 10-years could range from 11.7% to 23.8% of the total fund’s value (Figure 7),
at an annual commitment pace of $750 million.
Figure 7
Pe
rce
nt
of
SER
S’ T
ota
l Fu
nd
P
erc
en
t o
f SE
RS’
To
tal F
un
d
Pennsylvania State Employees’ Retirement System 2016 – 2017 Strategic Investment Plan 17
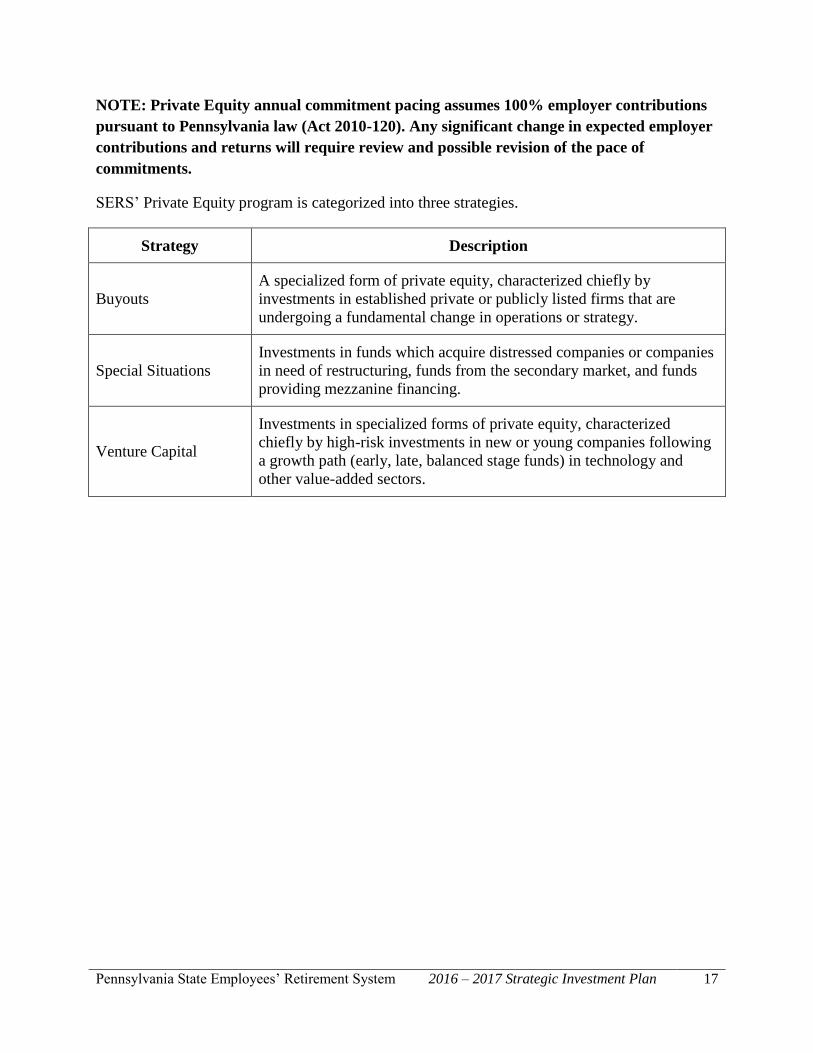
NOTE: Private Equity annual commitment pacing assumes 100% employer contributions
pursuant to Pennsylvania law (Act 2010-120). Any significant change in expected employer
contributions and returns will require review and possible revision of the pace of
commitments.
SERS’ Private Equity program is categorized into three strategies.
Strategy Description
Buyouts
A specialized form of private equity, characterized chiefly by
investments in established private or publicly listed firms that are
undergoing a fundamental change in operations or strategy.
Special Situations
Investments in funds which acquire distressed companies or companies
in need of restructuring, funds from the secondary market, and funds
providing mezzanine financing.
Venture Capital
Investments in specialized forms of private equity, characterized
chiefly by high-risk investments in new or young companies following
a growth path (early, late, balanced stage funds) in technology and
other value-added sectors.

Pennsylvania State Employees’ Retirement System 2016 – 2017 Strategic Investment Plan 18
Global Public Equity
Role: SERS’ Global Public Equity program seeks high returns through capital appreciation and
income from dividend payments while also improving the total fund’s liquidity. As of June 30,
2015, 44% of SERS’ Global Public Equity program is invested using index funds. SERS’ Global
Public Equity program contributes a high expected long-term return to the fund but also may be
the greatest contributor to near-term volatility.
Objective: The objective of the Global Public Equity program is to generate annualized net-of-
fee returns that exceed its benchmark over a three- to five-year period (see Benchmarks section
of Investment Plan).
Structure: Investments in public equity are achieved through buying and holding publicly-
traded securities of companies throughout the developed world and in emerging markets. These
companies exhibit a wide range of market capitalizations in many industries and sectors, and
offer vastly different equity return opportunities.
SERS’ Global Public Equity program is categorized into four strategies.
Strategy Description
Global Mandate U.S., non-U.S. developed markets, and emerging markets,
large/mid/small cap.
U.S. U.S. market, large/mid/small cap.
Non-U.S. Developed
Markets Non-U.S. developed markets, large/mid/small cap.
Emerging Markets Emerging markets, large/mid/small cap.

Pennsylvania State Employees’ Retirement System 2016 – 2017 Strategic Investment Plan 19
Real Estate
Role: Real Estate plays several roles within SERS’ overall investment portfolio, including
enhancing returns, diversification and income and providing inflation hedging. In the past, SERS
has emphasized tactical value-add and opportunistic Real Estate strategies to provide competitive
total returns through capital appreciation. Going forward, SERS will tilt the risk profile to more
core-like strategies, which is appropriate given the larger allocation to Real Estate and the desire
for more income and liquidity created by SERS’ maturing pension fund obligations. This
moderating risk profile may be achieved by improving diversification within Real Estate, which
may result in better long-term risk-adjusted returns.
Objective: The objective of the Real Estate program is to generate annualized net-of-fee returns
that exceed its benchmark over a three- to five-year period, with the various components
weighted according to long-term allocation targets within the asset class (see Benchmarks
section of Investment Plan).
Structure: SERS will diversify its Real Estate allocation by increasing investments in more
stable, core-like investments, and by adding agriculture to the portfolio. New target allocations
within the Real Estate program are designed to increase expected return, liquidity,
diversification, and inflation hedging, while decreasing expected risk (Figure 8).9
Figure 8
9 Townsend’s analysis and asset allocation assumptions (risk, return, correlation) are based on industry standards.
6.5%
7.0%
7.5%
8.0%
8.5%
9.0%
9.5%
10.0%
7% 8% 9% 10% 11% 12% 13% 14% 15% 16%
Exp
ect
ed
Re
turn
Expected Risk (Volatility)
Real Estate Efficient Frontier
SERS’ Real Estate
Current Portfolio
SERS’ Real Estate
Target Portfolio

Pennsylvania State Employees’ Retirement System 2016 – 2017 Strategic Investment Plan 20
Figure 9 shows Real Estate’s current portfolio structure and target portfolio structure.
Figure 9
Reporting for SERS’ Real Estate program is being enhanced in order to improve transparency,
facilitate better investment decision-making, and enhance the accountability of staff and
consultants, while leveraging their skill sets.
The 2016 – 2017 Strategic Investment Plan sets the annual pacing target at $100 million to $200
million to non-core closed-end Real Estate funds. Real Estate investment opportunities other
than non-core closed-end Real Estate funds will be evaluated on a case-by-case basis.
NOTE: Real Estate annual commitment pacing assumes 100% employer contributions
pursuant to Pennsylvania law (Act 2010-120). Any significant change in expected employer
contributions and returns will require review and possible revision of the pace of
commitments.
Core, 20%
Non-Core Value-Add,
36%
Non-Core Opp., 26%
REITS, 13%
Timber, 5%
Current Real Estate Portfolio
Core, 40%
Non-Core Opp. &
Value-Add, 40%
REITS, 10%
Timber, 5%Ag, 5%
Target Real Estate Portfolio

Pennsylvania State Employees’ Retirement System 2016 – 2017 Strategic Investment Plan 21
SERS’ Real Estate program is categorized into five specific strategies.
Strategy Description
Core Real Estate
Core Real Estate investments are long-term investments in high-quality
real estate that generates returns primarily from stable income
producing properties.
Non-Core Real Estate
(Value-Add and
Opportunistic)
Non-Core Real Estate investments have higher risk/return expectations
than Core Real Estate investments. Non-Core strategies utilize greater
leverage and development strategies, thereby taking higher risks but
demand higher returns. Returns are primarily generated from capital
appreciation from opportunistic investments.
Real Estate Investment
Trust Securities
(REITs)
Investments in publicly-traded securities of companies whose primary
business is to own real estate. REITs provide SERS with direct
exposure to U.S. and non-U.S. real estate markets and offer high
dividend yield and liquidity.
Timber In general, Timber differs from real estate in that it is renewable and
derives its return from the biological growth of trees and sale of timber.
Agriculture
Agriculture offers a non-correlated real estate strategy in a sector
characterized by increasing institutional investment and global growth
in population and preferences for higher value add food products.
Appendix 2 of the Investment Plan details the reclassification of portfolios to current asset
classes as a result of the elimination of the classification named Commodities and Infrastructure,
a sector-focused sub-strategy within the former Real Assets asset class.
Pennsylvania State Employees’ Retirement System 2016 – 2017 Strategic Investment Plan 22
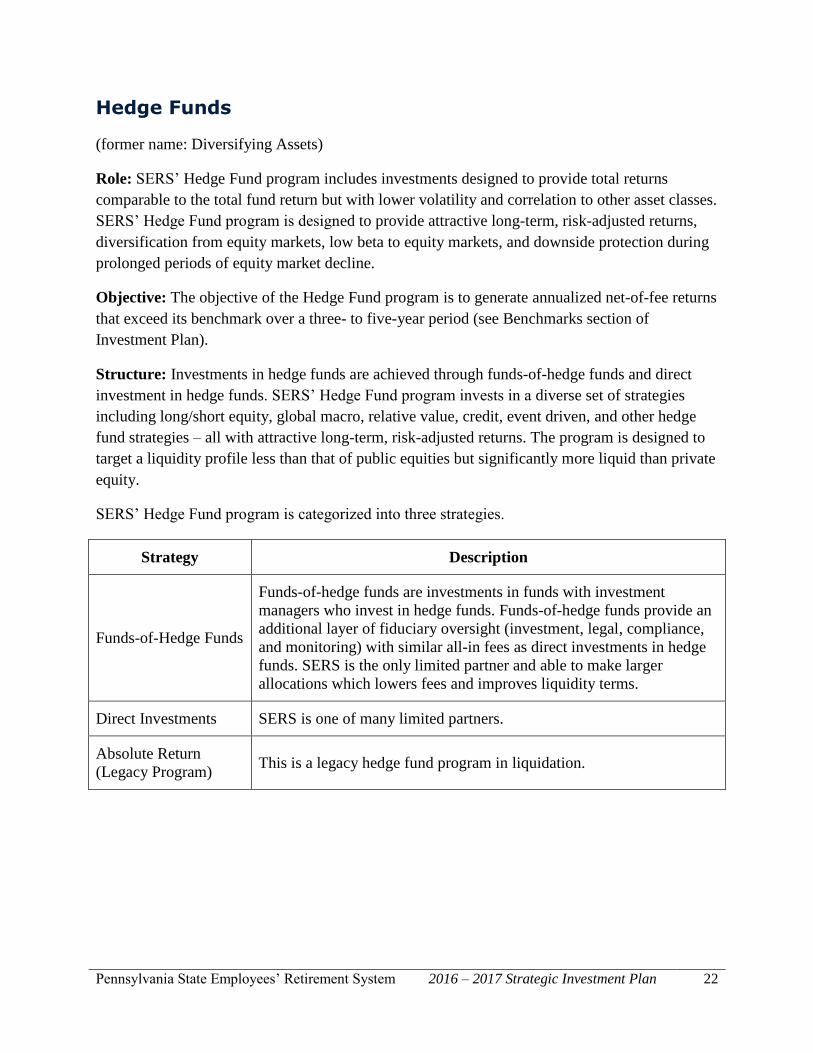
Hedge Funds
(former name: Diversifying Assets)
Role: SERS’ Hedge Fund program includes investments designed to provide total returns
comparable to the total fund return but with lower volatility and correlation to other asset classes.
SERS’ Hedge Fund program is designed to provide attractive long-term, risk-adjusted returns,
diversification from equity markets, low beta to equity markets, and downside protection during
prolonged periods of equity market decline.
Objective: The objective of the Hedge Fund program is to generate annualized net-of-fee returns
that exceed its benchmark over a three- to five-year period (see Benchmarks section of
Investment Plan).
Structure: Investments in hedge funds are achieved through funds-of-hedge funds and direct
investment in hedge funds. SERS’ Hedge Fund program invests in a diverse set of strategies
including long/short equity, global macro, relative value, credit, event driven, and other hedge
fund strategies – all with attractive long-term, risk-adjusted returns. The program is designed to
target a liquidity profile less than that of public equities but significantly more liquid than private
equity.
SERS’ Hedge Fund program is categorized into three strategies.
Strategy Description
Funds-of-Hedge Funds
Funds-of-hedge funds are investments in funds with investment
managers who invest in hedge funds. Funds-of-hedge funds provide an
additional layer of fiduciary oversight (investment, legal, compliance,
and monitoring) with similar all-in fees as direct investments in hedge
funds. SERS is the only limited partner and able to make larger
allocations which lowers fees and improves liquidity terms.
Direct Investments SERS is one of many limited partners.
Absolute Return
(Legacy Program) This is a legacy hedge fund program in liquidation.
Pennsylvania State Employees’ Retirement System 2016 – 2017 Strategic Investment Plan 23
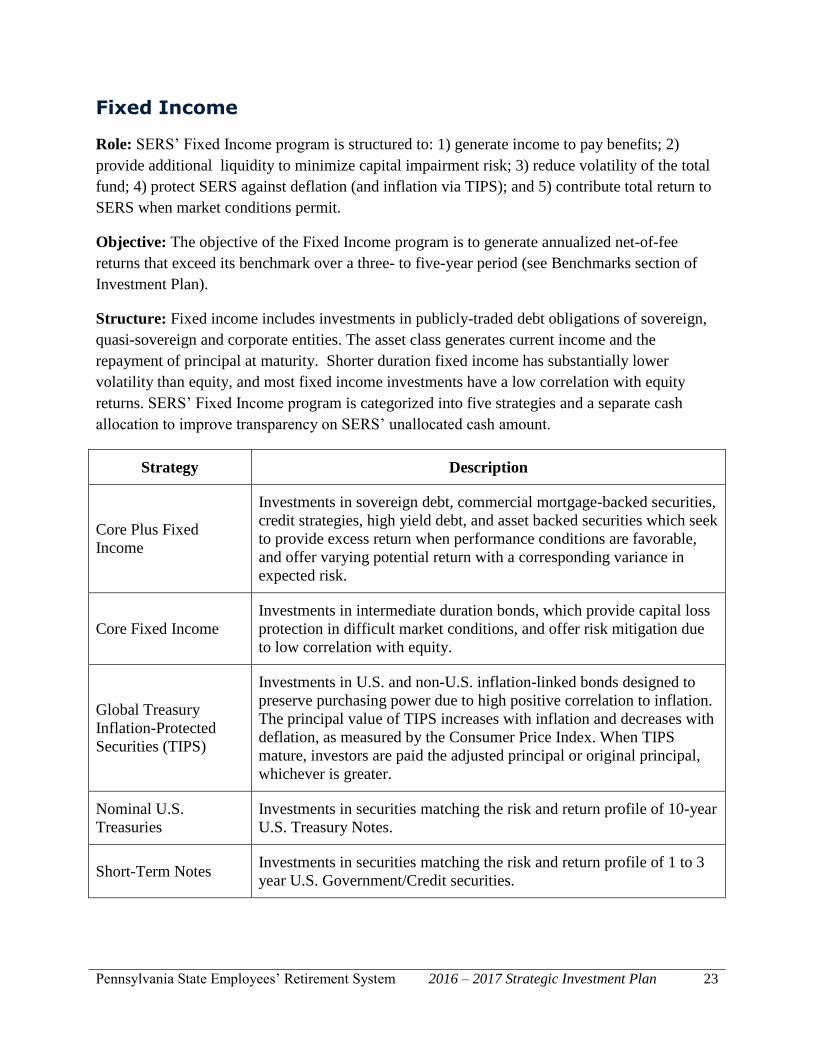
Fixed Income
Role: SERS’ Fixed Income program is structured to: 1) generate income to pay benefits; 2)
provide additional liquidity to minimize capital impairment risk; 3) reduce volatility of the total
fund; 4) protect SERS against deflation (and inflation via TIPS); and 5) contribute total return to
SERS when market conditions permit.
Objective: The objective of the Fixed Income program is to generate annualized net-of-fee
returns that exceed its benchmark over a three- to five-year period (see Benchmarks section of
Investment Plan).
Structure: Fixed income includes investments in publicly-traded debt obligations of sovereign,
quasi-sovereign and corporate entities. The asset class generates current income and the
repayment of principal at maturity. Shorter duration fixed income has substantially lower
volatility than equity, and most fixed income investments have a low correlation with equity
returns. SERS’ Fixed Income program is categorized into five strategies and a separate cash
allocation to improve transparency on SERS’ unallocated cash amount.
Strategy Description
Core Plus Fixed
Income
Investments in sovereign debt, commercial mortgage-backed securities,
credit strategies, high yield debt, and asset backed securities which seek
to provide excess return when performance conditions are favorable,
and offer varying potential return with a corresponding variance in
expected risk.
Core Fixed Income
Investments in intermediate duration bonds, which provide capital loss
protection in difficult market conditions, and offer risk mitigation due
to low correlation with equity.
Global Treasury
Inflation-Protected
Securities (TIPS)
Investments in U.S. and non-U.S. inflation-linked bonds designed to
preserve purchasing power due to high positive correlation to inflation.
The principal value of TIPS increases with inflation and decreases with
deflation, as measured by the Consumer Price Index. When TIPS
mature, investors are paid the adjusted principal or original principal,
whichever is greater.
Nominal U.S.
Treasuries
Investments in securities matching the risk and return profile of 10-year
U.S. Treasury Notes.
Short-Term Notes Investments in securities matching the risk and return profile of 1 to 3
year U.S. Government/Credit securities.

Pennsylvania State Employees’ Retirement System 2016 – 2017 Strategic Investment Plan 24
Cash
Role: SERS’ investment program endeavors to maintain an appropriate level of cash to pay
retirement benefits and covenants during prolonged periods of market decline and state
budgetary constraints.
Objective: The objective of Cash is to generate annualized net-of-fee returns that exceed its
benchmark over a three-year period (see Benchmarks section of Investment Plan).
Structure: Cash investments emphasize the use of higher credit quality debt instruments that are
liquid and have short maturities and durations, or have floating rates and have historically been
invested in the Pennsylvania Treasury Group Investment Fund, a short-term investment fund.

Pennsylvania State Employees’ Retirement System 2016 – 2017 Strategic Investment Plan 25
Benchmarks
The objective of the fund is to generate investment returns that meet, or preferably exceed, the
actuarially assumed rate of return over complete market cycles. Performance is measured net-of-
fees relative to the following benchmarks according to the long-term target asset allocation
weights.
Private Equity Russell 3000 + a 3% premium and Private Equity Peer Group
Comparison
Global Equity MSCI All Country World Investable Market Index
Real Estate Custom Index (NCREIF Fund Index - Open End Diversified
Core Equity, S&P Developed Property Index for REITs, & CPI
plus a 3% premium for Timber and Agriculture)
Hedge Funds HFRI Fund-of-Funds Strategic Index
Fixed Income Barclays U.S. Aggregate Bond Index
Cash 90-Day T-Bill Index
Total Fund Total Fund Custom Index and Public Market Equivalent Index
Russell 3000 Index – The Russell 3000 Index measures the performance of the 3,000 largest
U.S. companies based on total market capitalization, which represents approximately 98% of the
investable U.S. equity market.
Private Equity Peer Group Custom Indices – The current Private Equity Peer custom indices
currently utilize the Burgiss private equity database. They are calculated using the time-weighted
returns for a composite of funds based on their specified strategies and with the same vintage
dates as SERS' funds. For all Burgiss benchmarks, Geographic Focus, Industry Focus, Fund
Size, and Currency are all inclusive across countries, industries, funds, and currencies,
respectively.
MSCI All Country World Investable Market Index – The index captures large, mid and
small-cap public equity representation across developed markets and emerging markets
countries. With approximately 8,600 constituents, the index covers approximately 99% of the
global public equity investment opportunity set.
NCREIF Fund Index – Open-End Diversified Core Equity – The first of the NCREIF Fund
Database products and is an index of investment returns reporting on both a historical and

Pennsylvania State Employees’ Retirement System 2016 – 2017 Strategic Investment Plan 26
current basis the results of 33 open-end commingled funds pursuing a core investment strategy,
some of which have performance histories dating back to the 1970s. The NFI-ODCE Index is
capitalization-weighted and is reported gross of fees. Measurement is time-weighted. NCREIF
will calculate the overall aggregated Index return.
Given the proposed more moderate risk profile and increasing diversification objective in Real
Estate, the benchmark for Real Estate will be adjusted. Specifically, the NCREIF “Open-End”
Fund Index will be replaced with the NCREIF Fund Index for Open-End Diversified Core Equity
funds. The benchmark for SERS’ timber and agriculture investments will be changed to an
index composed of CPI + 300 basis points. The latter change reflects the challenge of fully
diversifying SERS’ timber and agriculture allocations given the relatively small size of
commitments in these sectors.
The S&P Developed Property Index defines and measures the investable universe of publicly
traded property companies domiciled in developed markets. The companies in the index are
engaged in real estate related activities, such as property ownership, management, development,
rental and investment.
The Consumer Price Indexes (CPI) program produces monthly data on changes in the prices
paid by urban consumers for a representative basket of goods and services. Prices for the goods
and services used to calculate the CPI are collected in 87 urban areas throughout the country and
from about 23,000 retail and service establishments.
HFRI Fund-of-Funds Strategic Index – The HFRI Fund-of-Funds Strategic Index includes
fund of funds that are classified as “strategic” by exhibiting one or more of the following
characteristics: seeks superior returns by primarily investing in funds that generally engage in
more opportunistic strategies such as Emerging Markets, Sector specific, and Equity Hedge;
exhibits a greater dispersion of returns and higher volatility compared to the HFRI Fund-of
Funds-Composite Index.
Barclays U.S. Aggregate Bond Index – The Barclays U.S. Aggregate Bond Index is a
comprehensive measure of the entire U.S. taxable bond market. The aggregate includes all
publicly issued, non-convertible domestic debt of the U.S. Government and agencies, the three
major corporate bond classifications (industrial, utility, and financial), mortgage-backed
securities (GNMA, FNMA, FHLMC) and Yankee bonds (U.S. dollar denominated, SEC
registered fixed-rate debt issued or guaranteed by sovereign foreign governments). Bonds
included are investment grade (Baa rating or higher), have a minimum outstanding principal of
$1 million, and a minimum one-year maturity. The index is a capitalization weighted and
includes income calculated on an accrual basis at the end of each month. The universe is
screened on the last business day of each month for inclusion in the next month's index. Bonds
that decline below the minimum quality or one-year maturity will drop out of the index during
the monthly screening.

Pennsylvania State Employees’ Retirement System 2016 – 2017 Strategic Investment Plan 27
90-Day U.S. T-Bill Index – The index is made up of U.S. Treasury securities maturing in 90
days that assumes reinvestment of all income.
Total Fund Custom Benchmarks – The Total Fund Custom Benchmarks are calculated
monthly using target weights for each asset class, applied to corresponding primary and
secondary benchmarks.
Pennsylvania State Employees’ Retirement System 2016 – 2017 Strategic Investment Plan 28
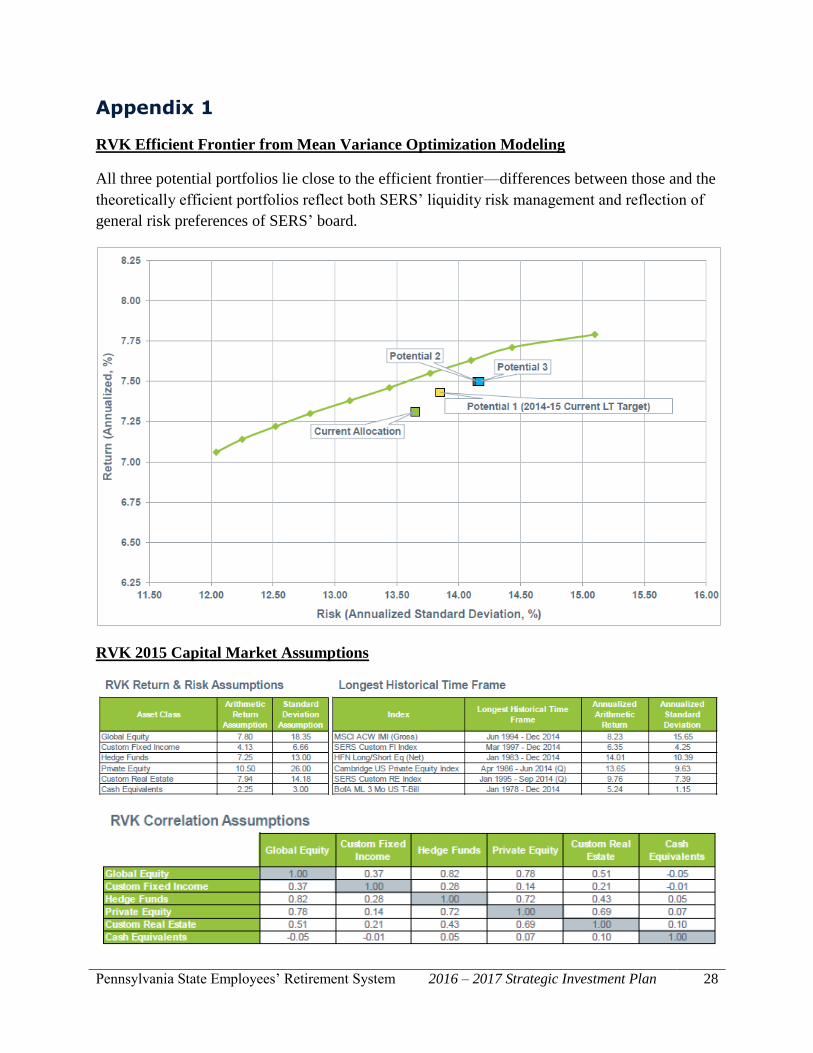
Appendix 1
RVK Efficient Frontier from Mean Variance Optimization Modeling
All three potential portfolios lie close to the efficient frontier—differences between those and the
theoretically efficient portfolios reflect both SERS’ liquidity risk management and reflection of
general risk preferences of SERS’ board.
RVK 2015 Capital Market Assumptions

Pennsylvania State Employees’ Retirement System 2016 – 2017 Strategic Investment Plan 29
Appendix 2
Portfolio and Fund Reclassifications
The Private Energy strategy will be reclassified as a sub-strategy within the Private Equity asset
class. Private Energy funds were previously a subset of the Private Equity asset class. Moving
Private Energy funds to the Private Equity asset class will align funds with similar return, risk,
and liquidity profiles. It also aligns staff, consultant, and investment manager accountability and
skill sets.
The Wellington Diversified Inflation Hedge (“Wellington DIH”) portfolio will be reclassified as
a stand-alone portfolio within the Global Public Equity asset class. Moving Wellington DIH to
the Global Public Equity program will align portfolios with similar return, risk and liquidity
profiles. SERS’ investment staff and its general investment consultant will evaluate the
Wellington DIH portfolio to determine if it continues to fit in SERS’ investment program.
The Blackstone Alternative Asset Management Customized Commodities (“BAAM
Commodities”) fund will be reclassified as a stand-alone fund within the Hedge Fund program.
Moving the BAAM Commodities portfolio to the Hedge Funds program will align portfolios
with similar return, risk and liquidity profiles. SERS’ investment staff and its general investment
consultant will evaluate the BAAM Commodities portfolio to determine if it continues to fit in
SERS’ Investment Program.
The two Master Limited Partnership (“MLPs”) portfolios will be reclassified as Core Plus Fixed
Income. MLPs are investments in publicly-traded energy MLP securities and securities of energy
companies. Although MLPs exhibit similar volatility as public equity, their current income
profile through quarterly distributions better align MLPs within Core Plus Fixed Income.
The two portfolios in Short-Term Notes will be moved to the Fixed Income asset class to
improve transparency of reporting unallocated cash as a stand-alone strategy.

Pennsylvania State Employees’ Retirement System 2016 – 2017 Strategic Investment Plan 30
Appendix 3
The board selected Target Allocation 2 as the 10-year target asset allocation policy.
Efficient Asset Allocation Targets10
Current Exposure
6/30/2015
Target Allocation 1 (Current LT Target)
Target Allocation 2
Target Allocation 3
Policy Ranges
Private Equity 19% 16% 16% 18%
Global Equity 39% 41% 43% 42%
Total Equity 58% 57% 59% 60% +/- 5%
Real Estate 10% 12% 12% 12% +/- 3%
Hedge Funds 8% 12% 12% 9% +/- 3%
Fixed Income 19% 16% 14% 16% +/- 3%
Cash 5% 3% 3% 3% +/- 3%
Total 100% 100% 100% 100%
Expected Return 7.31% 7.43% 7.50% 7.50%
Risk (Standard Deviation) 13.65% 13.85% 14.15% 14.17%
RVK Liquidity Metric 60 60 60 60
10 Source: SERS’ Investment Office and RVK


State Employees’ Retirement System30 N 3rd St, Suite 150Harrisburg, PA 17101-17161.800.633.5461www.SERS.pa.gov