common stochastic trends among asian currencies: evidence for japan, aseans, and the asian tigers
TRANSCRIPT
Review of Quantitative Finance and Accounting, 10 (1998): 193–206© 1998 Kluwer Academic Publishers, Boston. Manufactured in The Netherlands.
Common Stochastic Trends Among Asian Currencies:Evidence for Japan, Aseans, and the Asian Tigers
RAJ AGGARWALThe Edward J. and Louise E. Mellen Chair in Finance, John Carroll University, Cleveland, Ohio 44118
MBODJA MOUGOUÉSchool of Business Administration, Wayne State University, Detroit, MI 48202
Abstract. This study documents that daily changes in Asian exchange rates are significantly non-normal,serially correlated, non-stationary, and have unit roots. Further, accounting for these time series properties andusing a longer time horizon than other similar studies of exchange rates, this study also documents cointegrationbetween the Japanese Yen and two sets of Asian currencies, i.e., currencies of the ‘Tigers’, Hong Kong, SouthKorea, Singapore, and Taiwan; and currencies of the ASEANs, Malaysia, Philippines, Thailand, and Singapore.These findings of cointegration among Asian exchange rates are in contrast to the findings for the majorcurrencies, and are evidence of nascent Yen blocs in Asia. The results presented here have important implicationsfor understanding Asian financial integration and the international role of the Japanese yen and should be usefulfor developing asset allocation, currency overlay, value at risk (VAR), and hedging strategies for investments inthese often illiquid Asian currencies.
JEL Classification: F15; F31; or F36
1. Introduction
There is much interest in trade and currency blocs and in the impact of increasingJapanese trade and investment in Asia [e.g., Sato et al, (1994); Frankel and Kahler, (1993)]and it has been contended that Japanese foreign direct investment is particularly tradeenhancing (Kojima, 1985; Lii, 1994). There has also been much interest in relationshipsbetween exchange rates [e.g., Baillie and Bollerslev, (1994); Diebold et al, (1994); Hakkioand Rush, (1991)]. As Asia accounts for an increasingly higher proportion of the globaleconomy and financial markets, Asian currency movements are ever more likely to havecontagion effects elsewhere in the world. Thus, it is important to understand the stochasticproperties and international relationships of Asian currencies.
However, prior research on stochastic properties and cointegration of currencies hasfocused on the currencies of the major industrial nations and evidence of such cointegra-tion is at best mixed. Baillie and Bollerslev (1994) review much of this research and notethe need for examining cointegration for longer periods. In spite of the sharply risingimportance of Asia in world trade and investment, there has been relatively little similarwork, or even work related to their stochastic properties, for the currencies of the emerg-ing Asian markets.1 While there are some moves towards deregulation, many Asian cur-
Kluwer Journal@ats-ss3/data11/kluwer/journals/requ/v10n2art4 COMPOSED: 01/13/98 2:44 pm. PG.POS. 1 SESSION: 12
rencies are generally still characterized by higher levels of government control and byilliquid and incomplete markets many times with little or no forward trading. Stochasticprocesses for such currencies not only determine asset valuations and portfolio manage-ment decisions, they are also be useful in assessing foreign exchange risks and in devel-oping hedging policies for such currencies. If these currencies are found to be cointe-grated with each other or with a major currency, cross-hedging policies based onderivatives in the major currencies can be developed and used for investments denomi-nated in such emerging market currencies (e.g., Aggarwal and DeMaskey, 1997).
The time series properties of Asian exchange rates and the role of the Japanese Yenamong these currencies are examined to assess if the yen is cointegrated with and forms‘Yen Blocs’ with two sets of Asian currencies, i.e., currencies of the Tigers, Hong Kong,South Korea, Singapore, and Taiwan; and currencies of the ASEANs (Association ofSoutheast Asian Nations), Malaysia, Philippines, Thailand, and Singapore.2 While there islittle agreement regarding the definition of a trade or currency bloc, these two groups ofAsian countries are characterized by significant intra-group similarities but separated byimportant inter-group differences in levels of economic development and per capita in-come.
This study documents, using daily data for a longer period than in other recent studiesof currency cointegration, significant non-stationarity, deviations from normality, and thepresence of unit roots for each of the examined Asian currencies. Using statistical pro-cedures that account for these time-series properties, the Japanese yen was found to becointegrated with both sets of Asian currencies. These findings of cointegration amongAsian currencies not only have important implications for portfolio managers and inves-tors, they also have policy implications. For example, these findings are a significantindication of nascent Yen blocs in Asia. Thus, while the western European nations face atleast a temporary retreat in their well-publicized quest for an economic and monetaryunion (Eichengreen and Bayoumi, 1992), trading and currency blocs headed by Japan mayquietly be emerging in Asia.3
2. Testing for stochastic trends among exchange rates
Characteristics of exchange rate time series
The time series properties of exchange rates are well documented for the major industrialcountries. Analysis of the daily changes in the logarithms of spot exchange rates revealsthat the unconditional distribution is nonnormal, exhibiting greater probability in the tailrelative to the normal distribution (i.e., leptokurtosis). In attempting to model this evi-dence of leptokurtosis, researchers have considered (with mixed results) fat-tailed prob-ability distributions such as the scaled t, the exponent, the stable paretian, mixture ofnormals, mixed diffusion jump, and the autoregressive conditional heteroscedastic model(ARCH) [see, for example, Akgiray and Booth (1988), Hsieh (1988, 1989), and Baillieand McMahon (1989)]. Research also suggests that the probability distribution of ex-change rate changes varies with the days of the week [e.g., McFarland et. al. (1982) and
194 AGGARWAL AND MOUGOUÉ
Kluwer Journal@ats-ss3/data11/kluwer/journals/requ/v10n2art4 COMPOSED: 01/13/98 2:44 pm. PG.POS. 2 SESSION: 12
Hsieh (1988)]. While there is some evidence to suggest that temporal aggregation of thedata may reduce deviations from the normal distribution, there is evidence that the pa-rameters of the distribution such as the mean and the variance may vary over time [e.g.,Friedman and Vandersteel (1982) and Boothe and Glassman (1987)] and moments higherthan the second may be priced by the market.4
Daily spot exchange rate changes for the major currencies also exhibit several otherinteresting characteristics. Meese and Singleton (1982) and Baillie and Bollerslev (1989)document that exchange rates are characterized by unit roots and Meese and Rogoff(1983) show that these processes are martingales. However, Liu and He (1991) presentevidence of mean reversion in temporal aggregation, indicating that spot rates do notfollow a martingale process. As noted by Fama (1970), Leroy (1973), Dwyer and Wallace(1992), and others, market efficiency does not imply that asset prices should follow amartingale process, as that obtains only if the fundamental variables themselves follow amartingale process.
Common trends among exchange rates
Given their time series properties, common trends among exchange rates have beenassessed by examining if selected sets of exchange rates are cointegrated with each other.Baillie and Bollerslev (1989) examine daily data for seven major currencies (for Germany,U.K., Japan, Canada, France, Italy, and Switzerland) for the period March 1, 1980 toJanuary 28, 1985 and find evidence in favor of the spot rates being cointegrated. However,Hakkio and Rush (1989) analyze monthly data for the U.K. pound and German mark(priced in terms of U.S. dollars), and reject the hypothesis of the two spot rates beingcointegrated. Further, Hakkio and Rush (1991), Sephton and Larsen (1991), and Dieboldet al (1994) also find against cointegration of the major currencies. In response, Baillieand Bollerslev (1994) re-examine the data used in their 1989 study and contend that theseven currencies can be said to be fractionally cointegrated, and shocks to exchange ratesystems may only vanish at very long horizons. Thus, it seems that there is still somecontroversy regarding the cointegration of the major currencies, and the literature suggeststhat it may be particularly useful to examine cointegration using longer horizons.
As the preceding discussion indicates, the empirical evidence on cointegration of cur-rencies is mixed and mostly covers the currencies of the major industrial countries.Relatively little empirical evidence exists for the emerging market currencies even thoughforeign portfolio and direct investments in emerging markets has been increasing greatlyin recent years.5 While analysis of the time series properties of these latter currencieswould provide an important challenge for any model building process, such model build-ing would have important practical implications. For example, as indicated earlier, a testfor cointegration of the minor currencies with respect to a major currency may alsoprovide useful information, especially if one cannot reject cointegration. Since some ofthese minor currencies do not have forward or futures markets that may be used to hedgeforeign exchange risk (Gray, 1991), evidence in favor of cointegration may suggest ameans of hedging through the use of derivatives in the more liquid currencies.
COMMON STOCHASTIC TRENDS AMONG ASIAN CURRENCIES 195
Kluwer Journal@ats-ss3/data11/kluwer/journals/requ/v10n2art4 COMPOSED: 01/13/98 2:43 pm. PG.POS. 3 SESSION: 11
Statistical procedures
In order to determine the appropriate statistical procedures for assessing common trendsamong exchange rates, this paper first examines the time series properties of the Asianexchange rates being studied here. In addition to distributional properties, non-linearities(using Box-Pierce Q-statistics for squared returns) are also examined. Next, this paperexamines the selected exchange rate series for unit roots. Consider the following AR(1)process for the nominal exchange rate:
~Xt 2 µ! 5 r~Xt21 2 µ! 1 et (1)
where Xt is the natural logarithm of the nominal exchange rate at time t, µ is a constantterm, and et is the error term with no serial correlation, zero mean, and constant variance.
In the model given in equation (1), the long run behavior of exchange rates hingescrucially on r. The exchange rate will be stationary if 0 , r , 1 so that, in the absenceof future shocks, the deviation (Xt 2 µ) would narrow in succeeding periods. On the otherhand, if there is a unit root so that r 5 1, the exchange rate is nonstationary and is arandom walk as there will be no tendency for (Xt 2 µ) to dampen. Thus, the problem forthe empirical researcher is that of making correct statistical inferences about the true valueof r since the presence or absence of a unit root is crucial to exchange rate determinationmodels.
The classical test of Phillips and Perron (1988) and a Bayesian technique proposed bySims (1988) are available to examine whether a time series data set such as an exchangerate contains a unit root. The unit root test proposed by Phillips and Perron (1988) is usedbecause it allows for a wide variety of heterogeneously distributed and weakly dependentinnovations.6 Based on the work by Leamer (1978), Sims constructs a test using theBayesian posterior odds ratio. As indicated by Whitt (1989), the Sims test considers amore appropriate alternative hypothesis and hence should by a more powerful test than theDickey-Fuller or the Phillips-Perron unit root tests.
In the Phillips-Perron and Sims tests, the null hypothesis being tested is r 5 1, i.e., theseries is tested for a unit root. These tests have been criticized on the basis that their failureto reject the unit root hypothesis may be due to their low power against weakly stationaryalternatives. As an alternative, Kwiatkowski, Phillips, Schmidt, and Shin (1992) (KPSS)propose a test of the null hypothesis of stationarity against the alternative of a unit root.This test is implemented as a complementary procedure to the Phillips-Perron and Simstests. The KPSS test statistic is,
hu 5 N22 ( F St2
s2~L!G (2)
where,
St 5 (i51
t
ei, t 5 1, 2, 3,…N (2a)
196 AGGARWAL AND MOUGOUÉ
Kluwer Journal@ats-ss3/data11/kluwer/journals/requ/v10n2art4 COMPOSED: 01/13/98 2:43 pm. PG.POS. 4 SESSION: 11
and
s2 5 N21 (t51
N
et2 1 2N21 (
s51
L S1 2s
~L 1 1!D (t5s11
N
etet2s (2b)
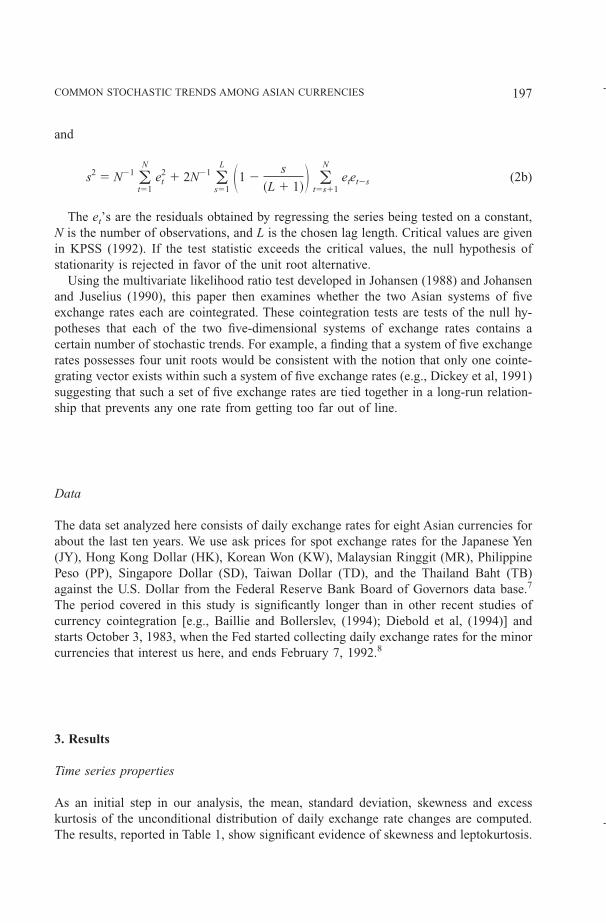
The et’s are the residuals obtained by regressing the series being tested on a constant,N is the number of observations, and L is the chosen lag length. Critical values are givenin KPSS (1992). If the test statistic exceeds the critical values, the null hypothesis ofstationarity is rejected in favor of the unit root alternative.
Using the multivariate likelihood ratio test developed in Johansen (1988) and Johansenand Juselius (1990), this paper then examines whether the two Asian systems of fiveexchange rates each are cointegrated. These cointegration tests are tests of the null hy-potheses that each of the two five-dimensional systems of exchange rates contains acertain number of stochastic trends. For example, a finding that a system of five exchangerates possesses four unit roots would be consistent with the notion that only one cointe-grating vector exists within such a system of five exchange rates (e.g., Dickey et al, 1991)suggesting that such a set of five exchange rates are tied together in a long-run relation-ship that prevents any one rate from getting too far out of line.
Data
The data set analyzed here consists of daily exchange rates for eight Asian currencies forabout the last ten years. We use ask prices for spot exchange rates for the Japanese Yen(JY), Hong Kong Dollar (HK), Korean Won (KW), Malaysian Ringgit (MR), PhilippinePeso (PP), Singapore Dollar (SD), Taiwan Dollar (TD), and the Thailand Baht (TB)against the U.S. Dollar from the Federal Reserve Bank Board of Governors data base.7
The period covered in this study is significantly longer than in other recent studies ofcurrency cointegration [e.g., Baillie and Bollerslev, (1994); Diebold et al, (1994)] andstarts October 3, 1983, when the Fed started collecting daily exchange rates for the minorcurrencies that interest us here, and ends February 7, 1992.8
3. Results
Time series properties
As an initial step in our analysis, the mean, standard deviation, skewness and excesskurtosis of the unconditional distribution of daily exchange rate changes are computed.The results, reported in Table 1, show significant evidence of skewness and leptokurtosis.
COMMON STOCHASTIC TRENDS AMONG ASIAN CURRENCIES 197
Kluwer Journal@ats-ss3/data11/kluwer/journals/requ/v10n2art4 COMPOSED: 01/13/98 2:45 pm. PG.POS. 5 SESSION: 12
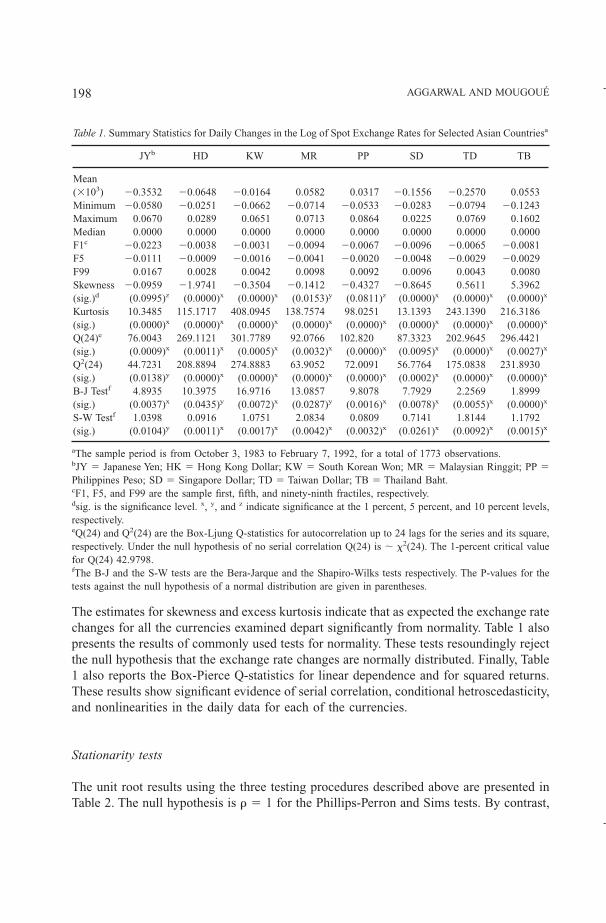
The estimates for skewness and excess kurtosis indicate that as expected the exchange ratechanges for all the currencies examined depart significantly from normality. Table 1 alsopresents the results of commonly used tests for normality. These tests resoundingly rejectthe null hypothesis that the exchange rate changes are normally distributed. Finally, Table1 also reports the Box-Pierce Q-statistics for linear dependence and for squared returns.These results show significant evidence of serial correlation, conditional hetroscedasticity,and nonlinearities in the daily data for each of the currencies.
Stationarity tests
The unit root results using the three testing procedures described above are presented inTable 2. The null hypothesis is r 5 1 for the Phillips-Perron and Sims tests. By contrast,
Table 1. Summary Statistics for Daily Changes in the Log of Spot Exchange Rates for Selected Asian Countriesa
JYb HD KW MR PP SD TD TB
Mean(3103) 20.3532 20.0648 20.0164 0.0582 0.0317 20.1556 20.2570 0.0553Minimum 20.0580 20.0251 20.0662 20.0714 20.0533 20.0283 20.0794 20.1243Maximum 0.0670 0.0289 0.0651 0.0713 0.0864 0.0225 0.0769 0.1602Median 0.0000 0.0000 0.0000 0.0000 0.0000 0.0000 0.0000 0.0000F1c 20.0223 20.0038 20.0031 20.0094 20.0067 20.0096 20.0065 20.0081F5 20.0111 20.0009 20.0016 20.0041 20.0020 20.0048 20.0029 20.0029F99 0.0167 0.0028 0.0042 0.0098 0.0092 0.0096 0.0043 0.0080Skewness 20.0959 21.9741 20.3504 20.1412 20.4327 20.8645 0.5611 5.3962(sig.)d (0.0995)z (0.0000)x (0.0000)x (0.0153)y (0.0811)z (0.0000)x (0.0000)x (0.0000)x
Kurtosis 10.3485 115.1717 408.0945 138.7574 98.0251 13.1393 243.1390 216.3186(sig.) (0.0000)x (0.0000)x (0.0000)x (0.0000)x (0.0000)x (0.0000)x (0.0000)x (0.0000)x
Q(24)e 76.0043 269.1121 301.7789 92.0766 102.820 87.3323 202.9645 296.4421(sig.) (0.0009)x (0.0011)x (0.0005)x (0.0032)x (0.0000)x (0.0095)x (0.0000)x (0.0027)x
Q2(24) 44.7231 208.8894 274.8883 63.9052 72.0091 56.7764 175.0838 231.8930(sig.) (0.0138)y (0.0000)x (0.0000)x (0.0000)x (0.0000)x (0.0002)x (0.0000)x (0.0000)x
B-J Testf 4.8935 10.3975 16.9716 13.0857 9.8078 7.7929 2.2569 1.8999(sig.) (0.0037)x (0.0435)y (0.0072)x (0.0287)y (0.0016)x (0.0078)x (0.0055)x (0.0000)x
S-W Testf 1.0398 0.0916 1.0751 2.0834 0.0809 0.7141 1.8144 1.1792(sig.) (0.0104)y (0.0011)x (0.0017)x (0.0042)x (0.0032)x (0.0261)x (0.0092)x (0.0015)x
aThe sample period is from October 3, 1983 to February 7, 1992, for a total of 1773 observations.bJY 5 Japanese Yen; HK 5 Hong Kong Dollar; KW 5 South Korean Won; MR 5 Malaysian Ringgit; PP 5Philippines Peso; SD 5 Singapore Dollar; TD 5 Taiwan Dollar; TB 5 Thailand Baht.cF1, F5, and F99 are the sample first, fifth, and ninety-ninth fractiles, respectively.dsig. is the significance level. x, y, and z indicate significance at the 1 percent, 5 percent, and 10 percent levels,respectively.eQ(24) and Q2(24) are the Box-Ljung Q-statistics for autocorrelation up to 24 lags for the series and its square,respectively. Under the null hypothesis of no serial correlation Q(24) is ; x2(24). The 1-percent critical valuefor Q(24) 42.9798.fThe B-J and the S-W tests are the Bera-Jarque and the Shapiro-Wilks tests respectively. The P-values for thetests against the null hypothesis of a normal distribution are given in parentheses.
198 AGGARWAL AND MOUGOUÉ
Kluwer Journal@ats-ss3/data11/kluwer/journals/requ/v10n2art4 COMPOSED: 01/13/98 2:43 pm. PG.POS. 6 SESSION: 11
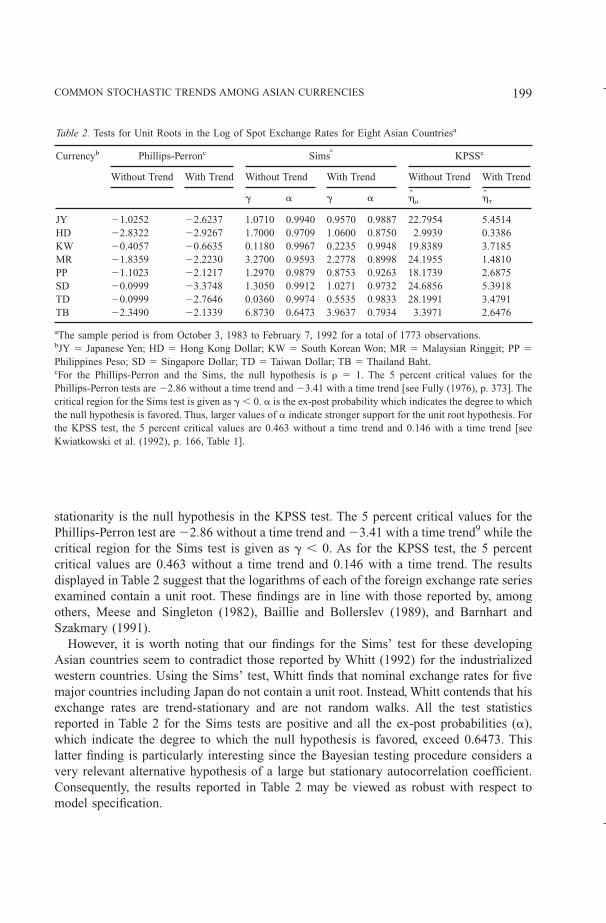
stationarity is the null hypothesis in the KPSS test. The 5 percent critical values for thePhillips-Perron test are 22.86 without a time trend and 23.41 with a time trend9 while thecritical region for the Sims test is given as g , 0. As for the KPSS test, the 5 percentcritical values are 0.463 without a time trend and 0.146 with a time trend. The resultsdisplayed in Table 2 suggest that the logarithms of each of the foreign exchange rate seriesexamined contain a unit root. These findings are in line with those reported by, amongothers, Meese and Singleton (1982), Baillie and Bollerslev (1989), and Barnhart andSzakmary (1991).
However, it is worth noting that our findings for the Sims’ test for these developingAsian countries seem to contradict those reported by Whitt (1992) for the industrializedwestern countries. Using the Sims’ test, Whitt finds that nominal exchange rates for fivemajor countries including Japan do not contain a unit root. Instead, Whitt contends that hisexchange rates are trend-stationary and are not random walks. All the test statisticsreported in Table 2 for the Sims tests are positive and all the ex-post probabilities (a),which indicate the degree to which the null hypothesis is favored, exceed 0.6473. Thislatter finding is particularly interesting since the Bayesian testing procedure considers avery relevant alternative hypothesis of a large but stationary autocorrelation coefficient.Consequently, the results reported in Table 2 may be viewed as robust with respect tomodel specification.
Table 2. Tests for Unit Roots in the Log of Spot Exchange Rates for Eight Asian Countriesa
Currencyb Phillips-Perronc Simsc
KPSSc
Without Trend With Trend Without Trend With Trend Without Trend With Trend
g a g a hµ ht
JY 21.0252 22.6237 1.0710 0.9940 0.9570 0.9887 22.7954 5.4514HD 22.8322 22.9267 1.7000 0.9709 1.0600 0.8750 2.9939 0.3386KW 20.4057 20.6635 0.1180 0.9967 0.2235 0.9948 19.8389 3.7185MR 21.8359 22.2230 3.2700 0.9593 2.2778 0.8998 24.1955 1.4810PP 21.1023 22.1217 1.2970 0.9879 0.8753 0.9263 18.1739 2.6875SD 20.0999 23.3748 1.3050 0.9912 1.0271 0.9732 24.6856 5.3918TD 20.0999 22.7646 0.0360 0.9974 0.5535 0.9833 28.1991 3.4791TB 22.3490 22.1339 6.8730 0.6473 3.9637 0.7934 3.3971 2.6476
aThe sample period is from October 3, 1983 to February 7, 1992 for a total of 1773 observations.bJY 5 Japanese Yen; HD 5 Hong Kong Dollar; KW 5 South Korean Won; MR 5 Malaysian Ringgit; PP 5Philippines Peso; SD 5 Singapore Dollar; TD 5 Taiwan Dollar; TB 5 Thailand Baht.cFor the Phillips-Perron and the Sims, the null hypothesis is r 5 1. The 5 percent critical values for thePhillips-Perron tests are 22.86 without a time trend and 23.41 with a time trend [see Fully (1976), p. 373]. Thecritical region for the Sims test is given as g , 0. a is the ex-post probability which indicates the degree to whichthe null hypothesis is favored. Thus, larger values of a indicate stronger support for the unit root hypothesis. Forthe KPSS test, the 5 percent critical values are 0.463 without a time trend and 0.146 with a time trend [seeKwiatkowski et al. (1992), p. 166, Table 1].
COMMON STOCHASTIC TRENDS AMONG ASIAN CURRENCIES 199
Kluwer Journal@ats-ss3/data11/kluwer/journals/requ/v10n2art4 COMPOSED: 01/13/98 2:43 pm. PG.POS. 7 SESSION: 11
Common stochastic trends
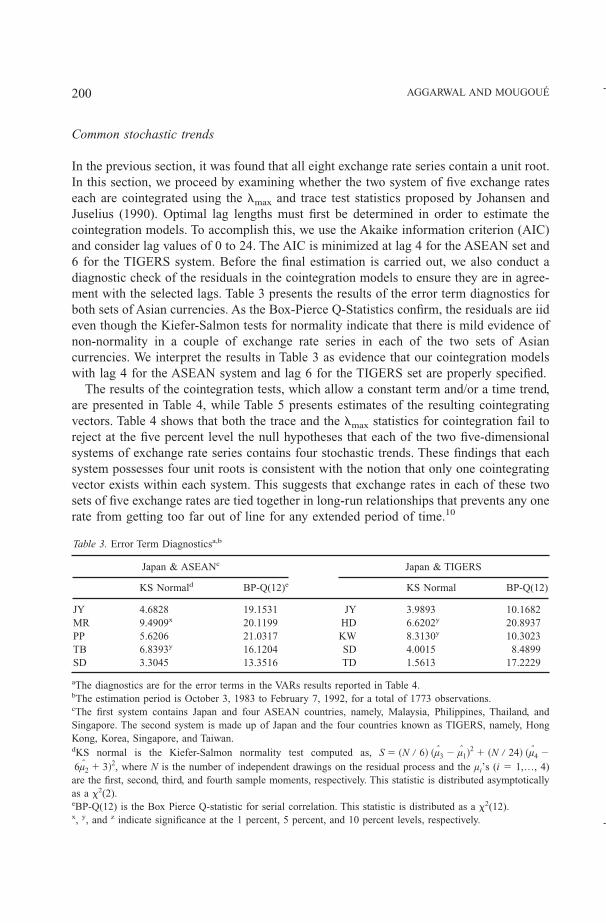
In the previous section, it was found that all eight exchange rate series contain a unit root.In this section, we proceed by examining whether the two system of five exchange rateseach are cointegrated using the lmax and trace test statistics proposed by Johansen andJuselius (1990). Optimal lag lengths must first be determined in order to estimate thecointegration models. To accomplish this, we use the Akaike information criterion (AIC)and consider lag values of 0 to 24. The AIC is minimized at lag 4 for the ASEAN set and6 for the TIGERS system. Before the final estimation is carried out, we also conduct adiagnostic check of the residuals in the cointegration models to ensure they are in agree-ment with the selected lags. Table 3 presents the results of the error term diagnostics forboth sets of Asian currencies. As the Box-Pierce Q-Statistics confirm, the residuals are iideven though the Kiefer-Salmon tests for normality indicate that there is mild evidence ofnon-normality in a couple of exchange rate series in each of the two sets of Asiancurrencies. We interpret the results in Table 3 as evidence that our cointegration modelswith lag 4 for the ASEAN system and lag 6 for the TIGERS set are properly specified.
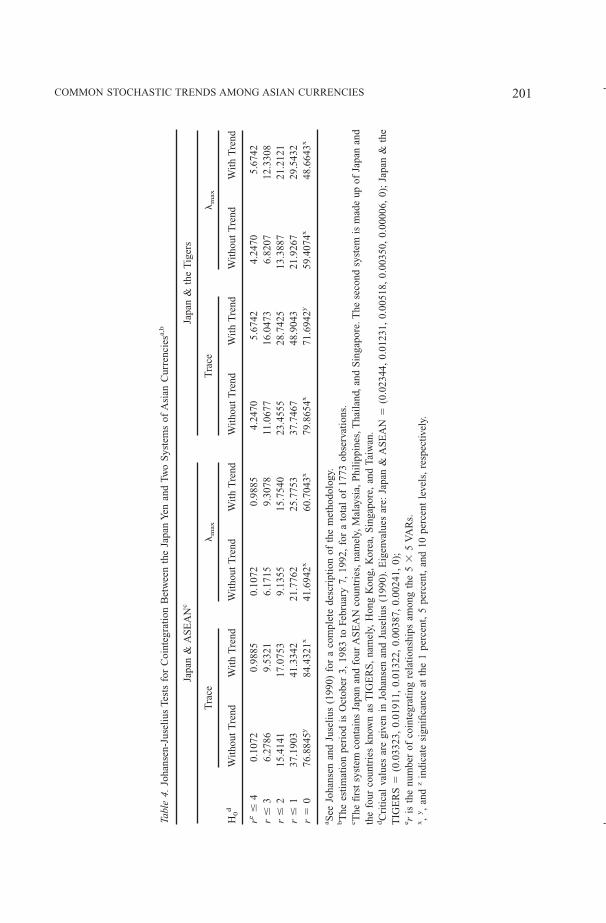
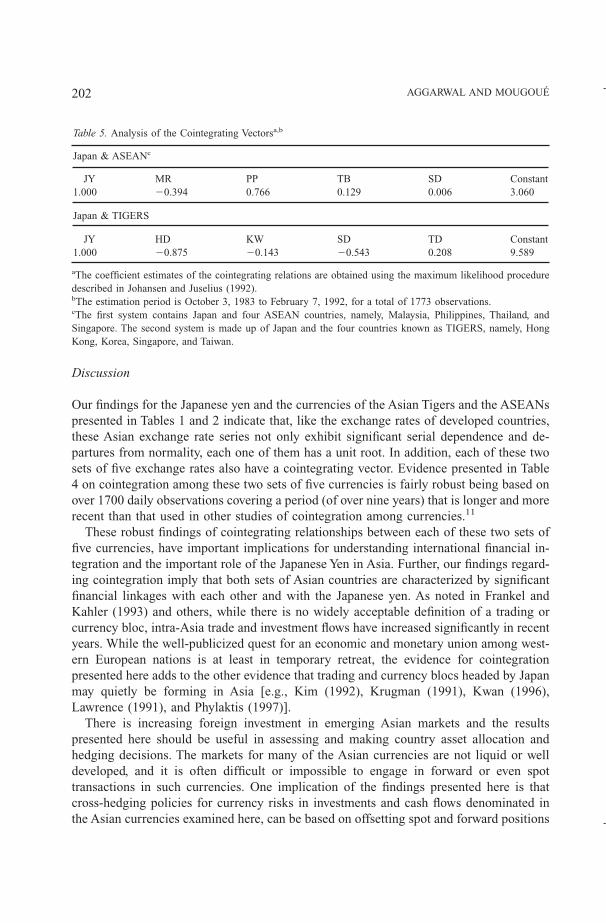
The results of the cointegration tests, which allow a constant term and/or a time trend,are presented in Table 4, while Table 5 presents estimates of the resulting cointegratingvectors. Table 4 shows that both the trace and the lmax statistics for cointegration fail toreject at the five percent level the null hypotheses that each of the two five-dimensionalsystems of exchange rate series contains four stochastic trends. These findings that eachsystem possesses four unit roots is consistent with the notion that only one cointegratingvector exists within each system. This suggests that exchange rates in each of these twosets of five exchange rates are tied together in long-run relationships that prevents any onerate from getting too far out of line for any extended period of time.10
Table 3. Error Term Diagnosticsa,b
Japan & ASEANc Japan & TIGERS
KS Normald BP-Q(12)e KS Normal BP-Q(12)
JY 4.6828 19.1531 JY 3.9893 10.1682MR 9.4909x 20.1199 HD 6.6202y 20.8937PP 5.6206 21.0317 KW 8.3130y 10.3023TB 6.8393y 16.1204 SD 4.0015 8.4899SD 3.3045 13.3516 TD 1.5613 17.2229
aThe diagnostics are for the error terms in the VARs results reported in Table 4.bThe estimation period is October 3, 1983 to February 7, 1992, for a total of 1773 observations.cThe first system contains Japan and four ASEAN countries, namely, Malaysia, Philippines, Thailand, andSingapore. The second system is made up of Japan and the four countries known as TIGERS, namely, HongKong, Korea, Singapore, and Taiwan.dKS normal is the Kiefer-Salmon normality test computed as, S 5 ~N / 6! ~µ3 2 µ1!
2 1 ~N / 24! ~µ4 2
6µ2 1 3!2, where N is the number of independent drawings on the residual process and the µi’s (i 5 1,…, 4)are the first, second, third, and fourth sample moments, respectively. This statistic is distributed asymptoticallyas a x2(2).eBP-Q(12) is the Box Pierce Q-statistic for serial correlation. This statistic is distributed as a x2(12).x, y, and z indicate significance at the 1 percent, 5 percent, and 10 percent levels, respectively.
200 AGGARWAL AND MOUGOUÉ
Kluwer Journal@ats-ss3/data11/kluwer/journals/requ/v10n2art4 COMPOSED: 01/13/98 2:43 pm. PG.POS. 8 SESSION: 11
Tabl
e4.
Joha
nsen
-Jus
eliu
sTe
sts
for
Coi
nteg
rati
onB
etw
een
the
Japa
nY
enan
dTw
oS
yste
ms
ofA
sian
Cur
renc
iesa,
b
Japa
n&
AS
EA
Nc
Japa
n&
the
Tig
ers
Tra
cel
max
Tra
cel
max
H0d
Wit
hout
Tre
ndW
ith
Tre
ndW
itho
utT
rend
Wit
hT
rend
Wit
hout
Tre
ndW
ith
Tre
ndW
itho
utT
rend
Wit
hT
rend
re#
40.
1072
0.98
850.
1072
0.98
854.
2470
5.67
424.
2470
5.67
42r
#3
6.27
869.
5321
6.17
159.
3078
11.0
677
16.0
473
6.82
0712
.330
8r
#2
15.4
141
17.0
753
9.13
5515
.754
023
.455
528
.742
513
.388
721
.212
1r
#1
37.1
903
41.3
342
21.7
762
25.7
753
37.7
467
48.9
043
21.9
267
29.5
432
r5
076
.884
5y84
.432
1x41
.694
2x60
.704
3x79
.865
4x71
.694
2y59
.407
4x48
.664
3x
a See
Joha
nsen
and
Juse
lius
(199
0)fo
ra
com
plet
ede
scri
ptio
nof
the
met
hodo
logy
.bT
hees
tim
atio
npe
riod
isO
ctob
er3,
1983
toFe
brua
ry7,
1992
,fo
ra
tota
lof
1773
obse
rvat
ions
.c T
hefi
rst
syst
emco
ntai
nsJa
pan
and
four
AS
EA
Nco
untr
ies,
nam
ely,
Mal
aysi
a,P
hili
ppin
es,T
hail
and,
and
Sin
gapo
re.T
hese
cond
syst
emis
mad
eup
ofJa
pan
and
the
four
coun
trie
skn
own
asT
IGE
RS
,na
mel
y,H
ong
Kon
g,K
orea
,S
inga
pore
,an
dTa
iwan
.dC
riti
cal
valu
esar
egi
ven
inJo
hans
enan
dJu
seli
us(1
990)
.E
igen
valu
esar
e:Ja
pan
&A
SE
AN
5(0
.023
44,
0.01
231,
0.00
518,
0.00
350,
0.00
006,
0);
Japa
n&
the
TIG
ER
S5
(0.0
3323
,0.
0191
1,0.
0132
2,0.
0038
7,0.
0024
1,0)
;e r
isth
enu
mbe
rof
coin
tegr
atin
gre
lati
onsh
ips
amon
gth
e5
35
VA
Rs.
x,
y,
and
zin
dica
tesi
gnifi
canc
eat
the
1pe
rcen
t,5
perc
ent,
and
10pe
rcen
tle
vels
,re
spec
tivel
y.
COMMON STOCHASTIC TRENDS AMONG ASIAN CURRENCIES 201
Kluwer Journal@ats-ss3/data11/kluwer/journals/requ/v10n2art4 COMPOSED: 01/13/98 2:43 pm. PG.POS. 9 SESSION: 11
Discussion
Our findings for the Japanese yen and the currencies of the Asian Tigers and the ASEANspresented in Tables 1 and 2 indicate that, like the exchange rates of developed countries,these Asian exchange rate series not only exhibit significant serial dependence and de-partures from normality, each one of them has a unit root. In addition, each of these twosets of five exchange rates also have a cointegrating vector. Evidence presented in Table4 on cointegration among these two sets of five currencies is fairly robust being based onover 1700 daily observations covering a period (of over nine years) that is longer and morerecent than that used in other studies of cointegration among currencies.11
These robust findings of cointegrating relationships between each of these two sets offive currencies, have important implications for understanding international financial in-tegration and the important role of the Japanese Yen in Asia. Further, our findings regard-ing cointegration imply that both sets of Asian countries are characterized by significantfinancial linkages with each other and with the Japanese yen. As noted in Frankel andKahler (1993) and others, while there is no widely acceptable definition of a trading orcurrency bloc, intra-Asia trade and investment flows have increased significantly in recentyears. While the well-publicized quest for an economic and monetary union among west-ern European nations is at least in temporary retreat, the evidence for cointegrationpresented here adds to the other evidence that trading and currency blocs headed by Japanmay quietly be forming in Asia [e.g., Kim (1992), Krugman (1991), Kwan (1996),Lawrence (1991), and Phylaktis (1997)].
There is increasing foreign investment in emerging Asian markets and the resultspresented here should be useful in assessing and making country asset allocation andhedging decisions. The markets for many of the Asian currencies are not liquid or welldeveloped, and it is often difficult or impossible to engage in forward or even spottransactions in such currencies. One implication of the findings presented here is thatcross-hedging policies for currency risks in investments and cash flows denominated inthe Asian currencies examined here, can be based on offsetting spot and forward positions
Table 5. Analysis of the Cointegrating Vectorsa,b
Japan & ASEANc
JY MR PP TB SD Constant1.000 20.394 0.766 0.129 0.006 3.060
Japan & TIGERS
JY HD KW SD TD Constant1.000 20.875 20.143 20.543 0.208 9.589
aThe coefficient estimates of the cointegrating relations are obtained using the maximum likelihood proceduredescribed in Johansen and Juselius (1992).bThe estimation period is October 3, 1983 to February 7, 1992, for a total of 1773 observations.cThe first system contains Japan and four ASEAN countries, namely, Malaysia, Philippines, Thailand, andSingapore. The second system is made up of Japan and the four countries known as TIGERS, namely, HongKong, Korea, Singapore, and Taiwan.
202 AGGARWAL AND MOUGOUÉ
Kluwer Journal@ats-ss3/data11/kluwer/journals/requ/v10n2art4 COMPOSED: 01/13/98 2:43 pm. PG.POS. 10 SESSION: 11
in the relatively more liquid Japanese Yen or other more liquid currencies which may berelated to the Japanese Yen.12 Further, these findings also have significant implications forassessing asset allocation, curency overlay, and value at risk (VAR) strategies.
4. Conclusions
Most research on international financial market integration and on the behavior of ex-change rates has focused on the currencies of the developed and mostly western countriesand have noted the need to examine longer time horizons. This paper examines, over aperiod longer than in other currency cointegration studies, the stochastic time-seriesproperties and financial integration between the Japanese Yen and two sets of four Asiancurrencies, i.e., the currencies of the Tigers: Hong Kong, South Korea, Singapore, andTaiwan; and the currencies of the ASEANs: Malaysia, Philippines, Thailand, and Sin-gapore. Significant deviations from normality, serial correlations, non-stationarity, and thepresence of unit roots were documented for each currency. Further, both sets of theseAsian currencies were found to be cointegrated with the Japanese yen.
These results documenting a close relationship between the Japanese yen and the otherAsian currencies should be of interest to policy makers, managers, and others interestedin Asian financial markets. For example, these findings have important implications forunderstanding international integration among Asian countries and the international roleof the Japanese yen, as well as for developing asset allocation, value at risk (VAR),currency overlay, and hedging strategies for investments and cash flows denominated inthese often illiquid currencies of Asian emerging markets.
Acknowledgment
The authors would like to thank P. Andersen, R. Baillie, V. Errunza, K. Hogan, D. Schirm,and other participants in various research seminars including those at the Sevreges Riks-bank and the Reserve Bank of Australia for useful comments on earlier versions of thispaper, and the Mellen Foundation and Wayne State University for research support. Thecontents remain the responsibility solely of the authors.
Notes
1. For a review of research on developed country exchange rates see, for example, Baillie and McMohan(1989). Related research on developing country exchange rates is relatively sparse. For some examples see,Rana (1981), Glick and Hutchison (1994), and Chinn and Frankel (1994). These studies focus on short rundynamics and do not examine cointegration issues.
2. The Indonesian Rupiah was fixed for most of the period under investigation and is, thus, excluded from thisanalysis as it would provide no information useful in this analysis.
3. There seems to be a consensus that the world economy is moving towards three economic blocs with theAsian bloc centered around Japan [see for example, Kim, (1992); Krugman, (1991); Kwan, (1996); and
COMMON STOCHASTIC TRENDS AMONG ASIAN CURRENCIES 203
Kluwer Journal@ats-ss3/data11/kluwer/journals/requ/v10n2art4 COMPOSED: 01/13/98 2:45 pm. PG.POS. 11 SESSION: 12
Lawrence, (1991)]. The Asian countries have increasingly been a focus for Japanese foreign investment inrecent years. For details see, for example, Frankel (1993), Lii (1994), and “Third wave carries investorstoward China, South Asia, Vietnam” The Nikkei Weekly, July 25, 1992, p. 31. Further, Japanese FDI in Asiais rapidly and significantly being supplemented by FDI from the newly industrialized Asian countries (see,for example, “South-East Asia’s Octopuses” Economist, July 17, 1993, pp. 61–62).
4. The temporal aggregation results of Boothe and Glassman (1987) may reflect the outcome of a series whichhas been over differenced. While Whitt (1989) reports that monthly changes in the spot rate reject the nullhypothesis of a unit root in the series, Baillie and Bollerslev (1994) and others confirm the presence of unitroots in the daily exchange rates of the major currencies.
5. Frankel (1993) examines relationships between Asian currencies and contends that in spite of increasedintra-Asia trade and investment, evidence of a Yen Bloc in Asia is not strong.
6. For additional details on the Phillips-Perron test, see Phillips and Perron (1988). Also see Bollerslev et al(1992) and Pagan (1996) for excellent reviews of these and related procedures.
7. The exchange rate data used here pertain to the official market. For some currencies, such as the PhilippinePeso and the Malaysian Ringgit, significant foreign exchange may be traded in parallel or black markets thatcoexist with the official market.
8. This study uses data on 1773 daily observations over about nine years while both the recent studies citedhere use 1245 daily observations for about six years (March 1980–January 1985).
9. This critical value was taken from Fuller (1976), Table 8.5.2, page 373.10. The results presented here seem fairly robust to alternative specifications. While it has been suggested that
these findings should be interpreted with caution as they are derived from non-normal data, as Diebold etal (1994) note, it has been found that the Johansen procedures are remarkably robust to these and otherdeviations from classical assumptions.
11. As noted earlier, this study uses approximately one and a half times the observations used in other recentstudies of currency cointegration such as Baillie and Bolerslev (1994) and Diebold et al (1994). In addition,the results presented here do not change when the analysis is repeated without the stock market crash periodof October 1987.
12. It is possible that the Japanese yen may simply be acting as a proxy for other liquid currencies not examinedhere. Thus, cross-hedging policies should assess not only investments and derivatives denominated in theJapanese yen, but also in other such currencies [for details see, for example, Aggarwal and DeMasky,(1997)].
References
Aggarwal, R. and A. DeMaskey, “Cross Hedging Currency Risks in Asian Emerging Markets Using Derivativesin the Major Currencies.” Journal of Portfolio Management 23 (No. 3, Spring), 88–95, (1997).
Akgiray, V. and G.G. Booth, “Mixed Diffusion-Jump Process Modeling of Exchange Rate Movements.” Reviewof Economics and Statistics (November), 631–637, (1988).
Baillie, R.T. and T. Bollerslev, “Common Stochastic Trends in a System of Exchange Rates.” Journal of Finance44 (No. 1, March), 167–181, (1989).
Baillie, R.T. and T. Bollerslev, “Cointegration, Fractional Cointegration, and Exchange Rate Dynamics.” Journalof Finance 49 (No. 2, June), 737–745, (1994).
Baillie, R.T. and P. McMahon, The Foreign Exchange Market: Theory and Econometric Evidence New York:Cambridge University Press, 1989.
Barnhart, S.W. and A.C. Szakmary, “Testing the Unbiased Forward Rate Hypothesis: Evidence on Unit Roots,Cointegration and Stochastic Coefficients.” Journal of Financial and Quantitative Analysis 26 (No. 2, June),245–267, (1991).
Blangiewicz, M. and W.W. Charezma, “Cointegration in Small Samples.” Oxford Bulletin of Economics andStatistics 52 (June), 303–315, (1990).
Bollerslev, T., R.Y. Chen, and K.F. Kroner, “ARCH Analysis in Finance: A Review of Theory and EmpiricalEvidence” Journal of Econometrics 52, 5–59, (1992).
204 AGGARWAL AND MOUGOUÉ
Kluwer Journal@ats-ss3/data11/kluwer/journals/requ/v10n2art4 COMPOSED: 01/13/98 2:43 pm. PG.POS. 12 SESSION: 11

Boothe, P. and D. Glassman, “The Statistical Distribution of Exchange Rates.” Journal of International Eco-nomics 22 (May), 297–319, (1987).
Chinn, M. and J. Frankel, “Patterns in Exchange Rate Forecasts for Twenty Five Currencies.” Journal of MoneyCredit and Banking 26 (No. 4, November), 759–770, (1994).
Corbae, D. and S. Ouliaris, “Robust Tests for Unit Roots in Foreign Exchange Markets.” Economic Letters 22,375–80, (1986).
Dickey, D.A. and W. Fuller, “Distribution of Estimators for Autoregressive Time Series with a Unit Root.”Journal of the American Statistical Association 74, 427–431, (1979).
Dickey, D.A., D.W. Jansen, and D.L. Thornton, “A Primer on Cointegration with an Application to Money andIncome.” FRB of St. Louis Economic Review (March/April), 58–78, (1991).
Diebold, F.X., J. Gardeazabal, and K. Yilmaz, “On Cointegration and Exchange Rate Dynamics.” Journal ofFinance 49 (No. 2, June), 727–735, (1994).
Dwyer, G.P. and M.S. Wallace, “Cointegration and Asset Pricing” Journal of International Money and Finance11, 318–327, (1992).
Eichengreen, B. and T. Bayoumi, “Shocking Aspects of European Monetary Unification?” NBER Working PaperNumber 3949, Cambridge, MA, 1992.
Engle, R.F., “Autoregressive Conditional Heteroskedasticity with Estimates of the Variance of United KingdomInflation.” Econometrica 50 (July), 987–1007, (1982).
Engle, R.F., D.M. Lilien, and R.P. Robins, “Estimating Time-Varying Risk Premia in the Term Structure: TheARCH-M Model.” Econometrica 55, 391–407, (1987).
Engle, R.F. and C.W.J. Granger,“Co-Integration and Error Correction: Representation, Estimation, and Testing.”Econometrica 55, 251–276, (1987).
Fama, E., “Efficient Capital Markets: A Review of Theory and Empirical Work.” Journal of Finance 25 (No. 2,June), 382–417, (1970).
Frankel, J.A., “Is Japan Creating a Yen Block in East Asia and the Pacific?” Chapter 2 of J.A. Frankel and M.Kahler, (eds.), Regionalism and Rivalry: Japan and the United States in Pacific Asia. Chicago: University ofChicago Press, 53–85, 1993.
Frankel, J.A. and M. Kahler, (eds.), Regionalism and Rivalry: Japan and the United States in Pacific AsiaChicago: University of Chicago Press, 1993.
Friedman, D. and S. Vandersteel, “Short-Run Fluctuations in Foreign Exchange Rates.” Journal of InternationalEconomics 123, 171–186, (1982).
Fuller, W., Introduction to Statistical Time Series, New York: John Wiley & Sons, 1976.Glick, R. and M. Hutchison, (eds.), Exchange Rate Policy and Interdependence: Perspectives from the Pacific
Rim New York: Cambridge University Press, (1994).Granger, C.W.J., “Developments in the Study of Cointegrated Economic Variables.” Oxford Bulletin of Econom-
ics and Statistics 48 (August), 213–228, (1986).Gray, Gavin, “Dealing with Exotic Currencies.” Corporate Finance 38 (No. 2, February), 9–11, (1991).Hakkio, C.S. and M. Rush, “Market Efficiency and Cointegration: An Application to the Sterling and Deutsche
Mark Exchange Markets.” Journal of International Money and Finance 8, 75–88, (1989).Hakkio, C.S. and M. Rush, “Cointegration: How Short is the Long Run?” Journal of International Money and
Finance 10, 571–81, (1991).Hsieh, D.A., “The Statistical Properties of Daily Foreign Exchange Rates: 1974–1984.” Journal of International
Economics 24, 129–145, (1988).Hsieh, D.A., “Testing for Nonlinear Dependency in Daily Foreign Exchange Rates.” Journal of Business 62,
339–368, (1989).Johansen, S., “Statistical Analysis of Cointegration Vectors.” Journal of Economic Dynamics and Control, 12,
231–254, (1988).Johansen, S. and K. Juselius, “Maximum Likelihood Estimation and Inference on Cointegration with Applica-
tions to the Demand for Money.” Oxford Bulletin of Economics and Statistics 52 (May), 169–210, (1990).Kiefer, N.A. and M. Salmon, “Testing Normality in Econometric Models.” Economic Letters 11, 123–127,
(1983).
COMMON STOCHASTIC TRENDS AMONG ASIAN CURRENCIES 205
Kluwer Journal@ats-ss3/data11/kluwer/journals/requ/v10n2art4 COMPOSED: 01/13/98 2:43 pm. PG.POS. 13 SESSION: 11
Kim, Duk-Choong, “Open Regionalism in the Pacific: A World of Trading Blocs?” American Economic Review82 (No. 2, May), 79–83, (1992).
Kim, Y., “Purchasing Power Parity in the Long Run.” Journal of Money Credit and Banking 22 (No. 4,November), 491–503, (1990).
Kojima, Kiyoshi, “Japanese and American Direct Investment in Asia: A Comparative Analysis.” HitotsubashiJournal Economics 26 (No. 1, June), (1985).
Krugman, Paul, “The Move Towards Free Trade Zones.” in Policy Implications of Trade and Currency ZonesKansas City, KS: Federal Reserve Bank of Kansas City, 7–42, 1991.
Kwiatkowski, D., Phillips, Peter C.B., Schmidt, P., and Shin, Y., “Testing the Null Hypothesis of StationarityAgainst the Alternative of a Unit Root.” Journal of Econometrics 54, 159–178, (1992).
Kwan, C.H., “A Yen Bloc in Asia: An Integrative Approach.” Journal of the Asia-Pacific Economy 1(1), 1–21,(1996).
Lawrence, Robert, “Emerging Regional Arrangements: Building Blocks or Stumbling Blocks” in RichardO’Brien, (ed.), Finance in the International Economy. New York: Oxford University Press, 24–36, 1991.
Leamer, E.E., Specification Searches. New York: John Wiley, 1978.Leroy, S.F., “Risk Aversion and the Martingale Property of Stock Returns.” International Economic Review 14,
436–446, (1973).Lii, Sheng-Yann, “Japanese Direct Foreign Investment and Trade Flows in the Asia-Pacific Region” Asian
Economics Journal 8 (No. 2), 181–203, (1994).Liu, C.Y. and J. He, “A Variance-Ratio Test of Random Walks in Foreign Exchange Rates” Journal of Finance
46 (No. 2, June), 773–785, (1991).McFarland, J.W., R.R. Pettit, and S.K. Sung, “The Distribution of Foreign Exchange Price Changes: Trading Day
Effects and Risk Measurement.” Journal of Finance 37, 693–715, (1982).McLeod, A.J. and W.K. Li, “Diagnostic checking ARMA Time Series Using Square-Residual Autocorrelations.”
Journal of Time Series Analysis 4, 269–273, (1983).Meese, R.A. and K.J. Singleton, “On Unit Roots and the Modeling of Exchange Rates.” Journal of Finance 37
(No. 4, September), 1029–1035, (1982).Meese, R.A. and K. Rogoff, “Empirical Exchange Rate Models of the Seventies: Do they Fit Out-of-Sample?”
Journal of International Economics 14 (No. 1), 3–24, (1983).Pagan, Adrian, “The Economics of Financial Markets.” Journal of Empirical Finance 3 (1), 15–102, (1996).Phillips, P.C.B. and P. Perron, “Testing for a Unit Root in Time Series Regression.” Biometrika 75, 335–346,
(1988).Phylaktis, K., “Capital Market Integration in the Pacific Basin: An Analysis of Real Interest Rate Linkages.”
Pacific Basin Finance Journal 5 (No. 2, June), 195–213, (1997).Rana, P., “Exchange Rate Risk Under Generalized Floating: Eight Asian Currencies.” Journal of International
Economics 11, 459–66, (1981).Sato, R., R. M. Levich, and R. V. Ramachandran, (eds.). Japan, Europe, and International Financial Markets.
New York: Cambridge University Press, 1994.Sephton, P.S., H.K. Larsen, “Tests of Exchange Market Efficiency: Fragile Evidence from Cointegration Tests.”
Journal of International Money and Finance 10, 561–570, (1994).Sims, C.A., “Bayesian Skepticism on Unit Root Econometrics.” Journal of Economic Dynamics and Control 12
(June/September), 463–474, (1988).Stock, J.H. and M.W. Watson, “Testing for Common Trends.” Journal of American Statistical Association 83,
1097–1107, (1988).Whitt, J.A., Jr., “Nominal Exchange Rates and Unit Roots: A Reconsideration” Journal of International Money
and Finance 11, 539–551, (1992).
206 AGGARWAL AND MOUGOUÉ
Kluwer Journal@ats-ss3/data11/kluwer/journals/requ/v10n2art4 COMPOSED: 01/13/98 2:43 pm. PG.POS. 14 SESSION: 11