common spatial pattern using multivariate emd for … · common spatial pattern using multivariate...
TRANSCRIPT

Common Spatial Pattern Using Multivariate EMDfor EEG Classification
Long Zhang∗, Cheng Zhang∗, Hiroshi Higashi∗ ‡, Jianting Cao† ‡, and Toshihisa Tanaka∗ ‡∗ Tokyo University of Agriculture and Technology, Japan
∗ E-mail: qiaoliu,chousei,[email protected], [email protected] Tel/Fax: +81-42-388-7123† Saitama Institute of Technology, Japan† [email protected] Tel/Fax: +81-48-585-6854‡ RIKEN Brain Science Institute, Japan
Abstract—Brain-computer interface (BCI) is a system to trans-late humans thoughts into commands. For electroencephalog-raphy (EEG) based BCI, motor imagery is considered as oneof the most effective ways. This paper presents a methodfor classifying EEG during motor-imagery by the combinationof well-known common spatial pattern (CSP) with so-calledmultivariate empirical mode decomposition (MEMD), which iseffectively suitable for processing of multichannel signals of EEG.In the proposed method, the EEG signal is decomposed intointrinsic mode functions (IMF) using the MEMD. Different fromEMD, the number of IMF is the same in each channel. Then byremoving some of the IMFs, the reconstructed signal can carrymore useful information than the original signal. Based on theMEMD, weights of CSP are found. By off-line simulation, the useof MEMD in CSP has shown to perform well in the applicationto the classification of EEG signals.
I. Introduction
Brain-computer interface (BCI) can translate humansthoughts directly to the outside world. It is a new technologyas a radically new communication option for those withneuromuscular impairments that prevent them from usingconventional augmentative communication methods. It enablesus to connect to the real world without peripheral nerves andmuscles.
The brain normally produces tiny electrical signals thatcome from the brain cells and nerves which send messagesto each other. These electrical signals can be detected andrecorded by the electroencephalography (EEG) measurements.It has been chosen to capture brainwaves for BCI applicationsbecause of its simplicity, inexpensiveness and high temporalresolution.
Because of the volume conduction, EEG signals give aunclear image of brain activity [2]. Therefore, a spatial filteringpreprocessing stage which performs source separation beforefeature extraction is often used to improve BCI’s performance,so that it can give a clear response to the brain acticity.Recently, common spatial pattern (CSP) has been widely usedin spatial filtering because of its efficiency [3] [4]. However,it can only reflect the separative ability of the mean powerof two classes. Artifacts such as eye and muscle activitiesmay dominate over the EEG signal, and thus they may giveexcessive power in some channels. Because of CSP simplypooling the covariance matrices of trials together, if an artifact
happens to be unevenly distributed in different experimentconditions, CSP will capture it with a high eigenvalue. Thiswill distort the following CSP spatial filter. Therefore, it mustbe removed as much as possible.
To remove such a non-linear artifact, the empirical modedecomposition (EMD) has been used [1] [2]. The EMD is asignal processing decomposition technique that decomposesthe signal into waveforms modulated in both amplitude andfrequency by extracting all of the oscillatory modes embeddedin the signal. The key issue in EMD processing is the com-putation of the local mean of the original singal, a step whichdepends critically on finding the local extrema. In real-valuedEMD, the local mean is computed by taking an average ofupper and lower envelopes, which in turn are obtained by inter-polating between the local maxima and minima. In the actualsignal processing, multivariate signals are necessary to be dealtwith. In general, for multivariate signals, the local maximaand minima may not be defined directly [5]. So it is onlysuitable for univariate (real valued) signals. Although artifactswill commonly appear over several channels, univariate EMDcannot consider inter-channel relationship in decomposition.
Recently, an n-variate EMD processing for signal processingdecomposition, so-called multivariate empirical mode decom-position (MEMD) has been proposed [10], which is an exten-sion of the basic EMD suitable for dealing with multivariatesignals. MEMD generates multiple n-dimensional envelopesby taking signal projections along different directions in n-dimensional spaces, and then averaged to obtain the localmean.
In this paper, we propose to combine CSP with MEMD, toextract necessary components from multi-channel signals. Bythe application of MEMD processing, an n-variate signal isdecomposed into a finite set of amplitude-and/or frequency-modulate components, where some artifact-related compo-nents are discarded and the reconstructed signal is obtained.This signal is used for designing CSP.
II. Common Spatial Pattern (CSP) – Review
CSP is an effective method for feature extraction andclassification in two class motor imagery–BCI. This section
APSIPA ASC 2011 Xi’an
reviews basic CSP processing [3] [4].Let X ∈RM×N be an observed signal, where M is the number
of channels and N is the number of samples. CSP finds aspatial weight vector, w ∈ RM , in such a way that a varianceof a signal extracted by linear combination of X is minimizedin a class. Actually, we do not directly use X, but use thefiltered signal described as X = H(X) in CSP, where H isa bandpass filter which passes the frequency band related tobrain activity of motor-imagery. Denote the components of Xby X = [x1, . . . , xN], where xn ∈RM , and the time mean of theobserved signal is given by µ = 1
N∑N
n=1 xn. Then, the varianceof the extracted signal of X is given by
σ2(X,w) =1N
N∑n=1
|wT (xn−µ)|2. (1)
We assume that sets of the learning data, C1 and C2, where Cdcontains the signals belonging to class d, d ∈ 1,2 is a classlabel, and C1∩C2 = ∅. CSP finds the weight vector that mini-mizes the intra-class variance in Cc, under the normalization ofsamples, where c ∈ 1,2. More specifically, for c fixed, CSPfinds wc by solving the following optimization problem [3][4];
minw
EX∈Cc [σ2(X,w)]
subject to∑
d=1,2
EX∈Cd [σ2(X,w)] = 1, (2)
where EX∈Cd [·] denotes the expectation over Cd. Then, (2) canbe rewritten as
minw
wTΣcw, subject to wT (Σ1+Σ2)w = 1, (3)
where Σd, d = 1,2, are defined as
Σd = EX∈Cd
1N
N∑n=1
(xn−µ)(xn−µ)T
. (4)
The solution of (3) is given by the generalized eigenvectorcorresponding to the minimum generalized eigenvalue of thegeneralized eigenvalue problem described as
Σcw = λ(Σ1+Σ2)wc. (5)
For classification, the following method is applicable to CSP.Given an unlabeled data, X, we classify X by the followingrule:
u = argmincσ2(X,w) =⇒ X ∈ Cu. (6)
III. EmpiricalMode Decomposition
The EMD processing is a fully data-driven method designedfor multi-scale decomposition and time-frequency analysis ofreal-world signals, whereby the original signal is modeledas a linear combination of intrinsic oscillatory modes, calledintrinsic mode functions (IMFs), which are defined so as toexhibit locality in time and to represent a single oscillatorymode.
A. Univariate EMD
EMD decomposes the original signal into a finite set ofamplitude-and/or frequency-modulated components, termedIMFs, which represent its inherent oscillatory modes. Morespecifically, for a real-valued signal x(k), the standard EMDfinds a set of N IMFs ci(k)Ni=1 , and a monotonic residuesignal r(k), so that
x(k) =N∑
i=1
ci(k)+ r(k) (7)
IMFs ci(k) are defined so as to have symmetric upper andlower envelopes, with the number of zero crossings and thenumber of extrema differing at most by one. The process toobtain the IMFs is called sifting.
The first complex extension of EMD was proposed in [6].An extension of EMD to analyze complex/bivariate data whichoperates fully in the complex domain was first proposed in[7], termed rotation invariant EMD (RI-EMD). An processingwhich gives more accurate values of the local mean is thebivariate EMD (BEMD) [8], where the envelopes correspond-ing to multiple directions in the complex plane are generated,and then averaged to obtain the local mean. An extensionof EMD to trivariate signals has been recently proposed in[9]; the estimation of the local mean and envelopes of atrivariate signal is performed by taking projections alongmultiple directions in three-dimensional spaces.
B. Multi-Variate EMD
For multivariate signals, the local maxima and minima maynot be defined directly because the fields of complex numbersand quaternions are not ordered [9]. Moreover, the notion of‘oscillatory’ modes defining an IMF is rather confusing formultivariate signals. To deal with these problems, the multiplereal-valued projections of the signal was proposed [10]. Theextrema of such projected signals are then interpolated com-ponentwise to yield the desired multidimensional envelopes ofthe signal. In multivariate EMD, we choose a suitable set ofdirection vectors in n-dimensional spaces by using: (i) uniformangular coordinates and (ii) low-discrepancy pointsets.
The problem of finding a suitable set of direction vectorsthat the calculation of the local mean in an n-dimensionalspace depends on can be treated as that of finding a uniformsampling scheme on an n sphere. For the generation of apointset on an (n−1) sphere, consider the n sphere with centrepoint C and radius R, given by R =
∑n+1j=1 (x j −C j)2 where a
coordinate system in an n-dimensional Euclidean space canthen be defined to serve as a pointset on an (n− 1) sphere.Let θ1, θ2, . . . , θn−1 be a set of the (n−1) angular coordinates,then an n-dimensional coordinate system having xini=1as then coordinates on a unit (n−1) sphere is given by
xn = sin(θ1)× · · ·× sin(θn−2)× sin(θn−1) (8)
Discrepancy can be regarded as a quantitative measure for theirregularity (non-uniformity) of a distribution, and may be usedfor the generation of the so-called ‘low discrepancy pointset’,
leading to a more uniform distribution on the n sphere. Aconvenient method for generating multidimensional‘ low-discrepancy ’ sequences involves the family of Halton andHammersley sequences. Let x1, x2, . . . , xn be a set of the firstn prime numbers, then the ith sample of a one-dimensionalHalton sequence, denoted by rx
i is given by
rxi =
a0
x+
a21
x+
a33
x+ · · ·+ as+1
s
x(9)
where base−x representation of i is given by
i = a0+a1× x+a2× x2+ · · ·+as× xs (10)
Starting from i= 0, the ith sample of the Halton sequence thenbecomes
(rx1i ,r
x2i ,r
x3i , . . . ,r
xni ) (11)
Consider a sequence of n-dimensional vectors V(t)Tt=1 =
v1(t),v2(t), . . . ,vn(t) which represents a multivariate signalwith n-components, and Xθk = xk
1, xk2, . . . , x
kn denoting a set
of direction vectors along the directions givenby angles θk =θk1, θ
k2, . . . , θ
kn−1 on an (n − 1) sphere. Then, the proposed
multivariate extension of EMD suitable for operating ongeneral nonlinear and non-stationary n-variate time series issummarized in the following.
1) Choose a suitable pointset for sampling on an (n− 1)sphere.
2) Calculate a projection, denoted by pθk (t)Tt=1 , of theinput signal v(t)Tt=1 along the direction vector xθk ,for all k (the whole set of direction vectors),givingpθk (t)Kk=1 as the set of projections.
3) Find the time instants tθki corresponding to the maximaof the set of projected signals pθk (t)Kk=1.
4) Interpolate tθki ,v(tθki ) to obtain multivariate envelopecurves eθk (t)Kk=1.
5) For a set of K direction vectors, the mean m(t) of theenvelope curves is calculated as
m(t) =1K
K∑k=1
eθk (t) (12)
6) Extract the ‘detail’ d(t) using d(t)= x(t)−m(t). If the ‘de-tail’ d(t) fulfills the stoppage criterion for a multivariateIMF, apply the above procedure to x(t)−d(t), otherwiseapply it to d(t).
The stoppage criterion for multivariate IMFs is similar to thestandard one in EMD, which requires IMFs to be designed insuch a way that the number of extrema and the zero crossingsdiffer at most by one for S consecutive iterations of theshifting processing. The optimal empirical value of S has beenobserved to be in the range of 2–3 [11]. In the multivariateEMD, we apply this criterion to all projections of the inputsignal and stop the shifting process once the stopping conditionis met for all projections.
IV. Application ofMEMD to CSP
We propose a new method by the combination of CSP withMEMD processing. In the first step MEMD application to theoriginal signal x(k), each channel has the same number ofIMF index ci(k). Through some experiment, we remove someof IMFs, in this way a new signal x(k) is reconstructed by
x(k) =∑i∈Ω
ci(k)+ r(k) (13)
where Ω is IMF index, r(k) is the residue, ci(k) reperents theIMFs corresponding to the original signal, and k is time. Thereconstructed signal can carry more useful information thanthe original signal, and are used to design CSP.
V. Experimental Results
We experimented classification of EEG during imaginedmovement using the method we proposed. In the experiment,the proposed method (MEMD–CSP) is used to the classifi-cation of the EEG data. We also compare the performanceof the proposed method to that of other methods (CSP andEMD–CSP).A. Dataset
The EEG dataset which we test with is from BCI competi-tionIII 2005. This dataset comprises of 118 electrode channelsout of an EEG amplifier sampled at 100Hz. These data arecollected from five subjects aa, al, av, aw, ay. The EEG dataused in this experiment consisted of two classes: right hand(R) and right foot (F) motor imageries. The visual cues at eachtrial last for 3.5 seconds and there are 280 trials each subject,and 140 trials in each class. [12].
In this experiment, we applied bandpass filter at first, whichthe passbands for each subject was 7–30 Hz. Because theselection of a suitable EEG reference can greatly influence theclassification accuracy and sensitivity to artifacts [13] [14].In this paper, we also performed another experiment as acomparison, using a small Laplacian reference [4] which isobtained by rereferencing an electrode to the mean of its fournearest neighboring electrodes. Before we apply MEMD orEMD, 100 of 140 trials in each class were randomly dividedinto 10 groups, all trials were completely disrupted the order,9 of which were used for processing and learning, leaving 1group as test data (leave-one-out).
B. Experiment Method
1) Channel selection: It is well-known that during themotor imageries, the parts of brain center are most active [15].We selected 7 channels from the whole EEG: C1, C2, C3, C4,C5, C6, Cz, which obtained the biggest contrast between theweight spatial weights given by CSP. Here we call channel51–57 for short.
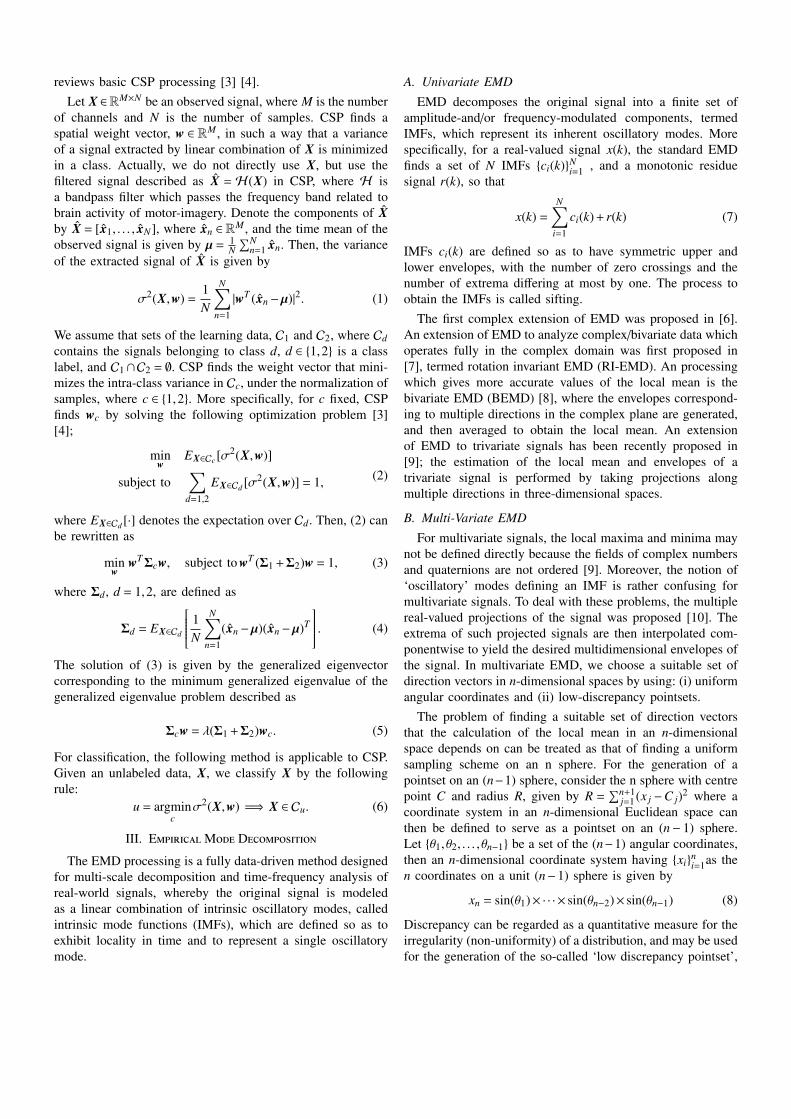
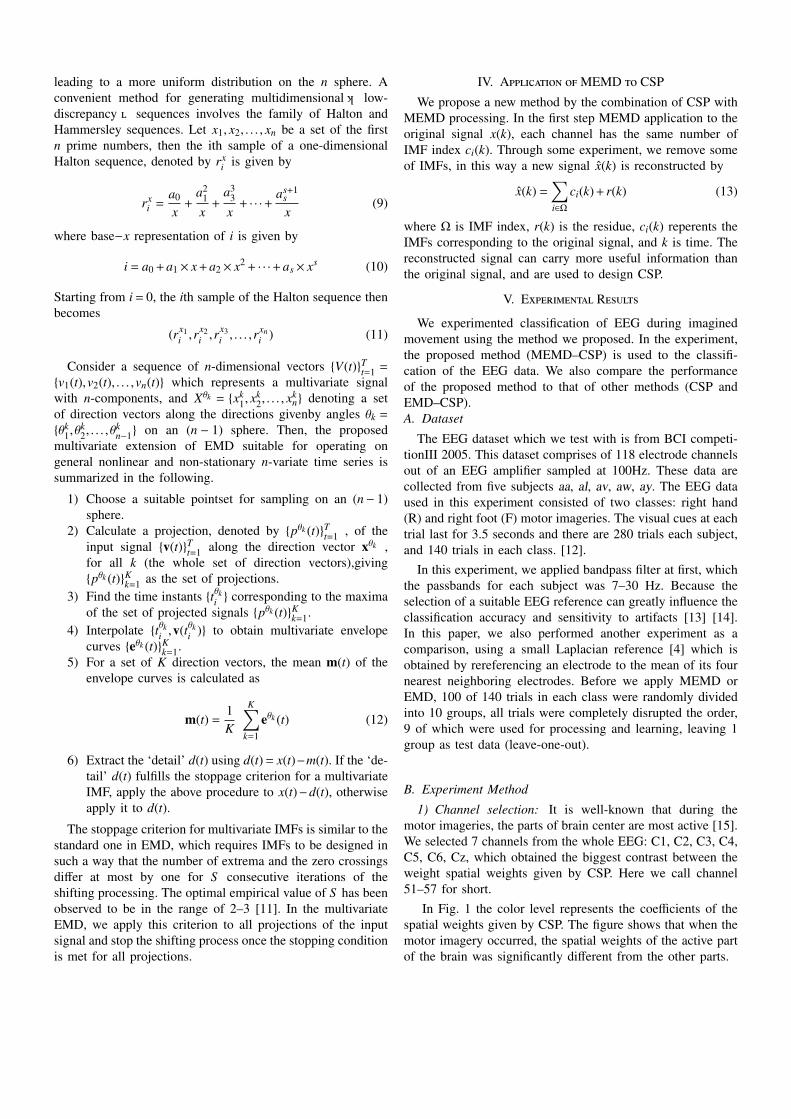
In Fig. 1 the color level represents the coefficients of thespatial weights given by CSP. The figure shows that when themotor imagery occurred, the spatial weights of the active partof the brain was significantly different from the other parts.
(a) w1 (b) w2 (c) colormap
Fig. 1: The CSP weights of subject aa when the CSP was obtained with channel 51-47: (a) weights for right hand movement,and (b) weights for right foot movement. (c) The colormap represents the value of spatial weights.
2) MEMD1–CSP: In eq. (14), we need to determine Ω forreconstruction. To obtain the highest classification accuracy,we need to find a way to choose the proper IMFs ci(k)that obtained from MEMD processing, then add the ci(k) toreconstruct the new signal: x(k). We make 10 data groups from100 trials each class, which mentioned in Dataset, because weused 9 of them for learning, we can obtain 90 ctr
i (k) eachclass (i ∈ Ω), where tr is the number of trial. We make allcombinations of IMF index Ω, reconstruct new signal x(k),and make test by CSP. The best result is showed in Table I.
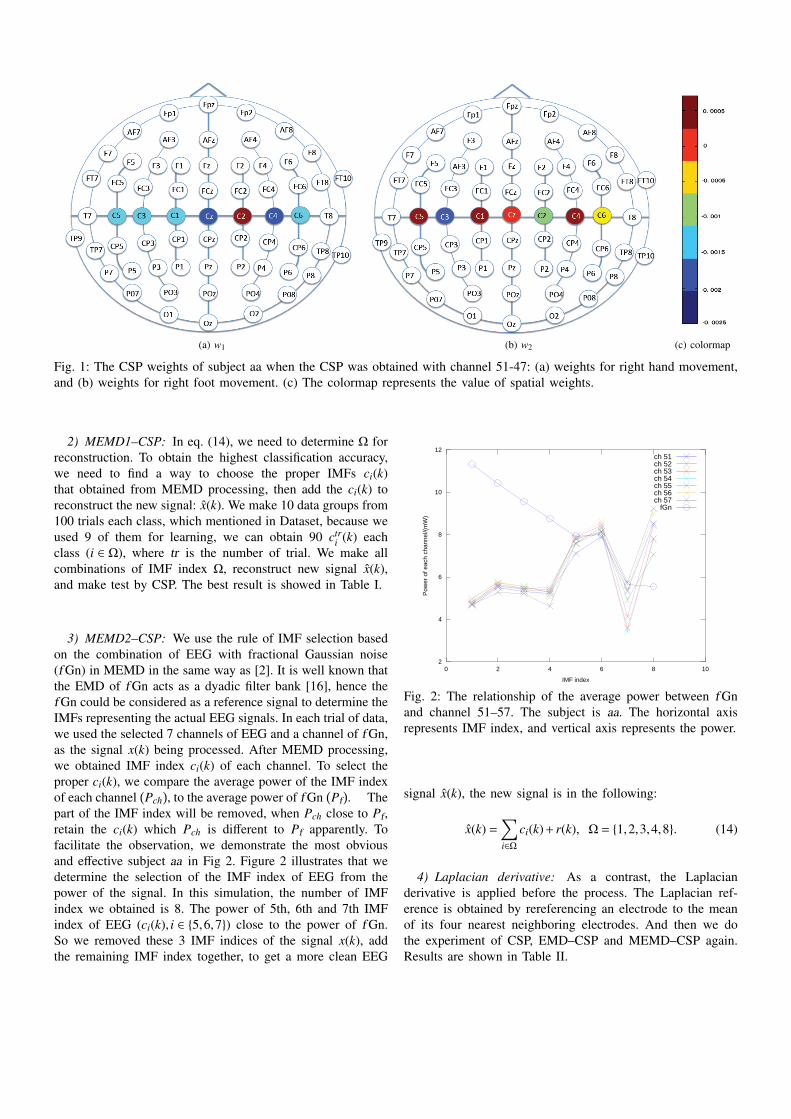
3) MEMD2–CSP: We use the rule of IMF selection basedon the combination of EEG with fractional Gaussian noise(f Gn) in MEMD in the same way as [2]. It is well known thatthe EMD of f Gn acts as a dyadic filter bank [16], hence thef Gn could be considered as a reference signal to determine theIMFs representing the actual EEG signals. In each trial of data,we used the selected 7 channels of EEG and a channel of f Gn,as the signal x(k) being processed. After MEMD processing,we obtained IMF index ci(k) of each channel. To select theproper ci(k), we compare the average power of the IMF indexof each channel
(Pch), to the average power of f Gn
(Pf). The
part of the IMF index will be removed, when Pch close to Pf,retain the ci(k) which Pch is different to Pf apparently. Tofacilitate the observation, we demonstrate the most obviousand effective subject aa in Fig 2. Figure 2 illustrates that wedetermine the selection of the IMF index of EEG from thepower of the signal. In this simulation, the number of IMFindex we obtained is 8. The power of 5th, 6th and 7th IMFindex of EEG (ci(k), i ∈ 5,6,7) close to the power of f Gn.So we removed these 3 IMF indices of the signal x(k), addthe remaining IMF index together, to get a more clean EEG
2
4
6
8
10
12
0 2 4 6 8 10
Pow
er o
f eac
h ch
anne
l/(m
W)
IMF index
ch 51ch 52ch 53ch 54ch 55ch 56ch 57
fGn
Fig. 2: The relationship of the average power between f Gnand channel 51–57. The subject is aa. The horizontal axisrepresents IMF index, and vertical axis represents the power.
signal x(k), the new signal is in the following:
x(k) =∑i∈Ω
ci(k)+ r(k), Ω = 1,2,3,4,8. (14)
4) Laplacian derivative: As a contrast, the Laplacianderivative is applied before the process. The Laplacian ref-erence is obtained by rereferencing an electrode to the meanof its four nearest neighboring electrodes. And then we dothe experiment of CSP, EMD–CSP and MEMD–CSP again.Results are shown in Table II.

TABLE I: Classification accuracy
Method subjectaa al av aw ay
CSP1 71.3 88.4 48.6 89.9 79.9CSP2 65.3 90.2 63.7 80.3 87.3
EMD–CSP 68.4 89.6 64.1 82.5 86.9MEMD1–CSP 68.8 90.0 68.8 76.3 87.5MEMD2–CSP 60.3 82.9 55.3 60.7 74.0
TABLE II: Classification accuracy (usingLaplacian derivative)
Method subjectaa al av aw ay
CSP1 70.7 78.3 48.7 88.5 72.6CSP2 63.7 87.7 64.0 79.1 86.3
EMD–CSP 62.8 89.5 64.4 79.6 85.9MEMD1–CSP 63.8 95.0 63.8 71.2 88.1MEMD2–CSP 55.3 79.7 54.7 70.0 75.6
C. Results
Table I shows classification accuracy obtained by eachmethods. Each method is applied to EEG signals as follows.In the application of the proposed method MEMD–CSP andthe comparative method EMD–CSP, we used data of originalsignal as test data. Accuracy rate is given by 10× 10 crossvalidation.
Table II shows classification accuracy obtained by eachmethods, using Laplacian derivative.• CSP1 All of 118 EEG channels were classified by CSP.• CSP2 For comparison, channel 51–57 of the EEG
signals were selected for the classification by CSP.• EMD–CSP We also classified the EEG signals using
EMD processing. The channels we selected are 51–57.Because by definition EMD is suitable for univariate sig-nals, we can obtain different number of IMFs one channelto another. However we removed the same number of IMFci(k) from each channel carrying fewer feature value, thenreconstruct the new signal x(k) and classified by CSP.
• MEMD1–CSP As the procedure shown in section V. B.2), we classified the EEG signals by using the proposedmethod in the way of making test for each situation ofIMF selection given by MEMD.
• MEMD2–CSP As the the procedure shown in sectionV. B. 3), to find a more effective method about IMFselection, we also used the method which on the basisof power comparison.
Table I shows that we obtained the best classification accuracyusing the proposed method MEMD1–CSP in subjects av anday.
In the method MEMD1–CSP for subject aa, by makingtest for IMF selection we obtained the highest classificationaccuracy is 68.8%, when Ω= 2,5,6. However, in the methodMEMD2–CSP, according to Fig. 2, we removed 5th, 6thand 7th IMF index, recontructed the signal x(k) with Ω =1,2,3,4,8, then obtained classification accuracy is 60.3%,
it illustrates that the results are not satisfied.
VI. ConclusionsWe have proposed a novel method where the EEG signal
is decomposed into IMF using the MEMD, and are classifiedby CSP. By experiment, the use of MEMD–CSP has shownto perform well in the application to classification of EEGsignals. However the current study are all based on No.51–57 channels. The experimental results may not be satisfactory.We also try other methods, such as seclecting channels bycomparing the spatial weights or in different frequency.
AcknowledgmentThis work was supported in part by KAKENHI (21360179).
References[1] N. Huang, Z. Shen, S. Long, M. Wu, H. Shih, Q. Zheng, N. C. Yen, C.
Tung, and H. Liu, “The empirical mode decomposition and the Hilbertspectrum for nonlinear and non-stationary time series analysis,” Proc.ofthe Royal Society A, vol. 454, no. 1971, pp. 903–995, 1998.
[2] Md. K. I. Molla, T. Tanaka, T. M. Rutkowski, and A. Cichocki, “Separa-tion of EOG artifacts from EEG signals using bivariate EMD,” in Proc.2010 IEEE International Conference on, Acoustics Speech and SignalProcessing (ICASSP), pp. 562–565, Dallas, TX, Mar. 14–19. 2010.
[3] J. Muller-Gerking, G. Pfurtscheller, and H. Flyvbjerg, “Designing optimalspatial filters for single-trial EEG classification in a movement task,”Clinical Neurophysiology, vol. 110, pp. 787–798, 1999.
[4] H. Ramoser, J. Muller-Gerking, and G. Pfurtscheller, “Optimal spatialfiltering of single trial EEG during imagined hand movement,” IEEETrans. Rehabil. Eng., vol. 8, no. 4, pp. 441–446, 2000.
[5] J. Muller-Gerking, G. Pfurtscheller, and H. Flyvbjerg, “Classification ofmovement-related EEG in a memorized delay task experiment,” ClinicalNeurophysiology, vol. 111, no. 8, pp. 1353–1365, Aug. 2000.
[6] T. Tanaka and D. P. Mandic, “Complex empirical mode decomposition,”IEEE Signal Processing Letters, vol. 14, pp. 101–104, 2007.
[7] M. U. Altaf, T. Gautama, T. Tanaka, and D. P. Mandic, “Rotationinvariant complex empirical mode decomposition,” in Proc. 2007 IEEEInternational Conference on, Acoustics Speech and Signal Processing(ICASSP), Honolulu, HI, pp. 1009–1012, 2007.
[8] G. Rilling, P. Flandrin, P. Goncalves, and J. M. Lilly, “Bivariate empiricalmode decomposition,” IEEE Signal Processing Letters, vol. 14, pp. 936–939, 2007.
[9] N. Rehman and D. P. Mandic, “Empirical mode decomposition fortrivariate signals,” IEEE Trans. Signal Process. pp. 1059–1068, Mar.2010.
[10] N. Rehman and D. P. Mandic, “Multivariate empirical mode decompo-sition,” Proc.of the Royal Society A, vol. 466, no. 2117, pp. 1291–1302,May. 2010.
[11] N. E. Huang, M. Wu, S. Shen, W. Qu, P. Gloersen, and K. Fan,“A confidence limit for the empirical mode decomposition and Hilbertspectral analysis,” Proc. of the Royal Society. Lond. A, vol. 459, pp. 2317–2345, 2003.
[12] B. Blankertz, K. R. Muller, D. J. Krusienski, G. Schalk, J. R. Wolpaw,A. Schlogl, G. Pfurtscheller, J. R. Millan, M. Schroder, and N. Birdaumer,“The BCI competition III: Validating alternative approaches to actual BCIproblems,” IEEE Trans. Neural Syst. Rehabil. Eng., vol. 14, no. 2, pp.153–159, 2006.
[13] D. J. McFarland, L. M. McCane, S. V. David, and J. R. Wolpaw,“Spatial filter selection for EEG-based communication,” Electroenc. Clin.Neurophys., vol. 103, no. 3, pp. 386–394, 1997.
[14] G. Pfurtscheller, “Mapping of event-related desynchronization and typeof derivation,” Electroenc. Clin. Neurophys., vol. 70, pp. 190–193, 1988.
[15] C. Neuper, G. R. Muller-Putz, R. Scherer, and G. Pfurtscheller, “Motorimagery and EEG-based control of spelling devices and neuroprostheses,”Progress in Brain Research, vol. 159, pp. 393–409, 2006.
[16] P. Flandrin, G. Rilling, and P. Goncalves, “Empirical mode decomposi-tion as a filter bank,” IEEE Signal Processing Letters, vol. 11, no. 2, pp.112–114, Feb. 2004.