common-size analysis chapter 5 robinson, munter, grant
TRANSCRIPT

Common-size Analysis
Chapter 5
Robinson, Munter, Grant

Grant, Munter & Robinson
Chapter 5 2
Learning Objectives
• Prepare and evaluate common-size financial statements in cross-sectional and time-series
• Explain operating leverage
• Evaluate common-size interim data
• Use this analysis to forecast earnings

Grant, Munter & Robinson
Chapter 5 3
Common-size Analysis
• Allows comparisons of companies of different sizes
• Based on assets or revenues
• Understand the nature of costs– Variable: move in proportion to sales– Fixed: unchanged within a relevant range of
activity

Grant, Munter & Robinson
Chapter 5 4
Common-size AnalysisIncome Statement
• Vertical analysis – income statement items are expressed as a percentage of sales– Sales = 100%
– Each line item = Item/Sales
• Horizontal analysis with a base year– Each line item of base year = 100%
– Growth/decline is relative to base year
– Focus on changes over time• Use to forecast earnings
Grant, Munter & Robinson
Chapter 5 5
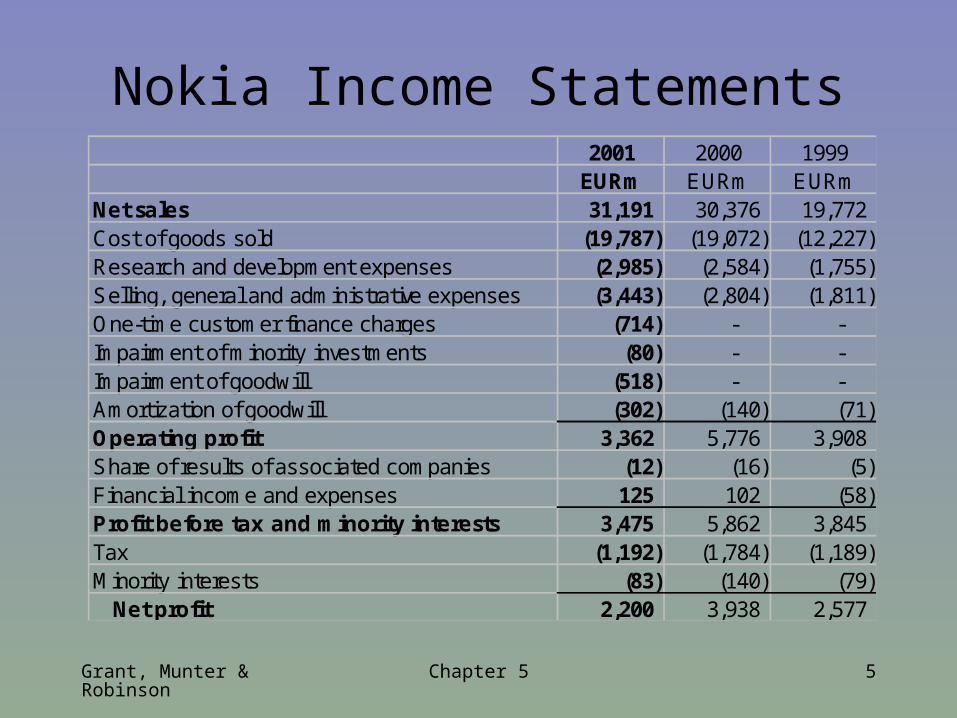
Nokia Income Statements2001 2000 1999
EURm EURm EURmNet sales 31,191 30,376 19,772 Cost of goods sold (19,787) (19,072) (12,227) Research and development expenses (2,985) (2,584) (1,755) Selling, general and administrative expenses (3,443) (2,804) (1,811) One-time customer finance charges (714) - - Impairment of minority investments (80) - - Impairment of goodwill (518) - - Amortization of goodwill (302) (140) (71) Operating profit 3,362 5,776 3,908 Share of results of associated companies (12) (16) (5) Financial income and expenses 125 102 (58) Profit before tax and minority interests 3,475 5,862 3,845 Tax (1,192) (1,784) (1,189) Minority interests (83) (140) (79)
Net profit 2,200 3,938 2,577

Grant, Munter & Robinson
Chapter 5 6
Nokia’s Vertical Common-size Income Statements
2001 2000 1999Net sales 100% 100% 100%Cost of goods sold 63% 63% 62%Research and development expenses 10% 9% 9%Selling, general and administrative expenses 11% 9% 9%One-time customer finance charges 2% 0% 0%Impairment of minority investments 0% 0% 0%Impairment of goodwill 2% 0% 0%Amortization of goodwill 1% 0% 0%Operating profit 11% 19% 20%Share of results of associated companies 0% 0% 0%Financial income and expenses 0% 0% 0%Profit before tax and minority interests 11% 19% 19%Tax 4% 6% 6%Minority interests 0% 0% 0%
Net profit 7% 13% 13%

Grant, Munter & Robinson
Chapter 5 7
Nokia Common-size Income Statements (1999 is base year)
2001 2000 1999Net sales 158% 154% 100%Cost of goods sold 162% 156% 100%Research and development expenses 170% 147% 100%Selling, general and administrative expenses 190% 155% 100%One-time customer finance chargesImpairment of minority investmentsImpairment of goodwillAmortization of goodwill 425% 197% 100%Operating profit 86% 148% 100%Share of results of associated companies 240% 320% 100%Financial income and expenses 100%Profit before tax and minority interests 90% 152% 100%Tax 100% 150% 100%Minority interests 105% 177% 100%
Net profit 85% 153% 100%
Grant, Munter & Robinson
Chapter 5 8
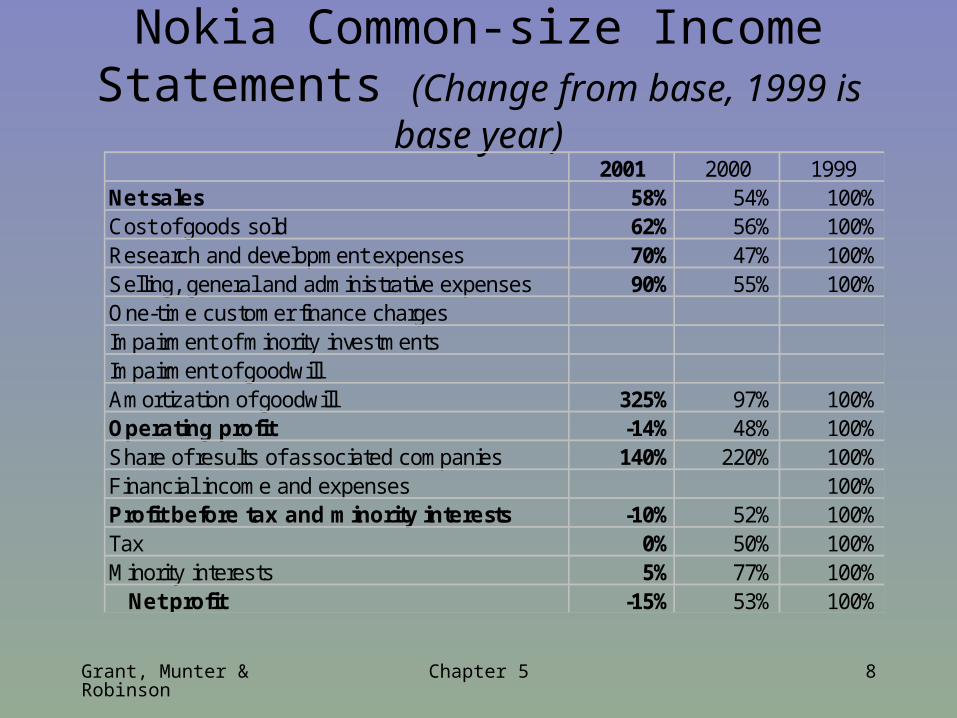
Nokia Common-size Income Statements (Change from base, 1999 is base year)
2001 2000 1999Net sales 58% 54% 100%Cost of goods sold 62% 56% 100%Research and development expenses 70% 47% 100%Selling, general and administrative expenses 90% 55% 100%One-time customer finance chargesImpairment of minority investmentsImpairment of goodwillAmortization of goodwill 325% 97% 100%Operating profit -14% 48% 100%Share of results of associated companies 140% 220% 100%Financial income and expenses 100%Profit before tax and minority interests -10% 52% 100%Tax 0% 50% 100%Minority interests 5% 77% 100%
Net profit -15% 53% 100%

Grant, Munter & Robinson
Chapter 5 9
(millions, except per share data)2001 2000 1999
Net Sales 30,004 37,580 33,075 Costs and ExpensesManufacturing and other costs of sales 21,445 23,628 20,631 Selling, general and administrative expenses 3,703 5,141 5,220 Research and development expenditures 4,318 4,437 3,560 Depreciation expense 2,357 2,352 2,243 Reorganizations of businesses 1,858 596 (226) Other charges 3,328 517 1,406 Interest expense, net 437 248 138 Gains on sales of invesements and businesses (1,931) (1,570) (1,180)
Total costs and expenses 35,515 35,349 31,792 Earnings (loss) before income taxes (5,511) 2,231 1,283 Income tax provision (benefit) (1,574) 913 392 Net earnings (loss) (3,937) 1,318 891
Basic Earnings (loss) per common share (1.78) 0.61 0.42 Diluted Earnings (loss) per common share (1.78) 0.58 0.41 Basic wgtd avg common shares outstanding 2213.3 2170.1 2119.5Diluted wgtd avg common shares outstanding 2213.3 2256.6 2202.0
Year ended December, 31
Motorola, Inc. and SubsidiariesConsolidated Statements of Operations

Grant, Munter & Robinson
Chapter 5 10
2001 2000 1999Net Sales 100% 100% 100%Costs and ExpensesManufacturing and other costs of sales 71% 63% 62%Selling, general and administrative expenses 12% 14% 16%Research and development expenditures 14% 12% 11%Depreciation expense 8% 6% 7%Reorganizations of businesses 6% 2% -1%Other charges 11% 1% 4%Interest expense, net 1% 1% 0%Gains on sales of invesements and businesses -6% -4% -4%
Total costs and expenses 118% 94% 96%Earnings (loss) before income taxes -18% 6% 4%Income tax provision (benefit) -5% 2% 1%Net earnings (loss) -13% 4% 3%
Year ended December, 31
Motorola, Inc. and SubsidiariesCommon-Size Consolidated Statements of Operations

Grant, Munter & Robinson
Chapter 5 11
2001 2000 1999Net Sales 91% 114% 100%Costs and ExpensesManufacturing and other costs of sales 104% 115% 100%Selling, general and administrative expenses 71% 98% 100%Research and development expenditures 121% 125% 100%Depreciation expense 105% 105% 100%Reorganizations of businesses -822% -264% 100%Other charges 237% 37% 100%Interest expense, net 317% 180% 100%Gains on sales of invesements and businesses 164% 133% 100%
Total costs and expenses 112% 111% 100%Earnings (loss) before income taxes -430% 174% 100%Income tax provision (benefit) -402% 233% 100%Net earnings (loss) -442% 148% 100%
Motorola, Inc. and SubsidiariesCommon-size Consolidated Statements of Operations, 1999 is base

Grant, Munter & Robinson
Chapter 5 12
2001 2000Net Sales -9% 14%Costs and ExpensesManufacturing and other costs of sales 4% 15%Selling, general and administrative expenses -29% -2%Research and development expenditures 21% 25%Depreciation expense 5% 5%Reorganizations of businesses -922% -364%Other charges 137% -63%Interest expense, net 217% 80%Gains on sales of invesements and businesses 64% 33%
Total costs and expenses 12% 11%Earnings (loss) before income taxes -530% 74%Income tax provision (benefit) -502% 133%Net earnings (loss) -542% 48%
Motorola, Inc. and SubsidiariesCommon-size Consolidated Statements of Operations
Change from 1999

Grant, Munter & Robinson
Chapter 5 13
Operating Leverage
• Positive when percentage increases in net income exceed percentage increases sales
• A scalar indicating how net income will change as revenues change
income Operating
costs] variable- [Sales

Grant, Munter & Robinson
Chapter 5 14
Operating Leverage Example
• Revenues = $1,250
• Variable costs = $950 (Contribution margin = $300)
• Operating income = $200
• Operating leverage = 1.5 ($300/$200)
• A 10% increase in sales will result in a 15% increase in operating income

Grant, Munter & Robinson
Chapter 5 15
Operating Leverage
Approximated by:
Revenuesin Change Percentage
Income Operatingin Change Percentage
Grant, Munter & Robinson
Chapter 5 16
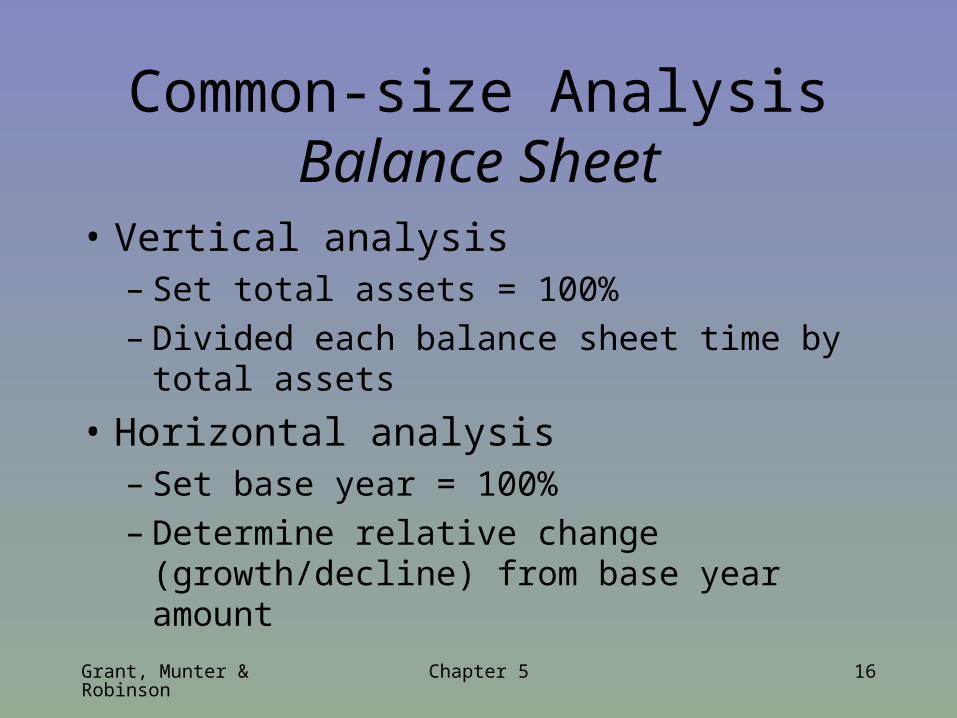
Common-size AnalysisBalance Sheet
• Vertical analysis– Set total assets = 100%– Divided each balance sheet time by total assets
• Horizontal analysis– Set base year = 100%– Determine relative change (growth/decline)
from base year amount

Grant, Munter & Robinson
Chapter 5 17
December 31,ASSETSFixed assets and other non-current assetsCapitalized development costs 893 4% 640 3%Goodwill 854 4% 1,112 6%Other intangible assets 237 1% 242 1%Property, plant and equipment 2,514 11% 2,732 14%Investments in associated companies 49 0% 61 0%Available-for-sale investments 399 2% 337 2%Deferred tax assets 832 4% 401 2%Long-term notes receivable 1,128 5% 808 4%Other non-current assets 6 0% 55 0%
6,912 31% 6,388 32%Current assetsInventories 1,788 8% 2,263 11%Accounts receivable, less allowances for doubtful accounts (2001:217, 2000: 236) 5,719 26% 5,594 28%Prepaid expenses and accrued income 1,480 7% 1,418 7%Short-term loan receivable 403 2% 44 0%Available-for-sale investments 4,271 19% 2,774 14%Bank and cash 1,854 8% 1,409 7%
15,515 69% 13,502 68%Total assets 22,427 100% 19,890 100%
Nokia Consolidated Common-size Balance Sheet, IAS (EURm)2001 2000
Grant, Munter & Robinson
Chapter 5 18
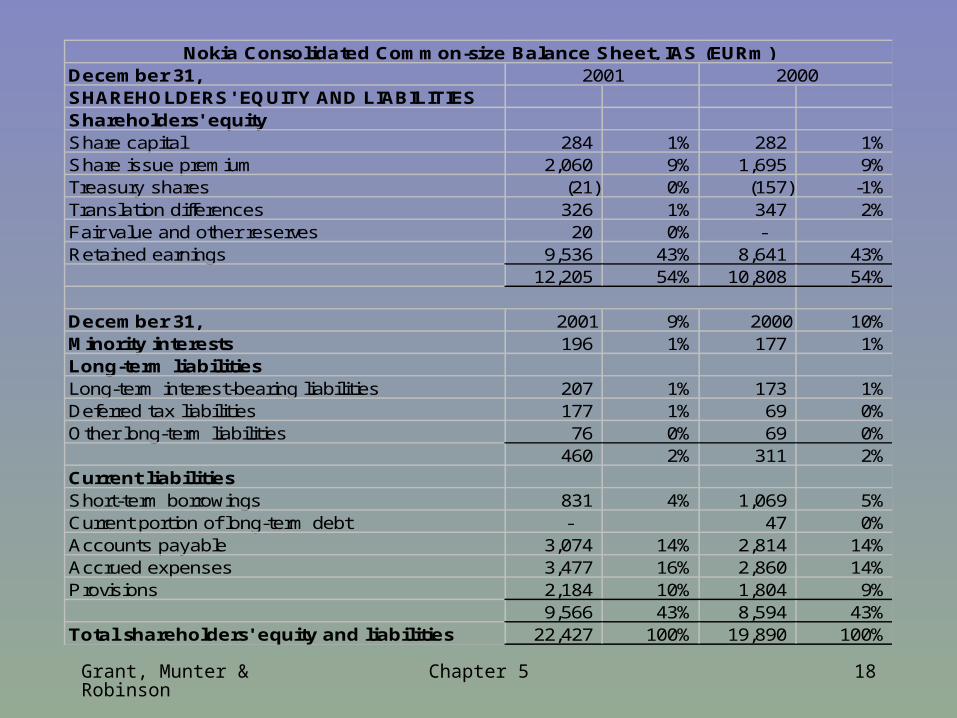
December 31,SHAREHOLDERS' EQUITY AND LIABILITIESShareholders' equityShare capital 284 1% 282 1%Share issue premium 2,060 9% 1,695 9%Treasury shares (21) 0% (157) -1%Translation differences 326 1% 347 2%Fair value and other reserves 20 0% - Retained earnings 9,536 43% 8,641 43%
12,205 54% 10,808 54%
December 31, 2001 9% 2000 10%Minority interests 196 1% 177 1%Long-term liabilitiesLong-term interest-bearing liabilities 207 1% 173 1%Deferred tax liabilities 177 1% 69 0%Other long-term liabilities 76 0% 69 0%
460 2% 311 2%Current liabilitiesShort-term borrowings 831 4% 1,069 5%Current portion of long-term debt - 47 0%Accounts payable 3,074 14% 2,814 14%Accrued expenses 3,477 16% 2,860 14%Provisions 2,184 10% 1,804 9%
9,566 43% 8,594 43%Total shareholders' equity and liabilities 22,427 100% 19,890 100%
2001 2000Nokia Consolidated Common-size Balance Sheet, IAS (EURm)

Grant, Munter & Robinson
Chapter 5 19
December 31, 2001 Change 2000ASSETSFixed assets and other non-current assetsCapitalized development costs 893 40% 640 Goodwill 854 -23% 1,112 Other intangible assets 237 -2% 242 Property, plant and equipment 2,514 -8% 2,732 Investments in associated companies 49 -20% 61 Available-for-sale investments 399 18% 337 Deferred tax assets 832 107% 401 Long-term notes receivable 1,128 40% 808 Other non-current assets 6 -89% 55
6,912 8% 6,388 Current assetsInventories 1,788 -21% 2,263 Accounts receivable, less allowances for doubtful accounts (2001:217, 2000: 236) 5,719 2% 5,594 Prepaid expenses and accrued income 1,480 4% 1,418 Short-term loan receivable 403 816% 44 Available-for-sale investments 4,271 54% 2,774 Bank and cash 1,854 32% 1,409
15,515 15% 13,502 Total assets 22,427 13% 19,890
Nokia Consolidated Balance Sheet, IAS (EURm), 2000=Base

Grant, Munter & Robinson
Chapter 5 20
December 31, 2001 Change 2000SHAREHOLDERS' EQUITY AND LIABILITIESShareholders' equityShare capital 284 1% 282 Share issue premium 2,060 22% 1,695 Treasury shares (21) -87% (157) Translation differences 326 -6% 347 Fair value and other reserves 20 - Retained earnings 9,536 10% 8,641
12,205 13% 10,808 Minority interests 196 11% 177 Long-term liabilitiesLong-term interest-bearing liabilities 207 20% 173 Deferred tax liabilities 177 157% 69 Other long-term liabilities 76 10% 69
460 48% 311 Current liabilitiesShort-term borrowings 831 -22% 1,069 Current portion of long-term debt - -100% 47 Accounts payable 3,074 9% 2,814 Accrued expenses 3,477 22% 2,860 Provisions 2,184 21% 1,804
9,566 11% 8,594 Total shareholders' equity and liabilities 22,427 13% 19,890
Nokia Consolidated Balance Sheet, IAS (EURm). 2000=Base

Grant, Munter & Robinson
Chapter 5 21
Motorola, Inc. and SubsidiariesCommon-size Consolidated Balance Sheets
December 31 (millions)ASSETSCurrent Assets
Cash and cash equivalents 6,082 18% 3,301 8%Short-term investments 80 0% 354 1%Accounts receivable, net 4,583 14% 7,092 17%Inventories 2,756 8% 5,242 12%Deferred income taxes 2,633 8% 2,294 5%Other current assets 1,015 3% 1,602 4%
Total current assets 17,149 51% 19,885 47%
Property, plant and equipment, net 8,913 27% 11,157 26%Investments 2,995 9% 5,926 14%Long-term deferred income taxes 1,152 3% - 0%Other assets 3,189 10% 5,375 13%
TOTAL ASSETS 33,398 100% 42,343 100%
2001 2000

Grant, Munter & Robinson
Chapter 5 22
Motorola, Inc. and SubsidiariesCommon-size Consolidated Balance Sheets
December 31 (millions)LIABILITIES AND STOCKHOLDERS' EQUITYCurrent liabilitiesNotes payable and current portion of long-term debt 870 3% 6,391 15%Accounts payable 2,434 7% 3,492 8%Accrued liabilities 6,394 19% 6,374 15%
Total current liabilities 9,698 29% 16,257 38%
Long-term debt 8,372 25% 4,293 10%Long-term deferred income taxes - 0% 1,504 4%Other Liabilities 1,152 3% 1,192 3%Company-obligated... preferred securities… 485 1% 485 1%
Shareholders' equityCommon stock, $3 par 6,764 20% 6,574 16%Additional paid-in capital 1,707 5% 1,188 3%Retained earnings 5,434 16% 9,727 23%Non-owner changes to equity (214) -1% 1,123 3%Total stockholders' equity 13,691 41% 18,612 44%TOTAL LIABILITIES AND STOCKHOLDERS' EQUITY 33,398 100% 42,343 100%
2001 2000

Grant, Munter & Robinson
Chapter 5 23
Motorola, Inc. and SubsidiariesCommon-size Consolidated Balance Sheets
December 31 2001 Change 2000ASSETSCurrent Assets
Cash and cash equivalents 6,082 84% 3,301 Short-term investments 80 -77% 354 Accounts receivable, net 4,583 -35% 7,092 Inventories 2,756 -47% 5,242 Deferred income taxes 2,633 15% 2,294 Other current assets 1,015 -37% 1,602
Total current assets 17,149 -14% 19,885
Property, plant and equipment, net 8,913 -20% 11,157 Investments 2,995 -49% 5,926 Long-term deferred income taxes 1,152 - Other assets 3,189 -41% 5,375
TOTAL ASSETS 33,398 -21% 42,343
Grant, Munter & Robinson
Chapter 5 24
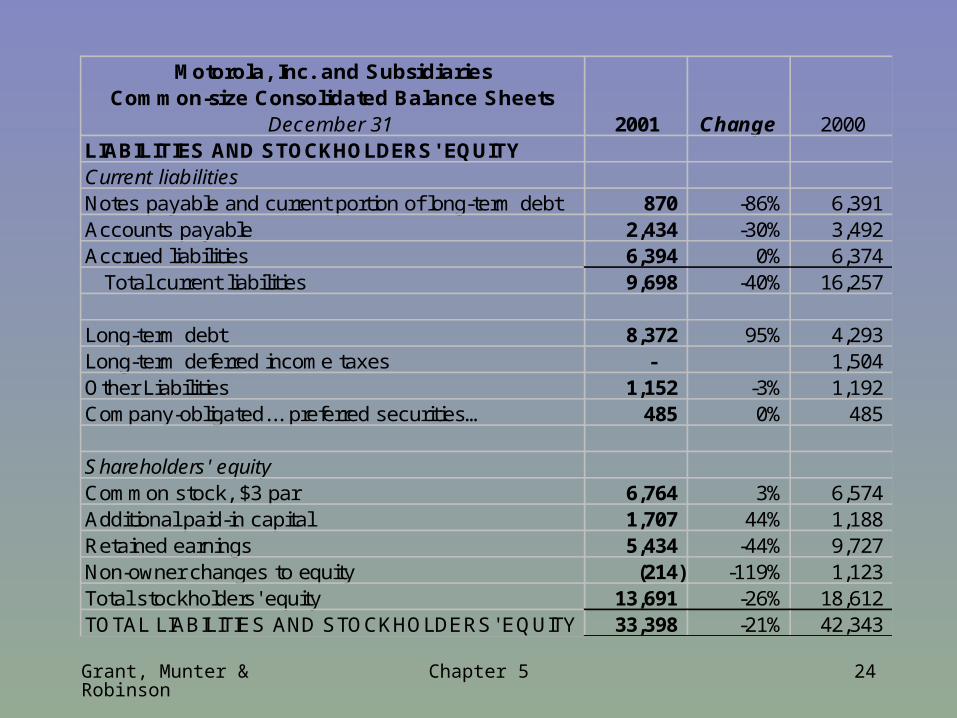
Motorola, Inc. and SubsidiariesCommon-size Consolidated Balance Sheets
December 31 2001 Change 2000LIABILITIES AND STOCKHOLDERS' EQUITYCurrent liabilitiesNotes payable and current portion of long-term debt 870 -86% 6,391 Accounts payable 2,434 -30% 3,492 Accrued liabilities 6,394 0% 6,374
Total current liabilities 9,698 -40% 16,257
Long-term debt 8,372 95% 4,293 Long-term deferred income taxes - 1,504 Other Liabilities 1,152 -3% 1,192 Company-obligated... preferred securities… 485 0% 485
Shareholders' equityCommon stock, $3 par 6,764 3% 6,574 Additional paid-in capital 1,707 44% 1,188 Retained earnings 5,434 -44% 9,727 Non-owner changes to equity (214) -119% 1,123 Total stockholders' equity 13,691 -26% 18,612 TOTAL LIABILITIES AND STOCKHOLDERS' EQUITY 33,398 -21% 42,343

Grant, Munter & Robinson
Chapter 5 25
Cross-sectional Comparisons
• Compare firm to peers
• Compare firm to industry averages
• In a single time period
• Differences in accounting methods and business models make this analysis difficult

Grant, Munter & Robinson
Chapter 5 26
Cross-section: 2001
Nokia Motorola
Sales 100% 100%
Operating profit 11% -23%
Pretax income 11% -18%
Net profit 7% -13%
Grant, Munter & Robinson
Chapter 5 27
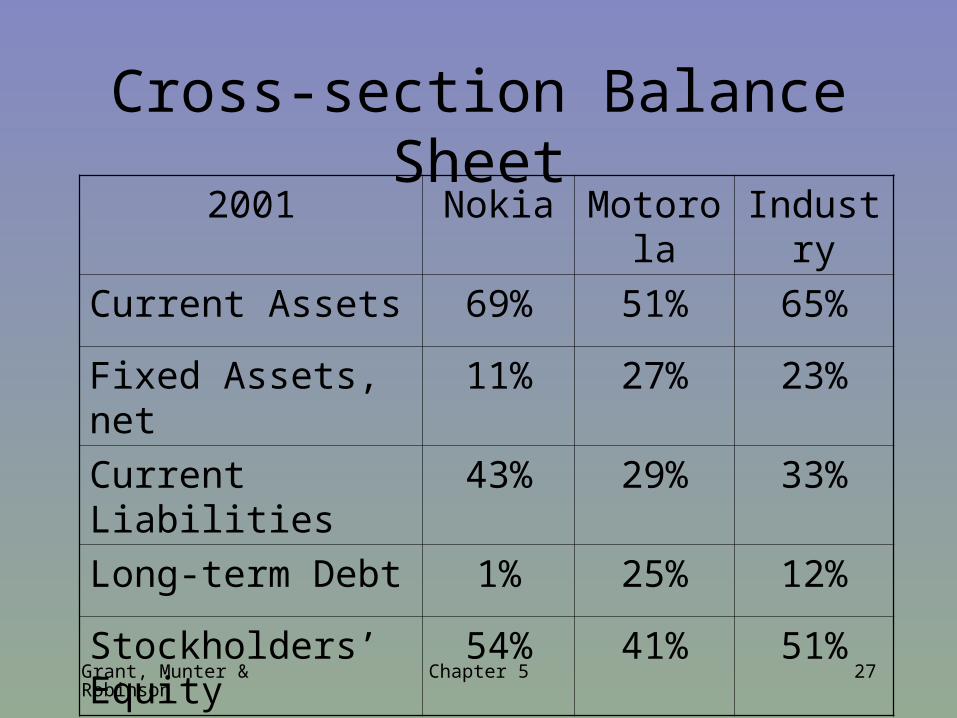
Cross-section Balance Sheet2001 Nokia Motorola Industry
Current Assets 69% 51% 65%
Fixed Assets, net 11% 27% 23%
Current Liabilities 43% 29% 33%
Long-term Debt 1% 25% 12%
Stockholders’ Equity 54% 41% 51%

Grant, Munter & Robinson
Chapter 5 28
Interim Reports
• Generally unaudited
• More timely; prepared quarterly or semi-annually
• Detect trends and seasonality
• Compare results of current period to those presented in annual reports
• Data can be used to forecast earnings

Grant, Munter & Robinson
Chapter 5 29
Motorola Interim Analysis
First Quarter
2002
First Quarter
2001
Net revenue $6,021 100% $7,683 100%
Gross margin 1,773 29% 1,566 21%
Operating income (362) -6% (1,106) -14%
Net income (449) -7% (533) -7%

Grant, Munter & Robinson
Chapter 5 30
Summary
• Common-size income statement
• Operating leverage
• Common-size balance sheet
• Interim reports