common data project 2018 procedural guidebook · the new england secondary school consortium common...
TRANSCRIPT
Improving the Quality and Comparability of State Educational Data across New England
Common Data Project2018 Procedural Guidebook

The New England Secondary School Consortium Common Data Project 2018 Procedural Guidebook
The procedures outlined within this document were developed by Research in Action, Inc. and updated by Plimpton Research under contract with the Great Schools Partnership. This document’s primary purpose is to record the process used to collect, review, and publish data submitted by the six member states of the New England Secondary School Consortium.
The Common Data Project 2018 Procedural Guidebook by Great Schools Partnership is licensed under a Creative Commons Attribution-NonCommercial-ShareAlike 4.0 International License. To view a copy of this license, visit http://creativecommons.org/licenses/by-nc-sa/4.0/deed.en_US. For questions related to the Common Data Project 2018 Procedural Guidebook: Duke Albanese Senior Policy Advisor, Great Schools Partnership [email protected] Lauren Leigh Hinthorne Director of Research and Evaluation, Great Schools Partnership [email protected] Lisa Plimpton Plimpton Research [email protected] General Inquiries Great Schools Partnership 482 Congress Street, Suite 500 Portland, Maine 04101 207.773.0505

Common Data Project 2016 Procedural Guidebook—Final 2
TABLE OF CONTENTS NESSC Common Data Project Team Representatives .................................................................... 3 LIST OF ABBREVATIONS .............................................................................................................. 5 SECTION I: GOAL, KEY TASKS, AND SELECTED METRICS 1.0 Background ........................................................................................................................ 6 1.1 Goal ................................................................................................................................... 8 1.2 Key Tasks ........................................................................................................................... 8 1.3 Selected Indicators ............................................................................................................. 9 SECTION II: DATA COLLECTION, BUSINESS RULES, AND QUALITY CONTROLS 2.0 Overview .......................................................................................................................... 11 2.1 Data Collection ................................................................................................................. 11 2.2 Business Rules ................................................................................................................. 14 2.3 Timelines .......................................................................................................................... 21 2.4 Quality Controls ................................................................................................................ 22 SECTION III: ANNUAL REPORT 3.0 Overview .......................................................................................................................... 25 3.1 Content ............................................................................................................................ 25 APPENDIX A: QUALITY-CONTROL CHECKLIST ......................................................................... 26 APPENDIX B: PROCEDURAL STEPS .......................................................................................... 29

Common Data Project 2016 Procedural Guidebook—Final 3
NESSC Common Data Project Team Representatives
Connecticut Department of Education Ajit Gopalakrishnan | Bureau Chief of Data Collection, Research and Evaluation
Charles Martie | Bureau of Data Collection, Research and Evaluation
Connecticut Higher Education Jan Kiehne | Institutional Research Specialist, P20 WIN Program Manager, Office of Research & System Effectiveness, Connecticut State Colleges and Universities Education
Maine Department of Education Rick Bergeron | EDFacts Coordinator
Charlotte Ellis | Education Data Manager
Lance Gilman | Trainer, Statewide Longitudinal Data System
Maine Higher Education Amy Johnson | Assistant Director, Center for Education Policy, Applied Research and Evaluation, University of Southern Maine
Massachusetts Department of Elementary and Secondary Education Rob Curtin | Associate Commissioner of Data and Accountability
Craig Weller | Data Reporting Analyst, Education Data Services
New Hampshire Department of Education Jan Fiderio | Program Specialist for Research and Studies, Division of Higher Education, Office of the Director
Sandie MacDonald | Administrator, Bureau of Instructional Support and Student Assessment
Dina Rabuck | Technical Specialist, Division of Instruction
New Hampshire Higher Education Beth Doiron | Director of DOE and College Access Programs, Community College System of New Hampshire
Heidi Hedegard | Research and Data Manager, University System of New Hampshire, Research and Planning
Common Data Project 2016 Procedural Guidebook—Final 4
Rhode Island Department of Education Ken Gu | Data and Analysis
Greg Martin | Data and Analysis, Rhode Island Department of Education
Margaret Votta | Research Specialist, Data Analysis and Research
Rhode Island and NESSC Connecting Organization Michael Grady | Deputy Director, Annenberg Institute for School Reform, Brown University
Vermont Agency of Education Glenn Bailey | Education Analyst and Data Management Director
Rachel Stanger | Education Statistician
Nellie Mae Education Foundation Eve Goldberg | Director of Research
Stephanie Lerner | Senior Associate for Strategic Learning and Evaluation System
Charlie Toulmin | Director of Policy
New England Board of Higher Education Stafford Peat | Senior Consultant
NESSC Data Coordinator Lisa Plimpton | Researcher, Plimpton Research
Great Schools Partnership Duke Albanese | Senior Policy Advisor
Lauren Leigh Hinthorne | Director of Research and Evaluation
Mark Kostin | Associate Director
David Ruff | Executive Director

Common Data Project 2016 Procedural Guidebook—Final 5
Purpose Statement The purpose of the Common Data Project 2018 Procedural Guidebook is to provide participating state agencies with a clearly articulated record of the agreed-upon business rules, decision logic, and quality controls used in the execution of the New England Secondary School Consortium’s Common Data Project. The guide is intended to facilitate understanding, compliance, ease of use, and professional development across the participating member states. The guidebook will also serve to help education leaders, stakeholders, and the general public understand the technical details associated with the Common Data Project. List of Abbreviations ABBREVIATION FULL TERM ACGR Adjusted Cohort Graduation Rate AHSFC Adjusted High School Freshmen Cohort CRI College Readiness Indicator ED Economically Disadvantaged EDEN Education Data Exchange Network EL English Learners ESEA Elementary and Secondary Education Act ESSA Every Student Succeeds Act (P.L. 114-95) FCFC First-time College Freshmen Cohort FERPA Family Education Rights and Privacy Act F/R Free or Reduced-Priced Lunch FTP File Transfer Protocol GED General Educational Development GSP Great Schools Partnership HSGC High School Graduation Cohort IDEA Individuals with Disabilities Education Act IEP Individualized Education Plan IHE Institutions of Higher Education LEA Local Education Agency LEP Limited English Proficiency NCES National Center for Educational Statistics NESSC New England Secondary School Consortium NGA National Governors Association NLT No Later Than NSC National Student Clearinghouse PII Personally Identifiable Information SEA State Education Agency SPC Statistical Process Controls SpEd Special Education SWD Students with Disabilities UMDI University of Massachusetts Donahue Institute

Common Data Project 2016 Procedural Guidebook—Final 6
SECTION I GOALS, KEY TASKS, AND SELECTED METRICS 1.0 Background
The New England Secondary Schools Consortium (NESSC) is a six-state partnership that works to promote forward-thinking innovations in the design and delivery of secondary education throughout the New England region. The NESSC vision—which was created and endorsed by education officials and state leaders from Connecticut, Massachusetts, Maine, New Hampshire, Rhode Island, and Vermont—seeks to ensure that every adolescent graduates from a new generation of high-performing, internationally competitive high schools prepared for success in the colleges, careers, and communities of our interconnected global society. The NESSC was established in the fall of 2008 with funding from the Nellie Mae Education Foundation and the Bill and Melinda Gates Foundation. The NESSC has established performance goals to be achieved in each of the six states and collectively as a region by 2021. The regional goals include:
1. Increase graduation rates to 90%. 2. Decrease annual dropout rates to 5%. 3. Increase the percentage of students enrolling in college degree programs or pursuing
industry certified accredited postsecondary certificates to 75%. 4. Increase the percentage of students who graduate from high school college-ready.
To track and measure progress in relation to its stated goals, the NESSC brought together data experts from each state to form its Data Team. The initial charge of the team was to discuss data collection across the states, identify current methods used to analyze data, and specify how states could report common indicators of student success related to the NESSC’s four goals. One key area explored after the adoption of the charter was how member states were defining college readiness. Since college readiness is such a complex and important metric to capture, the Data Team recommended that the NESSC use multiple measures to create a “college-readiness index.” The Data Team collaborated with the Annenberg Institute for School Reform at Brown University and the Center for Education Policy, Applied Research, and Evaluation at the University of Southern Maine. The team agreed on a working definition of college readiness for the purposes of creating a college-readiness index based upon multiple measures. The following formula was an initial metric of a successful college student:
• Completion of 24 credit hours of college coursework and a GPA of 2.5 or enrollment in a third semester of college (two- or four-year programs)
However, the college readiness indicator development was suspended until sufficient funding could be secured. In 2011, the Data Team identified and hired a Data Coordinator, Research in Action, Inc. (RIA). Drawing on materials from previously published technical reports, meeting notes, and RIA’s corporate experience, the Data Coordinator established standardized guidelines for state data submission. The University of Massachusetts’ Donahue Institute (UMDI) developed data templates that were used by each state to submit data for each performance indicator. Finally, RIA modified

Common Data Project 2016 Procedural Guidebook—Final 7
its data-auditing procedures for use with the NESSC’s procedures and data. The Data Coordinator and staff checked the data for consistency and accuracy, flagged data discrepancies using an internal quality-control procedure, and coordinated with state education agency (SEA) representatives to revise and update any inaccuracies. After the data-verification procedures were completed, RIA transmitted the data to UMDI. UMDI received the data from the states via RIA and reported on each NESSC indicator. The data submitted were then compiled and published in the Annual Evaluation and Phase III Technical Report. In this guidebook, key indicators were compared with statistics from the prior two years to measure progress toward the initiative’s desired outcomes. UMDI staff also attended Data Team meetings and debriefed with the team’s facilitator from the Great Schools Partnership (GSP) and consultants from RIA. To verify the reported information, UMDI provided an initial draft of the report tables to all team members for feedback and revisions. Once the corrections were implemented, UMDI published the final report and presented its findings to the Data Team. In 2012, UMDI completed its role as external evaluator. Given this change, the Data Team began to streamline the procedures used to collect and report on its performance goals. The data-collection template, the procedures used to establish data comparability, and consistent reporting methods were incorporated into the formal business procedures outlined in this document. In 2013, the Data Team continued to implement and report data associated with the graduation-rate and dropout-rate indicators. The participating states also began examining postsecondary enrollment and completion indicators. All states agreed to a common point in time (early February) to request data from the National Student Clearinghouse (NSC)—a necessary quality-assurance measure because the NSC continuously updates its databases. After seeking guidance from NSC staff, the Data Team established a request window of 15 days from February 1 to February 15. The work increased data comparability across the member states, but quality concerns necessitated a preliminary reporting in the spring 2013, with states requesting time to double check the results. The Data Team used an end-user-verification control approach (the Annual Report), which the states created, reviewed, and approved prior to publication. The Team observed and corrected several minor errors within the established review and correction window. In 2014, the Data Team conducted several additional refinements of the data submitted over the past years to ensure the trend statistics reflected publicly released information. Exceptions in earlier years, such as in 2009 when one SEA estimated dropout rates, were reexamined and annotated in the Annual Report. Further, the Data Coordinator clarified and validated the three baseline cohorts used to establish the denominators among the indicators. Specifically, the high school freshmen cohort was used as the denominator for both the graduation and dropout indicators. For college enrollment, the high school graduate cohort was used as the denominator. This cohort included all students graduating with a standard diploma in four or more years. Thus, students who graduated with a standard diploma in five, six, or seven years are members of the high school graduate cohort. The final cohort —the denominator of the persistence and completion indicators—is the number of first-time freshmen enrolled in college education. In 2015, the primary focus of the Data Team was to fully explore, discuss, and refine the procedural steps used for each of the five key performance indicators. The team delineated how the three cohorts establish the denominators for the applicable indicators. Details such as timeframes, student characteristics, etc., were discussed and codified in the business rules. Finally, the Data Team established macro-level procedures documented in Appendix B of this document.

Common Data Project 2016 Procedural Guidebook—Final 8
In 2016, the Data Team focused on clarifying the rules around the college-completion metric and then reporting the measure for the first time in the Annual Report. College completion rates use a multi-year window to determine the numerator (those individuals that earn a two- or four-year degree). State representatives shared concerns regarding the possibility of students being double counted (i.e., an individual completes an associate degree, matriculates into a 4-year degree program, and then completes that degree). It was determined that these possibilities exist but are “low incident” events. Future data meetings will reexamine the aforementioned phenomenon and determine what technical approach(es) can be develop to audit the college completion data. Also in 2016, the Data Team refined the Annual Report to include additional disaggregated data, particularly the inclusion of gender and the extended six-year high school graduation rate. In 2017, Great Schools Partnership contracted with a new Data Coordinator, Plimpton Research, to complete the 2018 data collection and Data Report. In January 2018, the Data Team met and agreed on several changes to the data elements in order to simplify data entry, align with federal reporting, and stop collecting data that are not included in the Data Report. Changes include removing 5-year high school graduates and early college enrollment from the data template; changing the definition of college enrollment to within 16 months after graduation; reporting college enrollment, persistence, and completion in two-year and four-year institutions as a single measure (i.e., combining data for 2- and 4-year institutions); and combining the race and ethnicity into a single category, eliminating “Non-Hispanic,” and including Hispanic as a sub-group consistent with federal reporting guidelines. The details of these changes are described throughout this document. 1.1 Goal The Data Team works to promote data comparability for each performance indicator used by the NESSC member states. This goal is partially achieved by implementing standardized procedures that eliminate unwanted variance resulting from the misinterpretation of agreed-upon business rules and computational errors introduced during aggregation. The team also uses the Data Coordinator as a quality control and support mechanism for the NESSC member states. Each year, the Data Team reviews and revises this guidebook to reflect evolving needs and requirements, refine common business rules and procedures, and improve data quality, consistency, and comparability. 1.2 Key Tasks
In collaboration with the Great Schools Partnership and the Data Coordinator, the Data Team agreed to implement the following procedural tasks, which are organized into four phases:
1. PHASE I (PLANNING): All parties (a) identify procedures from the prior year that need improvement, and (b) establish milestones for data collection, quality review, and report production. This phase is completed by December.
2. PHASE II (PRE-EXECUTION): The Data Coordinator (a) amends the procedural documents, (b) establishes state-centric timelines, (c) develops coordination and communication guidelines, and (d) promulgates data collection tools and techniques. The Data Team then (a) reviews the procedural guidelines, (b) reports any inconsistencies, (c) establishes internal timelines, and (d) identifies data coordinators in each state. This phase is completed by February.

Common Data Project 2016 Procedural Guidebook—Final 9
3. PHASE III (EXECUTION): The Data Coordinator (a) receives updated Data Templates, (b) implements quality controls, (c) monitors timelines, (d) identifies data issues, (e) provides corrective suggestions, (f) finalizes data elements, and (g) reports progress to GSP and others. During this phase, SEA representatives are (a) populating the Data Templates, (b) reporting any known data anomalies, (c) seeking clarification on business rules, (d) monitoring internal timelines, (e) requesting technical assistance, and (f) correcting any erroneous data. This phase is completed by June.
4. PHASE IV (REPORTING): The Common Data Project begins public reporting of data that have been reviewed, finalized, and placed into the reporting tool, which allows end users to view each available metric. The Data Coordinator (a) populates the reporting tool, (b) conducts internal quality controls on data charts and tables, and (c) amends report narratives to match the displayed data. All parties (a) review the data displays, and (b) provide feedback for a draft report. Once completed, the SEAs release public reports on their websites. This phase is completed by August.
1.3 Selected Indicators The NESSC has established four performance goals to be achieved in each of the six states: (1) increase high school graduation rates, (2) decrease dropout rates, (3) increase the percentage of students enrolling in two- and four-year college programs or pursuing industry-certified and accredited postsecondary certificates, and (4) increase the percentage of students who graduate from high school prepared for college. The Data Team, in conjunction with external third parties, created five performance indicators based on the agreed-upon metrics described in this document. The common metrics, in conjunction with a standardized set of business procedures and rules, allows the reported data on each indicator to be comparable among NESSC states. To our knowledge, only the federal government, via the National Center for Educational Statistics (NCES), has attempted to provide the public with comparable metrics on key educational initiatives. 1.3.1 Graduation Rate [Status: Operational] [Baseline Year: 2009] Graduation rates have been computed using the formula articulated in 34 C.F.R. §200.19. The rate relies on the identification and tracking of a four-year graduation cohort. All states in the Consortium currently report the federal graduation rate. The following formula is used for calculating the graduation rate:
(# of Graduates with a Standard Diploma) ÷ (# Adjusted High School Freshmen Cohort) 1.3.2 Dropout Rate [Status: Operational] [Baseline Year: 2009] The NESSC dropout data are closely linked to the data used in calculating the adjusted cohort graduation rate (ACGR). Data Team members recognize that, as the graduation rate and dropout rate have often been reported using disparate methods, a clearer relationship between these measures would be helpful. The National Governors Association (NGA) offered guidance on the dropout rate by recommending that dropouts be counted as those students who have not completed high school and are no longer enrolled in high school. This rate is calculated as a cohort formula using the same adjusted freshmen cohort used for the graduation rate. The following formula is used for calculating dropout rate:
(# Adjusted High School Freshmen Cohort) - (Graduates + Students Still Enrolled + Other Completers) = Dropouts | Dropout Rate = Dropouts ÷ Adjusted High School Freshmen Cohort

Common Data Project 2016 Procedural Guidebook—Final 10
1.3.3 College-Enrollment Rate [Status: Operational] [Baseline Year: 2009] The rationale for collecting college enrollment data is to determine the percentage of students who go on to further education after completing high school. All NESSC states use data collected by the National Student Clearinghouse (NSC), and NSC reports are run during a common reporting window to reduce variance associated with ongoing updating of the national NSC database. In 2018, our definition of College Enrollment is changing from Immediate (by October 15 of the same year as graduation) to Within 16 months (by October 15) of the subsequent year. The following formula is used for calculating college enrollment:
(# of Students Enrolled in College for the First Time) ÷ (# of High School Graduate Cohort)
1.3.4 College-Persistence Rate [Status: Operational] [Baseline Year: 2011] The final business rule states: “The number of first-time college freshmen (by cohort) that remain enrolled in a college program in the third semester after initial enrollment.” The first-time college freshmen cohort (FCFC) is defined as those high school graduates earning a standard diploma that enroll in college for the first time. The annual report combines both 2-year and 4-year college students that maintain their enrollment.
(# of Students Enrolled in 3rd Semester) ÷ (# of First-Time College Freshmen Cohort)
1.3.5 College-Completion Rate [Status: Operational] [Baseline Year: 2011] College completion is determined by the percentage of the first-time college freshmen cohort who attend two- or four-year institutions of higher education (IHEs) and earn a college diploma. The data reported by this indicator does not reflect all students starting and completing their college education “on time.” For that reason, the college-completion rate will be computed over a six-year period. All NESSC states use data collected by the National Student Clearinghouse (NSC). The following formula is used for calculating college completion in four-year programs (the same formula is used for two-year programs):
(# of Students Completing College within 6 Years) ÷ (# of First-Time College Freshmen Cohort)

Common Data Project 2016 Procedural Guidebook—Final 11
SECTION II DATA COLLECTION, BUSINESS RULES, AND QUALITY CONTROLS
2.0 Overview This section describes the five key performance indicators for which data are being collected and reported, along with the quality controls used to ensure the comparability of the data. The production of statistical information based upon identified performance indicators requires a well-defined set of business rules that describe what the indicator is intending to measure and the metric by which results are produced. Business rules are further augmented by data definitions, which operationalize and codify the data-collection processes. Agreed-upon operational definitions articulate how to process raw data into reported statistics. The business rules reported within this section define the parameters and data necessary for NESSC to meet its objectives. Most states use a combination of statistical process controls (SPC), internal audit procedures, and/or end-user-verification opportunities within their quality-assurance framework. These processes help to ensure that reported data and statistics are valid representations of actual performance, rather than errors. The Data Team’s overarching goal of comparable data across states can only be actualized by the prevention of unwanted errors from entering the early stages of the reporting cycle. Each member state has, within their student-information systems, internal processes to detect and correct irregularities, such as duplicate records, missing data fields, illogical data, and multiple memberships. Support to local districts—such as developing data-acquisition calendars, training IT and school staff, and improving communication with local officials—are typical approaches used by states to promote data quality. Each NESSC member state has agreed to adhere to the guidelines and business rules outlined in this guidebook. The role of the Data Coordinator is to ensure the aggregated data submitted in the Data Template is both credible and comparable—i.e., that the data points were derived through the correct interpretation of the NESSC business rules. All member states data are reviewed on the same quality criteria using the Data Coordinator’s revised internal audit procedures. 2.1 Data Collection The Data Team established its original data collection procedures with UMDI at the beginning of 2009. A straightforward method was developed by which member states aggregated data from within their student-information systems, along with data from the NSC, and reported those data within a customized Excel spreadsheet. Once populated, the SEAs sent the spreadsheet to the UMDI for use in developing the annual NESSC report. Beginning in 2013, the data-collection spreadsheet was streamlined to reduce the time burdens on team members and eliminate unreported data points. These changes reduced the number of Data Elements to seventeen, but the number of variables per element increased slightly to seventeen. This increase was a result of the team’s decision to report the Asian/Pacific Islander student subgroup in two distinct categories, which is consistent with federal reporting requirements. Furthermore, minor changes to the nomenclature within the Data Template were applied to the 2013 version. In 2014, detailed cohort data associated with the denominators used for the five different indicators were added to the data templates to improve comparability among the member states. In 2018, five-year high school graduation elements were removed; 2-year and 4-year

Common Data Project 2016 Procedural Guidebook—Final 12
college enrollment elements were consolidated; and the ethnicity and race variables were combined, with Hispanic added as a seventh subgroup. All Data Elements will be collected and reported for each of the following student subgroups:
VARIABLE SUBGROUP
Gender All
Male Female
Race/ Ethnicity
Asian Black
Hawaiian/Pacific Islander Hispanic
Multiracial Native American
White
Income Eligible F/R Not Eligible F/R
Language EL Non-EL
SpEd SWD Non-SWD
2.1.1 Data Element: Number of Students Graduating in Four Years The number of students graduating from high school with a standard diploma in four years or less. 2.1.2 Data Element: Percentage of Students Graduating in Four Years The percentage of students graduating from high school with a standard diploma in four years or less. [2.1.3 Data Element: Number of Students Graduating in Five Years and 2.1.4 Data Element: Percentage of Students Graduating in Five Years removed in 2018] 2.1.5 Data Element: Number of Students Graduating in Six Years The number of students graduating from high school with a standard diploma in six years or less, adjusted for transfers in and out all six years. 2.1.6 Data Element: Percentage of Students Graduating in Six Years The percentage of students graduating from high school with a standard diploma in six years or less, adjusted for transfers in and out all six years. 2.1.7 Data Element: Number of High School Dropouts The number of students exiting high school prior to earning a standard diploma, including students exiting to enroll in a GED program.

Common Data Project 2016 Procedural Guidebook—Final 13
2.1.8 Data Element: Percentage of High School Dropouts The percentage of students exiting high school prior to earning a standard diploma, including students exiting to enroll in a GED program. [2.1.9 Data Element: Percentage of Students Enrolling Early in Postsecondary Education removed in 2018] 2.1.10 Data Element: College Enrollment The number of high school graduates earning a standard diploma and enrolling in a 2-year or 4-year degree program within 16 months after graduation [2.1.11 Data Element: Number of Students Enrolled in Four-Year Programs consolidated with 2-year programs in 2018. 2.1.12 Data Element: Number of Students Enrolled in Two-Year Programs [Delayed] and 2.1.13 Data Element: Number of Students Enrolled in Four-Year Programs [Delayed] removed in 2018] 2.1.14 Data Element: Number of College Students Persisting The number of first-time college freshmen (by cohort) enrolled in a college program in the third semester after initial enrollment. Meaning, for a given cohort of college freshmen, the number of students who are still enrolled in a college program in the 3rd semester. [2.1.15 Data Element: Number of Students Persisting in Four-Year Programs consolidated with two-year programs in 2018] 2.1.16 Data Element: Number of Students Completing College The number of first-time college freshmen (by cohort) that earn a diploma/certification by completing a college degree within six years. [2.1.17 Data Element: Number of Students Completing Four-Year Programs removed in 2018] 2.1.18 Data Element: Adjusted High School Freshmen Cohort (AHSFC) The unduplicated number of students enrolled for the first-time in high school (grade 9) any time during the academic year adjusted for transfers in and out (new enrollments/exiting enrollment) over the next four years. 2.1.19 Data Element: High School Graduation Cohort (HSGC) The unduplicated number of students that graduate with a standard diploma (as defined by each state) in the identified year (from the prior September 1 to August 31) regardless of their freshmen cohort. 2.1.20 Data Element: First-time College Freshmen Cohort (FCFC) The unduplicated number of students enrolled (must be after graduation date) for the first time in college by the fall enrollment window (October 15) that earned a standard diploma from zero to five years ago from a public high school in the state.

Common Data Project 2016 Procedural Guidebook—Final 14
2.2 Business Rules The business rules are further augmented by data definitions, which operationalize and codify the data-collection processes. The National Center for Educational Statistics (NCES) publishes data definitions that are used by state education agencies (SEAs) to report on federal performance indicators. Many of these data definitions are found in the National Data Model used to collect and store federally mandated data via the Education Data Exchange Network (EDEN) and EDFacts. The Data Team uses data definitions consistent with federal reporting, except when noted within this document. Additionally, some definitions are unique to the NESSC given the focus of the performance indicators. For example, graduation rates are reported using the most recent federal reporting formats and data definitions; however, a “six-year” rate required a new data definition. The Data Team has created seventeen data variables to display aggregated performance data by gender, ethnicity, race, income (free and reduced lunch eligibility status), language (English learners), and special education (students with disabilities). 2.2.1 Graduation Rate In addition to the common four-year graduation rate, the NESSC decided to report five- and six-year graduation rates. The Data Team decided against “freezing” the number of students in a graduating cohort (the denominator in the equation). This means that as graduates (adjusted for transfers in and out) are added in the fifth and sixth years of the cohort, graduation rates will rise. For the purpose of baseline data, the adjusted cohorts in the fifth and sixth years will be applicable once the baseline cohort (2009) reaches the five-year mark. No exemptions will be included for English learners or students with disabilities. The graduation rate is calculated using a four-year adjusted cohort graduation rate (ACGR), defined as the number of students who graduate in four years with a regular high school diploma divided by the number of students who form the adjusted cohort for that graduating class. For those high schools that start after ninth grade, the cohort is calculated based on the earliest high school grade.
§ The term “adjusted cohort” means the students who enter ninth grade (or the earliest high school grade) and any students who transfer into the cohort in grades nine through twelve minus any students removed from the cohort.
§ The term “students who transfer into the cohort” means the students who enroll after the beginning of the entering cohort’s first year in high school, up to and including grade twelve.
§ Transfers into the cohort and out of the cohort used in the ACGR are tracked using entry and exit coding found within an SEA’s student-information systems, such as the examples below:
DEFINITION COUNTS AS A TRANSFER-IN
New to education system YES Continuous in same school with no interruption NO Grade reassignment within same school NO Transfer from a public school within same district NO

Common Data Project 2016 Procedural Guidebook—Final 15
Transfer from a non-district site YES Transfer from a public school in a different district YES Transfer from a different state/country YES Transfer from a non-public school YES Transfer from home-based education YES Transfer from a GED/HISET program YES Transfer from a vocational program YES Transfer from state facility YES Reentry after dropping out from same district NO Reentry after dropping out from different district YES Reentry after dropping out from different state/country YES Reentry after expulsion from same district NO Reentry after expulsion from different district YES Reentry after expulsion from different state/country YES
DEFINITION
CLASSIFICATION TRANSFER OUT (TO)
DROPOUT (DO) GRADUATE (GR)
Transfer to public school in the same district TO Transfer to public school in different district TO Transfer to public school in a different state TO Transfer to private non-religious school, same district TO Transfer to private, non-religious, different district TO Transfer to private non-religious, out-of-state TO Transfer to private religious school within district TO Transfer to private, religious, different district TO Transfer to private, religious, different state TO Transfer to school outside of the country TO Transfer to an institution TO Transfer to a charter school TO Transfer to home schooling TO Matriculation to another school TO Graduated with regular, advanced diploma GR1 Completed school with other credentials GR2 Death TO Illness DO Expulsion DO Reached maximum age for services DO Discontinued schooling DO

Common Data Project 2016 Procedural Guidebook—Final 16
Transfer to GED/HISET program DO Transfer to a college education TO Moved, not known to be continuing DO Reason unknown DO Close of year TO/DO (Summer) Other DO
To remove a student from the cohort, a school or local education agency (LEA) must confirm in writing that the student transferred out, emigrated to another country, or died. A student who is retained in a grade level, enrolls in a GED program, or leaves school for any other reason may not be counted as having transferred out and must, therefore, remain in the adjusted cohorts – for the purpose of calculating the graduation rate.
§ The term “students who graduate in four years” means students who earn a regular high school diploma at the conclusion of their fourth year, before the conclusion of their fourth year, or during a summer session immediately following their fourth year.
§ The term “regular high school diploma” means the standard high school diploma that is awarded to students in the state and that is fully aligned with the state's academic content standards or a higher diploma, which does not include a GED credential, certificate of attendance, or any alternative award.
An “extended-year adjusted cohort graduation rate” is defined as the number of students who graduate in four years or more with a regular high school diploma divided by the number of students who form the adjusted cohort for the four-year adjusted cohort graduation rate—provided that the adjustments account for any students who transfer into the cohort by the end of the given year of graduation minus the number of students who transfer out, emigrate to another country, or die by the end of that year.
§ Students are aggregated into the <Language–EL> and <SpEd–SWD> variables if a student has received services at any time during high school.
§ Students are aggregated into the Race variable <Multiracial> based on state-developed definitions.
2.2.2 Dropout Rate A student is considered a dropout if any one of the following occurs: (1) the student is over 16 years of age, withdraws from school, and does not enroll in any other school; (2) the student withdraws, and the school does not know where the student has gone; (3) the student withdraws and enrolls in a GED program; or (4) the student has not officially withdrawn and the school does not know where the student has gone. The term “dropout” is used to describe both the event of leaving school before completing high school and the status of an individual who is not in school and who is not a high school completer. High school completers include both regular graduates of school programs and those completing high school through equivalency programs such as the GED. Transferring from a public school to a private school, for example, is not regarded as a dropout event.

Common Data Project 2016 Procedural Guidebook—Final 17
A student who drops out of school may later return and graduate, but is called a “dropout” at the time he or she leaves school. Measures to describe these frequently complicated behaviors include the event dropout rate (or the closely related school-persistence rate), the status dropout rate, and the high school completion rate. A clear distinction was made between students who complete a high school program that requires students to meet state standards and those who receive a general educational development (GED) diploma. Since a variety of alternative high school diplomas exist in the region, the Data Team decided:
§ Only programs that required students to meet state standards would be allowed to count for the graduation and dropout rates.
§ GED completers are counted as dropouts, since they do not complete a program that requires students to meet state standards.
§ The adjusted freshmen cohort would serve as the denominator. The following dropout reasons are typically found within student-information systems used by SEAs (yet the actual coding varies among states):
REASON DESCRIPTOR Academic Left school because of problems in academics Behavior Left school because of problems in behavior
Dislike experience Left school because of dislike of experience
Economic Left school because of economic reason
Employment Left school to seek employment
Curriculum Left school because lack of appropriate curriculum
Childcare Left school because of childcare
Transportation Left school because of transportation
Language Left school because of language
Marriage Left school because of marriage
Military Left school because of military
Needed at home Left school because needed at home
Pregnancy Left school because of pregnancy
Religion Left school because of religion
Substance abuse Left school because of substance abuse

Common Data Project 2016 Procedural Guidebook—Final 18
2.2.3 College Enrollment The Data Team considered whether the denominator for the college enrollment rate should be the number of high school graduates or the number in the freshmen (high school) cohort, since the measure seeks to report the effect of high school transformation over the course of a student’s high school career. The Team determined that the denominator would be based on the number of high school graduates earning a regular (i.e., standard) diploma. The team has, on many occasions, discussed the validity of data related to college enrollment if decision rules beyond “any instance” of enrollment are not in place. That is, “any instance” could include students enrolled at any time and enrolled for less than one day. In March 2011, the Data Team agreed to the “any instance” criteria, as most states received these data from the National Student Clearinghouse (NSC) and is therefore subject to NSC’s data-reporting guidelines.
§ The NCS identifies “College Enrollment” when the student enrolled in a two- or four-year college institution with an enrollment status of full-time, half-time, or less-than half-time within 16 months after high school graduation. The student must be enrolled for at least ten days.
2.2.4 College Persistence The Data Team initially organized the persistence indicator into two-year and four-year college programs. For two-year college institutions, the college freshmen cohort was evaluated to determine if they (the students) maintained their enrollment in the third semester. Subsequently, for four-year college institutions, the cohort was evaluated to determine if they continued their enrollment into the fifth semester. After several meetings in which the persistence data for both groups were evaluated, it was determined a common metric (third semester) would be the most applicable, and the following business rule was adopted:
The number of college freshmen (by cohort) enrolled [by October 15] in a college program in the third semester [by October 15 of the subsequent year] after initial enrollment.
2.2.5 College Completion The Data Team was concerned about accurately representing students in the college completion rate. One concern was based on the group of students who delayed (or deferred) entering college. If the calculation for college completion was predicated on students going directly from high school to college, this population would be misrepresented as “unmatriculated” rather than simply starting school later. For this reason, the decision was made to establish a first-time college freshman cohort (FCFC) each fall. Students would belong in the cohort of the year in which they started their college education. For example, a student who graduated in 2009 but did not start college until fall of 2011 would be assigned to the 2011 college cohort. At its winter 2015 meeting, the Data Team decided on reporting the two-year and four-year college completion rates together in the Annual Report. The reporting method would determine the number (unduplicated) of two-year and four-year college graduates within a six-year window given the number of FCFC in the applicable baseline year.

Common Data Project 2016 Procedural Guidebook—Final 19
2.2.6 College Readiness Index (CRI) The Data Team organized its College Readiness Indicators (CRIs) into four dimensions: (1) performance, (2) preparatory, (3) behavioral, and (4) attitudinal. Potential indicators were screened and vetted by the team based upon the indicator’s degree of objectivity, research foundation, comparability, and data availability. After considerable deliberation, the following CRIs were approved for testing: (1) SAT/ACT participation rates, (2) completion of Algebra II, (3) course completion and scores in dual enrollment/early college, Advanced Placement, and International Baccalaureate courses/programs, (4) SAT/PSAT/ACT scores, (5) state assessment results, (6) high school GPA, (7) attendance rates in high school, (8) completion of FAFSA, and (9) completion of four years of mathematics. 2.2.7 Student Categories The Data Team referenced the requirements within federal statutes (see Section 1111h) in developing the student categories for which data would be collected, aggregated, and reported. The team selected six student data categories, then in 2018 consolidated Race and Ethnicity to form five categories:
1. GENDER 2. RACE/ETHNICITY 3. INCOME 4. LANGUAGE 5. SPECIAL EDUCATION
2.2.7.1 Gender
1. Defined as a student’s reported gender as either MALE or FEMALE.
2. Missing data are reported within the variable <Gender ALL> on the Data Template.
Common Data Project 2016 Procedural Guidebook—Final 20
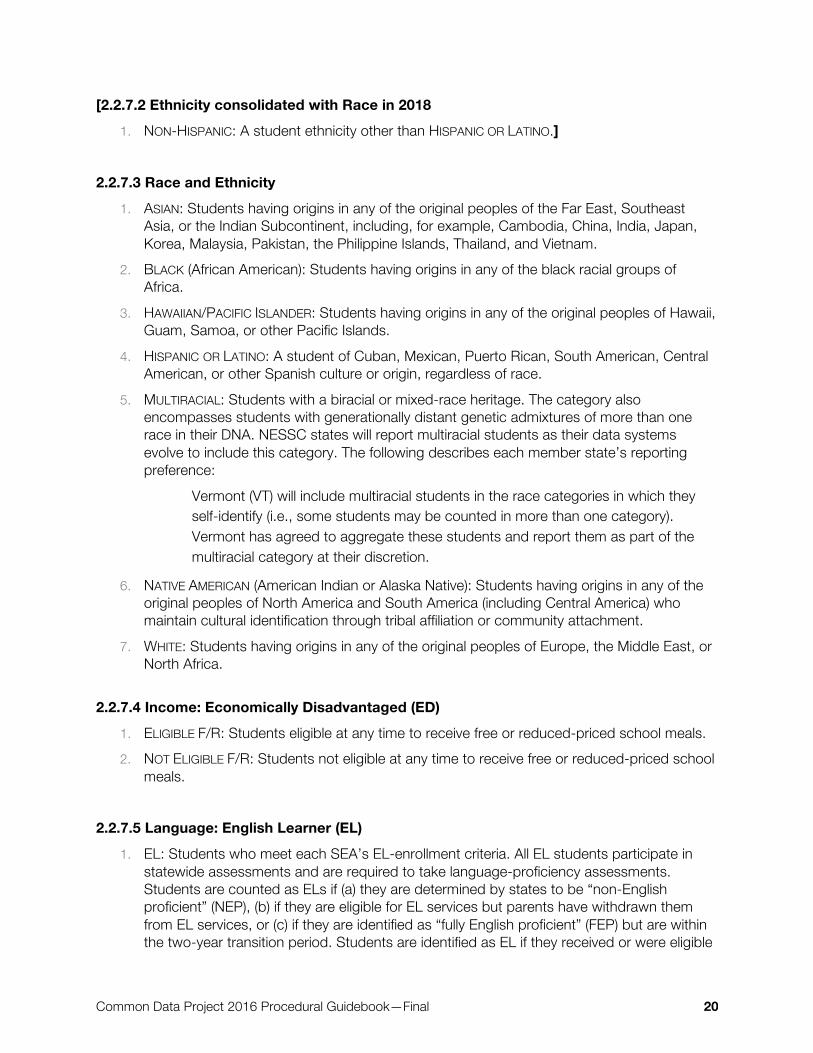
[2.2.7.2 Ethnicity consolidated with Race in 2018 1. NON-HISPANIC: A student ethnicity other than HISPANIC OR LATINO.]
2.2.7.3 Race and Ethnicity
1. ASIAN: Students having origins in any of the original peoples of the Far East, Southeast Asia, or the Indian Subcontinent, including, for example, Cambodia, China, India, Japan, Korea, Malaysia, Pakistan, the Philippine Islands, Thailand, and Vietnam.
2. BLACK (African American): Students having origins in any of the black racial groups of Africa.
3. HAWAIIAN/PACIFIC ISLANDER: Students having origins in any of the original peoples of Hawaii, Guam, Samoa, or other Pacific Islands.
4. HISPANIC OR LATINO: A student of Cuban, Mexican, Puerto Rican, South American, Central American, or other Spanish culture or origin, regardless of race.
5. MULTIRACIAL: Students with a biracial or mixed-race heritage. The category also encompasses students with generationally distant genetic admixtures of more than one race in their DNA. NESSC states will report multiracial students as their data systems evolve to include this category. The following describes each member state’s reporting preference:
Vermont (VT) will include multiracial students in the race categories in which they self-identify (i.e., some students may be counted in more than one category). Vermont has agreed to aggregate these students and report them as part of the multiracial category at their discretion.
6. NATIVE AMERICAN (American Indian or Alaska Native): Students having origins in any of the original peoples of North America and South America (including Central America) who maintain cultural identification through tribal affiliation or community attachment.
7. WHITE: Students having origins in any of the original peoples of Europe, the Middle East, or North Africa.
2.2.7.4 Income: Economically Disadvantaged (ED) 1. ELIGIBLE F/R: Students eligible at any time to receive free or reduced-priced school meals. 2. NOT ELIGIBLE F/R: Students not eligible at any time to receive free or reduced-priced school
meals. 2.2.7.5 Language: English Learner (EL)
1. EL: Students who meet each SEA’s EL-enrollment criteria. All EL students participate in statewide assessments and are required to take language-proficiency assessments. Students are counted as ELs if (a) they are determined by states to be “non-English proficient” (NEP), (b) if they are eligible for EL services but parents have withdrawn them from EL services, or (c) if they are identified as “fully English proficient” (FEP) but are within the two-year transition period. Students are identified as EL if they received or were eligible
Common Data Project 2016 Procedural Guidebook—Final 21
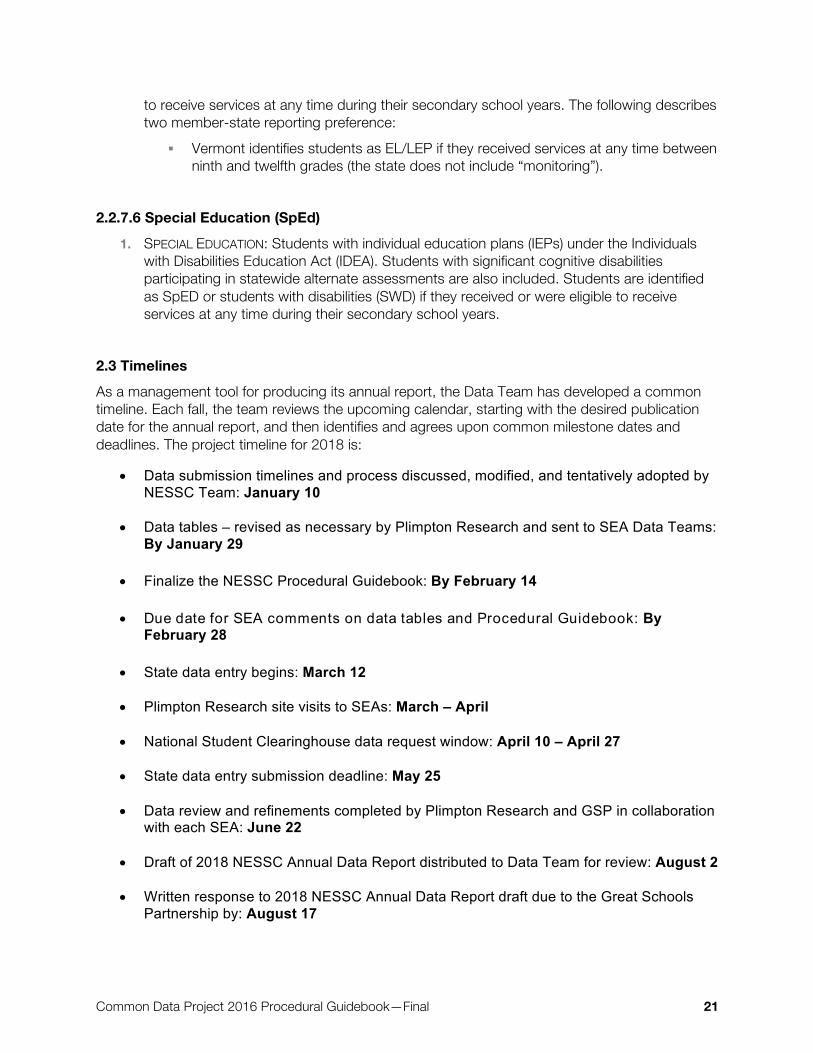
to receive services at any time during their secondary school years. The following describes two member-state reporting preference:
§ Vermont identifies students as EL/LEP if they received services at any time between ninth and twelfth grades (the state does not include “monitoring”).
2.2.7.6 Special Education (SpEd)
1. SPECIAL EDUCATION: Students with individual education plans (IEPs) under the Individuals with Disabilities Education Act (IDEA). Students with significant cognitive disabilities participating in statewide alternate assessments are also included. Students are identified as SpED or students with disabilities (SWD) if they received or were eligible to receive services at any time during their secondary school years.
2.3 Timelines As a management tool for producing its annual report, the Data Team has developed a common timeline. Each fall, the team reviews the upcoming calendar, starting with the desired publication date for the annual report, and then identifies and agrees upon common milestone dates and deadlines. The project timeline for 2018 is:
• Data submission timelines and process discussed, modified, and tentatively adopted by NESSC Team: January 10
• Data tables – revised as necessary by Plimpton Research and sent to SEA Data Teams: By January 29
• Finalize the NESSC Procedural Guidebook: By February 14
• Due date for SEA comments on data tables and Procedural Guidebook: By
February 28
• State data entry begins: March 12
• Plimpton Research site visits to SEAs: March – April
• National Student Clearinghouse data request window: April 10 – April 27
• State data entry submission deadline: May 25
• Data review and refinements completed by Plimpton Research and GSP in collaboration with each SEA: June 22
• Draft of 2018 NESSC Annual Data Report distributed to Data Team for review: August 2
• Written response to 2018 NESSC Annual Data Report draft due to the Great Schools Partnership by: August 17
Common Data Project 2016 Procedural Guidebook—Final 22
• Great Schools Partnership Publishes and Distributes to the Nellie Mae Education Foundation and to NESSC the 2018 Annual Data Report and the 2018 NESSC Procedural Guidebook: September 12
2.4 Quality Controls Quality-control practices are critical to producing comparable and credible data across selected performance indicators. Quality approaches in most states constitute a combination of externally reported data, internal-review procedures (i.e., field specifications and error reports), and data-verification techniques. These processes allow agency officials to assert that their performance statistics are valid representations of events within the state, and the judicious application of control measures is one approach within an overall quality-assurance framework. Control procedures are used to evaluate data elements during the collection and production cycle and mitigate unwanted variance and error. Without such control procedures, valid inferences about performance cannot be made for the given year. The controls must be sensitive enough to detect slight changes in the performance indicators, while also discerning actual change from natural variability and non-systematic error. All state data contain some anomalies—some are valid, while others do not represent facts. Several critical areas, such as primary and secondary “keys” used to link multiple years of data for a student, require differing levels of error detection and controls. State and local officials have limited time and human resources to investigate every data point in their information systems. However, some data elements require more effort than others because of their overall influence on the result. Accounting for every student within a state is a complex task made more difficult by diverse programs, student mobility, changing policies, political demands, and secondary/external data sources (e.g., the National Student Clearinghouse). In examining the collection and production procedures necessary to report on each NESSC performance indicator, the first step is for the SEA to implement its own internal controls. These controls are used to identify and reduce unwanted error, thus improving data quality. In addition to these internal controls, the NESSC Data Team has developed a series of external and cross-state checks for quality. Each member state provides data in accordance with the guidelines and business rules agreed upon by the Data Team, and each Data Template is reviewed using the same quality-control criteria. Three quality-assurance techniques are implemented to ensure that the reported information is both accurate and comparable.
§ Business-Rule Fidelity: A qualitative approach developed to define the parameters and conditions necessary to satisfy the NESSC objectives, while also promoting transparency and improved comparability.
§ Data-Quality Checklist: A standardized, qualitative procedure used to audit the data for comprehensiveness by ensuring each metric is responded to correctly.
§ Statistical Process Control (SPC): A quantitative procedure that requires multi-wave data to test hypotheses associated with the likelihood that the observed data point represents actual performance.
*NOTE: The data submitted by each state agency will be handled in accordance with regulations outlined in the Family Education Rights and Privacy Act (FERPA). Personally identifiable information is not transmitted under any conditions.
Common Data Project 2016 Procedural Guidebook—Final 23
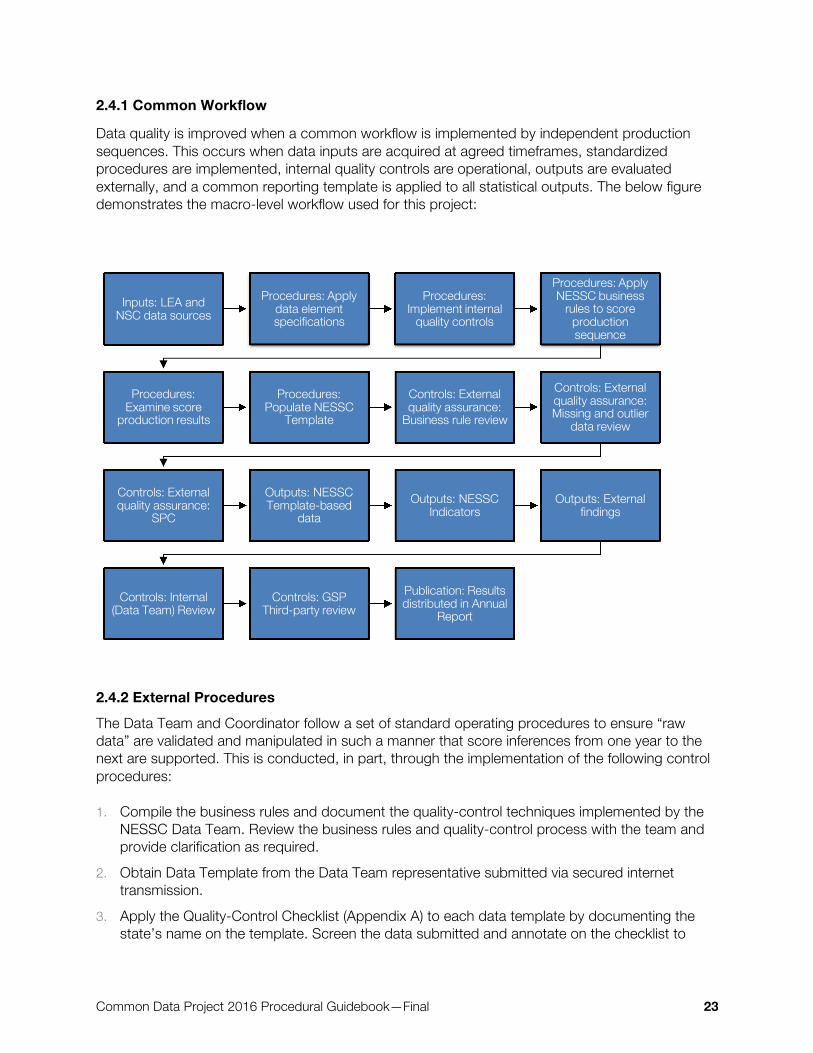
2.4.1 Common Workflow
Data quality is improved when a common workflow is implemented by independent production sequences. This occurs when data inputs are acquired at agreed timeframes, standardized procedures are implemented, internal quality controls are operational, outputs are evaluated externally, and a common reporting template is applied to all statistical outputs. The below figure demonstrates the macro-level workflow used for this project:
2.4.2 External Procedures The Data Team and Coordinator follow a set of standard operating procedures to ensure “raw data” are validated and manipulated in such a manner that score inferences from one year to the next are supported. This is conducted, in part, through the implementation of the following control procedures: 1. Compile the business rules and document the quality-control techniques implemented by the
NESSC Data Team. Review the business rules and quality-control process with the team and provide clarification as required.
2. Obtain Data Template from the Data Team representative submitted via secured internet transmission.
3. Apply the Quality-Control Checklist (Appendix A) to each data template by documenting the state’s name on the template. Screen the data submitted and annotate on the checklist to
Inputs: LEA and NSC data sources
Procedures: Apply data element specifications
Procedures: Implement internal
quality controls
Procedures: Apply NESSC business
rules to score production sequence
Procedures: Examine score
production results
Procedures: Populate NESSC
Template
Controls: External quality assurance:
Business rule review
Controls: External quality assurance: Missing and outlier
data review
Controls: External quality assurance:
SPC
Outputs: NESSC Template-based
dataOutputs: NESSC
IndicatorsOutputs: External
findings
Controls: Internal (Data Team) Review
Controls: GSP Third-party review
Publication: Results distributed in Annual
Report

Common Data Project 2016 Procedural Guidebook—Final 24
identify any missing data based on the elements and subgroups identified in the provided template.
4. Compare all prior years N-counts in the template submitted with the current year’s N-counts in the original template provided. Identify and notate in the quality-control checklist any changes made to prior year N-counts.
5. Identify possible anomalies in N-counts by summing subgroup N-counts and ensuring the subgroup total equals the full student population. Annotate in the quality-control checklist any N-count anomalies identified in totaling subgroup N-counts.
6. Apply a 10% (+/-) threshold and/or 95% confidence interval to a weighted, multi-year average and compare the resultant to the current year.
7. Annotate in the quality-control checklist any N-count (subgroup) that falls outside of the 10% (+/-) threshold and/or 95% confidence interval as a possible “red flag.”
8. Finalize the state’s quality-control checklist. Send an email with the completed quality-control checklist to the respective SEA for investigation. Each SEA representative will investigate and resubmit data/responses based on the identified anomalies.
9. Review and validate the resubmitted data based on the anomalies identified (quality-control checklist).
10. Migrate the finalized data into the reporting tool.

Common Data Project 2016 Procedural Guidebook—Final 25
SECTION III ANNUAL REPORT 3.0 Overview The Data Team conducts post-hoc analyses on the targeted performance indicators using both current and past data. Expanding on the early work of UMDI, the Data Team created an analytical framework that examines how the current year’s data compare with data from previous years. Performance indicators for each state and the region are examined and represented graphically. Multiyear results are used for comparative purposes and to provide a context for the current year’s results. 3.1 Content of the Report EXECUTIVE SUMMARY
KEY FINDINGS
HOW TO USE THIS REPORT
REGIONAL AND STATE CONTEXT INFORMATION
STATE AND REGIONAL CONTEXT
SECTION I: HIGH SCHOOL GRADUATION RATES (4-YEAR)
SECTION II: EXTENDED HIGH SCHOOL GRADUATION RATES (6-YEAR)
SECTION III: DROPOUT RATES
SECTION IV: COLLEGE ENROLLMENT RATES: [no new data for 2018 due to definition change]
SECTION V: COLLEGE PERSISTENCE RATES
SECTION VI: COLLEGE COMPLETION RATES
APPENDIX 1: SUB-GROUP DEFINITIONS
APPENDIX 2: COMMON DATA PROJECT METHODOLOGY

Common Data Project 2016 Procedural Guidebook—Final 26
APPENDIX A
QUALITY-CONTROL CHECKLIST KPI #1. Graduation Rate
WBS MEASURE COMPLETION STATUS
QUALITY STATUS FINDINGS
1.1 Four-Year Rate: Graduates
1.2 Fifth-Year Rate: Graduates
1.3 Six-Year Rate: Graduates
1.4 Demographics: Gender
1.5 Demographics: Race/Ethnicity
1.6 Demographics: Income (ED)
1.7 Demographics: Language (EL)
1.8 Demographics: Special Education (SpEd/SWD)
1.9 Baseline-AHSFC
KPI #2. Dropout Rate
WBS MEASURE COMPLETION STATUS
QUALITY STATUS FINDINGS
2.1 High School Dropouts
2.2 Demographics: Gender
2.3 Demographics: Race/Ethnicity
2.4 Demographics: Income (ED)
2.5 Demographics: Language (EL)
2.6 Demographics: Special Education (SpEd/SWD)
2.7 Baseline-AHSFC

Common Data Project 2016 Procedural Guidebook—Final 27
KPI #3. College Enrollment Rate
WBS MEASURE COMPLETION STATUS
QUALITY STATUS FINDINGS
3.1 Enrolled in College within 16 months
3.2 Demographics: Gender
3.3 Demographics: Race/Ethnicity
3.4 Demographics: Income (ED)
3.5 Demographics: Language (EL)
3.6 Demographics: Special Education (SpEd/SWD)
3.7 Baseline-HSGC
KPI #4. College Persistence Rate
WBS MEASURE COMPLETION STATUS
QUALITY STATUS FINDINGS
4.1 Students Persistent [3rd semester enrolled]
4.2 Demographics: Gender
4.3 Demographics: Race/Ethnicity
4.4 Demographics: Income (ED)
4.5 Demographics: Language (EL)
4.6 Demographics: Special Education (SpEd/SWD)
4.7 Baseline-FCFC

Common Data Project 2016 Procedural Guidebook—Final 28
KPI #5. College Completion Rate
WBS MEASURE COMPLETION
STATUS QUALITY STATUS FINDINGS
5.1 College Completion
5.2 Demographics: Gender
5.3 Demographics: Race/Ethnicity
5.4 Demographics: Income (ED)
5.5 Demographics: Language (EL/LEP)
5.6 Demographics: Special Education (SpEd/SWD)
5.7 Baseline- FCFC

Common Data Project 2016 Procedural Guidebook—Final 29
APPENDIX B
PROCEDURAL STEPS
The primary purpose of the below section is to articulate the sequence of steps (not-state centric) used in the production of data points published in the Annual Report. They are provided as a frame-of-reference for both NESSC member states and quasi-technical audiences. Graduation Rate
STEP 1. Establish the adjusted high school freshmen cohort (AHSFC) articulated in 2.1.18. STEP 2. Determine the number of students composing the denominator for the beginning
graduation window (i.e., baseline year). STEP 3. Remove students from the AHSFC given different “transfer-out” codes throughout
the high school window (e.g., 4-years). STEP 4. Add students to the AHSFC given different “transfer-in” codes throughout the high
school window. STEP 5. Given the adjusted AHSFC (denominator), determine the number of students
(numerator) earning a standard diploma. STEP 6. Aggregate data given the different reporting categories enumerated in Section
2.2.7. Dropout Rate STEP 1. Establish the adjusted high school freshmen cohort (AHSFC) articulated in 2.1.18. STEP 2. Determine the number of students composing the denominator for the beginning
graduation window (i.e., baseline year). STEP 3. Remove students from the AHSFC given different “transfer-out” codes throughout
the high school window. STEP 4. Add students to the AHSFC given different “transfer-in” codes throughout the high
school window. STEP 5. Given the adjusted AHSFC (denominator), create the numerator by removing all
students earning a standard diploma, alternative diploma, still enrolled, and other completers.
STEP 6. Evaluate the numerator created from STEP 5 with prior year’s enrollment status codes to identity (and remove) any students not previously identified in the enrollment tables as dropouts. Determine if these students should be categorized as dropouts (e.g., exit status = “other” or “unknown”).
STEP 7. Aggregate data given the different reporting categories enumerated in Section 2.2.7.

Common Data Project 2016 Procedural Guidebook—Final 30
College Enrollment Rate
STEP 1. Establish the adjusted high school graduation cohort (HSGC) articulated in 2.1.19. STEP 2. Determine the number of students composing the denominator for the beginning
college enrollment window (i.e., baseline year). STEP 3. Add students to the HSGC that complete high school during the summer. STEP 4. Given the adjusted HSGC (denominator), determine the number of students
(numerator) enrolled within 16 months into a college institution of higher education. STEP 5. Aggregate data given the different reporting categories enumerated in Section
2.2.7. College Persistence Rate STEP 1. Establish the first-time college freshmen cohort (FCFC) articulated in 2.1.20. STEP 2. Determine the number of students composing the denominator for the beginning
college enrollment window (i.e., baseline year). STEP 3. Add students to the FCFC that did not matriculate from high school to college
immediately “late college freshmen” by October 15 of the given year. STEP 4. Given the adjusted FCFC (denominator), determine the number of students
(numerator) that remain enrolled by October 15 of the subsequent year in a college institution of higher education.
STEP 5. Aggregate data given the different reporting categories enumerated in Section 2.2.7.
College-Completion Rate STEP 1. Given the first-time college freshmen cohort (FCFC) articulated in 2.1.20. STEP 2. Determine the number of students composing the denominator for the beginning
college enrollment window (i.e., baseline year). STEP 3. Add students to the FCFC that did not matriculate from high school to college
immediately “late freshmen” by October 15 of the given year. STEP 4. Given the adjusted FCFC (denominator), determine the number of students
(numerator) that completed a two-year program within three years from initial enrollment.
STEP 5. Given the adjusted FCFC (denominator), determine the number of students (numerator) that completed a four-year program within six years from initial enrollment.
STEP 6. Aggregate data given the different reporting categories enumerated in Section 2.2.7.