commodity watch -...
TRANSCRIPT

COMMODITY WATCH
Bunzl Distribution Newsletter August 2015
Goodbye To All That From the print edition | The Economist
Published: August 22nd 2015
A decade of bingeing on raw materials
may leave an even longer hangover
IT WAS only a decade or so ago that Scot-
land was hit by the “Great Drain Robbery”,
the disappearance of 50 manhole covers
in Fife. It gave an inkling of the emergence
of a new era in commodity markets,
spurred by insatiable demand from China.
Scrap-metal prices – and so scrap-metal
thefts – soared. Africa was over-run by
Chinese engineers; Australia elected a
Mandarin-speaking prime minister; and
emerging markets from Argentina to Zam-
bia relished the rising values of their farm-
land and mines. The boom was fanned by
a weak American dollar, the currency in
which most stuff that comes out of the
ground is priced.
The gears have now gone into reverse. A
resurgent dollar has hammered commodity
prices: many have recently fallen below
their levels of a decade ago. That is a fate
not shared by other tradeable assets: not
since the late 1990s have commodity pric-
es been so weak compared with shares
(see chart 1). The American economy is
strengthening, but by no means enough to
encourage thieves to filch bronze bells
from Chinese temples to send as scrap to
the United States. The impact of its recov-
ery is
dwarfed by
slowing
demand in
China,
which still
consumes
about half
the world’s
metals
such as iron, aluminium, and zinc.
See Goodbye To All That on pg. 7
Contents
Resin
Aluminum
Paper and Pulp
Energy
Foreign Currency
2
4
4
5
6
Contact us
E-mail us with your comments
and suggestions.
Tetiana Tarasova
Bunzl Distribution
Our Goal is:
To show market trends that
affect Bunzl Distribution’s
final product cost.
To provide market and eco-
nomical data to internal
readers.
Prices Fall For Most Commodity
Resins By Frank Eposito | Plastic News
Published: September 3rd 2015
The Summer of 2015 began to fade in August – and it
took North American commodity resin prices down along
with it.
Average per-pound selling prices for polyethylene, polypro-
pylene, polystyrene, PVC and PET all fell in August. PE
saw the largest August drop with 5 cents, while PET prices
fell 4 cents. Next in line were PP and PS, each with a 2-
cent drop, while PVC prices ticked down 1 cent.
“Whenever oil prices move down sharply, most commodity
resins prices are bound to soon start moving downward, as
well,” said Phil Karig, managing director with the Mathelin
Bay Associates consulting firm in St. Louis. “In the case of
ethylene-affected resins [like PE and PVC], the recent eas-
ing of ethylene supply issues is also contributing to down-
ward pricing pressures. “Add in weaker export markets,
expectations for continued resin price declines … and a
growing unease over financial instability in China … and we
have all the ingredients for continued price declines in the
months ahead,” he added.
All of the pricing changes are reflected in the Sept. 7 print
edition of Plastics News. The lower polyethylene prices
were noted on PlasticsNews.com on Aug. 27, and the rest
of the changes on Sept. 3.
Lower feedstock costs played a role in sending North
American PE prices down. The decline effectively wipes out
a 5-cent hike that the market had seen in May. Prior to that
increase, regional PE prices fell a total of 16 cents between
October and April.
See Prices Fall on pg. 8
2
Bunzl Distribution Newsletter | Commodity Watch August 2015
2
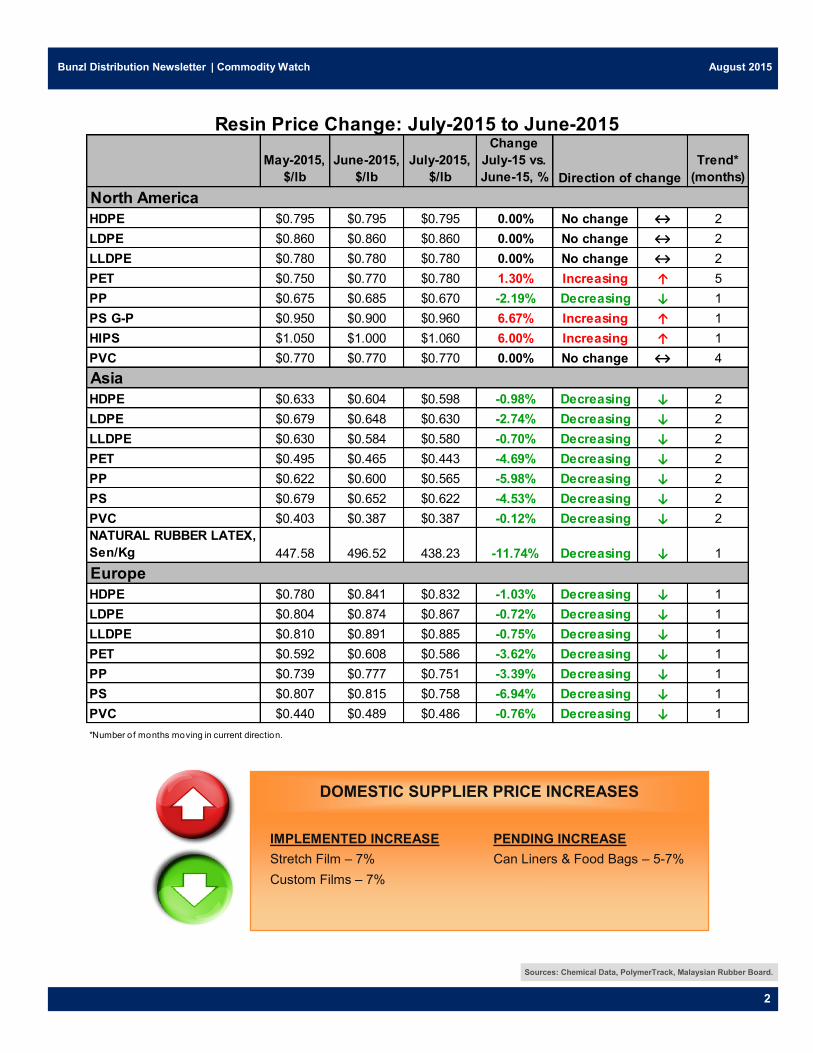
IMPLEMENTED INCREASE
Stretch Film – 7%
Custom Films – 7%
PENDING INCREASE
Can Liners & Food Bags – 5-7%
DOMESTIC SUPPLIER PRICE INCREASES
Sources: Chemical Data, PolymerTrack, Malaysian Rubber Board.
May-2015,
$/lb
June-2015,
$/lb
July-2015,
$/lb
Change
July-15 vs.
June-15, %
Trend*
(months)
HDPE $0.795 $0.795 $0.795 0.00% No change ↔ 2
LDPE $0.860 $0.860 $0.860 0.00% No change ↔ 2
LLDPE $0.780 $0.780 $0.780 0.00% No change ↔ 2
PET $0.750 $0.770 $0.780 1.30% Increasing ↑ 5
PP $0.675 $0.685 $0.670 -2.19% Decreasing ↓ 1
PS G-P $0.950 $0.900 $0.960 6.67% Increasing ↑ 1
HIPS $1.050 $1.000 $1.060 6.00% Increasing ↑ 1
PVC $0.770 $0.770 $0.770 0.00% No change ↔ 4
HDPE $0.633 $0.604 $0.598 -0.98% Decreasing ↓ 2
LDPE $0.679 $0.648 $0.630 -2.74% Decreasing ↓ 2
LLDPE $0.630 $0.584 $0.580 -0.70% Decreasing ↓ 2
PET $0.495 $0.465 $0.443 -4.69% Decreasing ↓ 2
PP $0.622 $0.600 $0.565 -5.98% Decreasing ↓ 2
PS $0.679 $0.652 $0.622 -4.53% Decreasing ↓ 2
PVC $0.403 $0.387 $0.387 -0.12% Decreasing ↓ 2
NATURAL RUBBER LATEX,
Sen/Kg 447.58 496.52 438.23 -11.74% Decreasing ↓ 1
HDPE $0.780 $0.841 $0.832 -1.03% Decreasing ↓ 1
LDPE $0.804 $0.874 $0.867 -0.72% Decreasing ↓ 1
LLDPE $0.810 $0.891 $0.885 -0.75% Decreasing ↓ 1
PET $0.592 $0.608 $0.586 -3.62% Decreasing ↓ 1
PP $0.739 $0.777 $0.751 -3.39% Decreasing ↓ 1
PS $0.807 $0.815 $0.758 -6.94% Decreasing ↓ 1
PVC $0.440 $0.489 $0.486 -0.76% Decreasing ↓ 1
Resin Price Change: July-2015 to June-2015
Direction of change
North America
Asia
Europe
*Number of months moving in current direction.
3
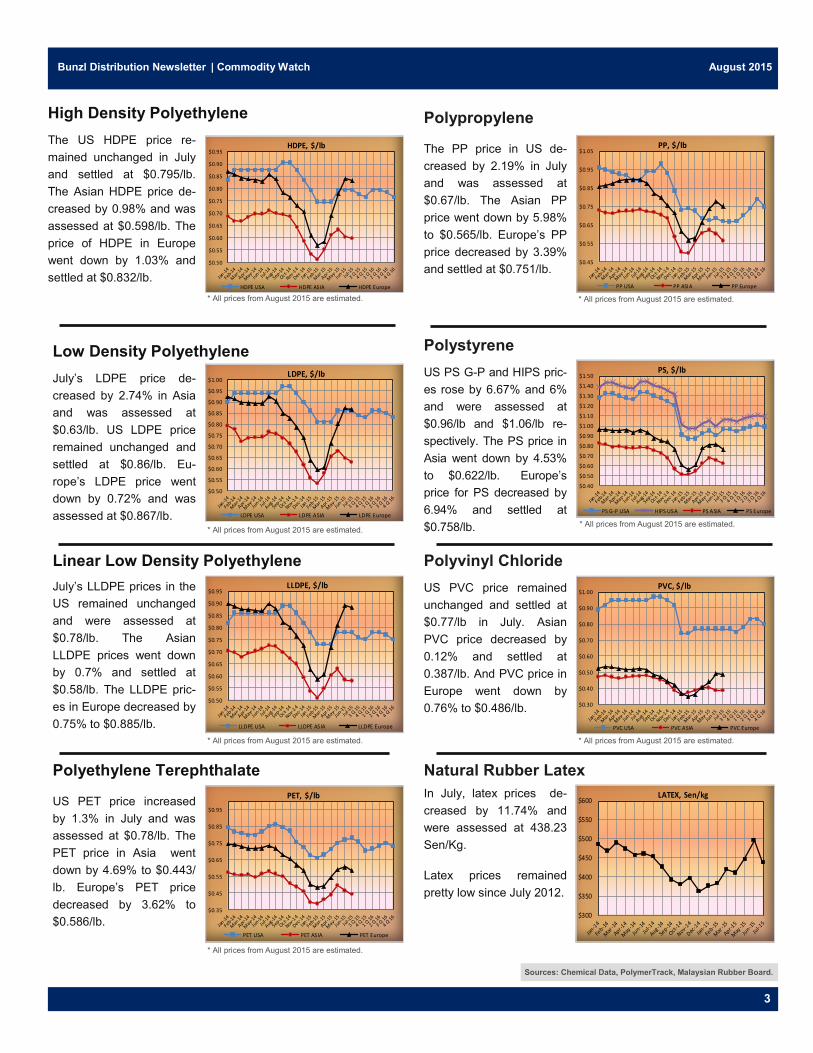
High Density Polyethylene
The US HDPE price re-
mained unchanged in July
and settled at $0.795/lb.
The Asian HDPE price de-
creased by 0.98% and was
assessed at $0.598/lb. The
price of HDPE in Europe
went down by 1.03% and
settled at $0.832/lb.
3
Low Density Polyethylene
July’s LDPE price de-
creased by 2.74% in Asia
and was assessed at
$0.63/lb. US LDPE price
remained unchanged and
settled at $0.86/lb. Eu-
rope’s LDPE price went
down by 0.72% and was
assessed at $0.867/lb.
Linear Low Density Polyethylene
July’s LLDPE prices in the
US remained unchanged
and were assessed at
$0.78/lb. The Asian
LLDPE prices went down
by 0.7% and settled at
$0.58/lb. The LLDPE pric-
es in Europe decreased by
0.75% to $0.885/lb.
Polyethylene Terephthalate
US PET price increased
by 1.3% in July and was
assessed at $0.78/lb. The
PET price in Asia went
down by 4.69% to $0.443/
lb. Europe’s PET price
decreased by 3.62% to
$0.586/lb.
Polypropylene
The PP price in US de-
creased by 2.19% in July
and was assessed at
$0.67/lb. The Asian PP
price went down by 5.98%
to $0.565/lb. Europe’s PP
price decreased by 3.39%
and settled at $0.751/lb.
Polystyrene
US PS G-P and HIPS pric-
es rose by 6.67% and 6%
and were assessed at
$0.96/lb and $1.06/lb re-
spectively. The PS price in
Asia went down by 4.53%
to $0.622/lb. Europe’s
price for PS decreased by
6.94% and settled at
$0.758/lb.
Polyvinyl Chloride
US PVC price remained
unchanged and settled at
$0.77/lb in July. Asian
PVC price decreased by
0.12% and settled at
0.387/lb. And PVC price in
Europe went down by
0.76% to $0.486/lb.
Natural Rubber Latex
In July, latex prices de-
creased by 11.74% and
were assessed at 438.23
Sen/Kg.
Latex prices remained
pretty low since July 2012.
Bunzl Distribution Newsletter | Commodity Watch August 2015
Sources: Chemical Data, PolymerTrack, Malaysian Rubber Board.
$0.50
$0.55
$0.60
$0.65
$0.70
$0.75
$0.80
$0.85
$0.90
$0.95HDPE, $/lb
HDPE USA HDPE ASIA HDPE Europe
* All prices from August 2015 are estimated.
$0.50
$0.55
$0.60
$0.65
$0.70
$0.75
$0.80
$0.85
$0.90
$0.95
$1.00LDPE, $/lb
LDPE USA LDPE ASIA LDPE Europe
* All prices from August 2015 are estimated.
$0.50
$0.55
$0.60
$0.65
$0.70
$0.75
$0.80
$0.85
$0.90
$0.95LLDPE, $/lb
LLDPE USA LLDPE ASIA LLDPE Europe
* All prices from August 2015 are estimated.
* All prices from August 2015 are estimated.
$0.45
$0.55
$0.65
$0.75
$0.85
$0.95
$1.05PP, $/lb
PP USA PP ASIA PP Europe
$300
$350
$400
$450
$500
$550
$600LATEX, Sen/kg
$0.35
$0.45
$0.55
$0.65
$0.75
$0.85
$0.95
PET, $/lb
PET USA PET ASIA PET Europe
* All prices from August 2015 are estimated.
$0.40
$0.50
$0.60
$0.70
$0.80
$0.90
$1.00
$1.10
$1.20
$1.30
$1.40
$1.50PS, $/lb
PS G-P USA HIPS USA PS ASIA PS Europe
* All prices from August 2015 are estimated.
$0.30
$0.40
$0.50
$0.60
$0.70
$0.80
$0.90
$1.00PVC, $/lb
PVC USA PVC ASIA PVC Europe
* All prices from August 2015 are estimated.

ALUMINUM
Aluminum prices decreased by 5.4% in July.
Prices for Aluminum on the London Metal Exchange were assessed at
$1,594/mt in July.
4
PAPER AND PULP
Northern bleached softwood kraft prices remained unchanged in July and
were assessed at $980/ton.
The prices for 30# KRAFT UNBLEACHED BAG and 70# KRAFT UN-
BLEACHED SACK remained unchanged in July and settled at $1,175/ton
and $985/ton respectively.
Solid bleached sulphate prices remained unchanged and were assessed
at $1,155/ton in July.
Bunzl Distribution Newsletter | Commodity Watch August 2015
Sources: LME, P&P weekly.
$1,400
$1,500
$1,600
$1,700
$1,800
$1,900
$2,000
$2,100
$2,200ALUMINUM, $/ton
$900
$925
$950
$975
$1,000
$1,025
$1,050
$1,075
$1,100
$1,125
$1,150
$1,175
$1,200PAPER AND PULP, $/ton
NBSK SBS BOARD
30# KRAFT UN BLEACHED BAG 70# KRAFT UN BLEACHED SACK
*Tracking of Wastepaper pricing discontinued from January 2015.
May-2015,
$/ton
June-2015,
$/ton
July-2015,
$/ton
Change
July-15 vs.
June-15, %
Trend*
(months)
NBSK $980 $980 $960 -2.04% Decreasing ↓ 1
SBS BOARD $1,155 $1,155 $1,155 0.00% No change ↔ 6
30# KRAFT UNBLEACHED
BAG $1,175 $1,175 $1,175 0.00% No change ↔ 15
70# KRAFT UNBLEACHED
SACK $985 $985 $985 0.00% No change ↔ 15
*Number of months moving in current direction.
Paper and Pulp Price Change: July-2015 to June-2015
Direction of change

5
5
Bunzl Distribution Newsletter | Commodity Watch August 2015
Sources: U.S. Energy Information Administration (EIA).
ENERGY
North Sea Brent crude oil prices averaged $57/barrel (b)
in July, a $5/b decrease from June. Brent crude oil spot
prices fell further in early August, settling at $48/b on
August 7. The recent price declines reflect concerns
about lower economic growth in emerging markets, ex-
pectations of higher oil exports from Iran, and continuing
actual and expected growth in global inventories.
EIA forecasts that Brent crude oil prices will average
$54/b in 2015 and $59/b in 2016, $6/b and $8/b lower
than in last month's STEO, respectively. Forecast West
Texas Intermediate (WTI) crude oil prices in both 2015
and 2016 average $5/b less than the Brent price. The
current values of futures and options contracts for No-
vember 2015 delivery suggest the market expects WTI
prices to range from $34/b to $64/b (at the 95% confi-
dence interval) in November 2015.
On July 14, the P5+1 (the five permanent members of
the United Nations Security Council and Germany) and
Iran announced an agreement that could result in relief
from United States and European Union nuclear-related
sanctions (which include some oil-related sanctions). If
the agreement is implemented and sanctions relief oc-
curs, it will put additional Iranian oil supplies on a global
market that has already seen oil inventories rise signifi-
cantly over the past year. This forecast assumes sanc-
tions relief occurs in 2016, contributing to an annual av-
erage increase in Iranian crude oil production of 0.3 mil-
lion b/d from 2015 to 2016, with most of the increase
coming in the second half of 2016.
U.S. regular gasoline monthly average retail prices aver-
aged $2.79/gallon (gal) in July, a decrease of 1 cent/gal
from June and 82 cents/gal lower than in July 2014. EIA
expects monthly average gasoline prices to decline from
their July level to an average of $2.11/gal during the
fourth quarter of 2015. EIA forecasts U.S. regular gaso-
line retail prices to average $2.41/gal for all of 2015.
EIA estimates total U.S. crude oil production declined by
100,000 barrels per day (b/d) in July compared with
June. Production is expected to continue decreasing
through mid-2016 before growth resumes late in 2016.
Projected U.S. crude oil production averages 9.4 million
b/d in 2015 and 9.0 million b/d in 2016, 0.1 million b/d
and 0.4 million b/d lower, respectively, than in July's
STEO.
Natural gas working inventories were 2,912 billion cubic
feet (Bcf) on July 31, which was 23% higher than a year
earlier and 2% higher than the previous five-year aver-
age (2010-14). EIA projects inventories will close the
injection season at the end of October at 3,867 Bcf,
which would be the second-highest end-of-October level
on record.
U.S. population-weighted cooling degree days through
the end of July were 14% more than in the same period
last year. The hotter temperatures contribute to an EIA
estimate that the typical residential electricity customer
will use 3,134 kilowatthours in the months of June, July,
and August this year, which is 4% more than during the
same period in 2014.
* All prices from August 2015 are estimated.
$2.0
$2.5
$3.0
$3.5
$4.0
$4.5
$5.0
$5.5
$6.0
$6.5
Natural Gas, Dollars/Mil. BTUs
$40
$50
$60
$70
$80
$90
$100
$110
$120
Crude Oil, Dollars per BarrelCrude oil - Cushing OK WTI, $/barrel
$2.00
$2.25
$2.50
$2.75
$3.00
$3.25
$3.50
$3.75
$4.00
U.S. Regular-grade Retail Gasoline, Dollars per Gallon
Short-Term Energy Outlook
6
6
Bunzl Distribution Newsletter | Commodity Watch August 2015
Sources: http://www.x-rates.com/
http://www.oanda.com/currency/converter/
0.70
0.75
0.80
0.85
0.90
0.95Euro, per 1 USD
8,500
9,500
10,500
11,500
12,500
13,500
14,500Indonesian Rupiah, per 1 USD
31.50
32.00
32.50
33.00
33.50
34.00
34.50Thai Baht, per 1 USD
20,700
20,900
21,100
21,300
21,500
21,700
21,900Vietnamese Dong, per 1 USD
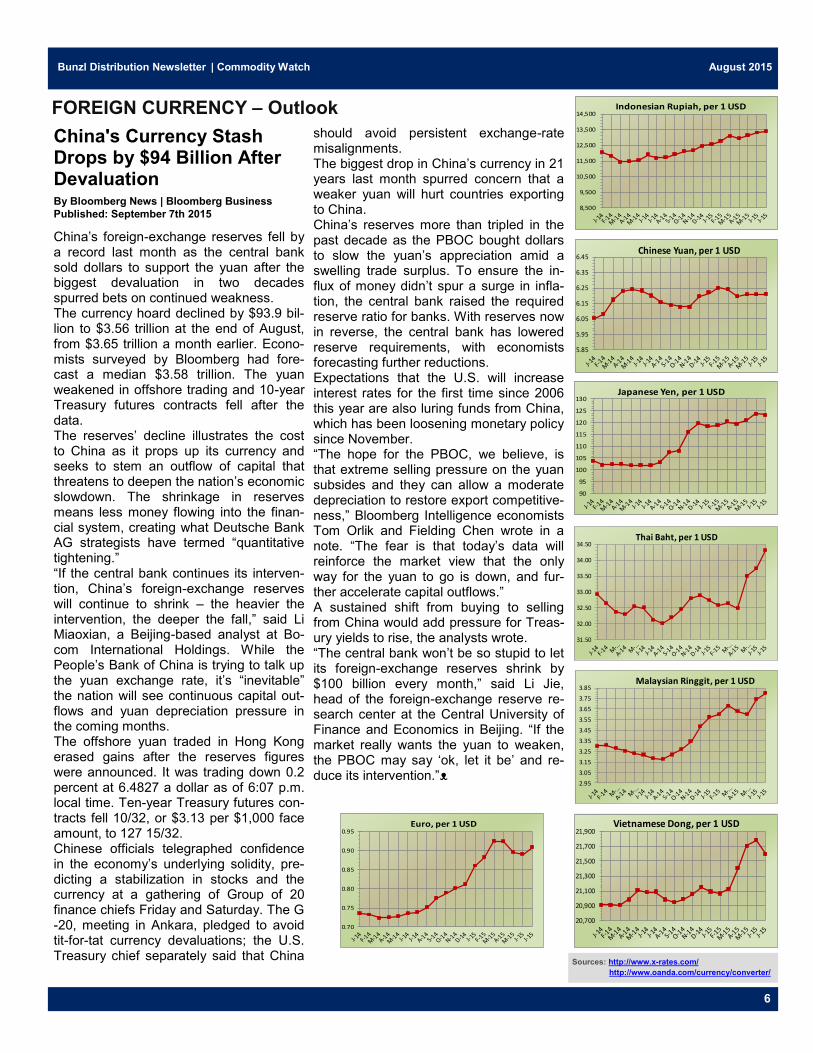
FOREIGN CURRENCY – Outlook
5.85
5.95
6.05
6.15
6.25
6.35
6.45Chinese Yuan, per 1 USD
2.95
3.05
3.15
3.25
3.35
3.45
3.55
3.65
3.75
3.85Malaysian Ringgit, per 1 USD
China's Currency Stash Drops by $94 Billion After Devaluation
By Bloomberg News | Bloomberg Business
Published: September 7th 2015
China’s foreign-exchange reserves fell by a record last month as the central bank sold dollars to support the yuan after the biggest devaluation in two decades spurred bets on continued weakness. The currency hoard declined by $93.9 bil-lion to $3.56 trillion at the end of August, from $3.65 trillion a month earlier. Econo-mists surveyed by Bloomberg had fore-cast a median $3.58 trillion. The yuan weakened in offshore trading and 10-year Treasury futures contracts fell after the data. The reserves’ decline illustrates the cost to China as it props up its currency and seeks to stem an outflow of capital that threatens to deepen the nation’s economic slowdown. The shrinkage in reserves means less money flowing into the finan-cial system, creating what Deutsche Bank AG strategists have termed “quantitative tightening.” “If the central bank continues its interven-tion, China’s foreign-exchange reserves will continue to shrink – the heavier the intervention, the deeper the fall,” said Li Miaoxian, a Beijing-based analyst at Bo-com International Holdings. While the People’s Bank of China is trying to talk up the yuan exchange rate, it’s “inevitable” the nation will see continuous capital out-flows and yuan depreciation pressure in the coming months. The offshore yuan traded in Hong Kong erased gains after the reserves figures were announced. It was trading down 0.2 percent at 6.4827 a dollar as of 6:07 p.m. local time. Ten-year Treasury futures con-tracts fell 10/32, or $3.13 per $1,000 face amount, to 127 15/32. Chinese officials telegraphed confidence in the economy’s underlying solidity, pre-dicting a stabilization in stocks and the currency at a gathering of Group of 20 finance chiefs Friday and Saturday. The G-20, meeting in Ankara, pledged to avoid tit-for-tat currency devaluations; the U.S. Treasury chief separately said that China
should avoid persistent exchange-rate misalignments. The biggest drop in China’s currency in 21 years last month spurred concern that a weaker yuan will hurt countries exporting to China. China’s reserves more than tripled in the past decade as the PBOC bought dollars to slow the yuan’s appreciation amid a swelling trade surplus. To ensure the in-flux of money didn’t spur a surge in infla-tion, the central bank raised the required reserve ratio for banks. With reserves now in reverse, the central bank has lowered reserve requirements, with economists forecasting further reductions. Expectations that the U.S. will increase interest rates for the first time since 2006 this year are also luring funds from China, which has been loosening monetary policy since November. “The hope for the PBOC, we believe, is that extreme selling pressure on the yuan subsides and they can allow a moderate depreciation to restore export competitive-ness,” Bloomberg Intelligence economists Tom Orlik and Fielding Chen wrote in a note. “The fear is that today’s data will reinforce the market view that the only way for the yuan to go is down, and fur-ther accelerate capital outflows.” A sustained shift from buying to selling from China would add pressure for Treas-ury yields to rise, the analysts wrote. “The central bank won’t be so stupid to let its foreign-exchange reserves shrink by $100 billion every month,” said Li Jie, head of the foreign-exchange reserve re-search center at the Central University of Finance and Economics in Beijing. “If the market really wants the yuan to weaken, the PBOC may say ‘ok, let it be’ and re-duce its intervention.”ᴥ
90
95
100
105
110
115
120
125
130Japanese Yen, per 1 USD

7
7
Bunzl Distribution Newsletter | Commodity Watch August 2015
Goodbye To All That Continued from pg. 1
The real curse for producers is over-supply in almost all
raw materials. Yet they continue to act as if they are
blithely unaware of it. Capital is still pouring into holes in
the ground, creating a hangover that may last at least a
decade. Jeff Currie of Goldman Sachs, a bank, says past
cycles suggest it can take up to 15 years to work through
the over-investment. “The world has just flip-flopped,” he
says.
Analysts point out that not all commodities act the same
way. Coal prices started falling in 2011; crude oil hung on
until mid-2014; agricultural prices hinge on the weather.
But a generalised whiff of fear about China’s economic
prospects has re-emerged in recent weeks, partly caused
by sliding stockmarkets and by the unexpected devalua-
tion of the yuan this month. So far this year, almost all ma-
jor commodities – energy, industrial metals and agriculture
– have fallen in a 10-20% range, a fairly homogenous per-
formance. What’s more, the supply glut is being fed by
three common factors. Cost-cutting has led producers to
think they can bear the pain of falling prices for longer.
Heavy hitters, whether OPEC princes or global miners,
still yearn to increase market share. And funding is still
available.
The cost cuts are part of a self-reinforcing downward spi-
ral. Outside America, cheap currencies vis-à-vis the dollar
have made domestic inputs, such as manpower, appear
less pricey. Ironically, cheaper energy and steel help, too.
In Australia, for example, Gina Rinehart, a mining tycoon,
uses low costs to justify opening a $13 billion mine in the
outback that is expected to produce 55m tonnes of iron
ore a year – as much as America’s annual output.
In the oil world, cost cuts have come from producers once
thought likely to be wiped out by falling oil prices: shale
producers. “Frackers” have slashed a third off their cost
bases, and continue to pump enough black stuff to de-
press prices. Lower costs may give them a false sense of
security about where prices will go: when crude prices
temporarily ticked higher in America this spring, the num-
ber of drilling rigs rose for the first time since December.
Shortly afterward prices fell again.
Among drilling titans, efforts to recoup market share from
fracking upstarts can appear counterproductive. Led by
Saudi Arabia, OPEC is pumping well above its 30m barrel-
a-day quota, helping push crude prices to below $47 a
barrel on August 19th, just about the lowest level since
March 2009. But if it intended to strangle American shale
producers, its plan has backfired, instead pushing frackers
to become more efficient. Meanwhile global miners such
as BHP Billiton and Rio Tinto have continued to increase
iron-ore production, despite plunging prices. Analysts say
they are trying to drive higher-cost competitors in China
and elsewhere out of business.
Funding avenues have not closed down, however. Tomás
Gutiérrez of Kallanish Commodities, an industry watcher,
notes that in China steel output has only recently peaked.
Yet rather than facing
bankruptcy, many
inefficient steel pro-
ducers are limping
along thanks to local-
government support.
Their surpluses are
exported, adding to
the pressure on glob-
al steel prices (see
chart 2).
In the oil industry Goldman’s Mr Currie says that, unusual-
ly, high-cost output, such as Canada’s tar sands, is owned
by oil majors with strong balance-sheets. Though they
have cut spending, it may take longer to shut down entire
projects.
Eventually stresses will manifest themselves more violent-
ly. Small shale producers may find themselves in a pickle
unless prices stop falling. Deutsche Bank notes that ener-
gy companies account for about one in six of America’s
high-yield borrowers. It believes American crude prices
below $55 a barrel may push them into financial distress.
OPEC has its own invalids, such as Venezuela, Nigeria
and Libya.
But the latest leg down in crude prices may not yet have
run its course. Saudi Arabia, the all-important swing pro-
ducer of the cartel, is deaf to talk of a cutback. Earlier this
month it raised $5 billion to offset flagging oil income.
America’s summer driving season is ending. If an Iran nu-
clear deal is ratified by America’s Congress next month,
8
8
Bunzl Distribution Newsletter | Commodity Watch August 2015
Goodbye To All That Continued from pg. 7
once-embargoed oil will start flowing. Glencore, an Anglo-
Swiss miner and commodities trader, reported whopping
losses on August 19th. Its boss, Ivan Glasenberg, has
railed against rivals unwilling to throttle back production
and decried “prices that are still not making any sense”.
If these are daunting headwinds, they are not unusual.
When prices fall far enough for long enough, output does
eventually decline, as it started to do with nickel last year.
In the meantime, big mining and oil firms will take over
smaller ones and shut down their weakest assets. Then
another decades-long cycle can start.ᴥ
Prices Fall Continued from pg. 1
North American PE makers now have taken the almost
unprecedented step of advising their customers that prices
are expected to decline by 4 cents per pound in Septem-
ber. Market sources said this likely is an attempt to stop
prices from falling even farther in light of recent stock mar-
ket volatility, which has threatened to destabilize global
economies.
Oil prices remain a global price-setter for PE, even though
most PE made in North America is derived from natural
gas. West Texas Intermediate oil prices were above $45
per barrel on Aug. 1, but were near $39 per barrel by the
end of the month, for a drop of about 13 percent. Prices
since then have rebounded to above $46 in late trading
Sept. 2.
Abundant supplies of PE also played a role in the 5-cent
price drop, according to Mike Burns, a PE market analyst
with Resin Technology Inc. in Fort Worth, Texas.
“There are no supply issues for polyethylene or ethylene,”
Burns said in a phone interview. “You can almost say that
globally.”
PE demand remains solid
PE demand growth in the U.S. and Canada remained solid
through July, according to the American Chemistry Council
in Washington. High density PE sales in the region were up
almost 6 percent in that seven-month period, with domestic
growth of 2 percent boosted by a gain of almost 29 percent
in export sales.
For low density PE, seven-month sales ticked up almost 2
percent, with 3.5 percent domestic growth hampered by a
loss of more than 4 percent in export sales. The linear low
density PE market fared better, with sales up almost 6 per-
cent in that time frame. Domestic LLDPE growth of almost
7 percent was softened by growth of only 2 percent in the
export market.
The August PP decline averaged 2 cents per pound, alt-
hough that amount could vary, depending on how much of
a decrease buyers saw in July. The two-month July-August
dip totaled 3 cents per pound. Some saw that move in 1.5-
cent increments, others saw 1 cent in July and 2 in August,
or vice versa.
The August PP drop was the second straight month prices
for the material have fallen and the third decline in four
months. Regional PP prices now are down a net of 17
cents per pound so far in 2015.
At the same time, PP makers in the region have been able
to increase their profit margins by about 10 cents per
pound in 2015. They’ve done so by lowering prices by less
than the amounts that propylene monomer feedstock pric-
es have fallen. By comparison, producers only gained 1
cent in margin per year in 2013 and 2014.
Tight PP supplies
They’ve been able to take that step because of tight sup-
plies of PP in the region, according to Scott Newell, a PP
market analyst with RTI. “Operating rates [for PP] are as
high as we’ve seen in many years,” he said by phone.
“They’re above 92 percent for the year and in these last
couple of months have been close to 95 percent. Supply is
tight, and when you add in some production issues and
other dynamics, things can get pinched here and there.”
North American PP growth was solid in the first seven
months of 2015, growing 5.3 percent. A 5.9 percent do-
mestic growth rate was dampened by a 10 percent slide in
export sales.
Regional PS prices tumbled an average of 2 cents per
pound in August. Some buyers reported 3 cent drops, but 2
seemed to be the market average and is being shown on
this week’s Plastics News resin pricing chart. That drop
came only a month after prices rose 6 cents, prompted by
higher prices for benzene feedstock.

9
9
Bunzl Distribution Newsletter | Commodity Watch August 2015
Prices Fall For Most Commodity
Resins Continued from pg. 8
Benzene prices for August, however, fell about 8 percent
to $2.80 per gallon, sending PS resin prices down as well.
Regional PS prices now are down a net of 4 cents per
pound in 2015.
PS suppliers announce decreases
The region’s three major PS makers had pre-announced
price decreases for August. The market apparently was
able to hold to the 2-cent drops announced by Americas
Styrenics and Styrolution instead of the 3-cent decline of-
fered by Total Petrochemicals.
North American PS sales through July essentially were flat
vs. the year-ago period. Sales into the market’s leading
food packaging/food service sector grew 2 percent in those
seven months.
For PVC, prices ticked down an average of 1 cent per
pound as seasonal construction activity began to slow in
the region. Prior to that decline, prices for the material had
been flat for four consecutive months. The 1-cent August
drop now has regional PVC prices right back where they
started on Jan. 1.
U.S./Canadian PVC sales essentially were flat through
July, as a gain of almost 3 percent in export sales was
canceled out by a decline of almost 2 percent for sales into
the domestic market. Sales into PVC’s flagship rigid pipe
and tubing market also were essentially flat for the seven-
month period.
PET bottle resin’s 4-cent August drop wiped out a 3-cent
hike that some buyers saw in June and others saw in July.
In August, some buyers reported a 5-cent price drop, but 4
seemed to the number seen by most buyers and is being
shown on this week’s PN chart.
For the year, North American PET prices now are up a net
of 2 cents per pound. The market continues to struggle
with lower consumption of carbonated soft drinks and with
increased use of thinner water bottles that use less PET
per unit.ᴥ
Copyright © 2013 Bunzl Distribution USA, Inc. All rights reserved. This document is the property of Bunzl and its affiliated companies, and is intended only for the person(s) or entity to which it is ad-dressed and may contain confidential and/or privileged information. It may not be reproduced, distributed or otherwise made available to other parties without the explicit written approval of Bunzl and its
legal department. Information has been obtained from sources believed reliable. However, because of the possibility of human or mechanical error by sources, Bunzl or others, Bunzl does not guarantee the accuracy, adequacy or completeness of any such information and is not responsible for any errors or omissions or for results obtained from use of such information.