commodity revenue management: coffee and cotton · pdf filecommodity revenue management:...
TRANSCRIPT
Commodity Revenue Management: Coffee and Cotton in Uganda Moses Masiga Alice Ruhweza YOMA Consultants May 2007
© 2007 International Institute for Sustainable Development (IISD) Published by the International Institute for Sustainable Development The International Institute for Sustainable Development contributes to sustainable development by advancing policy recommendations on international trade and investment, economic policy, climate change, measurement and assessment, and natural resources management. Through the Internet, we report on international negotiations and share knowledge gained through collaborative projects with global partners, resulting in more rigorous research, capacity building in developing countries and better dialogue between North and South. IISD’s vision is better living for all—sustainably; its mission is to champion innovation, enabling societies to live sustainably. IISD is registered as a charitable organization in Canada and has 501(c)(3) status in the United States. IISD receives core operating support from the Government of Canada, provided through the Canadian International Development Agency (CIDA), the International Development Research Centre (IDRC) and Environment Canada; and from the Province of Manitoba. The institute receives project funding from numerous governments inside and outside Canada, United Nations agencies, foundations and the private sector. International Institute for Sustainable Development 161 Portage Avenue East, 6th Floor Winnipeg, Manitoba Canada R3B 0Y4 Tel: +1 (204) 958–7700 Fax: +1 (204) 958–7710 E-mail: [email protected] Web site: http://www.iisd.org/ Tackling Commodity Price Volatility This paper is published as part of a larger project, sponsored by the Norwegian Government, on policy options to tackle the problem of commodity price volatility. More research and papers can be found at http://www.iisd.org/trade/commodities/price.asp

i
Contents Abbreviations and Acronyms............................................................................................ ii Summary ........................................................................................................................... iii 1.0 Introduction ........................................................................................................... 1
1.1 History of coffee marketing in Uganda..................................................................1 1.2 History of cotton marketing in Uganda .................................................................4
2.0 Genesis of Commodity Revenue Risk ................................................................. 6 2.1 Commodity dependence and a history of political and economic turmoil ..............6
2.1.1. Coffee...............................................................................................................6 2.1.2 Cotton ...............................................................................................................7
2.2 Trends in coffee and cotton prices and their impacts livelihoods...........................7 2.2.1 Coffee................................................................................................................7 2.2.2 Cotton ...............................................................................................................8
3.0 Approaches to Managing Commodity Revenues ............................................. 11 3.1 Commodity marketing boards.........................................................................11 3.2 Farmers’ cooperatives, futures and option markets.......................................11 3.3 Liberalization of commodity trade..................................................................12 3.4 Diversification...................................................................................................12 3.5 Alternative market channels ............................................................................12 3.6 Vertical integration and emerging market opportunities..............................13 3.7 Strategic Export Programme: Government subsidies for export supply chains 13 3.8 Compensatory financing ..................................................................................14 3.9 International agreements ................................................................................14 3.10 Warehouse receipts systems ............................................................................14 3.11 Commodity exchange ......................................................................................15
4.0 Recommendations............................................................................................... 16 References ........................................................................................................................ 18 List of Figures Figure 1: Map of Uganda showing geographical boundaries of districts…………………......2 Figure 2: Coffee trade structure before liberalization.....................................................................3 Figure 3: Coffee trade structure post liberalization.........................................................................4 Figure 4: Price and production trends of coffee between 1970–71 and 2005–06......................8 Figure 5: Price and production trends of cotton between 1970–71 and 2005–06 .....................9 List of Tables Table 1: Coffee and cotton export values and per cent of total exports, 1986–2006................7 Table 2: Export of coffee and cotton 2001–02 to 2005–06 ........................................................10
ii
Abbreviations and Acronyms ACP Africa Caribbean and Pacific countries AGOA African Growth and Opportunity Act BOU Bank of Uganda CDO Cotton Development Organization CMB Coffee Marketing Board CSDP Cotton Sub-sector Development Project ERP Economic Reform Programme EU European Union ICO International Coffee Organization IDA International Development Agency IFAD International Fund for Agricultural Development IISD International Institute for Sustainable Development IMF International Monetary Fund LMB Lint Marketing Board MAAIF Ministry of Agriculture, Animal Industry and Fisheries MFPED Ministry of Finance Planning and Economic Development NARO National Agricultural Research Organisation NYBOT New York Board of Trade PAF Poverty Action Fund PEAP Poverty Eradication Action Plan PMA Plan for Modernisation of Agriculture SAPs structural adjustment plans SCRP Smallholders Cotton Rehabilitation Project UCA Uganda Cooperative Alliance UCDA Uganda Coffee Development Authority UCE Uganda Commodity Exchange UCFA Uganda Commercial Farmers Association UCGEA Uganda Cotton Ginners and Exporters Association UCTF Uganda Coffee Traders Federation UNFFE Uganda National Farmers Federation USAID United States Agency for International Development
iii
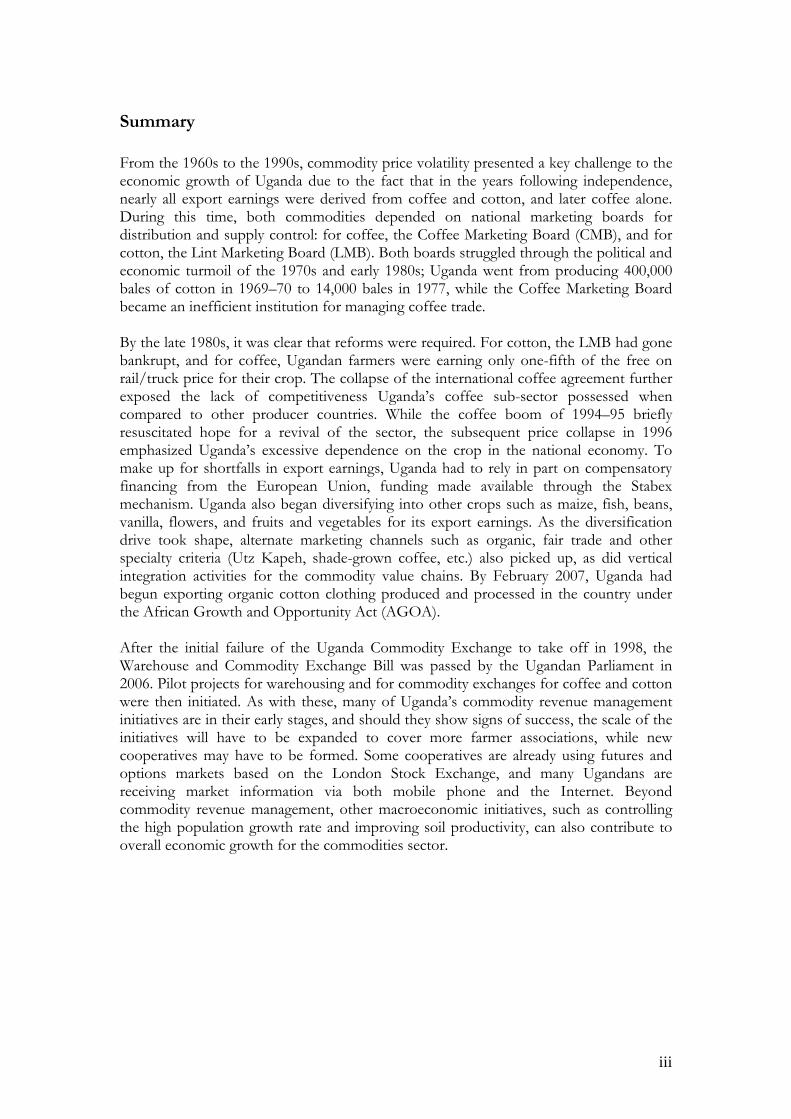
Summary From the 1960s to the 1990s, commodity price volatility presented a key challenge to the economic growth of Uganda due to the fact that in the years following independence, nearly all export earnings were derived from coffee and cotton, and later coffee alone. During this time, both commodities depended on national marketing boards for distribution and supply control: for coffee, the Coffee Marketing Board (CMB), and for cotton, the Lint Marketing Board (LMB). Both boards struggled through the political and economic turmoil of the 1970s and early 1980s; Uganda went from producing 400,000 bales of cotton in 1969–70 to 14,000 bales in 1977, while the Coffee Marketing Board became an inefficient institution for managing coffee trade. By the late 1980s, it was clear that reforms were required. For cotton, the LMB had gone bankrupt, and for coffee, Ugandan farmers were earning only one-fifth of the free on rail/truck price for their crop. The collapse of the international coffee agreement further exposed the lack of competitiveness Uganda’s coffee sub-sector possessed when compared to other producer countries. While the coffee boom of 1994–95 briefly resuscitated hope for a revival of the sector, the subsequent price collapse in 1996 emphasized Uganda’s excessive dependence on the crop in the national economy. To make up for shortfalls in export earnings, Uganda had to rely in part on compensatory financing from the European Union, funding made available through the Stabex mechanism. Uganda also began diversifying into other crops such as maize, fish, beans, vanilla, flowers, and fruits and vegetables for its export earnings. As the diversification drive took shape, alternate marketing channels such as organic, fair trade and other specialty criteria (Utz Kapeh, shade-grown coffee, etc.) also picked up, as did vertical integration activities for the commodity value chains. By February 2007, Uganda had begun exporting organic cotton clothing produced and processed in the country under the African Growth and Opportunity Act (AGOA). After the initial failure of the Uganda Commodity Exchange to take off in 1998, the Warehouse and Commodity Exchange Bill was passed by the Ugandan Parliament in 2006. Pilot projects for warehousing and for commodity exchanges for coffee and cotton were then initiated. As with these, many of Uganda’s commodity revenue management initiatives are in their early stages, and should they show signs of success, the scale of the initiatives will have to be expanded to cover more farmer associations, while new cooperatives may have to be formed. Some cooperatives are already using futures and options markets based on the London Stock Exchange, and many Ugandans are receiving market information via both mobile phone and the Internet. Beyond commodity revenue management, other macroeconomic initiatives, such as controlling the high population growth rate and improving soil productivity, can also contribute to overall economic growth for the commodities sector.
1
1.0 Introduction Commodity price volatility has been on the international development agenda since the 1950s. The problems are well studied; high revenues tend to distort fiscal responsibility and monetary policy, and encourage rampant corruption, while a slump in prices can lead to a reduction in government and producer revenues, unemployment and a decline in government spending on education and health. While developed country producers are supported by subsidies and social safety nets, developing countries and smallholder producers feel the effects of commodity price volatility much more directly (Brown and Gibson, 2006). These effects, and the mechanisms employed by the Ugandan government and people to address them, are the central focus of this paper. In the first section of this report, we will discuss the history of coffee and cotton marketing in Uganda. We will then examine commodity revenue and price volatility risk for these two commodities, and some of the approaches taken to manage this risk. The fourth and final section presents our recommendations for coffee and cotton revenue management in Uganda.
1.1 History of coffee marketing in Uganda
Uganda produces two types of coffee: Arabica coffee (Coffea arabica), which comprises about 70 per cent of the world’s coffee production but only 10 per cent of Uganda’s coffee production; and Robusta coffee (Coffea canephora), which comprises about 30 per cent of the world’s production and 90 per cent of Uganda’s production. Robusta coffee is indigenous to Uganda in the central parts of the country, while Arabica coffee was introduced by the British colonial authorities at the turn of the twentieth century. Robusta is grown in the central part of Uganda in the Lake Victoria crescent, and across the west, south-west, and east of the country. Arabica beans1 are grown at higher altitude, in the areas of Mount Elgon along Uganda’s western border with Kenya and in south-western Uganda along the Rwenzori mountain range. This widespread cultivation places Uganda among the top 10 coffee-producing countries in the world and second only to Ethiopia among the Africa, Caribbean and Pacific (ACP) countries (CTA, 2006). Ugandan Robusta beans are uncharacteristically hard, giving them good roasting qualities. The beans are typically grown in the absence of chemical fertilizers by rooted cuttings and elite seeds. They have a mild, soft, sweet and neutral taste, and have high frothing properties suitable for popular drinks such as espressos. Uganda’s Arabica also has strong market qualities; it is wet processed (washed) to produce a mild coffee more popular with most consumers.
1 Robustas have the advantage that they have higher yields (2,300–4,000 kg/ha) than Arabica (1,500–3,000 kg/ha) but the disadvantage is they fetch little more than half the price (CTA, 2006)
2
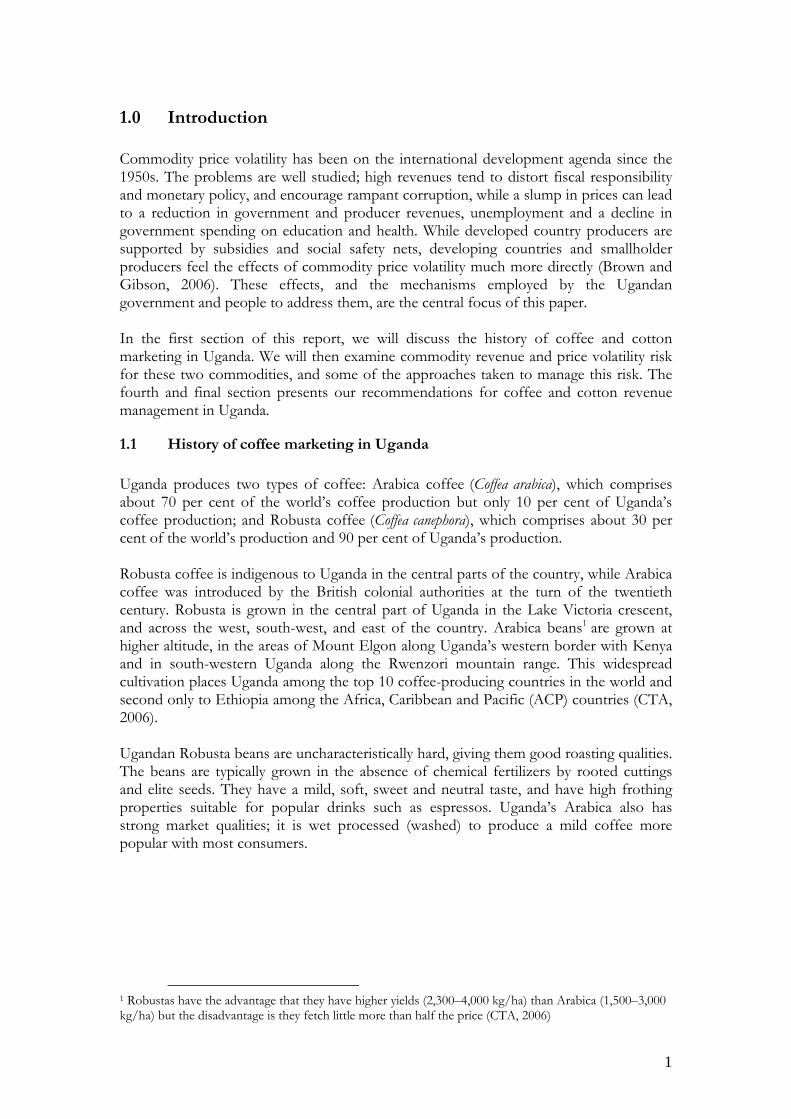
Figure 1: Map of Uganda showing geographical boundaries of districts
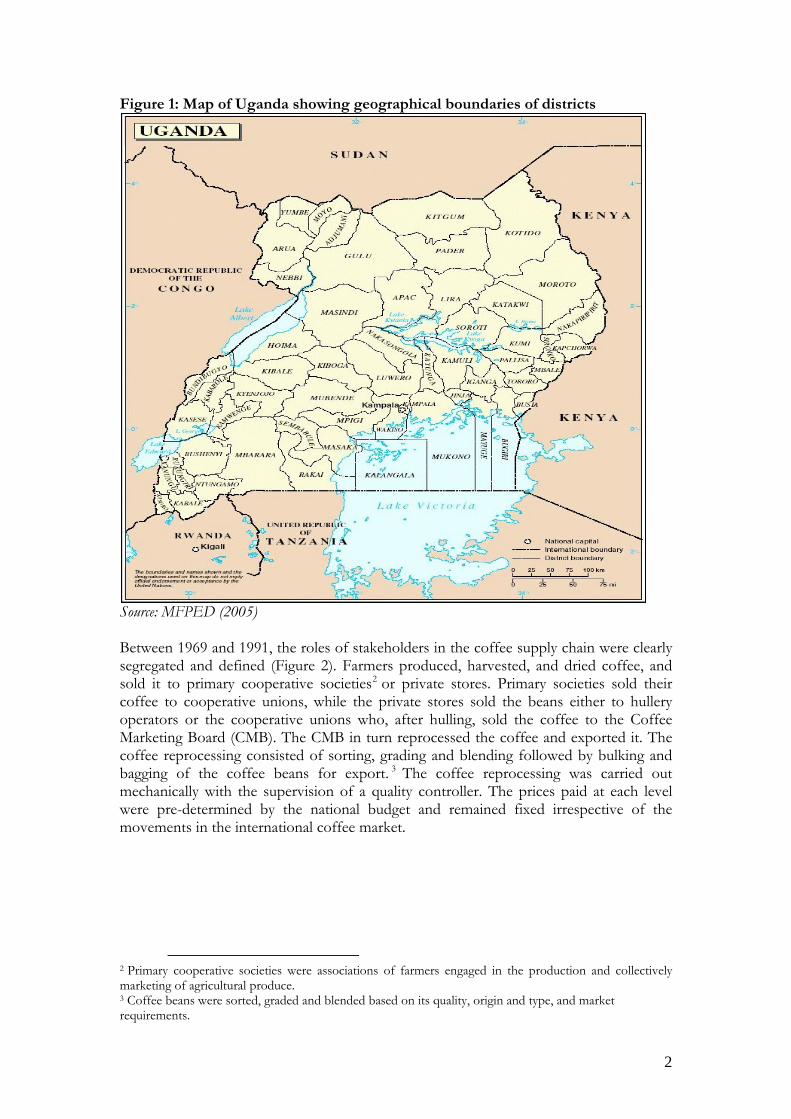
Source: MFPED (2005) Between 1969 and 1991, the roles of stakeholders in the coffee supply chain were clearly segregated and defined (Figure 2). Farmers produced, harvested, and dried coffee, and sold it to primary cooperative societies2 or private stores. Primary societies sold their coffee to cooperative unions, while the private stores sold the beans either to hullery operators or the cooperative unions who, after hulling, sold the coffee to the Coffee Marketing Board (CMB). The CMB in turn reprocessed the coffee and exported it. The coffee reprocessing consisted of sorting, grading and blending followed by bulking and bagging of the coffee beans for export. 3 The coffee reprocessing was carried out mechanically with the supervision of a quality controller. The prices paid at each level were pre-determined by the national budget and remained fixed irrespective of the movements in the international coffee market.
2 Primary cooperative societies were associations of farmers engaged in the production and collectively marketing of agricultural produce. 3 Coffee beans were sorted, graded and blended based on its quality, origin and type, and market requirements.
3
Figure 2: Coffee trade structure before liberalization
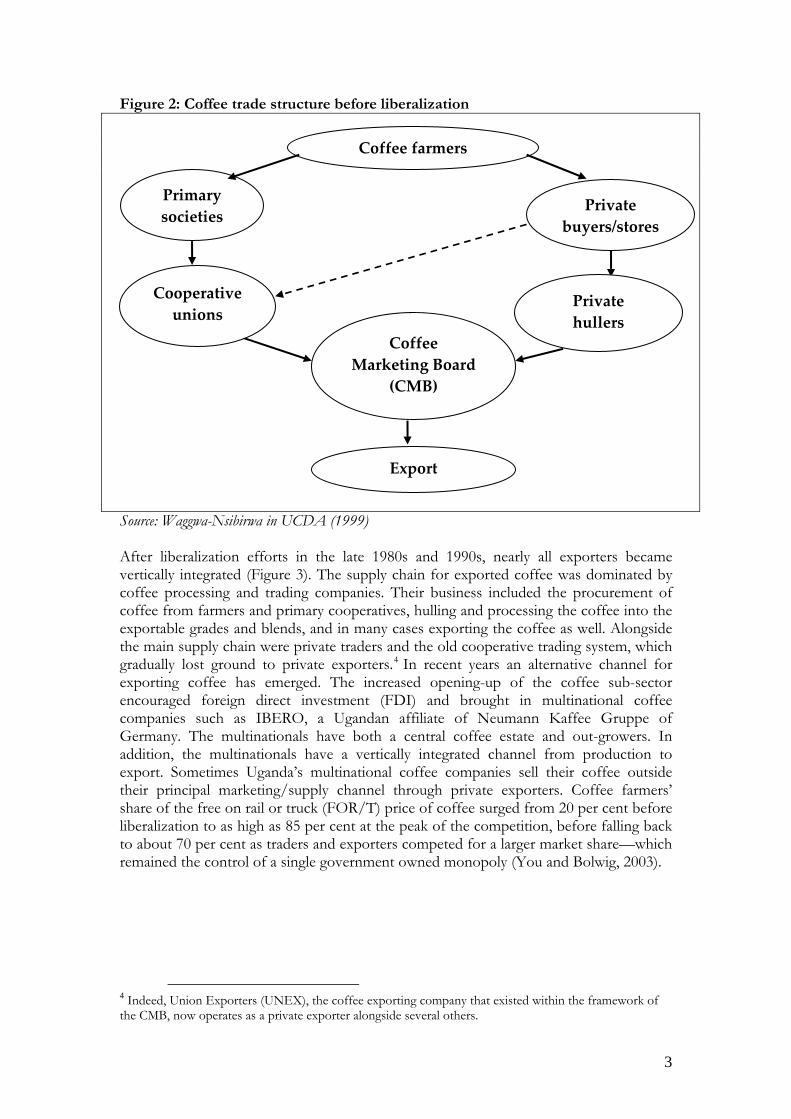
Source: Waggwa-Nsibirwa in UCDA (1999) After liberalization efforts in the late 1980s and 1990s, nearly all exporters became vertically integrated (Figure 3). The supply chain for exported coffee was dominated by coffee processing and trading companies. Their business included the procurement of coffee from farmers and primary cooperatives, hulling and processing the coffee into the exportable grades and blends, and in many cases exporting the coffee as well. Alongside the main supply chain were private traders and the old cooperative trading system, which gradually lost ground to private exporters.4 In recent years an alternative channel for exporting coffee has emerged. The increased opening-up of the coffee sub-sector encouraged foreign direct investment (FDI) and brought in multinational coffee companies such as IBERO, a Ugandan affiliate of Neumann Kaffee Gruppe of Germany. The multinationals have both a central coffee estate and out-growers. In addition, the multinationals have a vertically integrated channel from production to export. Sometimes Uganda’s multinational coffee companies sell their coffee outside their principal marketing/supply channel through private exporters. Coffee farmers’ share of the free on rail or truck (FOR/T) price of coffee surged from 20 per cent before liberalization to as high as 85 per cent at the peak of the competition, before falling back to about 70 per cent as traders and exporters competed for a larger market share—which remained the control of a single government owned monopoly (You and Bolwig, 2003).
4 Indeed, Union Exporters (UNEX), the coffee exporting company that existed within the framework of the CMB, now operates as a private exporter alongside several others.
Primary societies
Coffee Marketing Board
(CMB)
Export
Private hullers
Coffee farmers
Private buyers/stores
Cooperative unions
4
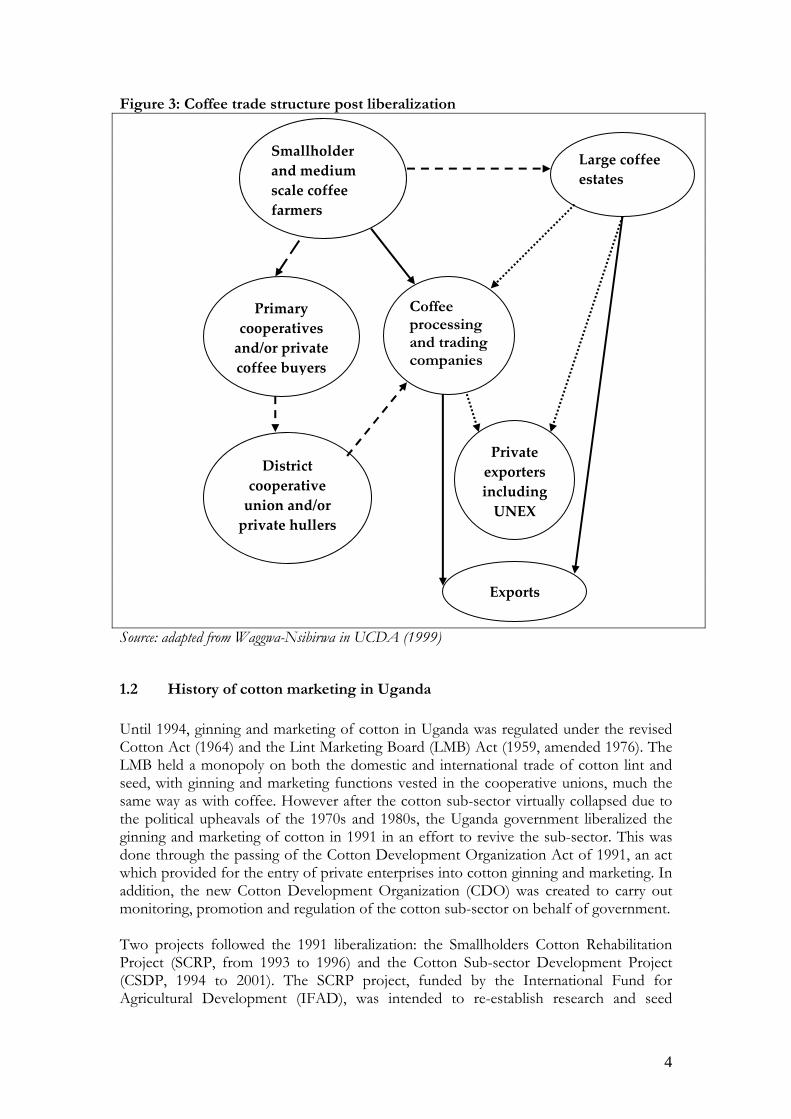
Figure 3: Coffee trade structure post liberalization
Source: adapted from Waggwa-Nsibirwa in UCDA (1999)
1.2 History of cotton marketing in Uganda
Until 1994, ginning and marketing of cotton in Uganda was regulated under the revised Cotton Act (1964) and the Lint Marketing Board (LMB) Act (1959, amended 1976). The LMB held a monopoly on both the domestic and international trade of cotton lint and seed, with ginning and marketing functions vested in the cooperative unions, much the same way as with coffee. However after the cotton sub-sector virtually collapsed due to the political upheavals of the 1970s and 1980s, the Uganda government liberalized the ginning and marketing of cotton in 1991 in an effort to revive the sub-sector. This was done through the passing of the Cotton Development Organization Act of 1991, an act which provided for the entry of private enterprises into cotton ginning and marketing. In addition, the new Cotton Development Organization (CDO) was created to carry out monitoring, promotion and regulation of the cotton sub-sector on behalf of government. Two projects followed the 1991 liberalization: the Smallholders Cotton Rehabilitation Project (SCRP, from 1993 to 1996) and the Cotton Sub-sector Development Project (CSDP, 1994 to 2001). The SCRP project, funded by the International Fund for Agricultural Development (IFAD), was intended to re-establish research and seed
Smallholder and medium scale coffee farmers
Primary cooperatives and/or private coffee buyers
Coffee processing and trading companies
District cooperative union and/or private hullers
Exports
Private exporters including UNEX
Large coffee estates
5
multiplication, and to develop animal traction in the sub-sector. The CSDP project, also funded by IFAD along with the World Bank (through the International Development Agency) and the government of Uganda, was aimed at improving the regulatory environment and promotion of cotton policy coordination between the work of the Ministry of Agriculture, Animal Industry and Fisheries (MAAIF), research managed by the National Research Organization (NARO), and credit provision managed by the Bank of Uganda (BOU). By the end of the two projects, Uganda’s cotton exports had increased by about 10 per cent per year between 1994 and 2000 (RATES, 2003; COMPETE, 2002).
6
2.0 Genesis of Commodity Revenue Risk
2.1 Commodity dependence and a history of political and economic turmoil
From independence in 1962, Uganda inherited an economy based on agriculture, consisting of smallholder agricultural exports centred on coffee and cotton (Fagernas and Roberts, 2004). During the 1970s, the presidency of Idi Amin was characterized by several fiscal and monetary policy distortions; with taxes on transactions and exports escalating, the country’s export base shrank. Inflationary pressures increased, as did deficits, and the Ugandan shilling became grossly over valued; price controls were soon introduced to try to contain the inflation. More political instability followed the overthrow of Amin in 1979, culminating in two military coups, the first in 1985 to remove Dr. Milton Obote, and the second in 1986 to bring to power current President Yoweri Museveni. In 1987, Uganda embarked on the Economic Recovery Programme (ERP), which aimed to strengthen Uganda’s export competitiveness, reform the national agriculture policy, attract foreign direct investment (FDI), and improve the effectiveness of fiscal and monetary policy. The recovery and growth strategies have been decidedly pro-poor, with the head count index5 of total poverty declining from 56 per cent in 1992–93 to 34 per cent in 1999–20006. Much of this progress has been felt outside of the cities: the rural poverty headcount declined from 60 per cent in 1992 to 37 per cent in 2000, before rising to 42 per cent in 2003 (Okidi et al., 2005).
2.1.1. Coffee
The Ugandan coffee sub-sector has a large geographic and socio-economic foot print. Coffee is said to have contributed an average of US$245 million per year for the last 25 years to Uganda’s national foreign exchange earnings (Kasozi, 2006). Approximately 500,000 smallholder families are engaged directly in its production, with over seven million people depending on the crop for their livelihoods—representing more than one-quarter of Uganda’s population (Lewin et al.., 2004). Despite coffee’s continued importance to a number of Ugandans, the country’s dependence on it as the main source of its export income has declined over time, from a high of over 95 per cent in the 1980s to just 20 per cent by 2006 (Table 1). Non-traditional exports have filled this gap, with 60 per cent of the export revenues. However, the poverty effects of non-traditional agricultural exports were very limited given that they engage only a small segment of the population: about five per cent for fisheries, less than one per cent in the horticulture sub-sector and while maize and beans are grown by about 20 per cent of the population, only a small fraction (US$10 million) is exported (Keizire, 2004; MFPED, 2006; UBOS, 2006). Deninger and Okidi (2003) suggested that had coffee prices been 10 per cent higher during the 1990s there would have been an additional six per cent decline in poverty by 1999/2000 (Okidi et al., 2005).
5 The head count measure of poverty gives the proportion of households whose per capita income falls below an established poverty line. 6 Poverty subsequently increased to 38 per cent in 2002/03 (Okidi et al., 2005).
7
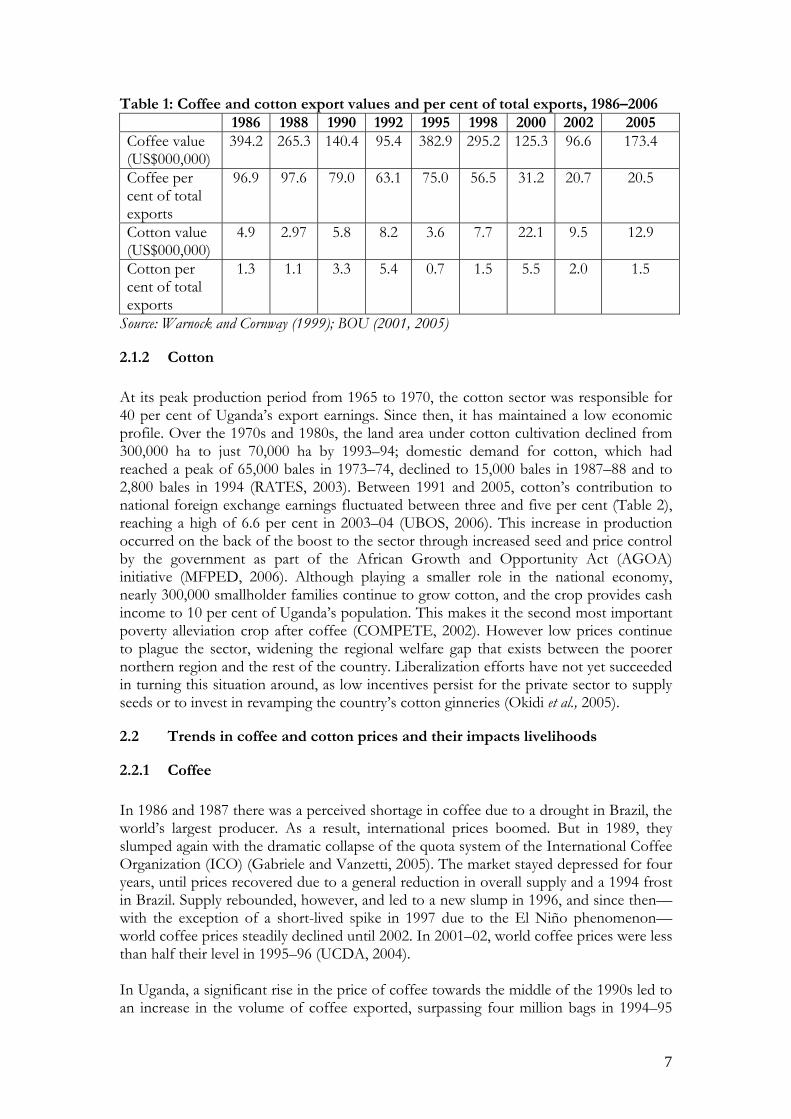
Table 1: Coffee and cotton export values and per cent of total exports, 1986–2006 1986 1988 1990 1992 1995 1998 2000 2002 2005 Coffee value (US$000,000)
394.2 265.3 140.4 95.4 382.9 295.2 125.3 96.6 173.4
Coffee per cent of total exports
96.9 97.6 79.0 63.1 75.0 56.5 31.2 20.7 20.5
Cotton value (US$000,000)
4.9 2.97 5.8 8.2 3.6 7.7 22.1 9.5 12.9
Cotton per cent of total exports
1.3 1.1 3.3 5.4 0.7 1.5 5.5 2.0 1.5
Source: Warnock and Cornway (1999); BOU (2001, 2005)
2.1.2 Cotton
At its peak production period from 1965 to 1970, the cotton sector was responsible for 40 per cent of Uganda’s export earnings. Since then, it has maintained a low economic profile. Over the 1970s and 1980s, the land area under cotton cultivation declined from 300,000 ha to just 70,000 ha by 1993–94; domestic demand for cotton, which had reached a peak of 65,000 bales in 1973–74, declined to 15,000 bales in 1987–88 and to 2,800 bales in 1994 (RATES, 2003). Between 1991 and 2005, cotton’s contribution to national foreign exchange earnings fluctuated between three and five per cent (Table 2), reaching a high of 6.6 per cent in 2003–04 (UBOS, 2006). This increase in production occurred on the back of the boost to the sector through increased seed and price control by the government as part of the African Growth and Opportunity Act (AGOA) initiative (MFPED, 2006). Although playing a smaller role in the national economy, nearly 300,000 smallholder families continue to grow cotton, and the crop provides cash income to 10 per cent of Uganda’s population. This makes it the second most important poverty alleviation crop after coffee (COMPETE, 2002). However low prices continue to plague the sector, widening the regional welfare gap that exists between the poorer northern region and the rest of the country. Liberalization efforts have not yet succeeded in turning this situation around, as low incentives persist for the private sector to supply seeds or to invest in revamping the country’s cotton ginneries (Okidi et al., 2005).
2.2 Trends in coffee and cotton prices and their impacts livelihoods
2.2.1 Coffee
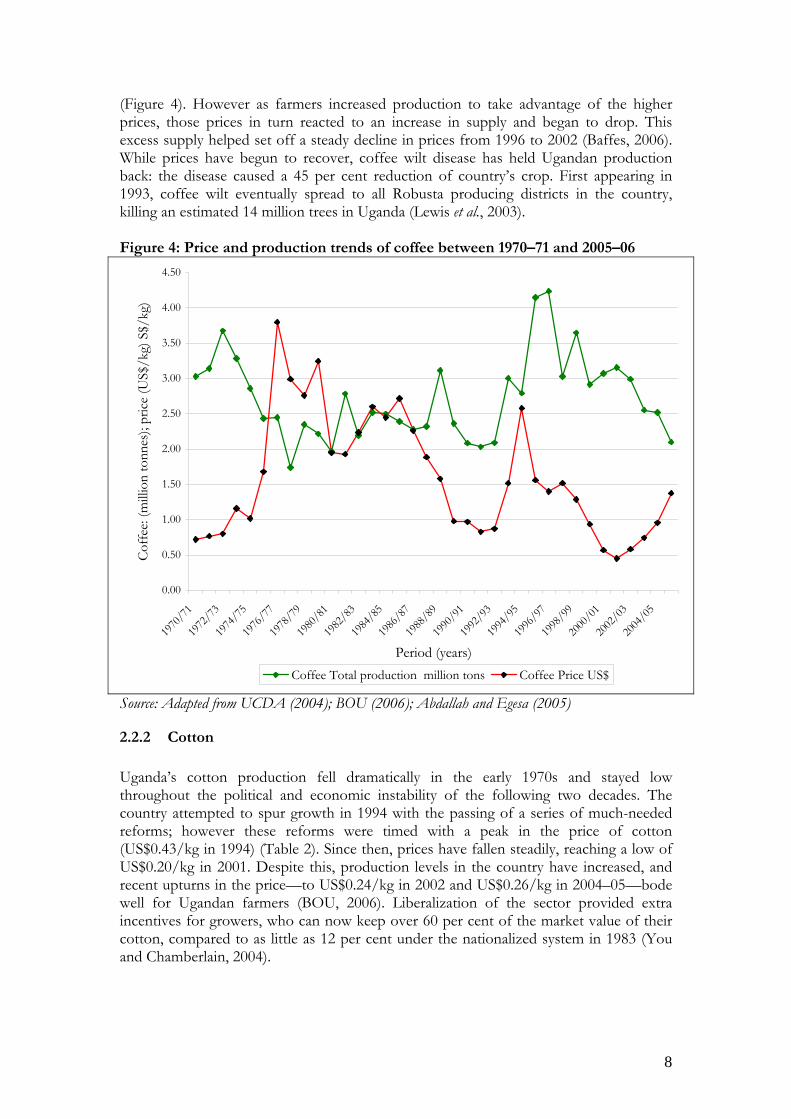
In 1986 and 1987 there was a perceived shortage in coffee due to a drought in Brazil, the world’s largest producer. As a result, international prices boomed. But in 1989, they slumped again with the dramatic collapse of the quota system of the International Coffee Organization (ICO) (Gabriele and Vanzetti, 2005). The market stayed depressed for four years, until prices recovered due to a general reduction in overall supply and a 1994 frost in Brazil. Supply rebounded, however, and led to a new slump in 1996, and since then—with the exception of a short-lived spike in 1997 due to the El Niño phenomenon—world coffee prices steadily declined until 2002. In 2001–02, world coffee prices were less than half their level in 1995–96 (UCDA, 2004). In Uganda, a significant rise in the price of coffee towards the middle of the 1990s led to an increase in the volume of coffee exported, surpassing four million bags in 1994–95
8
(Figure 4). However as farmers increased production to take advantage of the higher prices, those prices in turn reacted to an increase in supply and began to drop. This excess supply helped set off a steady decline in prices from 1996 to 2002 (Baffes, 2006). While prices have begun to recover, coffee wilt disease has held Ugandan production back: the disease caused a 45 per cent reduction of country’s crop. First appearing in 1993, coffee wilt eventually spread to all Robusta producing districts in the country, killing an estimated 14 million trees in Uganda (Lewis et al., 2003). Figure 4: Price and production trends of coffee between 1970–71 and 2005–06
0.00
0.50
1.00
1.50
2.00
2.50
3.00
3.50
4.00
4.50
1970
/71
1972
/73
1974
/75
1976
/77
1978
/79
1980
/81
1982
/83
1984
/85
1986
/87
1988
/89
1990
/91
1992
/93
1994
/95
1996
/97
1998
/99
2000
/01
2002
/03
2004
/05
Period (years)
Coffe
e: (m
illio
n to
nnes
); pr
ice
(US$
/kg)
S$/
kg)
Coffee Total production million tons Coffee Price US$
Source: Adapted from UCDA (2004); BOU (2006); Abdallah and Egesa (2005)
2.2.2 Cotton
Uganda’s cotton production fell dramatically in the early 1970s and stayed low throughout the political and economic instability of the following two decades. The country attempted to spur growth in 1994 with the passing of a series of much-needed reforms; however these reforms were timed with a peak in the price of cotton (US$0.43/kg in 1994) (Table 2). Since then, prices have fallen steadily, reaching a low of US$0.20/kg in 2001. Despite this, production levels in the country have increased, and recent upturns in the price—to US$0.24/kg in 2002 and US$0.26/kg in 2004–05—bode well for Ugandan farmers (BOU, 2006). Liberalization of the sector provided extra incentives for growers, who can now keep over 60 per cent of the market value of their cotton, compared to as little as 12 per cent under the nationalized system in 1983 (You and Chamberlain, 2004).
9
Figure 5: Price and production trends of cotton between 1970–71 and 2005–06
0
1
2
3
4
5
6
7
8
9
1970
/71
1972
/73
1974
/75
1976
/77
1978
/79
1980
/81
1982
/83
1984
/85
1986
/87
1988
/89
1990
/91
1992
/93
1994
/95
1996
/97
1998
/99
2000
/01
2002
/03
2004
/05
Period (years)
Cotto
n ('0
000
tonn
es);
price
US$
/bale
)
Cotton total production ten tons Cotton Price US$
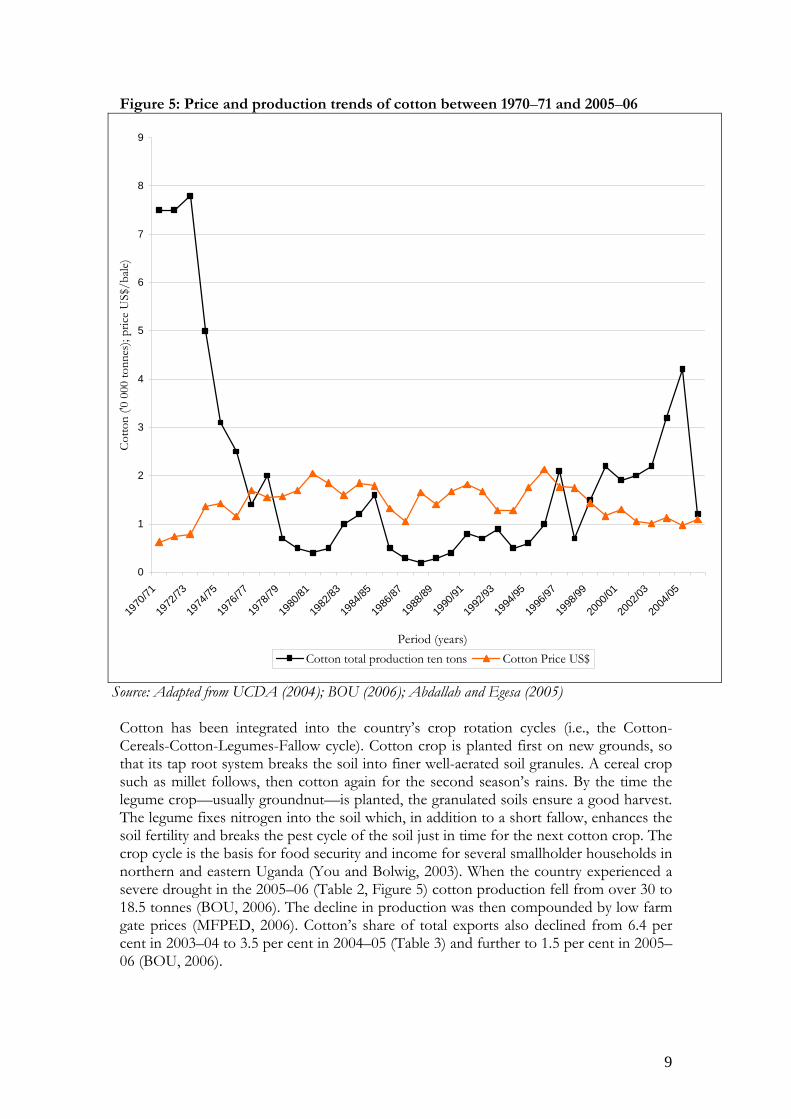
Source: Adapted from UCDA (2004); BOU (2006); Abdallah and Egesa (2005) Cotton has been integrated into the country’s crop rotation cycles (i.e., the Cotton-Cereals-Cotton-Legumes-Fallow cycle). Cotton crop is planted first on new grounds, so that its tap root system breaks the soil into finer well-aerated soil granules. A cereal crop such as millet follows, then cotton again for the second season’s rains. By the time the legume crop—usually groundnut—is planted, the granulated soils ensure a good harvest. The legume fixes nitrogen into the soil which, in addition to a short fallow, enhances the soil fertility and breaks the pest cycle of the soil just in time for the next cotton crop. The crop cycle is the basis for food security and income for several smallholder households in northern and eastern Uganda (You and Bolwig, 2003). When the country experienced a severe drought in the 2005–06 (Table 2, Figure 5) cotton production fell from over 30 to 18.5 tonnes (BOU, 2006). The decline in production was then compounded by low farm gate prices (MFPED, 2006). Cotton’s share of total exports also declined from 6.4 per cent in 2003–04 to 3.5 per cent in 2004–05 (Table 3) and further to 1.5 per cent in 2005–06 (BOU, 2006).
10
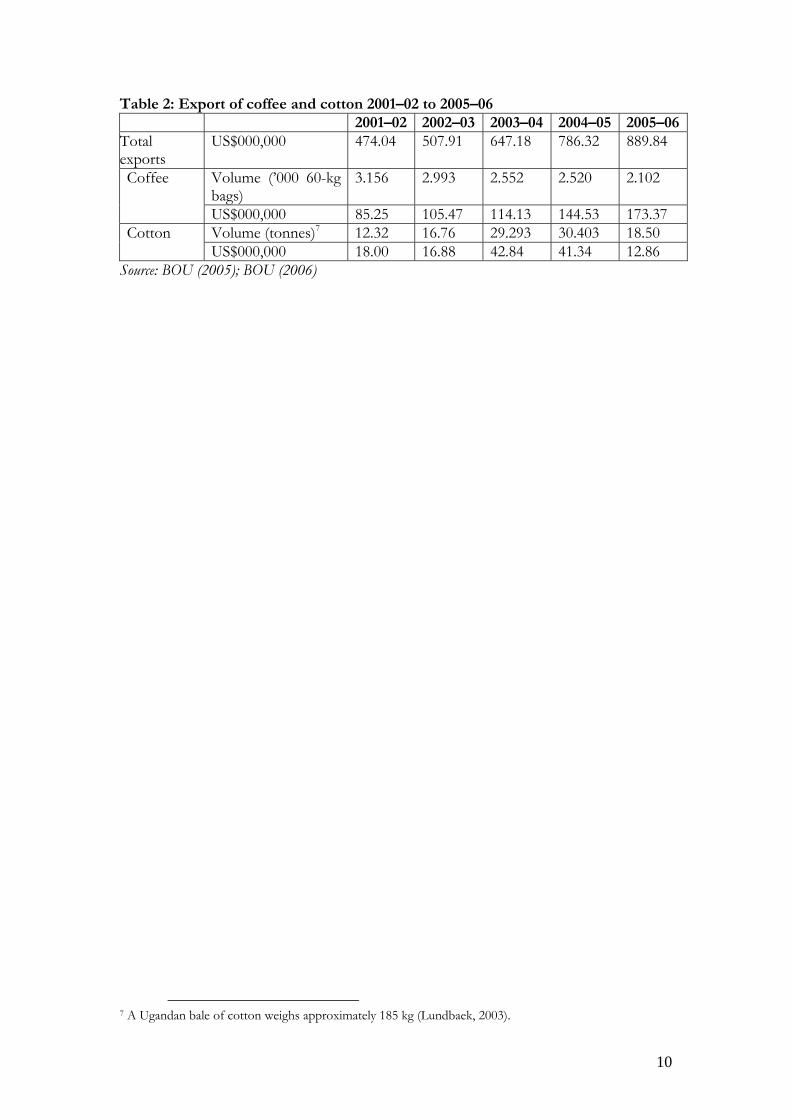
Table 2: Export of coffee and cotton 2001–02 to 2005–06 2001–02 2002–03 2003–04 2004–05 2005–06
Total exports
US$000,000 474.04 507.91 647.18 786.32 889.84
Volume (’000 60-kg bags)
3.156 2.993 2.552 2.520 2.102 Coffee
US$000,000 85.25 105.47 114.13 144.53 173.37 Volume (tonnes)7 12.32 16.76 29.293 30.403 18.50 Cotton US$000,000 18.00 16.88 42.84 41.34 12.86
Source: BOU (2005); BOU (2006)
7 A Ugandan bale of cotton weighs approximately 185 kg (Lundbaek, 2003).
11
3.0 Approaches to Managing Commodity Revenues Given the historical and current importance of coffee and cotton, there has been a series of approaches for managing commodity revenue. Prior to liberalization, commodity revenue management was in the hands of the government through commodity marketing boards, who employed a sub-sector-wide revenue management regime. After liberalization, commodity revenue management became a shared responsibility involving several stakeholders and employing several approaches, ranging from managing the individual to value chain and government initiatives. 3.1 Commodity marketing boards Until 1994, ginning and marketing of cotton in Uganda was regulated under the revised Cotton Act (1964) and the Lint Marketing Board (LMB) Act (1959, amended 1976). However by the late 1980s, the state-run LMB had gone bankrupt due to political instability and poor management. Cotton production had virtually collapsed, and the only option left for the government seemed to be structural reform (Baffes, 2004). Uganda’s coffee marketing board met with a similar end. In 1969, the Uganda Coffee Marketing Act (1969) gave the Coffee Marketing Board (CMB) a complete monopoly on the export and regulation of coffee. Under the CMB, farmer revenues from the crop were very low, hovering at around 20 per cent of the market price. This led to a high level of head count poverty among coffee farmers (56 per cent in 1992) in a country highly dependent upon the crop for its export earnings - which in certain years exceeded 90 per cent of all export revenues (Okidi et al., 2005). Over time, the CMB grew into a large bureaucracy hampered by mismanagement and high administration costs, and several cooperatives registered financial losses. Moreover, the collapse of the International Coffee Agreement in 1989 led to an increase in world production, especially of Robusta coffee from Vietnam. This led to an oversupply unmatched by consumption growth, which ranged from low to stable at about one per cent (You and Bolwig, 2003). For Uganda, reforms in the sub-sector were needed (UCDA, 1996). 3.2 Farmers’ cooperatives, futures and option markets Most individual coffee and cotton producers generate only small amounts of their crops, making intermediary institutions vital for ensuring that they—in cooperation with other farmers—can achieve economies of scale. One area for which this is important is the provision of risk management tools and instruments to smallholders. In Uganda, farmer associations are stepping in to fill this gap. Two cooperative cotton unions, the North Bukedi Cotton Company and the Lango Cooperative Union, 8 are using futures and options markets to promote predictable incomes. The first used its access to risk management markets to guarantee minimum prices to its farmers (CTA/Spore, 2005). However, the major exchange for futures and options products for cotton is the New York Board of Trade (NYBOT), which is not an effective hedging mechanism for Ugandans because cotton traded outside the U.S. does not follow the NYBOT price closely (Nsibirwa and Tiffen, 2003). At first the two unions, as well as several others, invested in Reuters screens but later information became available through the Internet. The two unions use currency forward rates to convert the international futures prices
8 North Bukedi Cotton Company and Lango Cooperative Union are members of Uganda Cotton Ginners and Exporters Association (UGCEA).
12
into local ones, to facilitate its price negotiations in forward sales, and also use fixed-price forward sales to manage their price risk exposure, although generally only for two months ahead (UNCTAD, 2002). Government support to the cotton sub-sector is directed through the Cotton Development Organisation (CDO) and is channeled through the Plan for Modernisation of Agriculture. However, direct interventions in the sub-sector are left to the Uganda Cotton Ginners and Exporters Association (UCGEA), which was formed in 1997, and the Cotton Farmers Association (CFA) formed in the 1999–2000 season. 3.3 Liberalization of commodity trade Between 1990 and 1993, the government successfully liberalized commodity trading in Uganda. And while the LMB lost its monopoly on the buying and exporting of cotton, it was not until 1996 that there was a supply response to the reforms in the cotton sub-sector. After years of decline, production eventually recovered, at first slowly in 1995–96 and 1996–97, and from 1999–2000 season onwards stabilized and reached 20,000 tonnes (Baffes, 2004). Prices received by farmers rose from 55 to 65 per cent of world prices—still low, but higher than before the reforms (World Bank, 2000). The revival of cotton in 1994 under the Cotton Sector Development Programme led to an increase in income for 15 per cent of the rural population and to poverty alleviation (You and Bolwig, 2003). Similar benefits flowed to coffee farmers; reforms were completed within a year, and smallholder revenues increased from 20 per cent of the free on rail/truck price to over 70 per cent (Akiyama et al., 2003). 3.4 Diversification The collapse of coffee prices in the mid-1990s decreased Uganda’s national revenues and exposed its dependence on the crop. Recognizing the need, Uganda embarked on a diversification drive. As a result, coffee’s contribution to national foreign exchange revenues declined from over 50 per cent to just over 20 per cent (UBOS, 2006). Non-traditional exports (NTEs) such as fish and fish products, maize and beans and horticultural products now contribute approximately 60 per cent of the export revenues, although coffee remains the single most important export commodity (BOU, 2006). 3.5 Alternative market channels In 1996, several non-traditional marketing channels emerged for coffee, including organic, fair trade and shade-grown. All were aimed at improving the stability of incomes received by farmers. A survey conducted on coffee certification in Uganda showed that premiums at the export level were in the range of 25–35 per cent (Table 4) depending on the type of coffee. At farm level the premiums were in the range of 22–35 per cent (Ponte, 2006). As a result of these benefits, export volumes began to expand immediately, growing from 1,200 bags of specialty coffee in 1995–96 to 7,692 bags in 2003–04. And yet while alternative market channels such as organic represented a growth opportunity, Uganda’s pace was far less than that of its global rivals: in 2003–04, only 0.21 per cent of Uganda’s coffee was exported as organic, much less than the 6–8 per cent world average (Baffes, 2006).
13
3.6 Vertical integration and emerging market opportunities Uganda exports most of its cotton crop in its raw form as lint, with only 5–10 per cent of production used domestically. This did not initially change under the African Growth and Opportunity Act (AGOA), founded in 2000 as part of U.S. efforts to its improve trade relations with sub-Saharan African countries. Cotton clothing exported by Uganda was typically manufactured from fabric imported from Asia because Ugandan textiles were deemed to be of a lower quality. Two ventures have tried to reverse this trend by taking advantage of AGOA. The first, a joint private-public company called Tri-star Apparels, collapsed under mismanagement in 2006. The Ugandan government has since turned to Phenix Logistics, a national manufacturer specializing in clothing made from locally produced organic cotton, to exploit the U.S. AGOA market; a first consignment worth US$125,000 has already been exported (New Vision, 2007; Daily Monitor, 2007). By exporting finished goods and not simply raw materials, Ugandans are able to improve both their revenues and their manufacturing capacity. Such vertical integration will be crucial for both sectors. On the coffee side, a typical grower in Uganda gets only US$0.14/kg for beans delivered to the roaster’s factory gates for US$1.64/kg while the average price of soluble coffee in the U.K. is US$26.40/kg (Oxfam, 2003). To improve this situation and to add value to Ugandan coffee before it is exported, the private sector is currently working to develop coffee products that are ready for the supermarkets of Europe. They have already achieved some success, with the branded Good African Coffee product now on the shelves of supermarkets in the United Kingdom. Banks such as Standard Chartered Bank and Stanbic Bank, based in Uganda, do not lend to farmers directly, but offer loans indirectly through the ginners and exporters by funding trading and ginning activities. The beneficiary cooperatives and private cotton ginners and exporters include: North Bukedi Cotton Co., South Base Agro Industries, Bugema Cotton Co. ltd, Lango cooperative Union and Nyakatonzi Cooperative Union among others for Standard Chartered; and Muddu Awulira Enterprises, Olam and Bon Holding for Stanbic bank (Nsibirwa and Tiffen, 2003). 3.7 Strategic Export Programme: Government subsidies for export supply chains In 2001, the Ugandan government embarked on the Strategic Exports Programme (SEP), whose aim was both to stimulate value-adding investments in selected areas to spur economic growth, and to remove impediments to the private sector’s ability to trade competitively. Over 70 billion Uganda shillings (about US$40 million) were invested in strategic export sectors between 2001 and 2004 (MFPED, 2006b). To enhance the value of coffee, 16 wet-processing facilities have been imported and were expected to have been operational by 2005–06—which had not happened by early 2007 (MFPED, 2006b). Wet processing coffee consists of a four-stage process: picking only the ripe cherries; pulping by squeezing wet beans out of the cherries and removing the mucilage around the beans through fermentation; washing the beans; and drying the wet beans from a moisture content of 50–60 per cent to about 12 per cent. Drying, the alternative to wet processing, consists only of harvesting of ripe cherries and drying them (UCDA, 2006). For the cotton sub-sector, de-linting and grading machines have been procured, as have tractors for ploughing services (MFPED, 2006b). Early results indicate
14
that exports have grown under the SEP, and for the first time were expected to exceed the US$1 billion in 2005–06 (MFPED, 2006). In the end, they fell just short total exports for 2006 were valued at US$962 million (East African Business Week, 2007) 3.8 Compensatory financing Introduced with the Lomé Convention, an aid and trade agreement between the EU and the ACP countries signed in 1975, the Stabex (Stabilization of Export Earnings) compensatory finance scheme was designed to help ACP countries stabilize their export earnings. Uganda has benefited under this scheme, with Stabex payments totaling €175 million transferred in 1990, 1991, 1993, 1995 and 1999 (MFPED, 2002). These funds were made available to compensate for export losses in the coffee, tea and—to a lesser extent—hides and skins sectors. In 1990–91, the EU found itself committed to disburse €1.38 billion to eligible applicants, three times more than had been reserved for this purpose (DFID and ODI, 2004). Such over-demand eventually led to a re-evaluation of the program; replacing Stabex in 2000, the FLEX (Fluctuations in Export Earnings) scheme introduced more stringent eligibility criteria and lower levels of real compensation for ACP countries. As such, FLEX came under considerable criticism from ACP countries as not being helpful since the chances of eligibility were very low. Indeed, Uganda has not yet qualified for FLEX compensatory financing (EU/MFPED, 2006). 3.9 International agreements From 1962 until its collapse in 1989, the International Coffee Organization (ICO) sought to balance supply and demand to achieve stable prices. The ICO used export quotas, allocated to each producing member country, as a market intervention system to “manage” the international coffee market. The quotas were set to keep prices above an agreed minimum (US$1.20 per pound during much of the quota period) and below an agreed maximum (US$1.40 per pound). The system was more successful at protecting the price floor than its ceiling. In case of a shortage, usually the result of a climatic problem in a major producing country, even the total suspension of quotas could not prevent prices from increasing far beyond the agreed ceiling. Under these pressures and those exerted by producing countries outside of the agreement (such as Vietnam), the ICO quota system was discontinued in 1989. In October 2002, Resolution 407 of the International Coffee Council came into force. The resolution made specific quality requirements for all coffee in the global market. The strict quality requirements were expected to lead to a reduction of 15 per cent in the global coffee supply. This mechanism was meant to reward quality coffee producers by guaranteeing them a market. Uganda is said to produce the world’s best Robusta coffee (Baffes, 2006), and in a system that rewards quality over volume, it is expected that the country’s share of the Robusta coffee market may edge upwards as the country’s high quality coffee volumes grow. 3.10 Warehouse receipts systems The Warehouse Receipts System (WRS) Bill was passed by the Parliament on April 5, 2006. The passing of the WRS ensures the establishment of a framework for regulating warehouses and warehouse operators, who can issue authorized Warehouse Receipts.
15
The WRS is being used in the development of a system for commodity trade and financing based on inventory collateralization as a means of trade financing. The WRS allows farmers to obtain market information and quality assurance, and its certification system enables farmers and traders to obtain financing from financial institutions using their produce as collateral (Akiyama et al., 2003). The warehouse receipt system, or warehouse inventory credit, achieves two important purposes: first, as a facilitator of credit delivery for inventory or products held in storage; and second, as a means of improving the bargaining position of the depositor (UCDA, 2006). Under a WRS pilot project, nearly 100,000 kg of seed cotton was deposited by farmers from Kasese and Bushenyi district into warehouses. For coffee, the WRS Project had forecasted deposits of 100 tonnes for the first pilot, but only 35 tonnes were received under the system. The main impediments were persistent wet weather which hampered coffee harvests and drying, and the stiff competition from the local traders. 3.11 Commodity exchange Supported by the government through the Plan for Modernisation of Agriculture (PMA), the first Uganda Commodity Exchange (UCE) was initiated in 1998. The UCE was registered by four founding shareholders: the Uganda Cooperative Alliance (UCA); the Uganda Coffee Traders Federation (UCTF); the Uganda National Farmers Federation (UNFFE); and the Uganda Commercial Farmers Association (UCFA). After two years of operation, several financial institutions and insurers lost enthusiasm for the exchange due to the absence of a legal and regulatory framework for the UCE and the warehouse receipts scheme (RATES, 2006). The UCE does, however, hold the potential to provide a robust trading system that assures delivery of and payment for commodities sold. The process allows financial institutions to liquidate collateralized stocks through transparent means. In addition, exporters are able to get access to certified quality produce of known a quantity and premium quality (Akiyama et al., 2003).
16
4.0 Recommendations The recommendations below are geared towards enabling policy-makers to integrate identified commodity revenue management options into the current set of price risk tools, particularly for the coffee and cotton sub-sectors in Uganda. There is considerable evidence that price responsiveness, market integration and financing mechanisms have already been used in Uganda, however there is still considerable room for improvement or even a change of focus. The alternative trade networks in organic and fair trade and the opportunities for strengthening the brand of Ugandan products all offer farmers an opportunity for price premiums, which can in turn help producers weather declines in international prices. Uganda’s Robusta coffee already enjoys a strong reputation built on higher quality beans, ensuring that it earns a premium price. Further efforts should be put into both ensuring that the Ugandan Robusta brand continues to lead in both quality and price, and that the country increase its output of organic and fair trade products to match the global average. The horizontal diversification of exports in Uganda has thus far proved to be successful. However, the production of the traditional exports seems to have waned as a result. The immense economic value that coffee and cotton bring to smallholders must not be lost on policy-makers. There may be a need to revisit the current coffee replanting programmes to make sure that they are effective, as the current arrangements seem to have had a negligible impact. The impact of the coffee wilt disease is enormous. UCDA estimated a loss equivalent to 61,200 tonnes (1.02 million bags) of coffee, which is around 40 per cent of the output in recent years. This corresponds to US$42.8 million in export revenue loss per annum at 2003–04 prices (Ushs 1,090/kg). In the current program coffee plantlets are distributed to farmers in the major growing districts, however, only a few districts have reported a substantial response from farmers. The number of coffee trees and coffee continues to decline due to the coffee wilt disease despite of the replanting effort. The vertical diversification efforts of Phenix Logistics in the cotton sub-sector are said to have added US$3,200 per tonne to the value of Uganda’s lint. Similarly, Ugandan coffee processed within the country is now sold in U.K. supermarkets under the label Good Quality Coffee. The Uganda Coffee Development Authority (UCDA) is already engaged in building capacity for local roasters and farmers to gauge quality through training, and is investing in de-pulping units and coffee dryers. By continuing to make such investments, Uganda will improve its ability to capture the higher returns which derive from value-added exports. In doing so, they can reduce their exposure to the volatile prices typically associated with raw commodities. There has been a lot of effort in recent years to promote markets for smallholder products from Africa. The adjusted EU/ACP agreements, the African Growth and Opportunities Act (AGOA), and Uganda’s coffee shops in China are some successful examples. There should be greater efforts in this direction. To help, Uganda should invest to increase its capacity for trading and participating in international negotiations. There is growing recognition of the importance of farmer cooperatives as a means of advancing marketing tools to farmers. However, because the primary cooperatives that existed as part of the controlled coffee and cotton boards have largely collapsed, new
17
ones will have to be created. The incentive to do so in a liberalized environment has unfortunately decreased as progressive farmers have already created their own networks. Instead value-chain approaches where farmers are linked to a specific exporter are emerging as the most adaptable form of cooperation practiced in Uganda’s export trade. Even with the Warehouse Receipt Systems and Uganda Commodity Exchange, there is still limited financing in the commodity sector. There are several programs that seem to operate independently of each other; for example, the Wealth-for-All program (Bonnna Bagagawale, Uganda’s newest microfinance scheme) seems to be operating outside the other financing mechanisms. Development institutions, banks and insurers need to develop further initiatives that improve the access of commodity producers to financing, for which the WRS and the UCE have laid a sound foundation. Although, there has been an increase in market information flow through mobile phones, radios and the prominent use of futures and option markets, a large segment of the population does not have access to these. Once access is improved, investments will have to be made in training programmes on the use of market information, credit arrangements, cooperatives and diversification, to allow commodity farmers to make better, more informed decisions about their crops. If commodity prices are stable and the commodity revenue management initiatives are adequate, farmers, traders and other commodity supply chain stakeholders would have a significant incentive to boost production. With enhanced commodity revenue management interventions for all stakeholders, national development goals such as poverty alleviation and economic growth would also be achieved.
18
References Abdallah, A. Y., and Egesa, A. K. (2005) Trade and growth in agriculture: a case study of Uganda’s export potential within the evolving Multilateral trading regime, Bank of Uganda Staff Working Paper, January 2005 http://www.bou.or.ug Akiyama, T., Baffes, J., Larson, F. D. and Varangis, P (2003) Commodity Market Reform in Africa: Some recent experiences, World Bank Policy Research Working Paper 2995, March 2003, http://econ.worldbank.org Alberto Gabriele and David Vanzetti (2005) Long Black: Surviving the coffee crisis, Division on International Trade in Goods and Services, and Commodities, UNCTAD, Geneva, 49th AARES Annual Conference, Coffs Harbour, New South Wales, 9-11 February 2005 Baffes, J., (2006) Restructuring Uganda’s Coffee Industry: Why going back to basics matters, World Bank Policy Research Working Paper 4020, October 2006, Washington, D.C. Bigirwa, J., (2005) Fair-trade and Cooperatives – The Uganda experience. Paper Presented to the IFAP Tropical Commodities Committee – in charge of coffee, for the National Union of Coffee Agribusinesses and Farm Enterprises, Berlin, Germany, January, 2005 BOU (2000) Annual Report 1999/00, Bank of Uganda. http://www.bou.or.ug BOU (2001) Annual Report 2000/01 Bank of Uganda. http://www.bou.or.ug BOU (2002) Annual Report 2001/02 Bank of Uganda. http://www.bou.or.ug BOU (2003) Annual Report 2002/03 Bank of Uganda. http://www.bou.or.ug BOU (2004) Annual Report 2003/04 Bank of Uganda. http://www.bou.or.ug BOU (2005) Annual Report 2004/05 Bank of Uganda. http://www.bou.or.ug BOU (2006) Annual Report 2005/06 Bank of Uganda. http://www.bou.or.ug Brown, O. and Gibson, (2006) Boom or Bust: Developing countries’ rough ride on the commodity rollercoaster, International Institute for Sustainable Development (IISD), October, 2006. http://www.iisd.org CTA/ Spore (2005) Commodity Risk Management: Weathering times of boom and bust, Spore Newsletter Number 115, February 2005, http://www.spore.cta.int CTA, 2006 Coffee Executive brief, Agritrade News and analysis of events affecting the Africa Caribbean and Pacific (ACP) agricultural trade, September, 2006. Deininger, K., and Okidi, J (2003) Growth and poverty reduction in Uganda. 1992–2000: Panel data evidence Development Policy Review 21 (4) pp 481–509.
19
DFID and ODI (2004) Rethinking Tropical Agricultural Commodities, paper was produced by the Agriculture and Natural Resources Team of the UK Department for International Development (DFID) in collaboration with Ian Gillson, Steve Wiggins and Nilah Pandian of the Overseas Development Institute (ODI). http://www.dfid-agriculture-consultation.nri.org East African Business Week (2007) Uganda: Country gets U.S. $962 Million from exports in 2006, East African Business Week (Kampala) 14 May 2007. EU/MFPED (2005) Uganda - European Community: Joint Annual Report 2003, Government of Uganda, Ministry of Finance Planning and Economic Development and the European Commission, http://www.deluga.cec.eu.int/en/annual_report/2005 FAO (2004) State of Agricultural Commodity Markets, United Nations Food and Agricultural Organization: http://www.fao.org Gibbon, P. (2006) An overview of the certified organic export sector in Uganda, Danish Institute for International Studies (DIIS) Working Paper No. 2006/13, Strandgade 56 1401 Copenhagen, Denmark, http://www.diis.dk Gibbon, P., and Bolwig, S. (2007) The economics of certified organic farming in tropical Africa: A preliminary Assessment, (Danish Institute for International Studies) DIIS Working Paper no. 2007/3, Sub-series on Standards and Agro-Food Exports (SAFE) No. 7. GOU – MFPED/ EC (2002) Uganda – European Community: Country Strategy Paper and National Indicative Programme for the period 2002-2007 Government of Uganda Ministry of Finance, Planning and Economic Development, and the European Commission. Kasozi A. (2006) Institutions and commodities of coffee in Uganda. A paper presented at the Workshop on Commodity Dependence and Development in Africa, Centre for Research in Institutional Economics, University of Hertfordshire. Keizire (2004) Policy Research – Implications of Liberalization of Fish Trade for Developing Countries: A Case Study for Uganda, DFR (MAAIF) for the Food and Agriculture Organization (FAO) of the United Nations, Rome, July 2004. Lewin, B., Giovannucci, D., and Varangis, P. (2004) Coffee markets: New paradigms in Global Supply and Demand, Agricultural and Rural Development Discussion paper 3. Washington D.C.: World Bank. Lewis Ivey, M. L, Miller, S, A., Hakiza, G., and Geiser, D. M., (2003) Characterization of Coffee Wild Pathogen in Uganda, Ohio State University, Coffee Research Institute Mukono-Kituza, and Pennsylvania State University. Lundbaek, J. (2003) Privatisation of the cotton sub-sector in Uganda: Market failures and institutional mechanisms to overcome these, Masters Thesis the Royal Veterinary and Agricultural University, Department of Economics and Natural Resources, Copenhagen, Demark, June 2003.
20
MFPED (2005) Budget Speech 2005/06 by Minister of Finance Planning and Economic Development, July 2005. MFPED (2006 b) Poverty Status Report of Uganda, 2005. Ministry of Finance Planning and Economic Development, September, 2006. MFPED (2006) Budget Speech 2006/07 by Minister of Finance Planning and Economic Development, July 2006. Nsibirwa, W. R. and Tiffen, P (2003) Uganda Cotton Price Risk Management: Phase II, The International Task Force on Commodity Risk Management in developing countries http://www.itf-commrisk.org/ Okidi, J., Sewanyana, S., Bategeka, L., and Muhumuza, F. (2005) Distributional and poverty impacts of Uganda’s growth: 1992 to 2003, Research Series No. 46, Economic Policy Research Centre. Oxfam (2003) Coffee: What a difference a penny makes, Oxfam - UK/ the Cooperative Group. http://www.oxfam.org Ponte and Kawuma (2003) Coffee Certification in Uganda: Feasibility Study, Consultancy report for DfID and the Uganda Coffee Development Authority: Kampala, Uganda. Ponte, S (2004) Standards and sustainability in the coffee sector: A global value chain approach. http://www.iisd.org, Sustainable commodity initiative, UNCTAD and International Institute for Sustainable Development (IISD). RATES (2006) Regional Initiatives for Structured Trading Systems: A synopsis of program initiatives supporting the start-up and development of commodity exchanges, warehouse receipts, and stakeholder capacity building in the COMESA Region. Regional Agricultural Trade Espansion Support Program (RATES) Trade Office, August 2006. Ribbink, G., Nyabuntu, P. and Kumar, S. (2005) Successful Supply Chains in Uganda: A study of three successful chains in the coffee, dried fruit and fresh vegetables sectors, International Labour Organization and the British Department for International Development, activities for Business Services Market Development Research Report May 2005. UBOS, (2005) Uganda Statistical Abstract 2006, Uganda Bureau of Statistics (UBOS). UBOS, (2006) Uganda Statistical Abstract 2006, Uganda Bureau of Statistics (UBOS). UCDA (1997) Uganda Coffee Development Authority Annual Report, 1996/97. UCDA (1998) Uganda Coffee Development Authority Annual Report, 1997/98. UCDA (1999) Uganda Coffee Development Authority Annual Report, 1998/99. UCDA (2003) Uganda Coffee Development Authority Annual Report, 2002/03. UCDA (2004) Uganda Coffee Development Authority Annual Report, 2003/04.
21
UCTF (2002) Coffee Year Book 2001/02, Uganda Coffee Traders’ Federation, 2002. UCTF (2003) Coffee Year Book 2002/03, Uganda Coffee Traders’ Federation, 2003. UCTF (2004) Coffee Year Book 2003/04, Uganda Coffee Traders’ Federation, 2004. UCTF (2005) Coffee Year Book 2004/05, Uganda Coffee Traders’ Federation, 2005. UNCTAD (2002) Farmers and farmers’ associations in developing countries and their use of modern financial instruments, Study prepared by the UNCTAD secretariat, GE.02-50026, http://www.ruralfinance.org/cds Warnock, F. and Conway, P. (1999) Post-Conflict Recovery in Uganda Teaching Notes, World Bank Institute, Washington D.C. World Bank (2000) Wold Cotton Market: Structure, recent trends, and prospects. World Bank Cotton Policy Brief, June 2000. You, L. and Boldwig, S (2003) Alternative growth scenarios for Ugandan coffee to 2002, Environment and Production Technology Division (EPTD) paper No. 98 International Food Policy Research Institute (IFPRI), February 2003. You, L. and Chamberlain, J. (2004) Spatial analysis of sustainable livelihoods enterprises of Uganda cotton production, Environment and Production Technology Division (EPTD) paper No. 121 International Food Policy Research Institute (IFPRI), September, 2004.