commodity classic 2020
TRANSCRIPT
Commodity Classic 2020 SAN ANTONIO, TEXAS
1

AttendanceBASED ON DEMOGRAPHIC DATA FROM ATTENDEE REGISTRATION
COMMODITY CLASSIC 2020
2

Year-to-Year Attendance
6,014 6,214
9,770
7,936
9,770 9,303
8,055
9,120 9,335
3,235 3,324
3,874 4,329
4,595 4,102
3,646
4,528 4,669
924 1,078 1,261 1,410 1,343 920
1,533 1,918 2,095
2012Nashville
2013Orlando
2014San Antonio
2015Phoenix
2016New Orleans
2017San Antonio
2018Anaheim
2019Orlando
2020San Antonio
Total Attendees Farmers Non-exhibitor First Time Attendees
3
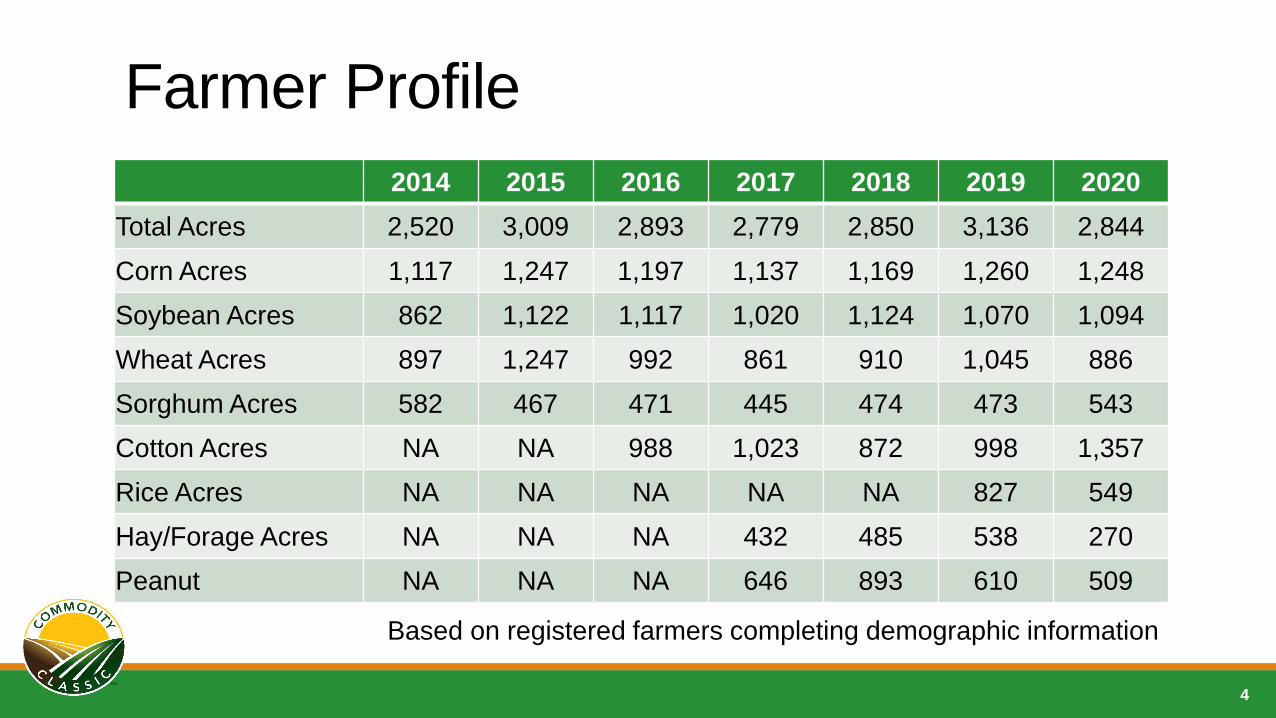
Farmer Profile
4
Based on registered farmers completing demographic information
2014 2015 2016 2017 2018 2019 2020
Total Acres 2,520 3,009 2,893 2,779 2,850 3,136 2,844
Corn Acres 1,117 1,247 1,197 1,137 1,169 1,260 1,248
Soybean Acres 862 1,122 1,117 1,020 1,124 1,070 1,094
Wheat Acres 897 1,247 992 861 910 1,045 886
Sorghum Acres 582 467 471 445 474 473 543
Cotton Acres NA NA 988 1,023 872 998 1,357
Rice Acres NA NA NA NA NA 827 549
Hay/Forage Acres NA NA NA 432 485 538 270
Peanut NA NA NA 646 893 610 509

Farmer Profile - Continued
5
2014 2015 2016 2017 2018 2019 2020
Vegetables Acres NA NA NA NA NA 696 458
Other Specialty Acres NA NA NA NA NA 1,513 804
No. Feedlot Cattle NA NA 604 314 550 702 744
Cow/Calf Pairs NA NA 150 177 240 398 146
Avg. Hogs 6,511 7,363 7,994 7,956 7,500 NA NA
Sows NA NA NA NA NA 1,026 1,988
Feeders NA NA NA NA NA 1,329 2,251
Finishers NA NA NA NA NA 5,658 6,588
Avg. Age 51.7 53.4 52.6 50.1 50.2 52.3 49.3
Based on registered farmers completing demographic information
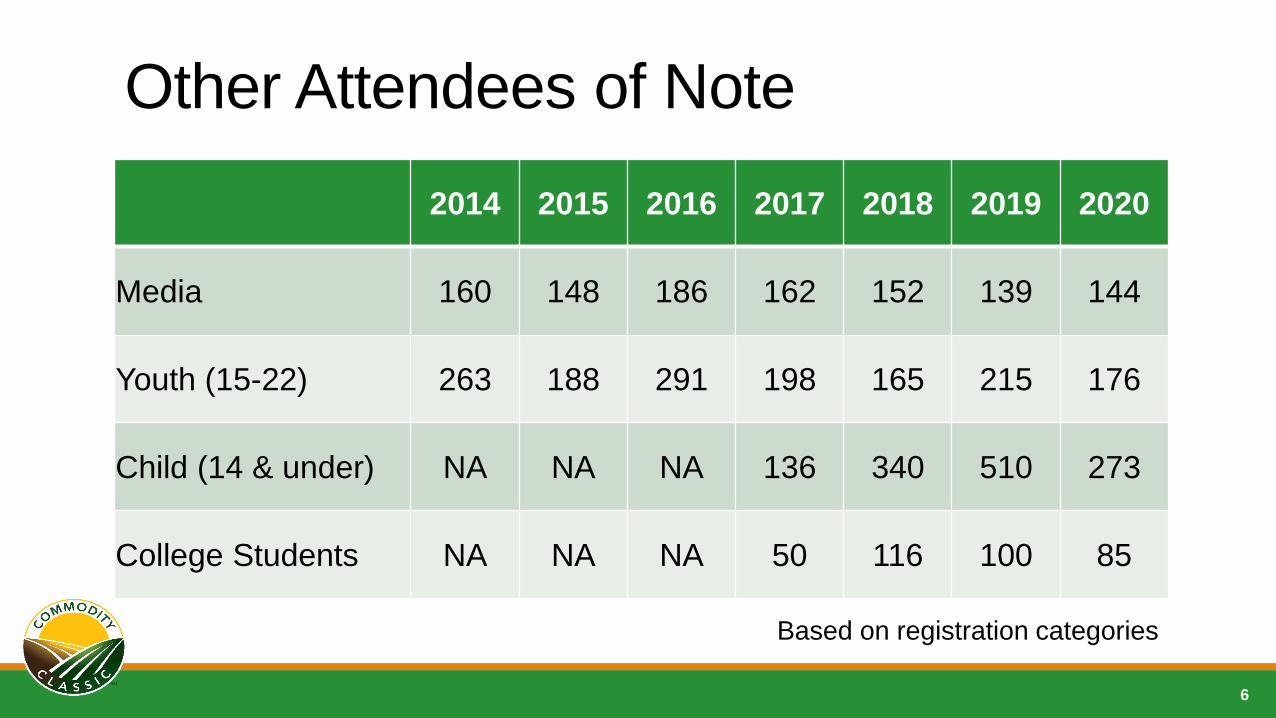
Other Attendees of Note
6
2014 2015 2016 2017 2018 2019 2020
Media 160 148 186 162 152 139 144
Youth (15-22) 263 188 291 198 165 215 176
Child (14 & under) NA NA NA 136 340 510 273
College Students NA NA NA 50 116 100 85
Based on registration categories

Farmer Attendee Distribution
7
CANADA AB 108 | MB 14 | ON 140 | QC 1 | SK 6
59
31
3
15
56
CT 3
DC 19
DE 18
MA 16
MD 95
NJ 19
VT 4
25
50
457
32
436 278
248 136
17
4
174
336
181
22
19
90
127
261
10
2
54
265
60
11
77
24
166
63
205
8 54
25
122
11
15
Top States
1) Iowa – 457
2) Illinois – 436
3) Minnesota – 336
4) Indiana – 278
5) Ohio – 265
Canada – 269

Trade ShowBASED ON POST-SHOW DATA
COMMODITY CLASSIC 2020
8

Trade Show Profile
9
963 1010
1262
1705
2533
2266
1894
2105 2097
252 234301 354
433 425367 404 399
38 19 71 70128 83 45 78 67
0
500
1000
1500
2000
2500
3000
2012Nashville
2013Kissimmee
2014 SanAntonio
2015 Phoenix 2016 NewOrleans
2017 SanAntonio
2018Anaheim
2019 Orlando 2020 SanAntonio
Booths Companies New Exhibitors
Booths =10x10 booth spaces

Chemical-Nutrients, 84
Seed, 15
Organizations, 45
Technology, 54Marketing: Insurance-
Consulting, 41
Grain Storage - Processing, 23
Equipment, 95
Media, 9 Other, 31
OEM, 2
Number of Companies by Products and Services
10
Total Companies = 399

Total Net Square Feet = 209,700
Net Square Feet by Exhibitor Category
11
Chemical-Nutrients, 48,900
Seed, 11,400
Organizations, 13,900
Technology, 16,500
Marketing: Insurance-Consulting, 12,000
Grain Storage - Processing, 5,600
Equipment, 92,600
Media, 1,700
Other, 6,900
OEM, 200

Exhibitor FeedbackA SUMMARY OF INSIGHT FROM EXHIBITOR SURVEYS
COMMODITY CLASSIC 2020
12

Trade Show Overall – 98% Positive
13
61%
48%
32%
45%
32%
49%
76%
37%
45%
55%
48%
58%
44%
24%
2%
7%
9%
6%
8%
7%
4%
2%
0% 20% 40% 60% 80% 100%
San Antonio 2020
Orlando 2019
Anaheim 2018
San Antonio 2017
New Orleans 2016
Phoenix 2015
San Antonio 2014
Percent of Respondents (n=147)
Excellent Good Fair Poor

Quality of Attendees – 98% Positive
14
74%
57%
51%
62%
50%
54%
24%
36%
45%
36%
43%
42%
2%
6%
4%
2%
7%
4%
0% 20% 40% 60% 80% 100%
San Antonio 2020
Orlando 2019
Anaheim 2018
San Antonio 2017
New Orleans 2016
Phoenix 2015
Percent of Respondents (n=147)
Excellent Good Fair Poor
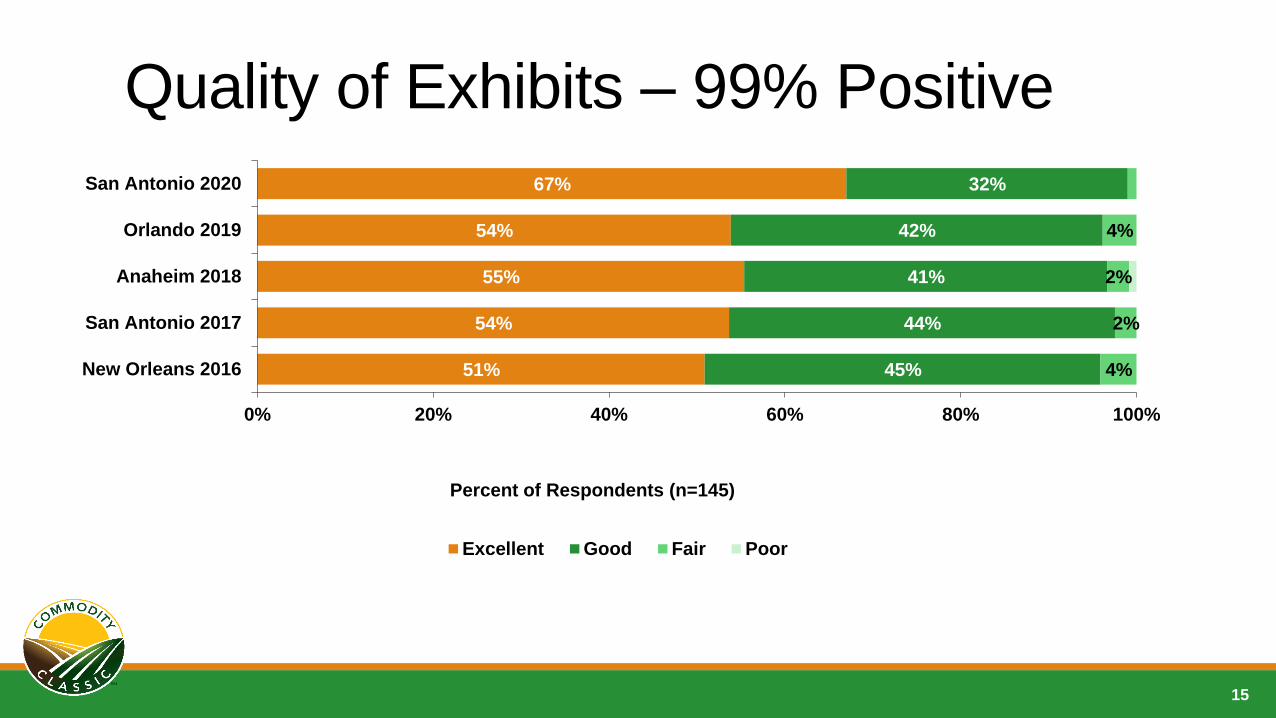
Quality of Exhibits – 99% Positive
15
67%
54%
55%
54%
51%
32%
42%
41%
44%
45%
4%
2%
2%
4%
0% 20% 40% 60% 80% 100%
San Antonio 2020
Orlando 2019
Anaheim 2018
San Antonio 2017
New Orleans 2016
Percent of Respondents (n=145)
Excellent Good Fair Poor
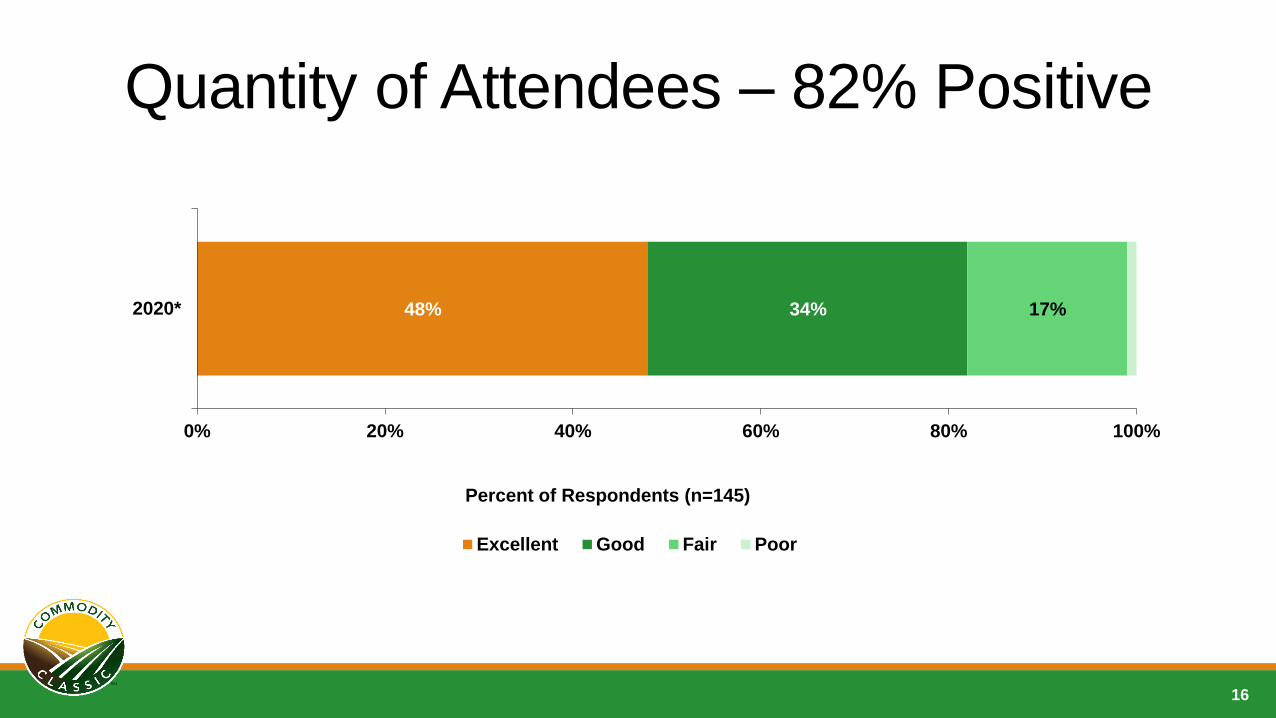
Quantity of Attendees – 82% Positive
16
48% 34% 17%
0% 20% 40% 60% 80% 100%
2020*
Percent of Respondents (n=145)
Excellent Good Fair Poor

Location Satisfaction
17
77%
60%
23%
75%
42%
52%
21%
32%
28%
20%
38%
41%
7%
31%
4%
17%
6%
2%
17%
4%
0% 20% 40% 60% 80% 100%
2020 San Antonio
2019 Orlando
2018 Anaheim
2017 San Antonio
2016 New Orleans
2015 Phoenix
Percent of Respondents (n=145)
Excellent Good Fair Poor
Looks good for San Antonio – Let’s go back
there again in 2021!
Audience InsightA SUMMARY OF INSIGHT FROM POST-SHOW SURVEY
COMMODITY CLASSIC 2020
18

Representative Sample of Farmers• Surveys (onsite and post) were designed to provide
more insight on farmer attendees and reasons for attending
• The on-site survey was completed by 388 attendees
• Post survey was completed by 383 attendees
• 35% of those who completed the post-show survey were first timers
• Survey participants were incented with sweepstakes
• Only farmers and influencer attendees were targeted for survey
Demographic profile of on site-survey responses aligns with registration data of farmer attendees.
19
79%
15%
3% 2% 1%
Farmer
FarmAdvisor
Exhibitor
Media
Youth

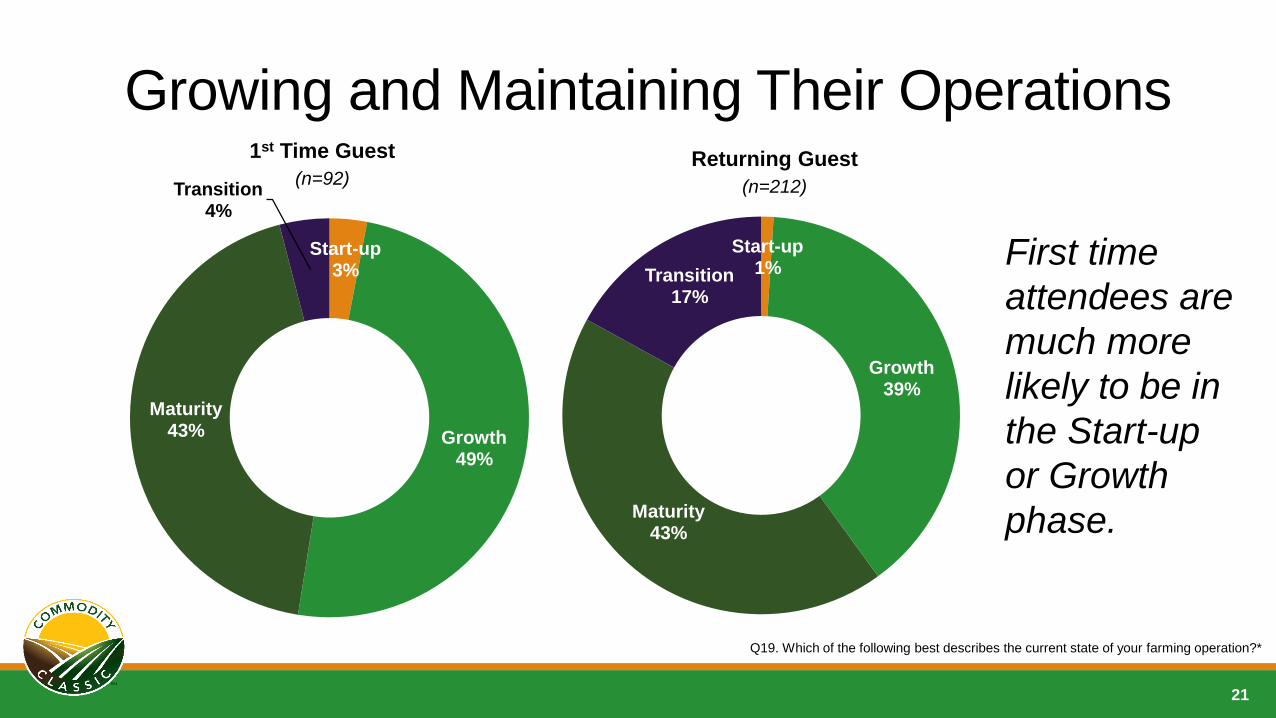
Growing and Maintaining Their Operations
Overall Attendees
20
Phase Definition
Start-up Starting a new operation
Growth Growing the size of the farming operation
MaturityFocusing on maintaining size of the
operation
TransitionDownsizing or transitioning off the farm in
the next few years
Start-up 2%
Growth42%
Maturity43%
Transition13%
Start-up 1%
Growth39%
Maturity43%
Transition17%
Growing and Maintaining Their Operations
21
1st Time Guest
(n=92)Returning Guest
(n=212)
First time
attendees are
much more
likely to be in
the Start-up
or Growth
phase.
Start-up 3%
Growth49%
Maturity43%
Transition4%
Q19. Which of the following best describes the current state of your farming operation?*
0%
5%
10%
15%
20%
25%
30%
35%
Less than 5 5-9 years 9-10 years 20-30 years More than 30
First Time Returners
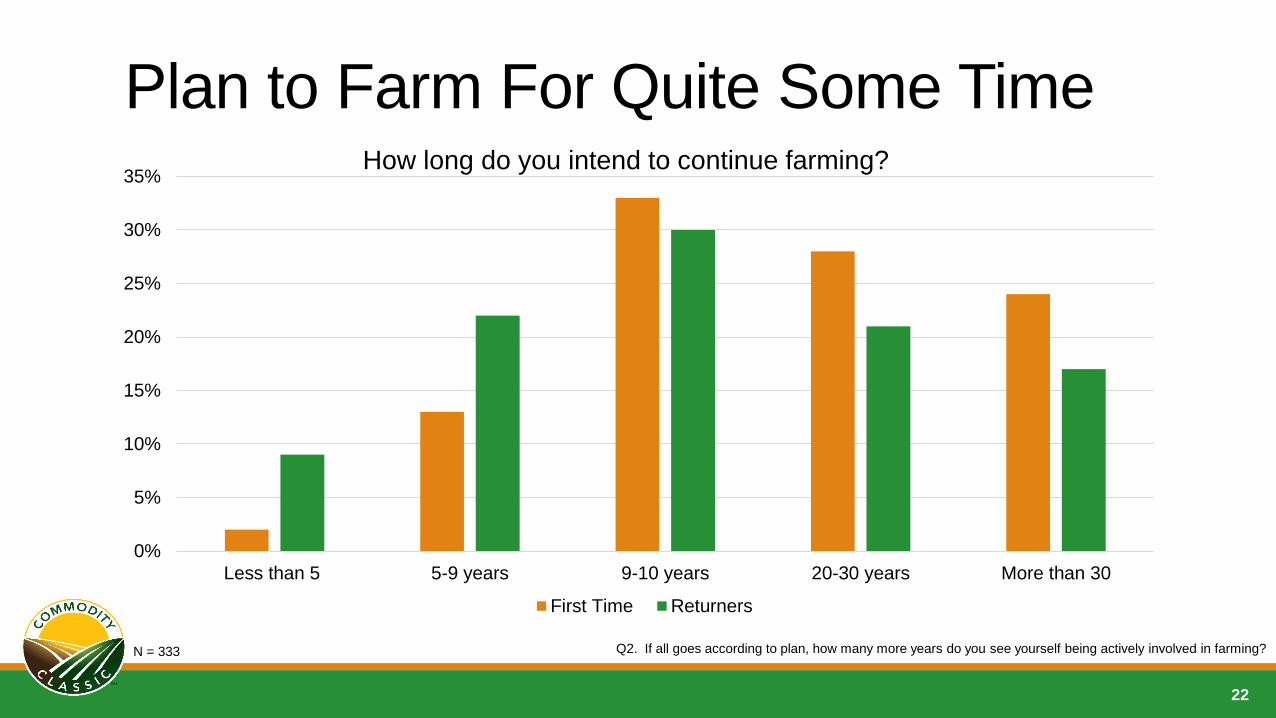
Plan to Farm For Quite Some Time
22
Q2. If all goes according to plan, how many more years do you see yourself being actively involved in farming?
How long do you intend to continue farming?
N = 333

Attendees Are Well Educated
A high school diploma
16%
Some college coursework
16%
A college diploma49%
Post-college coursework
17%
23
Over 65% of Commodity Classic farmer and farmer influencer attendees are college graduates.
D2. Which of the following best describes your level of education?N = 383
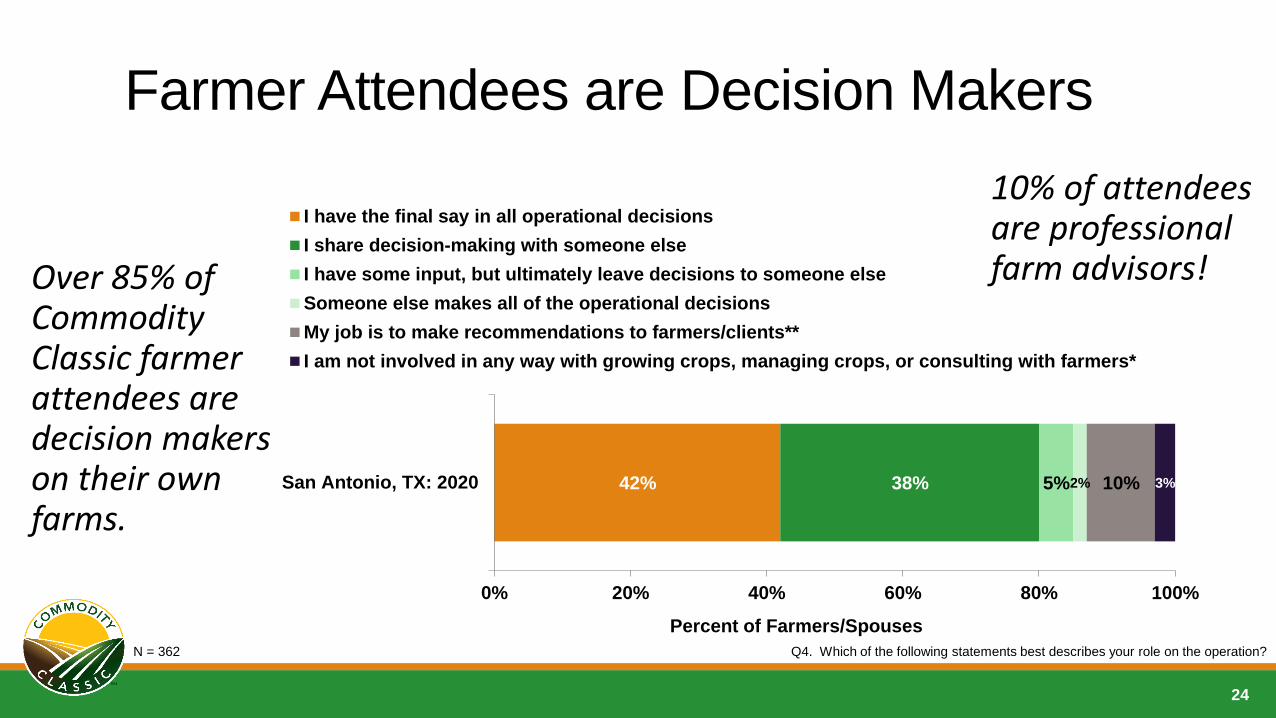
Farmer Attendees are Decision Makers
24
Q4. Which of the following statements best describes your role on the operation?
10% of attendees are professional farm advisors!
42% 38% 5%2% 10% 3%
0% 20% 40% 60% 80% 100%
San Antonio, TX: 2020
Percent of Farmers/Spouses
I have the final say in all operational decisions
I share decision-making with someone else
I have some input, but ultimately leave decisions to someone else
Someone else makes all of the operational decisions
My job is to make recommendations to farmers/clients**
I am not involved in any way with growing crops, managing crops, or consulting with farmers*
N = 362
Over 85% of Commodity Classic farmer attendees are decision makers on their own farms.
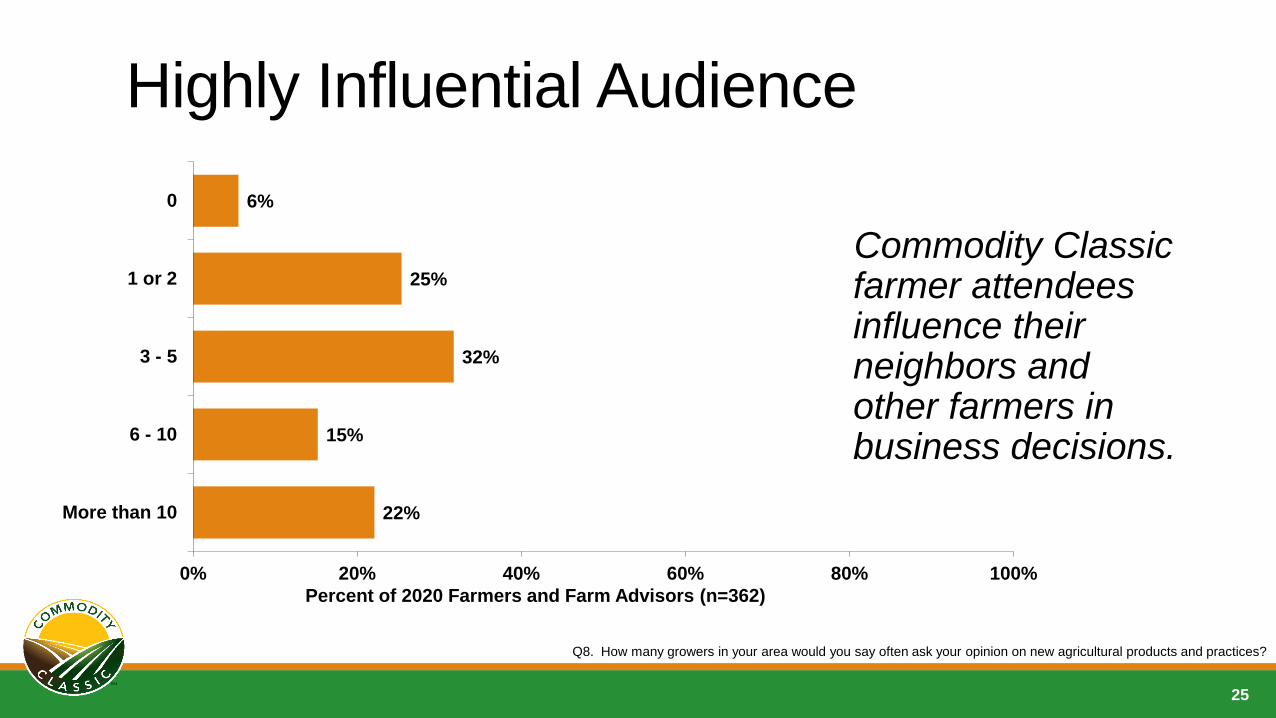
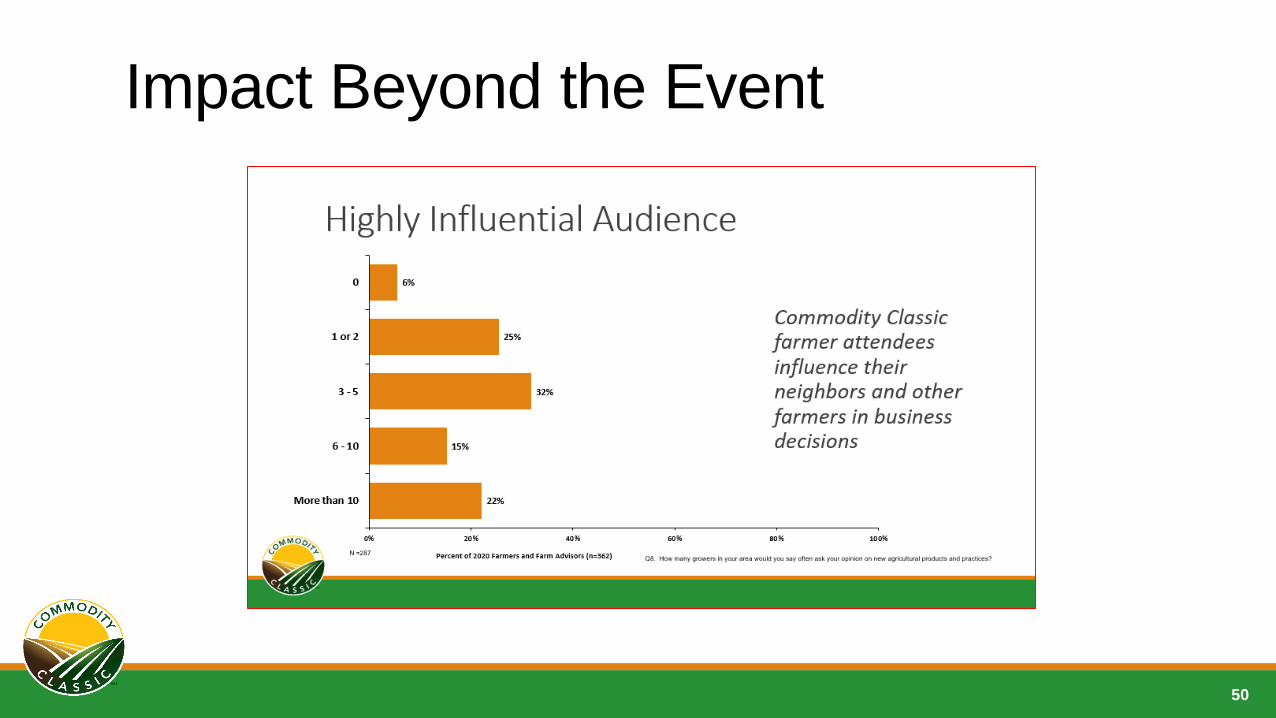
Highly Influential Audience
25
Commodity Classic farmer attendees influence their neighbors and other farmers in business decisions.
Q8. How many growers in your area would you say often ask your opinion on new agricultural products and practices?
6%
25%
32%
15%
22%
0% 20% 40% 60% 80% 100%
0
1 or 2
3 - 5
6 - 10
More than 10
Percent of 2020 Farmers and Farm Advisors (n=362)
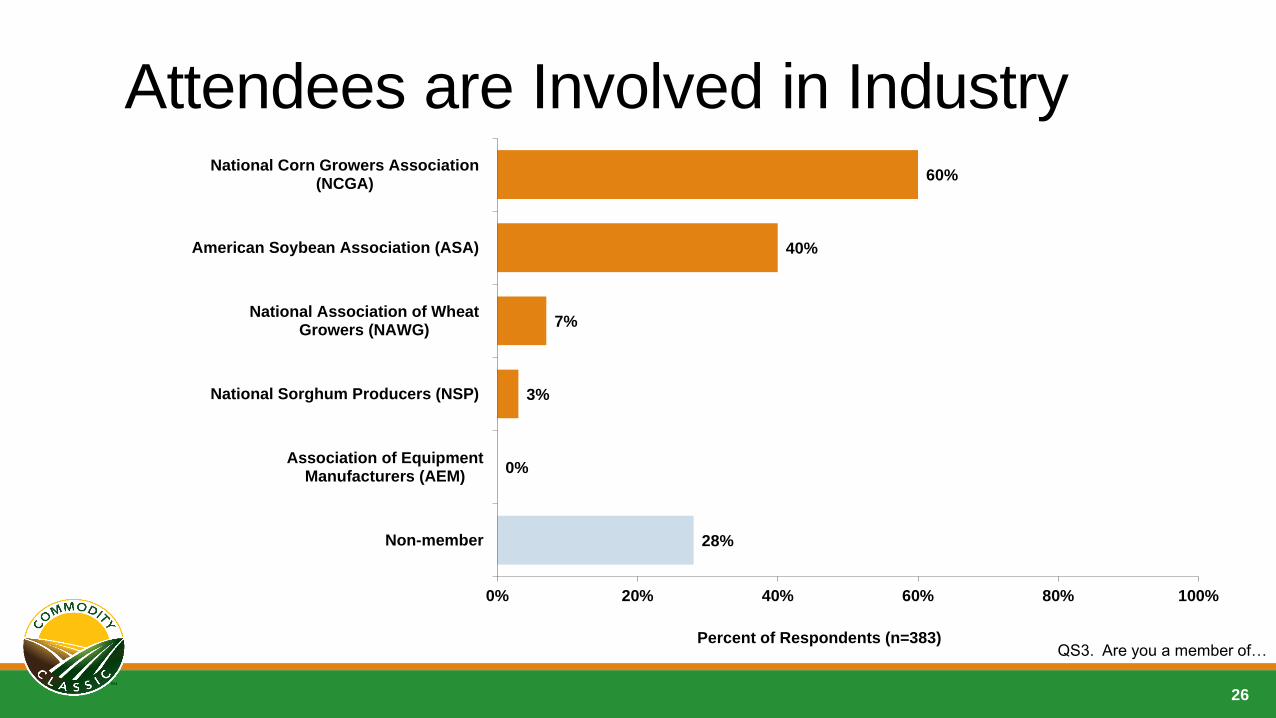
Attendees are Involved in Industry
26
QS3. Are you a member of…
60%
40%
7%
3%
0%
28%
0% 20% 40% 60% 80% 100%
National Corn Growers Association(NCGA)
American Soybean Association (ASA)
National Association of WheatGrowers (NAWG)
National Sorghum Producers (NSP)
Association of EquipmentManufacturers (AEM)
Non-member
Percent of Respondents (n=383)
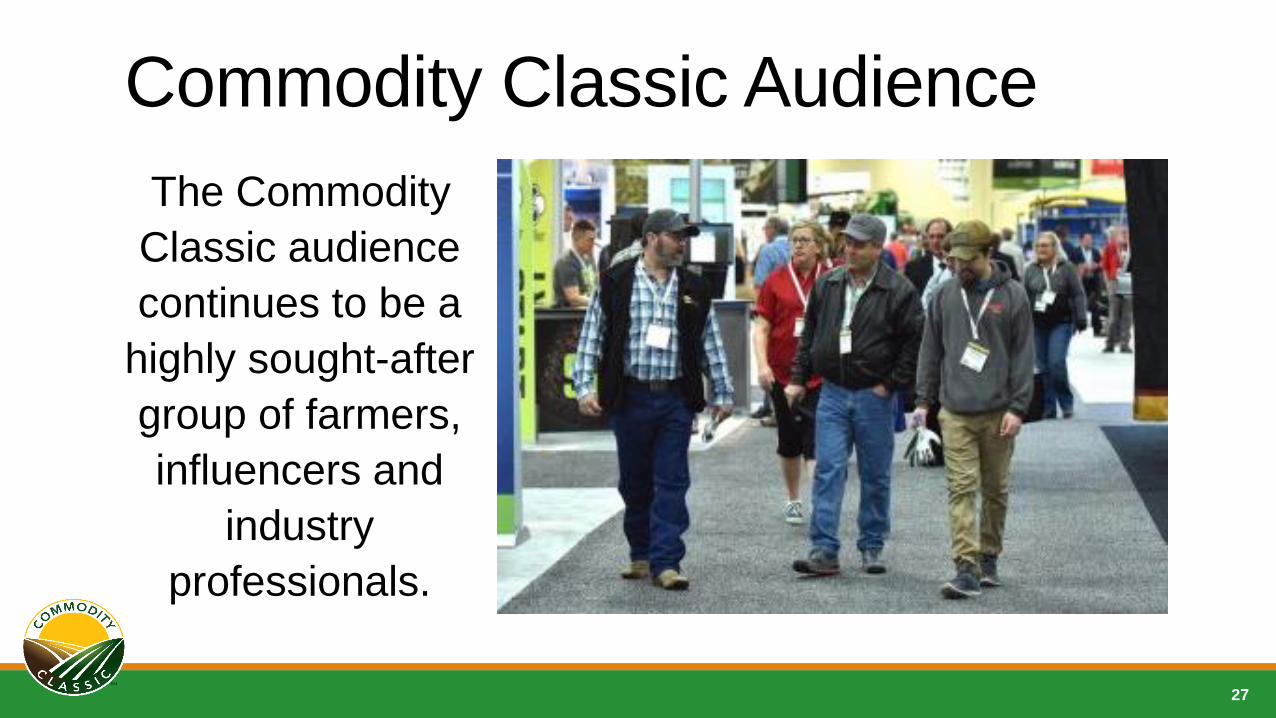
Commodity Classic Audience
The Commodity
Classic audience
continues to be a
highly sought-after
group of farmers,
influencers and
industry
professionals.
27
So… what did they think of Classic?
28

Main Reasons for Attending Classic(1st Time vs. Returning Guests)
29Q5. Please rank your top 3 reasons for attending Commodity Classic in San Antonio:
44%
38%
34%
34%
32%
31%
25%
18%
9%
8%
8%
8%
7%
3%
46%
42%
47%
22%
16%
26%
19%
14%
20%
7%
4%
14%
18%
4%
1%
0% 20% 40% 60%
Learning about new products at the trade show
Networking with other farmers
Education Sessions
Family Vacation
Someone else paid my way
San Antonio location
Meeting with company leaders at the trade show
National Corn Yield Contest
General Session
Evening of Entertainment
Other
NCGA Meetings
ASA Meetings
NAWG Meetings
NSP Meetings
Percent of Respondents
1st Time Guests (n=131)
Returning Guests (n=257)
** Based on
the Onsite
Survey
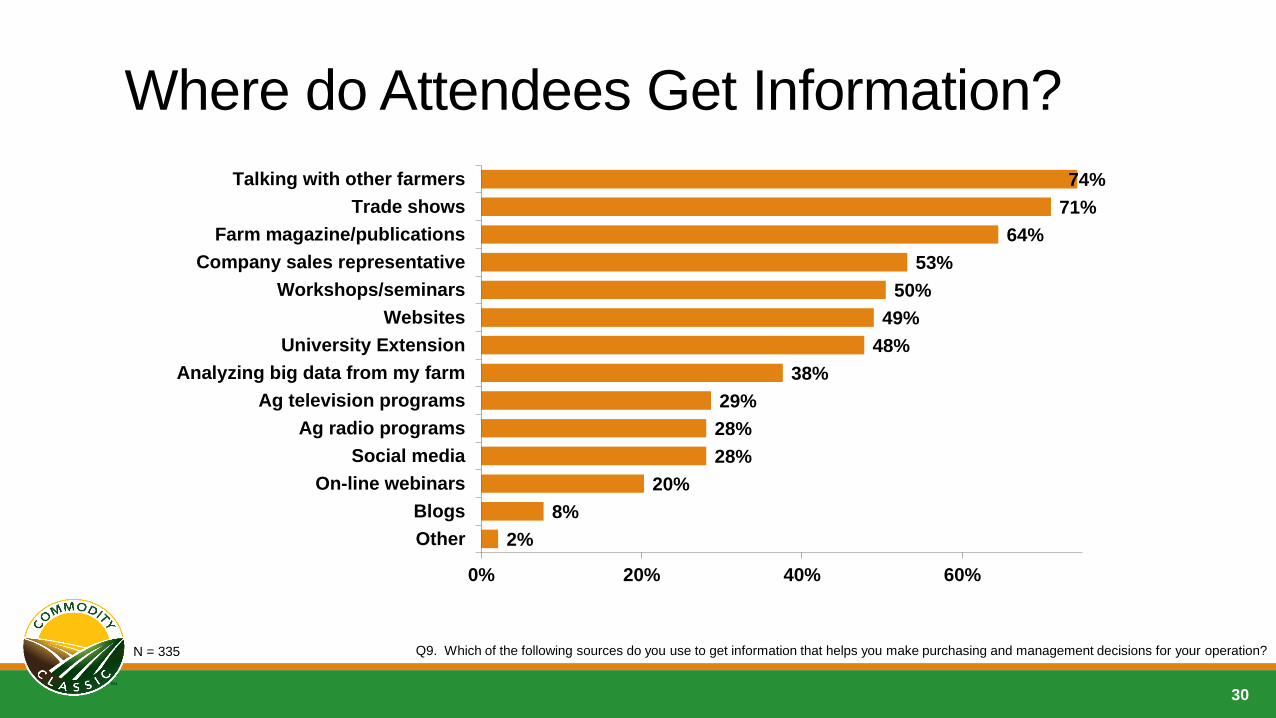
Where do Attendees Get Information?
74%
71%
64%
53%
50%
49%
48%
38%
29%
28%
28%
20%
8%
2%
0% 20% 40% 60%
Talking with other farmers
Trade shows
Farm magazine/publications
Company sales representative
Workshops/seminars
Websites
University Extension
Analyzing big data from my farm
Ag television programs
Ag radio programs
Social media
On-line webinars
Blogs
Other
30
Q9. Which of the following sources do you use to get information that helps you make purchasing and management decisions for your operation? N = 335
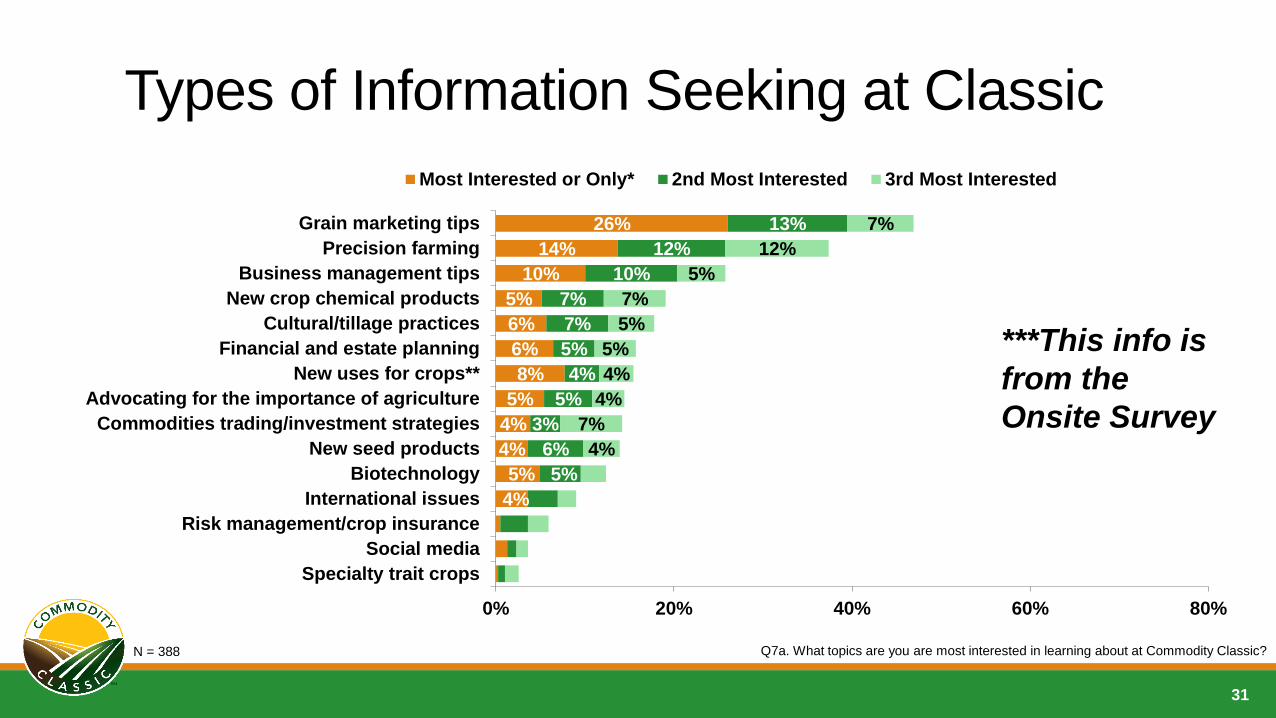
26%
14%
10%
5%
6%
6%
8%
5%
4%
4%
5%
4%
13%
12%
10%
7%
7%
5%
4%
5%
3%
6%
5%
7%
12%
5%
7%
5%
5%
4%
4%
7%
4%
0% 20% 40% 60% 80%
Grain marketing tips
Precision farming
Business management tips
New crop chemical products
Cultural/tillage practices
Financial and estate planning
New uses for crops**
Advocating for the importance of agriculture
Commodities trading/investment strategies
New seed products
Biotechnology
International issues
Risk management/crop insurance
Social media
Specialty trait crops
Most Interested or Only* 2nd Most Interested 3rd Most Interested
Types of Information Seeking at Classic
31
Q7a. What topics are you are most interested in learning about at Commodity Classic?
***This info is
from the
Onsite Survey
N = 388
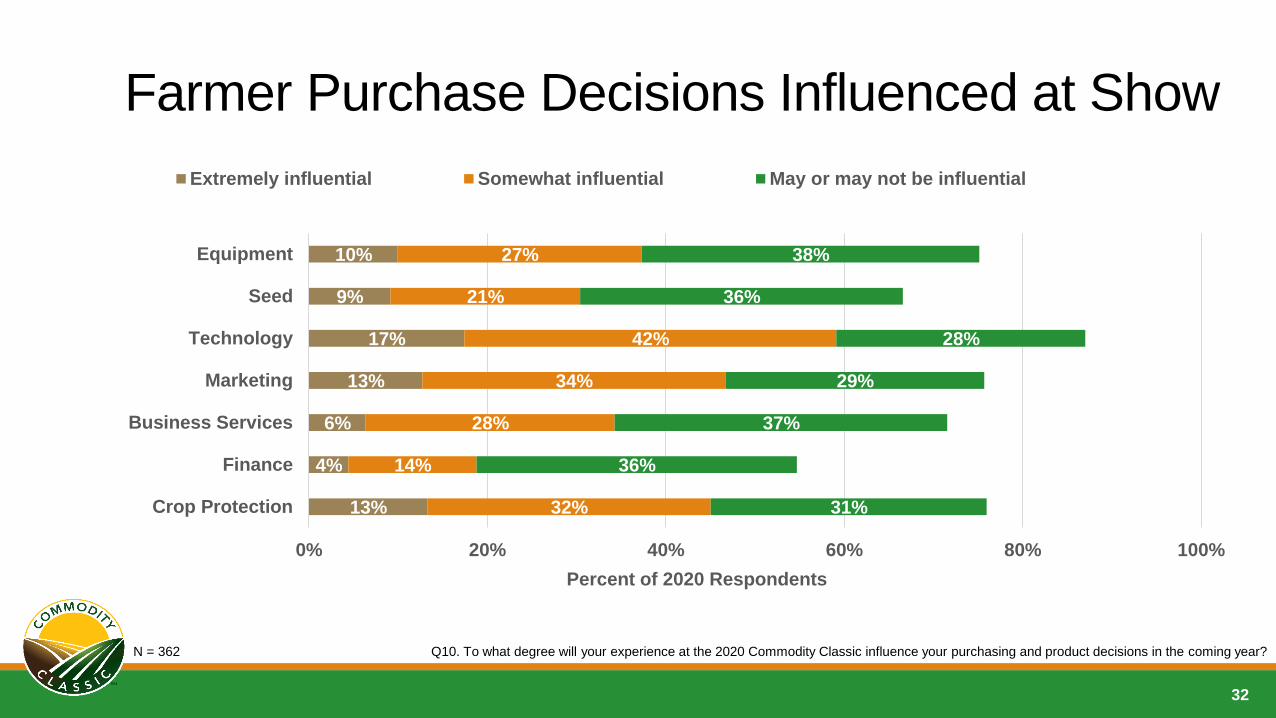
Farmer Purchase Decisions Influenced at Show
32
10%
9%
17%
13%
6%
4%
13%
27%
21%
42%
34%
28%
14%
32%
38%
36%
28%
29%
37%
36%
31%
0% 20% 40% 60% 80% 100%
Equipment
Seed
Technology
Marketing
Business Services
Finance
Crop Protection
Percent of 2020 Respondents
Extremely influential Somewhat influential May or may not be influential
Q10. To what degree will your experience at the 2020 Commodity Classic influence your purchasing and product decisions in the coming year? N = 362
Competitive SetA SUMMARY OF INSIGHT FROM POST-SHOW SURVEY
2020 COMMODITY CLASSIC
33
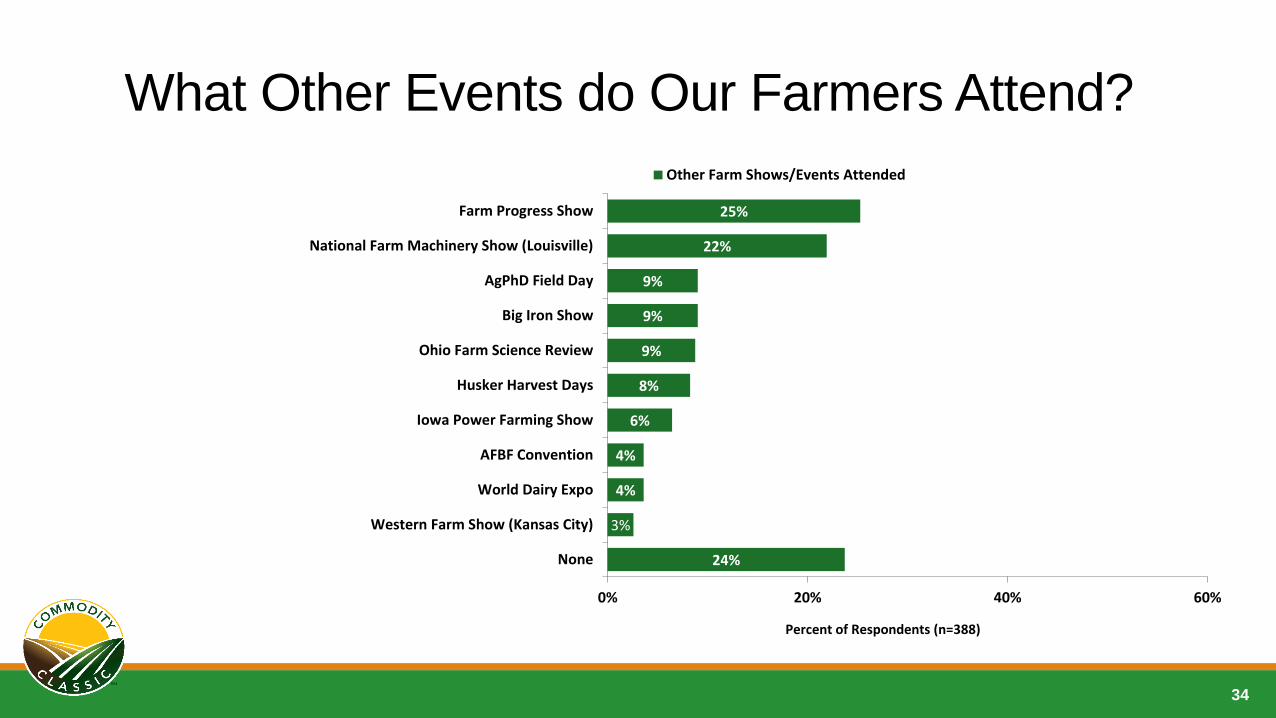
What Other Events do Our Farmers Attend?
34
25%
22%
9%
9%
9%
8%
6%
4%
4%
3%
24%
0% 20% 40% 60%
Farm Progress Show
National Farm Machinery Show (Louisville)
AgPhD Field Day
Big Iron Show
Ohio Farm Science Review
Husker Harvest Days
Iowa Power Farming Show
AFBF Convention
World Dairy Expo
Western Farm Show (Kansas City)
None
Percent of Respondents (n=388)
Other Farm Shows/Events Attended
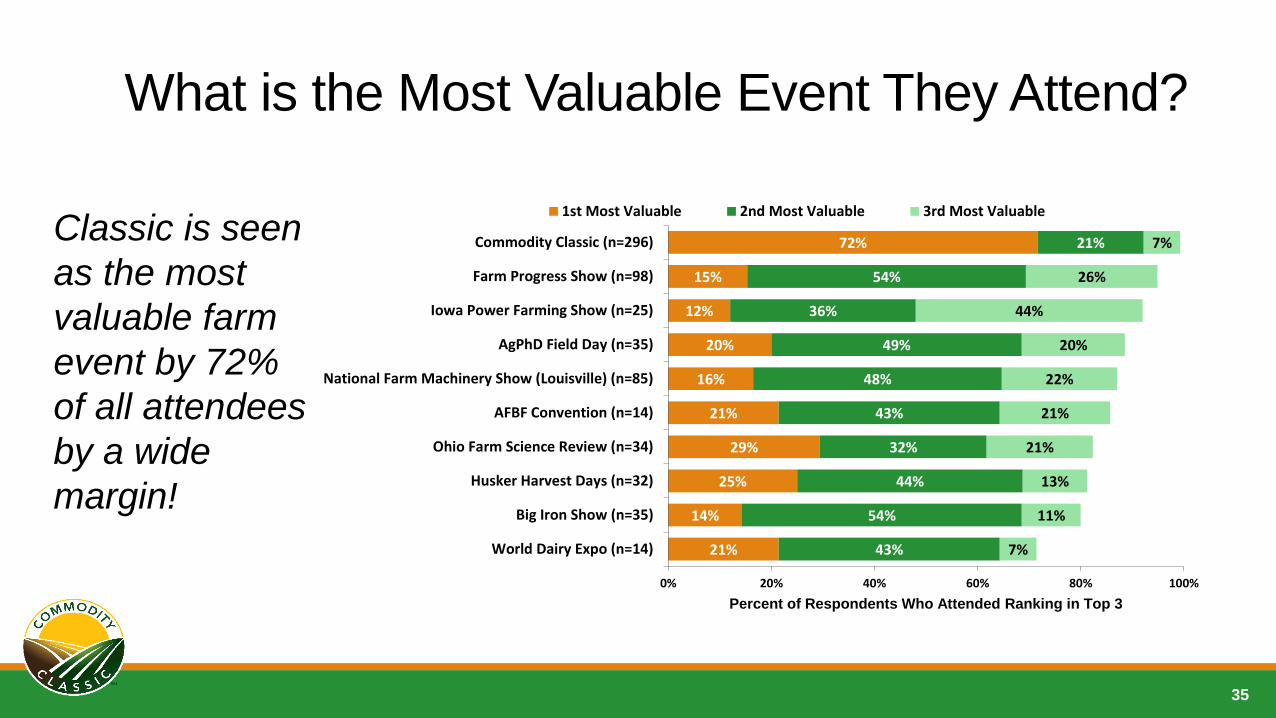
What is the Most Valuable Event They Attend?
35
72%
15%
12%
20%
16%
21%
29%
25%
14%
21%
21%
54%
36%
49%
48%
43%
32%
44%
54%
43%
7%
26%
44%
20%
22%
21%
21%
13%
11%
7%
0% 20% 40% 60% 80% 100%
Commodity Classic (n=296)
Farm Progress Show (n=98)
Iowa Power Farming Show (n=25)
AgPhD Field Day (n=35)
National Farm Machinery Show (Louisville) (n=85)
AFBF Convention (n=14)
Ohio Farm Science Review (n=34)
Husker Harvest Days (n=32)
Big Iron Show (n=35)
World Dairy Expo (n=14)
Percent of Respondents Who Attended Ranking in Top 3
1st Most Valuable 2nd Most Valuable 3rd Most Valuable
Classic is seen
as the most
valuable farm
event by 72%
of all attendees
by a wide
margin!

Attendee SatisfactionA SUMMARY OF INSIGHT FROM POST-SHOW SURVEY
2020 COMMODITY CLASSIC
36
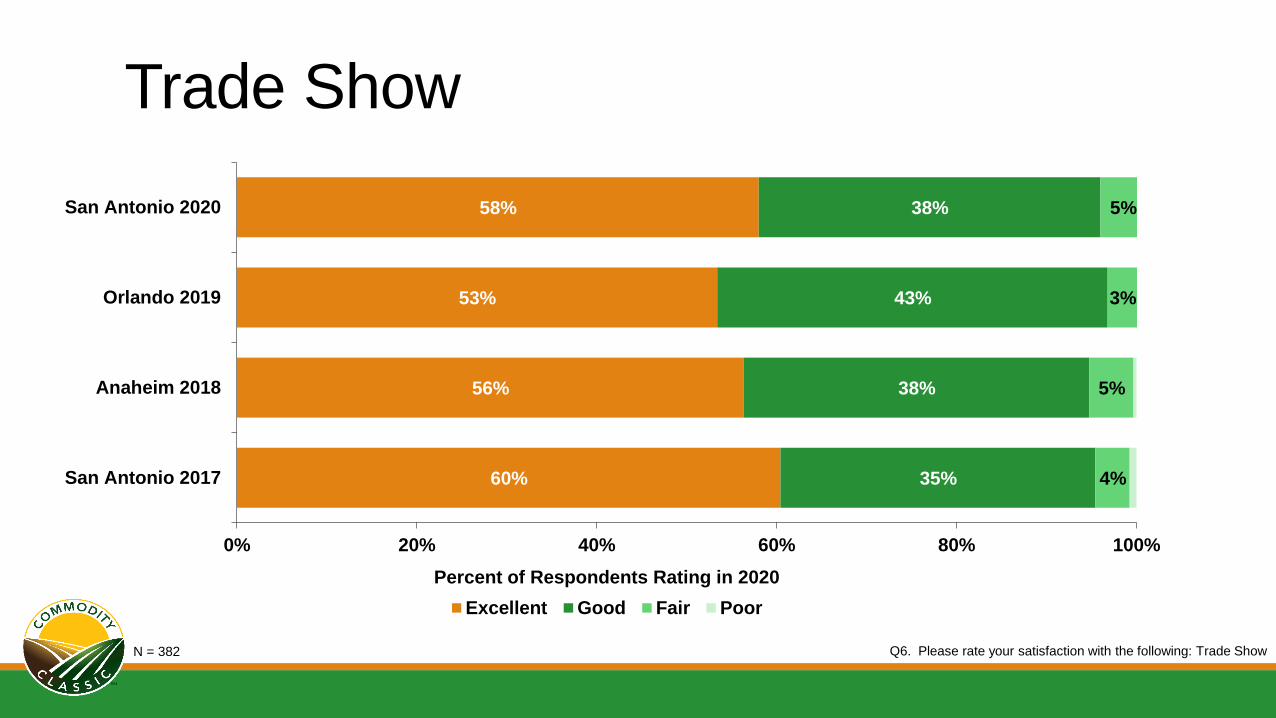
Trade Show
Q6. Please rate your satisfaction with the following: Trade Show
58%
53%
56%
60%
38%
43%
38%
35%
5%
3%
5%
4%
0% 20% 40% 60% 80% 100%
San Antonio 2020
Orlando 2019
Anaheim 2018
San Antonio 2017
Percent of Respondents Rating in 2020
Excellent Good Fair Poor
N = 382
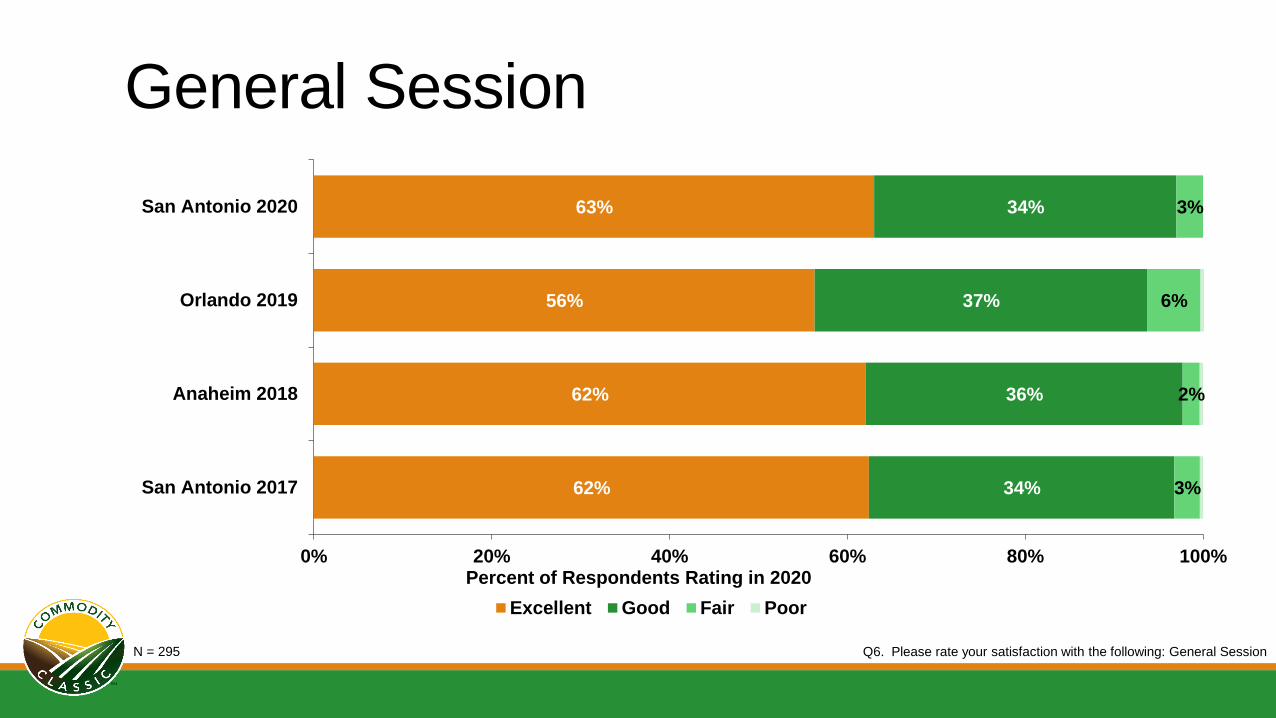
Q6. Please rate your satisfaction with the following: General Session
63%
56%
62%
62%
34%
37%
36%
34%
3%
6%
2%
3%
0% 20% 40% 60% 80% 100%
San Antonio 2020
Orlando 2019
Anaheim 2018
San Antonio 2017
Percent of Respondents Rating in 2020
Excellent Good Fair Poor
General Session
N = 295

Q6. Please rate your satisfaction with the following: Evening of Entertainment
54%
61%
47%
43%
30%
26%
30%
38%
12%
11%
14%
14%
4%
9%
5%
0% 20% 40% 60% 80% 100%
2020 Montgomery Gentry
2019 Charlie DanielsBand
2018 World ClassicRockers
2017 Pat Greene
Percent of Respondents Rating in 2020
Excellent Good Fair Poor
Evening of Entertainment
N = 193
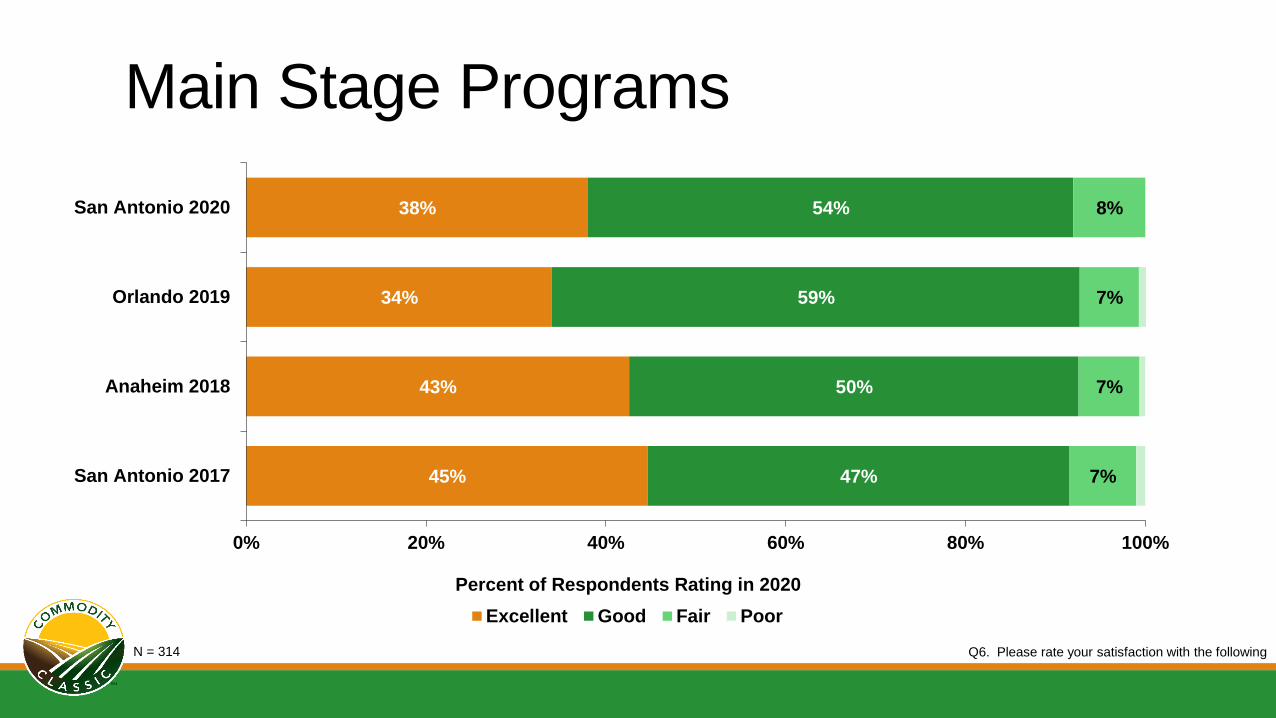
Q6. Please rate your satisfaction with the following
38%
34%
43%
45%
54%
59%
50%
47%
8%
7%
7%
7%
0% 20% 40% 60% 80% 100%
San Antonio 2020
Orlando 2019
Anaheim 2018
San Antonio 2017
Percent of Respondents Rating in 2020
Excellent Good Fair Poor
N = 314
Main Stage Programs
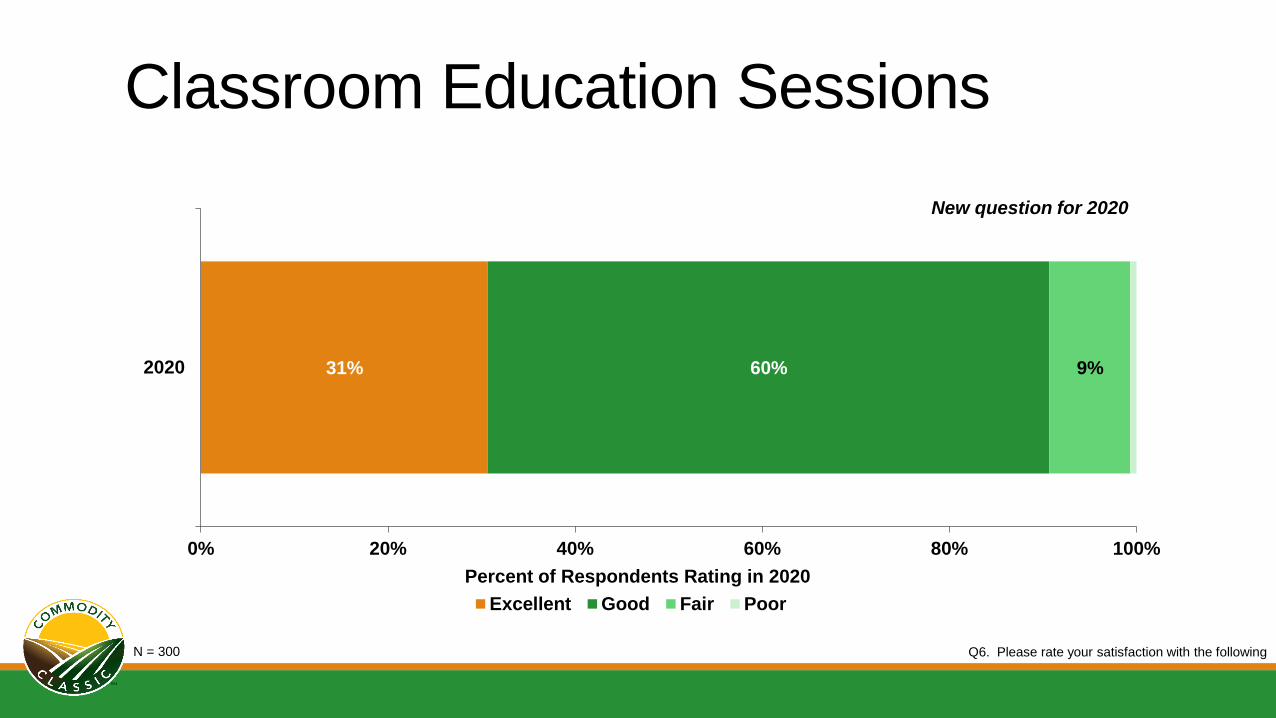
Q6. Please rate your satisfaction with the following
New question for 2020
31% 60% 9%
0% 20% 40% 60% 80% 100%
2020
Percent of Respondents Rating in 2020
Excellent Good Fair Poor
Classroom Education Sessions
N = 300

40% 52% 8%
0% 20% 40% 60% 80% 100%
2020
Percent of Respondents Rating in 2020Excellent Good Fair Poor
Q6. Please rate your satisfaction with the followingN = 159
New question for 2020
Association Business Meetings
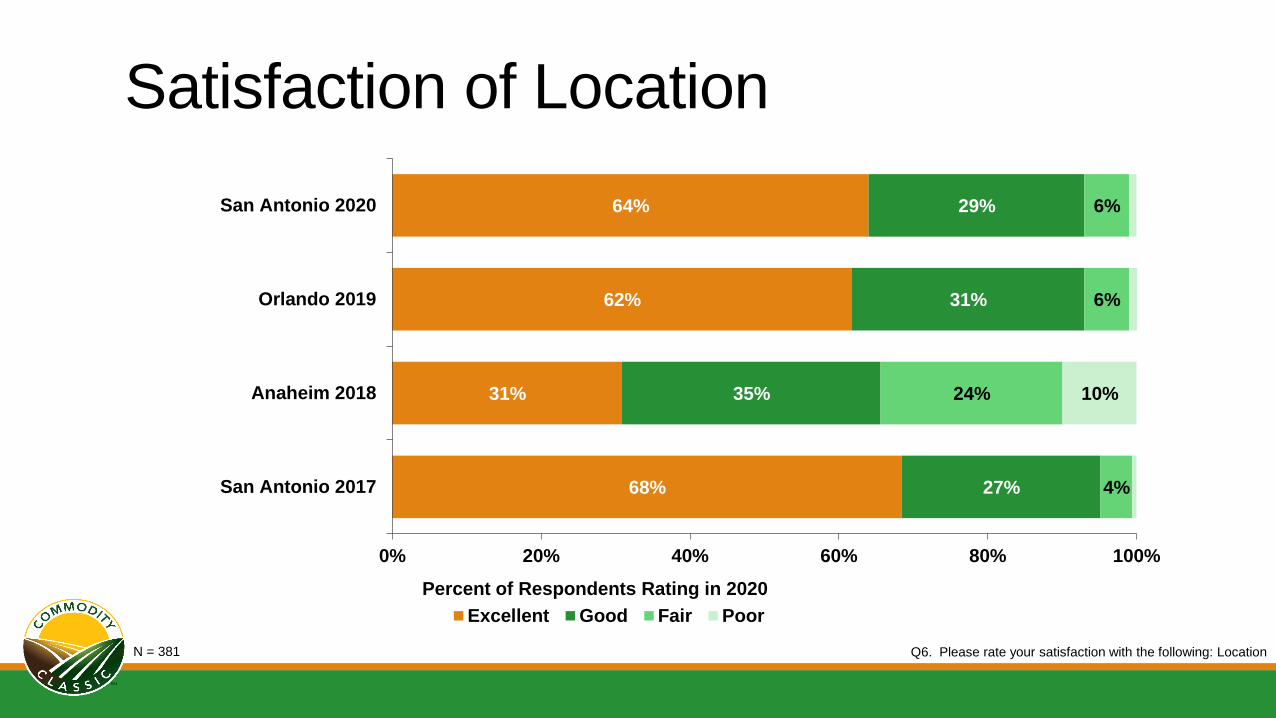
64%
62%
31%
68%
29%
31%
35%
27%
6%
6%
24%
4%
10%
0% 20% 40% 60% 80% 100%
San Antonio 2020
Orlando 2019
Anaheim 2018
San Antonio 2017
Percent of Respondents Rating in 2020
Excellent Good Fair Poor
Q6. Please rate your satisfaction with the following: LocationN = 381
Satisfaction of Location

35%
27%
23%
25%
27%
35%
29%
32%
36%
35%
45%
41%
2%
3%
3%
2%
0% 20% 40% 60% 80% 100%
San Antonio 2020
Orlando 2019
Anaheim 2018
San Antonio 2017
Percent of Respondents in 2020
Far Exceeded Expectations Slightly Exceeded Expectations Met Expectations Did Not Meet Expectations
Q3. Overall, would you say the 2020 Commodity Classic ...N = 383
Expectations vs. Experience
56%
48%
46%
56%
40%
49%
50%
40%
3%
4%
5%
3%
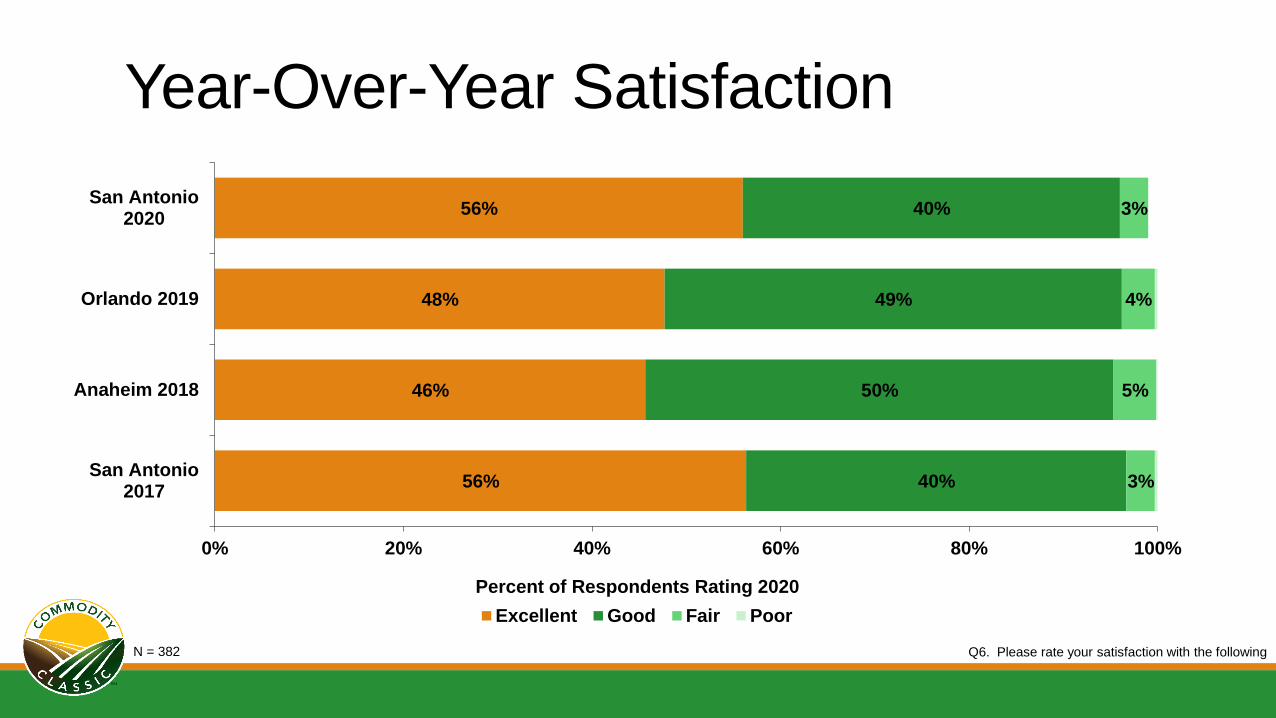
0% 20% 40% 60% 80% 100%
San Antonio2020
Orlando 2019
Anaheim 2018
San Antonio2017
Percent of Respondents Rating 2020
Excellent Good Fair Poor
Q6. Please rate your satisfaction with the followingN = 382
Year-Over-Year Satisfaction
Acres & Dollars ImpactA SUMMARY OF INSIGHT FROM POST-SHOW SURVEY
2020 COMMODITY CLASSIC
46
Sources
• Commodity Classic Registration
• Commodity Classic Surveys
• USDA NASS Crop Production Annual Summary (January 2020)
• USDA World Ag Supply & Demand Estimates (March 2020)
• USDA ERS Cost of Production (December 2019)
47

High Impact10,064,903 acres of these 4 crops in attendance
• Corn: 3,330,965
• Soybeans: 2,920,755
• Wheat: 2,364,669
• Sorghum: 1,448,515
Per Farm
Avg. Gross Farm Income: $ 1,586,573
Avg. Equipment Purchases: $ 401,411
Avg. Seed & Chem. Purchases: $ 298,962
Avg. Fertilizer Purchases: $ 196,421
48
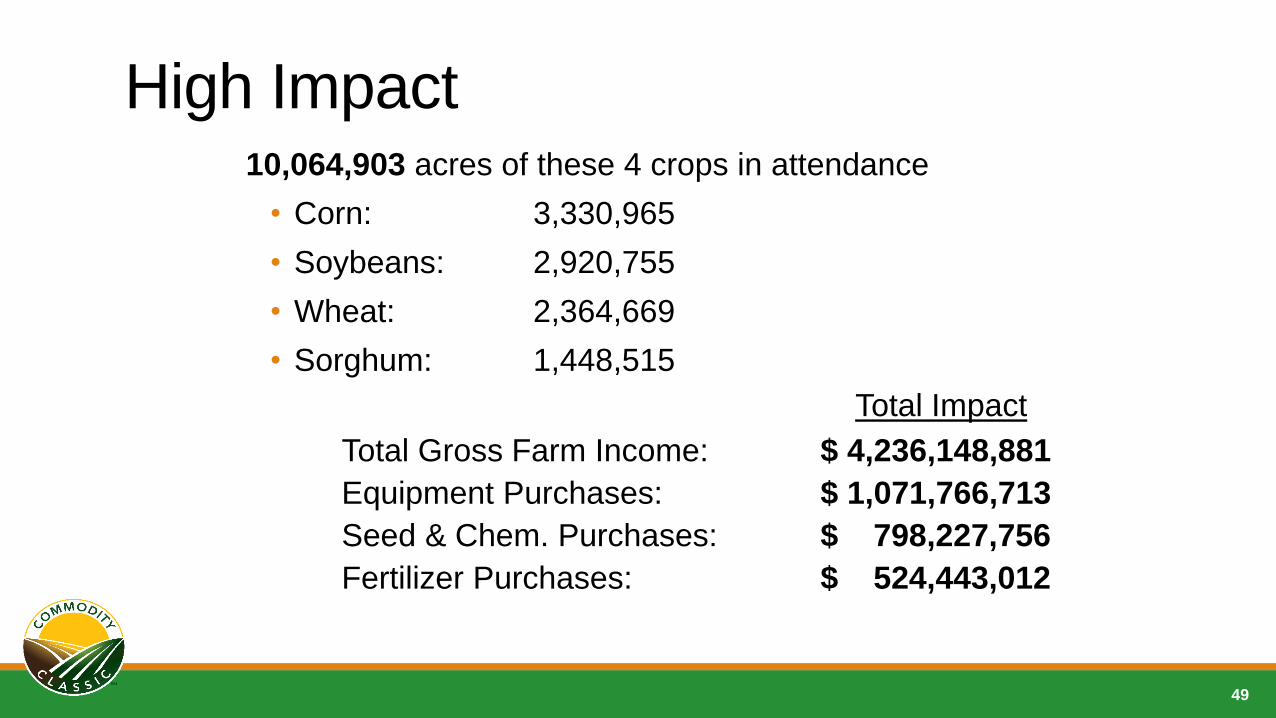
High Impact10,064,903 acres of these 4 crops in attendance
• Corn: 3,330,965
• Soybeans: 2,920,755
• Wheat: 2,364,669
• Sorghum: 1,448,515
Total Impact
Total Gross Farm Income: $ 4,236,148,881
Equipment Purchases: $ 1,071,766,713
Seed & Chem. Purchases: $ 798,227,756
Fertilizer Purchases: $ 524,443,012
49
Impact Beyond the Event
50

High Indirect Impact (Factor 6.04)
56,577,736 acres of the 4 crops influenced (29%)
• Corn: 20,119,027
• Soybeans: 17,641,360
• Wheat: 14,282,599
• Sorghum: 4,534,750
Total Influence
Total Gross Farm Income: $ 24,571,119,263
Equipment Purchases: $ 6,092,167,162
Seed & Chem. Purchases: $ 4,664,887,152
Fertilizer Purchases: $ 3,046,652,798
51

Q13. How likely are you to attend Commodity Classic next year in San Antonio, TX?
Likelihood of Attending Next Year
Over 88% of all attendees have interest in attending 2021 Commodity Classic
44%
40%
47%
44%
28%
27%
30%
25%
16%
21%
17%
18%
12%
12%
5%
14%
0% 20% 40% 60% 80% 100%
San Antonio 2020
Orlando 2019
Anaheim 2018
San Antonio 2017
Percent of Respondents in 2020 (n=383)
Top Box (10-9) Near Top (8-7) Mid (6-5) Bottom (4-0)
Mean
7.5
7.3
7.9
7.3