commodities reference guide
TRANSCRIPT

COMMODITIES REFERENCE GUIDE INTRODUCTION
1
INTRODUCTIONThe Commodities Reference Guide (CRG) provides information on food commodities distributedunder Title II of Public Law 480 (P.L. 480), as amended. This program is administered by theUnited States Agency for International Development (USAID) in conjunction with the UnitedStates Department of Agriculture (USDA), and comprises emergency and development activities.Since its inception in 1954, the P.L. 480 Program and other food assistance instruments havedistributed 375 million metric tons of US food commodities valued at well over $50 billion. In1990, the Congress amended the P.L. 480 legislation, reasserting the United States’ intent to use itsagricultural productivity to enhance food security in the developing world.
The CRG is an information tool, providing relevant information about the food commodities used inP.L. 480 Title II program. All food commodities are available to the P.L. 480 Program as long asthey are not determined to be in short supply by the US Secretary of Agriculture, a determinationthat is made every October (per Section 401(a) of the FAIR Act, 1996) by the Secretary ofAgriculture. The CRG is intended for use by Title II cooperating sponsors as they develop newproposals or modify previously approved activities. The CRG is designed to provide theseorganizations with a description of available food commodities, their nutritional values and physicalproperties, a guide to appropriate storage and handling, and important general information regardingtheir safe and effective use as rations in Title II programs that distribute food directly to recipients.It is also designed as a reference for USAID Food for Peace officers (FFP), other USAID officers,the staff of cooperating sponsors, and recipient governments and agencies that are involved indecision-making for planning, managing, controlling, and evaluating appropriate uses of Title IIfood commodities.
The CRG provides information on the food commodities that are in general use in the Title IIprogram in Part One (Title II Food Aid Commodities and Fact Sheets) and information andexamples on selecting rations for different program scenarios in Part Two (Guidelines for SelectingFood Aid Commodities). It should be noted that the information here is not a substitute for the verydetailed guidance provided by the Office of Food for Peace annual proposal guidance, themonetization manual, and the USAID food aid and food security policy paper. The CRG programexamples are for illustration. It does not attempt to anticipate all the ways in which rations mayenter into programs. The CRG is not intended to offer programming guidance, which is derivedfrom USAID policies on program design, management, performance monitoring and evaluationwhich are all available elsewhere. Policy guidance is provided in other documentation from theBureau for Humanitarian Assistance, Office of Food for Peace (BHR/FFP). The CRG web site doesprovide links to relevant representative complementary policy and program documents and key websites.
Title II food assistance programs illustrated in the CRG are geared to impact food security throughimproved access to food, increased availability of food and/or improved nutrition and utilization offood of the target groups. In addition to providing emergency relief from hunger and malnutrition,Title II programs emphasize sustainable food security and nutrition goals.
The following is a major revision and update of the original CRG, issued in January 1988, by the

COMMODITIES REFERENCE GUIDE INTRODUCTION
2
USAID/BHR/FFP. The decade following the publication of the CRG has seen significant changesthat necessitate updating both the content of the CRG and the methods of dissemination of thatcontent. New information regarding micronutrients and their importance in food assistance hasbecome available. Understanding has evolved on the bioavailability of micronutrients (e.g., theadvisability and feasibility of fortification of vegetable oil with vitamin A), the nutritional needs offood assistance recipients, methods for delivery of micronutrients, and changes in the fortificationrequirements for the U.S. food supply. Changes in the availability of key food commodities used tomake blended products also have affected the composition of the P.L. 480 food assistance basket.The 1999/2000 revision process has incorporated input from all the stakeholders: USAID, USDA,the cooperating sponsors and the commodity groups and includes input from headquarters and fieldpersonnel.
Significant advances in communication and information systems (e.g., satellite/wirelesscommunication, the Internet and the World Wide Web), have made it possible to present, publishand disseminate information in an entirely new fashion -- on the World Wide Web. Thus, the 1999edition of the CRG is available in both hard copy and on the USAID Web site as a downloadablePDF file, and can be accessed at http://www.usaid.gov. This method has the added advantage ofensuring that the CRG is updated and revised quickly and inexpensively to reflect new commodityspecifications or program requirements, making the CRG a vital, “evergreen” document.
Furthermore, users of the Guide anywhere in the world can share their decades of experience, offerrecipes, preparation methods, specific anecdotal information or suggestions regarding ways inwhich the CRG can be made more useful to recipients of Title II P.L. 480 food commodities.Similarly, USAID and USDA can update the nutritional composition data, reflecting state-of-the arttechnology, bioavailability data, and other related issues. Manufacturers of Title II foodcommodities are also able to offer timely input on packaging, distribution, insect and rodent control,and other operations-related matters. The use of web site technology makes all of the informationavailable at low cost and in short time frames.
The Commodities Reference Guide is organized into three parts:
Part One: TITLE II FOOD AID COMMODITIES AND FACT SHEETS
Section I provides a list of the food commodities generally used in Title II projectsalong with a brief description of each one, and explains the rationale for USDAexclusion of those in shortage in any given year.
Section II presents individual Commodity Fact Sheets. Included are detaileddescriptions of commonly used food commodities, including their nutritionalcontent, components, USDA specifications, and packaging information.
Section III addresses commodity storage and shelf life concerns.
Section IV provides information on controlling damages to food commodities.
Part Two: GUIDELINES FOR SELECTING FOOD AID COMMODITIES (Draft)

COMMODITIES REFERENCE GUIDE INTRODUCTION
3
The Overview section outlines the features of the Food for Peace Program and ageneral guideline for selecting food rations. The guidelines consist of five steps:(1) Program Design, (2) Suitability of Food Commodities, (3) Ration Specifications,(4) Ration Calculation, and (5) Ranking and Selection. In five Modules, these stepsare applied to types of programs in which food aid is commonly used. The followingmodules are designed so each can be read independently of the others:
Module 1 provides information for Maternal and Child Health and Nutritionprograms.
Module 2 provides information for Food for Work program components.
Module 3 provides information regarding Food for Education and school feedingprogram components
Module 4 provides information for Non-Emergency Humanitarian Assistance
Module 5 provides information for Emergency Programs
Part Three: ANNEXES (Draft)
Annex I – DefinitionsAnnex II – Tools and IndicatorsAnnex III – Recommended Energy Allowance TablesAnnex IV – Recommended Dietary Allowance TableAnnex V – Illustrative Commodity Prices
Comments on the draft parts of the guide and additional information on commodity specificationand P.L.480 program management can be obtained from
Tom MarchioneBureau for Humanitarian ResponseU.S. Agency for International Development1300 Pennsylvania Avenue, NWWashington, D.C. 20523E-mail: [email protected]
Sylvia GravesOffice of Food for PeaceU.S. Agency for International Development1300 Pennsylvania AvenueWashington, D.C. 20523E-mail: [email protected]

COMMODITIES REFERENCE GUIDE INTRODUCTION
4
List of Acronyms
BHR Bureau for Humanitarian ResponseCCC Commodity Credit CorporationCDO Cooperative Development OrganizationCFW Cash-for-WorkCIDA Canadian International Development AgencyCS Cooperating SponsorCSB Corn Soy BlendDA Development Assistance (funds)DAP Development Activity ProposalERS Economic Research Service (USDA)EU European UnionFAC Food Aid ConventionFAC Food Aid Coordinating Committee/Sierra
LeoneFACG Food Aid Consultative GroupFAMP Food Aid Management PlanFAO Food and Agriculture Organization of the
United NationsFFE Food-for EducationFFP Office of Food for Peace (in USAID/BHR
Bureau)FFP/DP Development Programs Division in FFPFFP/ER Emergency Response Division in FFPFFPO Food for Peace OfficerFFPr Food for Progress Program of P.L. 480 Title
IFFW Food-for-WorkFTE Full-time equivalent (direct-hire staff)FVA Bureau for Food and Voluntary AssistanceGDP Gross domestic productGHAI Greater Horn of Africa InitiativeGNP Gross national productICRC International Committee of the Red CrossICSM Instant Corn-Soy MilkIFPRI International Food Policy Research InstituteIGAD Inter-Governmental Authority on DevelopmentIMR Infant mortality rateIO International organizationIR Intermediate ResultISG Institutional Support GrantLAC Latin America and Caribbean Bureau (USAID)LDC Least developed countryLIFDC Low-Income Food-Deficit CountryMCH Maternal-Child HealthM&E Monitoring and evaluationMOU Memorandum of UnderstandingMT Metric ton(s)
NIS Newly Independent States ofthe Former Soviet Union
NGO Non-GovernmentalOrganization
OCF Other child feedingOFDA Office of U.S. Foreign Disaster
Assistance (USAID)OE Operating Expense (funds)ORT Oral Rehydration TherapyOYB Operating Year BudgetPAA Previously Approved (Title II)
ActivitySF Soy FortifiedSFB Soy-Fortified BulgurSFCM Soy-Fortified CornmealSFSG Soy-Fortified Sorghum GritsP.L. 480 U.S. Public Law 480PVO Private voluntary organizationR4 USAID’s Results Report and
Resources RequestREDSO Regional Economic
Development SupportOffice/USAID
Section 202(e) Section of USAID’s P.L.480authorizing funds to supportTitle II activities
SF School feedingSO Strategic ObjectiveSO1 BHR/FFP's Strategic
Objective #1SO2 BHR/FFP's Strategic
Objective #2SPO Special ObjectiveUNDP United Nations Development
ProgramUNHCR United Nations Office of the
High Commissioner forRefugees
UNICEF United Nations Children’sFund
USAID United States Agency forInternational Development
USDA United States Department ofAgriculture
WFS World Food SummitWSB Wheat Soy BlendWHO World Health Organization

COMMODITIES REFERENCE GUIDE INTRODUCTION
5
List of Cooperating Sponsors (FY 1997)
ACDI/VOCA Agricultural Cooperative Development International/Volunteers in Overseas Cooperative Assistance
ADRA Adventist Development and Relief AgencyAFRICARE AfricareAG.FOUND Agricultural FoundationAGUDATH Agudath Israel of America, Inc.AIA American International Association of the Hematologists of the World for
Children, Inc.AKF Aga Khan FoundationARC American National Red CrossCARE Cooperative for Assistance and Relief Everywhere, Inc.CARITAS/Bolivia Caritas BoliviaCARITAS/Peru Caritas PeruCFI Counterpart Foundation Inc.CHAMAH ChamahCITIHOPE CitiHope InternationalCNFA Citizens Network for Foreign AffairsCRM Christian Rescue MissionCRS Catholic Relief Services – USCCDOULOS Doulos Community, Inc.DPPC Disaster Prevention and Preparedness Commission/EthiopiaEOC Ethiopian Orthodox ChurchFAR Fund for Armenian ReliefFHI Food for the Hungry, Inc.FTC Feed the ChildrenGJARN Global Jewish Assistance Relief NetworkIOCC International Orthodox Christian CharitiesIPHD International Partnership for Human DevelopmentLEA Lishkas Ezras AchimMCI Mercy Corps InternationalNCBA/CLUSA National Cooperative Business AssociationNPA Norwegian Peoples’ AidOICI Opportunities Industrialization Centers International, Inc.PCI Project Concern InternationalPRISMA Projects in Agriculture, Rural Industry, Science & Medicine, Inc./PeruPROJECT AID Project AidREST Relief Society of TigrayRFCP/CBI Russian Farm Community Project, Inc./Cooperative Business InternationalSALESIANS (SSI) Salesian MissionsSAWSO Salvation Army World Service OfficeSCF Save the Children Federation, Inc.SHARE World SHARESUSTAIN Sharing U.S. Technology to Aid in the Improvement of NutritionTECHNOSERVE TechnoServeUMCOR United Methodist Committee on ReliefWFP World Food ProgramWINROCK/WI Winrock International Institute for Agricultural DevelopmentWVRD World Vision Relief and Development, Inc.

COMMODITIES REFERENCE GUIDE INTRODUCTION
6
CONVERSION TABLES
Cubic Measure1 cubic inch = 16.39 cubic centimeters1 cubic foot = 0.03 cubic meter1 cubic yard = 0.76 cubic meter
1 cubic centimeter = .06 cubic inch1 cubic meter = 35.31 cubic feet1 cubic meter = 1.31 cubic yard
Liquid Measure1 pint = 0.47 liter1 quart = 0.95 liter1 gallon = 3.79 liter
1 liter = 1.06 quarts1 kiloliter = 264.18 gallons
Weights1 grain = 0.06 gram1 ounce = 28.35 grams1 pound = 453.59 grams1 ton = 907.18 kilograms
1 gram = 15.43 grains10 grams = 0.35 ounce1 kilogram = 2.2 pounds1 metric ton = 2,204.6 pounds

COMMODITIES REFERENCE GUIDE SECTION I: COMMODITIES
1
SECTION ICommodities
This Section provides general characteristics of food commoditiesused in P.L. 480 Title II Program (Food for Peace Program).The commodities are inexpensive food staples used to providebasic nourishment to populations in extreme food securityemergencies as well as for development activities designed toaddress food security goals.
I COMMODITY AVAILABILITYWhile the Secretary of the United States Department ofAgriculture (USDA) determines the total supply of commodities,USAID’s Bureau for Humanitarian Response Food for PeaceOffice (USAID/BHR/FFP) coordinates the eligibility,procurement, allocation, and delivery of commodities with theUSDA. USAID also coordinates the development andimplementation of project procedures of cooperating sponsors,including private voluntary organizations (PVO), non-governmental organizations (NGO), international agencies, andthe World Food Programme (WFP).
The legal provisions for determining commodity eligibility forP.L. 480 were revised in the Federal Agricultural Improvementand Reform (FAIR) Act of 1996. Section 401(a) of this Actstipulates that all agricultural commodities are essentially eligiblefor programming under P.L. 480. T he only exception being whenthe Secretary of Agriculture determines that the inclusion of acommodity under P.L. 480 would reduce its domestic supply sothat it does not meet domestic requirements (includingcommercial exports) or provide for an adequate carryover. Underprior legislation, the Secretary of Agriculture used similar criteriato determine the specific commodities and the quantity of thosecommodities that were available for P.L. 480 programming.
Under Section 401(a) of the FAIR Act, the Secretary ofAgriculture continues to have the authority to determine if someportion of a commodity in short supply can be made available toaddress the urgent humanitarian purposes of this Act. Forexample, during fiscal year 1997, corn was defined as being inshort supply and therefore not available for P.L. 480, yet theSecretary of Agriculture determined that up to 700,000 metrictons of corn would be available to meet urgent humanitarian needsunder P.L. 480, Title II.
Table I 1
Commodities Provided by theUnited States Food AidPrograms in FY 1997:
Thousand Metric Tons
BEANS 26
BULGUR 68
CORN 269
CORN SOY MASA FLOUR 1
CORN SOY BLEND 211
CORNMEAL 24
COTTON 6
LENTILS 20
PEAS 30
RICE 218
NONFAT DRY MILK 1
SORGHUM 44
SOY BEAN MEAL 108
SOY BEANS 10
Soy-Fortified BULGUR 60
Soy-Fortified CORNMEAL 43
Soy-Fortified SORGHUM GRITS 14
TALLOW 2
VEGETABLE OIL 184
WHEAT 1,329
WHEAT FLOUR 161
WHEAT SOY BLEND 9
WHOLE DRY MILK 3
TOTAL: 2,841
In FY 1997, P.L. 480 Title IIdistributed a total of 1.66 millionmetric tons, valued at $821 million, to43 million people in 53 countries. TitleII accounted for approximately 58% ofthe entire P.L. 480 program.
(Source: USDA/FAS/ 11-18-97)

COMMODITIES REFERENCE GUIDE SECTION I: COMMODITIES
2
Commodity availability for P.L. 480 is also determined by the Bill Emerson Humanitarian Trust Act.This Act provides for a reserve of funds or up to 4 million metric tons of eligible commoditiesincluding wheat, rice, corn and sorghum. These commodities may be released to meet unanticipatedemergency needs under the P.L. 480 Title II program or when the domestic supply of eligiblecommodities is so limited that commodities in the reserve cannot be made available under theprovisions of P.L. 480, Section 401(a).
II GENERAL COMMODITY CHARACTERISTICS
A brief review of the general commodity characteristics is provided here to facilitate the selectionprocess. The commodities provided under P.L. 480 Title II programs generally fall into twocategories: A) non-processed foods, such as whole grains and pulses (legumes) and B) value-addedfoods, which are processed foods that are manufactured and fortified to particular specifications for theP.L. 480 Title II program on an as-needed basis. This category includes: milled commodities, soyfortified processed commodities, blended commodities, and fortified refined vegetable oil.
A more detailed fact sheet for each commodity is provided in Section II.
A. NON-PROCESSED FOODS
These commodities are whole grains and pulses (legumes) which have been cleaned but not ground,milled or heated. They have a long shelf life if stored under cool conditions and low humidity.
1. WHOLE GRAINSWhole grains are considered unprocessed. They are readily available and relativelyinexpensive. They are recommended for use primarily in regions that are familiar withprocessing and cooking these types of commodities. Whole grains normally need to be groundprior to use in cooking or baking.
Corn (Maize)This is whole-grain yellow corn. In some corn-consuming parts of the world, large-kernelwhite corn is preferred but yellow corn can be substituted for it. Due to its abundance, lowprice and widespread acceptance, whole corn is widely used in emergency programs, bothby relief agencies and recipient country governments.
SorghumThis unprocessed whole grain is used as a staple in parts of Asia and Africa. It has limitedutility as it can present problems of digestibility in areas where the population is notfamiliar with how to process it.
WheatWheat is widely accepted but requires more processing than the other whole grains to beconverted into food. It can be either soft or hard in texture and white or red in color. Softwheat is often closer to the type of wheat used in most recipient countries and is the easiestto process into flour at home. Hard red wheat is prized for use by commercial mills to

COMMODITIES REFERENCE GUIDE SECTION I: COMMODITIES
3
make into bread flour. Hard wheat and durum wheat is used by mills to produce semolinafor use in couscous and pasta.
2. PULSES (LEGUMES)Dry beans, peas and lentils fall into the category of pulses (or legumes). There are manyvarieties grown in the Unites States that can match local preferences. Pulses are high proteinfoods and good natural sources of fiber, B vitamins and minerals. Beans, in particular, are highin iron. They generally have a good market value locally. Taste and variety preferences varysignificantly within and between countries. Pulses can be used in all categories of food aidprograms.
The combination of pulses and cereals, such as rice and beans, provide the diet a better qualityof protein than either one consumed separately. Pulses need to be cleaned to remove any debrisprior to preparation. Cooking times and water and fuel requirements vary based on size andage (smaller, fresher varieties cook faster). Most beans and whole peas need to be soaked inwater prior to preparation.
Dry BeansWhite, red/pink, and other colored varieties are grown in the United States. Beans are eatenthroughout the world. Central/Latin America and the Caribbean and the Great LakesRegion of Africa are bean-eating regions. Taste, size and color preferences differ widely.For example, Black Beans are eaten in most of Brazil while Small Reds are preferred inNicaragua. Title II programs historically have used about ten varieties: Black Beans, DarkRed Kidney Beans, Great Northern Beans, Light Red Kidney Beans, Navy Beans (PeaBeans), Pink Beans, Pinto Beans, and Small Red Beans. Other varieties are available.Specific variety and acceptable alternates should be specified when ordering.
Dry Whole and Split PeasDry Peas (Green Peas, Split Green Peas, Yellow Peas, Split Yellow Peas) are used in manyP.L. 480 Title II programs, as inexpensive protein sources. Peas are dried naturally by thesun. Split peas have shorter cooking times than beans and do not need to be soaked. Wholepeas need to be soaked overnight. Specific variety and acceptable alternates should bespecified when ordering.
LentilsLentils are preferred throughout Asia, where color and taste preferences are local. They areeasy to prepare, as they require no soaking, have shorter cooking times and need less fuelrequirements than most beans and whole peas. The most common type used in P.L. 480Title II programs is the U.S. Regular Lentil. Other types grown in the U.S. are Red Chief,Pardina, Eston, Crimson and Grande Lentils.
B. VALUE ADDED COMMODITIES
1. MILLED COMMODITIESMany raw commodities are ground and purified in order to make them more acceptable andeasier to prepare and consume. This often results in a decrease in micronutrients from their

COMMODITIES REFERENCE GUIDE SECTION I: COMMODITIES
4
whole-grain equivalent, but they are normally fortified with calcium and iron and enriched withfour B vitamins (including folic acid) to restore some of the lost nutrients.
Corn Masa FlourCorn soy masa flour is made from lime-treated whole corn. It is primarily intended for usein the preparation of tortillas and similar products but may also be used to make gruel.
Cornmeal (Maize or Mealy Meal)Ground, degermed, yellow cornmeal can be used to make porridge, ugali or baked items. Itis fortified with iron, calcium, vitamin A and four B vitamins.
RiceWhite rice is processed from long, medium or short grain rough rice by removing the hulland bran layers. Parboiled rice is precooked with a steam-pressure process that gelatinizesthe starch and ensures a firmer, more separate grain. The kernel in the process absorbssome of the fiber and minerals from the bran layer as well. Rice has high acceptability andmarket value in many parts of the world. It has all eight of the essential amino acids, and isa good source of other essential nutrients: thiamin, riboflavin, niacin, phosphorous, ironand potassium. White rice provided under this program is not fortified with vitamins andminerals.
Sorghum GritsDegermed and dehulled sorghum grain can be prepared similar to rice or employed as abaking ingredient. It is used mainly in Africa and parts of Asia.
Wheat BulgurBulgur is made from cleaned, cracked, debranned, partially precooked whole wheat. It isoften accepted as a substitute for rice and prepared in a similar manner. Bulgur is fortifiedwith minerals and vitamins to same levels as in cornmeal.
Wheat FlourAll-purpose flour made from hard wheat can be used in a variety of applications includingbread making. It is fortified with iron, calcium, vitamin A and four B vitamins.
2. SOY-FORTIFIED PROCESSED FOODSSoy flour is added to cereals because it greatly improves their protein content and quality. Soyfortified processed foods are used as staples in all categories of P.L. 480 Title II programs.They have been formulated to resemble as much as possible the appearance and taste of similarunfortified foods.
Corn Soy Masa Flour, InstantCorn soy masa flour is made from lime-treated whole corn, fortified with 5% soy flour, plusvitamins and minerals. It is primarily intended for use in the preparation of tortillas andsimilar products but may also be used to make gruel.

COMMODITIES REFERENCE GUIDE SECTION I: COMMODITIES
5
Soy-Fortified BulgurCracked, debranned, and partially precooked bulgur wheat is fortified with 15 percent soygrits and vitamins and minerals. It is often accepted as a substitute for rice and is generallyused to make porridge. Soy-fortified bulgur is also fortified with minerals and vitamins tosame levels as bulgur and cornmeal.
Soy-Fortified CornmealDegermed cornmeal is fortified with 15 percent soy flour and vitamins and minerals. Soy-fortified cornmeal can be prepared the same way as plain cornmeal.
Soy-Fortified Sorghum GritsSoy-fortified sorghum grits is degermed and dehulled grain sorghum that has been fortifiedwith 15 percent soy grits. They are a good replacement for rice in rice-consuming areas ofthe world.
3. BLENDED FOODSBlended foods consist of a granulated mixture of partially precooked cereal flour, soy flour,vegetable oil, and vitamins and minerals. (See Table I 2 for composition.) Blended foods arenutrient-dense due to their fortification with protein and a full range of 11 vitamin and 6minerals, as shown in Table I 3. They require minimal cooking (only five to seven minutes),are easily digestible and are widely accepted, making them usable in Maternal and Child Healthprograms and emergency programs. They retain stability during storage for at least one year at77°F.
Blended foods or formulated cereal foods, as they also are called, were introduced into theprogram in August 1966. They were intended to be a substitute for nonfat dry milk and toserve as a high quality protein source for weaning-age children, older preschool-age children,pregnant women, and other malnourished individuals. The vitamin and mineral fortificationlevels make blended foods a good vehicle to boost micronutrient intakes in vulnerablepopulations. If blended foods are used as the primary component of the diet, sugar or vegetableoil should be added to increase their energy density.
Corn Soy Blend (CSB)Corn soy blend has a bland flavor and tan color and has been widely used in P.L. 480 TitleII programs, especially in India for MCH programs. CSB is a blend of partially cookedcornmeal, soy flour, salt, vegoil, plus vitamins and minerals. It is often used for weaning-age children in the form of a thin, drinkable gruel. The only preparation necessary is to mixCSB with water in the appropriate proportions and boil for 5 to 7 minutes. Many otherpreparations are possible. Vitamin A and C retention is improved if prepared into a thickpaste, or ugali. Additional salt, sugar and other ingredients may be added for flavor.
Wheat Soy Blend (WSB)WSB is a blend of partially precooked wheat or bulgur flour, wheat protein concentrate, andsoy flour. It is supplemented by oil, salt, vitamins and minerals. Unlike the bland taste ofCSB, WSB has a distinctive wheat-type flavor and a darker color. It produces a thickerpaste than CSB with the same level of added water and can be formed into dumplings. It is

COMMODITIES REFERENCE GUIDE SECTION I: COMMODITIES
6
quite versatile and used in many programs.
4. FORTIFIED REFINED VEGETABLE OIL (EDIBLE VEGOIL)Fortified refined vegetable oil is made from refined, deodorized, and bleached vegetable oilthat is then further purified, filtered, fortified, and packaged. Normally, it is derived fromsoybean oil, although, based on availability, corn oil, sunflower oil, cottonseed oil, peanut oil,or rapeseed oil, individually or in combination may be utilized.
Unless otherwise specified in the request, all refined vegetable oil must be fortified withvitamin A to a level of 60 to 75 IU/g. Edible vegoil has a high caloric density, providesessential fatty acids and aids in the absorption of fat-soluble vitamins. It increases the fluidityof cereal foods, making it an important component of feeding programs for young children.Vegetable oil is used as an ingredient in cereal dishes, such as porridge or rice, and is used as acooking medium for frying and sautéing foods.

COMMODITIES REFERENCE GUIDE SECTION I: COMMODITIES
7
Table 1 2 Composition of Blended Commodities Provided under P.L. 480 Title II
Ingredient CSB WSBCornmeal, processed 69.9 %Soy flour, defatted, toasted 21.8 % 20.0 %Bulgur flour 52.9 %Wheat Protein Concentrate 20.0 %Soybean oil 5.5 % 4.0 %Vitamin premix 0.1 % 0.1 %Tricalciumphosphate 2.0 % 2.0 %Salt/Mineral premix 1.0 % 2.7 %
Table 1 3 Micronutrient Addition Level Standards for Fortified Blended Foods Provided underP.L. 480 Title II*
Micronutrient units per100g
Current CSB/WSBLevels Added
Calcium mg 775Calcium d Pantothenate mg 2.76Folic acid mg 0.20Iodine ug 57Iron mg 14.7Magnesium mg 82.5Niacin mg 4.96Pyridoxine HCl mg 0.17Riboflavin mg 0.39Salt g 0.81Thiamin mg 0.28Vitamin A IU 2,315Vitamin B12 ug 3.97Vitamin C mg 40.1Vitamin D IU 198Vitamin E IU 7.5Zinc mg 3.98
*(WFP has other nutrient level specifications, which are lower in all cases exceptRiboflavin, Vitamin C and Zinc)

COMMODITIES REFERENCE GUIDE SECTION I: COMMODITIES
8
P.L. 480 TITLE II Generally Used Commodities
Beans• Black Beans• Kidney Beans (Light Red, Dark Red, All types)• Great Northern Beans• Blackeye Beans (Cowpeas)• Pink Beans• Pinto Beans• Small Red Beans• Navy Beans (Pea Beans)
Bulgur (BW)Bulgur, Soy Fortified (SFBW)Corn (bagged, bulk)CornmealCorn Meal, Soy Fortified (CMSF)Corn Soy Blend (CSB)Corn Masa FlourCorn Soy Masa FlourLentilsPeas
• Green Peas (whole, split)• Yellow Peas (whole, split)
Rice, milled non-parboiled (bagged, bulk)Rice, milled parboiled (bagged, bulk)Sorghum (bagged, bulk)Sorghum Grits, Soy Fortified (SFSG)Soybeans (bagged, bulk)Soybean Meal (bulk)Fortified Refined Vegetable Oil (Edible Vegoil)Wheat (bagged, bulk)Wheat Flour (all purpose [AP] flour, bread flour)Wheat, Soy Blend (WSB)
For further information on restricted and available commodities see the FFP web site,http://www.info.usaid.gov/hum_response/ffp/.

COMMODITIES REFERENCE GUIDE SECTION I: COMMODITIES
9
III REFERENCES
U.S. International Food Assistance Report 1997. USDA/FAS/ 11-18-97.
Title II P.L. 480 Commodities List. USAID/BHR/FFP/POD. http://www.usaid.gov/
USDA/FSA/PDD/EOB. December, 1997. http://fas.usda.gov/

COMMODITIES REFERENCE GUIDE FACT SHEET: LENTILS
27
LentilsThese are dry whole lentils with seedcoat. They can be used in all program categories.
1. NUTRITIONAL VALUES (per 100 g)These are average values, taken from the U.S. Departmentof Agriculture, Agricultural Research Service(USDA:ARS) 1998 USDA Nutrient Database, Release 12,Laboratory Home Page,(http://www.nal.usda.gov/fnic/foodcomp). These nutrientvalues are provided as a guide for use in the calculation offood aid rations; users should be aware that shipments offood aid may vary from these exact values.
2. COMPONENTS100% Lentils, unprocessed, whole
3. SPECIFICATIONSLentils shall be grade U.S. No. 3 or better.
(Source: USDA:FSA:PDD:EOB December, 1997.Contact 202-690-3565http://www.fas.usda.gov/excredits/pl480/commodities/peabeans.htm)
4. PACKAGING50 kg (110.23 lb.) woven polypropylene bags. This fabriccontains an inhibitor to resist ultra-violet absorption alongwith an anti-skid coating.
5. SHELF LIFEOne year. See “Section III: Storage/Shelf LifeSpecifications” for more information.
Nutrient Amount UnitWater 11.2 gEnergy 338.0 KcalProtein 28.1 gTotal Lipid 1.0 gCarbohydrate 57.1 gFiber, total dietary 30.5 gAsh 2.7 gCalcium 51 mgIron 9.02 mgMagnesium 107 mgPhosphorus 454 mgPotassium 905 mgSodium 10.0 mgZinc 3.6 mgCopper 0.9 mgManganese 1.4 mgSelenium 8 mcgVitamin C 6 mgThiamin 0.48 mgRiboflavin 0.25 mgNiacin 2.62 mgPantothenic acid 1.8 mgVitamin B-6 0.5 mgFolate 433 mcgVitamin B-12 0 mcgVitamin A 39 IUVitamin E 0.3 mg-ATEVitamin D n/a IUIodine n/a mcg

COMMODITIES REFERENCE GUIDE FACT SHEET: PEAS
28
PeasThese unprocessed commodities are used as protein sources in all categories of programs. Local tastesand preferences differ. Peas are available as whole or split, green or yellow varieties. Please specifypea variety (including color and whether whole or split peas) preferred and any alternates that areculturally acceptable.
1. NUTRITIONAL VALUES (per 100 g)These are average values, taken from the U.S.Department of Agriculture, Agricultural ResearchService (USDA:ARS) 1998 USDA NutrientDatabase, Release 12, Laboratory Home Page,(http://www.nal.usda.gov/fnic/foodcomp). Thesenutrient values are provided as a guide for use in thecalculation of food aid rations; users should be awarethat shipments of food aid may vary from these exactvalues.
2. COMPONENTS100% Whole or Split Green or Yellow Peas.
3. SPECIFICATIONSWhole dry peas shall be Grade U.S. No. 2 or better,except U.S. No. 3 or better because of cracked seedoats. Split peas shall grade U.S. No. 2 or better.
(Source: USDA:FSA:PDD:EOB December, 1997.Contact 202-690-3565http://www.fas.usda.gov/excredits/pl480/commodities/peabeans.htm)
4. PACKAGING50 kg (110.23 lb.) woven polypropylene bags. Thisfabric contains an inhibitor to resist ultra-violetabsorption along with an anti-skid coating.
5. SHELF LIFEAt least one year. See “Section III: Storage/Shelf LifeSpecifications” for more information.
Nutrient Amount UnitWater 11.3 gEnergy 341.0 KcalProtein 24.6 gTotal Lipid 1.2 gCarbohydrate 60.4 gFiber, total dietary 25.5 gAsh 2.7 gCalcium 55 mgIron 4.4 mgMagnesium 115 mgPhosphorus 366 mgPotassium 981 mgSodium 15 mgZinc 3.0 mgCopper 0.9 mgManganese 1.4 mgSelenium 1.6 mcgVitamin C 1.8 mgThiamin 0.7 mgRiboflavin 0.2 mgNiacin 2.9 mgPantothenic acid 1.8 mgVitamin B-6 0.2 mgFolate 273.8 mcgVitamin B-12 0 mcgVitamin A 149 IUVitamin E 0.3 mg-ATEVitamin D n/a IUIodine n/a mcg

COMMODITIES REFERENCE GUIDE FACT SHEET: RICE (NON-PARBOILED)
29
Rice(Non-parboiled)
This processed, milled commodity is used in all categories of programs as a staple food
1. NUTRITIONAL VALUES (per 100 g)These are average values, taken from the U.S.Department of Agriculture, Agricultural ResearchService (USDA:ARS) 1998 USDA Nutrient Database,Release 12, Laboratory Home Page,(http://www.nal.usda.gov/fnic/foodcomp). Thesenutrient values are provided as a guide for use in thecalculation of food aid rations; users should be awarethat shipments of food aid may vary from these exactvalues.
2. COMPONENTS100% Rice.
3. SPECIFICATIONSMilled from short, long, or medium grain rice, U.S.Grade No. 5 or better, containing not more than 20percent broken kernels. Not more than ten days prior topackaging, fumigate with Methyl Bromide or Phostoxinto inhibit infestation by weevils or other insects. Therice shall be long, medium, or short grain milled ricegrading U.S. No. 5 or better, except the rice shall bereasonably well-milled and not contain more than 20 %broken kernels.
Unless otherwise specified, milled rice of the specialgrades "parboiled light" or "parboiled" which meet classand grade specifications shall be acceptable. Nospecialty rice, including but not limited to aromatic rice,shall be acceptable unless specified in the applicableinvitation for offers.(Source: USDA:FSA:PDD:EOB April, 1996.Contact 202-690-3565http://www.fas.usda.gov/excredits/pl480/commodities/no5rice.htm)
4. PACKAGING50 kg (110.23 lb.) woven polypropylene bags. Thisfabric contains an inhibitor to resist ultra-violetabsorption along with an anti-skid coating.
Nutrient Amount UnitWater 11.6 gEnergy 365.0 KcalProtein 7.1 gTotal Lipid 0.7 gCarbohydrate 80.0 gFiber, total dietary 1.3 gAsh 0.6 gCalcium 28 mgIron 0.80 mgMagnesium 25 mgPhosphorus 115 mgPotassium 115 mgSodium 5.0 mgZinc 1.1 mgCopper 0.2 mgManganese 1.1 mgSelenium 15 mcgVitamin C 0 mgThiamin 0.07 mgRiboflavin 0.05 mgNiacin 1.60 mgPantothenic acid 1.0 mgVitamin B-6 0.2 mgFolate 8 mcgVitamin B-12 0 mcgVitamin A 0 IUVitamin E 0.1 mg-ATEVitamin D n/a IUIodine n/a mcg
5. SHELF LIFEAt least one year. See “Section III:Storage/Shelf Life Specifications” formore information.

COMMODITIES REFERENCE GUIDE FACT SHEET: RICE (PARBOILED)
30
Rice(Parboiled)
This processed, milled commodity is used in all categories of programs as a staple food
1. NUTRITIONAL VALUES (per 100 g)These are average values, taken from the U.S.Department of Agriculture, Agricultural ResearchService (USDA:ARS) 1998 USDA Nutrient Database,Release 12, Laboratory Home Page,(http://www.nal.usda.gov/fnic/foodcomp). Thesenutrient values are provided as a guide for use in thecalculation of food aid rations; users should be awarethat shipments of food aid may vary from these exactvalues..2. COMPONENTS100% Rice.
3. SPECIFICATIONSMilled from short, long, or medium grain rice, U.S.Grade No. 5 or better, containing not more than 20percent broken kernels. Not more than ten days prior topackaging, fumigate with Methyl Bromide or Phostoxinto inhibit infestation by weevils or other insects. Therice shall be long, medium, or short grain milled ricegrading U.S. No. 5 or better, except the rice shall bereasonably well-milled and not contain more than 20 %broken kernels.
Unless otherwise specified, milled rice of the specialgrades "parboiled light" or "parboiled" which meet classand grade specifications shall be acceptable. Nospecialty rice, including but not limited to aromatic rice,shall be acceptable unless specified in the applicableinvitation for offers.(Source: USDA:FSA:PDD:EOB April, 1996.Contact 202-690-3565http://www.fas.usda.gov/excredits/pl480/commodities/no5rice.htm)
4. PACKAGING50 kg (110.23 lb.) woven polypropylene bags. Thisfabric contains an inhibitor to resist ultra-violetabsorption along with an anti-skid coating.
Nutrient Amount UnitWater 10.2 gEnergy 371.0 KcalProtein 6.8 gTotal Lipid 0.6 gCarbohydrate 81.7 gFiber, total dietary 1.7 gAsh 0.8 gCalcium 60.0 mgIron 1.5 mgMagnesium 31.0 mgPhosphorus 136.0 mgPotassium 120.0 mgSodium 5.0 mgZinc 1.0 mgCopper 0.2 mgManganese 0.9 mgSelenium 23.0 mcgVitamin C 0.0 mgThiamin 0.1 mgRiboflavin 0.1 mgNiacin 3.6 mgPantothenic acid 1.1 mgVitamin B-6 0.4 mgFolate 17.0 mcgVitamin B-12 0.0 mcgVitamin A 0.0 IUVitamin E 0.1 mg-ATEVitamin D n/a IUIodine n/a mcg
5. SHELF LIFEAt least one year. See “Section III:Storage/Shelf Life Specifications” formore information.

COMMODITIES REFERENCE GUIDE FACT SHEET: SORGHUM
31
SorghumThis unprocessed whole grain is intended primarily for distribution in emergency situations and inFood for Work programs in those areas where sorghum is a common staple food.
1. NUTRITIONAL VALUES (per 100 g)These are average values, taken from the U.S.Department of Agriculture, Agricultural ResearchService (USDA:ARS) 1998 USDA NutrientDatabase, Release 12, Laboratory Home Page,(http://www.nal.usda.gov/fnic/foodcomp). Thesenutrient values are provided as a guide for use in thecalculation of food aid rations; users should be awarethat shipments of food aid may vary from these exactvalues.
2. COMPONENTS100% Yellow or white grain sorghum grown in theUnited States.
3. SPECIFICATIONSClass: Yellow or white. Dehulled or
degermed.Grade: No. 2 or better
4. PACKAGING50 kg (110.23 lb.) woven polypropylene bags. Thisfabric contains an inhibitor to resist ultra-violetabsorption along with an anti-skid coating.
5. SHELF LIFEAt least one year. See “Section III: Storage/Shelf LifeSpecifications” for more information.
Nutrient Amount UnitWater 9.2 gEnergy 339.0 KcalProtein 11.3 gTotal Lipid 3.3 gCarbohydrate 74.6 gFiber, total dietary n/a gAsh 1.57 gCalcium 110.0 mgIron 3 mgMagnesium n/a mgPhosphorus 287.00 mgPotassium 350 mgSodium 6 mgZinc n/a mgCopper n/a mgManganese n/a mgSelenium n/a mcgVitamin C 0 mgThiamin 0 mgRiboflavin 0.26 mgNiacin 3.53 mgPantothenic acid n/a mgVitamin B-6 n/a mgFolate 150.0 mcgVitamin B-12 0 mcgVitamin A 2205 IUVitamin E 0.00 mg-ATEVitamin D n/a IUIodine n/a mcg

COMMODITIES REFERENCE GUIDE FACT SHEET: SORGHUM GRITS, SOY-FORTIFIED
32
Sorghum Grits, Soy-Fortified This processed commodity is generally used for emergency programs, and where sorghum is a localstaple food, for other categories.
1. NUTRITIONAL VALUES (per 100 g)These are average values, taken from the U.S.Department of Agriculture, Agricultural ResearchService (USDA:ARS) 1998 USDA Nutrient Database,Release 12, Laboratory Home Page,(http://www.nal.usda.gov/fnic/foodcomp). Thesenutrient values are provided as a guide for use in thecalculation of food aid rations; users should be awarethat shipments of food aid may vary from these exactvalues. The values for thiamin, riboflavin, niacin,vitamin A, calcium and iron represent the minimumlevels of enrichment nutrients (converted to a 100 gbasis) as listed in Specifications below.
2. COMPONENTS85% Sorghum Grits: Sorghum Yellow or white grain
sorghum which has seedcoat,hulls, and germ removed.
15% Soy Beans: Cracked, dehulled, defatted andtoasted, (or expeller) processedfrom selected soybeans.
3. SPECIFICATIONSClass: Yellow or white grain sorghum as defined by
“Official United States Standards for Grain,”revised February 1970, pages 6.1-6.4, exceptthat the grain must contain no more than 2%of kernels having brown subcoats.
Grade: US No. 1, US No. 2, or US No. 3, ifdowngraded because of moisture only.
Other: The grain must be thoroughly cleaned toremove stones, sticks, trash, weed seeds, andshriveled kernels; dehulled; degermed; andreduced to grits. The sorghum must be milledto remove seed coat so that the product colorand general appearance will be that of typicalsorghum grits which are reasonably well-milled. (See Table next page.)
Nutrient Amount UnitWater 8.9 gEnergy 337.2 KcalProtein 17.3 gTotal Lipid 3.0 gCarbohydrate 68.5 gFiber, total dietary n/a gAsh 2.3 gCalcium 110 mgIron 2.90 mgMagnesium n/a mgPhosphorus 345 mgPotassium 655 mgSodium 8.1 mgZinc n/a mgCopper n/a mgManganese n/a mgSelenium n/a mcgVitamin C 0 mgThiamin 0.44 mgRiboflavin 0.26 mgNiacin 3.53 mgPantothenic acid n/a mgVitamin B-6 n/a mgFolate 150 mcgVitamin B-12 0 mcgVitamin A 2205.00 IUVitamin E 0.0 mg-ATEVitamin D n/a IUIodine n/a mcg
4. PACKAGING25 kg (55 lb.) multi-wall paper bags.Three plies of paper (minimum) with aninner polyethylene plastic liner. The outerpaper ply is treated to provide wetstrength.
5. SHELF LIFEAt least one year. See “Section III:Storage/Shelf Life Specifications” formore information.

COMMODITIES REFERENCE GUIDE FACT SHEET: SORGHUM GRITS, SOY-FORTIFIED
33
CHEMICAL AND PHYSICAL REQUIREMENTSREQUIREMENT 1
ITEM Minimum Maximum Moisture, % -- 13.5Protein (Nx6.25), % 2 15.0 --Crude Fat, % 2 -- 2.0Ash, % 2 -- 3
Crude Fiber, % 2 -- 2.1Total bacterial count per gram 4 -- 50,000Material that will pass through a U.S. Standard No. 8woven-wire-cloth sieve, % 90.0 --Material that will pass through a U.S. Standard No. 14woven-wire-cloth sieve, % -- 35.0Material that will pass through a U.S. Standard No. 30woven-wire-cloth sieve, % -- 5.0
1 All percentages are on the basis of weight.2 These limiting values are on a moisture-free basis.3 For maximum ash see Table on “Maximum Ash Allowable Without Discount at Specified Calcium Levels” (paragraph9.D) in USDA Specifications.4 Bacterial plate count in excess of 50,000 per gram will constitute rejection. However, at contractor’s request only, thefollowing additional requirements will apply: If the bacterial plate count is higher than 50,000 per gram but not more than500,000 per gram, product will be rejected, unless coliform count does not exceed 100 organisms per gram of product. Ifthe bacterial plate count is higher than 500,000 per gram but not more than 1,000,000 per gram, product will be rejected,unless the product is proved to contain:
1. No more than 100 coliform per gram.2. No more than 10 staph aureus per gram.3. No salmonella in 20 grams of product.
If bacterial plate counts higher than 1,000,000 organisms per gram, product will be rejected. Cost of additional testingrequired for acceptance of product having plate counts in excess of 50,000 per gram will be for contractor’s account.
ENRICHMENT INGREDIENTS Minimum Maximum Thiamine, mg/lb. 2.0 3.0Riboflavin, mg/lb. 1.2 1.8Niacin or niacinamide, mg/lb. 16.0 24.0Iron (reduced iron, 325 mesh to be used as the iron source), mg/lb. 13.0 26.0Vitamin A Palmitate, IU/lb. 10,000 12,000Calcium (in harmless and assimilable form), mg/lb. 500 750
(Source: USDA:FSA:PDD:EOB January 12, 1998. Contact 202-690-3565;SFSG9: PURCHASE OF SOY-FORTIFIED SORGHUM GRITS FOR USE IN EXPORT PROGRAMS –SPECIFICATIONS)

COMMODITIES REFERENCE GUIDE FACT SHEET: SOYBEANS
34
SoybeansSoybeans are used primarily for their high protein content. They can be used in all categories ofprograms.
1. NUTRITIONAL VALUES (per 100 g)These are average values, taken from the U.S. Departmentof Agriculture, Agricultural Research Service(USDA:ARS) 1998 USDA Nutrient Database, Release12, Laboratory Home Page,(http://www.nal.usda.gov/fnic/foodcomp). These nutrientvalues are provided as a guide for use in the calculation offood aid rations; users should be aware that shipments offood aid may vary from these exact values.
2. COMPONENTS100% Soybeans, mature seeds
3. SPECIFICATIONSClass: YellowGrade: No. 2 or BetterMoisture (Max.): 14.0 %Test weight (Min.): 54.0 lbs./bu.
(Source: USDA:FSA:PDD:EOB April, 1996.Contact 202-690-3565http://www.fas.usda.gov/excredits/pl480/commodities/soybeans.htm)
4. PACKAGING50 kg (110.23 lb.) woven polypropylene bags. This fabriccontains an inhibitor to resist ultra-violet absorption alongwith an anti-skid coating.
5. SHELF LIFEAt least one year. See “Section III: Storage/Shelf LifeSpecifications” for more information.
Nutrient Amount UnitWater 8.5 gEnergy 416.0 KcalProtein 36.5 gTotal Lipid 19.9 gCarbohydrate 30.2 gFiber, total dietary 9.3 gAsh 4.9 gCalcium 277.0 mgIron 15.7 mgMagnesium 280.0 mgPhosphorus 704.0 mgPotassium 1797.0 mgSodium 2.0 mgZinc 4.9 mgCopper 1.7 mgManganese 2.5 mgSelenium 17.8 mcgVitamin C 6.0 mgThiamin 0.9 mgRiboflavin 0.9 mgNiacin 1.6 mgPantothenic acid 0.8 mgVitamin B-6 0.4 mgFolate 375.1 mcgVitamin B-12 0.0 mcgVitamin A 24.0 IUVitamin E 2.0 mg-ATEVitamin D n/a IUIodine n/a mcg
COMMODITIES REFERENCE GUIDE FACT SHEET: SOYBEAN MEAL
35
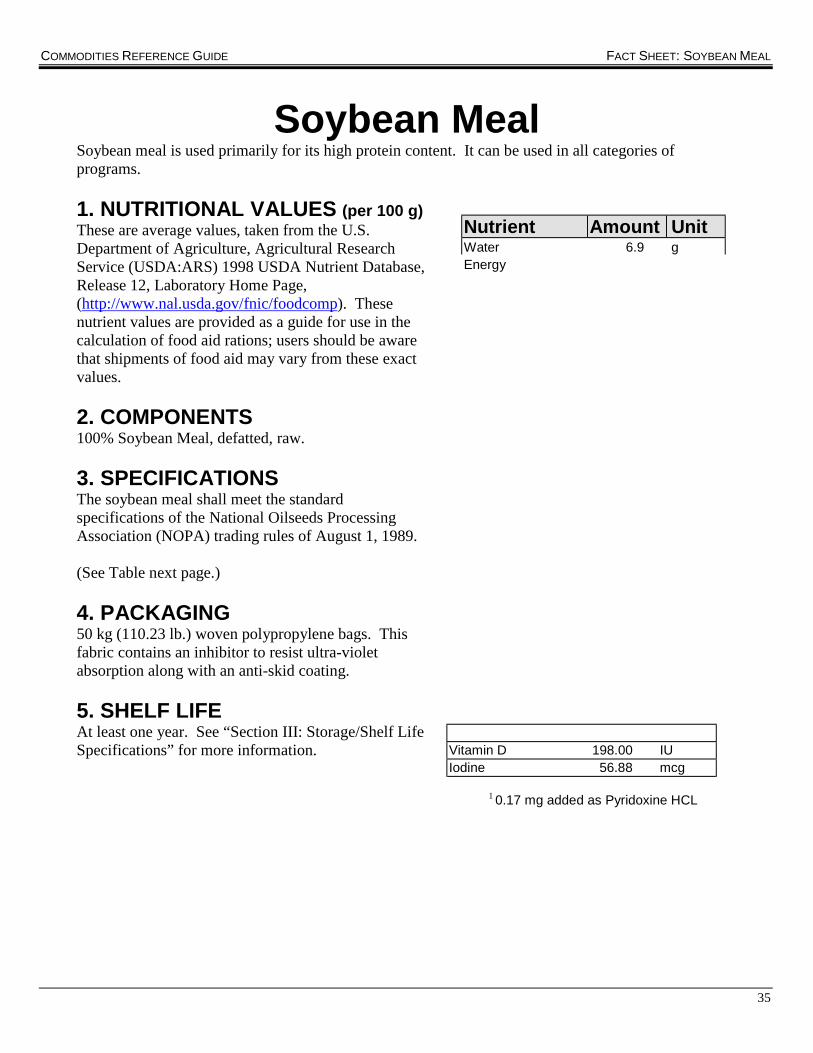
Soybean MealSoybean meal is used primarily for its high protein content. It can be used in all categories ofprograms.
1. NUTRITIONAL VALUES (per 100 g)These are average values, taken from the U.S.Department of Agriculture, Agricultural ResearchService (USDA:ARS) 1998 USDA Nutrient Database,Release 12, Laboratory Home Page,(http://www.nal.usda.gov/fnic/foodcomp). Thesenutrient values are provided as a guide for use in thecalculation of food aid rations; users should be awarethat shipments of food aid may vary from these exactvalues.
2. COMPONENTS100% Soybean Meal, defatted, raw.
3. SPECIFICATIONSThe soybean meal shall meet the standardspecifications of the National Oilseeds ProcessingAssociation (NOPA) trading rules of August 1, 1989.
(See Table next page.)
4. PACKAGING50 kg (110.23 lb.) woven polypropylene bags. Thisfabric contains an inhibitor to resist ultra-violetabsorption along with an anti-skid coating.
5. SHELF LIFEAt least one year. See “Section III: Storage/Shelf LifeSpecifications” for more information.
Nutrient Amount UnitWater 6.9 gEnergy
Vitamin D 198.00 IUIodine 56.88 mcg
1 0.17 mg added as Pyridoxine HCL

COMMODITIES REFERENCE GUIDE FACT SHEET: WHEAT SOY BLEND
42
CHEMICAL AND PHYSICAL REQUIREMENTSREQUIREMENT 1
ITEM Minimum Maximum Moisture, % -- 11.0Protein (Nx6.25), % 20.0 --Crude Fat, % 6.0 --Ash, % -- 6.6Crude Fiber, % -- 2.5Lysine, % 0.9 --Total Bacteria Count per gram -- 50,000Material that will pass through aU.S. Standard No. 8woven-wire-cloth sieve, % 97.0 --Salmonella, E. Coli and Coagulase Positive Staphylococci will be negative
1 Unless otherwise specified, all analyses except moisture are expressed on a moisture-free basis.(Source: USDA:FSA:PDD:EOB, December, 1997. Contact 202-690-3565http://www.fas.usda.gov/excredits/wheatsoy.html
4. PACKAGING25 kg (55 lb.) multi-wall paper bags. Three plies of paper (minimum) with an inner polyethylene orpolypropylene plastic liner. The outer paper ply is treated to provide wet strength and must have aplastic liner facing the product of 3 mil (minimum) low density polyethylene.
5. SHELF LIFEAt least one year.

COMMODITIES REFERENCE GUIDE SECTION II: COMMODITY FACT SHEETS
1
SECTION IIFood Commodity Fact Sheets
The Food Commodity Fact Sheets present useful information to providers and users of U.S. food aidunder P.L. 480. The Sheets contain general information on use of the commodity in the P.L. 480Program, data on the average nutritional values of commodities and formulae used in the P.L. 480 foodaid programs, information on components, ingredients and specifications, and packaging and shelf lifeinformation from USDA. The information contained in these Fact Sheets is updated as new databecomes available and therefore represents the most current information available.
The following Food Commodity Fact Sheets are available:• Beans, Black• Beans, Blackeye (Cowpeas)• Beans, Great Northern• Beans, Kidney (Light Red, Dark Red, All types)• Beans, Navy (Pea Beans)• Beans, Pink• Beans, Pinto• Beans, Small Red• Bulgur (BW)• Bulgur, Soy Fortified (SFBW)• Corn (bagged, bulk)• Cornmeal• Cornmeal, Soy Fortified (CMSF)• Corn Soy Blend 1 (CSB)• Corn Masa Flour• Corn Soy Masa Flour, Instant• Lentils• Peas• Rice (milled, non-parboiled, bagged, bulk)• Rice (milled, parboiled, bagged, bulk)• Sorghum (bagged, bulk)• Sorghum, Soy Fortified Grits1 (SFSG)• Soybeans (bulk)• Soybean Meal (bulk)• Fortified Refined Vegetable Oil (Edible Vegoil)• Wheat (bagged, bulk)• Wheat Flour (all purpose flour [AP] and bread flour)• Wheat Soy Blend (WSB)
1 Commodity may require nutrient analysis in order to be complete; USDA nutrient data may not be appropriate for thecommodity type used in the P.L. 480 Program.

COMMODITIES REFERENCE GUIDE SECTION II: COMMODITY FACT SHEETS
2
The Food Commodity Fact Sheets are organized as follows:
1. NUTRITIONAL VALUES (per 100 g of Raw Commodity)Commodity proportions presented in the Nutritional Value tables are all for 100 g amounts of raw,non-cooked commodity. They were obtained from USDA Purchase Announcements dating fromOctober 1997 through December 1, 1998. The USDA Nutrient Database for Standard Reference(Release 12: http://www.nal.usda.gov/fnic/foodcomp) was used to obtain nutritional data on each ofthe ingredient commodities except Small Red Beans, which was obtained from the National Dry BeanCouncil (NDBC), because there was no data in the USDA reference. Vitamin and mineral fortificationamounts were obtained from the Purchase Announcements. Except for Corn Soy Blend (CSB) andWheat Soy Blend (WSB), the commodities are enriched to restore vitamins and minerals lost inprocessing. Note that the definition of enrichment is the restoration of nutrients lost in food processingwhile fortification refers to the addition of nutrients. For CSB and WSB, the figures in the tablesrepresent the total of the naturally occurring nutrients plus the fortification ingredients added. For allother commodities, the nutrient levels given in the tables approximate the naturally occurring nutrientlevels in the food or formulation of foods making up the commodity. Where nutrient values were notavailable in the USDA Nutrient Database, “n/a” is listed in the nutrient tables.
2. COMPONENTSAll Commodity Fact Sheets contain information on the components of the commodities and/orformulae. Descriptions of the commodities that were not considered to be a specification wereincluded in this section. For example, bulgur is described as “cracked, debranned and partiallyprecooked to lower final cooking time, reduce toughness and some of the crude fiber.”
3. SPECIFICATIONSSpecifications included in this section were mostly obtained from USDA:FSA:PDD:EOB.(http://www.fas.usda.gov/excredits/pl480/commodities/commlist.html.) In cases where specificationsfrom the Foreign Agriculture Service (FAS) web site were not available, specification information wasobtained directly from the purchase announcements. It is important to note however, that the actualnutrient values in particular lots of food may vary from the exact values specified in the purchaseannouncements. Specifications in export purchase announcements are also subject to changeperiodically. The nutrient values given in the commodity fact sheets will be updated when thesechanges occur. Each commodity fact sheet also provides the source of the nutritional valueinformation.
The section on specifications includes information, as appropriate, on the commodity class or grade,filth, fumigation, physical and chemical requirements of the finished product, and enrichmentingredients.
4. PACKAGINGThe information on packaging was obtained from the Export Operations Branch at the ProcurementDonations Division of the Farm Services Agency of USDA during November 1998.
5. SHELF LIFEShelf life data were obtained from the 1988 Commodity Fact Sheets and confirmed by USDA ExportOperations Branch at the Procurement Donations Division of the Farm Services Agency (of USDA

COMMODITIES REFERENCE GUIDE SECTION II: COMMODITY FACT SHEETS
3
USDA/FSA/EOD/PPD) during November 1998. Refer to “Section III: Storage/Shelf LifeSpecifications” for more information.

COMMODITIES REFERENCE GUIDE FACT SHEET: BEANS, BLACK
4
Beans, BlackThis unprocessed commodity is used as a protein source in all categories of programs. Local tastes andpreferences differ. U.S. dry beans come in many varieties with different size, color and tastecharacteristics. When ordering, please specify Black Bean and any alternates that are culturallyacceptable.
1. NUTRITIONAL VALUES (per 100 g)These are average values, taken from the U.S.Department of Agriculture, Agricultural Research Service(USDA:ARS) 1998 USDA Nutrient Database, Release12, Laboratory Home Page,(http://www.nal.usda.gov/fnic/foodcomp). These nutrientvalues are provided as a guide for use in the calculation offood aid rations; users should be aware that shipments offood aid may vary from these exact values.
2. COMPONENTS100% Black Beans
3. SPECIFICATIONSBlack Beans shall be grade U.S. No. 2 or better. Beansmay include up to 5 percent total defects due to surfacedirt which is readily removed during processing, and shallmeet the specifications for the class(es) of beans listed inthe "U.S. Standards for Beans."(Source: USDA :FSA:PDD:EOB December, 1997.Contact 202-690-3565.http://www.fas.usda.gov/excredits/pl480/commodities/peabeans.htm)
4. PACKAGING50-kg (110.23 lb.) woven polypropylene bags. Thisfabric contains an inhibitor to resist ultra-violetabsorption along with an anti-skid coating.
5. SHELF LIFEAt least one year. Dry beans will keep indefinitely ifstored in a dry place. Cooking time will increase as beansage beyond one year. See “Section III: Storage/ShelfLife Specifications” for more information.
Nutrient Amount UnitWater 11.02 gEnergy 341.0 KcalProtein 21.6 gTotal Lipid 1.42 gCarbohydrate 62.37 gFiber, total dietary 15.2 gAsh 3.6 gCalcium 123.0 mgIron 5.02 mgMagnesium 171 mgPhosphorus 352 mgPotassium 1483 mgSodium 5.0 mgZinc 3.6 mgCopper 0.841 mgManganese 1.06 mgSelenium 3.2 mcgVitamin C 0.0 mgThiamin 0.8 mgRiboflavin 0.193 mgNiacin 1.955 mgPantothenic acid 0.899 mgVitamin B-6 0.286 mgFolate 444.3 mcgVitamin B-12 0.0 mcgVitamin A 17.0 IUVitamin E n/a mg-ATEVitamin D n/a IUIodine n/a mcg

COMMODITIES REFERENCE GUIDE FACT SHEET: BEANS, BLACKEYE (COWPEAS)
5
Beans, Blackeye(Cowpeas)
These unprocessed commodities are used as protein sources in all categories of programs. Local tastesand preferences differ. U.S. dry beans come in many varieties with different size, color and tastecharacteristics. Please specify Blackeye Bean and any alternates that are culturally acceptable.
1. NUTRITIONAL VALUES (per 100 g)These are average values, taken from the U.S.Department of Agriculture, Agricultural Research Service(USDA:ARS) 1998 USDA Nutrient Database, Release12, Laboratory Home Page,(http://www.nal.usda.gov/fnic/foodcomp). These nutrientvalues are provided as a guide for use in the calculation offood aid rations; users should be aware that shipments offood aid may vary from these exact values.
2. COMPONENTS100% Pea Beans (Blackeye Beans, Cowpeas)
3. SPECIFICATIONSBlackeye Beans (Cowpeas) shall be grade U.S. No. 2 orbetter but shall contain no more than 5 percent of beanswith surface dirt which is readily removed duringprocessing and shall meet the specifications for theclass(es) of beans listed in the "U.S. Standards forBeans."(Source: USDA :FSA:PDD:EOB December, 1997.Contact 202-690-3565)http://www.fas.usda.gov/excredits/pl480/commodities/peabeans.htm)
4. PACKAGING50 kg (110.23 lb.) woven polypropylene bags. Thisfabric contains an inhibitor to resist ultra-violetabsorption along with an anti-skid coating.
5. SHELF LIFEAt least one year. Dry beans will keep indefinitely ifstored in a dry place. Cooking time will increase as beansage beyond one year. See “Section III: Storage/Shelf LifeSpecifications” for more information.
Nutrient Amount UnitWater 11.95 gEnergy 336.0 KcalProtein 23.52 gTotal Lipid 1.26 gCarbohydrate 60.03 gFiber, total dietary 10.6 gAsh 3.24 gCalcium 110.0 mgIron 8.27 mgMagnesium 184.0 mgPhosphorus 424.0 mgPotassium 1112.0 mgSodium 16.0 mgZinc 3.37 mgCopper 0.845 mgManganese 1.528 mgSelenium 9.0 mcgVitamin C 1.5 mgThiamin 0.853 mgRiboflavin 0.226 mgNiacin 2.075 mgPantothenic acid 1.496 mgVitamin B-6 0.357 mgFolate 632.6 mcgVitamin B-12 0.0 mcgVitamin A 50.0 IUVitamin E n/a mg-ATEVitamin D n/a IUIodine n/a mcg

COMMODITIES REFERENCE GUIDE FACT SHEET: BEANS, GREAT NORTHERN
6
Beans, Great NorthernThis unprocessed commodity is used as a protein source in all categories of programs. Local tastes andpreferences differ. U.S. dry beans come in many varieties with different size, color and tastecharacteristics. When ordering, please specify Great Northern Bean and any alternates that areculturally acceptable.
1. NUTRITIONAL VALUES (per 100 g)These are average values, taken from the U.S.Department of Agriculture, Agricultural Research Service(USDA:ARS) 1998 USDA Nutrient Database, Release12, Laboratory Home Page,(http://www.nal.usda.gov/fnic/foodcomp). These nutrientvalues are provided as a guide for use in the calculation offood aid rations; users should be aware that shipments offood aid may vary from these exact values.
2. COMPONENTS100% Great Northern Beans
3. SPECIFICATIONSGreat Northern Beans shall be grade U.S. No. 2 or better.Beans may include up to 5 percent total defects due tosurface dirt which is readily removed during processing;and shall meet the specifications for the class(es) of beanslisted in the "U.S. Standards for Beans."(Source: USDA :FSA:PDD:EOB December, 1997.Contact 202-690-3565)http://www.fas.usda.gov/excredits/pl480/commodities/peabeans.htm)
4. PACKAGING50-kg (110.23 lb.) woven polypropylene bags. Thisfabric contains an inhibitor to resist ultra-violetabsorption along with an anti-skid coating.
5. SHELF LIFEAt least one year. Dry beans will keep indefinitely ifstored in a dry place. Cooking time will increase as beansage beyond one year. See “Section III: Storage/Shelf LifeSpecifications” for more information.
Nutrient Amount UnitWater 10.7 gEnergy 339.0 KcalProtein 21.86 gTotal Lipid 1.14 gCarbohydrate 62.37 gFiber, total dietary 20.2 gAsh 3.93 gCalcium 175.0 mgIron 5.47 mgMagnesium 189.0 mgPhosphorus 447.0 mgPotassium 1387.0 mgSodium 14.0 mgZinc 2.31 mgCopper 0.837 mgManganese 1.423 mgSelenium 12.9 mcgVitamin C 5.3 mgThiamin 0.653 mgRiboflavin 0.237 mgNiacin 1.955 mgPantothenic acid 1.098 mgVitamin B-6 0.447 mgFolate 482.0 mcgVitamin B-12 0.0 mcgVitamin A 3.0 IUVitamin E n/a mg-ATEVitamin D n/a IUIodine n/a mcg

COMMODITIES REFERENCE GUIDE FACT SHEET: BEANS, KIDNEY (LIGHT, DARK, ALL TYPES)
7
Beans, Kidney(Light, Dark, All types)
This unprocessed commodity is used as a protein source in all categories of programs. Local tastes andpreferences differ. U.S. dry beans come in many varieties with different size, color and tastecharacteristics. When ordering, please specify Kidney Bean (including color and size) and anyalternates that are culturally acceptable.
1. NUTRITIONAL VALUES (per 100 g)These are average values, taken from the U.S. Department ofAgriculture, Agricultural Research Service (USDA:ARS)1998 USDA Nutrient Database, Release 12, LaboratoryHome Page, (http://www.nal.usda.gov/fnic/foodcomp).These nutrient values are provided as a guide for use in thecalculation of food aid rations; users should be aware thatshipments of food aid may vary from these exact values.
2. COMPONENTS100% Kidney Beans (All types)
3. SPECIFICATIONSKidney Beans shall be grade U.S. No. 2 or better. Beansmay include up to 5 percent total defects due to surface dirtwhich is readily removed during processing, and shall meetthe specifications for the class(es) of beans listed in the"U.S. Standards for Beans."(Source: USDA :FSA:PDD:EOB December, 1997.Contact 202-690-3565)http://www.fas.usda.gov/excredits/pl480/commodities/peabeans.htm)
4. PACKAGING50 kg (110.23 lb.) woven polypropylene bags. This fabriccontains an inhibitor to resist ultra-violet absorption alongwith an anti-skid coating.
5. SHELF LIFEAt least one year. Dry beans will keep indefinitely if storedin a dry place. Cooking time will increase as beans agebeyond one year. See “Section III: Storage/Shelf LifeSpecifications” for more information.
Nutrient Amount UnitWater 11.75 gEnergy 333.0 KcalProtein 23.58 gTotal Lipid 0.83 gCarbohydrate 60.01 gFiber, total dietary 24.9 gAsh 3.83 gCalcium 143.0 mgIron 8.2 mgMagnesium 140.0 mgPhosphorus 407.0 mgPotassium 1406.0 mgSodium 24.0 mgZinc 2.79 mgCopper 0.958 mgManganese 1.021 mgSelenium 3.2 mcgVitamin C 4.5 mgThiamin 0.529 mgRiboflavin 0.219 mgNiacin 2.06 mgPantothenic acid 0.78 mgVitamin B-6 0.397 mgFolate 394.1 mcgVitamin B-12 0.0 mcgVitamin A 8.0 IUVitamin E n/a mg-ATEVitamin D n/a IUIodine n/a mcg

COMMODITIES REFERENCE GUIDE FACT SHEET: BEANS, NAVY (PEA BEANS)
8
Beans, Navy(Pea Beans)
This unprocessed commodity is used as a protein source in all categories of programs. Local tastes andpreferences differ. U.S. dry beans come in many varieties with different size, color and tastecharacteristics. When ordering, please specify Navy Bean and any alternates that are culturallyacceptable.
1. NUTRITIONAL VALUES (per 100 g)These are average values, taken from the U.S. Department ofAgriculture, Agricultural Research Service (USDA:ARS)1998 USDA Nutrient Database, Release 12, LaboratoryHome Page, (http://www.nal.usda.gov/fnic/foodcomp).These nutrient values are provided as a guide for use in thecalculation of food aid rations; users should be aware thatshipments of food aid may vary from these exact values.
2. COMPONENTS100% Navy Beans
3. SPECIFICATIONSNavy Beans shall be grade U.S. No. 2 or better. Beans mayinclude up to 5 percent total defects due to surface dirtwhich is readily removed during processing, and shall meetthe specifications for the class(es) of beans listed in the"U.S. Standards for Beans." (Source: USDA:FSA:PDD:EOB December, 1997.Contact 202-690-3565http://www.fas.usda.gov/excredits/pl480/commodities/peabeans.htm)
4. PACKAGING50 kg (110.23 lb.) woven polypropylene bags. This fabriccontains an inhibitor to resist ultra-violet absorption alongwith an anti-skid coating.
5. SHELF LIFEAt least one year. Dry beans will keep indefinitely if storedin a dry place. Cooking time will increase as beans agebeyond one year. See “Section III: Storage/Shelf LifeSpecifications” for more information.
Nutrient Amount UnitWater 12.36 gEnergy 335.0 KcalProtein 22.33 gTotal Lipid 1.28 gCarbohydrate 60.65 gFiber, total dietary 24.4 gAsh 3.37 gCalcium 155.0 mgIron 6.44 mgMagnesium 173.0 mgPhosphorus 443.0 mgPotassium 1140.0 mgSodium 14.0 mgZinc 2.54 mgCopper 0.879 mgManganese 1.309 mgSelenium 11 mcgVitamin C 3.0 mgThiamin 0.645 mgRiboflavin 0.232 mgNiacin 2.063 mgPantothenic acid 0.68 mgVitamin B-6 0.437 mgFolate 369.7 mcgVitamin B-12 0.0 mcgVitamin A 4.0 IUVitamin E 0.44 mg-ATEVitamin D n/a IUIodine n/a mcg

COMMODITIES REFERENCE GUIDE FACT SHEET: BEANS, PINK
9
Beans, Pink
This unprocessed commodity is used as a protein source in all categories of programs. Local tastes andpreferences differ. U.S. dry beans come in many varieties with different size, color and tastecharacteristics. When ordering, please specify Pink Bean and any alternates that are culturallyacceptable.
1. NUTRITIONAL VALUES (per 100 g)These are average values, taken from the U.S.Department of Agriculture, Agricultural Research Service(USDA:ARS) 1998 USDA Nutrient Database, Release12, Laboratory Home Page,(http://www.nal.usda.gov/fnic/foodcomp). These nutrientvalues are provided as a guide for use in the calculation offood aid rations; users should be aware that shipments offood aid may vary from these exact values.
2. COMPONENTS100% Pink Beans
3. SPECIFICATIONSPink Beans shall grade U.S. No. 2 or better. Beans mayinclude up to 5 percent total defects due to surface dirtwhich is readily removed during processing, and shallmeet the specifications for the class(es) of beans listed inthe "U.S. Standards for Beans."(Source: USDA :FSA:PDD:EOB December, 1997.Contact 202-690-3565)http://www.fas.usda.gov/excredits/pl480/commodities/peabeans.htm)
4. PACKAGING50 kg (110.23 lb.) woven polypropylene bags. This fabriccontains an inhibitor to resist ultra-violet absorption alongwith an anti-skid coating.
5. SHELF LIFEAt least one year. Dry beans will keep indefinitely ifstored in a dry place. Cooking time will increase as beansage beyond one year. See “Section III: Storage/Shelf LifeSpecifications” for more information.
Nutrient Amount UnitWater 10.06 gEnergy 343.0 KcalProtein 20.96 gTotal Lipid 1.13 gCarbohydrate 64.19 gFiber, total dietary 12.7 gAsh 3.66 gCalcium 130.0 mgIron 6.77 mgMagnesium 182.0 mgPhosphorus 415.0 mgPotassium 1464.0 mgSodium 8.0 mgZinc 2.55 mgCopper 0.81 mgManganese 1.376 mgSelenium 13.0 mcgVitamin C 0.0 mgThiamin 0.772 mgRiboflavin 0.192 mgNiacin 1.892 mgPantothenic acid 0.997 mgVitamin B-6 0.527 mgFolate 463.2 mcgVitamin B-12 0.0 mcgVitamin A 0.0 IUVitamin E 0.1 mg-ATEVitamin D n/a IUIodine n/a mcg

COMMODITIES REFERENCE GUIDE FACT SHEET: BEANS, PINTO
10
Beans, Pinto
This unprocessed commodity is used as a protein source in all categories of programs. Local tastes andpreferences differ. U.S. dry beans come in many varieties with different size, color and tastecharacteristics. When ordering, please specify Pinto Bean and any alternates that are culturallyacceptable.
1. NUTRITIONAL VALUES (per 100 g)These are average values, taken from the U.S.Department of Agriculture, Agricultural Research Service(USDA:ARS) 1998 USDA Nutrient Database, Release12, Laboratory Home Page,(http://www.nal.usda.gov/fnic/foodcomp). These nutrientvalues are provided as a guide for use in the calculation offood aid rations; users should realize food aid shipmentsmay vary from these exact nutrient values.
2. COMPONENTS100% Pinto Beans
3. SPECIFICATIONSPinto Beans shall be grade U.S. No. 2 or better. Beansmay include up to 5 percent total defects due to surfacedirt which is readily removed during processing, and shallmeet the specifications for the class(es) of beans listed inthe "U.S. Standards for Beans."(Source: USDA :FSA:PDD:EOB December, 1997.Contact 202-690-3565)http://www.fas.usda.gov/excredits/pl480/commodities/peabeans.htm
4. PACKAGING50 kg (110.23 lb.) woven polypropylene bags. Thisfabric contains an inhibitor to resist ultra-violetabsorption along with an anti-skid coating.
5. SHELF LIFEAt least one year. Dry beans will keep indefinitely ifstored in a dry place. Cooking time will increase as beansage beyond one year. See “Section III: Storage/Shelf LifeSpecifications” for more information.
Nutrient Amount UnitWater 10.95 gEnergy 340.0 KcalProtein 20.88 gTotal Lipid 1.13 gCarbohydrate 63.41 gFiber, total dietary 24.4 gAsh 3.63 gCalcium 121.0 mgIron 5.88 mgMagnesium 159.0 mgPhosphorus 418.0 mgPotassium 1328.0 mgSodium 10.0 mgZinc 2.54 mgCopper 0.774 mgManganese 1.13 mgSelenium 18.5 mcgVitamin C 7.3 mgThiamin 0.555 mgRiboflavin 0.238 mgNiacin 1.446 mgPantothenic acid 0.763 mgVitamin B-6 0.443 mgFolate 506.3 mcgVitamin B-12 0.0 mcgVitamin A 5.0 IUVitamin E 0.21 mg-ATEVitamin D n/a IUIodine n/a mcg

COMMODITIES REFERENCE GUIDE FACT SHEET: BEANS, SMALL RED
11
Beans, Small Red
This unprocessed commodity is used as a protein source in all categories of programs. Local tastes andpreferences differ. U.S. dry beans come in many varieties with different size, color and tastecharacteristics. When ordering, please specify Small Red Bean and any alternates that are culturallyacceptable.
1. NUTRITIONAL VALUES (per 100 g)These are average values, taken from the U.S.Department of Agriculture, Agricultural ResearchService (USDA:ARS) 1998 USDA Nutrient Database,Release 12, Laboratory Home Page,(http://www.nal.usda.gov/fnic/foodcomp). Thesenutrient values are provided as a guide for use in thecalculation of food aid rations; users should be awarethat shipments of food aid may vary from these exactvalues.
2. COMPONENTS100% Small Red Beans
3. SPECIFICATIONSSmall Red Beans shall be grade U.S. No. 2 or better.Beans may include up to 5 percent total defects due tosurface dirt which is readily removed during processing,and shall meet the specifications for the class(es) ofbeans listed in the "U.S. Standards for Beans."(Source: USDA :FSA:PDD:EOB December, 1997.Contact 202-690-3565)http://www.fas.usda.gov/excredits/pl480/commodities/peabeans.htm
4. PACKAGING50 kg (110.23 lb.) woven polypropylene bags. Thisfabric contains an inhibitor to resist ultra-violetabsorption along with an anti-skid coating.
5. SHELF LIFEAt least one year. Dry beans will keep indefinitely ifstored in a dry place. Cooking time will increase asbeans age beyond one year. See “Section III:Storage/Shelf Life Specifications” for more information.
Nutrient Amount UnitWater Max 18% gEnergy 350.0 KcalProtein 22.0 gTotal Lipid 1.0 gCarbohydrate 62.0 gFiber, total dietary 9.0 gAsh n/a gCalcium 150.0 mgIron 7.0 mgMagnesium 200.0 mgPhosphorus 450.0 mgPotassium 1450.0 mgSodium 18.0 mgZinc 3.0 mgCopper 7.0 mgManganese 0.8 mgSelenium n/a mcgVitamin C n/a mgThiamin 0.7 mgRiboflavin 0.2 mgNiacin 2.2 mgPantothenic acid 0.750 mgVitamin B-6 0.250 mgFolate 0.250 mcgVitamin B-12 n/a mcgVitamin A n/a IUVitamin E n/a mg-ATEVitamin D n/a IUIodine n/a mcg

COMMODITIES REFERENCE GUIDE FACT SHEET: BULGUR
12
BulgurThis processed commodity is generally used as a staple food for all categories of programs. Bulgur iscracked, debranned, and partially precooked to lower final cooking time, reduce toughness and someof the crude fiber.
1. NUTRITIONAL VALUES (per 100 g)These are average values, taken from the U.S.Department of Agriculture, Agricultural ResearchService (USDA:ARS) 1998 USDA Nutrient DatabaseLaboratory Home Page, Release 12,(http://www.nal.usda.gov/fnic/foodcomp These nutrientvalues are provided as a guide for use in thecalculation of food aid rations; users should be awarethat shipments of food aid may vary from these exactvalues.The values for thiamin, riboflavin, niacin, vitamin A,calcium and iron represent the minimum levels ofenrichment nutrients (converted to a 100 g basis) aslisted in Specifications below.
2. COMPONENTS100% Whole Wheat
3. SPECIFICATIONSThe bulgur shall be milled from wheat of any of theclasses defined in the "Official Grain Standards of theUnited States," for wheat except red durum wheat ormixtures of wheat of contrasting classes.
Nutrient Amount UnitWater 9.0 gEnergy 342.0 KcalProtein 12.3 gTotal Lipid 1.3 gCarbohydrate 75.9 gFiber, total dietary 18.3 gAsh 1.5 gCalcium 110 mgIron 2.90 mgMagnesium 164 mgPhosphorus 300 mgPotassium 410 mgSodium 17.0 mgZinc 1.9 mgCopper 0.3 mgManganese 3.0 mgSelenium 2 mcgVitamin C 0 mgThiamin 0.44 mgRiboflavin 0.26 mgNiacin 3.53 mgPantothenic acid 1.0 mgVitamin B-6 0.3 mgFolate 150 mcgVitamin B-12 0 mcgVitamin A 2205 IUVitamin E 0.2 mg-ATEVitamin D n/a IUIodine n/a mcg

COMMODITIES REFERENCE GUIDE FACT SHEET: BULGUR
13
CHEMICAL AND PHYSICAL REQUIREMENTSREQUIREMENT 1
ITEM Minimum Maximum Moisture -- 11.5Protein (Nx5.7), % 2 9.3 --Crude Fiber, % 2 -- 2.3Ash, % 2 -- 3
Foreign Material:Other grains except wheat, % -- 0.10Material except other grains, % 4 -- 0.10Scorched particles (whole or pieces of kernels), % -- 0.20Ungelatinized particles (whole or pieces of kernels), % -- 1.0Whole processed kernels remaining onwoven-wire-cloth sieve, % -- 4.0Material that will pass through U.S. Standard No. 8woven-wire-cloth sieve, % 80 --Material that will pass through U.S. Standard No. 14woven-wire-cloth sieve, % -- 18Material that will pass through U.S. Standard No. 30woven-wire-cloth sieve, % -- 0.9
1 All percentages are on the basis of weight.2 These limiting factors are on a moisture-free basis.3 Prior to calcium enrichment, Bulgur may not have an ash content exceeding 2.0% on a moisture free basis.4 Including grain hulls either attached or detached. However, any hulls attached to product should be detached beforeinclusion in the hull fraction.
ENRICHMENT INGREDIENTS Minimum Maximum Thiamine, mg/lb. 2.0 3.0Riboflavin, mg/lb. 1.2 1.8Niacin or niacinamide, mg/lb. 16.0 24.0Vitamin A Palmitate, IU/lb. 10,000 12,000Calcium (in harmless and assimilable form), mg/lb. 500 750Iron (reduced iron, 325 mesh,to be used as the iron source), mg/lb. 13.0 26.0
(Source: USDA :FSA:PDD:EOB April, 1996. Contact 202-690-3565http://www.fas.usda.gov/excredits/pl480/commodities/bulgar.htm)
4. PACKAGING50 kg (110.23 lb.) bags made of woven polypropylene. This fabric contains an inhibitor to resist ultra-violet absorption along with an anti-skid coating.
5. SHELF LIFEAt least one year. See “Section III: Storage/Shelf Life Specifications” for more information.

COMMODITIES REFERENCE GUIDE FACT SHEET: BULGUR, SOY FORTIFIED
14
Bulgur, Soy-FortifiedThis processed commodity is generally used as a staple food for all categories of programs. Bulgur iscracked, debranned, and partially precooked to lower final cooking time, reduce toughness and someof the crude fiber.
1. NUTRITIONAL VALUES (per 100 g)These are average values, taken from the U.S.Department of Agriculture, Agricultural ResearchService (USDA:ARS) 1998 USDA Nutrient Database,Release 12, Laboratory Home Page,(http://www.nal.usda.gov/fnic/foodcomp These nutrient valuesare provided as a guide for use in the calculation of foodaid rations; users should be aware that shipments of foodaid may vary from these exact values.The values for thiamin, riboflavin, niacin, vitamin A,calcium and iron represent the minimum levels ofenrichment nutrients (converted to a 100 g basis) aslisted in Specifications below.
2. COMPONENTS85% Bulgur Milled from any classes of wheat
defined in the “official grain standardof the United States.” Cracked,debranned.
15% Soy grits Defatted, toasted, or expellerprocessed.
3. SPECIFICATIONS(See Table next page.)
Nutrient Amount UnitWater 8.7 gEnergy 339.8 KcalProtein 18.2 gTotal Lipid 1.3 gCarbohydrate 69.6 gFiber, total dietary 18.18 gAsh 2.2 gCalcium 110 mgIron 2.90 mgMagnesium 182.90 mgPhosphorus 356 mgPotassium 706 mgSodium 17.5 mgZinc 2.0 mgCopper 0.9 mgManganese 3.0 mgSelenium 2 mcgVitamin C 0 mgThiamin 0.44 mgRiboflavin 0.26 mgNiacin 3.53 mgPantothenic acid 1.2 mgVitamin B-6 0.4 mgFolate 150 mcgVitamin B-12 0 mcgVitamin A 2205.00 IUVitamin E 0.1 mg-ATEVitamin D n/a IUIodine n/a mcg

COMMODITIES REFERENCE GUIDE FACT SHEET: BULGUR, SOY FORTIFIED
15
CHEMICAL AND PHYSICAL REQUIREMENTS (FINISHED PRODUCT)REQUIREMENT1
ITEM Minimum Maximum Moisture, % -- 11.5Protein (Nx6.25), % 2 17.3 --Crude Fat 2 -- 2.6Ash, % 2 -- 3
Crude Fiber, % 2 -- 2.6Total Bacteria Count per gram -- 50,000Foreign Material: Other grains except wheat and soy grits, % -- 0.10Materials other than cereal grains or soy grits, % 4 -- 0.10Scorched particles (whole kernels and/orpieces of kernels of wheat or soy), % -- 0.20Ungelatinized wheat particles (whole kernels and/orpieces of kernels), % -- 0.9Whole processed kernels remaining onU.S. Standard No. 8 woven-wire-cloth sieve, % -- 3.5Material that will pass through U.S. Standard No. 8woven-wire-cloth sieve, % 81 --Material that will pass through U.S. Standard No. 14woven-wire-cloth sieve, % -- 23Material that will pass through U.S. Standard No. 30woven-wire-cloth sieve, % -- 1.2
1 All percentages are on the basis of weight.2 These limiting factors are on a moisture-free basis.3 For maximum ash see table on “Maximum Ash Allowable Without Discount at Specified Calcium Levels” in USDASpecifications4 Including grain hulls either attached or detached. However, any hulls attached to product should be detached beforeinclusion in the hull fraction.(Source: USDA :FSA:PDD:EOB February 12, 1998. Contact 202-690-3565;BWSF7: PURCHASE OF BULGUR/SOY-FORTIFIED BULGUR FOR USE IN EXPORT PROGRAMS –SPECIFICATIONS)
4. PACKAGING50 kg (110.23 lb.) bags of woven polypropylene. This fabric contains an inhibitor to resist ultra-violetabsorption along with an anti-skid coating.
5. SHELF LIFEAt least one year. See “Section III: Storage/Shelf Life Specifications” for more information.

COMMODITIES REFERENCE GUIDE FACT SHEET: CORN
16
Corn
This unprocessed whole grain is used primarily for distribution in emergency situations and to a lesserextent in Food for Work (FFW) and Maternal and Child Health (MCH) programs.
1. NUTRITIONAL VALUES (per 100 g)These are average values, taken from the U.S.Department of Agriculture, Agricultural ResearchService (USDA:ARS) 1998 USDA Nutrient DatabaseLaboratory Home Page, Release 12,(http://www.nal.usda.gov/fnic/foodcomp ). These nutrientvalues are provided as a guide for use in thecalculation of food aid rations; users should be awarethat shipments of food aid may vary from these exactvalues.
2. COMPONENTS100% Yellow Corn
3. SPECIFICATIONSClass: YellowGrade: No. 2 or betterMoisture (Max.): 14.5%Test weight (Min.): 54.0 lbs./bu.
(Source: USDA :FSA:PDD:EOB April, 1996.Contact 202-690-3565http://www.fas.usda.gov/excredits/pl480/commodities/corn.htm)
4. PACKAGING50 kg (110.23 lb.) bags of woven polypropylene. Thisfabric contains an inhibitor to resist ultra-violetabsorption along with an anti-skid coating.
5. SHELF LIFEAt least one year. See “Section III: Storage/Shelf LifeSpecifications” for more information.
Nutrient Amount UnitWater 10.3 gEnergy 365.0 KcalProtein 9.4 gTotal Lipid 4.7 gCarbohydrate 74.3 gFiber, total dietary n/a gAsh 1.2 gCalcium 7 mgIron 2.71 mgMagnesium 127 mgPhosphorus 210 mgPotassium 287 mgSodium 35.0 mgZinc 2.2 mgCopper 0.3 mgManganese 0.5 mgSelenium 16 mcgVitamin C 0 mgThiamin 0.39 mgRiboflavin 0.20 mgNiacin 3.63 mgPantothenic acid 0.4 mgVitamin B-6 0.6 mgFolate 19 mcgVitamin B-12 0 mcgVitamin A 469 IUVitamin E 0.8 mg-ATEVitamin D n/a IUIodine n/a mcg

COMMODITIES REFERENCE GUIDE FACT SHEET: CORNMEAL
17
CornmealThis processed commodity is generally used as a staple food in all categories of programs.
1. NUTRITIONAL VALUES (per 100 g)These are average values, taken from the U.S.Department of Agriculture, Agricultural ResearchService (USDA:ARS) 1998 USDA Nutrient DatabaseLaboratory Home Page, Release 12,(http://www.nal.usda.gov/fnic/foodcomp ). These nutrientvalues are provided as a guide for use in thecalculation of food aid rations; users should be awarethat shipments of food aid may vary from these exactvalues.The values for thiamin, riboflavin, niacin, vitamin A,calcium and iron represent the minimum levels ofenrichment nutrients (converted to a 100 g basis) aslisted in Specifications below.
2. COMPONENTS100% Yellow Corn, shelled, dehulled and degermedto reduce susceptibility to rancidity.
3. SPECIFICATIONSPer Federal Specification NC-521E (March 3, 1970),Cornmeal will be enriched to contain: 2.0 to 3.0mg/lb thiamin; 1.2 to 1.8 mg/lb riboflavin;16.0 to 24.0mg/lb niacin or niacinamide; 13.0 to 26.0 mg/lb iron;and 750 mg/lb calcium.
(See Table next page)
4. PACKAGING25 kg (55 lbs.) bags of multi-wall paper. Three pliesof paper (minimum) with an inner polyethylene orpolypropylene plastic liner. The outer paper ply istreated to provide wet strength.
Nutrient Amount UnitWater 11.6 gEnergy 366.0 KcalProtein 8.5 gTotal Lipid 1.7 gCarbohydrate 77.7 gFiber, total dietary 7.4 gAsh 0.6 gCalcium 110 mgIron 2.90 mgMagnesium 40 mgPhosphorus 84 mgPotassium 162 mgSodium 3.0 mgZinc 0.7 mgCopper 0.1 mgManganese 0.1 mgSelenium 8 mcgVitamin C 0 mgThiamin 0.44 mgRiboflavin 0.26 mgNiacin 3.53 mgPantothenic acid 0.3 mgVitamin B-6 0.3 mgFolate 150 mcgVitamin B-12 0 mcgVitamin A 2205 IUVitamin E 0.3 mg-ATEVitamin D N/a IUIodine N/a mcg
5. SHELF LIFEAt least one year. See “Section III:Storage/Shelf Life Specifications” formore information.

COMMODITIES REFERENCE GUIDE FACT SHEET: CORNMEAL
18
CHEMICAL AND PHYSICAL REQUIREMENTSREQUIREMENT 1
ITEM Minimum Maximum Moisture -- 13.0Fat, % -- 1.5Ash, % 2 -- 3
Material that will pass through U.S. Standard No. 20woven-wire-cloth sieve, % 99 --Material that will pass through U.S. Standard No. 25woven-wire-cloth sieve, % 90 --Material that will pass through U.S. Standard No. 45woven-wire-cloth sieve, % 30 --Material that will pass through U.S. Standard No. 80woven-wire-cloth sieve, %Vitamin A Palmitate, IU/lb. 4 10,000 12,000Calcium, mg/lb. 2 500 750
1 All values are on the basis of weight.2 These limiting values are on a moisture-free basis.3 For maximum ash see Table on “Maximum Ash Allowable Without Discount at Specified Calcium Levels” (paragraph9.D) in USDA Specifications.4 Vitamin A Palmitate (stabilized) must be added in encapsulated form containing 250,000 IU Vitamin A Palmitate/g.(Source: USDA :FSA:PDD:EOB November, 1997. Contact 202-690-3565http://www.fas.usda.gov/excredits/pl480/commodities/cornmeal.html)
ENRICHMENT INGREDIENTS Minimum Maximum Thiamine, mg/lb. 2.0 3.0Riboflavin, mg/lb. 1.2 1.8Niacin or niacinamide, mg/lb. 16.0 24.0Vitamin A-Palmitate, IU/lb. 1 10,000 12,000Calcium (in harmless and assimilable form), mg/lb. 500 750Iron (reduced iron, 325 mesh, to be used as the iron source), mg/lb. 2 13.0 26.0
1 Vitamin A Palmitate (stabilized) must be added in encapsulated form containing 250,000 IU Vitamin APalmitate/g.2 Ferrous sulfate is not to be used as the iron source in any processed cereal products purchased for exportassistance programs.
(Source: USDA :FSA:PDD:EOB November, 1997. Contact 202-690-3565http://www.fas.usda.gov/excredits/pl480/commodities/sfcornmeal.html)

COMMODITIES REFERENCE GUIDE FACT SHEET: CORNMEAL, SOY-FORTIFIED
19
Cornmeal, Soy-FortifiedThis processed commodity is most used in emergency programs and to a lesser extent in othercategories.
1. NUTRITIONAL VALUES (per 100 g)These are average values, taken from the U.S.Department of Agriculture, Agricultural ResearchService (USDA:ARS) 1998 USDA Nutrient DatabaseLaboratory Home Page, Release 12,(http://www.nal.usda.gov/fnic/foodcomp ). These nutrientvalues are provided as a guide for use in thecalculation of food aid rations; users should be awarethat shipments of food aid may vary from these exactvalues. The values for thiamin, riboflavin, niacin,vitamin A, calcium and iron represent the minimumlevels of enrichment nutrients (converted to a 100 gbasis) as listed in Specifications below.
2. COMPONENTS85% Cornmeal Degermed to reduce
susceptibility to rancidity.15% Soy Flour Defatted and toasted.Vitamins & Minerals Added to help meet
nutritional requirements.
3. SPECIFICATIONS(See Table next page)
4. PACKAGING25 kg (55 lb.) bags of multi-wall Paper. Three pliesof paper (minimum) with an inner polyethylene orpolypropylene plastic liner. The outer paper ply istreated to provide wet strength.
5. SHELF LIFEAt least one year. See “Section III: Storage/Shelf LifeSpecifications” for more information.
Nutrient Amount UnitWater 10.9 gEnergy 360.2 KcalProtein 14.9 gTotal Lipid 1.6 gCarbohydrate 71.1 gFiber, total dietary 8.92 gAsh 1.4 gCalcium 110 mgIron 2.90 mgMagnesium 77.50 mgPhosphorus 173 mgPotassium 495 mgSodium 5.6 mgZinc 1.0 mgCopper 0.7 mgManganese 0.5 mgSelenium 7 mcgVitamin C 0 mgThiamin 0.44 mgRiboflavin 0.26 mgNiacin 3.53 mgPantothenic acid 0.6 mgVitamin B-6 0.3 mgFolate 150 mcgVitamin B-12 0 mcgVitamin A 2205.00 IUVitamin E 0.3 mg-ATEVitamin D n/a IUIodine n/a mcg

COMMODITIES REFERENCE GUIDE FACT SHEET: CORNMEAL, SOY-FORTIFIED
20
CHEMICAL AND PHYSICAL REQUIREMENTSREQUIREMENT 1
ITEM Minimum Maximum Moisture -- 13.0Protein (Nx6.25), % 2 13.0 --Fat, % 2 -- 1.5Crude Fiber, % 2 -- 2.0Ash, % 2 -- 3
Material that will pass through U.S. Standard No. 20woven-wire-cloth sieve, % 99 --Material that will pass through U.S. Standard No. 25woven-wire-cloth sieve, % 91 --Material that will pass through U.S. Standard No. 45woven-wire-cloth sieve, % 40 --Material that will pass through U.S. Standard No. 80woven-wire-cloth sieve, %
1 All values are on the basis of weight.2 These limiting values are on a moisture-free basis.3 For maximum ash see Table on “Maximum Ash Allowable Without Discount at Specified Calcium Levels”(paragraph 9.D) in USDA Specifications.
ENRICHMENT INGREDIENTS Minimum Maximum Thiamine, mg/lb. 2.0 3.0Riboflavin, mg/lb. 1.2 1.8Niacin or niacinamide, mg/lb. 16.0 24.0Vitamin A-Palmitate, IU/lb. 1 10,000 12,000Calcium (in harmless and assimilable form), mg/lb. 500 750Iron (reduced iron, 325 mesh, to be used as the iron source), mg/lb. 2 13.0 26.0
1 Vitamin A Palmitate (stabilized) must be added in encapsulated form containing 250,000 IU Vitamin APalmitate/g.2 Ferrous sulfate is not to be used as the iron source in any processed cereal products purchased for exportassistance programs.
(Source: USDA :FSA:PDD:EOB November, 1997. Contact 202-690-3565http://www.fas.usda.gov/excredits/pl480/commodities/sfcornmeal.html)

COMMODITIES REFERENCE GUIDE FACT SHEET: CORN SOY BLEND
21
Corn Soy BlendThis processed commodity is used mainly as a weaning food in Maternal Child Health Programs(MCH), and to a lesser extent in emergency and other types of programs.
1. NUTRITIONAL VALUES (per 100 g)These are average values, taken from the U.S.Department of Agriculture, Agricultural ResearchService (USDA:ARS) 1998 USDA NutrientDatabase, Release 12, Laboratory Home Page,(http://www.nal.usda.gov/fnic/foodcomp). Thesenutrient values are provided as a guide for use in thecalculation of food aid rations; users should be awarethat shipments of food aid may vary from these exactvalues.
2. COMPONENTS69.5% Cornmeal: Processed, gelatinized21.8% Soy flour: defatted, toasted5.5% Soybean oil: refined, deodorized, stabilized3.0% Minerals and Vitamin Antioxidant premix
3. SPECIFICATIONSSalmonella, E. Coli and Coagulase Positive.Staphylococci will be negative.Dispersability - will be essentially free from
lumping or balling when mixed with water.For micronutrient addition level standards, refer to
Section I, p. 7
(See Table next page.)
4. PACKAGING25 kg (55 lb.) bags of multi-wall paper. Three plies ofpaper (minimum) with an inner polyethylene orpolypropylene plastic liner. The outer paper ply istreated to provide wet strength.
5. SHELF LIFEAt least one year. See “Section III: Storage/Shelf LifeSpecifications” for more information.
Nutrient Amount UnitWater 9.7 gEnergy 375.7 KcalProtein 17.2 gTotal Lipid 6.9 gCarbohydrate 61.7 gFiber, total dietary 9.0 gAsh 1.8 gCalcium 831 mgIron 17.49 mgMagnesium 173.8 mgPhosphorus 206 mgPotassium 634 mgSodium 7.3 mgZinc 5.0 mgCopper 0.9 mgManganese 0.7 mgSelenium 6 mcgVitamin C 40 mgThiamin 0.53 mgRiboflavin 0.48 mgNiacin 6.23 mgPantothenic acid 3.4 mgVitamin B-6 0.51 mgFolate 300 mcgVitamin B-12 1 mcgVitamin A 2612.2 IUVitamin E 8.7 mg-ATEVitamin D 198.0 IUIodine 56.9 mcg
1 0.2 mg added as Pyridoxine HCL
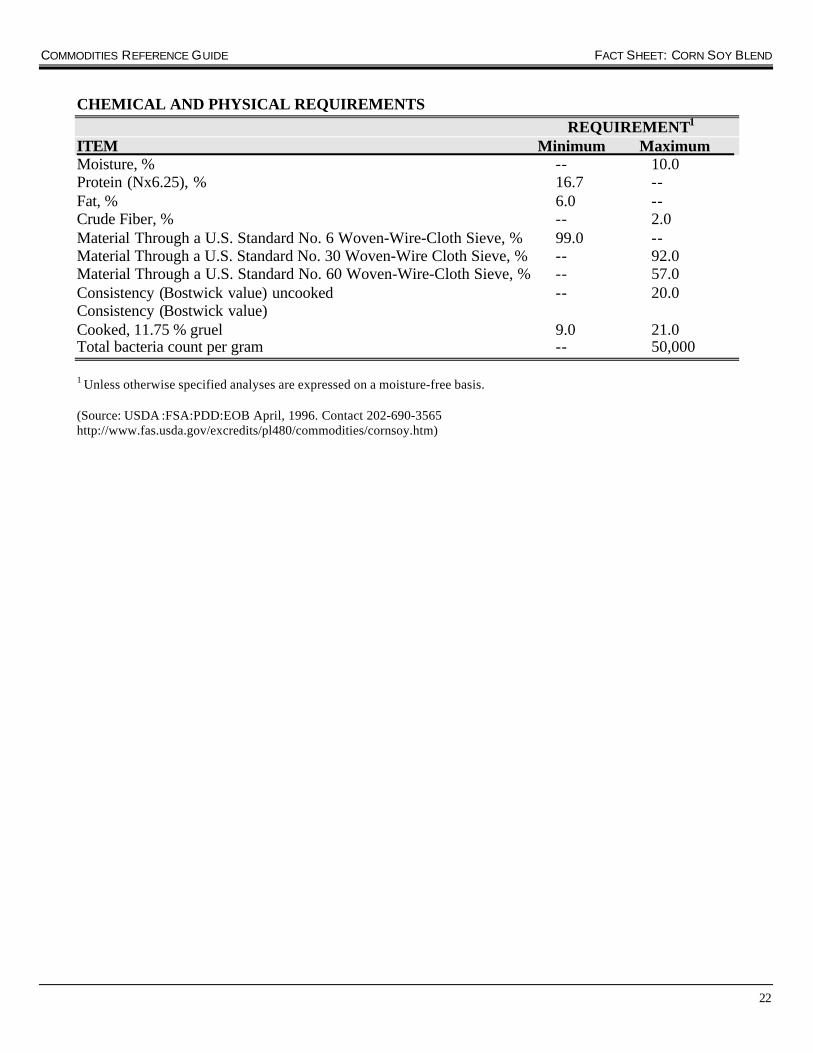
COMMODITIES REFERENCE GUIDE FACT SHEET: CORN SOY BLEND
22
CHEMICAL AND PHYSICAL REQUIREMENTSREQUIREMENT1
ITEM Minimum Maximum Moisture, % -- 10.0Protein (Nx6.25), % 16.7 --Fat, % 6.0 --Crude Fiber, % -- 2.0Material Through a U.S. Standard No. 6 Woven-Wire-Cloth Sieve, % 99.0 --Material Through a U.S. Standard No. 30 Woven-Wire Cloth Sieve, % -- 92.0Material Through a U.S. Standard No. 60 Woven-Wire-Cloth Sieve, % -- 57.0Consistency (Bostwick value) uncooked -- 20.0Consistency (Bostwick value)Cooked, 11.75 % gruel 9.0 21.0Total bacteria count per gram -- 50,000
1 Unless otherwise specified analyses are expressed on a moisture-free basis.
(Source: USDA :FSA:PDD:EOB April, 1996. Contact 202-690-3565http://www.fas.usda.gov/excredits/pl480/commodities/cornsoy.htm)

COMMODITIES REFERENCE GUIDE FACT SHEET: CORN MASA FLOUR
23
Corn Masa FlourThis blended, protein-fortified, processed commodity is designed for use in the preparation of tortillasand similar products or gruels to be consumed by both children and adults.
1. NUTRITIONAL VALUES (per 100 g)These are average values, taken from the U.S.Department of Agriculture, Agricultural ResearchService (USDA:ARS) 1998 USDA Nutrient Database,Release 12, Laboratory Home Page,(http://www.nal.usda.gov/fnic/foodcomp). Thesenutrient values are provided as a guide for use in thecalculation of food aid rations; users should be awarethat shipments of food aid may vary from these exactvalues. The values for thiamin, riboflavin, niacin,vitamin A, calcium and iron represent the minimumlevels of enrichment nutrients (converted to a 100 gbasis) as listed in Specifications below.
2. COMPONENTS95% Corn Masa Flour:
Whole ground white or yellow corn, partiallyprecooked in lime water, followed by washing,rinsing, grinding, and drying to produce thetraditional flavor and performance characteristicssuitable for preparation of a wide range of foodstaples in the form of arepas, corn cakes, cornchips, tortillas, enchiladas, or gruel.
5% Soy Flour : Defatted and toasted.Vitamin and Mineral Enrichment
3. SPECIFICATIONS(See Table next page.)
4. PACKAGING25 kg (55lb.) bags of multi-wall paper. Three plies ofpaper (minimum) with an inner polyethylene orpolypropylene plastic liner. The outer paper ply istreated to provide wet strength.
5. SHELF LIFEAt least one year. See “Section III: Storage/Shelf LifeSpecifications” for more information.
Nutrient Amount UnitWater 9.0 gEnergy 365.0 KcalProtein 9.3 gTotal Lipid 3.8 gCarbohydrate 76.3 gFiber, total dietary n/a gAsh 1.6 gCalcium 110 mgIron 3 mgMagnesium 110.0 mgPhosphorus 223.0 mgPotassium 298.0 mgSodium 5.0 mgZinc 1.8 mgCopper 0.2 mgManganese 0.5 mgSelenium n/a mcgVitamin C 0.0 mgThiamin 0.44 mgRiboflavin 0.26 mgNiacin 3.53 mgPantothenic acid 0.7 mgVitamin B-6 0.4 mgFolate 150 mcgVitamin B-12 0.0 mcgVitamin A 2205 IUVitamin E n/a mg-ATEVitamin D n/a IUIodine n/a mcg

COMMODITIES REFERENCE GUIDE FACT SHEET: CORN MASA FLOUR
24
CHEMICAL AND PHYSICAL REQUIREMENTSREQUIREMENT1
ITEM Minimum Maximum Moisture, % -- 11.5Protein, % 1 11.0 --Fat, % 1 3.0 --Ash, % 1 -- 2.5Ph 6.7 8.0Material through a U.S. Standard No. 30 woven-wire-cloth sieve, % 100 --Material through a U.S. Standard No. 50 woven-wire-cloth sieve, % 85 --Material through a U.S. Standard No. 100 woven-wire-cloth sieve, % 52 --Dough Handling Typical, Cohesive, PliableBaked tortilla Typical, No cracksFlavor Typical, Lime-cornTotal bacteria count, per gram -- 50,000
1 Analyses are expressed on a moisture-free basis.
ENRICHMENT INGREDIENTS Minimum Maximum Thiamine, mg/lb. 2.0 3.0Riboflavin, mg/lb. 1.2 1.8Niacin or niacinamide, mg/lb 16.0 24.0Iron (reduced iron, 325 mesh to be used as the iron source), mg/lb. 13.0 26.0Vitamin A Palmitate, IU/lb. 10,000 12,000Calcium (in harmless and assimilable form), mg/lb. 500 1,000
(Source: USDA :FSA:PDD:EOB January 16, 1998. Contact 202-690-3565;MF7: PURCHASE OF INSTANT CORN-SOY MASA FLOUR FOR USE IN EXPORT PROGRAMS –SPECIFICATIONS)

COMMODITIES REFERENCE GUIDE FACT SHEET: CORN SOY MASA FLOUR, INSTANT
25
Corn Soy Masa Flour, InstantThis blended, protein-fortified, processed commodity is designed for use in the preparation of tortillasand similar products or gruels to be consumed by both children and adults.
1. NUTRITIONAL VALUES (per 100 g)These are average values, taken from the U.S.Department of Agriculture, Agricultural ResearchService (USDA:ARS) 1998 USDA Nutrient Database,Release 12, Laboratory Home Page,(http://www.nal.usda.gov/fnic/foodcomp). Thesenutrient values are provided as a guide for use in thecalculation of food aid rations; users should be awarethat shipments of food aid may vary from these exactvalues. The values for thiamin, riboflavin, niacin,vitamin A, calcium and iron represent the minimumlevels of enrichment nutrients (converted to a 100 gbasis) as listed in Specifications below.
2. COMPONENTS95% Corn Masa Flour:
Whole ground white or yellow corn, partiallyprecooked in lime water, followed by washing,rinsing, grinding, and drying to produce thetraditional flavor and performance characteristicssuitable for preparation of a wide range of foodstaples in the form of arepas, corn cakes, cornchips, tortillas, enchiladas, or gruel.
5% Soy Flour : Defatted and toasted.Vitamin and Mineral Enrichment
3. SPECIFICATIONS(See Table next page.)
4. PACKAGING25 kg (55lb.) bags of multi-wall paper. Three plies ofpaper (minimum) with an inner polyethylene orpolypropylene plastic liner. The outer paper ply istreated to provide wet strength.
Nutrient Amount UnitWater 8.9 gEnergy 363.1 KcalProtein 11.4 gTotal Lipid 3.7 gCarbohydrate 74.2 gFiber, total dietary n/a gAsh 1.8 gCalcium 110 mgIron 2.90 mgMagnesium 119.0 mgPhosphorus 246 mgPotassium 402 mgSodium 5.8 mgZinc 1.8 mgCopper 0.4 mgManganese 0.6 mgSelenium n/a mcgVitamin C 0 mgThiamin 0.44 mgRiboflavin 0.26 mgNiacin 3.53 mgPantothenic acid 0.7 mgVitamin B-6 0.4 mgFolate 150 mcgVitamin B-12 0 mcgVitamin A 2205 IUVitamin E n/a mg-ATEVitamin D n/a IUIodine n/a mcg

COMMODITIES REFERENCE GUIDE FACT SHEET: CORN SOY MASA FLOUR, INSTANT
26
5. SHELF LIFEAt least one year. See “Section III: Storage/Shelf Life Specifications” for more information
CHEMICAL AND PHYSICAL REQUIREMENTSREQUIREMENT1
ITEM Minimum Maximum Moisture, % -- 11.5Protein, % 1 11.0 --Fat, % 1 3.0 --Ash, % 1 -- 2.5Ph 6.7 8.0Material through a U.S. Standard No. 30 woven-wire-cloth sieve, % 100 --Material through a U.S. Standard No. 50 woven-wire-cloth sieve, % 85 --Material through a U.S. Standard No. 100 woven-wire-cloth sieve, % 52 --Dough Handling Typical, Cohesive, PliableBaked tortilla Typical, No cracksFlavor Typical, Lime-cornTotal bacteria count, per gram -- 50,000
1 Analyses are expressed on a moisture-free basis.
ENRICHMENT INGREDIENTS Minimum Maximum Thiamine, mg/lb. 2.0 3.0Riboflavin, mg/lb. 1.2 1.8Niacin or niacinamide, mg/lb 16.0 24.0Iron (reduced iron, 325 mesh to be used as the iron source), mg/lb. 13.0 26.0Vitamin A Palmitate, IU/lb. 10,000 12,000Calcium (in harmless and assimilable form), mg/lb. 500 1,000
(Source: USDA :FSA:PDD:EOB January 16, 1998. Contact 202-690-3565;MF7: PURCHASE OF INSTANT CORN-SOY MASA FLOUR FOR USE IN EXPORT PROGRAMS –SPECIFICATIONS)

COMMODITIES REFERENCE GUIDE SECTION III: STORAGE/SHELF LIFE SPECIFICATIONS
1
SECTION IIIStorage/Shelf Life Specifications
I STORAGE SPECIFICATIONS
Storage space requirements should be given careful attention. The amount of space necessary in awarehouse depends upon the total volume of food to be stored and on the number of differentcommodities. Each commodity should be stacked separately. Separate stacks require more usablevolume than one large stack (i.e., a warehouse large enough to hold 50 MT of wheat will hold less than50 MT of wheat and sorghum stacked separately).
The difference between gross dimensions of a warehouse and usable volume for storage must be takeninto consideration. The following illustrations show gross dimensions of warehouses and usable volumewhen stacks of food are stored.
Space Utilization - Usable Stacking Volume in Cubic Meters
Figure 1:Warehouse with one stack of grain. Figure 2:Warehouse with two stack of grain
(Source: CARE Food Resource Manual, November 1995).

COMMODITIES REFERENCE GUIDE SECTION III: STORAGE/SHELF LIFE SPECIFICATIONS
2
1M1M1M
1M1M1M
20M
8.5M8.5M
10M
20M
18M
8M10M
8M
Small Warehouse (Height = 3M)
One stack Two stacks
Gross Volume Gross volume= 10M x 5M = 50M2 x 3M = 150M3 = 10M x 5M = 50M2 x 3M = 150M3
Usable Volume Usable volume= 8M x 3M = 24M2 x 2M = 48M3 = (10M - 3M) x (5M - 2M)Storage Capacity (50 kg bags) = 7M x 3M = 21M2 x 2M = 42M3
= 48 M3/ 2 = 24 MT (480 bags) Storage Capacity (50 kg bags)= 42 M3 / 2 = 21 MT (420 bags)
Medium Warehouse (Height = 4M)
One stack Two stacks
Gross Volume Gross volume= 10M x 20M = 200M2 x 4M = 800M3 = 10M x 20MUsable Volume = 200M2 x 4M = 800M3
= 18M x 8M = 144M2 x 3M = 432M3 Usable volumeStorage Capacity (50 kg bags) = (20M - 3M) x (10M - 2M)= 432 M3 / 2 = 216MT (4320 bags) = 17M x 8M = 136M2 x 3M = 408M3
Storage Capacity (50 kg bags)= 408M3 / 2 = 204 MT (4080 bags)
(Source: CARE Food Resource Manual, November 1995).
10M
3.5M3.5M
5M5M
10M
3M
8M
3M

COMMODITIES REFERENCE GUIDE SECTION III: STORAGE/SHELF LIFE SPECIFICATIONS
3
1M1M
15M 1M4M1M
40M
15M
40M
38M
13M
17M
13M
17M
13M
Large Warehouse (Height = 5M)
One stack Two stacks; four meter central gangway
Gross Volume Gross volume= 40M x 15M = 600M2 x 5M = 3,000M3 = 40M x 15M = 600M2 x 5M = 3,000M3
Usable Volume Usable volume= 38M x 13M = (40M - 4M - 2M) x (15M - 2M)= 494M2 x 4M = ,1976M3 = 34M x 13M = 442M2 x 4M = 1,768M3
Storage Capacity Storage Capacity= 1,976M3 / 2 = 988M3 (19,760 bags) = 1,768M3 / 2 = 884M3 (17,680 bags)
Eight stacks; four meter central gangway40M
Gross volume = 40M x 15M = 600M2 x 5M = 3,000M3
Usable volume = (40M - 4M - 4M) x (15M - 3M)= 32M x 12M = 442M2 x 4M = 1,768M3
Storage Capacity = 1,768M3 / 2 = 884M3 (17,680 bags)
1M
1M
4M
4M
8M
6M
8M
6M
8M
6M
8M
6M
8M
6M

COMMODITIES REFERENCE GUIDE SECTION III: STORAGE/SHELF LIFE SPECIFICATIONS
4
(Source: CARE Food Resource Manual, November 1995).

COMMODITIES REFERENCE GUIDE SECTION III: STORAGE/SHELF LIFE SPECIFICATIONS
5
In estimating how much usable space is needed per commodity, the following rules of thumb mayhelp. (These are estimated figures)
§ One MT of a bagged commodity (50 lb. bags) requires approximately 2 cubicmeters of usable storage space.
§ One MT of edible Vegoil in tins requires approximately 1.4 cubic meters of usablestorage space.
§ In using the stacking suggestions below, do not stack fiberboard cases of oil tinshigher than 8 layers. Do not stack flour and meals higher than 20 layers. Do notstack grits or whole grains higher than 30-40 layers.

COMMODITIES REFERENCE GUIDE SECTION III: STORAGE/SHELF LIFE SPECIFICATIONS
6
II STORAGE INSPECTION CHECKLISTDate: __________________Inspected by: __________________Warehouse: __________________
A. Yard Area Surrounding Warehouse
___ 1. Inspect the yard for signs of rodents (i.e., pellets, tracks, burrows, holes, sings of feeding).___ 2. Check to see that conditions do not attract insects (i.e., spilled commodities or other
edible materials, empty containers, bird nests, weeds, trash, piled or damaged packingmaterials).
___ 3. Remove trash and unnecessary equipment and supplies regularly.___ 4. Check the general security of the yard area surrounding the warehouse.
B. Warehouse
___ 1. Screen openings with wire netting with mesh not larger than 6.35 mm.___ 2. Make doors of tightly fitting metal.___ 3. Check for roof leaks.___ 4. Check for holes in the walls.___ 5. Ensure that the floor is sufficiently hard-packed to prevent burrowing by rodents.___ 6. Check to see that the warehouse is well lit.___ 7. Clean and service the anticoagulant and rodent bait stations regularly, and keep them filled
with fresh bait (exterior use only)___ 8. Use rodent tracking powders (exterior use only)___ 9. Use multiple-catch mouse traps, snap traps, and glue boards in the interior of the
warehouse and check them weekly.___ 10. Position commodity stacks at least one meter from walls and other stacks.___ 11. Keep passageways clean.___ 12. (For large and very large warehouses) Provide three to four meters wide central
gangways.___ 13. Stack at a reasonable height for ease of handling and to prevent damage to containers by
crushing or falling from stacks.___ 14. Lift bags by the body instead of corners (to prevent tearing or weakening of the bag).___ 15. Place bags on stacks, do not throw.___ 16. Make sides of stack flush.___ 17. Provide air spaces between the individual stacks.___ 18. Clean empty bags thoroughly before reuse and stack neatly.___ 19. Use packing materials (e.g. cardboard, wood crates) that is clean.___ 20. Stack clean unused packing materials neatly.___ 21. Remove broken packing materials.___ 22. Cover the top of packing materials to prevent spillage of food from damaged containers
to ground or floor below.

COMMODITIES REFERENCE GUIDE SECTION III: STORAGE/SHELF LIFE SPECIFICATIONS
7
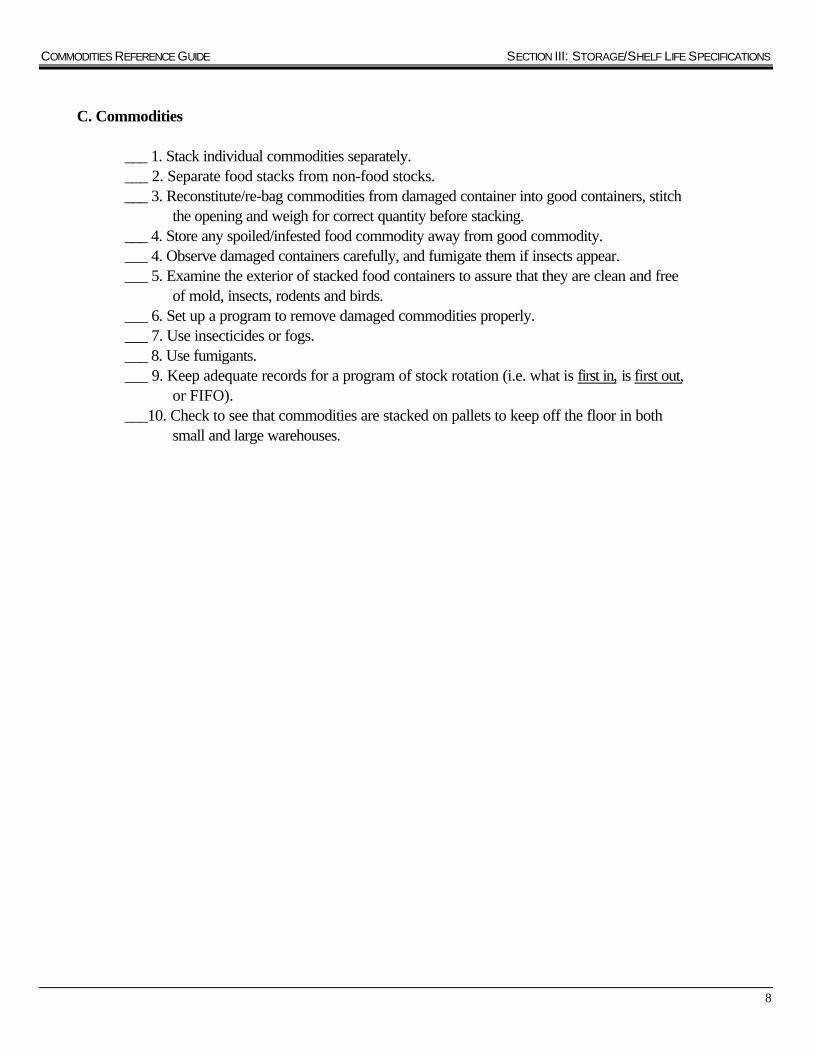
COMMODITIES REFERENCE GUIDE SECTION III: STORAGE/SHELF LIFE SPECIFICATIONS
8
C. Commodities
___ 1. Stack individual commodities separately.___ 2. Separate food stacks from non-food stocks.___ 3. Reconstitute/re-bag commodities from damaged container into good containers, stitch
the opening and weigh for correct quantity before stacking.___ 4. Store any spoiled/infested food commodity away from good commodity.___ 4. Observe damaged containers carefully, and fumigate them if insects appear.___ 5. Examine the exterior of stacked food containers to assure that they are clean and free
of mold, insects, rodents and birds.___ 6. Set up a program to remove damaged commodities properly.___ 7. Use insecticides or fogs.___ 8. Use fumigants.___ 9. Keep adequate records for a program of stock rotation (i.e. what is first in, is first out,
or FIFO).___10. Check to see that commodities are stacked on pallets to keep off the floor in both
small and large warehouses.

COMMODITIES REFERENCE GUIDE SECTION III: STORAGE/SHELF LIFE SPECIFICATIONS
9
III SHELF LIFE OF AGRICULTURAL COMMODITIES
A. GENERAL REVIEW
Shelf life refers to the average amount of time a product may be store without nutritional or organoleptic(sensory) deterioration. A food product can deteriorate for several reasons: aging, microbiologicaldecay, chemical and physical degradation, texture changes, etc. These modes of deterioration areaffected by many factors, both intrinsic (of or within the product) and extrinsic (environmental oroutside the product). Controlling processing, packaging, handling and storing of the product can slowdeterioration of food products. Depending on the product, this date may be a food safety date; however,it primarily refers to the length of time the product can be expected to last without significantdeterioration.
Intrinsic Factors Extrinsic Factors moisture or water activity (Aw) storage temperature salt and mineral content atmosphere (e.g., oxygen, nitrogen pH and carbon dioxide levels) physical state type of packaging degree of microbiological contamination light exposure presence or absence of antimicrobial agents water moisture/ air permeability
handlingrelative humidity
B. BEST IF USED BY DATE
Shelf life is different from the “Best if Used by Date”, which is intended to tell you how long the productwill retain best flavor or quality. This is not a food safety date and “Best if Used by Dates” are intendedas useful guidelines. Some food may deteriorate more quickly and other foods may last longer than thetimes suggested. A number of factors can shorten the useful life of a food product, such as improperhandling and inadequate storage temperatures. As the expiration date is not always noted on thecontainer/bag, the inventory control methods of “first-in, first-out” (FIFO) should be practiced by thoseresponsible for managing commodity inventories and distribution at all levels. Products kept past the“Best if Used by Date” are not necessarily “out of condition”. Food products may be eaten after the“Best if Used by Date” if the product has been properly stored, handled, and the primary container is ingood condition.
In either case, the dates assigned to products are based on intrinsic and extrinsic factors, and determinedby systematic study or empirical data. Systematic studies are designed to simulate actual or potentialstorage and handling practices of a given product and estimate shelf life through the course of chemicaland analytical testing at specific intervals throughout the expected shelf life. Systematic studies may alsorely on accelerated testing when dealing with products with expected long shelf lives. In some cases,shelf life evaluations can be made based on existing information, or empirical data. By gatheringinformation from actual field use, an estimated shelf life can be determined; however, this should beconfirmed through systematic studies where the mode of deterioration is a food safety hazard.

COMMODITIES REFERENCE GUIDE SECTION III: STORAGE/SHELF LIFE SPECIFICATIONS
10
Often there is a conflict between quality and the logistic requirements of manufacturing and shipping.Compromises which have to be made should never sacrifice quality (or safety) and statutory qualitystandards and regulations of the product.
(Source: All Shelf Life material provided by Contract Management Branch, USDA)
C. TEMPERATURE AND HUMIDITY
Universal guidelines for controlling temperature and humidity conditions are impossible because theseconditions and the operating environment vary from place to place. The basic instructions for field staffare:§ Keep all food commodities in dry condition.§ Do not keep wet food with dry food.§ De-bag wet commodities and dry them under the sun. Re-bag them and weigh them.§ Cross-ventilate the warehouse if possible.§ A sunroof in the warehouse is preferable.§ Covering food commodities with tarpaulin during transportation is mandatory.

COMMODITIES REFERENCE GUIDE SECTION III: STORAGE/SHELF LIFE SPECIFICATIONS
11
IV References
CARE. Food Resources Manual. 1998. Food Aid Management Website: http://www.foodaid.orgCommodity Management Page.
Monetization Field Manual P.L. 480 Title II Programs. USAID/BHR/FFP/Development Programs.October 16, 1998. http://www.info.usaid.gov/hum_response/ffp/monetiz.htm
Proceedings Commodity Storage and Loss Reduction Project Dissemination Workshops. Port-au-Prince,Haiti, June 29-July 2, 1998, and Johannesburg, South Africa, July 27-29, 1998. Workshops hosted by:CARE, Catholic Relief Services, Food Aid Management, World Vision Relief and Development, andUSDA/OFDA. http://www.foodaid.org Commodity Management Page.
Save the Children Monetization Manual: Market Analysis, 2.2 Commodity Selection, pp. 2-5
Selected Bibliography of FSRC Resources on Commodity Storage, Commodity Loss, and CommodityManagement. Prepared by Jessica Graef for the Commodity Storage and Loss Reduction ProjectWorkshop July 27-29, 1998, Johannesburg, South Africa (see above). Attachment J, pp. 1-10. FoodAid Management, http://www.foodaid.org Commodity Management Page.

COMMODITIES REFERENCE GUIDE SECTION IV: CONTROLLING DAMAGE TO FOOD COMMODITIES
1
SECTION IVControlling Damage to Food
Commodities
I CLEANING AND INSPECTING
If sound storage procedures for commodities, as addressed in the following chapter, are followed, insect and rodentproblems will be minimal. The problems can be further controlled with a program of cleaning and inspecting.
The program should include (1) closing or removing open food containers, (2) repairing damaged packages, (3)removing and disposing food unfit for human consumption, and (4) inspecting and cleaning the storage area regularlyaccording to a planned, scheduled program.
Table IV, 1 Guidelines for Warehouse InspectionsArea to be inspected: Inspect for:Outside the warehouse Cleanliness
Condition of roof, walls and windowsSecurity--fences, guards, locked doors and windows
Inside the warehouse Condition and cleanliness of ceilings, floors and wallsAdequate ventilationPlacement of rodent baits / trapsPresence of hazardous substances such as chemicals and pesticidesPresence of fire extinguishing equipment, dates not expired
Food storage area Distance between stacks, and between stacks and wallsInterlaced or bonded stacksUse of pallets free of exposed nails or wooden splinters which may tear bagsSegregation of damaged foodInsect infestations -visual and soundsRodent or bird infestationsStale food which has been stored too longLeaking, stained or discolored containers, bulging or rusting cans andcaking of food within bagsGermination of grain in sacksShort-weight containers
Warehouse office area CleanlinessAdequate shelvingAdequate lightingCondition of office equipment

COMMODITIES REFERENCE GUIDE SECTION IV: CONTROLLING DAMAGE TO FOOD COMMODITIES
2
II INSECT CONTROL
A. FUMIGATION
In all cases, READ THE MANUFACTURER'S LABEL BEFORE USING FUMIGANTS. Due to theextreme toxicity of fumigants, the utmost caution must be taken during their handling andadministration.
Fumigation is the use of a gas to kill insects and rodents. The purpose of fumigation is to destroy all stages ofinsects present in the material to be treated. An atmosphere that is toxic to insects will also kill rodents orother forms of animal life. Fumigation, will not eliminate mold or bacteria. Because there is no residual kill,insects or rodents may recontaminate the commodity immediately after fumigation. In order to protect storedfoods a great emphasis must be placed on cleaning when sprays and fogs are used to eliminate insects.
To conduct an effective and safe fumigation, certain conditions must be met, including, but not limitedto the following:
• appropriate temperature• proper use of tarpaulins and sealing technique• proper dosage and time exposure• monitoring for presence of fumigants• safety precautions• inspection and follow-up.
B. INSECTICIDES (Other than Fumigants)
Again, READ THE MANUFACTURER'S LABEL BEFORB USING INSECTICIDES. Insecticides areuseful tools when used with stack rotation and thorough cleaning. Nothing takes the place of cleanliness.
Sprays.Insecticide sprays are applied to surfaces and will leave a residue that continues to kill insects thatcontact it. Be careful not to spray on product. Effective life of the residue depends on many things,including type of insecticide, surface to which it is applied, temperature, and humidity.
Fogs and Mists.Insecticide fogs and mists move through the air to reach insects that may not be reached by contactsprays. They are especially effective against flying insects and insects that cannot be reached withcontact sprays (for example, on surfaces of bags containing food). Close all doors and openings in thewarehouse to prevent escape of the fog or mist. Read and follow manufacturer’s label instructions.

COMMODITIES REFERENCE GUIDE SECTION IV: CONTROLLING DAMAGE TO FOOD COMMODITIES
3
III RODENT CONTROL
The primary method of rodent control is cleaning to eliminate harborage and food in the warehouse andaround the storage area. Remove debris, weeds, trash, and food outside. Keep the inside of the warehouseclean of all food, especially containers of food unfit for human consumption and awaiting disposal. Remove orrepair torn and broken packages. Openings into storage buildings should be protected against rodents withscreen having openings not larger than 6.35 mm. Doors must fit tightly and they must be kept closed when notin use.
Bait StationsTo help control rodents, exterior bait stations containing fresh anti-coagulant poison should be maintainedaround the periphery of the grounds, 100 feet apart and around the exterior of the building, 50 feet apart. Baitstations must be checked frequently, (at least twice monthly) so that the bait does not become wet, moldy, orinfested with insects.
Tracking PowderTracking powder can be used in limited areas (not where it could contaminate food) where a mouse problemis suspected.
Snap Traps
Snap Traps can be used; however, they must be given daily attention to be effective.
Glue BoardsThese are useful against mice. They can be distributed among the stacks of food where mice becomeentangled with the glue and cannot escape. Glue boards must be inspected frequently, to be certain that theyare fresh and effective. To increase effectiveness, place under a box with openings at each end (to create atunnel), to protect from dust and to offer shelter to rodents.
Multiple-Catch TrapsThese traps are for interior use and can hold up to 30 mice. Some require winding; all require weeklyinspection.

COMMODITIES REFERENCE GUIDE SECTION IV: CONTROLLING DAMAGE TO FOOD COMMODITIES
4
IV REFERENCE CHART FOR CONTROLLING DAMAGE TO FOODCOMMODITIES
Table IV, 2 Controlling Damage to FoodType ofdamage
Evidence of damage Methods of control Action necessary
Short-weightcontainers
Bags appear slack.Containers are not asheavy as normal whenlifted.Weighing a randomsample of bags andcontainers indicatesshort-weight.
If bulk shipments,increase vigilance ofbagging operation at port.Increase security instorage areas and duringtransport.
Repackage or assign a newweight to the containers.Prepare Loss and AdjustmentReports and enter transactionson stack cards and inwarehouse inventory ledgers.
Leaking,broken ortorn bags orcontainers
Spilled food intransport vehicle.Food spills fromcontainers duringunloading.Bags are torn andcontainers are dentedor crumpled.
Handle properly--do notthrow, stack too high oruse hooksContact donor ifpackagingmaterial/containerappears inadequate.
Repackage food fit forhuman consumption. Inspectsweepings and eitherreconstitute or dispose ofsweepings declared unfit forhuman consumption.Prepare Loss and AdjustmentReports and enter transactionson stack cards and inwarehouse inventory ledgers.
Wet, stainedor moldybags orcontainers
Containers are wet tothe touch or dripping.Containers arediscoloredUnusual smell (moldyor chemical)Caking of food.
Ship in waterproof holdsor in adequately sealedcargo containers.Keep under cover whenstored outside.Transport usingtarpaulins.Insure adequate aircirculation.Do not store pastexpiration date oncontainer.
Inspect and reconstitutefood fit for humanconsumption; dispose of fooddeclared unfit for humanconsumption. Fooddampened by rain may bedried and reconstituted.Prepare Loss and AdjustmentReports and enter transactionson stack cards and inwarehouse inventory ledgers.
Bulging orrusted tins
Rust on outside ofcontainer, especiallynear seams and lids.Shape of container isbulging and distorted.
Do not store in directsunlightDo not store pastexpiration date oncontainer or longer thanfour months.
Inspect and reconstitutefood fit for humanconsumption; dispose of fooddeclared unfit for humanconsumption.Prepare Loss and AdjustmentReports and enter transactionson stack cards and inwarehouse inventory ledgers.

COMMODITIES REFERENCE GUIDE SECTION IV: CONTROLLING DAMAGE TO FOOD COMMODITIES
5
Type ofdamage
Evidence of damage Methods of control Action necessary
Rodent orbirdinfestation
Rodents or birds in thewarehouseExcrement on the flooror stacksGnawed bags orcontainersFootprints in dustNests
Cleanliness andmaintenance are criticalto preventing infestations.Keep both the outsideand the inside of thestorage facility clean andfree of debris. Closeholes or openings inwalls, floors and ceilings.If possible place screensover windows andventilation openings.Cats are effective incontrolling rodents.Traps can be set alongthe interior walls of thewarehouse, at each sideof every outside door, andin rafters. Insure that nopoisons or traps areaccessible to the cats.
Inspect and reconstitutefood fit for humanconsumption; dispose of fooddeclared unfit for humanconsumption.Prepare Loss and AdjustmentReports and enter transactionson stack cards and inwarehouse inventory ledgers.
Insect ormothinfestation
Flying insectsLive or dead insects orlarvae on the floorTraces of insects orlarva in dustGrain bags have smallholes and excessivedustNoise heard inside thebagIrregular holes in thegrain or beansStrong odor
Cleanliness is critical toprevent insect infestations.Keep both the outside andthe inside of the storagefacility clean and free ofdust and debris.
Inspect and fumigate ;dispose of food declared unfitfor human consumption.Prepare Loss and AdjustmentReports and enter transactionson stack cards and inwarehouse inventory ledgers.
Seepings Loose food from slack ortorn bags on warehousefloorsLoose food on warehousefloors after reconstitution
Keep bags of food frombeing handled roughly ormoved too many times.Instruct laborers to avoid asmuch spillage as possibleduring the reconstitution offood.
Frequently sweep floors to keepthem clean.Reconstitute all food that maybe fit for human consumption.Determine if sweepings areunfit.Prepare Loss and AdjustmentReports and enter transactionson stack cards and inwarehouse inventory ledgers.

COMMODITIES REFERENCE GUIDE SECTION IV: CONTROLLING DAMAGE TO FOOD COMMODITIES
6
V REFERENCES
CARE. Food Resources Manual. 1998. Food Aid Management Website: http://www.foodaid.orgCommodity Management Page.
Bibliography available at FAM.
USAID. Environmental Documentation Manual – For P.L. 480 Title II Cooperation SponsorsImplementing Food-Aided Development Programs (Final Draft). Reprinted April 1998.
USAID. A Field Guide to USAID Environmental Compliance Procedures, based on the USAIDEnvironmental Manual for P.L. 480 Title II Food for Development Programs. March 5, 1998.

COMMODITIES REFERENCE GUIDE OVERVIEW OF PART TWO
1
Part Two
GUIDELINES FOR SELECTING FOODAID COMMODITIES
AN OVERVIEW
I. INTRODUCTION
The Commodities Reference Guide (CRG) provides relevant information about food commodities thatare used in PL 480 Title II programs. Part One of the CRG contains Sections I through IV, whichcontain descriptions of food commodities available through PL480, Title II and their nutritional valuesand physical properties. Part One also includes important general information regarding the safe andeffective storage and use of rations for use in Title II programs. Part One may be found online atwww.usaid.gov/hum_response/crg.
Part Two provides programming information and considerations for selecting food aid rations fordifferent program scenarios, including an overview and five program modules. The overview consistsof a description of USAID’s Office of Food for Peace (FFP) mandate,the types of programs it hasapproved and outlines the general approach to selection of food commodities used in the modules. Thefive program modules are the following: Module 1: Maternal Child Health and Nutrition; Module 2:Food for Work; Module 3: Food for Education; Module 4: Non-Emergency Humanitarian Assistance ,and Module 5: Emergency. . Part III consists of five annexes, which include USAID and select foodsecurity definitions, a resource list of indicators, and tables for use in calculating food aid rationpackages.
The information presented in Part Two is not intended to substitute for the detailed guidance providedannually by the Office of Food for Peace, the monetization manual, or the USAID food aid and foodsecurity policy paper. For guidance on the development of proposals see FFP’s Title II Guidelines forDevelopment Programs available online at www.usaid.gov/hum_response/ffp/dappaa.htm or PVOGuidelines for Title II Emergency Food Proposals and Reporting (Draft) also online atwww.usaid.gov/hum_response/ffp/emerg.htm. Additional information can be found at the Food AidManagement website www.foodaid.org. Examples provided in this section are meant to be illustrativeand do not attempt to cover all the ways in which rations may be used in programs. Part Two provideslinks to relevant program and policy documents as well as key web sites useful to cooperating sponsors(CSs) implementing Title II food aid programs.

COMMODITIES REFERENCE GUIDE OVERVIEW OF PART TWO
2
II. OFFICE OF FOOD FOR PEACE’S MANDATE AND PROGRAMS
The overarching goal of the PL 480, Title II resource is to improve the food security of vulnerablepopulations around the world, either by the direct distribution of food aid commodities or the use oflocal currencies generated by the sale of these commodities. Food for Peace has the responsibility foradministering PL 480, Title II food aid programs. This responsibility includes the review and approvalof CS food aid program submissions, monitoring of program implementation and reporting to the U.S.Congress on progress made against established performance indicators. The CSs are generally U.S.and local PVOs and international organizations, such as the World Food Program (WFP).
Development and emergency food aid activities complement one another in achieving USAID’sstrategic goal of long-term food security. In crisis prone regions, for example, emergency food aid isused to rapidly respond to reduce human suffering caused by natural and man-made disasters whilesimultaneously laying a broader foundation for longer-term food security. Similarly, in developmentactivities food aid helps to mitigate emergencies. An intermediate program supported by Food forPeace is the Short Term Development Program or Transition Activity, which takes a program from anemergency function to a more long-term development activity. A brief explanation of developmentand emergency food aid programs are as follows:
A. DEVELOPMENT FOOD AID PROGRAMS
PL 480, Title II development food aid constitutes the single largest source of USAID funding for foodsecurity programs. As a development tool, food aid is a flexible resource that can be used for directfeeding or monetized (sold) to generate local currency for development activities. Food aid is usuallyone component of a multifaceted development program and is used to help achieve programobjectives. The majority of Title II development programs support the following major areas: (1)household nutrition and health; (2) agricultural productivity and natural resources management; (3)education; and (4) non-emergency humanitarian assistance for vulnerable groups.
1. HOUSEHOLD NUTRITION AND HEALTH
Household nutrition depends not only on sufficient quantity and quality in the household diet and food,but also on health, child care, and the environment of care (e.g., water and sanitation). Activities toimprove household nutrition can aim to do so in various ways, for example an objective could be: toreduce malnutrition, increase micronutrient consumption, promote breast-feeding, improve ante-natalcare, and ensure immunization against preventable diseases. Title II food assistance directly supportsinterventions that aim to improve nutritional status and mother and child survival worldwide.Guidance for food aid components for activities that support Maternal Child Health and Nutrition(MCHN) can be found in Module 1-MCHN Programs.
2. AGRICULTURAL PRODUCTIVITY AND NATURAL RESOURCES MANAGEMENT
Agricultural productivity and natural resources management efforts promote sustainable farmingpractices, more productive and diversified farming techniques, and improved post-harvest managementand marketing. Under this sector, Food-for-Work (FFW) and Cash-for-Work (CFW) programs may beused to generate employment and construct infrastructure that has the potential to improve agricultural

COMMODITIES REFERENCE GUIDE OVERVIEW OF PART TWO
3
productivity or income, and, in turn, household nutrition. FFW is typically targeted seasonally as wellas geographically, focusing on areas and seasons that are most food deficit. For example, food assistedcommunity infrastructure projects can provide short term employment to keep farmers near their fieldsand families, forestalling migration in search of wage work elsewhere. Food for Work programs arelargely used to support development efforts, but are also used to support reconstruction afteremergencies . A part of the Title II development portfolio includes support to microenterprise creditactivities often managed by women and women’s groups. Module 2-Food for Work Programsprovides principles and examples of how rations are selected for FFW activities.
3. EDUCATION
USAID uses food aid to help improve educational opportunities by providing school snacks and mealsand take-home incentive rations. These Food-for-Education (FFE) programs are used to encourageschool enrollment and attendance, and to improve students’ attentiveness—especially for those whoreceive no breakfast at home. Food insecure communities with poor school attendance and low-testscores are usually selected as the primary target for this type of assistance. Some programsspecifically target girls. Principles and examples of ration selection in FFE programs are provided inModule 3-Food for Education Programs.
4. NON-EMERGENCY HUMANITARIAN ASSISTANCE
NEHA is designed to respond to crises as well as to feed those who are not able to take advantage ofdevelopment activities in their communities. It exemplifies a longer-term effort to provide safety netsto vulnerable populations while providing a rapid response to rapid onset disaster. Beneficiariesinclude orphans, the elderly, patients in hospitals and families affected with HIV/AIDS. NEHA isgenerally provided through direct feeding programs and, frequently, in conjunction with otherassistance activities. Principles and ration selection guidelines for NEHA programs are described inModule 4-Non-Emergency Humanitarian Assistance Programs.
B. EMERGENCY FOOD AID PROGRAMS
Typically, emergency relief activities are a combination of general and targeted food distribution.General food distribution provides food rations for the whole population most affected by a disaster,including refugees and internally displaced populations (IDPs). Targeted food distribution providesfood only to a selected group who is the most vulnerable within the larger emergency-affectedpopulation. Common groups for targeting include: young children, especially those under five;orphans or unaccompanied children; pregnant and lactating women; the elderly, sick, or handicapped;and those identified as malnourished. Targeted food distribution activities can be implemented in oneor more of several ways : supplementary feeding, therapeutic feeding, and food-for-work.
Emergency food aid programs may use a combination of components and should evolve over timebased on information from continuous needs assessments. For example, an emergency activity thatbegins as a general feeding program serving all members of a population may evolve over time into afood-for-work or food-for-agriculture activity targeted to only a portion of the population. Thisevolution should correspond to recipients’ growing self-reliance and facilitate the transition fromrelief to sustainable development.

COMMODITIES REFERENCE GUIDE OVERVIEW OF PART TWO
4
While planning emergency activities, CSs and USAID endeavor to: (1) design relief interventions thatdo not promote aid dependency; (2) target food aid so that it reaches the most vulnerable populationsin a timely manner; and (3) incorporate activities that ease the transition from crisis to recovery bylinking relief to development. Examples of the use and selection of food aid commodities foremergency situations may be found in Module 5-Emergency Programs.
C. MONETIZATION
Monetization involves the sale of donated commodities overseas followed by the use of the funds tosupport some humanitarian or development activity. For a detailed treatment of monetizationactivities, see the USAID Monetization manual, which is posted on the USAID webpagewww.usaid.gov/hum_response/ffp/monetiz.htm.
III. WHEN TO USE FOOD AID
There are many factors that determine if food aid is appropriate. While each CS has developed its ownset of programming documents, several USAID-supported technical assistance projects have workedwith CSs and USAID to harmonize their practices. Any new PVO entering the field today has thebenefit of the collective experience of counterparts who have been implementing food assistanceprograms for decades.1
A primary concern in all Title II food aid programs is that the food aid not be a disincentive to localfood production or markets and that it not disrupt a country’s usual marketing requirements (UMR).To determine if food aid will be a production disincentive for local farmers, PL 480 legislation requiresthat a Bellmon analysis and determination be conducted. It is also important to emphasize that foodaid should not displace fundamentally sound dietary practices of the recipient population. The basicson the Bellmon analysis and determination are identified below.
BELLMON ANALYSIS AND DETERMINATION
Disincentive (Bellmon) analyses are presented with development (non-emergency)project proposals to the local USAID Mission Director. The analysis must show that:
• The commodity is suitable for monetization or distribution in that country;• There are adequate storage facilities in the recipient country;• Commodity distribution or monetization will not act as a substantial disincentive or
interfere with domestic production or commercial marketing of the commodity.
Guidance on how to carry out the Bellmon analysis may be found online atwww.usaid.gov/hum_response/ffp/bellmon.htm.

COMMODITIES REFERENCE GUIDE OVERVIEW OF PART TWO
5
IV. GUIDELINES FOR COMMODITY SELECTION
FFP recognizes that there is no such thing as “one size fits all” in program design and that no oneration can be appropriate for every context. For this reason, Part Two provides general guidelines,allowing for flexibility in different situations. Specific documents on how to design, manage, monitorand/or evaluate Title II programs can be found in the Resource List at the end of this chapter. Theguidelines below pertain to all five program modules set forth in this CRG, which are as follows:
Module 1: Maternal Child Health and Nutrition ProgramsModule 2: Food for Work ProgramsModule 3: Food for Education ProgramsModule 4: Non-Emergency Humanitarian Assistance ProgramsModule 5: Emergency Programs
With the exception of Module 5-Emergency Programs, the modules correspond to the beneficiarycategories of the annual estimate of requirements (AER) of food commodities for development activityproposals (DAP) or previously approved activities (PAA) used by CSs.2
The principles for selecting the most appropriate and cost-effective commodity rations to accomplishprogram objectives are organized in five general steps as follows:
1. Program Design2. Suitability of Food Commodities3. Ration Specifications4. Ration Calculation5. Ration Ranking and Selection
STEP 1: PROGRAM DESIGN
The five key program design considerations when using food aid are usually: (1) carrying out a needsassessment; (2) determining the appropriate use of food aid; (3) identifying characteristics of the targetpopulation; (4) developing program activity objectives; and (5) determining the distribution mode andfrequency. For the most recent and detailed guidelines on proposal development see FFP’s Title IIGuidelines for Development Programs (www.usaid.gov/hum_response/ffp/dappaa.htm) or, foremergency programs, PVO Guidelines for Title II Emergency Food Proposals and Reporting-Draft(www.usaid.gov/hum_response/ffp/emerg.htm). An explanation of each design component follows:
1. Carrying Out a Needs Assessment
As the food aid component of a program is designed, it is important to articulate why food aid is 1 Several sources of information and assistance are available from USAID-supported Food Aid Management (FAM). Theycan be reached at: www.foodaid.org2 USAID/BHR: Check for the most recent guidance also: Title II Guidelines for Development Programs. January 2000.www.usaid.gov/hum_response/ffp/dappaa.htm

COMMODITIES REFERENCE GUIDE OVERVIEW OF PART TWO
6
needed and how it will be used to meet program goals. A needs assessment or problem analysis willhelp to identify the nature, extent, severity, and distribution of the food needs, and, in turn, helpdetermine which type of food aid intervention would be most appropriate. Needs assessment shouldinclude analyses of food availability and the main causes of malnutrition, and summarize resources andcapacities for action. Attention should be given to how problems in the priority technical andgeographic areas are already being addressed.
Information about the target population’s demographic profile, nutritional status, food consumptionpatterns, breast-feeding practices, health statistics, socio-economic statistics, and other basicinformation needs for program design can be attained through primary data collection, using methodssuch as qualitative research, food consumption surveys, and nutritional status surveys. A usefulpublication on how to use these methods is USAID/CDIE’s Performance Monitoring and EvaluationTips, which is available online at www.dec.org/usaid_eval. Useful information can also be obtainedfrom secondary sources, but should be verified with local key informant interviews. Other informationabout the collection of primary data and secondary data resources may be found in the Resource List.Project design, data collection, and analysis for all methods should be conducted under the supervisionof experienced professionals. Please refer to USAID/BHR’s Title II Guidelines for DevelopmentPrograms 2000 for further guidance on developing a needs assessment(www.usaid.gov/hum_response/ffp/dappaa.htm).
2. Determining the Appropriate Use for Food Aid
Experience shows that food aid is most appropriate for achieving the following objectives: (a) meetingthe nutritional requirements of vulnerable target groups; (b) rehabilitating malnourished individuals;(c) improving school enrollment or attendance rates; (d) improving attendance at health clinics orcommunity centers; and (e) increasing agricultural income and productivity. To these ends, food aidcan be used as a nutritional supplement, a wage for service rendered, an incentive to participation, etc.Naturally, each of these different activities will involve different targeting, rations, and graduationcriteria.
3. Identifying Characteristics of Target Population
Results of the needs assessment will drive targeting decisions. Food aid can be used differently toaddress the needs of different target groups. Typical characteristics by which members of a targetpopulation or group are identified include age, nutritional status, gender, physiological status (e.g.pregnant, lactating, chronically ill), geographical location, etc. For example, the target beneficiariesmight be children under 2 years of age, malnourished children under 5 years of age, pregnant andlactating women, people over 60 years of age, refugees, households of farmers living in a droughtaffected area, residents of a TB sanatorium, etc.
4. DevelopingProgram Activity Objectives
Food commodities and rations should be selected in a manner consistent with program objectives andthe target group. For example, an intervention to improve nutritional status of a population mighttarget underweight children while, in another case, food aid may be used as an incentive to motivatepregnant women to attend prenatal clinics. Provision of food aid is one input in such program designs.

COMMODITIES REFERENCE GUIDE OVERVIEW OF PART TWO
7
No matter how the food is used, the desired result of the food assistance intervention should be statedin terms of objectives. Then, food commodities and rations can be selected to be consistent with theseobjectives. Each CS has its way of expressing objectives. However, using USAID’s Managing forResults Terminology will facilitate reporting to USAID, (See Annex 1 in Part Three )HYPERLINKObjectives for USAID-funded programs should be result statements, that is, they shouldclearly describe the desired end results of the intervention) For example, a results-oriented objectivewould be “Improved nutritional status of children under two years of age”.
USAID recommends that there be at least one indicator to track progress toward the achievement ofeach objective/result. These indicators, referred to as performance indicators, are variables with aparticular characteristic or dimension that can measure progress. Resources for sample food securityand nutrition indicators can be found in Annex II (HYPERLINK). USAID/CDIE’s PerformanceMonitoring and Evaluation Tips (www.dec.org/usaid_eval) provides guidance on how to developobjectives and choose performance indicators. Whenever possible, programs should include input aswell as impact indicators for measuring progress of food aid programs. Each CS’s resources tomonitor and evaluate programs are different, and this will be taken into consideration during USAID’sfood aid proposal review and approval process.
CSs should also provide baseline data for selected indicators or a plan for collecting these data.Baseline studies should be conducted as part of the needs assessment, but may be accomplishedimmediately after activity approval. CSs should also articulate an evaluation and monitoring plan thatoutlines how indicators will be tracked.
5. Determining the Distribution Mode and Frequency
The mode and frequency of distribution should depend on program objectives, costs to both thedistributors and beneficiaries, the local context, characteristics of the target group, and the type andquantity of the rations. It is best to choose the distribution method or methods that will cause minimaldisruption to the recipient’s daily activities while best achieving program objectives. The types ofresponse mechanisms range from serving meals of prepared foods (on-site feeding), to distribution ofuncooked food to carry home (take-home rations) to the sale of food to get cash that is used to supportprogram activities (monetization).
On-site (wet) feeding involves preparing and serving ready-to-eat (wet) rations at designated sitesoutside the home. Most commonly on-site feeding is provided at institutions where beneficiariesreside or at designated feeding centers. The frequency of on-site feeding is one or more times daily,every day or several days per week. The advantage of on-site feeding is that food rations are eatenunder supervision, which helps to ensure that the food supplement is actually consumed by the targetbeneficiaries. Disadvantages of on-site feeding are that it is costly and labor intensive and the foodmay substitute rather than add to recipients’ diets when the family does not provide a meal at homebecause the recipient has received meals at the feeding center (substitution).
Take-home dry rations are uncooked food rations carried home where it is prepared and consumed.The frequency of distribution will depend on program objectives and practical logistics, both on theside of the distributors and the recipients. The advantage of take-home rations is that they are easier toadminister, more cost-effective, less time consuming for recipients, and can reach larger numbers ofrecipients. However, dry rations intended for one family member may be shared with other family

COMMODITIES REFERENCE GUIDE OVERVIEW OF PART TWO
members (leakage) or might be sold/exchanged in the market place, thereby reducing nutritionalimpact on the intended beneficiary.
Fooworactiits nandIn cdistis psecoandcommayproasso
MovarimorII c
All mayandthe dign
STE
Theindi
SUBSTITUTION: A World Food Program study found that substitution with on-sitefeeding programs ranged from 37-53% of energy compared to a leakage of 46-82% if theration was taken home.Source: Supplementary Feeding for Mothers and Children: Operational Guidelines, FAO, 1998, p.44
LEAKAGES: Self-targeting May Not Always Work: A study by SUSTAIN on themicronutrient content of food aid commodities found that corn soy blend food rations inHaiti, which were assumed to be self-targeted to weaning age children, was in fact beingused to make soup dumplings for the entire family.Source: Micronutrient Assessment Project Final Report, SUSTAIN, 1999
8
d-for-Work (FFW) activities generally involve distribution of take-home rations as payment fork done or services provided, or as an incentive for participation in training activities. In thesevities, food takes on importance to families both for it income transfer (monetary) value as well asutritional value. The frequency of distribution will depend on local circumstances and the nature
size of work accomplished. Recipients might receive food only once, when the work is completed.ases where the project is large and continues for an extended time period, there might beribution at regular intervals as the work progresses, e.g., weekly or monthly. The food distributedrimarily intended as compensation for work performed, although nutritional support may be andary objective. In situations where food insecurity and unemployment is a significant problem,
improvements in public infrastructure, remuneration of participant’s time for training, and/orpensation for decreases in food production while improved technologies are being implemented be necessary, FFW may be the most appropriate intervention. In these situations, FFW would
vide targeted families with employment and food while avoiding any dependency that might beciated with direct free food distribution activities.
netization involves the sale of donated commodities in the target country to get cash to supportous humanitarian and development activities. Monetization allows CSs to design and implemente flexible and responsive food security programs. Detailed guidance on the monetization of Title
ommodities is available online at www.usaid.gov/hum_response/ffp/monetiz.htm.
food aid activities should be designed to increase the recipient’s self-reliance and self-esteem. This be accomplished by encouraging the affected population to provide their comments on the mix
size of the ration, food payment ratios, the distribution system (daily, weekly, monthly, etc.), andperformance monitoring system. Use of this type of programming approach helps preserve theity of the recipients and contributes to program effectiveness.
P 2: SUITABILITY OF FOOD COMMODITIES
suitability of a ration should be assessed with regard to the needs and preferences of the targetedviduals, households, and community. A ration is suitable if it can be utilized effectively to achieve

COMMODITIES REFERENCE GUIDE OVERVIEW OF PART TWO
9
intended objectives. Aspects of suitability of food rations to consider, include beneficiaries’ nutritionalneeds and physiological capacities, food consumption preferences and patterns, locally available foods,community and household food processing and storage capacities and local market prices. Below arekey factors that should be taken into consideration when developing a list of appropriate commoditiesfor ration packages:
Cultural suitability includes factors such as traditional diet patterns, taste preferences, and foodsavoided for cultural or religious reasons that will affect food use and consumption. For example,Brazilians prefer black beans while Nicaraguans prefer small red beans. Another importantconsideration is whether the commodities are culturally suitable for the particular role they are to playin the project. For example, in a take-home MCHN program with a nutritional objective, blendedfoods, perceived as “baby foods”, may be less acceptable to other family members and, thus, morelikely to be consumed by the young child.
! Nutritional content is the nutritive content of the food commodity. Major nutrient considerationsshould include energy (calories), protein, fat, and micronutrients (vitamins and minerals).Characteristics of the target population, especially in terms of their age, body size, activity levels,health, nutritional status, reproductive status, and environmental factors, such as ambienttemperature, are the primary determinants of nutritional needs.
Physiological appropriateness relates to physical characteristics of the food commodities, such as thebulk, ease of chewing, viscosity, or digestibility, that affect their consumption and use in the body.Choices should consider the capabilities and limits of the target group. For example, children less then24 months have smaller stomach size and are less able to consume enough high bulk foods, such asgrains, to meet their caloric needs. Physical characteristics of a food ration are also important forchildren or adults who are severely malnourished, the sick and the elderly. People with HIV/AIDSinfections while needing extra energy and protein also find it difficult to eat certain types of foods.Availability of processing and/or storage facilities at both the community and household orinstitutional levels, fuel demands and availability, time and labor for preparation and cooking time, andavailability/absence of cooling equipment need to be considered.
Relationship to locally produced food should be examined because it may complement the importedTitle II food aid. The timing of harvests, seasonal shortages of staple foods and affordability of localfoods should also be considered. Ideally, the most cost-effective food aid commodities to achieve thedesired result should be selected.
Cost: The value of a commodity on the local market will affect the demand for the food by therecipients. Foods with high prices on the local markets may be good for income transfer, but may bemore likely to be sold rather than eaten by recipients.
STEP 3: RATION SPECIFICATIONS
Program objectives and characteristics of the target groups(s) should drive the decisions about rationspecifications. Below is guidance for developing ration specifications for nutritional as well as incometransfer considerations:

COMMODITIES REFERENCE GUIDE OVERVIEW OF PART TWO
10
1. Determining Nutritional Values
Filling the nutrient gap in a beneficiary’s diet is one objective of food aid programs. For programswith this type of objective, the definition of that nutrient gap is the basis for determining how muchand what kind of food is to be provided. Additional food may be needed to recuperate themalnourished, overcome substitution effects (when home diets are reduced because of on-site feeding),or account for take-home rations shared within the household (leakage). Taking all these factors intoaccount, the nutritional value of the ration package should be established in terms of the minimumenergy, fat, protein, and micronutrient content needed per person per day to meet projectrequirements. A ration package will generally consist of two to three commodities.
The use of specific donated food aid should be consistent with appropriate feeding guidelines includingexclusive breast feeding for infants under 6 months of age and continued, frequent on-demand breastfeeding to 24 months and beyond. For children 6 to 24 months, it is important to gradually increasefood thickness and add variety as the child ages. For more information on young child and adolescentfeeding, refer to the LINKAGES Project series titled Facts for Feeding at:www.linkagesproject.org/pubs.html).
People with HIV/AIDS suffer from appetite loss (anorexia), eat less food and have difficulty eatingand therefore failing to meet their dietary requirements. HIV/AIDS also affects how the body uses thefoods that are consumed and these results in nutrient malabsorption. Fevers and the infections thataccompany an HIV infection also lead to greater nutrient requirements and poor use of the nutrients bythe body. In designing rations for HIV affected families, increase energy needs for adults by 10 to 15percent and increase protein levels by 1.5 to 2 times normal requirements. Refer to the FANTApublication on “Nutritional Care and Support for Persons Living with HIV/AIDS and other AffectedHousehold Members” at: www.fantaproject.org.
In some countries, local organizations and/or national health authorities may have already establishedthe nutritional allowance levels for supplementary feeding, and CSs will be required to conform.
Micronutrients. In the CRG, calculations for rations focus on energy, fat, and protein content.However, among target groups receiving Title II food aid, micronutrient deficiencies are likely to be aproblem. In these cases, micronutrient fortified commodities should be considered. All processedfood cereals under Title II programs, with the exception of rice, are fortified with B vitamins (thiamin,riboflavin, folic acid, and niacin), vitamin A, calcium, and iron. Blended cereals (corn-soy blend andwheat-soy blend) are further fortified with zinc, B12, pantothenic acid, iodine, magnesium, vitamin C,vitamin D, and vitamin E. Vegetable oil is fortified with vitamin A. If micronutrient deficiencies areknown, the micronutrient contribution from blended cereals and fortified vegetable oil can beestimated from the values provided in the Commodity Fact Sheets found in Part One, Section II of theCRG. (HYPERLINK)
2. Income Transfer Value
If a program uses food mainly for its income transfer (monetary) value, the ration package’s incometransfer value is as important or more important than its nutritional content. Income transfer is thefood’s monetary value to the household. The income value of a ration is the market price for anequivalent quantity of the locally-available commodity that is most similar to the Title II commodity

COMMODITIES REFERENCE GUIDE OVERVIEW OF PART TWO
11
plus the recipients' participation costs, such as lost wages and transportation. To determine the incometransfer value needed for incentive programs, the following factors should be considered:
♦ What is the cost to the target population for participation in the program, i.e., transportation, dailylost wages, daily wage rate?
♦ What is the value of other incentives that are offered, i.e., training, health services?♦ What is the value of the commodities to the participants?
Higher priced foods in the diet should also be examined, such as imported foods, high cost locallyproduced items, seasonally unavailable staples and important foods that cannot be obtained in adequatequantities because of income constraints. Commodities that replace highly valued and expensive fooditems, such as oil, may have a substantial income mediating effect, freeing up income typically usedfor purchasing these expensive items.
STEP 4: RATION CALCULATION
After calculating the nutritional value of a proposed ration package, the following should bedetermined: (1) the food commodities to be provided; (2) the total tonnage of commodities needed;and (3) the cost-effectiveness of the ration package selected. It is generally prudent to consideralternative rations in the initial planning stages in the event the desired commodities are not availableor are delayed in transport, or when packaging requirements significantly alters the relative cost-effectiveness of ration package. Calculating the ration package
For logistical and management reasons, programmers should try to limit ration packages to no morethan three commodities per ration unless strong reasons exit. Because vegetable oil is an excellentsource of energy, it should almost always be included in a ration. Other value-added commodity, suchas all-purpose wheat flour, may be selected since local bakeries often prefer the higher qualityimported American flour.3 Bulk commodities are usually preferred for monetization, such as non-refined, bulk vegetable oil and wheat grain. Suggestions for how to select appropriate rations andcalculate ration packages are provided in each module.
1. Calculating the Total Amount of Food Commodities Needed
Once the food commodities are chosen for the ration package the total amount of each commodityneeded for the project can be calculated (usually in metric tons). To calculate the number of metrictons (MT) needed for each commodity use the following steps:
" Multiply the number of grams of the commodity per person per day times the total number ofpersons to receive the commodity.
3 Value-added commodities include fortified blended foods like Wheat Soy Blend (WSB), Corn Soy Blend (CSB), VitaminA-fortified edible vegetable oil, and soy-fortified bulgur, wheat flour and sorghum grits. The PL 480 legislation requiresthat 75% of the commodities used be value-added, bagged and or processed commodities.

COMMODITIES REFERENCE GUIDE OVERVIEW OF PART TWO
12
" Multiply the total number of grams of the commodity needed to feed the target group times thenumber of days the program will provide the ration package.
" Determine the number of metric tons of commodity needed by dividing the total number of gramsper program period by 1,000,000 (number of grams in a metric ton).
" Complete the same calculation for each commodity (vegetable oil, cereal, cereal blend, or legume)that comprises the ration.
An examples provided in each program module.
3. Determining cost-effectiveness of the ration package
Cost is often not the primary factor for selecting the commodities. Food preferences, availability,potential disincentive effects, and urgent emergency requirements often outweigh cost considerations.However, the cost-effectiveness of the commodity, i.e., the ratio of its cost to its nutritive or incomevalue, may help in determining whether it is appropriate for the food aid component of a developmentor emergency program. CSs should try to conduct the appropriate cost-effectiveness analysis.4
Calculating the cost-effectiveness of desired commodities in terms of cost per unit of nutritional value(one kilocalorie or one gram of protein) or income transfer value (in USD to the recipient) providesinformation about which commodities provide the most nutritional benefits or highest income at thelowest cost to the project. It is important to note that cost per calorie of fortified foods will always behigher than bulk grains, but in that fortified food are rich in micronutrients, they add key nutritionalvalue to many program situations.
Cost Effectiveness per Nutritional Value: To determine the cost effectiveness value of a commodityper its nutritive value, calculate the cost in cents per one kilocalorie and one gram of protein ofcommodity using the following steps. The illustrative list of prices in Annex V and the nutritionalvalues of commodities from the Commodity Fact Sheets are two helpful sources of information for usein making these calculations. The cost-effectiveness of a ration package per its nutritional value can becalculated in the following way.
a) Per Energy value:
! To calculate the cost of the commodity per 100 grams, divide the cost per metric ton (from AnnexV) by 10,000 (a MT is equal to 10,000 units of 100 grams.)
Divide the cost per 100 grams of commodity by the number of kilocalories per 100 grams ofcommodity. This will give the dollar cost per one kilocalorie of commodity.
b) Per protein value: 4 Cost also refers to costs to the project associated with a commodity (such as CCC dollar values found in Annex V). Insome projects, in-country transportation and storage costs and special handling costs may be critical, however, these costsmay be similar for most commodities. For each project, first decide which of these cost elements are most relevant.

COMMODITIES REFERENCE GUIDE OVERVIEW OF PART TWO
13
! To calculate the cost of a commodity per 100 grams, divide the cost per metric ton by 10,000.(10,000 x 100 g = 1 MT).
! Divide the cost per 100 grams of commodity by the number of grams of protein per 100 grams ofcommodity. This will give the dollar cost per one gram of protein provided by the commodity.
Box 1 below gives an example of how to calculate the cost effectiveness of both the caloric and proteinnutritive values for CSB.
BOX 1: EXAMPLE OF COST PER NUTRITIVE VALUE OF CORN-SOY BLEND (CSB)
Per caloric content of CSB:$260 per MT ÷ 10,000 = $0.026 (per 100 g) = $0.0000692 or 0.00692 cents per one kilocalorie
375.7 kcal (per 100 g)
Thus, the cost one kilocalorie of CSB is 0.007 cents (rounded)
Per protein content of CSB:$260 per MT ÷ 10,000 = $0.026 (per 100 g) = $0.0015 or 0.15 cents 17.2 grams (per 100 g)
Thus, the cost of one gram of protein provided by CSB is 0.15 cents
This type of analysis would be used to compare different commodities that are suitable for meeting thesame nutritional objectives in order to determine which ration package is most cost-effective. Forexample, the cost of one kilocalorie of corn-soy blend is 0.007 cents and one gram of protein costs0.15 cents while the cost per one kilocalorie and one gram of protein of cornmeal is 0.005 cents and0.23 cents, respectively. Cornmeal is a less expensive source of energy but not a cost-effective sourceof protein compared to the corn-soy blend, and CSB contains more micronutrients than the cornmeal.Decisions about cost-effectiveness of a commodity should be made in tandem with the objectives ofthe program. If the objective of the program is to improve nutritional status of a target group the corn-soy blend has a higher protein and micronutrient value than cornmeal. However, if the main objectiveis to provide energy to maintain nutritional status, the cornmeal may be the most cost-effectivecommodity in this case.5 In all instances, it is desirable to consider not only how food aidcommodities compare with one another, but also how their nutrition and income values compare withfood that is locally available. This type of analysis is provided here for comparing the income valueof food aid to the cost of providing it.
Cost Effectiveness per Income Value: A different type of analysis provides an indication of theefficiency of providing food aid, especially when CSs use food aid commodities to provide a givenincentive or wage. The cost effectiveness per income value is determined by the value to the recipientcompared to the cost of the program. For example, if a recipient receives a commodity that replacesone that would cost them $0.30 at the local market price, this is considered a $0.30 value to the family. 5 The alternative package was calculated using the formula in Box 1 with the cost of cornmeal at $194 per MT.
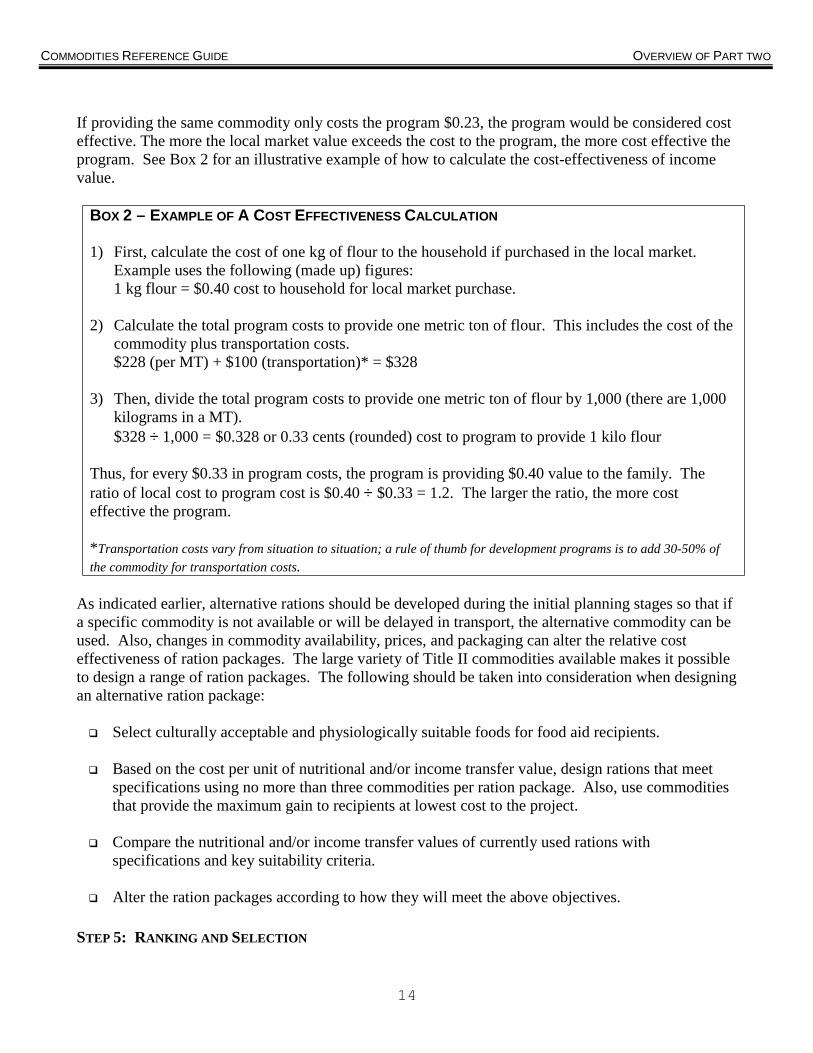
COMMODITIES REFERENCE GUIDE OVERVIEW OF PART TWO
14
If providing the same commodity only costs the program $0.23, the program would be considered costeffective. The more the local market value exceeds the cost to the program, the more cost effective theprogram. See Box 2 for an illustrative example of how to calculate the cost-effectiveness of incomevalue.
BOX 2 – EXAMPLE OF A COST EFFECTIVENESS CALCULATION
1) First, calculate the cost of one kg of flour to the household if purchased in the local market.Example uses the following (made up) figures:1 kg flour = $0.40 cost to household for local market purchase.
2) Calculate the total program costs to provide one metric ton of flour. This includes the cost of thecommodity plus transportation costs.
$228 (per MT) + $100 (transportation)* = $328
3) Then, divide the total program costs to provide one metric ton of flour by 1,000 (there are 1,000kilograms in a MT).$328 ÷ 1,000 = $0.328 or 0.33 cents (rounded) cost to program to provide 1 kilo flour
Thus, for every $0.33 in program costs, the program is providing $0.40 value to the family. Theratio of local cost to program cost is $0.40 ÷ $0.33 = 1.2. The larger the ratio, the more costeffective the program.
*Transportation costs vary from situation to situation; a rule of thumb for development programs is to add 30-50% ofthe commodity for transportation costs.
As indicated earlier, alternative rations should be developed during the initial planning stages so that ifa specific commodity is not available or will be delayed in transport, the alternative commodity can beused. Also, changes in commodity availability, prices, and packaging can alter the relative costeffectiveness of ration packages. The large variety of Title II commodities available makes it possibleto design a range of ration packages. The following should be taken into consideration when designingan alternative ration package:
! Select culturally acceptable and physiologically suitable foods for food aid recipients.
! Based on the cost per unit of nutritional and/or income transfer value, design rations that meetspecifications using no more than three commodities per ration package. Also, use commoditiesthat provide the maximum gain to recipients at lowest cost to the project.
! Compare the nutritional and/or income transfer values of currently used rations withspecifications and key suitability criteria.
! Alter the ration packages according to how they will meet the above objectives.
STEP 5: RANKING AND SELECTION

COMMODITIES REFERENCE GUIDE OVERVIEW OF PART TWO
15
Naturally, cost plays a key role in the size and effectiveness of programs and cost calculations involvedecisions about what cost elements to consider. At a minimum, the illustrative list of commodityprices in Annex V and current in-country transportation and storage costs can be used. Other factors toconsider are:
• Market disruptions: The Bellmon determination must ensure that the local market is notdisrupted. Market considerations in local areas where programs are targeted might also come intoplay. For example, it may be less disruptive to provide certain foods in the lean season rather thanthe harvest season. Guidance on conducting the Bellmon analysis may be found online atwww.usaid.gov/hum_response/ffp/bellmon.htm.
• Logistics and management: Some commodities may impose undue management or cost burdens
due to unusual local conditions (e.g. transportation, storage, handling, pilferage) or unsuitablepackaging, for the limited shelf life of the commodity.
The usual sources of data for considering potential market disruptions and logistical problems includepast evaluations of similar programs, interviews with host governments and local and internationalPVO, as well as discussions with international organizations (such as the World Bank and the UnitedNations), USAID, USDA Agricultural Attaches and Economic/Commercial Officers at U.S.Embassies.
Proposed and alternative, ration packages can now be ranked by nutritional value, income transfervalue, total cost, and other factors, such as potential market disruptions and logistical problems. Theymight also be ranked by cost. Decisions to change ration packages can be made less arbitrarily whenalternative rations and their main attributes have been examined in advance.

COMMODITIES REFERENCE GUIDE OVERVIEW OF PART TWO
16
VI RESOURCE LIST
1. Food and Nutrition Technical Assistance (FANTA) Project, Academy for EducationalDevelopment, 1825 Connecticut Avenue, NW, Washington, D.C., 20009-5721. Tel: 202-884-8000; Fax 202-884-8432. E-mail: [email protected]; Web site www.fantaproject.org. FANTA hasthe following guides:
# Agricultural Productivity Indicators Measurement Guide. Patrick Diskin# Anthropometry Indicators Measurement Guide (Draft). Bruce Cogill# Food For Education Indicator Guide (Draft). Joy Miller del Rosso and Gilles Bergeron# Food Security Indicators and Framework for Use in the Monitoring and Evaluation of Food
Aid Programs. Frank Riely, Nancy Mock, Bruce Cogill, Laura Bailey, and Eric Kenefick# Improving the Use of Food Rations In Title II Maternal/Child Health and Nutrition Programs
(Draft). Serena Rajabiun, Beatrice Rogers, Margarita Safdie, Anne Swindale# Infant and Child Feeding Indicators Measurement Guide. Mary Lung’aho# Measuring Household Food Consumption: A Technical Guide. Anne Swindale and Punam
Ohri-Vachaspati# Nutritional Care and Support for Persons Living with HIV/AIDS and other Affected Household
Members. (forthcoming)# Potential Uses of Food Aid to Support HIV/AIDS Mitigation Activities in Sub-Saharan Africa.# Sampling guide. Robert Magnani# Water and Sanitation Indicators Measurement Guide. Patricia Billig, Diane Benahmane and
Anne Swindale
2. Food Aid Management (FAM). 1625 K Street, NW, 5th Floor Washington, DC 20006. Tel:(202) 223-4860, Fax: (202) 223-4862; Web site www.foodaid.org. FAM provides USAIDdocuments (FY 1990-ongoing).
3. Linkages Project. Recommended Feeding and Dietary Practices to Improve Infant andMaternal Nutrition also see Facts for Feeding (English, Spanish, French). Academy forEducational Development, 1825 Connecticut Avenue, NW, Washington, D.C., 20009-5721.Tel: 202-884-8000; Fax: 202-884-8977; E-mail: [email protected]; Website:www.linkagesproject.org.
4. National Research Council. Recommended Dietary Allowances. National Academy Press,Washington, D.C., 1989.
5. USAID/BHR. U.S. International Food Assistance Report 1999. January 2000. Web site:www.usaid.gov/hum_response/farpt1999.
6. USAID/BHR. Commodities Reference Guide (CRG): Section 1-4. April 1999. Web site:www.usaid.gov/hum_response/crg.
7. USAID/BHR/FFP. Monetization Field Manual P.L. 480 Title II Programs. October 1998.Web site: www.usaid.gov/hum_response/ffp/monetiz.htm.

COMMODITIES REFERENCE GUIDE OVERVIEW OF PART TWO
17
8. USAID/BHR/FFP. Title II Guidelines for Development Programs. January 2000. Web site:www.usaid.gov/hum_response/ffp/dappaa.htm.
9. USAID/BHR/FFP. PVO Guidelines for Title II Emergency Food Proposals and Reporting(Draft). 1998 www.usaid.gov/hum_response/ffp/emerg.htm.
10. USAID/CDIE. Performance Monitoring and Evaluation Tips. 1996. Web site:www.usaid.gov/pubs/usaid_eval/#02.
11. WHO. The Management of Nutrition in Major Emergencies. Geneva, 2000.

COMMODITIES REFERENCE GUIDE MODULE 1:MCHN PROGRAMS
1
MODULE 1:MATERNAL CHILD
HEALTH AND NUTRITIONI. INTRODUCTION
An overarching objective of USAID’s mandate is to improve food security of vulnerable populationsin the developing world. Food security exists when all people at all times have physical and economicaccess to sufficient food to meet their dietary needs for a productive and healthy life. Programming offood aid through Maternal Child Health and Nutrition (MCHN) activities can help achieve the goal ofimproving household food security. Specifically, MCHN programs are intended to improve thenutritional status of young children and women. These programs can also address the intergenerationaleffects of malnutrition. For example, providing food supplements to pregnant and lactating womencan improve birth outcomes and reduce low birthweight, and improve nutritional status of youngchildren.
MCHN interventions differ from other food aid programming in two ways. First, the primaryobjective of MCHN programs is the reduction of malnutrition in the target population. Second, thetarget population consists of the most nutritionally vulnerable groups, namely young children (twoyears and under) and pregnant and lactating women.
Food aid to young children helps to bolster energy, protein, fat, and micronutrient intake needed forgrowth and development, especially for food insecure children with poor nutritional status. Providingfood aid to pregnant and lactating women helps to ensure the health of the mothers who are nototherwise able to consume sufficient energy, protein, and micronutrients in their diets. Further, goodmaternal health during nutritionally vulnerable periods contributes to improved birth outcomes andoverall health of children. Assuring food security and a healthy nutritional status of young childrenand women, therefore, becomes paramount in MCHN programs.
Food aid is considered only one component of an MCHN program. Food assistance within MCHNprograms generally focuses on meeting the nutritional gap of young children and pregnant andlactating mothers through a cooked (wet) ration, consumed at a monitored location (on-site feeding) orthrough a dry ration of food commodities that are taken home (take-home rations). These mealsprovide extra energy, protein, and crucial micronutrients.
While food can help meet the nutritional gap for vulnerable children and women, it alone cannotimprove the nutrition and health status of women and children. Food aid should be combined withcomponents that improve the quality of health and nutrition services as well as behavior changecomponents that improve maternal child health, feeding and care practices.

COMMODITIES REFERENCE GUIDE MODULE 1:MCHN PROGRAMS
2
II. GUIDELINES FOR COMMODITY SELECTION FOR MCHNPROGRAMMING
The introductory chapter for Part Two entitled Guidelines for Selecting Food Aid Commodities: AnOverview provides information on how to develop the most appropriate and cost-effective rationpackages to accomplish program objectives. These guidelines are organized into five general steps.This module summarizes the five steps and includes key points of consideration for MCHNprogramming under each step. This guidance is meant to be flexible enough to permit the selection ofthe most appropriate food ration in each situation. Box 1 below lists the five steps for commodityselection:
Box 1: Five Steps for Selecting Commodity Rations:Step 1. Program DesignStep 2. Suitability of Food CommoditiesStep 3. Ration SpecificationsStep 4. Ration Calculation
Step 5. Ration Ranking and Selection
STEP 1: PROGRAM DESIGN
The five key program design components are usually: (1) carrying out a needs assessment; (2)determining the appropriate use of food aid; (3) identifying characteristics of the target population,including dietary and other preferences; (4) developing program activity objectives; and (5)determining the distribution mode and frequency. Together with a monitoring and evaluation plan andan exit or graduation strategy, these components are key elements for the development of Title II foodaid proposals. For detailed guidelines on proposal development see the most recent FFP’s Title IIGuidelines for Development Programs www.usaid.gov/hum_response/ffp/dappaa.htm. Also refer toFood Aid Management’s website for guidelines and useful links www.foodaid.org. An explanation ofeach design component follows:
1. Carrying out a Needs Assessment
As the food aid component of a program is designed, it is important to articulate why food aid isneeded and how it will be used to meet program goals. A needs assessment should determine thenature, extent, severity, and distribution of the food needs. If relevant to the program’s objectives, theneeds assessment should include identification of the degree of malnutrition in the target population.The results of the assessment should describe the criteria for selecting the beneficiaries and thegeographic areas to be targeted. Factors that could impede effective use of food aid, and the possibilityof using local foods to supplement the food aid ration package should also be investigated. Alsoinclude an assessment of current maternal child feeding and care practices and the quality of healthservices including delivery of immunizations, micronutrients and human resource capacity.
Primary Data Collection: Primary data may be collected in a variety of ways, including foodconsumption surveys, nutritional status surveys, or qualitative assessment. Useful qualitativetechniques include in-depth interviews, focus group discussions, participatory rural appraisal, andobservation. Some methods for collecting primary sources of data are described in USAID/CDIE’s

COMMODITIES REFERENCE GUIDE MODULE 1:MCHN PROGRAMS
3
Performance Monitoring and Evaluation Tips www.dec.org/usaid_eval. See also the Resource List atthe end of this module.
Secondary Data Collection: Secondary data collected and reported by other organizations, includingthe host government can also be useful. These data should be verified with local key informantinterviews. Secondary sources of information include USAID documents; Demographic HealthSurveys (DHS); documents from local institutions, donor agencies, other PVOs; and UN agencies,especially UNICEF, WHO, and the World Bank.
More detailed guidance on how to conduct needs assessments and develop MCHN proposals may befound at www.usaid.gov/hum_response/ffp/dappaa.htm as well as www.fantaproject.org.
2. Determining the Appropriate Use of Food Aid
MCHN food aid can achieve several different humanitarian response objectives, such as (a) preventionof malnutrition in vulnerable target groups; (b) rehabilitation of malnourished individuals; or (c)improved participation in health and nutrition activities. To these ends, food aid serves either as anutritional supplement or an income transfer. Naturally, different programs will require differenttargeting, rations, and graduation criteria.
3. Identifying Characteristics of the Target Population
MCHN programs focus on the women and children who use MCHN services, i.e., young children andpregnant and lactating women. The results of the needs assessment and the desired end results willdrive further targeting within this group and should identify the specific feeding and care practices thatneed to be focused on for improving nutritional status. For example, if the objective is nutritionalrecuperation, the target group will be children who are malnourished. If the objective is to increasewomen’s use of prenatal services and trained birth attendants, then the target group would be pregnantwomen. If the objective is to promote optimal growth, the recommended target group would bechildren aged 6-24 months. A key added characteristic could be the estimated HIV/AIDS prevalence.
4. Developing Program Activity Objectives
The most common objectives of food aid components of MCHN programs are to provide nutrients toimprove or maintain the nutritional status in the target group or to provide incentive to use health ornutrition services or to participate in health and nutrition education programs.
It is critical that the design of the program does not compromise the adoption of appropriate andrecommended feeding and dietary practices including exclusive breast feeding for infants under sixmonths of age. The eligibility criteria for recipients, quantities, commodity mix, and recommendationsfor use of the rations should be consistent with official government policies and with standard practicesused by USAID and the United Nations. Detailed recommendations for appropriate feeding practicesare available from USAID’s LINKAGES Project series, Facts for Feedingwww.linkagesproject.org/pubs.html.
Although each cooperating sponsor (CS) will approach the achievement of its program objectives in adifferent way, following USAID’s Managing for Results terminology (see Annex I of Part Three)when stating objectives, will facilitate reporting to USAID. Objectives for USAID-funded programs

COMMODITIES REFERENCE GUIDE MODULE 1:MCHN PROGRAMS
4
should be should be result statements, that is, they should clearly describe the desired end result of theintervention. For example, “Improved nutritional status of children under two” is a results-orientedobjective. A useful reference in this regard is the Food and Nutrition Technical Assistance (FANTA)project’s guide on the use of food rations in MCHN programs www.fantaproject.org.
USAID recommends that there should be at least one performance indicator to track progress towardeach objective or result. Performance indicators are variables with a particular characteristic ordimension that can measure progress toward the stated result. An example of an indicator for theresult statement mentioned above (Improved nutritional status of children under two) could be“average weight-for-age z-score of children under two”. When possible, impact and output indicatorsshould also be developed and monitored. The benefits of having both types of indicators are self-evident. For example, it is not only important to know the percent of the population reached with foodaid (output), but to also determine whether nutritional status of the target population improved as aresult of the food aid (impact). USAID/CDIE’s Performance Monitoring and Evaluation Tips,(www.dec.org/usaid_eval) provides guidance on how to develop results statements and performanceindicators. Other resources for developing nutrition and food security related indicators can be foundin Annex II of Part Three.
CSs should also include a description of the baseline data or spell out a plan to collect it. It would beideal to include as part of the needs assessment baseline studies that identify values for the selectedindicators. However, if this is not possible then the indicators can be submitted for FFP review afterthe program proposal is approved. Naturally, each CSs resources to monitor and evaluate programsare different. This will be taken into consideration during USAID’s food aid proposal review andapproval process.
5. Distribution Mode and Frequency
There are two primary ways to distribute MCHN food aid rations: on-site feeding and take-homerations. Below is a description of these two distribution methods. Box 2 summarizes the advantagesand disadvantages of each mode.
♦ On-site (wet) feeding is where the food aid recipient is fed prepared wet rations at a designatedsite outside the home. MCHN on-site feeding is usually targeted to mild to moderatelymalnourished children at MCHN or community feeding centers, and the food provided is intendedto supplement, not replace, what the children eat at home. During periods of severe food insecurityall children in a selected age range might be eligible for on-site feeding at community centers. Toobtain maximum nutritional improvement, feeding would be daily, 365 days per year. Dependingon program objectives and local conditions, some feeding programs operate only 5 or 6 days perweek, and many operate only during “lean” seasons of the year. The advantage of on-site feedingis that food rations are eaten under supervision, which helps to ensure that the food supplement isactually consumed by the target population. However, on-site feeding is labor intensive for acommunity to organize and prepare. A potential disadvantage of on-site feeding is that food maybe withheld at home because the recipient is fed at the feeding center.
♦ Take-home rations are dry, uncooked food rations that are prepared and eaten at home. Take-home packages can provide the entire day’s requirements of energy and protein, or only a part ofthese requirements, filling a gap between the recipients’ typical diet and what they need. The

COMMODITIES REFERENCE GUIDE MODULE 1:MCHN PROGRAMS
5
advantage of take-home rations is that they are easier to administer, more cost effective, less timeconsuming for recipients, and can reach larger numbers of recipients. However, dry rations may beshared with other family members (leakage or dilution) or sold/exchanged in the market, therebyreducing nutritional impact on the intended beneficiary.
As take-home ration feeding activities are being designed, it would be helpful to determine to whatextent the take-home food rations will be shared by other family members. Several ways to addressintra-household sharing of food rations include education, increasing the amount of the ration package,and selecting rations that promote self-selection. For example, self-targeting "baby food" (or weaningfood), such as blended cereals may be less acceptable to other family members, thus more likely to beconsumed only by target children.
The mode and frequency of distribution should be based on project objectives, the costs, localconditions, including human resource capacity to help with distribution, the nutritional deficiencyprofile of the target group, and the type and quantity of rations. It is important, also, to consider thedemands on caregivers to pick up the food or attend the feeding center. A program should alsoconsider whether it will be clinic (or center based) or community-based. The advantages anddisadvantages of on-site or take-home feeding distribution modes should be weighed to optimize thenutritional impact on women and children. Box 2 below summarizes the key points of bothdistribution modes:
Box 2- Advantages and Disadvantages of Feeding ModesOn-site feeding Take-home rationsAdvantages:! Rations eaten under supervision.! Help can be given to ill or anorexic children.! Feeding problems can be identified and dealt
with.! Ensures that food ration is consumed by target
population.! Opportunity to inform caregiver.
Advantages:! Large numbers of recipients can be reached.! Fewer resources required to administer the
program.! Fewer costs for preparation and distribution.! Caregiver spends less time and effort
attending feeding site.! Families take responsibility for feeding
recipient.Disadvantages:! Recipients may be given less food at home
(substitution).! Requires that caregivers travel to feeding
center on a daily basis.! Resource intensive requiring equipment, fuel,
a feeding facility, and well-trained staff.
Disadvantages:
! No guarantee that recipient consumes the foodration as it may be shared with other familymembers (dilution or sold and traded,leakage).
! Less time for behavior change andcommunication.
STEP 2: SUITABILITY OF FOOD COMMODITIES
The suitability of a ration should be assessed with regard to the needs and preferences of the targetedindividuals, households, and community. A ration is suitable if it can be used effectively to achieveintended objectives. Aspects of food commodities that should be considered include women’s and

COMMODITIES REFERENCE GUIDE MODULE 1:MCHN PROGRAMS
6
children’s nutritional needs and physiological capacities, food consumption preferences and patterns,locally available foods, household and community food processing and storage capacities, and localmarket value.
Appropriateness to good feeding practices: The use of specific donated foods should be consistentwith good scientific feeding guidelines, including exclusive breast feeding for infants under 6 monthsof age and continued, frequent on-demand breast feeding to 24 months and beyond. For children 6 to24 months, it is important to gradually introduce thicker and more various foods that can complementbut not replace breast milk. The following recommendations come from LINKAGES Facts forFeeding: Guidelines for Appropriate Complementary Feeding of Breastfed Children 6-24 months ofage:
! Provide 6 to 8 month old infants approximately 280 kcal per day from complementary foods.! Provide 9 to 11 month old infants approximately 450 kcal per day from complementary foods.! Provide 12 to 24 month old children approximately 750 kcal per day from complementary foods.
Feeding frequency is another important consideration. By combining meals and snacks, childrenshould be fed complementary foods with the following frequency:
! Feed complementary foods for 6 to 8 month old infants 2-3 times per day.! Feed complementary foods for 9 to 11 month old infants 3-4 times per day.! Feed complementary foods for 12 to 24 month old children 4-5 times per day.
Complementary foods can include the food aid commodity and should be programmed to ensure theyoung child has a diversified and nutritious diet. During illness, the child should continue to receivebreast milk and receive frequent and active feeding. Any feeding activity should be designed so thatthe young child is fed directly, slowly and patiently. Children should not be forced to eat.
More detailed information can be found in the LINKAGES Project series titled Facts for Feedingwww.linkagesproject.org/pubs.html
Below are key suitability factors to consider as food aid rations for MCHN programs are beingdeveloped. Field tests and monitoring to confirm that MCHN rations are well accepted and usedappropriately are recommended.
Cultural suitability: It is important to consider women’s and children’s traditional diets, tastepreferences, food taboos, and feeding practices. Unfamiliar food may be made more acceptablethrough nutrition education, food processing, packaging, and/or by combining it with familiar foods inrecipes.
Nutritional content: This refers to the energy, fat, protein, and micronutrient content of the rations.There are certain nutritional considerations for women and children that should be examined whendesigning food rations. Young children, especially those up to 24 months of age, suffer linear growthfaltering (stunting) and delayed development that leaves permanent damage when they are notadequately nourished. Underweight children are also at much higher risk of death due to illness thanare their well-nourished counterparts. Although energy (kilocalories) is the main predictor of heightand growth, adequate micronutrients and protein for this age group are also important, particularly

COMMODITIES REFERENCE GUIDE MODULE 1:MCHN PROGRAMS
7
vitamin A.1
Pregnant and lactating women need extra energy, protein, and micronutrients to support the growth oftheir fetus or infant and maintain their own health. Pregnant women need the extra nutrients for thegrowing fetus and to ensure a healthy and safe birth outcome without depleting her own reserves andputting herself and her child at greater risk. While frequent, on-demand breastfeeding helps maintainthe quantity of breast milk, lactating mothers need extra energy and nutrients to produce optimalquality breast milk, to protect their own health, and to assure that their nutritional stores are preservedor restored to support subsequent pregnancies.
Physiological appropriateness: Because of small stomachs, infants from 6-24 months of age areunable to meet their energy needs through high-bulk foods, such as cereals and legumes. (See Box 3below for gastric capacity of this age group.) For example, infants between 9-11 months have astomach capacity of 285 grams. To meet their daily energy needs (850 kcal) they would need toconsume 226 grams of CSB a day, which when cooked, yields about 1,883 grams of gruel (assumingthe gruel is 12% CSB).2 If an infant were fed six times a day it would need to consume 314 grams ofgruel during each meal to meet its energy needs with only CSB. Clearly, infants in this age range donot have the stomach capacity to consume this amount of food. Therefore, nutrient-dense, low bulksources of energy such as edible vegetable oil should be added when these cereals are the primarysource of nourishment.
Children who are undernourished have an even smaller stomach capacity. For this reason, nutrient richblended food commodities and fortified vegetable oil are important commodities to provide for thesechildren.
Box 3- Stomach Capacity of Children 6 to 23 months Well nourished: 6-8 months 249 g 9-11months 285 g 12-23 months 345 g Growth retarded 6-8 months 192 g 9-11 months 228 g 12-23 months 273 g Source: WHO, Complementary Feeding of Young Children in Developing Countries: a review of current scientificknowledge, p. 61.
The viscosity of prepared foods for young children should also be considered. Cereal gruels can varyconsiderably in viscosity, and as they cool or are repeatedly reheated, they can become thicker andmore difficult to eat. If when reheating, mothers dilute the cereals to make them more edible for theiryoung children, they significantly reduce the energy, protein, and micronutrient densities and may
1 WHO, Complementary Feeding of Young Children in Developing Country: a review of current scientific knowledge,19982 Refer to the Commodity Fact Sheets, CRG, Section I at

COMMODITIES REFERENCE GUIDE MODULE 1:MCHN PROGRAMS
8
introduce harmful microorganisms. For this reason, quick-cooking, nutrient and energy dense -blended cereals, that can be prepared easily, several times daily, are good choices for rations for smallchildren and their mothers.
Availability of processing and/or storage facilities: Consider factors that affect food preparation,such as access to mills and processing facilities and fuel, and women’s or institution’s preparation andcooking time. Household’s or institution’s capacity to store food aid commodities is anotherconsideration.
Characteristics of locally/commercially available food: The timing of harvests, seasonal shortages,and the affordability of staple foods should be examined to determine if they can complement andeventually replace the donated Title II food commodities.
Cost: Ideally, the most cost-effective food ration is the one that achieves the desired results with theleast cost. Step 5 below provides guidance on how to calculate the cost -effectiveness of a rationpackage.
STEP 3: RATION SPECIFICATIONS
The size of the ration should be based on the purpose of the food and its use in the MCHN program:the recipients’ nutritional needs and/or the ration’s income value. However, there are other factors thatinfluence ration size. These include existing ration standards, e.g., government standards, those thatother implementing agencies are using, or past program ration specifications. To determine the rationspecifications, first articulate the minimum nutritional or income value a ration must have to achievethe project objectives. Below is an explanation of how to calculate nutritional and income transfervalues and key considerations for MCHN programs.
1. Determining Nutritional Values
Determining the nutritional value of a ration package is important for selecting the commodities thatwill assure meeting program objectives. Targets for minimum nutritional values of rations should bebased on estimates of deficits in existing diets of the target group, in terms of energy (calories), fat,protein and micronutrients. Generally, more food is added to rations to address substitution effects(when home diets are reduced because of on-site feeding) or to account for take-home rations sharedwith other family members (leakage). For pregnant and lactating women, a ration should supply, at aminimum, the extra energy and protein they need during these reproductive periods. Therapeuticfeeding programs (TFP) are medical interventions that require food commodities not available throughTitle II. The specification of rations for this type of program is, therefore, beyond the scope of thisguide.
When providing food aid supplements for children or women in circumstances where a householdfood shortage is the underlying cause of the malnutrition, it is recommended that rations fill as much aspossible of the nutrient gap between available food and requirements. (For specific suggestions on theuse of food rations, refer to the “Use of Food Rations in Maternal and Child Health and Nutrition TitleII Programs” at www.fantaproject.org/publications/index.html.
Ideally, program managers would use the precise method in Box 4 below to determine the nutritionaldeficit of a ration package. However, the precise value of substitution and leakage are difficult to

COMMODITIES REFERENCE GUIDE MODULE 1:MCHN PROGRAMS
9
estimate and the measurement of energy consumption is also difficult and costly to determine exactly.In such cases, program managers may wish to employ an estimation method. Therefore, both methodsare presented.
Box 4 – Precise Method for Determining Nutritional Energy Deficit
Recommended energy + Substitution/leakage - Estimated energy = Total energy deficit allowance (REA) factors intake (kcals)
a) Precise Method for Determining Energy Deficit
Based on the formula in Box 4 above, detailed instructions on how to determine nutritional energyvalues of ration packages are as follows:
Recommended energy allowance (REA) – This is the amount of kilocalories (energy) recommendedfor children and adults to maintain health and a good level of mental and physical performance3. Forthe purposes of demonstrating how to calculate the energy deficit, the National Research Council’s(NRC) Recommended Dietary Allowances, 10th Edition (1989) is used as the reference forrecommended energy allowance requirements. NRC’s values for REA are a sum of resting energyexpenditure (REE) from WHO equations and energy required for light to moderate levels of activity.Steps for calculating the REA for a target group follow:
Determine the REA per person per day for different target groups using Table 1 in Annex III. REAvalues are expressed in kilocalories (kcal) and are based on median weights for the U.S. population.For median weights of target groups from specific countries, refer to FANTA’s publication “Measuring Household Food Consumption: a Technical Guide” (February, 2000)www.fantaproject.org/publications/index.html.
1) REA for children differentiates the energy allowances between sexes to take into account theonset of puberty and activity.
2) For children less than two years of age who are breastfed, use Table 2 in Annex III to calculatethe energy allowances needed from complementary foods to meet daily energy requirements.
3) For adults with heavy activity level, REA will need to be adjusted. Use Table 3 in Annex III toobtain resting energy expenditure (REE) per age category and multiply this number times 1.82for women and 2.10 for men.4 If needed, a list of heavy activities can be found in FANTA’spublication, Measuring Household Food Consumption: a Technical Guide” (February, 2000)www.fantaproject.org/publications/index.html.
4) For pregnant and lactating women, factor in additional energy requirements needed during thisperiod. If a woman is pregnant, add 350 kilocalories to her recommended energy allowance. If
3 National Research Council, Recommended Dietary Allowances , National Academy Press, 19894 Multiplier value from WHO, 1985, Energy and protein Requirements: Report of a Joint FAO/WHO/UNU ExpertConsultation, p. 78

COMMODITIES REFERENCE GUIDE MODULE 1:MCHN PROGRAMS
10
a mother is lactating, add 500 kilocalories.
Substitution/leakage factors: If they can be reliably estimated, the ration should include additionalfood to address substitution (cutting back intake at home because a food supplement is provided) orleakage (sharing the food ration with other family members), especially if household-level fooddeficits are large. Self-targeting foods (foods assumed to be eaten by the target beneficiary only andnot shared) may be less prone to family-wide sharing, but their use will probably not be sufficient toeliminate leakage. Additional ways to reduce substitution or leakage problems include education,on-site feeding, or provision of a family package consisting of other commodities. There is noempirical data on how to calculate how much extra energy to add. Past experience with food aidprograms or trial and error may be the best way to determine the quantity of energy to add to accountfor substitution and leakage.
Estimated energy Intake – This is often the most difficult and costly to assess. Methods of collectingthese data include the following:
♦ Aggregate household level surveys - Data gleaned from household surveys generally includeinformation on food expenditures, production and stocks, and food acquired as in-kind income. Thesesurveys help determine whether there is a general food deficit and the severity of the deficit at thehousehold level. Information from food gap assessments may be used for interim guidance if no othersources of information are available.
♦ Individual food intakes - This is a way to assess food deficits for specific age groups, such aswomen and children. Data collection approaches include dietary recall surveys, reviews of foodrecords, and observation studies. These approaches can be built into sample household surveys. Forchildren under 2 years of age, an estimate of the extent to which breastfeeding is contributing to thediet is useful. It is often difficult and costly to gather individual intake. Therefore, availability orexpenditure surveys may provide substitute data that will enable Program Managers to estimateindividual intake.
♦ Availability or expenditure surveys - These surveys are ways to gather information on theavailability of food in a household and estimates of energy expenditures of individuals. Data fromthese surveys can help to estimate intake of certain groups.
♦ 24-hour recall surveys- This is a method for collecting information on the food consumptionof individual household members over the previous 24 hour period. A respondent is asked to recall allthe foods consumed, sometimes including the exact amounts of each food. A respondent is asked torecall all foods consumed and breast feeding patterns, sometimes including the exact amount of eachfood or quantity of breastmilk.
Publications describing different methods for measuring consumption can be found in the ResourceList. While it is ideal to know the exact actual intake of the target group, estimates or data fromsecondary sources may be more practical.
Total energy deficit per ration : This is the difference between the REA + substitution/leakagefactors and the estimated energy intake. The resulting value represents the caloric deficit in a person’s

COMMODITIES REFERENCE GUIDE MODULE 1:MCHN PROGRAMS
11
diet. A ration package is usually designed to fill the caloric and protein deficit of the target group’sdiet.
Once the nutritional energy of rations are defined, the ration package can be adjusted to meet the fat,protein, and micronutrient needs. Detail on how to calculate the protein and fat composition of thepackage is presented in step 4 of this module.
b) Estimation Method for Determining Ration Size
In the absence of sufficient data to accurately quantify requrirements and food shortages,recommendations for optimally closing major nutrient gaps are:5
• Energy:
Women: Rations should supply about one third of the energy needs of pregnant and lactatingwomen (750-850 kcals/day). At the very least, the rations for these women should provide the extraenergy and protein demands of pregnancy or lactation, i.e., 350 kcals, including 10-13 g protein, forpregnant women, and 500 kcals, including 14-19 g protein, for lactating women.
Children: Rations should supply about one half of the energy needs of young children (about150-350 kcals/d for breast fed children aged 6-24 mos, and 400-600 kcals/d for those that are not).
• Fat: For breastfed children 6-24 months, older children and women, the fat content should beabout 20% of the total energy. For children under two who are not breastfed, the fat content of theration should be higher, 30-40% of the total.
• Protein: As long as the fat in the ration is held to the above guidelines, the fulfillment of theremaining energy with a combination of pulse and cereal or a blended food (which contains both), willinevitably provide women or children enough protein to meet their needs.
Box 5 below shows an example of how to calculate the ration size for children 1-3 years of age whoare moderately malnourished, based on the precise and estimated methods.
Box 5: Example of Calculating Energy Deficit of Moderately MalnourishedChildren 1-3 years of age
Precise Method
REA for children 1-3 years of age is 1,300 kcal per day (from Table 1 Annex III).
For this example, calculate 20% of the REA for the leakage factor: 1,300 x 0.20 = 260 kcal.
Add the kcal from the REA and leakage factor: 1,300 kcal + 260 kcal = 1,560 kcal.
Subtract Estimated energy intake, which for this example is 1,000 kcal: 1,560 kcal –1,000 5 Derived from WFP, Supplementary Feeding for Mothers and Children: Operational Guidelines and WHO,Complementary Feeding of Young Children in Developing Countries.

COMMODITIES REFERENCE GUIDE MODULE 1:MCHN PROGRAMS
12
kcal = 560 kcal.
Thus, the caloric deficit for this target group would be 560 kcal per person per day
Estimation Method
Assuming the target child is from 6-24 months of age and is not breastfeeding, the ration sizewould be in the range of 400-600 kcal/day, or 500 kcal/day on average would supply roughlyhalf of the child's daily nutritional energy requirement.
c) HIV/AIDS Affected Individuals: People with HIV/AIDS suffer from appetite loss (anorexia), eatless food and have difficulty eating and therefore fail to meet their dietary requirements. HIV/AIDSalso affects how the body uses the foods that are consumed and this results in nutrient malabsorption.Fevers and the infections that accompany an HIV infection also lead to greater nutrient requirementsand poor use of the nutrients by the body. There are several illnesses that are common with peopleliving with HIV/AIDS and that cause malnutrition. These include poor appetite or anorexia, losingweight, fever, diarrhea, frequent vomiting, oral thrush and other infections. Good nutrition for HIVaffected people requires the consumption of an adequate amount of macronutrients such as proteins,carbohydrates and fats, and micronutrients, which include vitamins and minerals. A deficiency inmacronutrients, also known as protein energy malnutrition manifests itself in the weight loss andwasting that is typical of AIDS patients. This weight loss and wasting occurs as a result of reducedfood intake, nutrient malabsorption and changes in metabolism. Vitamin A for HIV affected people isimportant for growth, immune function and maintenance of the lining of the respiratory,gastrointestinal, and gastro-urinal tracts. Consuming micronutrients especially vitamin A, B6, B12,iron, and zinc are important for building a strong immune system and fighting infections. Consumingfortified foods like the cereal blends and vegetable oil fortified with vitamin A as well as takingmicronutrient supplements at early stages of HIV infection can slow weight loss and diseaseprogression. In the case of vitamin A there is the likelihood of reduced transmission between motherand child and slowing the progression of the disease in infected people. Refer to the FANTApublication on “Nutritional Care and Support for Persons Living with HIV/AIDS and other AffectedHousehold Members” at www.fantaproject.org.
d) Micronutrients.
Young children’s and pregnant and lactating women’s micronutrient requirements are high; therefore,micronutrient fortified commodities should be included in the rations.
All oil provided through Title II is fortified with vitamin A nutrient essential for the protection of thehealth of any population, but particularly young children. Forty grams (40g) of refined vegetable oilpotentially satisfies children’s full daily requirements and about 70% of adult requirements.
Whereas whole grain cereal, such as wheat and corn are not fortified, all processed food cereals underTitle II programs, with the exception of rice, are fortified with B vitamins (thiamin, riboflavin, folicacid, and niacin), vitamin A, calcium, and iron. Blended cereals (corn-soy blend and wheat-soy blend)
COMMODITIES REFERENCE GUIDE MODULE 1:MCHN PROGRAMS
13
are further fortified with zinc, B12, pantothenic acid, iodine, magnesium, vitamin C, vitamin D, andvitamin E.
The micronutrient content of blended cereals (see the Commodity Fact Sheets found in Section I of theCRG) are estimates.6 Because some of these vitamins are lost during storage and cooking, they do notaccurately reflect the quantities available to the body after consumption. For example, up to 40 percentof vitamin A is lost from fortified cereals that is exposed for several months to heat, light and air.Minerals are not subject to deterioration by environmental factors, however, their bioavailability incereal can be greatly reduced by absorption inhibitors present in food aid commodities and other foodscommonly consumed, such as tea, and coffee.
Since micronutrient deficiencies, particularly vitamin A and iron are common in most food insecureareas, food aid programs, to the extent possible, should try to provide vitamin A and iron supplementsto young children and pregnant and lactating women. Cooperating Sponsors should try to link withgovernment services or donors such as UNICEF to obtain a regular supply of supplements.
2. Income Transfer Value
Rations are sometimes used as an incentive for mothers to attend health facilities, and it is the incometransfer value of the ration package that is important. Income transfer value is the monetary value ofthe ration to the household. The estimated income transfer of Title II rations is the market price ofequivalent quantities of the local commodities that are most similar to the food aid commodities in theration. If an MCHN program uses food aid for its income transfer (monetary) value, the rationpackage’s minimum level of acceptable income transfer value will need to be determined. Theminimum level of income transfer value should include the recipients' participation costs, such as lostwages and transportation.
When used as an incentive, past program experience, conversations with local authorities andcommunity leaders, and discussions with agencies implementing MCHN programs may be usefulsources of data and information before agreeing upon a minimum level. To determine the incometransfer value needed for incentive-type programs, the following factors should be considered:
♦ What is the cost to the target population for participation in the program, i.e., transportation, dailylost wages, daily wage rate?
♦ What other incentives are offered, i.e., health services?♦ What is the value of the commodities to the participants?
Foods in the current diet should be determined, such as:♦ imported foods♦ high cost items, i.e., oil, milk and other commercial processed foods♦ seasonally unavailable staples♦ important foods that cannot be obtained in adequate quantities because of income constraints
Commodities that replace highly valued and expensive food items, such as oil, may have a substantial 6 However, U.S. manufacturers of dry food aid commodities are now required to produce fortified food with average lotvalues of not less than 80 percent of the vitamin values and 100 percent of mineral values as specified in Part One of theCRG. In refined vegetable oil, the vitamin A levels are mandated to be between 60 and 75 IU/gram.

COMMODITIES REFERENCE GUIDE MODULE 1:MCHN PROGRAMS
14
income mediating effect, freeing up income typically used for purchasing expensive items to buy lessexpensive local foods or goods that can enhance and diversify the diet. See Module 2: FFW Programsfor more information on income transfer value considerations. HYPERLINK.
STEP 4: RATION CALCULATION After calculating the nutritional or income value of a proposed ration package, the following actionsmay be taken: (1) calculate the ration package; (2) calculate the total amount of commodities neededfor the program; and (3) determine commodity cost-effectiveness. The large number of commoditieson the Title II eligibility list makes it possible to design a variety of ration packages. It is useful to develop several alternative ration packages so that they can be compared for cost andother trade-offs. Alternative rations should be considered in the initial planning stages in the event thata commodity is not available, may be delayed in transport or when changes in commodity availability,prices, and packaging significantly alter the relative cost effectiveness of a ration package. If amicronutrient deficiency is a problem, consideration of key micronutrient values of a food aidcommodity should be factored into the selection process. 1. Calculating the ration package
For logistical and management reasons, a ration package that meets nutritional values should use nomore than three commodities per ration unless strong reasons exist. Because vegetable oil is adense source of energy for food deficient populations, it should almost always be included in a rationpackage. While there is an element of trial and error, the following checklist helps provide asystematic approach for designing food aid ration packages and selecting commodities and theirquantities to meet nutritional values:
" Consider the energy and protein nutritional values of the proposed food ration, which have beencalculated using Step 3.
" Calculate the oil ration. Around 20% of the food ration’s energy should come from oil.7 Multiplythe total energy value of the ration package by 20%. Then divide this amount by 9 (number of kcalper one gram of vegetable oil).
" Subtract the energy contribution of oil from the total energy value of the proposed food package toobtain the balance of kilocalories needed.
" Select a cereal or cereal blend from the list of commodities in Section I of the CRG. Projectstargeting a protein or micronutrient deficit target group should first consider blended cereals, suchas corn-soy blend (CSB) or wheat-soy blend (WSB). While blended, fortified, or value addedfoods should be considered first, other factors such as cost, energy and protein content,acceptability, ease of storage, and processing requirements should also be considered.
7 The total contribution of fat to the calories in the ration will be higher than 20 percent, especially if oil is combined witheither CSB or WSB, which contain about 7 percent fat. About 16 percent of the nutritional energy of these foods is in theform of fat because oil is a part of the blend, while other processed cereals contain much less fat content. Also, the overallcontribution of fat by the local food in the diet should be considered. With the exception of breast milk, in most poorhouseholds the amount of fat consumed by a child is likely to be low.

COMMODITIES REFERENCE GUIDE MODULE 1:MCHN PROGRAMS
15
" Calculate the number of kilocalories per one gram of cereal/cereal blend by dividing the number ofkilocalories per 100 grams of commodity by 100 (from Commodity Fact Sheets in Section II).These fact sheets are available at www.usaid.gov/hum_response/crg.
" Divide the balance of kilocalories needed by the number of kilocalories per one gram ofcereal/cereal blend to obtain the total grams of cereal/cereal blend.
" Calculate the number of grams of protein per one gram of cereal/cereal blend by dividing the gramsof protein per 100 grams of commodity by 100.
" Multiply the amount of protein per one gram of cereal/cereal blend times the total grams ofcereal/cereal blend in the ration package to obtain the protein contribution of the cereal/cerealblend.
" Subtract the protein contribution of the cereal/cereal blend from total protein value target for theproposed ration package. If more protein is needed, either increase the amount of cereal/cerealblend, replace the cereal with a cereal blend, or use a third commodity.
" If a third commodity will be used, dry beans, peas, lentils, or soy should be used to increase theprotein value of the package.
" Determine the number of grams of protein per one gram of the third commodity by dividing thegrams of protein per 100 g of commodity by 100. Then, divide the balance of protein needed bythe grams of protein per one gram of the third commodity. This will determine the amount ofcommodity needed to provide the remaining protein allowance.
" A ration calculated this way would contain up to 30 percent of its energy from fat (lipid) if a cerealblend is used along with the oil, because of the contribution of fat from the cereal commodity. Ifanother cereal is used, the fat contribution will be closer to 20 percent. The fat contribution can beadjusted by lowering or raising the percentage of oil the first step of the calculation.
" Do not forget to take into account the energy value of the third commodity and, if necessary,reduce the cereal ration accordingly.
Box 6 below provides a detailed example of how to calculate a ration package for 1-3 year oldchildren.

COMMODITIES REFERENCE GUIDE MODULE 1:MCHN PROGRAMS
16
The micronutrient content of the ration package should also be considered when designing rationpackages for MCHN programs. The ration package containing 105 grams of CSB in Box 7 providesbetween 50% to over 100% of this target group’s (children 1-3 years of age) recommended dietaryallowances (RDAs) for vitamin A, vitamin C, the B vitamins, folate, calcium, magnesium, iron, zinc,and iodine. The micronutrients content of blended cereals (see Commodity Fact Sheets in Section II)are estimates. Because some of these vitamins are lost during storage and cooking, they do notaccurately reflect the quantities available to the body at consumption. For example, up to 40 percent ofvitamin A is lost from fortified cereals that is exposed for several months to heat, light, and air.8Minerals are not subject to deterioration by environmental factors, however, their bioavailability canbe greatly reduced by absorption inhibitors, such as phytates, tea, and coffee.
8 SUSTAIN. Final Report of the Micronutrient Assessment Project. Washington, D.C., 1999.
Box 6: Calculating a Ration Package For 1-3 Year Old Children(This example uses the nutritional energy value from Box 5, "precise method".)OIL1) Multiply the total number of kcal times .20 (20%) to determine kcal from oil ration.
560 kcal (from Box 5) x 0.20 = 112 kcal
2) Divide the number of kcal of oil by 9 (1 g oil = 9 kcal).112 kcal ÷ 9 kcal/gram = 12.44 g or 12 g of fortified, vegetable oil per child per day
3) Subtract the caloric contribution of oil from the total caloric value of the ration package.560 kcal – 112 kcal oil = 448 kcal
CORN SOY BLEND4) CSB is selected to meet needs of young children. Calculate the number of kilocalories per
gram of CSB by dividing the number of kilocalories per 100 grams of CSB by 100.375 kcal ÷ 100 g = 3.75 kcal per one g of corn-soy blend (CSB)
5) Divide the balance of kilocalories by the number of kilocalories per one gram of CSB.448 kcal ÷ 3.75 kcal/gram = 119.47 g or 119 g of CSB per child per day
6) Calculate the number of grams of protein per one gram of CSB by dividing the grams ofprotein in a 100 g amount by 100.
17.2 g ÷ 100 g = 0.17 g
7) Then multiply the protein amount per one gram of CSB times the total grams of CSB.119 g x 0.17 g= 20.23 g or 20 g of protein per child per day
Thus, a ration package of 12 g of fortified, vegetable oil and 119 g of CSB provides 560kcal and 20 g protein. (Fat contributes 30 percent of the calories in this ration.)

COMMODITIES REFERENCE GUIDE MODULE 1:MCHN PROGRAMS
17
2. Calculating the Total Amount of Food Commodities Needed
Once the ration package is determined, the amount of commodities needed to feed the total number ofpersons/household for the program period (usually in metric tons) can be calculated. To determine thenumber of metric tons (MT) needed for each commodity use the following steps:
! Multiply the number of grams of the commodity per person per day times the total number ofpersons to receive the commodity.
! Multiply the total number of grams of the commodity needed to feed the target group times thenumber of days the program will provide the ration package.
! Determine the number of metric tons of commodity needed by dividing the total number of gramsper program period by 1,000,000 (number of grams in a metric ton).
! Complete the same calculation for each commodity (vegetable oil, cereal, cereal blend, or legume)that comprises the ration.
Box 7 below provides an example of how to calculate the total amount of commodities.
3. Determining the Cost Effectiveness of Ration Packages
For information on determining cost-effectiveness of the ration package and ranking commodities,refer to the beginning of Part Two of the CRG, Guidelines for Development of Food Aid Programs:An Overview.
STEP 5: RANKING AND SELECTION
Naturally, cost plays a key role in the size and effectiveness of programs and cost calculations involvedecisions about what cost elements to consider. At a minimum, the illustrative list of commodity
Box 7: Calculating Amount of Commodities Needed For 2,500 Children 1-3 Yearsof Age for One Year
1) Multiply grams of vegetable oil per child per day times 2,500 times 365 days.12 g oil (from Box 7) x 2,500 persons = 30,000 g x 365 days = 10,950,000 g
2) Divide the total number of grams of oil per year by 1,000,00010,950,500 ÷ 1,000,000 = 10.9 MT of fortified vegetable oil per year
3) Multiply grams of CSB per child per day times 2,500 persons times 365 days.119 g CSB (from Box 7) x 2500 persons = 295,500 g x 365 days = 108,587,500 grams
4) Divide the total number of grams of CSB by 1,000,000108,587,500 g ÷ 1,000,000 = 108.6 MT of CSB per year

COMMODITIES REFERENCE GUIDE MODULE 1:MCHN PROGRAMS
18
prices in Annex V and current in-country transportation and storage costs can be used. Other factors toconsider are: • Market disruptions: The Bellmon determination must ensure that the local market is not
disrupted. Market considerations in local areas where programs are targeted might also come intoplay. For example, it may be less disruptive to provide certain foods in the lean season rather thanthe harvest season. Guidance on conducting the Bellmon analysis may be found online atwww.usaid.gov/hum_response/ffp/bellmon.htm.
• Logistics and management: Some commodities may impose undue management or cost burdens
due to unusual local conditions (e.g. transportation, storage, handling, pilferage) or unsuitablepackaging, for the limited shelf life of the commodity.
The usual sources of data for considering potential market disruptions and logistical problems includepast evaluations of similar programs, interviews with host governments and local and internationalPVO, as well as discussions with international organizations (such as the World Bank and the UnitedNations), USAID, USDA Agricultural Attaches and Economic/Commercial Officers at U.S.Embassies.
Proposed and alternative, ration packages can now be ranked by nutritional value, income transfervalue, total cost, and other factors, such as potential market disruptions and logistical problems. Theymight also be ranked by cost. Decisions to change ration packages can be made less arbitrarily whenalternative rations and their main attributes have been examined in advance.

COMMODITIES REFERENCE GUIDE MODULE 1:MCHN PROGRAMS
19
RESORUCE LIST
1. Food and Nutrition Technical Assistance (FANTA) Project, Academy for EducationalDevelopment, 1825 Connecticut Avenue, NW, Washington, D.C., 20009-5721. Tel: 202-884-8000; Fax 202-884-8432. E-mail: [email protected]; Web site www.fantaproject.org. FANTA hasthe following guides:
# Agricultural Productivity Indicators Measurement Guide. Patrick Diskin# Anthropometry Indicators Measurement Guide (Draft). Bruce Cogill# Food For Education Indicator Guide (Draft). Joy Miller del Rosso and Gilles Bergeron# Food Security Indicators and Framework for Use in the Monitoring and Evaluation of
Food Aid Programs. Frank Riely, Nancy Mock, Bruce Cogill, Laura Bailey, and EricKenefick
# Improving the Use of Food Rations In Title II Maternal/Child Health and NutritionPrograms (Draft). Serena Rajabiun, Beatrice Rogers, Margarita Safdie, Anne Swindale
# Infant and Child Feeding Indicators Measurement Guide. Mary Lung’aho# Measuring Household Food Consumption: A Technical Guide. Anne Swindale and Punam
Ohri-Vachaspati# Nutritional Care and Support for Persons Living with HIV/AIDS and other Affected
Household Members. (forthcoming)# Potential Uses of Food Aid to Support HIV/AIDS Mitigation Activities in Sub-Saharan
Africa.# Sampling guide. Robert Magnani# Water and Sanitation Indicators Measurement Guide. Patricia Billig, Diane Benahmane
and Anne Swindale
2. Food Aid Management (FAM), 1625 K Street, NW, 5th Floor Washington, DC 20006. Tel:(202) 223-4860, Fax: (202) 223-4862; Web site www.foodaid.org. FAM provides USAIDdocuments (FY 1990-ongoing).
3. Linkages Project. Recommended Feeding and Dietary Practices to Improve Infant andMaternal Nutrition also see Facts for Feeding (English, Spanish, French). Academy forEducational Development, 1825 Connecticut Avenue, NW, Washington, D.C., 20009-5721.Tel: 202-884-8000; Fax: 202-884-8977; E-mail: [email protected] Web sitewww.linkagesproject.org.
4. Medicine Sans Frontieres. Nutrition Guidelines 1st Ed. 1995.
5. National Research Council. Recommended Dietary Allowances. National Academy Press,Washington, D.C., 1989.
6. Oxfam. Guide to Selective Feeding Programmes. Oxfam Practical Guide No. 1, 1984.
7. USAID/BHR. U.S. International Food Assistance Report 1999. January 2000. Web site:www.usaid.gov/hum_response/farpt1999.
8. USAID/BHR. Commodities Reference Guide (CRG): Section 1-4. April 1999. Web site:www.usaid.gov/hum_response/crg.
COMMODITIES REFERENCE GUIDE MODULE 1:MCHN PROGRAMS
20
9. USAID/BHR/FFP. Monetization Field Manual P.L. 480 Title II Programs. October 1998.Web site: www.usaid.gov/hum_response/ffp/monetiz.htm.
10. USAID/BHR/FFP. Title II Guidelines for Development Programs. January 2000. Web site:www.usaid.gov/hum_response/ffp/dappaa.htm.
11. USAID/CDIE. Performance Monitoring and Evaluation Tips. 1996. Web site:www.usaid.gov/pubs/usaid_eval/#02.
12. WHO. Management of Severe Malnutrition: A Manual for Physicians and Other SeniorHealth Workers. Geneva, 1999.
13. WHO. The Management of Nutrition in Major Emergencies. Geneva, 2000.
14. World Food Programme (WFP), Supplementary Feeding for Mothers and Children:Operational Guidelines also see UNHCR/WFP Guidelines For Selective Feeding ProgrammesIn Emergency Situations, February 1999 at www.wfp.org/OP/guide/PolGuideSelect.html.

COMMODITIES REFERENCE GUIDE MODULE 2-FFW PROGRAMS
1
MODULE 2:FOOD FOR WORK
I. INTRODUCTION
The overarching objective of USAID’s Office of Food for Peace (FFP) is to improve foodsecurity of vulnerable populations in developing countries around the world. Food securityexists when people have access to sufficient food to meet their nutrition needs for a healthy andproductive life.
The programming of food aid through Food-for-Work (FFW) activities can help improve foodsecurity by addressing temporary household food insecurity while supporting key constructionand rehabilitation activities that lead to longer term, more sustainable food security results.Usually, the major consideration in FFW activities is the income transfer value of a food rationas a wage equivalent or incentive. However, depending on the problems being addressed, thenutritional value of the food provided may also be a major consideration. FFW can be used tosupport a range of objectives primarily in non-emergency, development contexts, but also insome emergency programs where both rehabilitation projects and nutritional support receivehigh priority.
FFW programs include the construction or repair of farm-to-market and urban roads, schools,health clinics, irrigation systems, public water and sanitation systems and other infrastructure andenvironmental protection and conservation activities. FFW’s self targeting feature is useful inrehabilitation following disaster situations, where needy individuals will contribute their laborfor food while helping to return the community’s infrastructure to normal.. FFW interventionsare particularly appropriate when faced with the combination of widespread and/or seasonal fooddeficits and high unemployment rates. FFW is also common when drought, dislocation orintroduction of valuable new technologies in the local area temporarily disrupts productiveactivities of a farming community.
Good practice dictates that the community should participate in the FFW decision-makingprocess and should view the activity as creating a valuable community asset, such as treeplanting on common property.
II. GUIDELINES FOR COMMODITY SELECTION FOR FFWPROGRAMS
This module is intended to be flexible enough to permit the selection of food aid rations that areappropriate for each FFW situation. Box 1 below identifies five key steps in the development ofa FFW ration:

COMMODITIES REFERENCE GUIDE MODULE 2-FFW PROGRAMS
2
Box 1: Five Steps for Selecting FFW Commodity Rations:Step 1. Program DesignStep 2. Suitability of CommoditiesStep 3. Ration SpecificationsStep 4. Ration Calculations
Step 5. Ration Ranking and Selection
STEP 1: PROGRAM DESIGN
The five key components in the design of a FFW program proposal are: (1) carrying out a needsassessment; (2) determining whether FFW is appropriate; (3) identifying the target group; (4)developing the FFW objectives; and (5) determining the distribution mode and frequency. Fordetailed guidelines on proposal development see FFP’s Title II Guidelines for DevelopmentPrograms (www.usaid.gov/hum_response/ffp/dappaa.htm). Also refer to the Food AidManagement website at www.foodaig.org. An explanation of each design component follows:
1. Carrying Out A Needs Assessment
As the food aid component of the program is designed, it is important to articulate why food aidis needed and how it will be used to meet program goals. A needs assessment will provideinformation relevant to the design of the overall technical intervention (e.g. in agriculture orwater and sanitation) and specific information necessary for designing the FFW component.
A needs assessment will help to determine the nature, extent, severity, and distribution of thefood need. It should include an analysis of the degree of food accessibility and availability andother information that would inform to what foods might be useful in a FFW “payment”package. It should collect information on the local labor market, including seasonality in thesupply and demand for labor, and local wage rates. The assessment should also consider who ismost in need of food and during what seasons to have a basis for describing criteria for selectionof beneficiaries, the geographic areas to be targeted, and the period of time during which FFWshould be offered. The ideal timing for FFW activities is during periods of food scarcity whenlocal labor opportunities are limited.
Primary Data Collection: Primary data may be collected using survey methods that gatherinformation about food consumption, nutritional status, food availability, agricultural productionpatterns or migration. Qualitative data gathering techniques are also helpful. These may includetechniques such as in-depth interviews, focus group discussions, participatory rural appraisal, orobservation. Tips for collecting primary data are provided in USAID/CDIE’s PerformanceMonitoring and Evaluation Tips, available online at www.dec.org/usaid_eval. Otherinformational resources may be found in the Resource List at the end of this module.
Secondary Data Collection: Secondary data may be collected from various sources includingreports from the USAID/Africa Bureau-funded Famine Early Warning System (FEWS); UN

COMMODITIES REFERENCE GUIDE MODULE 2-FFW PROGRAMS
3
Food and Agriculture Organization (FAO) crop and food supply reports; UN World FoodProgram (WFP) food aid assessment reports; international and local PVO reports and otherdonor reports.
2. Determining whether a FFW component is appropriate
FFW may be an appropriate component of an emergency or non-emergency program where theassessment identifies the need for the following: 1) public infrastructure, such as roads, irrigationsystems, public water supply systems, schools and health clinics and environmental protection orconservation activities; 2) remuneration of participant’s time for training; 3) compensation fordecreases in food production while improved technologies are being implemented; 4) support forhousehold food need while rehabilitating agriculture or damaged infrastructure following adisaster or resettlement..
The assessment should document that food and labor opportunities are scarce in the programareas, and show that FFW activities (in-kind transfer of food resources) would not interfere withlocal labor markets, act as a disincentive to local enterprise, including farm production, andwould reinforce forms of community initiative rather than simply replace community labor withFFW paid labor.
The assessment should also document the likelihood that in-kind transfer of food would result inpreventing the following: 1) divestiture of productive assets by households (or other negativecoping strategies), 2) out-migration, and/or 3) increased prevalence of malnutrition.
3. Identifying and Targeting a Group
Typically, FFW programs are implemented in communities facing seasonal food deficits that canbenefit from improved infrastructure and to accelerate economic development. Populationgroups undergoing reconstruction following and emergency are also candidates. Whereas wholecommunities are often targeted, within these communities the focus is often on poor householdswith unemployed or underemployed adult men or women.
To the extent feasible, the FFW ration should be designed to be self-targeted to these groups.FFW rations can be self-targeted by developing a ration with a value slightly less than prevailinglocal wage, and including less preferred commodities. Selection of a food used in child feedingmay also help in self-targeting women.
Clearly, a FFW ration set too high will attract a greater spectrum of the available workers, butwill cut into local labor markets, and the food may not benefit the most needy individuals,women, and families. For instance, men may take the bulk of the work in situations wherewomen heads of household are in greater need. However, rates set too low while targeting thepoorest well, may be unjust and will not get the job done.
4. Developing Program Activity Objectives
USAID’s Managing for Results terminology in Annex 1 of Section VI should be reviewed prior

COMMODITIES REFERENCE GUIDE MODULE 2-FFW PROGRAMS
4
to drafting a proposal for submission to FFP. Program objectives in the food aid programproposal should be result statements, that is, what is the end result to be achieved by theintervention? For example, one results-oriented objective might be “improved access to food byhouseholds living in communities served by new or improved farm-to-market roads.”
Each result statement should have at least one performance indicator to track progress.Performance indicators are variables designed to measure progress toward achievement of thestated result. Sample food security indicators may be found in Annex II. USAID/CDIE’s
Performance Monitoring and Evaluation Tips, available online at www.dec.org/usaid_eval.These tips also include guidance for developing result statements and performance indicators.
When possible, both impact (performance) and output indicators should be developed andmonitored, although many of the output level indicators may not be reported to USAID. Thebenefits of having both are self-evident. For example, it is important for the PVO to know theamount of infrastructure constructed (e.g. km of farm-to-market roads improved - an output). Itis also important to determine how the economic situation and/or food access and/or utilizationof the target group improved (impact).
5. Determining the Distribution Mode and Frequency
The mode and frequency of FFW payments should be based on recipients’ needs, programobjectives, the type and quantity of the ration and commodity transport and distribution costs.Generally, FFW rations are distributed as take-home rations (dry, uncooked rations.)
FFW activities should be designed to increase the recipient’s self-reliance and self-esteem. Thismay be accomplished by encouraging the affected populations to provide their comments on themix and size of the ration, food payment ratios, and the distribution and monitoring systems.The latter programming approach helps preserve the dignity of the recipients while contributingto increased program efficiency and effectiveness.
STEP 2: SUITABILITY OF FOOD COMMODITIES
The suitability of the food aid should be assessed with regard to the needs and preferences of thetargeted individuals, households, and community. A ration is suitable if it can be usedeffectively to achieve intended objectives. Managers should judge the suitability of food rationsto the local food consumption patterns, nutritional requirements, locally available foods, foodprocessing and storage capacities, and local market prices. Below are key suitability factors to betaken into consideration in developing rations for FFW programs:
Cultural Suitability: It is important to consider food consumption patterns, taste preferences,and traditional taboos of the target population when designing the FFW ration package. Forexample, Brazilians prefer black beans while Nicaraguans prefer red beans. Clearly, food that isnot eaten does not have any nutritional value to the beneficiary. Foods that are totally foreign tothe local diet are not recommended, and they should not be introduced without sensitizing therecipients about the new food commodity.

COMMODITIES REFERENCE GUIDE MODULE 2-FFW PROGRAMS
5
Nutritional Values: Although FFW is intended primarily as an in-kind income-transfer, hungerand nutritional factors should also be considered. For example, one might consider the dietaryneeds of working women of childbearing age and those of their children by including fortifiedsoy-blended cereals and fortified vegetable oil in their ration. The program should also insurethat the amount of energy required to do the work is not greater than the amount of energyprovided by the ration.
Availability of Processing and/or Storage Facilities: Consider factors that will affect foodpreparation, such as access to mills, processing and storage facilities, access to fuel for cookingand preparation time. For example, it would not be appropriate whole grains when millingfacilities are not available, or to use beans (which require considerable energy to cook) in an areawhere there is a shortage of fuel. The means participants will transport rations to their homesand their facilities for storing them might also be considered. transport the commodities to theirhome.
Timing of Harvests and Seasonal Shortages: Methods for obtaining the required informationon harvests and seasonal availability of food include market analyses, and focus group and keyinformant interviews. Other considerations include whether labor requirements will impactnegatively on local agricultural production or the local labor market. If so, variations in the FFWwork schedule and/or distribution schedule in response to these needs should be madeaccordingly.
STEP 3: RATION SPECIFICATIONS
Generally, income transfer (monetary) value is a primary consideration in determining the rationin FFW programs. The income transfer value of a commodity is equivalent to the price of asimilar food in the local market. For example, if a household buys whole grain wheat andprocesses it at home, and the commodity under consideration is whole grain wheat, then thevalue of the commodity will be the market price of the whole grain wheat. If the commodity iswheat flour, the value is the market price of wheat flour or of whole grain wheat plus anallowance for costs of milling.
FFW food rations are given as a wage payment (based either on time worked or output produced)or as an incentive. Their nutritional value is usually a secondary consideration, depending on thesituation. The recipients' participation costs, such as transportation, can also be considered indetermining the quantity of FFW food to be provided. Past program experience andconversations with local authorities and community leaders may be used to factor in“participation costs” before agreeing upon a minimum FFW ration level.
Descriptions of each situation are presented below.
1. Income Transfer Value as Wage Payment: FFW projects use commodities as wageequivalent payments in activities where the workers are not the sole or direct beneficiaries ofthe infrastructure being created. In these situations, FFW is the wage they receive for theirwork. Wage equivalent payments may also be appropriate in situations where the workers do

COMMODITIES REFERENCE GUIDE MODULE 2-FFW PROGRAMS
6
benefit directly from the infrastructure, but providing the amount of labor required would notbe feasible without some sort of remuneration.
Payments are made daily (rare), weekly or monthly if the workers are engaged for asignificant period of time. The frequency of FFW payments is likely to be greater inemergency situations. If the FFW program involves a major construction activity with a highdegree of technical input and performance standards (e.g., major roads, etc.), it may benecessary to provide a full wage payment using a high value commodity in order to attractqualified labor. However, many programs work with local governments to cover the skilledlabor requirements with counterpart funding.
2. Income Transfer Value as an Incentive: FFW may be provided as an incentive whenindividuals benefit directly from a work project or training. The FFW payment underincentive type programs is meant to motivate beneficiaries to participate in the constructionactivity or attend education or training activities. Income transfer value should be based onthe real and opportunity costs of participation, for example, to compensate the cost of publictransportation or the time used to walk to/from the FFW site, or to provide an incentive toattend an educational activity. The opportunity cost of time is based on prevailing localwages. However, since the participant is also receiving direct benefits from the activity, thevalue of the food provided could be less than the equivalent of a full wage If the program isincentive-based, it is important to know the customs under which individuals would normallydonate their labor to a project.
3. Work Norm Approach: FFW is provided as a specified task is completed. Despite theadditional work required to define and measure tasks, introduction of task-basedcompensation can be more efficient than a daily wage approach. This approach requiresmore extensive negotiations on individual work assignments and close, skilled supervision.Further, with this approach, parts of a task must be valued in food terms and workapportioned according to an individual’s capacity to contribute to the work group. For moredetailed information on the latter subject, please see Food for Work: A Review of the 1980swith Recommendations for the 1990s, which may be found on in the Resource List at the endof this module.
4. Nutritional Value: Food needs and nutritional value should not be ignored in FFW projects,and in some instances they are of major importance to help fill gap in the target group’sdiets.. In this instance, the nutritional value of the ration must be more carefully consideredalong with the work objectives. In such cases, a low market value commodity might reachmore people with appropriate food. A low value food commodity, such as sorghum, mayself-target individuals who will be more likely to eat rather than sell the commodity. Someexperience also shows that food provided for women’s work is more likely to contribute tohousehold nutrition than would food or cash provided to men. FFW with hunger andnutrition objectives are most common in emergency and transition situations. For details onhow to determine the nutritional value of a general ration refer to Module 1-MCHNPrograms, or for emergencies, see Module 5- Emergency Programs.HYPERLINKS

COMMODITIES REFERENCE GUIDE MODULE 2-FFW PROGRAMS
7
Additional information necessary to determine the value of the FFW ration includes:
Local Wage for Full Day’s Work: Determine what a laborer would receive for a full day’swork in local currency. This value should be based on the prevailing local wage. The officialminimum wage may also be used, but in cases where the minimum wage is not well-enforced,this may lead to offering FFW rations with values well in excess of prevailing local wages. Thiswill likely lead to negative effects on labor market.
Portion of Day Worked: Determine the portion of a day that a beneficiary will work. FFWbeneficiaries may work an entire day or a portion of the day on a FFW activity. If the FFWration is being offered as an incentive, the amount of time individuals will spend in the activityneeds to be determined.
Person Hours Required for Output: If a norm-based approach will be used, the number ofperson/hours required to produce each output (e.g. person hours per meter of trench dug) willneed to be determined.
Transportation Costs: If the program includes the cost of transportation (either by publictransportation or by foot) as part of the payment, determine what the local costs fortransportation are.
The formula in Box 3 below can be used to determine the wage payment or incentive equivalent.
Box 3- Formula for Determining FFW Wage/Incentive Payment Equivalent
Local wage for x Portion of day Worked + Transportation/Incentive = Value of wagefull day’s work costs (if applicable) payment(may be calculated at90-95% of local wageto self-target)
Box 4 below provides an example of how to calculate a wage payment for use in determining theration specification.
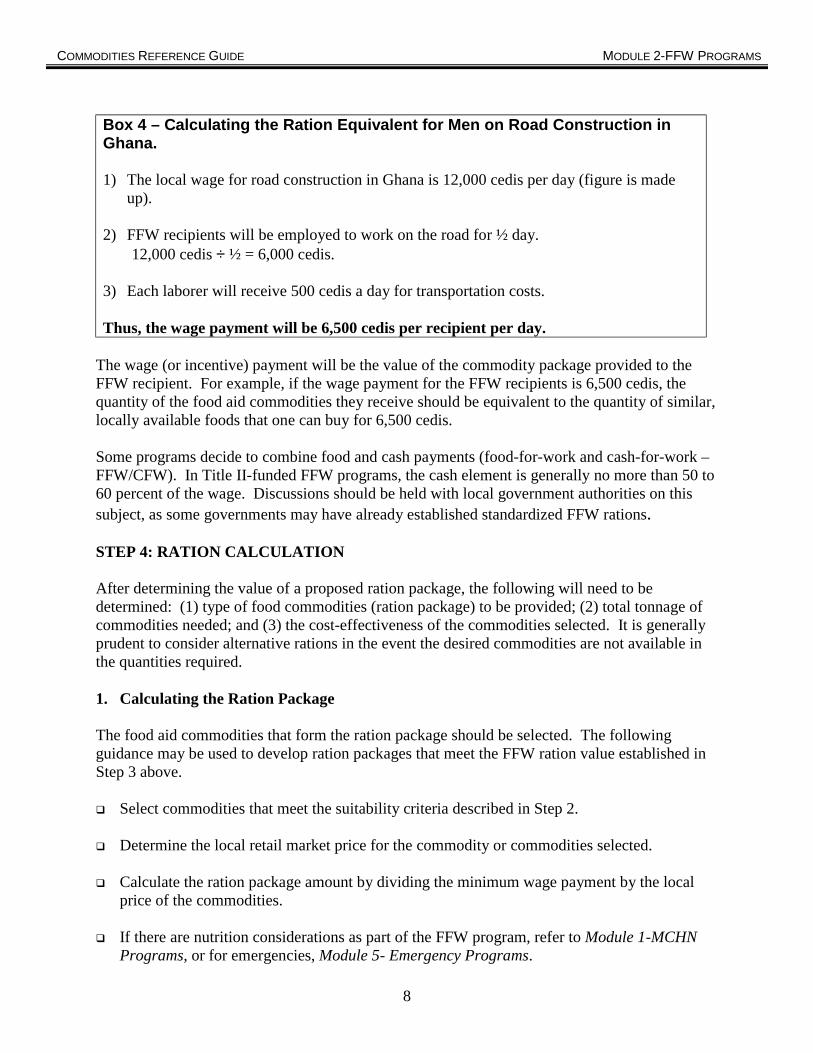
COMMODITIES REFERENCE GUIDE MODULE 2-FFW PROGRAMS
8
Box 4 – Calculating the Ration Equivalent for Men on Road Construction inGhana.
1) The local wage for road construction in Ghana is 12,000 cedis per day (figure is madeup).
2) FFW recipients will be employed to work on the road for ½ day.12,000 cedis ÷ ½ = 6,000 cedis.
3) Each laborer will receive 500 cedis a day for transportation costs.
Thus, the wage payment will be 6,500 cedis per recipient per day.
The wage (or incentive) payment will be the value of the commodity package provided to theFFW recipient. For example, if the wage payment for the FFW recipients is 6,500 cedis, thequantity of the food aid commodities they receive should be equivalent to the quantity of similar,locally available foods that one can buy for 6,500 cedis.
Some programs decide to combine food and cash payments (food-for-work and cash-for-work –FFW/CFW). In Title II-funded FFW programs, the cash element is generally no more than 50 to60 percent of the wage. Discussions should be held with local government authorities on thissubject, as some governments may have already established standardized FFW rations.
STEP 4: RATION CALCULATION After determining the value of a proposed ration package, the following will need to bedetermined: (1) type of food commodities (ration package) to be provided; (2) total tonnage ofcommodities needed; and (3) the cost-effectiveness of the commodities selected. It is generallyprudent to consider alternative rations in the event the desired commodities are not available inthe quantities required. 1. Calculating the Ration Package
The food aid commodities that form the ration package should be selected. The followingguidance may be used to develop ration packages that meet the FFW ration value established inStep 3 above.
! Select commodities that meet the suitability criteria described in Step 2.
! Determine the local retail market price for the commodity or commodities selected.
! Calculate the ration package amount by dividing the minimum wage payment by the localprice of the commodities.
! If there are nutrition considerations as part of the FFW program, refer to Module 1-MCHNPrograms, or for emergencies, Module 5- Emergency Programs.

COMMODITIES REFERENCE GUIDE MODULE 2-FFW PROGRAMS
9
Box 5 below provides an example of how to calculate the ration package for the target group inBox 3
BOX 5- CALCULATING A RATION PACKAGE FOR GHANAIAN FFW RECIPIENTS
1) The minimum wage payment is 6,500 cedis per person per day (from Box 3)
2) Rice and cow peas are the two food aid commodity selected for the ration package
3) Local cost of rice is 2,000 cedis per kilogram (kg); blackeye beans (cowpeas) are 1,750 cedisper kg. (the prices are hypothetical)
4) One and one-half kg of rice and 2 kg of cowpeas will provide the minimum wage paymentper recipient per day. ((1½ kg rice x 2,000) + (2 kg cowpeas x 1,750) = 6,500 cedis)
Thus, for ½ day labor on a road construction activity, a FFW recipient will receive 1½ kg of riceand 2 kg of cowpeas per day as payment for the labor provided.
Clearly, there is no exact formula for selecting the commodities or the mix of commodities ineach particular situation. Once foods that are economically viable to import in the given countryare identified, then programmers must be well informed about the suitability of the commoditiesin the cultural, economic and dietary context. In the Ghana example for instance, theprogrammers could justify greater quantities of beans than rice in the ration because of culturalpreference, or that the higher protein content of beans addresses deficiencies common in Ghanawhere low protein root crops make up a major part of the diet.
2. Calculate the Total Amount of Food Commodities Needed
Once the ration is calculated, determining the tonnage of commodities required for a wagepayment or an incentive type FFW program is fairly straightforward:
! Multiply the number of kilograms of the commodity per recipient per day times the totalnumber of persons to receive the commodity.
! Multiply the total number of commodity needed for the target group (all recipients workingon the FFW activity) times the total number of days that the ration package will be provided.
! Determine the number of metric tons (MT) of commodity needed by dividing the totalnumber of kilograms of commodity by 1,000 (number of kg in one MT).
! Complete the same calculation for each commodity in the ration package.
Box 6 below provides an example of how to calculate the total amount of commodities needed toprovide the two-commodity ration package example in Box 4.

COMMODITIES REFERENCE GUIDE MODULE 2-FFW PROGRAMS
10
Box 6: Calculating the Amount of Commodities Needed for 1,500 FFW Recipientsfor a 60 Day Road Construction Activity
For rice:1) 1½ kg rice x 1,500 recipients = 2,250 kg rice per day
2) 2,250 kg rice per day x 60 days = 135,000 kg rice per FFW activity
3) 135,000 kg rice ÷ 1,000 (number of kilograms in one MT)= 135 MT of rice
For Cowpeas:1) 2 kg cowpeas x 1,500 = 3,000 kg cowpeas per day
2) 3,000 kg cowpeas per day x 60 days = 180,00 kg
3) 180,000 kg ÷ 1,000 = 180 MT of cowpeas
3. Determining Cost Effectiveness of Ration Package
Occasionally, cost may not be the primary consideration in selecting the commodities. Foodpreferences, availability and potential disincentive effects may outweigh cost considerations. Inthis regard, a reexamination of the primary objective of the proposed FFW program and a furtherexamination of the cost of the commodity vis-a-vis its income transfer or nutritive value mayhelp reach a decision whether the program is sufficiently cost-effective and responsive to theneeds of the targeted population group.1
Cost effectiveness is determined by calculating the difference between the local value of theration package and the cost of delivering the ration package under the proposed program. Forexample, if a recipient receives a commodity that replaces one that would cost $0.50 in the localmarket, the provision of this commodity is a $0.50 value to the family. If providing the samecommodity via a Title II FFW program costs $0.25, then the program would be considered cost-effective as the value provided is higher than the actual cost of the commodity to the program.(See full example in the Part Two Overview section. HYPERLINK).
STEP 5: RANKING AND SELECTION
The various FFW ration packages proposed should be ranked in order to select the most cost-effective and appropriate combination to meet program objectives. In examining the primarycost elements, the illustrative price list of commodities in Annex IV and various in-countrytransportation and storage costs can be used. Other factors to consider are:
1 Cost also refers to costs to the project associated with a commodity (such as CCC dollar values found in AnnexVII). In some projects, in-country transportation and storage costs and special handling costs may be critical,however, these costs may be similar for most commodities. For each project, first decide which of these costelements are most relevant.

COMMODITIES REFERENCE GUIDE MODULE 2-FFW PROGRAMS
11
• Minimizing Market Disruptions: The Bellmon determination should confirm that localmarkets would not be disrupted. For example, it may be less disruptive to provide certainfoods in the lean season rather than during the harvest season. In fact, every effort should bemade to use Title II food aid to increase the productivity and sustainability of the targetedgroups. Guidance on conducting the Bellmon analysis may be found online atwww.usaid.gov/hum_response/ffp/bellmon.htm.
• Logistics, Packaging and Storage Considerations: The Bellmon determination should also
include an assessment of the country’s transportation and storage capacity. Further, somecommodities may impose undue management or cost burdens due to unusual local conditions-- such as storage, or pilferage problems -- or unsuitable packaging or a very limited shelf life(e.g., six-months or less).
The usual sources of data and information for examining potential market disruptions andlogistical problems include past evaluations of similar programs, interviews with localgovernment authorities, USAID missions, USDA Agricultural Attaches andEconomic/Commercial Officers at U.S. Embassies.
The next is to rank the alternative packages by total FFW program cost, income transfer value,nutritional value, and any other factors identified in the program design process. Subsequently,decisions to change ration packages can be made easily and less arbitrarily when alternativerations and their main attributes have been worked out in advance.

COMMODITIES REFERENCE GUIDE MODULE 2-FFW PROGRAMS
12
III. RESOURCE LIST
1. Food and Nutrition Technical Assistance (FANTA) Project, Academy for EducationalDevelopment, 1825 Connecticut Avenue, NW, Washington, D.C., 20009-5721. Tel: 202-884-8000; Fax 202-884-8432. E-mail: [email protected]; Web site www.fantaproject.org.FANTA has the following guides:
" Agricultural Productivity Indicators Measurement Guide. Patrick Diskin" Anthropometry Indicators Measurement Guide (Draft). Bruce Cogill" Food For Education Indicator Guide (Draft). Joy Miller del Rosso and Gilles Bergeron" Food Security Indicators and Framework for Use in the Monitoring and Evaluation of
Food Aid Programs. Frank Riely, Nancy Mock, Bruce Cogill, Laura Bailey, and EricKenefick
" Improving the Use of Food Rations In Title II Maternal/Child Health and NutritionPrograms (Draft). Serena Rajabiun, Beatrice Rogers, Margarita Safdie, Anne Swindale
" Infant and Child Feeding Indicators Measurement Guide. Mary Lung’aho" Measuring Household Food Consumption: A Technical Guide. Anne Swindale and
Punam Ohri-Vachaspati" Nutritional Care and Support for Persons Living with HIV/AIDS and other Affected
Household Members. (forthcoming)" Potential Uses of Food Aid to Support HIV/AIDS Mitigation Activities in Sub-Saharan
Africa." Sampling guide. Robert Magnani" Water and Sanitation Indicators Measurement Guide. Patricia Billig, Diane Benahmane
and Anne Swindale
2. Food Aid Management (FAM), 1625 K Street, NW, 5th Floor Washington, DC 20006. Tel:(202) 223-4860, Fax: (202) 223-4862; Web site www.foodaid.org. Provides USAIDdocuments (FY 1990-ongoing).
3. Linkages Project. Recommended Feeding and Dietary Practices to Improve Infant andMaternal Nutrition also see Facts for Feeding (English, Spanish, French). Academy forEducational Development, 1825 Connecticut Avenue, NW, Washington, D.C., 20009-5721.Tel: 202-884-8000; Fax: 202-884-8977; E-mail: [email protected]; Website:www.linkagesproject.org.
4. National Research Council. Recommended Dietary Allowances. National Academy Press,Washington, D.C., 1989.
5. SUSTAIN. Final Report of the Micronutrient Assessment Project. 1999. ExecutiveSummary available on Web site: www.sustaintech.org.
6. USAID/BHR/FFP. Commodities Reference Guide (CRG): Section 1-4. April 1999. Website: www.usaid.gov/hum_response/crg.

COMMODITIES REFERENCE GUIDE MODULE 2-FFW PROGRAMS
13
7. USAID/BHR/FFP. Food for Work: A Review of the 1980s with Recommendations for the1990s. Washington, DC, February 1991.
8. USAID/BHR/FFP. U.S. International Food Assistance Report 1999. January 2000. Website: www.usaid.gov/hum_response/farpt1999.
9. USAID/BHR/FFP. Monetization Field Manual P.L. 480 Title II Programs. October 1998.Web site: www.usaid.gov/hum_response/ffp/monetiz.htm.
10. USAID/BHR/FFP. Title II Guidelines for Development Programs. January 2000. Web site:www.usaid.gov/hum_response/ffp/dappaa.htm.
11. USAID/CDIE. Performance Monitoring and Evaluation Tips. 1996. Web site:www.usaid.gov/pubs/usaid_eval/#02.
12. WHO. Energy and Protein Requirements: Report of a Joint FAO Expert Consultation,WHO; Geneva, 1985.
13. WHO. The Management of Severe Malnutrition. Geneva, 1999.

COMMODITIES REFERENCE GUIDE MODULE 3: FOOD FOR EDUCATION
1
MODULE 3:FOOD FOR EDUCATION
I. INTRODUCTION
USAID’s Office of Food for Peace (FFP) administers PL 480, Title II food aid commodities. FFPprovides Title II resources to Cooperating Sponsors (CSs) to implement sustainable developmentprograms targeted to improve the food security of needy people, either by the direct distribution ofagricultural commodities or the use of local currencies generated by the sale of these commodities.
USAID supports education efforts and often uses food aid to help improve education opportunities andeducational progress by providing school lunches and take-home incentive rations. School lunches areused to encourage school enrollment, attendance, and to improve students’ attentiveness—especiallyfor those without breakfast at home. Food to schools may be referred to as Food for Educationprogram only if school feeding is integrated with other activities aimed at improving the quality of theeducation at the school, e.g., teacher training, curriculum development, development and provision ofacademic materials, infrastructural improvements, or provision of school supplies. The non-foodresources for these activities cannot be included in an activity funded by Title II Food for Educationresources. Some can be supported with Title II commodities, but the food must be requested in aseparate proposal, e.g., a Food for Work proposal. Normally, the government, Cooperating Sponsor,or other agencies should provide the non-food resources. School feeding that is not integrated withother activities must be referred to simply as “school feeding”, not as Food for Education. TheUSAID/FFP office has made it clear that the FFE is the preferred approach.
Food insecure communities with poor school attendance are usually selected as targets. Withincommunities, some programs specifically target girls. This Module provides principles and examplesof ration selection for FFE programs.
II. GUIDELINES FOR COMMODITY SELECTION FOR EDUCATIONPROGRAMS
This module, following the general five step framework of Part Two of the CRG (Box 1). It includeskey points of consideration for FFE programming under each step. This guidance is meant to beflexible enough to allow FFE Program Managers to select food aid rations appropriate for the situation.Box 1 lists the five steps.

COMMODITIES REFERENCE GUIDE MODULE 3: FOOD FOR EDUCATION
2
Box 1: Five Steps for Commodity Selection
1. Program Design2. Suitability of commodities3. Ration Size4. Ration Calculation5. Ration Ranking and Selection
STEP 1: PROGRAM DESIGN
Program design considerations are those program attributes that affect appropriate commodityselection. Key program design considerations discussed in this chapter include: (1) carrying out aneeds assessment; (2) developing program activity objectives; (3) determining the appropriate use offood; (4) identifying the target population’s characteristics; and (5) determining the distribution modeand frequency.
1. Needs Assessment
As programs with a food aid component are being designed, it is important to articulate why food aidis needed and how it will be used to meet program goals. A needs assessment or problem analysis willhelp to identify the nature, extent, severity, and distribution of the food needs. It should also includean assessment of food availability, an analysis of the main causes of malnutrition, identify the technicaland geographical areas in which the program will work, and summarize the resources and institutionalcapacity for action. Attention should be given to the extent which problems in these priority technicaland geographic areas are already being addressed.
Information about the target population’s demographic profile, nutritional status, food consumptionpatterns, health statistics, socio-economic statistics, and other basic information needs for programdesign can be attained from primary sources, such as qualitative research, food consumption surveys,and nutritional status surveys. A useful publication on how to use these methods is USAID/CDIE’sPerformance Monitoring and Evaluation Tips, which is available online at www.dec.org/usaid_eval.Other resources are listed in the Reference List. Useful information can also be obtained throughsecondary data reviews followed up with local key informant interviews. Other sources of secondaryinformation include:
! USAID reports and/or Demographic Health Surveys (DHS)! Ministry of Health and other in-country institutional statistics! National surveys or governmental action plans! International and bilateral donor agency situation analyses and reports! Other cooperating sponsors working in country! Internet databanks (such as UNICEF, WHO, World Bank, WFP, etc.)
Please refer to the current USAID/BHR’s Title II Guidelines for Development Programs for furtherguidance on developing a needs analysis (available online atwww.usaid.gov/hum_response/ffp/dappaa.htm). Also refer to the Food Aid Management website foradditional information: www.foodaid.org.

COMMODITIES REFERENCE GUIDE MODULE 3: FOOD FOR EDUCATION
3
2. Program Activity Objectives
No matter how the food will be used, the desired result of the food assistance intervention should bestated in terms of objectives. Once these have been defined, then, food commodities and rationsshould be selected to be consistent with these objectives. Each CS has its way of expressingobjectives. However, using USAID’s Managing for Results terminology will facilitate reporting toUSAID (for definitions of terms, see Annex 1 in Part Three of the CRG). Objectives for USAID-funded programs should be result statements, that is, they should clearly describe the desired end resultof the intervention. For example, “Improved attendance rates among school age children” is a result-oriented objective.
USAID recommends that each objective/result statement have at least one indicator to track progressof its achievement. Performance indicators are variables with a particular characteristic or dimensionthat can measure progress toward achievement of the desired result. Performance indicators should bedirect, measurable, and sensitive to capture small changes over short time intervals. For example, anindicator for the result statement mentioned (Improved attendance rates among school age children)could be “attendance rates in target schools”. USAID/CDIE’s Performance Monitoring andEvaluation Tips, available online at www.dec.org/usaid_eval, provides general guidance on how todevelop objectives and indicators. FANTA project’s “Food for Education Indicator Guide” proposesa set of indicators to measure the performance of FFE programs plus guidelines for computing theseindicators and can be found at www.fantaproject.org. Whenever possible, programs should includeinput as well as impact indicators for measuring progress of food aid programs. CSs should alsoprovide baseline data for selected indicators or a plan for collecting these data. Baseline studies of thetarget population, that incorporate the selected indicators should be part of the needs assessment, butmay be accomplished immediately after activity approval. CSs should also articulate an evaluationand monitoring plan that outlines the how indicators will be tracked and progress evaluated.
3. Food Use
In the past, school feeding (SF) programs used food primarily as an incentive to children and theirfamilies to improve attendance. Based on new findings that show that short-term hunger has anegative effect on attentiveness and learning, the role of food in FFE programs has been extended andrefined to additionally focus on improving learning, attention, and retention of material. Theconsumption of food early in the school day is important, but it is often logistically difficult to preparea breakfast at school. Therefore, the trend is towards mid-morning meals or snacks. Provision of thefood only near or at the end of the school day will reduce the effectiveness of the ration in achievingthe learning objectives, but FFE programs does help students’ families offset the costs of sending thechild to school.
4. Target Population
The target group for FFE programs is school age children in food insecure communities. Generally, allchildren in selected schools benefit, although the girls may be selected for extra benefits or may be theonly beneficiaries. Feeding may also be restricted to only certain grades within the school. Targetingof individual children is not done on the basis of nutritional criteria, but nutritional status at thecommunity or population level could be a basis for selecting schools or districts. Examples of othercriteria that may be used for school and district selection are: adequacy of food production, indicators

COMMODITIES REFERENCE GUIDE MODULE 3: FOOD FOR EDUCATION
4
of socio-economic status, rates of student enrolment or attendance, or student achievement. To assurethat educational benefits can be achieved, only schools that meet basic minimum standards of quality(to be determined in conjunction with the governing body and parents) should be targeted.
5. Distribution Mode and Frequency
The major mode of distribution for FFE programs is on-site feeding. However, take-home rations aresometimes provided. A description of both modes of distribution is provided below:
On-site school feeding: School feeding programs usually provide ready-to-eat meals or snacks onsite. The food should be provided to the students early in the day to maximize the learning gains.Obviously, food is provided only the days that the child is actually in school (e.g. five or six days aweek).
Take-home rations: Sometimes students are given a take-home ration in compensate the lost timethey would normally have spent working at home during school hours. This is a common incentive topromote enrolment of girls.
STEP 2: SUITABILITY OF COMMODITIES
Suitability of the ration is defined by assessing those attributes of the individual ration recipient, targethousehold, or community that will most affect utilization of the food aid commodities. Determiningsuitability must take into account nutritional needs, physiological appropriateness, food consumptionpreferences and patterns of the food aid recipient(s), locally available foods, food processing storagecapacities, and local market prices. These factors all affect the selection and appropriate allocation offood aid rations. Below is a checklist for use in considering food aid rations for an intended targetgroup(s). A detailed description of these factors can be found in Annex III.
Nutritional content is the nutritive content of the food commodity. Major nutrient considerationsshould include energy (calories), protein, and micronutrients (vitamins and minerals). Populationsdeficient in micronutrients would benefit from fortified food commodities. It is always important toconsider the nutritional content of the commodities when designing ration packages. The age, sex, andactivity level (e.g., depending on distance to walk to school), of the target school group are primarydeterminants of their nutritional needs. The ambient temperature during the school year must also beconsidered in cold climates. Special considerations of the disease burden affecting the school childmay influence the amount of food provided. For example, HIV/AIDS affected people requireadditional energy and protein (refer to to the FANTA publication on “Nutritional Care and Support forPersons Living with HIV/AIDS and other Affected Household Members” at www.fantaproject.org).
Physiological appropriateness relates to the physical characteristics of the food commodity thataffect its use by the target group. Consult local nutrition experts wherever available. Anything thatcould decrease utilization of the ration, such as food allergies and lactose intolerance, should beidentified and taken into consideration.
" Cultural suitability: Consider the cultural acceptability, including taste preferences, traditionaltaboos, and local practices of the target population or group that will affect food use and consumption.For example, most Brazilians prefer black beans while Nicaraguans prefer small red beans. Anotherimportant consideration is whether the commodities are culturally suitable for the particular role they

COMMODITIES REFERENCE GUIDE MODULE 3: FOOD FOR EDUCATION
5
are to play in the project. It is key to identify major constraints to using particular commodities.
Availability of processing and/or storage facilities: Food preparation, processing, and storagefacilities need to be considered when designing food supplements for FFE programs. Importantquestions to ask are: (1) are mills available to process whole grains; (2) are school facilities adequatefor storing the food supplement; (3) what fuel, preparation equipment or cooling facilities areavailable; and (4) what other locally available foods are available to improve taste, acceptability andnutrient diversity.
Characteristics of local food production are factors that provide an understanding of which localfoods are relatively available and affordable to the target group. Often parents are asked to contributefresh foods or condiments to add to the food aid commodities to add micronutrients or increase thepalatability of the school meals. If take-home rations are provided it would be wise to look at theproduction cycle helps to identify how food harvests correspond to the school year. Commodities fortake-home could be selected to help fill those gaps. Also, care should be taken in the commodityselection to assure that there is no disincentive to local production.
Cost will, in part, determine which food ration will be used.
Using this list, exclude commodities which do not meet the physiological criteria, are not culturallyacceptable, are difficult to store or process, and/or will compete with local food production from thelist of potential commodities. Making these decisions will aid in creating a short list of commoditiesfrom which to chose. Annex III provides a detailed description of the factors mentioned above.
STEP 3: RATION SPECIFICATIONS
The size of the ration should be based on specified nutritional needs and/or income values, costs orration standards that other agencies are currently using. Past program ration specifications for size andtype of ration, the approval of the USAID mission, and commodities that have been already orderedand are in the pipeline (up to several months in advance of the start of a program) are also keyconsiderations.
To determine ration size, first determine the nutritional or income value that a ration must have toachieve the project objectives and impact. Then list suitability criteria and key characteristics that areimportant to the full utilization and consumption of the ration as described in Step 2. Below aresuggestions on how to best determine the nutritional or income value of FFE food rations.
1. Determining Nutritional Values
The nutritional value of the ration is described in terms of its energy (calories), protein, fat andmicronutrient content. Establishing the beneficiaries’ minimum energy and protein needs, whichdepend on the child’s age and sex, provides a basis for defining a supplement package appropriate tomeet project requirements. These requirements are described in terms of the average number ofkilocalories and grams of protein needed per person per day before selecting the commodities. Inaddition, the fat in the rations should provide 10-20% of the total energy.
FFE programs generally provide only a snack or a meal, which would not be expected to fill thenutrition deficit completely. There are no fixed guidelines for calculating the nutritional value of

COMMODITIES REFERENCE GUIDE MODULE 3: FOOD FOR EDUCATION
6
supplementary food rations for a FFE program, since the food supplement is not based on the nutrientdeficit of the target group. Past experience with food aid programs may be the best way to determinethe nutritional value of the food ration. However, it can be assumed that the meal provided willsubstitute for at least one meal normally provided at home. Thus, the following general steps could beused for calculating the nutritional value of the meal.
" Determine which meal the food supplement would replace—breakfast or lunch.
" Determine the percentage of energy that meal represents. For example, if the breakfast is usuallylight, it may represent 10-15% of a child’s total intake per day. If the meal is served as a lunch, thepercentage of energy may be higher given that lunch is usually the bigger meal in most countries.
" Multiply the percentage times the Recommended Energy and protein allowances. The CRG usesAnnex V and VI, however, CSs may use their own dietary standards.
Box 2 provides an example of calculating the nutritional value of a FFE meal ration for 7 to 10 yearold children based on percentage of recommended dietary allowances.
BOX 2- EXAMPLE OF HOW TO CALCULATE A MEAL RATION FOR 7-10 YEAR OLD CHILD
Assumptions:The mid-day meal represents approximately 45% of the target group’s diet.
1) Determine recommended energy allowance (REA) for 7-10 year olds = 2,000 kcal (from Annex V)2) Multiply 2,000 (kcal) x .45 = 900 kcal per child per day3) Determine recommended protein allowance (RPA) for 7-10 year olds = 28 grams (from Annex VI)4) Multiply 28 grams x .45 = 12.6, rounded to 13 grams protein per child per day
Thus the nutritional value of the food supplement is 900 kilocalories and 13 grams protein.
General guidance provided by WFP/UNESCO/WHO1 for full day primary schools is to provide a:
# mid-morning snack containing 400-600 kilocalories per child and a# full lunch of 700-900 kilocalories,# for a total of 1200-1500 kilocalories per child (or 60-75% of REA), with 28-36 g protein (70-90%
of RPA) and 13-17g fat. (Refer to WFP/UNESCO/WHO. Rome 1999. School FeedingHandbook.)
For half day primary schools, depending on the frequency of feeding and whether or not the schoolfeeding is intended to provide a full lunch, the guidance provided is:
# A mid-morning snack only: 500 kcal (or 25% of REA); about 13g protein (33% of RPA); about 6 gfat.

COMMODITIES REFERENCE GUIDE MODULE 3: FOOD FOR EDUCATION
7
# Two snacks (before school and mid-morning): 600-900 kilocalories (or 30-45% of REA); 16-24 gprotein (40-50% of RPA); 7-11g fat.
# A mid-morning snack and lunch: 1200-1500 kilocalories; 28-36 g protein; 13-17 g fat (i.e., like fullday schools).
Micronutrient deficiencies are widespread in developing countries where Title II food aid isdistributed. All processed food cereals under Title II programs, with the exception of parbroiled rice,are fortified with B vitamins (thiamin, riboflavin, folic acid, and niacin), vitamin A, calcium, and iron.Blended cereals (corn-soy blend and wheat-soy blend) are further fortified with zinc, B12, pantothenicacid, iodine, magnesium, vitamin C, vitamin D, and vitamin E. Vegetable oil is fortified with vitaminA. If micronutrient deficiencies are known, the contribution from fortified commodities can beestimated by from the Commodity Fact Sheets in Section II of the CRG, available on line atwww.usaid.gov/hum_response/crg. Check with school authorities to ensure that children are notalready been supplemented with multi-vitamins or specific vitamins such as vitamin A.
2. Income Transfer Value
Income transfer value is the value of the ration in monetary terms to the household receiving the foodaid. If a FFE program uses food rations mainly for their income transfer (monetary) value, ProgramManagers will need to determine the ration package’s target level and the minimum level of acceptableincome transfer value. The cash value of rations is determined by the price (market or selling) of thelocal commodity that is most similar to the food aid commodity in the household diet. When used asan incentive to families to offset the costs of sending their children to school, past program experience,conversations with community leaders, tests of different income transfer value levels, and discussionswith the USAID mission may be necessary before agreeing upon a minimum level. Commodities thatsubstitute for highly valued and expensive food items, such as oil, may have a substantial incomemediating effect, freeing up income typically used for purchasing these expensive items to buyadditional local foods or goods.
STEP 4: RATION CALCULATION
When designing ration packages program managers need to (1) choose the ration package based on thenutritive or income transfer values, (2) calculate the total amount of commodities needed for theprogram, and (3) determine commodity cost-effectiveness. The large number of commodities on theeligibility list makes it possible to design a variety of ration packages. It is useful to develop severalalternative ration packages so that they can be compared for cost and other trade-offs. Programs maywish to consider alternative rations in the initial planning steps as contingency plans for when acommodity is not available, is delayed in transport, or when changes in commodity availability, prices,and packaging alter the relative cost effectiveness of ration packages.
1. Calculating the ration package
For logistical and management reasons, a ration package that meets nutritional values should use nomore than three commodities per ration unless strong reasons exit. Because vegetable oil is a densesource of energy for food deficient populations, it should almost always be included in a rationpackage. While there is an element of trial and error, the following checklist helps provide asystematic approach for calculating the ration package and selecting the commodities to meet

COMMODITIES REFERENCE GUIDE MODULE 3: FOOD FOR EDUCATION
8
nutritional values. For the sake of calculation, commodity 1 will be fortified vegetable oil, commodity2 will be a cereal or cereal blend, and commodity 3 will be a legume.
" Consider the caloric and protein nutritional values of the proposed food ration, which have beencalculated using Step 3.
" Calculate the oil ration. Around 10 to 20% of the food ration’s energy should come from oil.Multiply the total caloric value of the ration package by 10 to 20%. Then divide this amount by 9(number of kcal per 1 gram of vegetable oil).
" Subtract the caloric contribution of oil from the total caloric value of the proposed food package.
" Select a cereal or cereal blend from the list of commodities in Section I of the CRG to make up thebalance of kilocalories. At present, Title II cereals include wheat, sorghum, bulgur, corn, and rice.Blended cereals include corn-soy blends (CSB) and wheat-soy blends (WSB). Projects targeting aprotein deficit population utilizing a two-commodity ration should first consider soy-fortifiedcereals. While blended, fortified, or value added foods should be considered first, ProgramManagers should also consider cost, energy and protein content, acceptability, ease of storage andprocessing attributes of commodities.
" Calculate the number of kilocalories per 1 gram of cereal/cereal blend by dividing the number ofkilocalories per 100 grams of commodity (from Commodity Fact Sheets in Section II of the CRG,available online at www.info.usaid.gov/hum_response/crg) by 100.
" Divide the balance of kilocalories by the number of kilocalories per 1 gram of cereal/cereal blend.
" Calculate the number of grams of protein per 1 gram of cereal/cereal blend by dividing the numberof grams of protein per 100 grams of commodity (from Commodity Fact Sheets) by 100.
" Multiply the amount of protein per 1 gram of cereal/cereal blend times the total grams ofcereal/cereal blend in the ration package.
" Subtract the protein contribution of the cereal/cereal blend from total protein value of the proposedration package. If more protein is needed, either increase the amount of cereal/cereal blend or use athree-commodity ration.
" For a three-commodity ration package, the third commodity should be dry beans, peas, lentils, andsoy to increase the protein value of the package.
" Determine the grams of protein needed to make up the difference between the protein contributionof the cereal (soy-cereal blends are generally not used in 3-commodity rations). See Box 6 forspecific instructions. Do not forget to take into account the caloric value of the protein source and,if necessary, adjust your cereal ration accordingly.
" Assess suitability and physiological appropriateness of the commodities (see Step 2 and AnnexIV).

COMMODITIES REFERENCE GUIDE MODULE 3: FOOD FOR EDUCATION
9
Box 3 provides a detailed example of how to calculate ration package with two commodities.
BOX 3: EXAMPLE OF HOW TO CALCULATE A TWO-COMMODITY RATION1) The caloric and protein values for this example are 900 kcal and 13 grams (g) of protein per
person per day, respectively. (from Box 2).
2) Multiply the total number of kcal times 10-20% to determine kcal from oil ration. 900 kcal x 0.20 = 180 kcal
3) Divide the number of kcal of oil by 9 (1 gram oil = 9 kcal).270 kcal ÷ 9 kcal = 30 g of fortified vegetable oil per child per day
4) Subtract the caloric contribution of oil from the total caloric value of the ration package.900 kcal – 180 kcal fat = 720 kcal balance
5) Select a cereal or cereal blend to make up the balance of kilocalories. Using the CommodityFact Sheets (available online at www.info.usaid.gov/hum_response/crg) calculate thenumber of kilocalories per 1 gram of cereal/cereal blend by dividing the number ofkilocalories of 100 grams of cereal/cereal blend by 100. This example uses cornmeal.366 kcal ÷100 g = 3.66 kcal per 1 gram of cornmeal.
6) Divide the balance of kilocalories by the number of kilocalories per 1 gram of cornmeal.720 kcal ÷ 3.66 kcal = 196 g of cornmeal per person per day
7) Calculate whether 196 grams of cornmeal provides enough protein. To do this, firstdetermine the amount of protein per 1 gram of corn-soy blend by dividing the grams ofprotein per 100 g commodity (from Commodity Fact Sheets) by 100.8.5 g ÷ 100 g = 0.085 g
8) Then multiply the protein amount per 1 gram of corn soy blend times the total grams ofcorn-soy blend.196 g x 0.085 g= 16.6 g of protein per child per day. This amount is slightly more thanthe 13 grams proposed.
Thus, a two-commodity ration package of 30 grams fortified vegetable oil and 196 gramscornmeal provides 900 kilocalories and 16.6 grams of protein per child per day.

COMMODITIES REFERENCE GUIDE MODULE 3: FOOD FOR EDUCATION
10
2. Calculate the Total Amount of Food Commodities Needed
Once the ration package is determined, Program Managers will need to calculate how much of thecommodities (usually in metric tons) will be needed to feed the total number of students or householdper year or project period. To calculate the number of metric tons needed for each commodity(vegetable oil, cereal, cereal blend, or legume) use the following steps.
# Multiply the number of grams of the commodity per person per day times the total number ofpersons to receive the commodity.
# Multiple the total number of grams of the commodity needed to feed the target group times thetotal number of days the program will provide the ration package.
# Determine the number of metric tons of commodity needed by dividing the total number of gramsof commodity needed per program period by 1,000,000 (number of grams in a metric ton).
# Complete the same calculation for each commodity (vegetable oil, cereal, cereal blend, or legume)that comprises the ration.
Box 4 provides an example of how to calculate the total amount of commodities needed to provide thetwo-commodity ration package from Box 3 to 15,300 children for one school year of 180 school days.
BOX 4: CALCULATING AMOUNT OF COMMODITIES NEEDED FOR 15,300 STUDENTS FOR 180SCHOOL DAYS.
1) Multiply grams of oil per person per day times 15,300 persons times 180 days.30 g oil (Box 3) x 15,300 persons = 459,000 g per day x 180 days = 82.620,000 g per year
2) Divide the total number of grams of vegetable oil per year by 1,000,000 (number of gramsper metric ton)82,620,000 g ÷ 1,000,000 = 83 metric tons of fortified vegetable oil per school year
3) Multiply grams of cornmeal per person per day times 15,300 persons times 180 days.195 g cornmeal (Box 3) x 15,300 persons = 2,983,000 g per day x 180 days = 537,030,000 gper school year.
4) Divide the total number of grams of cornmeal by 1,000,000537,030,000 g ÷ 1,000,000 = 437 metric tons of cornmeal per school year

COMMODITIES REFERENCE GUIDE MODULE 3: FOOD FOR EDUCATION
11
3. Determine Cost Effectiveness of ration package
Cost is often not the primary factor for selecting the commodities. Food preferences, availability andpotential disincentive effects often outweigh cost considerations. The cost of the commodity per itsnutritive or income value may help in determining whether it is cost-effective and/or appropriate forthe food aid component of a development assistance or emergency program. CSs should determine theprimary purpose of the food aid program (nutritional benefit or income transfer) and conduct theappropriate cost-effectiveness analysis.2
Calculating the cost-effectiveness of desired commodities in terms of cost per unit of nutritional value(100 calories or 10 grams of protein) or income transfer value (in U.S.$ to the recipient) providesinformation about which commodities provide the most nutritional benefits or highest income at thelowest cost to the project. It is important to note that cost per calorie of blended and fortified foodswill always be higher than bulk grains.
Cost Effectiveness per Nutritional Value: To determine the cost effectiveness value of a commodityper its nutritive value, calculate the cost in cents per kilogram of commodity using the following steps.Commodity values in Annex VII and the nutritional values of commodities from the Food CommodityFact Sheets (Section II of CRG available online at www.usaid.gov/hum_response/crg) are two sourcesof information Program Managers will need to make these calculations.
a) Per Caloric value:
" As the cost of a commodity listed in Annex VII is per metric ton, divide the cost per metric ton by10,000 (100 g x 10,000 = 1 MT), which will give the cost per 100 grams of commodity.
" Divide that amount by the number of calories per 100 grams of commodity.
" Multiply the resulting figure by 100 to determine the cost in cents of one kilocalorie of thecommodity.
b) Per protein value:
" Divide the cost per metric ton (from Annex VII) by 10,000, which will give the cost per 100 gramsof commodity.
" Divide that amount by the number of grams of protein per 100 grams of commodity.
" Multiply the resulting figure by 100 to determine the cost in cents of one gram of protein from thecommodity.
2 Cost also refers to costs to the project associated with a commodity (such as CCC dollar values found in Annex IX). Insome projects, in-country transportation and storage costs and special handling costs may be critical, however, these costsmay be similar for most commodities. For each project, first decide which of these cost elements are most relevant.

COMMODITIES REFERENCE GUIDE MODULE 3: FOOD FOR EDUCATION
12
Box 5 gives an example of how to calculate the cost effectiveness of both the caloric and proteinnutritive values for cornmeal.
BOX 5: EXAMPLE OF COST PER NUTRITIVE VALUE OF CORNMEAL
Per caloric content of cornmeal:$ 194 ÷ 10,000 = $0.0194 per 100 g = $.000053 or .053 cents per kilocalorie
366 kcal per 100 g
Thus, the cost of one kilocalorie of cornmeal is 0.05 cents
Per protein content of CSB:$ 194 ÷ 10,000 = $ 0.0194 (per 100 g) = $.0023 or .23 cents per gram of protein 8.5 grams (per 100 g)
Thus, the cost of one gram of protein provided from cornmeal is .23 cents
This type of analysis would be used to assess different rations designed to meet nutritional objectives;and to determine which objective is most cost-effective. For example, the cost effectiveness ofcornmeal can be compared the cost effectiveness of another commodity, such as CSB. CSB turns outto be a more expensive source of nutritional energy but a more expensive source of protein. (See theexample in Part Two, Overview . Hyperlink. Based on the cost effectiveness values for different rationpackages, Program managers are better able to select the ration, which meets program objectives at thelowest cost to the project.
Cost per Income Value: Another analysis that could be done for when CSs use food aid commoditiesto provide a given value or an incentive or wage. In this context, cost effectiveness is the cost of acommodity per $5.00 of income value. For each commodity under consideration, use Annex VII tocalculate the income value of 1 kg of that commodity. Then calculate the amount of the ration that isrequired to yield $5.00 income value. Box 6 provides an example.
BOX 2 – EXAMPLE OF INCENTRIVE VALUE CALCULATION
1) First, calculate the cost of one kg of cornmeal to the household if purchased in the local market.Example uses the following (made up) figures:1 kg flour costs the household $.25 at their local market.
2) Dividing $0.25/kg into $5.00 yields 20 kg. Thus, to provide $5 worth of incentive requires distribution of 20 kilograms of cornmeal to the recipient.
*See Part I Overview for a cost effectiveness method comparing this cost to the cost to the program of delivering thecornmeal to the school.
Changes in commodity availability, prices, and packaging can alter the relative cost effectiveness ofration packages. It is useful to develop at least one alternative ration packages so that it can becompared for cost and other trade-offs.

COMMODITIES REFERENCE GUIDE MODULE 3: FOOD FOR EDUCATION
13
Take into consideration the following when designing an alternative ration package:
" Design rations that meet specifications using no more than three commodities per ration.
" Use commodities, which provide the maximum gain to recipients at lowest cost to the project.
" Based on the cost per unit of nutritional and/or income transfer value provided to the recipient,use the most cost-effective commodities and design at least one alternative package if a newproject is being planned.
" Compare the nutritional and/or income transfer values of currently used rations withspecifications and key suitability criteria.
" Alter the ration packages according to how they will meet nutritional or income transferobjectives as well as their cost-effectiveness.
STEP 5: RANKING AND SELECTION
It is important to rank your ration packages and commodities in order to select the most cost-effectiveand appropriate rations to meet program objectives. Cost plays a vital role in the size and effectivenessof projects, and budgetary requirements can be affected by the inclusion of certain commodities,especially when ordered in large quantities. Costs of the individual commodities are vital in obtaining atotal ration cost. Calculating the costs of commodities involves decisions about which cost elements toconsider. At a minimum, Commodity Credit Corporation (CCC) values (see Annex VII) and variousin-country transportation and storage costs can be used. Other factors to consider are:
• Market disruptions: The Bellmon determination must ensure that the local market is notdisrupted. Market considerations in local areas where programs are targeted might also come intoplay. For example, it may be less disruptive to provide certain foods in the lean season rather thanthe harvest season. Guidance on conducting the Bellmon analysis may be found online atwww.usaid.gov/hum_response/ffp/bellmon.htm
• Logistics and management: Some commodities may impose undue management or cost burdens
due to unusual local conditions (transportation, storage, handling, pilferage, accounting costs, etc.)or unsuitable packaging for the shelf life of the commodity.
The usual sources of these data for considering secondary purposes, potential market disruptions, andlogistical problems include past evaluations of the same or similar programs; interviews with localpersonnel, Ministries of Agriculture or Finance; USAID mission agricultural offices, and USDArepresentatives at U.S. Embassies.
Thus, ration packages can be ranked by nutritional value, income transfer value, total cost, and otherfactors, such as, secondary purposes of the ration, market disruptions, and logistical problems.Alternative rations should meet all the minimum standards of nutritional and/or income transfer valueas well as other critical specifications. Decisions to change ration packages can be made easily andless arbitrarily when alternative rations and their main attributes have been worked out in advance.

COMMODITIES REFERENCE GUIDE MODULE 3: FOOD FOR EDUCATION
14
III. REFERENCE LIST
1. Catholic Relief Services, CRS Food Security Programming Guide: Chapter Food AssistedEducation. January 1999 (draft)
2. Food and Nutrition Technical Assistance (FANTA) Project, Academy for EducationalDevelopment, 1825 Connecticut Avenue, NW, Washington, D.C., 20009-5721. Tel: 202-884-8000; Fax 202-884-8432. E-mail: [email protected]; Web site www.fantaproject.org. FANTA hasthe following guides:
$ Agricultural Productivity Indicators Measurement Guide. Patrick Diskin$ Anthropometry Indicators Measurement Guide (Draft). Bruce Cogill$ Food For Education Indicator Guide (Draft). Joy Miller del Rosso and Gilles Bergeron$ Food Security Indicators and Framework for Use in the Monitoring and Evaluation of
Food Security Programs. Frank Riely, Nancy Mock, Bruce Cogill, Laura Bailey and EricKenefick
$ Improving the Use of Food Rations In Title II Maternal/Child Health and NutritionPrograms (Draft). Serena Rajabiun, Beatrice Rogers, Margarita Safdie, Anne Swindale
$ Infant and Child Feeding Indicators Measurement Guide. Mary S. Lung’aho$ Measuring Household Food Consumption: A Technical Guide. Anne Swindale and Punam
Ohri-Vachaspati$ Nutritional Care and Support for Persons Living with HIV/AIDS and other Affected
Household Members. (forthcoming)$ Potential Uses of Food Aid to Support HIV/AIDS Mitigation Activities in Sub-Saharan
Africa.$ Sampling Guide. Robert Magnani$ Water and Sanitation Indicators Measurement Guide. Particia Billig, Diane Benahmane
and Anne Swindale
3. Food Aid Management (FAM), 1625 K Street, NW 5th Floor, Washington, D.C. 20006 Tel:202-223 4860; Web site www.foodaid.org. Provides USAID documents (FY 1990-ongoing).
4. Linkages Project. Facts for Feeding (English, Spanish, French). Academy for EducationalDevelopment, 1825 Connecticut Avenue, NW, Washington, D.C., 20009-5721. Tel: 202-884-8000; Fax: 202-884-8977; E-mail: [email protected]; Website: www.linkagesproject.org.
5. Médecins Sans Frontières. Nutrition Guidelines. 1st Edition. 1995.
6. National Research Council. Recommended Dietary Allowances. National Academy Press,Washington, D.C., 1989.
7. Oxfam's Guide to Selective Feeding Programmes. In: Oxfam Practical Guide No. 1, 1984.
8. Sehgal, Meena. Review of CARE Food Ration Packages. Sponsored by CARE-USA andUSAID, December 1995.

COMMODITIES REFERENCE GUIDE MODULE 3: FOOD FOR EDUCATION
15
9. Smith Nazaire, Jennifer. Food-Assisted Education. Presenation to Food Aid ConsultativeGroup (FACG). December 1998.
10. SUSTAIN, Micronutrient Assessment Project: Final Report. SUSTAIN, 1400 16th Street, NW,Box 25, Washington, D.C., 1999 Tel: 202-328-5183; Fax: 202-328-5175; Web site:www.sustaintech.org.
11. Tee, Dr. E-Siong and Florentino, Rodolfo. (Regional Forum and Workshop on) RecommendedDietary Allowances in the Southeast Asian Region: Scientific Basis and Future Direction.Singapore, March 10-11, 1997. In: Nutrition Reviews. Vol. 56, Number 4 (Part II), April1998. Sponsored by International Life Sciences Institute (ILSI) Southeast Asia.
12. UNESCO. Food Aid for Education. UNESCO’s Co-operation with the World FoodProgramme. 1994.
13. USAID/BHR. U.S. International Food Assistance Report 1999. January 2000. Web site:www.usaid.gov/hum_response/farpt1999.
14. USAID/BHR. Commodity Reference Guide (CRG). Section 1-4. April 1999 Web site:www.usaid.gov/hum_response/crg.
15. USAID/BHR/FFP. Title II Guidelines for Development Programs(DAP/PAA). January 2000.Web site: www.usaid.gov/hum_response/ffp/dappaa.htm.
16. USAID/BHR/FFP. Monetization Field Manual P.L. 480 Title II Programs. October 1998. Website: www.usaid.gov/hum_response/ffp/monetiz.htm.
17. USAID/CDIE. Performance Monitoring and Evaluation Tips. 1996. Web site:www.usaid.gov/pubs/usaid_eval.
18. U.S. Position Paper Prepared for the World Food Summit. July 1996.
19. WFP's School Feeding Programme Recommendation, Draft Guidelines. 1998.
20. WHO. Energy and Protein Requirements: Report of a Joint FAO Expert Consultation, WHO;Geneva, 1985.
21. World Bank/The Partnership for Child Development. School Feeding Programs: ImprovingEffectiveness and Increasing the Benefit to Education. A Guide for Managers. August 1999.
22. World Food Program, UNESCO, WHO. School Feeding Handbook. 1999.

COMMODITIES REFERENCE GUIDE MODULE 4-NEHA PROGRAMS
1
MODULE 4:NON-EMERGENCY HUMANITARIAN
ASSISTANCEI. INTRODUCTION
The overarching goal of USAID’s PL480, Title II development program is to achieve sustainable foodsecurity in chronically food deficit countries. The Office of Food for Peace’s (FFP) StrategicObjective (SO) #2 supports this goal and is stated as “Increased effectiveness of FFP’s partners incarrying out Title II development activities with measurable results related to food security with aprimary focus on household nutrition and agricultural productivity.”
FFP Title II food resources may also be used for “safety nets” for vulnerable groups who are not ableto take full advantage of food security activities available in their communities. Non-EmergencyHumanitarian Assistance (NEHA) can improve the nutrition and food security of these vulnerablepopulations. For example, NEHA can provide critical food aid to orphans, the elderly, hospitalpatients, and families stricken with HIV/AIDS.
II. GUIDELINES FOR COMMODITY SELECTION FOR NEHAPROGRAMMING
The following provides general guidelines for selecting the most appropriate, cost-effective Title IIcommodity rations to accomplish program objectives. The guidelines are organized into five steps.This module summarizes the five steps and includes key points of consideration for NEHAprogramming under each step. This guidance is intended to be flexible enough to allow the selection ofthe most appropriate food aid ration for each specific situation. Box 1 below lists the five steps forcommodity selection:
Box 1: Five Steps for Selecting Commodity Rations:Step 1. Program DesignStep 2. Suitability of Food CommoditiesStep 3. Ration SpecificationsStep 4. Ration Calculations
Step 5. Ration Ranking and Selection
STEP 1: PROGRAM DESIGN
The five key program design components are: (1) carrying out a needs assessment; (2) determining theappropriate use of food aid; (3) identifying characteristics of the target population; (4) developingprogram activity objectives; and (5) determining the distribution mode and frequency. An explanationof each design component follows:

COMMODITIES REFERENCE GUIDE MODULE 4-NEHA PROGRAMS
2
1. Carrying Out a Needs Assessment
A needs assessment should be carried out in a timely and participatory manner to determine the nature,extent and severity of the food need, to describe food accessibility and availability and to identifyfactors that may impede effective utilization of food aid. The findings from this assessment shouldhelp define the criteria for selecting the beneficiaries, institutions and/or geographic areas to betargeted. The assessment should also explore the possibility of using locally produced foods tosupplement the food aid package. When appropriate to the program objectives, the degree ofmalnutrition in the target population should also be determined. Finally, the assessment report shouldbriefly describe the assessment methodology used.
Primary Data Collection: Primary data may be collected using survey methods that gather informationabout such things as food consumption, nutritional status, food availability and networks of communitysupport. Qualitative data gathering techniques are also helpful, including in-depth interviews, focusgroup discussions, participatory rural appraisal, and observation. Methods for collecting primary dataare described in USAID/CDIE’s Performance Monitoring and Evaluation Tips, which is availableonline at www.dec.org/usaid_eval. Other instructional resources can be found in the Resource List atthe end of this module.
Secondary Data Collection:Secondary data may already be available from various sources including reports from governmentagencies, USAID, UN agencies (especially, UNICEF, UNAIDS), international or local PVOs andother donors. These data should be verified with local key informants. More guidance on how toconduct needs assessments may be found on line at www.usaid.gov/hum_response/ffp/dappaa.htm.
2. Determining the Appropriate Use for Food Aid
NEHA food aid will typically have a safety net or nutritional objective, such as the maintenance ofnutritional status, rehabilitation of malnourished individuals or the prevention of malnutrition. It mightalso be used as an incentive to motivate members of the target group to participate in health oreducation services. Naturally, different program activities will involve different targeting, rations, andgraduation criteria.
3. Identifying Characteristics of the Target Population
The general purpose of NEHA programs is to provide a safety net for those who cannot adequatelyprovide for themselves because of a long term or permanent disability of some kind. Many are housedin institutions, but others live in households disseminated through the community. Some groups thatmight be served by NEHA programs are:
♦ Persons residing indefinitely in institutions, such as orphans, the terminally ill, those who areseverely disabled mentally or physically, or elderly pensioners who must be institutionalized. Foodaid may provide a substantial portion of these individuals’ nutritional needs.
♦ Persons temporarily housed in institutions, including children and adults who are hospitalized orparticipate in residential rehabilitative services or skills training. The ration package can alleviatethe burden on the individuals’ households’ time and income.

COMMODITIES REFERENCE GUIDE MODULE 4-NEHA PROGRAMS
3
♦ Persons temporarily in need of assistance while living in the community, includingmarginalized individuals or households that are unable to adequately care for themselves, forinstance, because of mental or physical disability, illness, age, destitution, or low social status, andwho are not under the care of an institution. Included in this category are chronically ill out-patients (e.g. TB cases, lepers), and street children, including orphans, those abandoned by theirfamilies and those inadvertently separated from their families (e.g., by disaster). It can also includechildren living with members of their extended family, e.g., those from HIV/AIDS affectedhouseholds. Many of these recipients receive food aid as nutritional support for a relatively shortperiod of time while they achieve or regain self-sufficiency. For others it serves as an incentive toparticipate or attend another program (e.g., health education).
♦ Severely affected communities: In some cases, where the targeted group represents a large partof the population, an entire community might be targeted (e.g., HIV-affected communities)
4. Developing NEHA Program Activity Objectives
The primary objective of the NEHA program is to maintain or improve the nutritional status of thetarget population and to create a foundation for more sustainable food security programs funded fromnon-NEHA resources. Although each cooperating sponsor (CS) will approach the achievement of itsactivity objectives in different ways, it is urged that CSs review USAID’s Managing for ResultsTerminology (see Annex I of Part Three). The latter review will help CSs develop standardizedperformance reporting on progress made toward achieving established objectives. Activity objectivesshould be result statements, that is, they should clearly describe the desired end result of theintervention. For example, results-oriented objective would be “The nutritional status of the targetgroup maintained”.
USAID recommends having at least one performance indicator to track progress toward eachobjective/result. Performance indicators are variables that measure a particular dimension that canshow progress toward the stated result. For example, an indicator for the result statement mentionedabove (Maintenance of nutritional status of the target group) could be “average weight-for-age z-scorewithin the target group”. Resources for sample food security and nutrition indicators can be found inAnnex II. USAID/CDIE’s publication, Performance Monitoring and Evaluation Tips(www.dec.org/usaid.eval), which provides guidance on how to develop result statements andperformance indicators. When possible, impact and output indicators should also be developed andmonitored. The benefits of having both types of indicators are self-evident. For example, it is not onlyimportant to know the percent of the target population reached with food aid (output), but to alsodetermine whether nutritional status of the target population improved as a result of the food aid(impact).
CSs should also provide baseline data for the selected indicators or spell out a plan to collect it.Ideally, baseline studies should be part of the needs assessment. If this is not possible then theindicators can be submitted to FFP for review after the program proposal is approved. Naturally, eachCS’s resources to monitor and evaluate programs are different. This will be taken into considerationduring USAID’s food aid proposal review and approval process. Also refer to the Food AidManagement’s website for guidance and useful links www.foodaid.org.

COMMODITIES REFERENCE GUIDE MODULE 4-NEHA PROGRAMS
4
5. Determining the Distribution Mode and Frequency
NEHA programs typically provide on-site (wet) feeding in institutions or at community feeding centersor take-home rations for individuals or households in the community. If monetization or FFW areconsidered as alternative program components, refer to the relevant guidance in other parts of theCRG.
Direct Feeding
♦ On-site (wet) feeding involves preparing and serving meals or snacks at a designated site outsidethe home. In NEHA programs on-site feeding is commonly provided at institutions wherebeneficiaries reside or at designated community feeding centers. Most NEHA on-site feeding willinvolve provision of one or more meals daily, 365 days per year. Exceptionally, feeding may belimited to 5-6 days per week or only to certain season, because there is food available from othersources for the rest of the time. The advantage of on-site feeding is that food rations are eatenunder supervision, which helps to ensure that the food supplement is actually consumed by thetarget population.
♦ Take-home rations are dry, uncooked food rations carried home where it is prepared andconsumed by the food aid recipient. Take-home packages can provide recipients’ entire caloriesand protein requirements, or only a part of their requirements, if foods from other sources providethe rest. The advantage of take-home rations is that they are easier to administer, less costly thanon-site feeding, demand less time from recipients, and can reach larger numbers of beneficiaries.However, dry rations may be shared with other family members (leakage) or sold/exchanged in themarket place, thereby reducing their nutritional impact on the intended beneficiary.
STEP 2: SUITABILITY OF FOOD COMMODITIES
Suitability relates to the characteristics of the commodities that affect the utilization of the food aidcommodities. Suitability of food rations should take into account nutritional needs, cultural andphysiological appropriateness, locally available foods, food processing and storage capacities, andlocal market prices and food consumption preferences.
Cultural suitability: It is important to consider food preferences and consumption patterns, taste andtraditional taboos when designing ration package. Clearly, a food commodity that is not eaten does notdirectly provide nutritional benefit to the beneficiary. Another important consideration is whether thecommodities are culturally suitable for the particular role they are to play in the project. It is key toidentify major constraints to using particular commodities.
Nutritional content: This refers to the energy, protein, fat, and micronutrient content of the rationpackage. For example, populations deficient in vitamin A would benefit from receiving vitamin Afortified vegetable oil and blended commodities. The age, sex, and activity level (e.g., distance towalk to school) of the target group are primary determinants of their nutritional needs. The ambienttemperature must also be considered in cold climates.
Physiological appropriateness: The physical characteristics, such as, the bulk, viscosity, digestibilityand tolerance, of the food commodity need to be considered as ration packages are being developed.

COMMODITIES REFERENCE GUIDE MODULE 4-NEHA PROGRAMS
5
For example, children less then 24 months of age have a smaller stomach size and are, therefore, lessable to consume enough high bulk foods to meet their caloric needs. Young children, the sick and theelderly are less able to chew and digest some foods. Please refer to Module 1 – MCHN Program fordetails on physiological appropriateness for mothers and children. HYPERLINK People sufferingwith HIV/AIDS also have special food requirements.
Availability of processing and/or storage facilities: Factors that affect food processing andpreparation must be considered, such as access to mills, access to fuel for cooking and preparation andcooking time.
Characteristics of locally available food: Determine the timing of harvests and seasonal shortages ofstaple foods and examine the affordability of local foods for the target group, as locally produced orpurchased food may complement the imported Title II food commodities and eventually might replacethem.
Cost: In part, cost will guide the suitability of ration commodities. Step 5 below provides guidance onhow to calculate the cost-effectiveness of a ration package.
STEP 3: RATION SPECIFICATIONS
Ration specifications should be based on specific program objectives and nutritional needs of the targetpopulation or the income transfer value of the commodities it contains. However, other factors mayinfluence ration size, such as standards used by other implementing agencies or past program rationspecifications. Program objectives and characteristics of the target group(s) should drive the decisionsabout ration specifications. Below is guidance for developing ration specifications for nutritional aswell as income transfer consideration:
1. Determining Nutritional Values for On-site Feeding
Specifications for rations for institutional feeding programs should be based on the portion ofrecommended dietary allowance of food aid recipients it is intended to fulfill. Title II foodcommodities might provide beneficiaries’ full energy, fat and protein requirements or may provide oneor more basic staples to add to other foods provided by the community or another source. Based onWFP/ UNESCO/WHO recommendations for institutional feeding, programs that provide three meals aday should cover 100 percent of the daily recommended allowances for energy and protein foreveryone in the institution (e.g., an orphanage). When only 2 meals are provided and recipients eatone meal at home or a third meal is furnished from some other source, then the two meals shouldtogether include 60-75 percent of the energy and 80-90 percent of the protein. Programs offering onlya single meal should provide 30 to 45 percent of the recommended energy allowance and 60 to 70percent of the protein allowance.1
Other food items such as fresh fruits, vegetables, sugar, salt, etc. from some other sources (e.g.community contributions or institutional gardens) should be added to the food aid commodities toimprove the palatability and micronutrient content of the meals. Fresh fruits and vegetables areessential for ensuring adequate micronutrients in the diet.
1 WFP,UNESCO,WHO. School Feeding Handbook, Rome, 1999.

COMMODITIES REFERENCE GUIDE MODULE 4-NEHA PROGRAMS
6
It is critical that the design of an emergency program does not compromise the adoption of appropriateand recommended feeding and dietary practices including exclusive breast feeding for infants undersix months of age. The eligibility criteria for recipients, quantities, commodity mix, andrecommendations for use of the rations should be consistent with official government policies and withstandard practices used by USAID and the UN. Detailed recommendations for appropriate feedingpractices are available from USAID’s LINKAGES Project series titled Facts for Feeding atwww.linkagesproject.org. See also Module 1: MCHN Programs. HYPERLINK
Table 1 below lists the recommended daily allowances for different age/sex groups for use indetermining the specification of a ration package for on-site feeding programs.
Target groups in NEHA programs may include individuals that cross a wide range of ages, andrecommended allowances vary according to age, sex and physiological status. The nutritional needs oftwo groups stand out as being the most different from other ages, i.e. children aged three years andyounger and pregnant and lactating women. Young children (< 2 years) require proportionally morefat in their overall diets (30 to 40 percent) compared to other age groups (20 percent). Women needextra energy and protein during pregnancy and lactation, which would require adding a supplement to
Table 1: 100% Recommended Daily Allowances for Different Age/Sex groups*
Age/Sex RecommendedEnergy
Allowance(kcal/d)
RecommendedProtein
Allowance(g/d)
Fat(g/d)
Children 1-3 yrs 1300 16 45-58Children 4-6 yrs 1800 24 40Children 7-10 yrs 2000 28 45
Non-pregnantfemale11-50 yrs
2200 47* 45-50
Female 51+ yrs 1900 50 36-42
Male 11-14 yrs 2500 45 50-56
Male 15-18 years 3000 59 57-67
Males 19-50years
2900 60 55-65
Males 51+ years 1900 63 36-42Pregnant female
20+ years2+300 +13 +6-7
Lactating female1st 6 mos
+500 +18 +10-11
Lactating female2nd 6 mos
+500 +15 +10-11
*From the National Research Council’s Recommended Dietary Allowances. National Academy Press, 1989.

COMMODITIES REFERENCE GUIDE MODULE 4-NEHA PROGRAMS
7
these women’s diets. For more details on nutritional needs of children and pregnant and lactatingwomen, refer to Module 1- MCHN Programs. HYPERLINK
The recommended dietary balance of energy, protein, and fat for older children and non-pregnant, non-lactating adults is similar enough that all can be served from the same preparation. The differencesamong their particular needs relate more to quantity of food. Adolescent boys and men will need to eatmore. Primary school-aged children and the elderly will need less. To specify ration size for a groupof diverse ages, an average daily allowance can be used. The average should be a weighted average,depending on the age/sex distribution in the target group. Table 2 below provides a worksheet forcalculating the average recommended energy allowance for mixed target groups.
Instructions for using this worksheet:
1) Insert the percentage of the target group that fits into the age/sex category in the third column foreach line.
2) Multiply this percentage times the REA for each group and enter the product on the appropriateline in the last column.
3) Add the sum of the products in the last column, which will yield the average REA across the entiretarget group. (The percentages in column 3 should total 100%.)
4) For high bulk food aid commodities, multiply the Average by 1.05 (Atwater correction) to get therecommended energy allowance across the age/sex groups. This correction is to account for thevarying fiber content, digestibility, and complex carbohydrate composition of high bulkcommodities.
Box 2 below provides an example of how to calculate the average recommended energy and protein
Table 2: Table for Use in Calculating an Average Recommended Energy Allowance (REA)for Several age/sex Groups within an Institution.
Age/Sex REA*(kcal/d
)
% of targetgroup
Children 4-6 yrs 1800 X =Children 7-10 yrs 2000 X =
Non-pregnant female11-50 yrs 2200 X =
Male 11-14 yrs 2500 X =
Male 15-18 years 3000 X =
Males 19-50 years 2900 X =Elder adults 51+ years 1900 X =
Average 100% 3=
*For high bulk rations add 5% for Atwater correction

COMMODITIES REFERENCE GUIDE MODULE 4-NEHA PROGRAMS
8
allowance for children ages 4-10 years and adults.
Box 2. Example of Determining Average REA for a Target PopulationAcross Age/Sex Groups (percentages are made up for this example)
REA*Children 4-6 yrs 30% X 1,800 Kcal = 540 Kcal/dayChildren 7-10 yrs 20% X 2,000 Kcal = 400 Kcal/dayFemales 11-50 yrs 15% X 2,200 Kcal = 330 Kcal/dayMales 11-14 yrs 15% X 2,500 Kcal = 375 Kcal/dayMales 15-18 yrs 10% X 2,900 Kcal = 290 Kcal/dayMales 19-50 yrs 10% X 1,900 Kcal = 190 Kcal/day
AVERAGE 100% 2,125 Kcal/day
* From Table 1 above
2. Determining Nutritional Values for Take-Home Rations
NEHA programs often provide dry, uncooked food rations that will be prepared and consumed athome. Take home packages can be in the form of a full ration package providing an entire day’s worthof kilocalories and protein, or a partial ration package that is used to fill the gap in the recipient’s diet.Generally speaking, take-home rations are partial rations and based on the nutritional deficit of a targetgroup. For an explanation on how to calculate ration specifications for take-home packages, pleaserefer to Module 1 – MCHN Programs.
Additional food may be needed to compensate substitution effects (when home diets or institution dietsare reduced because of on-site feeding), or leakage (when take-home rations are eaten by untargetedmembers of the family). Substitution or leakage may occur if global household/institution levels offood deficits are large (seasonally or year round). Past experience with food aid programs or trial anderror may be the best way to determine the quantity of calories to add to account for leakage. In theabsence of local data, one option is to double the ration. to compensate the leakage. Other ways toaddress substitution or leakage are through education or by providing food commodities that promoteself-targeting, i.e., that are more likely to be consumed by the target group because of income, culturalor age-group characteristics.
3. HIV/AIDS Affected Individuals
Special nutritional considerations must given to the diet for people with HIV/AIDS; affected peoplesuffer from appetite loss (anorexia), eat less food and have difficulty eating and therefore fail to meettheir dietary requirements. HIV/AIDS also affects how the body uses the foods that are consumed andthis results in nutrient malabsorption. Fevers and the infections that accompany an HIV infection alsolead to greater nutrient requirements and poor use of the nutrients by the body. There are severalillnesses that are common with people living with HIV/AIDS and that cause malnutrition. Theseinclude poor appetite or anorexia, losing weight, fever, diarrhea, frequent vomiting, oral thrush andother infections. Good nutrition for HIV affected people requires the consumption of an adequateamount of macronutrients such as proteins, carbohydrates and fats, and micronutrients, which include

COMMODITIES REFERENCE GUIDE MODULE 4-NEHA PROGRAMS
9
vitamins and minerals. A deficiency in macronutrients, also known as protein energy malnutritionmanifests itself in the weight loss and wasting that is typical of AIDS patients. This weight loss andwasting occurs as a result of reduced food intake, nutrient malabsorption and changes in metabolism.Vitamin A for HIV affected people is important for growth, immune function and maintenance of thelining of the respiratory, gastrointestinal, and gastro-urinal tracts. Consuming micronutrientsespecially vitamin A, B6, B12, iron, and zinc are important for building a strong immune system andfighting infections. Consuming fortified foods like the cereal blends and vegetable oil fortified withvitamin A as well as taking micronutrient supplements at early stages of HIV infection can slowweight loss and disease progression. In the case of vitamin A there is the likelihood of reducedtransmission between mother and child and slowing the progression of the disease in infected people.Refer to the FANTA publication on “Nutritional Care and Support for Persons Living with HIV/AIDSand other Affected Household Members” at www.fantaproject.org.
STEP 4: RATION CALCULATION After determining the ration specification for a proposed ration package, the following should bedetermined: (1) defining the ration package; (2) the total tonnage of commodities needed; and (3) thecost-effectiveness of the commodities selected. It is generally prudent to consider alternative rations inthe initial planning stage in the event that the desired commodities may not be available in thequantities required. 1. Defining the ration package
The selection of rations for the different age groups will vary according to their nutritional needsEnergy, protein, and fat are the three main macronutrients and are of primary concern for growth,health, and recuperation from disease. A ration package composed of Title II commodities thatcontains sufficient energy and includes a variety of protein-rich commodities (cereals, blended foods,legumes) usually provides sufficient amount of protein for most of the population, but it is important toensure that it provides enough for nutritionally vulnerable groups, such as young children and pregnantand lactating women. Fats and oils are a rich source of energy and also essential for health and theprevention of some diseases. Similarly, vitamins and minerals, referred to collectively asmicronutrients, are essential to the health of people of all ages, but especially for growing children andwomen during their reproductive years. Below are considerations for defining ration packages forspecific target groups per mode of distribution.
For on-site feeding: When on-site feeding is the sole source of food, it is important that food aidrations provide sufficient energy, protein, and fats to meet all of the needs of the specific target groups.Nutritional needs vary according to the age and sex of the target group and subsequently affect the typeof commodity selected for the age group. Guidelines for commodity selection for the specific agegroups follows:
! For children ages 1-3: These children require sufficient energy, protein and micronutrients forgrowth, health and recuperation from infections. Fats should provide from 30-40 percent of theoverall dietary energy for this age group2. Given the high nutrient needs and smaller stomachcapacity of this target group, nutrient-dense food aid commodities, such as corn-soy blend (CSB)or wheat-soy blend (WSB) and refined vegetable oil, are recommended.
2 WHO, The Management of Nutrition in Major Emergencies. Geneva, 2000.

COMMODITIES REFERENCE GUIDE MODULE 4-NEHA PROGRAMS
10
! For children ages 4-10: Children this age still require that their caloric needs are met, but theyneed relatively less fat and micronutrients than their younger counterparts. Their diets should stillinclude a combination of protein rich pulses and cereals, and about 20 percent of kilocaloriesshould come from fats.
! For Adults: The diet should provide the minimum recommended amount of kilocalories. Tocover the requirements for certain essential fatty acids, 17-20 percent of the ration calories shouldbe provided in the form of fats or oil, but no more than 10% of energy should come from saturatedfatty acids (found in all animal fats and some vegetable oils).3 With the exception of vegetable oil,all Title II commodities contain some protein. Therefore, if the ration is restricted to 20-40% fatand includes either a blended food or both a cereal and a pulse, the minimum protein requirementfor this group will be provided.
Table 3 below provides examples of NEHA ration packages for on-site feeding of different targetgroups. They are organized according to how many meals are provided at the institution/feedingcenter. Two different ration packages are provided per number of meals provided. These rations arenutritionally adequate in terms of energy, fat and protein, but without additions of fresh condiments,sugar and salt they may not be palatable to a child. Refer to Module 1-MCHN for more aboutcomplementary feeding for young children.
3 WHO, The Management of Nutrition in Major Emergencies. Geneva, 2000

COMMODITIES REFERENCE GUIDE MODULE 4-NEHA PROGRAMS
11
Table 4 below provides examples of ration packages appropriate for on-site feeding of children agesfour to six years. Fresh fruits and vegetables as well as sugar will increase the caloric andmicronutrient content of these ration packages. Table 5 provides sample ration packages for an adulttarget group. Tables 3 , 4 and 5 provide two sample rations per number of meals provided.
Table 3: Examples of NEHA Ration Packages for On-site Feeding of 1-3 Year Old Children
Commodities If 3 meals (100%REA) are provided,below are 2 possible
ration packages*
If 2 meals areprovided, below are
2 possible rationpackages*
1 meal is provided,below are 2 possible
ration packages*
CSB 150 g 150 g 150 g 200 g 120 g 50 g
Cereal flour** or Rice
90 g 100 g 35 g 0 0 40 g
Pulse 50 g 35 g 15 g 15 g 0 10 g
Oil 35 g 35 g 25 g 20 g 10 g 20 g
CaloriesProteinPercent Fat***
1372 kcal46 g30%
1357 kcal43 g34%
965 kcal32 g33%
981 kcal37 g31%
541 kcal20 g31%
546 kcal14 g39%
* It is doubtful that children 1-3 can eat this volume of food in the number of meals indicated. The food for3 meals should be split to provide 3 meals with 2-3 snacks (CSB is an easily prepared snack); the food for 2meals can make 2 meals plus 1-2 snacks; and the food for 1 meal a meal plus a snack.** If cereal other than rice is unmilled, add 10% to account for caloric difference, and if cereal will behand milled, add another 10% to account for milling losses.*** This amount of fat is appropriate for children who are not breastfeeding. If children are being regularlybreastfed, the fat content could be reduced to 20 percent fat.

COMMODITIES REFERENCE GUIDE MODULE 4-NEHA PROGRAMS
12
Table 4: Examples of NEHA Rations for On-site Feeding of 4-6 Year Old Children
Commodities If 3 meals (100%REA) are provided,below are 2 possible
ration packages
If 2 meals areprovided, below are 2
possible rationpackages
1 meal is provided,below are 2 possible
ration packages
CSB 150 g 100 g 0 g 100 g 200 g 0 g
Cereal flour* or Rice
250 g 210 g 250 g 100 g 0 150 g
Pulse 40 g 120 g 40 g 50 g 0 30 g
Oil 30 g 40 g 30 g 25 g 5 g 20 g
KilocaloriesProteinPercent Fat
1886 kcal57 g19%
1899 kcal62 g21%
1306 kcal31 g21%
1130 kcal35 g23%
797 kcal34 g21%
822 kcal20 g22%
*If cereal other than rice is unmilled, add 10% to account for caloric difference, and if cereal will be hand milled,add another 10% to account for milling losses.
Table 5: Examples of NEHA Rations for On-site Feeding of Adults 19-50 years (50% eachmale and females)
Commodities If 3 meals (REA =2,600 kcal) are
provided, below are 2possible ration
packages
If 2 meals areprovided, below are 2
possible rationpackages
1 meal is provided,below are 2 possible
ration packages
WSB 100 g 0 g 0g 100g 0 g 100 g
Fortified Cerealflour or Rice*
300 g 450 g 250g 100g 150 g 100 g
Pulse 200 g 150 g 150 g 50g 75 g 50 g
Fortified Oil 50 g 55 g 35 g 25g 20 g 15 g
KilocaloriesProteinPercent Fat
2,575 kcal98 g21%
2,644 kcal73.5 g20%
1737 kcal59.5 g20%
1692 kcal39 g21%
980 kcal36 g20%
1,023 kcal42 g19%
* If cereal other than rice is unmilled, add 10% to account for caloric difference, and if cereal will be hand milled,add another 10% to account for milling losses.

COMMODITIES REFERENCE GUIDE MODULE 4-NEHA PROGRAMS
13
For take home rations: Remember that a supplementary ration, by definition, adds to food fromother sources, which also contribute nutritional energy, fat, protein, and micronutrients to thebeneficiaries’ diets. With regard to fat and protein, guidance that should be considered in the design oftake-home ration packages for targeted exclusively to children or women are that:
Fats and oils in the diet (including the supplementary ration plus other foods eaten) should provide20% of total energy intake of women of reproductive age and 30-40% of total energy for childrenup to 2 years of age, if they are not breastfeeding and 20% of total energy if they are breastfeeding.
! The protein needs of pregnant and lactating women are higher than those of non-pregnant/non-lactating women (7 grams per day (g/d) more during pregnancy and 14-19 g/d during lactation).On the other hand, the absolute protein needs of young children, are lower than the average in thepopulation overall (only 25-35 g/d).
As noted above, it is important that mothers be encouraged to breast feed their young children and notuse the donated foods to displace important breastmilk from the diet.
The likelihood that take-home rations will be shared with other family members (leakage) is high ifglobal household levels of food deficits are large (seasonally or year round). Past experience with foodaid programs or trial and error may be the best way to determine the quantity of calories to add to theration to account for leakage. Other ways to address leakage include education and selection rationsthat promote self-targeting, i.e. that are more likely to be consumed by the target group because ofincome, cultural or age-group characteristics. For more guidance on developing take-home rationpackages for women and children, refer to Module 1- MCHN Programs. HYPERLINK
Micronutrients: The micronutrient content of the ration package should also be considered,especially for nutritionally vulnerable target groups. All oil provided through Title II is fortified withvitamin A, an essential nutrient for the protection of the health of any population, but particularlyyoung children. Forty grams (40g) of the oil provided supplies 2,400 IU of vitamin A, which satisfieschildren’s full daily requirements and about 70% of adult requirements.
Whereas whole grain cereal, such as wheat and corn, are not fortified, all processed food cerealsprovided by Title II, with the exception of parboiled rice, are fortified with B vitamins (thiamin,riboflavin, folic acid, and niacin), vitamin A, calcium, and iron. Blended cereals (corn-soy blend andwheat-soy blend) are further fortified with zinc, B12, pantothenic acid, iodine, magnesium, vitamin C,vitamin D, and vitamin E.
The micronutrient content of blended cereals (see the Commodity Fact Sheets found in Part One of theCRG) are estimates.4 Because some of these vitamins are lost during storage and cooking, they do notaccurately reflect the quantities available to the body at consumption. For example, up to 40 percent ofvitamin A is lost from fortified cereals that is exposed for several months to heat, light and air.5Minerals are not subject to deterioration by environmental factors, however, their bioavailability in
4 However, U.S. manufacturers of dry food aid commodities are now required to produce fortified food with average lotvalues of not less than 80 percent of the vitamin values and 100 percent of mineral values as specified in Part One of theCRG. In refined vegetable oil, the vitamin A levels are mandated to be between 60 and 75 IU/gram.
5 SUSTAIN, Final Report of the Micronutrient Assessment Project. Washington, D.C. 1999.
COMMODITIES REFERENCE GUIDE MODULE 4-NEHA PROGRAMS
14
cereal can be greatly reduced by absorption inhibitors in the ration foods or in other foods commonlyconsumed, like tea and coffee.
2. Calculating the Total Amount of Food Commodities Needed
Once the ration package is determined, the total quantity of commodities needed can be calculated,usually in terms of metric tons (MT). To calculate the number of MT needed for each commodity in ageneral feeding or supplementary emergency ration package, use the following steps:
" Multiply the number of grams of the commodity per person per day times the total number ofpersons to receive the commodity.
" Multiply the total number of grams of the commodity times the number of days that the food willbe provided to the target group.
" Determine the number of MT of commodity needed by dividing the total number of grams perprogram period by 1,000,000 (number of grams in a MT).
" Complete the same calculation for each commodity (vegetable oil, cereal, cereal blend, or legume)that comprises the ration.
Box 3 below provides an illustrative example of how to calculate the total amount of commoditiesneeded to provide on-site feeding ration package to children ages 1 to 10 years a general feedingemergency ration package to 200 for one year (365 days).

COMMODITIES REFERENCE GUIDE MODULE 4-NEHA PROGRAMS
15
Box 3: Calculating Total Amount of Commodities Needed for On-Site feeding of 200Children 1-3 years for One Year (using the sample ration package in column 1 of Table 3).OIL1) Multiply grams of vegetable oil per person times 200 times 365 days
35 g oil x 200 = 7,000 g x 365 days = 2,555,000 grams
2) Divide the total number of grams of oil by 1,000,000 (the number of grams in a MT)2,555,000 g. ÷1,000,000 = 2.55 MT of fortified, vegetable oil
CSB3) Multiply grams of Corn Soy Blend cereal (CSB) person times 200 times 365 days.
150 g x 200 = 30,000 g x 365 days = 10,950,000
4) Divide the total number of grams of cereal-soy blend 1,000,00010,950,000 ÷ 1,000,000 = 10.95 or 11 MT of CSB
WHEAT FLOURMultiply grams of wheat flour per person times 200 times 365 days.
90 g wheat flour x 200 = 18,000 g x 365 days = 6,570,000 grams
5) Divide the total number of grams of wheat by 1,000,0006,570,000 ÷ 1,000,000 = 6.57 MT of wheat flour
PULSES6) Multiply grams of pulses per person times 200 times 365 days.
50 g x 200 = 10,000 g x 365 days = 3,650,000
7) Divide the total number of grams of pulses 1,000,0003,650,000 ÷ 1,000,000 = 3.65 MT of pulses
3. Determining Cost-effectiveness of Ration Packages
Cost may not be the primary factor in determining the ration package. Food preferences and energyrequirements for cooking (e.g., fuel wood, etc.) and potential market disincentives may outweigh costconsiderations. However, the cost-effectiveness of the commodity may help in determining whether itis cost-effective and/or appropriate for the food aid component of a NEHA program. CSs shoulddetermine the primary objective of the food aid program and conduct the appropriate cost-effectivenessanalysis.6
It is helpful to calculate the cost-effectiveness of desired commodities in terms of cost per unit ofnutritional value (1 kilocalorie or 1 gram of protein) or income transfer value (in U.S.$ to therecipient). This provides information about which commodities provide the most nutritional benefitsor highest contribution at the lowest cost to the project. (See the Overview chapter for an example ofsuch calculations as cost per nutrient value.)
6 Cost also refers to costs to the project associated with a. In some projects, in-country transportation and storage costs andspecial handling costs may be critical; however, these costs may be similar for most commodities. For each project, firstdecide which of these cost elements are most relevant.

COMMODITIES REFERENCE GUIDE MODULE 4-NEHA PROGRAMS
16
Cost-Effectiveness per Income Transfer Value: The cost-effectiveness per income value isdetermined by the value to the recipient compared to the overall cost of the program. For example, if arecipient receives a commodity that would cost them $0.40 in the local market, this is considered a$0.40 value to the family or local institution. If providing the same commodity only costs the program$0.33, the program would be cost-effective. A commodity is considered cost-effective if the cost ofproviding that commodity to a recipient is lower than the cost of the commodity in the local market.The more the commodity’s local market value exceeds the program cost, the more cost-effective theprogram. See Box 4 below for an illustrative example of how to calculate the cost-effectiveness ofincome transfer value.
Box 4- Example of An Illustrative Cost-Effectiveness Calculation
1) First, calculate the cost of one kg of wheat flour to the household or local institution if purchasedin the local market. This example uses the following (made up) figures:1 kg wheat flour = $0.40 cost to household for local market purchase.
2) Calculate the total program costs to provide one metric ton of wheat flour. This includes the costof the commodity plus transportation costs.
$228 (per MT) + $100 (transportation)* = $328
3) Then, divide the total program costs to provide one metric ton of flour by 1,000 (there are 1,000kilograms in a MT). The costs of one MT of wheat flour plus transportation costs are $328.$328 ÷ 1,000 = $0.328 or 33 cents (rounded) cost to program to provide 1 kilo wheat flour
Thus, for every $0.33 in program costs, the program is providing $0.40 value to the recipient. Ratioof local cost to program cost is $0.40 ÷ $0.33 = 1.2. The larger the ratio, the more cost-effective theprogram, i.e., the higher the dollar value to the consumer for every dollar of program cost.
*Transportation costs vary from situation to situation; a rule of thumb for development programs is to add 30-50% ofthe commodity for transportation costs.
During the initial planning period it is advisable to consider alternative rations as a contingencymeasure. For example, a desired commodity may not available, cannot be shipped in a timely manneror may not be appropriate for any number of unexpected reasons. The identification of a range ofacceptable commodities makes easier to design a variety of ration packages. Also, changes incommodity availability, prices, and packaging can alter the relative cost-effectiveness of rationpackages. It is useful to develop at least one alternative ration package so that it can be compared forcost and other trade-offs.Take into consideration the following when designing an alternative ration package:
" Select culturally acceptable and physiologically suitable foods for NEHA recipients.
" Design rations that meet specifications using no more than three commodities per ration, unlessgood reasons exist to use more commodities.
" Use commodities that provide the maximum gain to recipients at lowest cost to the project.

COMMODITIES REFERENCE GUIDE MODULE 4-NEHA PROGRAMS
17
" Based on the cost per unit of nutritional and/or income transfer value provided to the recipient,use the most cost-effective commodities and design at least one alternative package if a newproject is being planned.
" Compare the nutritional and/or income transfer values of currently used rations withspecifications and key suitability criteria.
STEP 5: RANKING AND SELECTION
It is important to rank ration packages commodities in order to select the most cost-effective andappropriate rations to meet program objectives. Cost plays a role in the size and effectiveness ofprojects. This calculation involves decisions about which cost elements to consider. At a minimum,the illustrative price list in Annex V and current in-country transportation and storage costs can beused. Other factors to consider are:
• Market disruptions: The Bellmon determination must ensure that the local market is notdisrupted. Market considerations in the local areas where programs are targeted might also comeinto play. For example, it may less disruptive to provide certain foods in the lean season ratherthan the harvest season. Guidance on conducting the Bellmon analysis may be found online atwww.usaid.gov/hum_response/ffp/bellmon.htm.
• Logistics and management: Some commodities may impose undue management or cost burdensdue to unusual local conditions (e.g., transportation, storage, handling, pilferage, accounting costs,etc.) or unsuitable packaging for the shelf life of the commodity.
The usual sources of data for considering potential market disruptions and logistical problems includepast evaluations of the same or similar programs, interviews with host government authorities andlocal and international PVOs as well as discussions with international organizations (such as the WorldBank, the United Nations), USAID, USDA Agricultural Attaches and Economic/Commercial Officersat U.S. Embassies.
Nutritional value, income transfer value, total cost, and other factors, such as potential marketdisruptions or logistical constraints can, now be ranked for the proposed and the alternative rationpackages. They might also be ranked by cost. Decisions to change ration packages can be made easilyand less arbitrarily when alternative rations and their main attributes have been worked out in advance.

COMMODITIES REFERENCE GUIDE MODULE 4-NEHA PROGRAMS
18
III. RESOURCE LIST
1. Food and Nutrition Technical Assistance (FANTA) Project, Academy for EducationalDevelopment, 1825 Connecticut Avenue, NW, Washington, D.C., 20009-5721. Tel: 202-884-8000; Fax 202-884-8432. E-mail: [email protected]; Web site www.fantaproject.org. FANTAhas the following guides:
# Agricultural Productivity Indicators Measurement Guide. Patrick Diskin# Anthropometry Indicators Measurement Guide (Draft). Bruce Cogill# Food For Education Indicator Guide (Draft). Joy Miller del Rosso and Gilles Bergeron# Food Security Indicators and Framework for Use in the Monitoring and Evaluation of Food
Aid Programs. Frank Riely, Nancy Mock, Bruce Cogill, Laura Bailey, and Eric Kenefick# Improving the Use of Food Rations In Title II Maternal/Child Health and Nutrition Programs
(Draft). Serena Rajabiun, Beatrice Rogers, Margarita Safdie, Anne Swindale# Infant and Child Feeding Indicators Measurement Guide. Mary Lung’aho# Measuring Household Food Consumption: A Technical Guide. Anne Swindale and Punam
Ohri-Vachaspati# Nutritional Care and Support for Persons Living with HIV/AIDS and other Affected Household
Members (forthcoming)# Potential Uses of Food Aid to Support HIV/AIDS Mitigation Activities in Sub-Saharan Africa.# Sampling guide. Robert Magnani
# Water and Sanitation Indicators Measurement Guide. Patricia Billig, Diane Benahmaneand Anne Swindale
2. Food Aid Management (FAM), 1625 K Street, NW, 5th Floor Washington, DC 20006. Tel:(202) 223-4860, Fax: (202) 223-4862; Web site www.foodaid.org. Provides USAID documents(FY 1990-ongoing).
3. Linkages Project. Facts for Feeding (English, Spanish, French). Academy for EducationalDevelopment, 1825 Connecticut Avenue, NW, Washington, D.C., 20009-5721. Tel: 202-884-8000; Fax: 202-884-8977; E-mail: [email protected]; Website: www.linkagesproject.org.
4. National Research Council. Recommended Dietary Allowances. National Academy Press,Washington, D.C., 1989.
5. SUSTAIN. Final Report of the Micronutrient Assessment Project. Executive Summaryavailable on web site: www.sustaintech.org.
6. USAID/BHR. U.S. International Food Assistance Report 1999. January 2000. Web site:www.usaid.gov/hum_response/farpt1999.
7. USAID/BHR. Commodities Reference Guide (CRG): Section 1-4. April 1999. Web site:www.usaid.gov/hum_response/crg.
8. USAID/BHR/FFP. Monetization Field Manual PL 480 Title II Programs. October 1998. Website: www.usaid.gov/hum_response/ffp/monetiz.htm.

COMMODITIES REFERENCE GUIDE MODULE 4-NEHA PROGRAMS
19
9. USAID/BHR/FFP. Title II Guidelines for Development Programs. January 2000. Web site:www.usaid.gov/hum_response/ffp/dappaa.htm.
10. USAID/CDIE. Performance Monitoring and Evaluation Tips. 1996. Web site:www.usaid.gov/pubs/usaid_eval/#02.
11. WHO. Energy and Protein Requirements: Report of a Joint FAO Expert Consultation.Geneva, 1985.
12. WHO. Management of Severe Malnutrition: A Manual for Physicians and Other SeniorHealth Workers. Geneva, 1999.
13. WHO. The Management of Nutrition in Major Emergencies. Geneva, 2000.

COMMODITIES REFERENCE GUIDE MODULE 5-EMERGENCY PROGRAMS
1
MODULE 5:EMERGENCY PROGRAMS
I. INTRODUCTION
The Office of Food for Peace’s (FFP) Strategic Objective #1 (SO) for emergency food aid programs isstated as “Critical food needs of targeted groups met.” This SO, in turn, directly supports the USAIDstrategic goal, “Lives saved, suffering associated with natural and man-made disasters reduced, andconditions necessary for political and/or economic development re-established”. Therefore, PL 480,Title II-funded emergency food aid programs should be designed and implemented with this strategicobjective in mind. Title II emergency food aid is used largely for three types of humanitarian crises: natural disasters;complex emergencies; and post-emergency situations. Natural disasters are crises caused by nature,such as floods, earthquakes, flooding, or drought. Complex emergencies generally arise fromprolonged civil strife, often exacerbated by climatic and other events, and are characterized byinsecurity, failure or the inability of host governments to respond effectively to assist refugees,internally displaced persons (IDPs) and other vulnerable groups. In post-relief situations, food aid isused to help facilitate resettlement, reintegration of ex-combatants, and in rejuvenating local foodproduction.1 In accomplishing the latter objectives, private and voluntary organizations (PVOs) andother recipient organizations may -- with FFP approval -- monetize a portion of the food aid for localcurrency required for an emergency program.
By meeting the critical food needs of vulnerable groups when a natural, man-made, or civil disasterstrikes, Title II emergency food aid can minimize human and economic losses and accelerate the returnto normalcy. Emergency food aid can also be an important vehicle in building the capacity for longer-term food security during the post-relief period.
During the design of emergency food aid programs, Cooperating Sponsors (CS) and USAID endeavorto: (1) target food aid to reach the most vulnerable populations in a timely and cost-effectivemanner; (2) undertake interventions that do not disrupt local production and do not encourage aiddependency; and (3) incorporate capacity-building activities to ease the transition from crisis torecovery and eventually to longer term development. Guidelines to assist in the selection and use offood aid commodities in emergency programs are outlined below.
II. GUIDELINES FOR COMMODITY SELECTION FOR EMERGENCYPROGRAMS
This Module sets forth in five steps how to choose the most appropriate and cost-effective rations toaccomplish emergency program objectives. This guidance is intended to be flexible enough to
1 USAID/BHR/Office of Food for Peace Emergency Division, PVO Guidelines for Title II Emergency Food Proposals andReporting, 1999 (Draft)

COMMODITIES REFERENCE GUIDE MODULE 5-EMERGENCY PROGRAMS
2
encourage the selection of food aid rations that are most appropriate for each emergency situation.Box 1 below identifies the five key steps in the commodity selection process:
Box 1: Five Steps for Selecting Food Rations:Step 1. Program DesignStep 2. Suitability of Food CommoditiesStep 3. Ration Specifications (Energy Requirements)Step 4. Ration Calculations
Step 5. Ration Ranking and Selection
STEP 1: PROGRAM DESIGN
The five key program design steps usually consist of the following: (1) conducting a needsassessment; (2) determining appropriate use of food aid; (3) identifying the target population; (4)developing program activity objectives; and (5) reaching decisions regarding the distribution mode andfrequency. These components are key elements for the development of Title II Emergency Food Aidproposals. These guidelines are primarily for use in determining rations selection and are not meant tobe rigidly proscriptive. For detailed guidelines on proposal development see FFP’s PVO Guidelinesfor Title II Emergency Food Proposals and Reporting (Draft) available on line atwww.usaid.gov/hum_response/ffp/emerg.htm. An explanation of each design component follows:
1. Conducting A Needs Assessment
All FFP emergency food aid requests must demonstrate the need for food as an appropriate response tothe emergency. A needs assessment should be carried out in a participatory and timely manner.Frequently, an in-country needs assessment is carried out on a joint basis involving several differentagencies, including the World Food Program and PVOs. This assessment is needed to determine thenature, extent, severity of the emergency (including, whenever possible, an indication of the degree ofmalnutrition), food accessibility and availability, and to identify factors that may impede effectiveutilization of food. The assessment should also describe the criteria for selecting the beneficiaries andgeographic areas to be targeted. Key to the assessment are good estimates as to whether local foodsmay be used to supplement the food aid ration package, and how donor and implementing agencieswill work together and what role U.S. food aid will play in satisfying the populations complete foodneed
Primary Data Collection: Data may be attained through primary sources such as food consumptionsurveys, nutritional status surveys, or rapid food security assessments. Qualitative data may becollected using techniques such as, in-depth interviews, focus group discussions, rapid appraisaltechniques, and observation verification of self-reported behavior by participating households. Keyinformants might include local health authorities, community leaders, teachers, or other knowledgeablemembers of the population. Tips for collecting primary data are provided in USAID/CDIE’sPerformance Monitoring and Evaluation Tips, which are available online at www.dec.org/usaid_eval.Other resources can be found in the Resource List at the end of this module.
Secondary Data Collection: Secondary data are available from several sources including: theUSAID/Africa Bureau-funded Famine Early Warning System (FEWS); UN Food and Agriculture
COMMODITIES REFERENCE GUIDE MODULE 5-EMERGENCY PROGRAMS
3
Organization (FAO) crop and food supply reports; UN World Food Program (WFP) food aidassessment reports; international and local PVO reports and other donor reports. Quarterly reports onthe nutritional status of refugees and internally displaced persons can be obtained in hard copy or onthe Internet from the Refugee Nutrition Information System (RNIS) of the United Nations Sub-Committee on Nutrition at http://acc.unsystem.org/scn/. The Health Information Network forAdvanced Planning (HINAP) of WHO’s Department of Emergency and Humanitarian Action providesbaseline health information, which is updated during an emergency at www.hinap.org. Additionalinformation can be collected from on-site from reports produced by the local government, the nationalhealth system, or other agencies.
The findings from the need assessments will naturally drive the program design process. Box 2 belowcontains examples of some possible general outcomes of an assessment.
Box 2- Examples of Assessment Outcomes
No Food Assistance When:There is only minor disruption in crop production or marketing systems or despite a minor orlocalized crop shortfall, the populations concerned are able to cope with the situation, or otherresource needs take priority.
Short-Term (Rapid Onset) Assistance When:Some food stocks may be lost, normal food supply/marketing systems may be disrupted, and/or cropsmay be damaged. Examples include situations immediately following earthquakes, floods, storms,fires, and short-duration civil disturbances. The duration may be as little as a few days or until thenext harvest or longer under certain circumstances.
Medium-Term Assistance When:It is not possible for the affected populations to return to normalcy within a period of 12 months orless. This includes massive crop failures and the inability of refugees or internally displaced persons(IDPs) to return home for security, political and other reasons.
Longer Term Title II Development Assistance When:Refugees and IDPs have returned to their home areas or when populations affected by drought, floodsand other natural disasters can resume productive agricultural activities. However, in this type of atransition situation, it is advisable for cooperating sponsors to consult with FFP prior to designing aPre-Development or Short Term Development Program or Development Program (DAP) proposal.
2. Determining the Appropriate Uses for Food Aid
The objectives of emergency food aid can vary. Some examples of objectives include: (a) to satisfythe nutritional requirements of vulnerable target groups; (b) to improve the nutritional status ofmalnourished individuals; (c) to enable affected households to maintain or resume livelihoodactivities; (d) to reduce sales of household assets to purchase food; and (e) to prevent mass migrationout of areas affected by drought and other natural disasters. Naturally, each of these different activitieswill involve different targeting rations, and exit criteria.

COMMODITIES REFERENCE GUIDE MODULE 5-EMERGENCY PROGRAMS
4
3. Identifying the Target Population
Plans for emergency food aid must include efforts to identify key characteristics of the recipientpopulations. The target beneficiaries may include entire populations of refugees, IDPs or persons whoremain in their home communities. Other programs may be targeted only to extremely vulnerablegroups within these populations, such as young children, lactating and pregnant women, the elderly,and certain livelihood groups or particular family units that have lost their source of income.
In emergency situations the size and circumstances of target groups can change quickly due to themovement of conflict zones, worsening drought conditions, encroaching floods, or other factors.These changing conditions naturally complicate planning and logistics, which can force changes to thesize of the target group or the size of the ration, method of transportation or distribution or food storagearrangements.
4. Developing Program Activity Objectives
Although each CS will approach the achievement of FFP Strategic Objective No. 1 (Critical FoodNeeds of Targeted Groups Met) in different ways, it is urged that cooperating sponsors (CSs) reviewUSAID’s Managing for Results terminology (see Annex 1 (HYPERLINK)) prior to drafting theproposal. Program objectives will be result statements, that is, a description of the end result to beachieved through the food aid intervention. One results-oriented objective might be “Improvednutritional status of target population.”
Each result statement should have at least one performance indicator to track progress. Performanceindicators are variables with a particular characteristic or dimension to measure progress towardachievement of the stated result. For example, an indicator for the objective, “Improved nutritionalstatus of target population” could be “average weight-for age- z-score within the target group”.Sample food security and nutrition indicators may be found in Annex II. USAID/CDIE’s PerformanceMonitoring and Evaluation Tips, available online at www.dec.org/usaid_eval, also provides guidanceon how to develop result statements and performance indicators. For purposes of USAIDhumanitarian goal monitoring in emergency situations, changes in the wasting (weight for height) ofchildren under five years of age and, if possible, the crude mortality rate are most important.
5. Determining the Distribution Mode and Frequency
Emergency food aid activities can generally be divided into two major categories: general fooddistribution and targeted food distribution.2 General distribution programs often provide fullnutritional support for emergency affected populations immediately after the onset of a humanitariancrisis. Food is distributed to all members of the population on a regular basis. Targeted food aidprovides food to only a segment of the emergency affected population, to meet the particular needs ofthe most nutritionally vulnerable households or individuals. These groups often include children,especially those under five; orphans or unaccompanied children; pregnant and lactating women; theelderly, the ill; the handicapped; those who are malnourished; or those displaced from their homes.
The distribution of targeted food aid can take any of several different forms, depending on thecharacteristics of the targeted group and contextual circumstances. Common examples of targeted 2 US International Food Assistance Report, 1999, p. 22 http://www.usaid.gov/hum_response/farpt1999

COMMODITIES REFERENCE GUIDE MODULE 5-EMERGENCY PROGRAMS
5
programs are supplementary feeding for malnourished children or pregnant and lactating women,therapeutic feeding for the severely malnourished, school feeding, and/or food-for-work.3 A combination of approaches may be necessary. For example, general feeding plus supplementaryfeeding for nutritionally vulnerable groups may be most effective in some situations. Programmingshould change over time to reflect positive or negative changes in circumstances that affect thepopulation’s ability to feed themselves. Similarly, the rations in a general feeding program may evolvefrom providing total daily requirements to providing only partial energy requirements and selectednutrients before being phased out completely in favor of targeted feeding for households least able tosustain themselves or food-for-work activities. In all phases of relief operations, the participation ofaffected populations, especially women, in ration determination, food distribution and monitoring isencouraged. This maximizes program efficiency and effectiveness and honors the dignity of therecipients. There are two primary emergency food aid distribution methods:
♦ On-Site (wet) Feeding: In this type of distribution, recipients are provided prepared food forconsumption on the spot. The most common examples of on-site feeding are therapeutic feeding ofseverely malnourished children and the feeding of children under two and a caregiver at communityfeeding centers. The advantage of on-site feeding is that food rations are eaten under supervision,which helps to ensure that the food supplement is actually consumed by the target population. Toobtain maximum nutritional improvement, two meals or a meal and a snack, 365 days per year aresuggested. The disadvantages are that on-site feeding is labor intensive and, therefore, not alwaysfeasible, and the likelihood is high that food may be withheld from beneficiaries at home because theyhave already eaten at a feeding center.
♦ Take-Home (dry) Rations: More commonly, uncooked food rations are distributed to be carriedhome for preparation and consumption. The advantages of take-home rations are that they are easier toadminister, more cost-effective, less time consuming, and can reach larger numbers of people.However, dry rations may be consumed by family members (leakage) other than the intendedbeneficiary, if the program is targeted on special vulnerable groups, or it may be sold/exchanged in themarket, thereby reducing their nutritional impact on the whole family. Yet, other critical needs of thehousehold may be satisfied this way. In some cases, a pre-cooked emergency food such as a highenergy, nutrient dense emergency relief biscuit or bar may be available. The advantage of these typesof products includes ease of handling and a set nutrient profile. While convenient, these foods are notrecommended for long term use. Refer to the specifications for these bars for their use andappropriateness.
When designing take-home rations for a targeted group, consideration must be given to the fact thatother family members will almost always share take-home rations. Some ways of addressing intra-household food sharing include education, increasing the ration package to accommodate sharing, orselecting ration commodities that are more likely to be consumed exclusively by the targetedindividuals. For example, blended cereals may be regarded as “baby food” and thus, less acceptablefor consumption by other family members..
The mode and frequency of distribution should be based on the accessibility to the target population,commodity transport and distribution costs, the nutritional profile of the target group, and the type and 3 US International Food Assistance Report, 1999, p. 22 http://www.usaid.gov/hum_response/farpt1999

COMMODITIES REFERENCE GUIDE MODULE 5-EMERGENCY PROGRAMS
6
quantity of rations. It is also important to consider the distance and travel time to and from the centerrequired for caregivers to pick-up and carry the food or the opportunities lost by beneficiaries andcaretakers while attending on-site feeding.
STEP 2: SUITABILITY OF FOOD COMMODITIES
Suitability is defined as those attributes of the individual ration recipient, target household, orcommunity that will affect their utilization of the foods provided. Judgment of ration foods’ suitabilityshould take into account traditional diets, food taboos, nutritional content, physiologicalappropriateness, resources for preparing the food for consumption, and the population’s ability toaccess other food. Food that is not accepted by the population or that cannot be readily prepared withresources available to the recipients will not be eaten, and, consequently, cannot effect the intendedresults.
It is critical that the design of an emergency program does not compromise the adoption of appropriateand recommended feeding and dietary practices including exclusive breast feeding for infants undersix months of age. The eligibility criteria for recipients, quantities, commodity mix, andrecommendations for use of the rations should be consistent with official government policies and withstandard practices used by USAID and the UN. Detailed recommendations for appropriate feedingpractices are available from USAID’s LINKAGES Project series titled Facts for Feeding atwww.linkagesproject.org.
Below are other key factors that should be examined carefully when choosing suitable rationcommodities:
Cultural suitability: It is important to consider women’s and children’s traditional diets, tastepreferences, food taboos, and feeding practices. Unfamiliar food may be made more acceptablethrough nutrition education, food processing, packaging, and/or by combining it with familiar foods inrecipes.
Nutritional content: This refers to the energy, fat, protein, and micronutrient content of the rations.There are certain nutritional considerations for women and children that should be examined whendesigning food rations. Young children, especially those up to 24 months of age, suffer linear growthfaltering (stunting) and delayed development that leaves permanent damage when they are notadequately nourished. Underweight children are also at much higher risk of death due to illness thanare their well-nourished counterparts. Although energy (kilocalories) is the main predictor of heightand growth, adequate micronutrients and protein for this age group are also important particularlyvitamin A.4
Pregnant and lactating women need extra energy, protein, and micronutrients to support the growth oftheir fetus or infant and maintain their own health. Pregnant women need the extra nutrients for thegrowing fetus and to ensure a healthy and safe birth outcome without depleting her own reserves andputting herself and her child at greater risk. While frequent, on-demand breastfeeding helps tomaintain the quantity of breastmilk, lactating mothers need extra energy and nutrients to produceoptimal quality breastmilk, to protect their own health, and to assure that their nutritional stores arepreserved or restored to support subsequent pregnancies. 4 WHO, Complementary Feeding of Young Children in Developing Country: a review of current scientific knowledge,1998

COMMODITIES REFERENCE GUIDE MODULE 5-EMERGENCY PROGRAMS
7
People with HIV/AIDS suffer from appetite loss (anorexia), eat less food and have difficulty eatingand therefore fail to meet their dietary requirements. HIV/AIDS also affects how the body uses thefoods that are consumed and this results in nutrient malabsorption. Fevers and the infections thataccompany an HIV infection also lead to greater nutrient requirements and poor use of the nutrients bythe body. There are several illnesses that are common with people living with HIV/AIDS and thatcause malnutrition. These include poor appetite or anorexia, losing weight, fever, diarrhea, frequentvomiting, oral thrush and other infections. Good nutrition for HIV affected people requires theconsumption of an adequate amount of macronutrients such as proteins, carbohydrates and fats, andmicronutrients, which include vitamins and minerals. A deficiency in macronutrients, also known asprotein energy malnutrition manifests itself in the weight loss and wasting that is typical of AIDSpatients. This weight loss and wasting occurs as a result of reduced food intake, nutrientmalabsorption and changes in metabolism. Vitamin A for HIV affected people is important for growth,immune function and maintenance of the lining of the respiratory, gastrointestinal, and gastro-urinaltracts. Consuming micronutrients especially vitamin A, B6, B12, iron, and zinc are important forbuilding a strong immune system and fighting infections. Consuming fortified foods like the cerealblends and vegetable oil fortified with vitamin A as well as taking micronutrient supplements at earlystages of HIV infection can slow weight loss and disease progression. In the case of vitamin A there isthe likelihood of reduced transmission between mother and child and slowing the progression of thedisease in infected people. Refer to the FANTA publication on “Nutritional Care and Support forPersons Living with HIV/AIDS and other Affected Household Members” at www.fantaproject.org.
Physiological appropriateness: Young children and the elderly require food that can be easilychewed and digested. In particular, infants and young children are unable to meet their caloric needsthrough high-bulk foods, such as cereals and legumes, due to their limited gastric capacity.5 See Box 3below for gastric capacity of children aged 6-24 mos. For example, infants between 9-11 months havea stomach capacity of 285 grams.6 If these infants are breastfed an average amount of breastmilk (659kcal7), they would need 168 grams of CSB to meet their additional caloric needs (1,290 kcal8 - 659kcal = 631 kcal). This amount of CSB yields about 1,400 grams of gruel (assuming the gruel is 12%CSB).9 If the infants are fed the gruel four times a day, they would need to consume 350 grams ofgruel at each meal to meet their supplemental caloric needs with only CSB. This amount is too muchfor their stomach capacity. Therefore, to assure that the infant’s energy needs are met, either the infantmust be fed less of this gruel more frequently or an energy-dense, low-bulk source of energy, such assugar or vegetable oil, must be added to the gruel. Children who are undernourished have an evensmaller stomach capacity.
5 ibid6 ibid7 WHO, Complementary Feeding of Young Children in Developing Country: a review of current scientific knowledge,19988 Per reference values in UNHCR/WFP”s Guidelines for Estimating Food and Nutritional Needs in Emergencies, 1997 p. 79 Per Commodity Fact Sheets, CRG, Section I

COMMODITIES REFERENCE GUIDE MODULE 5-EMERGENCY PROGRAMS
8
Box 3- Stomach Capacity of Children 6 to 23 months Well nourished: 6-8 months 249 g 9-11months 285 g 12-23 months 345 g Growth retarded 6-8 months 192 g 9-11 months 228 g 12-23 months 273 g Source: WHO, Complementary Feeding of Young Children in Developing Countries: a review of currentscientific knowledge, p. 61.
The viscosity of prepared foods for children less than 24 months should also be considered. Cerealsvary considerably in viscosity, and once prepared, can become thick and difficult for these youngchildren to eat. When mothers dilute the cereals to make them more edible for their children, they aresignificantly reducing the density of energy, protein, and micronutrients, increasing the volume ofintake that is necessary. For this reason, nutrient and energy dense soy-blended cereals are betterchoices for dilution than a one-grain cereal. Digestibility and/or food intolerance problems for thistarget group should also be taken into consideration as rations are selected.
Appropriateness to good feeding practices: The use of specific donated foods should be consistentwith appropriate feeding guidelines including exclusive breast feeding for infants under 6 months ofage and continued, frequent on-demand breast feeding to 24 months and beyond. For children 6 to 24months, it is important to gradually increase food thickness and add variety as the child ages.However, care must be taken to ensure that these foods complement rather than replace breastmilk. Inaddition to breast milk, children over 6 months of age should be feed other foods with the followingrecommendations:
! Provide 6 to 8 month old infants approximately 280 kcal per day from complementary foods.! Provide 9 to 11 month old infants approximately 450 kcal per day from complementary foods.! Provide 12 to 24 month old children approximately 750 kcal per day from complementary foods.
Feeding frequency is another important consideration. By combining meals and snacks, childrenshould be fed complementary foods with the following frequency:
! Feed complementary foods for 6 to 8 month old infants 2-3 times per day.! Feed complementary foods for 9 to 11 month old infants 3-4 times per day.! Feed complementary foods for 12 to 24 month old children 4-5 times per day.
Complementary foods can include the food aid commodity and should be programmed to ensure theyoung child has a diversified and nutritious diet. During illness, the child should continue to receivebreast milk and receive frequent and active feeding. Any feeding activity should be designed that the

COMMODITIES REFERENCE GUIDE MODULE 5-EMERGENCY PROGRAMS
9
young child is feed directly, slowly and patiently. Children should not be forced to eat.
For more information on young child and adolescent feeding, refer to the LINKAGES Project seriestitled Facts for Feeding (www.linkagesproject.org/pubs.html).
Availability of processing and/or storage facilities: Consider factors that will affect households’ability to prepare the food, such as access (distance and affordability) to mills, household food storagecapacities, access to fuel for cooking, and preparation time. The chosen foods should minimizepreparation demands, especially fuel wood demands because of the potentially negative environmentalimpact.
Characteristics and availability of locally produced food: Determine the timing of harvests andseasonal availability and affordability of local foods, and the affected population’s ability to accessthese foods. Imported Title II food aid should complement what is already available and accessible.
Food and cost effectiveness considerations: Ideally, the most cost-effective ration package toachieve the desired result should be selected. However, in rapid onset emergency situations, cost-effectiveness considerations may be overshadowed temporarily by the U.S. government’s overarchinghumanitarian response objective, which is to save lives and reduce human suffering as quickly aspossible.
STEP 3: RATION SPECIFICATIONS (ENERGY REQUIREMENTS)
1. General Food Distribution
Basic nutritional requirements for individuals vary according to age, sex and reproductive status.Nevertheless, for practical reasons, rations for general food distribution are usually distributedequitably for all persons, male and female of all ages. Therefore, the content of an individual rationpackage is based on the average per capita requirement. This presumes that the food can beredistributed within a household, which includes individuals some of whom have greater or lesser thanaverage requirements. The average per capita energy needs can be calculated using the demography ofthe affected population and age/sex-specific energy requirements.
However, at the onset of an emergency rapid response is essential and, generally, the demography ofthe population is not known. Therefore, to enable planning for quick response, the key internationalhumanitarian organizations have agreed to respond with rations that supply a default energyrequirement of 2,100 kcal/person/day, if the population is totally dependent on outside sources offood10. This default value was not selected arbitrarily. It is the average need based on the demographyof a “typical” developing country, and assumes that members of the population are of average(worldwide) body size, are engaged in light physical activity, and live in moderate climatic conditions.When planning for immediate response, the proposed ration package should meet this energyrequirement. In extreme cases, additional energy to cover high activity or severe cold should beconsidered. (See Box 4.) 10 This value was initially recommended by the Institute of Medicine (IOM) of the US National Academy of Science andhas been adopted by USAID, WFP, UNHCR, and their PVO partners. Refer to IOM’s “Estimated Mean per Capita EnergyRequirements for Planning Emergency Food Aid Rations” for the calculation of this default value.

COMMODITIES REFERENCE GUIDE MODULE 5-EMERGENCY PROGRAMS
10
As soon as possible after the onset of the emergency, the ration should be adjusted to reflect the truedemography of the population being served, and any good estimates of other reliable sources of foodTypically, when beneficiaries are registered for food rations their age and sex are recorded, and withina few months after the emergencies’ onset population breakdowns by relatively standard age/sexcategories are available. Using these data, average per capita energy requirements for the populationcan easily be calculated using the following guidelines:
To calculate the average per capita energy requirement in a population of known demographics (bystandard age/sex groups):
! Multiply the percentage of the population per age/sex group times the energy requirements for eachgroup. For example, if the percentage of girls 0-4 is six percent (per demographic data available),multiply 0.06 times 1250 kilocalories. (The energy requirements for each age/sex group can befound in Table 1 below.) Do this for each age/sex group.
! Sum the calculations of percentage X per capita energy requirements for all age groups.
! Multiply the Total Sum by 1.05 to account for the high fiber content of typical food aidcommodities (Atwater correction).11
The final adjusted sum is theoretically the average per capita energy requirement across the population.From that point, the energy content of rations should be based on the results of these calculations, i.e.,the default of 2,100 kcal/p/d should be replaced by the newly calculated average. Table 1 belowprovides a table for calculating the average energy requirement in a population of unknowndemography.
11 UNHCR/WFP. Guidelines for Estimating Food and Nutritional Needs in Emergencies. 1997

COMMODITIES REFERENCE GUIDE MODULE 5-EMERGENCY PROGRAMS
11
Other adjustments that reflect differences from assumed conditions (i.e., average body size, lightactivity, and temperate climate) should also be considered. Members of a population that are engagedin moderate or high activity (e.g., doing heavy manual labor or walking long distances to gather fuel),or are living in extremely cold climates, will need more energy. Simple formulas for adjusting theaverage per capita requirement are:12
" Add an extra 100 kcal/p/d for every five degrees below 20° C. (Note: this may be a seasonaladjustment)
" Add an extra 140 kcal/p/d for moderate activity levels and 350 kcal/p/d for heavy activity.
12 WHO. The Management of Nutrition in Major Emergencies. Geneva, 2000
Table 1: Calculation of Average Energy Requirements in Population of KnownDemography
Age/sex group% of
population X Requirement for
Age/sex group(kcal/d )
Girls 0-4 yrs X 12501 =Boys 0-4 yrs X 13201 =Girls 5-9 yrs X 1730 =Boys 5-9 yrs X 1980 =
Girls10-14 yrs X 2040 =Boys 10-14 yrs X 2370 =
Girls 15-18 yrs X 2120 =Boys 15-18 yrs X 2700 =
Non-pregnant female 19-59 yrs X 1990 =Pregnant female 20+ years2 X 2275 =
Male 19-59 yrs X 2460 =Female 60+ yrs X 1780 =Male 60+ yrs X 2010 =
SUM 100% 3 =
X 1.05 (Atwater correction) = Average Requirement =
1 For breast fed children, part of this energy is for the mother and the rest for complementary feeding of the child2 A crude estimate for % pregnant females = 4% of all females aged 19-59 yearsand for % non-pregnant females = 96% of all females aged 19-59 years

COMMODITIES REFERENCE GUIDE MODULE 5-EMERGENCY PROGRAMS
12
Adjustments based on extreme body size is also a consideration but will rarely be needed. Theadjustment may be upward (for populations of extremely large individuals) or downward (forpopulations of extremely small individuals).13
Finally, not every assisted population needs food aid to supply all of their daily needs. Except duringthe most acute stages of an emergency, many have access to other food. For example, as a displacedpopulation adjusts to their new environment or emergency conditions are mitigated, some findemployment and can buy food, and others gain access to land to farm and produce food. In these casesrations can be reduced, but reductions should be according to the type and quantity of food otherwiseaccessed. There is no simple formula to apply such adjustments. Each individual situation should beanalyzed in terms of food availability and the households’ ability to access that food. This requires acareful assessment of the household economy and food security.
In summary, the per capita energy content of rations for general feeding should equal the averagerequirement based on demography (or default of 2100 kcal/p/d) + activity level and/or temperatureadjustments +/- body size adjustment – energy provided by other food (see Box 4 below).
Box 4 - Formula for Determining Energy Content of and Individual Ration for AGeneral Feeding Program
Average Energy Requirement* + Activity Level/ Temperature Adjustments +/-Body size adjustment – Energy from other food = Total kilocalories per daily ration
* From demography or default of 2,100 kcal/p/d, if demography is unknown
2. Targeted Food Distribution
Targeted food distribution is designed to target only a segment of the emergency affected population,to meet the particular needs of the most nutritionally vulnerable households or individuals. Thesegroups often include young children, orphans or unaccompanied children, pregnant and lactatingwomen, and those who are malnourished or displaced from their homes. Young children are mostvulnerable to the cycle of malnutrition and infections and, therefore, should be the first target group toreceive supplemental food. Targeted feeding generally include supplementary feeding and/ortherapeutic feeding programs.
a) Supplementary Feeding
There are two types of supplemental feeding programs (SFPs): targeted and blanketed. Targeted SFPsare aimed at rehabilitating moderately malnourished target groups, preventing moderatelymalnourished groups from becoming severely malnourished, reducing the mortality and morbidity ofchildren under five, and providing food supplements to selected pregnant and nursing women andother individuals at risk. Targeted SFPs should be considered when:
13 WHO. The Management of Nutrition in Major Emergencies. Geneva, 2000

COMMODITIES REFERENCE GUIDE MODULE 5-EMERGENCY PROGRAMS
13
! There is a prevalence of 10-14 percent acute malnutrition among children (age 6 to 59 months)whose weight-for-height is below –2 Z scores or less than 80 percent of the median NCHS/WHOreference values and/or edema); or
! There is a prevalence of 5-9 percent acute malnutrition and widespread food insecurity and highrates of disease14
Blanketed SFPs are intended to prevent widespread malnutrition and excess mortality among at riskgroups. Blanket food distribution is most often directed to all children under a given age, pregnant andnursing mothers, the handicapped or elderly. Blanket SFPs are needed when:
! At the onset of an emergency general food distribution is not adequately meeting energy deficits;
! The prevalence of acute malnutrition among children <5 years of age is equal to or greater than 15percent;
! The prevalence of acute malnutrition among children <5 years is 10 - 14 percent, and there areaggravating factors, such as widespread food insecurity and/or disease;
! There is an increased rate of malnutrition due to seasonally induced epidemics; or
! There are cases of micronutrient deficiencies15
Guidelines for developing rations specifications for supplemental feeding programs are the same as forMaternal Child Health and Nutrition (MCHN) programs and can be found in Module 1- MCHNPrograms. HYPERLINK
b) Therapeutic Feeding
Although it is not within the scope of the CRG to discuss details of therapeutic feeding, a brief mentionmay be useful here. The objective of therapeutic feeding programs (TFP) is to provide intensivecurative care for severely malnourished recipients (primarily children with weight-for-height less than–3 Z score and/or edema). These programs should be closely supervised by qualified medicalprofessionals. The establishment of centers for therapeutic feeding should be considered when the rateof malnutrition among under-fives exceeds 10% and the capacity of existing facilities is exceeded. Forguidance on admission and practices of therapeutic feeding, see WHO’s The Management of Nutritionin Major Emergencies (see Resource List).
3. Income Transfer Value.
Food is seldom used in lieu of cash as an incentive or partial payment for work for the entire durationof an emergency-feeding program. However, especially while phasing out of an emergency program,rations may be designed to serve as an income transfer. For example, some food commodities with ahigh monetary value on the local market may be provided in order to reduce household spending onfood and thus free income to purchase other food or non-food essentials. However, in the light of cost 14 UNHCR/WFP Guidelines for Selective Feeding Programmes in Emergency Situations, 1999.

COMMODITIES REFERENCE GUIDE MODULE 5-EMERGENCY PROGRAMS
14
considerations, low value rations might also serve this purpose while reaching larger numbers ofpeople. Rations of this type are most commonly provided through a food-for-work program.Commonly, the minimum wage paid for work that is available in the area is the basis for determiningthe type and quantity of food in the ration, i.e., the market value of the ration should approximate theminimum wage. (See Module 2: Food for Work.) HYPERLINK
STEP 4: RATION CALCULATIONS
After determining the energy requirements of the ration package, the following may be determined:(1) type of ration package; (2) type and quantities of food commodities; and (3) the total tonnage ofcommodities needed.
1. Defining the ration package
Energy is the main macronutrient and is of primary concern for survival. However, two othermacronutrients that deserve consideration are protein and fat. Protein is important for growth andrecuperation from disease. While a ration package composed of sufficient energy and a range ofprotein-rich commodities (cereals, blended foods, legumes) usually provides a sufficient amount ofprotein, it is important to ensure that ration packages provide sufficient protein for nutritionallyvulnerable groups, such as young children and pregnant and lactating women. Fat is a rich source ofenergy and essential for health and the prevention of some diseases. Therefore, ration packages needto content a minimum amount of fat.
Vitamins and minerals, referred to collectively as micronutrients, are essential to the health of peopleof all ages, but especially for growing children and women during their reproductive years. Below aresome guidelines for defining the ration package by its nutritional content.
a) Macronutrients
For general rations: As with energy, the recommended protein and fat contents are averages of theneeds across a typical population of diverse ages. WHO’s recommendations are the following:16:
! The ration should include a mixture of cereal and pulse that provides a minimum of 46 grams ofprotein daily per person.17
! To cover the requirements for certain essential fatty acids, 17-20 percent of the ration energyshould be provided in the form of fats or oil, but no more than 10% of energy should come fromsaturated fatty acids (found in all animal fats and some vegetable oils).
For supplementary feeding: Ration content should reflect the protein and fat needs of the targetedportion of the population. However, remember that a supplementary ration, by definition, adds to foodfrom other sources, which also contribute fat and protein to the beneficiaries’ diets, i.e., thesupplementary ration does not supply all of the requirements of fat and protein. With regard to fat andprotein, guidance that should be considered in the design of ration packages for supplementary feedingtargeted exclusively to children or women are that: 16 WHO. The Management of Nutrition in Major Emergencies. Geneva, 200017 This is described as a “safe” input, i.e., the amount required to prevent deficiency disease

COMMODITIES REFERENCE GUIDE MODULE 5-EMERGENCY PROGRAMS
15
! Fats and oils in the diet (including the supplementary ration plus other foods eaten) should provide20% of total energy intake of women of reproductive age and 30-40% of total energy for childrenup to 2 years of age.
! The needs of pregnant and lactating women are higher than those of non-pregnant/non-lactatingwomen (7-10 grams per day (g/d) more during pregnancy and 14-19 g/d during lactation). On theother hand, the overall protein needs of young children, are lower than the average in thepopulation overall (only 25-35 g/d).
For more guidance on developing ration packages for women and children, refer to Module 1- MCHNPrograms. For the elderly, refer to Module 4- Non-Emergency Humanitarian Assistance Programs.
b) Micronutrients (vitamins and minerals)
People who have little or no access to fresh foods, and thus, are dependent solely on unfortifiedemergency food rations are at risk of developing micronutrient deficiencies. While assuring that thepopulation gain access to fresh food and vegetables by some other means than food aid is a moresatisfactory way to avoid deficiencies, in many cases, this is not possible. Especially during the acutephases of emergencies, while markets are not functioning and cultivation is interrupted, it is necessaryto cover as much of the daily requirements as possible by including fortified food commodities in thegeneral ration. When deficiency disease has already been identified in the population, the provision offortified foods is even more important. Objectives for supplementary feeding programs should includethe assurance of adequate intake of micronutrients by the most vulnerable groups, especially youngchildren and pregnant or lactating women (often because resources are not sufficient to provide for thewhole population). Regardless, the accessibility of fresh foods and the adequacy of intake of keymicronutrients by food aid beneficiaries should be examined carefully before designing emergencyrations.
All refined vegetable oil provided through Title II is fortified with vitamin A, a nutrient essential forthe protection of the health of any population, but particularly young children. Forty grams (40g) offortified vegetable oil potentially satisfies children’s full daily requirements and about 70% of adultrequirements. However, if the oil is used in dishes requiring high temperature frying, especiallyrepeated uses of the oil, the value of the vitamin A may be substantially less.
Whereas whole grain cereal, such as wheat and corn are not fortified, all processed food cerealsprovided by Title II, with the exception of parboiled rice, are fortified with B vitamins (thiamin,riboflavin, folic acid, and niacin), vitamin A, calcium, and iron. Blended cereals (corn-soy blend andwheat-soy blend) are further fortified with zinc, B12, pantothenic acid, iodine, magnesium, vitamin C,vitamin D, and vitamin E. Levels of fortification can be found in the Commodity Fact Sheets in Part Iof the CRG. HYPERLINK However, the values of vitamins reaching participants could besubstantially less depending on the storage and handling, and cooking. Losses of vitamin C inparticular can be substantial when cooked in relatively dilute gruel.
In order to fully satisfy the requirements for vitamins critical to the prevention of deficiency diseases,which have been observed in populations dependent on food aid for extended periods (beriberi- thelack of thiamin and pellagra- the lack of niacin), general ration packages should include 200 grams perperson per day (g/p/d) of blended food. This quantity is also adequate to protect against scurvyprovided losses in storage and cooking are not excessive. (In areas with particularly high vulnerability

COMMODITIES REFERENCE GUIDE MODULE 5-EMERGENCY PROGRAMS
16
to scurvy, e.g., the Horn of Africa, other vitamin C sources should be given a high priority byprogrammers.) To offer protection against iodine deficiency disease, 300 g/p/d of blended food wouldbe needed.
The micronutrient content of blended cereals (see the Commodity Fact Sheets found in Section II ofthe CRG) are estimates.18 Because some of these vitamins are lost during storage and cooking, they donot accurately reflect the quantities available to the body after consumption. For example, up to 40percent of vitamin A is lost from fortified cereals that is exposed for several months to heat, light andair. Minerals are not subject to deterioration by environmental factors, however, their bioavailabilityin cereal can be greatly reduced by absorption inhibitors in the ration commodities or in othercommonly consumed foods, like tea and coffee.
2. Choosing the type and quantities of food commodities:
a) General feeding rations: Initial response
Presented in Table 2 below are three combinations of the basic commodity types into daily per capitarations that meet the requirements for immediate response for general feeding in populations ofunknown demography (hence the use of 2,100 kcal/p/d energy requirement). These sample rationpackages have an appropriate balance of macronutrients (17-20% energy from fat and >46 g protein)and that provides essential micronutrients (although not 100% of requirements, except vitamin A).
The first selection is appropriate for populations that traditionally eat very little pulse, for example forsome Asian populations that traditionally use pulses (legumes) only in desserts. The second selectionis most appropriate where little cereal is eaten, for example where beans and tubers are the primarystaples. The third selection is included only to accommodate the cases when blended food is simplynot available. During an acute phase of an emergency, milled cereal or rice, not an unmilled cereal,should be provided because a population does not have access to milling facilities (either because oflocation or cost). This is especially relevant for displaced populations, who additionally do not havethe equipment to hand mill the grain. Note that in the third selection, it is critical that the cerealprovided is a fortified flour or meal as it does not include blended food.
18 However, U.S. manufacturers of dry food aid commodities are now required to produce fortified food with average lotvalues of not less than 80 percent of the vitamin values and 100 percent of mineral values as specified in Part One of theCRG. In refined vegetable oil, the vitamin A levels are mandated to be between 60 and 75 IU/gram.

COMMODITIES REFERENCE GUIDE MODULE 5-EMERGENCY PROGRAMS
17
Table 2: Three Combinations of Ration Packages
Selection 1- Ration Package with Fewer PulsesAmount Commodity Protein (g) Fat (g) Energy (kcal)
30 g Fortified oil 0 30 270
100g Blended food 17 7 376
350g Cereal flour19 orRice
30-35 3.5-6 1,260
60g Pulse 13 <1g 204
Total 60-65 41-4420 2,100
Selection 2- Ration Package with Cereal and LegumesAmount Commodity Protein (g) Fat (g) Energy (kcal)
35 g Fortified oil 0 35 315
100g Blended food 17 7 376
300g Cereal flour21 orRice
25-30 3-5 1,080
100g Pulse 22 <1g 340
Total 64-69 46-4822 2,111
Selection 3- Ration Package with No Blended FoodsAmount Commodity Protein (g) Fat (g) Energy (kcal)
40 g Fortified oil 0 40 360
400g Fortified cerealflour23
35-40 4-7 1,440
90g Pulse 20 <1g 306
Total 55-65 44-4724 2,106
19 If an unmilled cereal other than rice is used, then 10% more should be included to account for difference in energy andanother 10% for costs/losses during milling.20 1g fat = 9 kilocalories21 If unmilled cereal other than rice is provided, then 10% more should be added to account for the difference in caloriesand another 10% more for cost/losses during milling.22 1g fat = 9 kilocalories23 Without the blended food to supply micronutrients, only a fortified milled flour should be used.24 1g fat = 9 kilocalories

COMMODITIES REFERENCE GUIDE MODULE 5-EMERGENCY PROGRAMS
18
Things to keep in mind when designing rations for general feeding are:
Protein:- Cereal and pulse provide different types of protein, both of which are essential to a healthy diet. A
diet that includes no animal protein must include both cereal and pulse to assure intake of all of thedifferent amino acids needed for body growth and maintenance.
- In equal quantities of cereal and pulse, pulse caries about twice as much protein (about 22 g/100gof pulse versus 7-12 g/100g cereal).
- There are both cereal and pulse in blended foods, therefore, the protein they provide includes thefull range of amino acids needed.
Fat:- Among Title II commodities, fortified, vegetable oil is 100% fat and is the most dense source of
energy (1g = 9 kilocalories).- Blended foods also contribute fat Energy. (17% of calories from fat).
Micronutrients:- Among the Title II commodities, blended foods are the best sources of micronutrients, except
vitamin A.
- Fortified oil is the best source of vitamin A; 40 g of fortified oil protentially provides 100% ofchildren’s daily needs for vitamin A and about 70% of adults’ needs, assuming shipping andstorage times and cooking does not involve high temperature frying.
In some cases, micronutrient supplements may be provided by agencies in emergency situations. It isnecessary to determine the amount, type and frequency of Vitamin A supplements to ensure thatwomen and children are not provided excessive amounts. Check with the health and other providers toensure a joint response to meeting vitamin A needs.
b) General feeding rations: After more is known
Once the acute phase of an emergency has passed and the demography of the population is assessed,adjustments to the ration content should reflect this knowledge, either increasing or decreasing theenergy content accordingly. A presentation of the demographics and the calculation of average energyrequirements should be included in proposals for general rations for emergency affected populations,except for cases of rapid response or when the population is too mobile or too remote for accurateassessment (e.g., for internally displaced within a zone of conflict).
As food production and market activity resumes, food needs may diminish in terms of energy. Thecompositional needs, in terms of protein, fat and micronutrients, should reflect deficits afterdetermining the contributions of other foods. This will depend on the type and quantities of foods thatare available locally and how well households in the beneficiary population are able to access thatfood. In proposals for rations of other than the recommended content of fat and protein or the absenceof fortified foods, there should be some demonstration of knowledge about the other food accessed bythe majority of targeted households that justifies the difference.

COMMODITIES REFERENCE GUIDE MODULE 5-EMERGENCY PROGRAMS
19
c) Supplementary feeding rations
The choice and quantities of food commodities for supplementary feeding programs for emergenciesare similar to those in other contexts. See Module 1-MCHN Programs and Module 4-Non-EmergencyHumanitarian Relief for more about the design of rations for this purpose.
3. Calculating the Total Amount of Food Commodities Needed
Once the ration package is determined, the total quantity of commodities to satisfy the needs of apopulation totally dependent of food aid can be calculated using the default energy requirement of2100 kcal/person/day. To calculate the number of metric tons (MT) needed for each commodity in ageneral feeding or supplementary emergency ration package, use the following steps:
" Multiply the number of grams of the commodity per person per day times the total number ofpersons to receive the commodity.
" Multiply the total number of grams of the commodity times the number of days food will beprovided to the target group.
" Determine the number of MT of commodity needed by dividing the total number of grams perprogram period by 1,000,000 (number of grams in a MT).
" Complete the same calculation for each commodity (vegetable oil, cereal, cereal blend, or legume)that comprises the ration.
Box 5 below provides an illustrative example of how to calculate the total amount of commoditiesneeded to provide a general feeding emergency ration package to 100,000 people for six months.These amounts would be adjusted downward once reliable estimates of other sources of food availableto the general population, and other factors shown in Box 4 can be estimated.

COMMODITIES REFERENCE GUIDE MODULE 5-EMERGENCY PROGRAMS
20
Box 5: Calculating Total Amount of Commodities Needed for a General FeedingEmergency Ration Package (Selection 1 from Table 2) to a Beneficiary Population of100,000 for Six Months.
OIL1) Multiply grams of vegetable oil per person times 100,000 times 180 days
30 g oil x 100,000 = 3,000,000 x 180 = 540,000,000 grams
2) Divide the total number of grams of oil by 1,000,000 (the number of grams in a MT)540,000,000 g. ÷1,000,000 = 540 MT of fortified, vegetable oil
WSB3) Multiply grams of blended wheat soy blend (WSB) cereal per person times 100,000 times 180
days.100 g of WSB x 100,000 = 10,000,000 x 180 = 1,800,000,000 grams
4) Divide the total number of grams of WSB by 1,000,0001,800,000,000 ÷ 1,000,000 = 1,800 MT of WSB
RICE5) Multiply grams of rice per person times 100,000 times 180 days.
350 g x 100,000 = 35,000,000 x 180 = 6,300,000,000
6) Divide the total number of grams of rice by 1,000,000630,000,000 ÷ 1,000,000 = 6,300 MT of rice
PULSE7) Multiply grams of pulses per person times 100,000 times 180 days.
60 g x 100,000 = 6,000,000 x 180 = 108,000,000
8) Divide the total number of grams of pulses by 1,000,000108,000,000 ÷ 1,000,000 = 108 MT of pulses
STEP 5: RANKING AND SELECTION
Still taking into consideration the nutritional content and suitability of the commodities (Steps 2 and 3),the next most important consideration when choosing ration packages is cost-effectiveness andappropriateness for meeting program objectives. When examining the primary cost elements, theillustrative price list of commodities Annex V can be used. Other cost factors to consider are:
• Minimizing Market Disruptions: Even with emergency food aid programs, an analysis should bedone, (the Bellmon determination) to confirm that local markets will not disrupted. For example, itmay be less disruptive to provide certain foods in the lean season rather than during the harvestseason. In fact, every effort should be made to use Title II food aid to increase the productivity ofthe targeted groups (adequate food intake leads to improved health, which then leads to increased

COMMODITIES REFERENCE GUIDE MODULE 5-EMERGENCY PROGRAMS
21
productivity) and to promote local agricultural production. Guidance on conducting the Bellmonanalysis may be found online at www.usaid.gov/hum_response/ffp/bellmon.htm.
• Logistics, Packaging and Storage Considerations: The Bellmon determination should include an
assessment of in-country transportation and storage capacity. Some commodities may imposeundue management or cost burdens due to unusual local conditions (e.g., transportation, storage,handling, pilferage, accounting costs, etc.), unsuitable packaging or a limited shelf life of thecommodity.
The usual sources of data for considering potential market disruptions and logistical problems includepast evaluations of similar programs, interviews with host government authorities, and local andinternational PVOs and discussions with international organizations (such as the World Bank andUnited Nations agencies), USAID missions, USDA Agricultural Attaches and Economic/CommercialOfficers at U.S. Embassies.
The final step is to rank the alternative ration packages by nutritional value, cost, and other factors,such as potential market disruptions and logistical factors. Decisions to change ration packages areeasier when alternative rations and their main attributes have been examined in advance.

COMMODITIES REFERENCE GUIDE MODULE 5-EMERGENCY PROGRAMS
22
III. RESOURCE LIST
2. Collins, Duffield & Myatt. Assessment of Nutritional Status in Emergency Affected (Adults)Population. July 2000.
3. Food and Nutrition Technical Assistance (FANTA) Project, Academy for EducationalDevelopment, 1825 Connecticut Avenue, NW, Washington, D.C., 20009-5721. Tel: 202-884-8000 Fax 202-884-8432. E-mail: [email protected]; Web site www.fantaproject.org. FANTA hasthe following guides:
# Agricultural Productivity Indicators Measurement Guide. Patrick Diskin# Anthropometry Indicators Measurement Guide (Draft). Bruce Cogill# Food For Education Indicator Guide (Draft). Joy Miller del Rosso and Gilles Bergeron# Food Security Indicators and Framework for Use in the Monitoring and Evaluation of Food
Aid Programs. Frank Riely, Nancy Mock, Bruce Cogill, Laura Bailey, and Eric Kenefick# Improving the Use of Food Rations In Title II Maternal/Child Health and Nutrition Programs
(Draft. Serena Rajabiun, Beatrice Rogers, Margarita Safdie, Anne Swindale# Infant and Child Feeding Indicators Measurement Guide. Mary Lung’aho# Measuring Household Food Consumption: A Technical Guide. Anne Swindale and Punam
Ohri-Vachaspati# Nutritional Care and Support for Persons Living with HIV/AIDS and other Affected Household
Members. (forthcoming)# Potential Uses of Food Aid to Support HIV/AIDS Mitigation Activities in Sub-Saharan Africa.# Sampling guide. Robert Magnani# Water and Sanitation Indicators Measurement Guide. Patricia Billig, Diane Benahmane and
Anne Swindale
4. FANTA/Food Aid Management. Enhancing the Nutritional Quality of Relief Diets, WorkshopProceedings, April 28-30, 1999. Available at www.fantaproject.org.
5. Linkages Project. Facts for Feeding (English, Spanish, French). Academy for EducationalDevelopment, 1825 Connecticut Avenue, NW, Washington, D.C., 20009-5721. Tel: 202-884-8000; Fax: 202-884-8977; E-mail: [email protected]; Website: www.linkagesproject.org.
6. Institute of Medicine, Estimated Mean per Capita Energy Requirements for PlanningEmergency Food Aid Rations. National Academy Press. Washington, D.C., 1995. Web site:www.nap.edu.
7. SUSTAIN, Final Report of the Micronutrient Assessment Project, 1999. Executive Summaryavailable on Website: www.sustaintech.org.
8. The Sphere Project. Humanitarian Charter and Minimum Standards in Disaster Response.2000. E-mail: [email protected]; Web site: www.sphereproject.org.
9. USAID/BHR. U.S. International Food Assistance Report 1999. January 2000. Web site:www.usaid.gov/hum_response/farpt1999.

COMMODITIES REFERENCE GUIDE MODULE 5-EMERGENCY PROGRAMS
23
10. USAID/BHR. Commodities Reference Guide (CRG): Section 1-4. April 1999. Web site:www.usaid.gov/hum_response/crg.
11. USAID/BHR/FFP. PVO Guidelines for Title II Emergency Food Proposals and Reporting(Draft). 1998. Web site: www.usaid.gov/hum_response/ffp/emerg.htm.
12. USAID/CDIE. Performance Monitoring and Evaluation Tips. 1996. Web site:www.usaid.gov/pubs/usaid_eval/#02.
13. USAID/Office of Foreign Disaster Assistance (OFDA). Field Operations Guide (FOG) forDisaster Assessment and Response. November 1998. www.usaid.gov/ofda/fog/.
14. UNHCR/WFP. Guidelines for Estimating Food and Nutritional Needs in Emergencies.December 1997. Web site: www.univ-lille1.fr/pfeda/Infos/1999/0327wfpE.htm.
15. UNHCR/WFP. Memorandum of Understanding on the Joint Working Arrangements forRefugee, Returnee and Internally Displaced Persons Feeding Operations. 1997 Web site:www.wfp.org/eb_public/EB.2_97_English/eitem3_c1.html.
16. UNHCR/WFP. Guidelines for Selective Feeding Programs in Emergency Situations. Rome.February 1999. Available online at: www.wfp.-org/OP/guide/PolGuideSelect.html.
17. WHO Regional Office for the Eastern Mediterranean. Field Guide on Rapid NutritionalAssessment in Emergencies. Alexandria, 1995.HO. The Management of Nutrition in MajorEmergencies. Geneva, 2000.
18. WHO. Management of Severe Malnutrition. Geneva, 1999.
20. Woodruff & Duffield. Assessment of Nutritional Status in Emergency-Affected Populations(Adolescents). July 2000 at www.acc.unsystem.org/scn/.

COMMODITIES REFERENCE GUIDE ANNEX 1 – USAID DEFINITIONS
1
ANNEX I : DEFINITIONS(Source: USAID;s Automated Directives System and Food Aid Management’s Lexicon)
A. USAID TERMINOLOGY
Activity Manager: That member of the strategic objective or results package team designatedby the team to manage a given activity or set of activities. Member of an SO Team or sub-team who is responsible for the day-to-day management of one or more specific activity(s).The Activity Manager is selected by the SO Team, and may or may not also have the delegatedauthorities of a Cognizant Technical Officer (CTO), whose authority to carry out contractmanagement functions are delegated from a Contracting or Agreement Officer.
Agency Goal: A long-term development result in a specific area to which USAID programscontribute and which has been identified as a specific goal in the Agency Strategic Plan (ASP).
Agency Objective: A development result that contributes to the achievement of an Agencygoal as defined in the ASP.. Agency objectives generally denote preferred approaches or areasof emphasis for programs that support specific goals. Agency Objectives provide a generalframework for more detailed planning that occurs for specific country and regional programs.
Agricultural Commodity: Agricultural commodity is defined in the Farm Bill as anyagricultural commodity or products thereof produced in the United States.
Annual Estimate of Requirements (AER): The food budget proposal submitted by a PVO toA.I.D. that indicates who will receive food, how much, and how often. It provides thefoundation on which call forwards of commodities are based.
Automated Directives System (ADS): The ADS comprises USAID’s official, writtenguidance to its employees on policies, operating procedures, and delegations of authority forconducting Agency business. The ADS replaces the old AID Handbook System. The ADS isintended to help Agency employees understand their responsibilities and achieve the Agency’sdevelopment goals, consistent with applicable rules, sound policy, and management practices.http://www.usaid.gov/pubs/ads/
Basic Foods: These constitute the main bulk of rations in emergency operations, and providethe majority of energy, protein, and fat required by recipients. These foods include staples(wheat, maize, sorghum, roots, tubers, etc.), vegetable oil, and protein-rich foods (e.g. pulses).
Bellmon Analysis and Determination: A Bellmon Analysis is required by US Federal law todetermine that adequate storage facilities are available in the recipient country to prevent thespoilage or waste of commodity and importation of the commodity will not result in asubstantial disincentive to or interference with domestic production or marketing in thatcountry. The analysis also takes into account the Usual Marketing Requirement (UMR) ofUnited States commercial commodities to ensure that there is no interference with thisrequirement. A Bellmon Determination is supported by a Bellmon Analysis, which isprepared prior to the initiation of any PL 480 programs. In countries where PL 480
COMMODITIES REFERENCE GUIDE ANNEX 1 – USAID DEFINITIONS
2
commodities are already being programmed, the CS reviews the existing Bellmon analysis todetermine whether the marketplace can absorb the additional commodities, and whetherstorage is adequate. In countries where no PL 480 program is operating, the CS must conductits own Bellmon analysis, unless an analysis has been or is being carried out by USAID. TheBellmon Determination must be recertified each year. For multi-year development programs,the Bellmon analysis must be updated annually by the CSs.
Bills of Lading (B/L): Document used by exporters, importers and functional intermediariesto establish contract of carriage, receipt for the goods carried, and the transfer of legal title tothe goods carried.
Blended Foods : PL 480 foods consisting of finely granulated precooked cereal flour, soyflour, and grains fortified with vitamins and minerals. These have shorter cooking time, easierdigestibility, higher donor cost, and shorter shelf life.
Bulk commodities: Commodities that are not processed, fortified, or bagged. Whole wheat,corn, and beans are commodities that can be provided in bulk form.
Call Forward: A request initiated by the Field Office of a Cooperating Sponsor to AID forthe delivery of a specified amount of food commodities to a particular country program for useover a specified period of time. A Call Forward can be made only after the DAP and AERhave been approved. In response, USDA solicits bids, and arranges procurement and shipping.USDA notifies the PVO shipping department of the purchase order, the port of arrival and theestimated time of arrival.
Cargo Preference : Requirement that commodities supplied by the USG must be shipped onUS-flag vessels, as established by the Merchant Marine Act of 1936 (section 901b).
Certificate of Inspection: Document certifying the condition of goods at a particular point oftransit.
Certificate of Origin: A certificate stating the country in which a commodity has been grown,milled, produced, manufactured or assembled.
Chronic Food Insecurity: A state of food insecurity that arises and endures as a result of longterm, not easily changed conditions, such as access to land. (See also Transient FoodInsecurity)
Chronic Food Insecurity Indicators : Measurement of chronic food insecurity, which reflectsresources access and socio-economic constraints.
Chronic Vulnerability: Long-term conditions that predispose a particular group or region tofood insecurity.

COMMODITIES REFERENCE GUIDE ANNEX 1 – USAID DEFINITIONS
3
Clearing and Forwarding Agent : Licensed individual or firm who takes responsibility forpassing documents to customs and port authorities, and often for moving the commodities outof port to warehouses.
Commodity Credit Corporation (CCC): Operating unit of the US Department ofAgriculture, under the management of an Undersecretary for International Affairs andCommodity Programs, that manages export credits, surplus stocks and acquisition ofcommodities for PL 480 and Section 416(b) purposes.
Commodity Eligibility List: AID circular listing PL 480 commodities available to be calledforward.
Cooperating Sponsor (CS ): Any foreign government, U.S. registered voluntary agency, orintergovernmental organization, which enters into an agreement with the U.S. Government forthe use of P.L. 480 Title II, agricultural commodities and/or funds, including local currencies.
Cost and Freight (C&F): A pricing term indicating that the cost of the goods and freightcharges is included in the quoted price. The supplier must pay the costs and freight necessaryto bring the goods to the named destination, but the risk of loss or damage to the goods, as wellas of any cost increases, is transferred from the seller to the buyer when the goods pass theship's rail in the port of shipment. The buyer must purchase shipping insurance against the riskof loss and damage.
Cost, Insurance and freight (CIF): The value of procuring, loading, shipping and coveringrisk on commodities to a foreign destination. The seller is obligated to cover the cost of thegoods, the freight charges to the named port, the freight charges to the overseas destination,and the cost of insurance against loss.
Counterpart : An entity, indigenous to the country in which a Title II program is conducted,which is associated with and is sometimes sponsored by the cooperating sponsor in theimplementation of an approved Title II program.
Demurrage : Excess time for loading or unloading a vessel, railroad car, truck, etc. beyond thetime agreed upon, and the penalties and liabilities related by contract to such detention.
Development Activity Proposal (DAP): The document prepared by a CS and submitted toFFP requesting funding for the implementation of a Title II program in a particular country orregion. A DAP may seek approval to implement the proposed program for up to five years.
Discharge Survey: A report prepared by an independent commercial firm based on athorough examination of the cargo when it is discharged from the vessel at the destination port.Contains an accounting of the quantity discharged in sound and in damaged condition withdetails relating to the nature and extent of the damage, as well as the probable cause of damage.

COMMODITIES REFERENCE GUIDE ANNEX 1 – USAID DEFINITIONS
4
Docket: The quarterly list of commodities available to cooperating sponsors from which todesign, program and call forward categories of food. Also includes procurement prices perMT, indicating the relative efficiency of using any commodity and suggestive of the amount ofthe commodity that may be approved.
Dunnage : Materials placed adjacent to or beneath stacked goods to secure them in place or toallow for ventilation during transport or storage.
Duty Free: Exempt from all customs, excise, and other duties, tolls, taxes, or governmentimpositions levied on the act of importation or the commodities imported.
Emergency: An urgent situation in which a population is in imminent danger of increasedmalnutrition and mortality as a result of food shortages. It is usually caused by an event thatresults in human suffering and dislocation in the life of a community on an exceptional scale,and one, which the community or other authorities are unable to remedy without substantialexternal assistance.
Emergency Operations Program (EMOP) – World Food Programme (WFP): Themechanism whereby WFP provides emergency food for the victims of sudden disasters orabnormal droughts, and initial assistance to refugees and displaced persons.
Endowments: Financial mechanisms through which sales proceeds are deposited into aninterest-bearing account with only the interest earned used to finance project activities.
Entitlement: An individual’s endowment or initial resource bundle, which is transformed viaproduction and trade into food or commodities which can be exchanged for food. (Sen 1981)
Evaluation: A relatively structured analytical effort undertaken selectively to answer specificmanagement questions regarding USAID-funded assistance programs or activities. Evaluationfocuses on why results are or are not being achieved, on unintended consequences, or on issuesof interpretation, relevance, effectiveness, efficiency, impact, or sustainability. It addresses thevalidity of the causal hypothesis underlying strategic objectives and embedded in resultsframeworks. Evaluative activities may use different methodologies or take many differentforms, e.g. ranging from highly participatory review workshops to highly focused assessmentsrelying on technical experts.
Exchange Rate: Also "rate of exchange"; the price at which one currency can be bought withanother currency or commodity such as gold. Ideally, the rate is determined by supply anddemand in the foreign exchange market, but is frequently fixed by government.
Excise Tax: A form of sales tax on certain commodities.
Export Enhancement Program: Export subsidies for US farmer to export grains and oilseedsauthorized by the 1985 Farm Bill. Designed to compete with the export subsidy programs ofthe EC, the EEP lowered previously high domestic US support prices and used on-hand surplusof agricultural inventories to subsidize exports.

COMMODITIES REFERENCE GUIDE ANNEX 1 – USAID DEFINITIONS
5
Fair Market Price: Also "competitive market price"; in monetization, a sales price thatreflects the value of a similar commodity in the same market and, as such, does not place localproducers or traders at a marketing disadvantage.
Famine Early Warning System (FEWS): A generic term that includes methods of advanceforecasting of food insecurity and famine using satellite imagery and ground-level crop,demographic and market observations. FEWS is also a USAID Africa Bureau-funded projectthat aggregates remotely sensed and in country collected data, which is then analyzed. Theresulting information is given to decision-makers to assist them in choosing timely emergencyinterventions in African countries. More detailed information on FEWS may be found onlineat http://www.fews.org/
Field Operations Guide for Disaster Assessment and Response (FOG): The FOG wasdevelopment by USAID’s Office of Foreign Disaster Response (OFDA) as a reference tool forindividuals sent to disaster sites to perform initial assessments or to participate as members ofan OFDA Disaster Assistance Response Team (DART). The FOG contains information ongeneral responsibilities for disaster responders, formats and reference material for assessingand reporting on populations at risk, DART position descriptions and duty checklists, sampletracking and accounting forms, descriptions of OFDA stockpile commodities, generalinformation related to disaster activities, information on working with the military in the fieldand a glossary of acronyms and terms used by OFDA and other disaster response andhumanitarian relief organizations.
Food Aid: Edible commodities donated to needy populations. U.S. government food aid isauthorized under the agricultural appropriations bill, not foreign operations.
Food Aid Consultative Group: Established by Section 205 of the 1990 Farm Bill, this groupis to meet regularly and make recommendations regarding Title II regulations, guidance andprocedures. Included in the group are the AID Administrator, the USDA Under Secretary forInternational Affairs and representatives of each PVO participating in the Title II program orreceiving planning assistance funds, plus representatives from indigenous PVOs in recipientcountries.
Food, Agriculture, Conservation and Trade Act (Farm Bill, FACT Act): Public Law101-624 passed by Congress in 1990 that extends USG loans and grants of commodities todeveloping countries for five years (1991-1996). Food resources are directed to five purposes:a) to combat world hunger and malnutrition and their causes;b) to promote broad based, equitable and sustainable development;c) to expand international trade;d) to develop and expand export markets for US commodities;e) to foster the development of private enterprise and democratic participation in developingcountries.

COMMODITIES REFERENCE GUIDE ANNEX 1 – USAID DEFINITIONS
6
Food and Agriculture Organization of the United Nations (FAO): UN agency respons iblefor promoting agricultural development, dissemination of advanced agricultural techniques,combating plant/livestock diseases, promoting soil conservation, tracking global trends in foodproduction and consumption, monitoring food deficit problems, and to promote sharing ofknowledge in food processing, and food safety. The Global Information and Early WarningSystem (GIEWS) of FAO estimates food production and food needs in famine-prone countries.
Food Deficit Countries: Countries where food supplies are not sufficient to meet thepopulation's demands. Neither do they produce enough nor do they have sufficient foreignexchange to pay for imports needed to meet the country's food demand.
Food for Peace: The general term applied to the food-donation program authorized by theAgricultural Trade Development and Assistance Act of 1954 (P.L. 480), as amended.
Food for Peace Officer (FFPO): USAID representative who advises and assists the mission,PVO, and counterpart personnel on P.L. 480 matters and who oversees, monitors, and managesTitle II projects and activities.
Food for Progress Act: Section 1110 of the Food Security Act of 1985, as amended,authorizing use of Title I and Section 416 resources to assist emerging democracies anddeveloping countries which are committed to expanding free enterprise by liberalizingcommodity pricing, marketing, input availability, distribution, and private sector involvement.USDA is responsible for this program.
Food Security: The 1990 Farm Bill first identified the concept of food security as anobjective of U.S. food assistance programs. In the Bill, food security was defined simply as“access by all people at all times to sufficient food to meet their dietary needs for productiveand healthy life.” The USAID Food Aid and Food Security Policy Paper (1995) and the U.S.Position Paper for the World Food Summit in Rome, Italy (November, 1995) further expandedand refined the definition to encompass the three dimensions of access, (individuals andhouseholds have the resources to acquire appropriate foods for nutritious diet), availability(sufficient quality of appropriate quality food supplied via domestic production or imports) andutilization (adequate food diet available with water, sanitation and health care). Through theWorld Food Summit, this definition has been accepted by most nations. The USAID Food Aidand Food Security Policy Paper may be found online athttp://www.usaid.gov/hum_response/ffp/fspolicy.htm
Free Alongside Ship (FAS): Transport term whereby seller is obligated to procure anddeliver goods alongside the vessel, and clear them for export.
Free on Board (FOB): Export price including loading and port charges. The seller isobligated to place the goods aboard a named carrier at a specified port, obtain a clean bill oflading attesting to this performance, and pay the freight charges of inland carriers.

COMMODITIES REFERENCE GUIDE ANNEX 1 – USAID DEFINITIONS
7
Global Programs or Activities: Global programs or activities refer to USAID programs oractivities which take place across various regions, (i.e. they are trans-regional in nature).These types of programs are most often managed by central operating bureaus such as BHR orthe Global Bureau.
Guaranteed Export Credit (GSM 102/3): USG program whereby the USDA (CCC)guarantees commercial loans for foreign purchases of US commodities.
Humanitarian Assistance: Is a broad term that includes all types of external aid to respond toas well as prevent, mitigate, and prepare for, humanitarian emergencies.
Indigenous Coping Strategies: Activities and behavior patterns adopted by households underthe stress of food insecurity, including reducing food consumption, engaging in wider-rangingmigration in search of wage labor possibilities and food assistance, dry season farming,sending children off to stay with distant relatives, reducing recreational activity, and sellingassets including tools, land, and homes.
Initial Environmental Examination (IEE): When an AID funded activity has the potential toaffect the environment, documentation is required in the form of an IEE to determine whetheror not the activity will have significant adverse environmental impact. The IEE must besubmitted with a DAP or TAP, and is updated annually through an Environmental StatusReport (ESR) submitted with the PAA.
Inland Transport: The activity or cost of moving food from ocean port to the first point ofdelivery in the country within which distribution or sale will occur.
Intermediate Result: An important result that is seen as an essential step to achieving aStrategic Objective. Intermediate Results (IRs) are measurable results that may capture anumber of discrete and more specific results. IRs may also help to achieve other IntermediateResults. .
Internal Transport, Storage and Handling (ITSH): The major complementary expenses ofmoving food within a recipient country from port to final distribution, as paid for out of the PL480 account ITSH funds are awarded by FFP to support the costs of internal transport, storage,and handling incurred in Title II emergency programs.
Kansas City Commodity Office (KCCO): The United States Department of Agriculture(USDA) office is responsible for the acquisition, handling, transportation, and disposition ofTitle II commodities, including fiscal and claims responsibilities prior to export. More detailedinformation regarding KCCO may be found online athttp://www.fsa.usda.gov/daco/kccoorg.htm
Leading Indicators: Measurements used when changes exist in conditions prior to the onsetof decreased food access. Such indicators include, crop failures (i.e., poor access to seed andother inputs due to inadequate rainfall), sudden deterioration of range land conditions orcondition of livestock (i.e., unusual migration movements, unusual number of animal deaths,

COMMODITIES REFERENCE GUIDE ANNEX 1 – USAID DEFINITIONS
8
or large number of young females being offered for sale), significant deterioration in localeconomic conditions (i.e., increase in price of food grain and increases in unemployment),significant accumulation of livestock by some households (due to depressed prices caused byoversupply).
Local Capacity Building : The process of one organization passing on a skills and knowledgebase to another organization. Very often this involves a mutual exchange or sharing of skillsand knowledge, or a process of working in partnership to achieve a set of objectives. Buildinglocal capacity can take place between two or more organizations, or it can be accomplishedamong different levels of the same organization.
Low-Income Countries: Officially those countries with per capita income below the levelused by the World Bank to determine eligibility for grants under the International DevelopmentAssistance fund.
Low Income, Food Deficit Country (LIFDC): For purposes of Title II programming,LIFDCs are those food-deficit (i.e., net importing basic foodstuffs) countries with per capitaGNP not exceeding the level used by the World Bank to determine eligibility for InternationalDevelopment Association (IDA) (soft loan) assistance. FFP references the list published bythe Food and Agriculture Organization to determine a country’s status as an LIFDC.
Meals Ready to Eat (MRE): Standard USG issued, preprocessed enclosed meal, including abalanced mix of foods, for consumption during wartime by US troops, and distributed onoccasion as foreign aid.
Minimums and Sub-Minimums : US legislative annual targets for commodity tonnage bytype: (a) at least 75% of Title II for development programs should be in the form of processedor fortified products or bagged commodities; (b) at least 15% of the value of Title II non-emergency program food aid should be for monetization; (c) within the 1.9 million-tonminimum, a sub-minimum of 1.3 million metric tons for non-emergency programs operated bythe PVOs, the World Food Program and the cooperatives; (d) at least 75% of all food aidshipped must be on a US flag carrier; and (e) at least 252,000 of Title II commodities should beloaded and shipped out of US Great Lakes ports.
Monetization: The selling of agricultural commodities to obtain foreign currency for use inU.S. assistance programs. PVOs monetize USG donated commodities through PL480 Title IIand USDA programs. Monetization can be conducted by direct negotiation with governmentparastatals or through sealed-bid auctions to wholesalers and mid-level merchants. 1995 USlegislation requires that a minimum of 15% of Title II food aid be monetized each year.
Monetization Field Manual (MFM): Published by USAID in 1998, this manual defines anddescribes the requirements of both partial and 100% monetization programs. It providesguidelines on how to develop a monetization program. The manual may be found online athttp://www.usaid.gov/hum_response/ffp/ffp.htm.

COMMODITIES REFERENCE GUIDE ANNEX 1 – USAID DEFINITIONS
9
Office of Foreign Disaster Assistance (OFDA): The office within the Bureau forHumanitarian Assistance administers international disaster relief, management andpreparedness program and aids victims of natural disasters throughout the world.
Output: The product of a specific action, e.g., number of people trained, MT of fooddelivered. A tangible, immediate, and intended product or consequence of an activity withinan organization’s control or manageable interest.
Parastatal: A business owned and controlled by a government.
Participation: The active engagement of partners and customers in sharing ideas, committingtime and resources, making decisions, and taking action to bring about a desired developmentobjective.
Performance Baseline : The value of a performance indicator at the beginning of a planningand/or performance period. A performance baseline is the point used for comparison whenmeasuring progress toward a specific result or objective. Ideally, a performance baseline willbe the value of a performance indicator just prior to the implementation of the activity oractivities identified as supporting the objective that the indicator is meant to measure.
Performance Indicator: A particular characteristic or dimension used to measure intendedchanges defined by an organizational unit's results framework. Performance indicators areused to observe progress and to measure actual results compared to expected results.Performance indicators serve to answer "whether" a unit is progressing towards its objective,rather than why/why not such progress is being made. Performance indicators are usuallyexpressed in quantifiable terms, and should be objective and measurable (numeric values,percentages, scores and indices). Quantitative indicators are preferred in most cases, althoughin certain circumstances qualitative indicators are appropriate.
Performance Monitoring: A process of collecting and analyzing data to measure theperformance of a program, process, or activity against expected results. A defined set ofindicators is constructed to regularly track the key aspects of performance. Performancereflects effectiveness in converting inputs to outputs, outcomes and impacts (i.e., results).
Performance Monitoring Plan: A detailed plan for managing the collection of data in orderto monitor performance. It identifies the indicators to be tracked; specifies the source, methodof collection, and schedule of collection for each piece of datum required; and assignsresponsibility for collection to a specific office, team, or individual. At the Agency level, it isthe plan for gathering data on Agency goals and objectives. At the Operating Unit level, theperformance monitoring plan contains information for gathering data on the strategicobjectives, intermediate results and critical assumptions included in an operating unit's resultsframeworks.

COMMODITIES REFERENCE GUIDE ANNEX 1 – USAID DEFINITIONS
10
Performance Monitoring System: An organized approach or process for systematicallymonitoring the performance of a program, process or activity towards its objectives over time.Performance monitoring systems at USAID consist of, inter alia: performance indicators,performance baselines and performance targets for all strategic objectives, strategic supportobjectives, special objectives and intermediate results presented in a results framework; meansfor tracking critical assumptions; performance monitoring plans to assist in managing the datacollection process, and; the regular collection of actual results data.
Performance Target: The specific and intended result to be achieved within an explicit timeframe and against which actual results are compared and assessed. A performance target is tobe defined for each performance indicator. In addition to final targets, interim targets also maybe defined.Public Law (PL) 480, Titles I, II and III:
• Title I: Concessional loans to developing countries to purchase food or agriculturalcommodities determined to be surplus to the domestic and commercial exportrequirements of the United States by the Secretary of Agriculture. The USDA administersprogram.
• Title II: A program to provide agricultural commodities to foreign countries on behalf ofthe people of the United States to address famine or other urgent or extraordinary reliefrequirements; combat malnutrition, especially in children and mothers; carry out activitiesthat attempt to alleviate the causes of hunger, mortality or morbidity; promote economicand community development; promote sound environmental practices; and carry outfeeding programs. Agricultural commodities may be provided to meet emergency foodneeds through foreign governments and private or public organizations, includingintergovernmental organizations. The program is administered by USAID.
• Title III: A government to government grants program, entitled Food for Developmentthat is implemented by USAID in food-deficient countries. Local currency is generated bythe sale of the commodities which is then utilized for economic development and policyreform activities.
Point of Entry: The first customs point, or any other designated point in a recipient countrywhere imported commodities enter via an ocean port not located in the recipient country.
Pre-Qualification: A process whereby eligibility to bid is determined by a formal process; itmight impose standards on bidders, or require a show of good faith, or might simply requireregistration prior to bidding.
Previously Approved Activity (PAA): The report submitted annually by a CS requesting afiscal year allocation of commodities and dollars for a multi-year Title II activity. The term“PAA” is one of two new designations for “Operational Plan” as defined in Regulation 11.

COMMODITIES REFERENCE GUIDE ANNEX 1 – USAID DEFINITIONS
11
Private Voluntary Organization (PVO): A U.S. non-profit organization registered withUSAID, which traditionally deals with international programs and is funded by private grantsand contributions. In other countries the term used is non-governmental organization or NGO.
Program: Generally defined as the overall efforts of an agency in a region or country. Anapproved plan for utilizing available Title II commodities in authorized types of developmentor emergency projects by a CS.
Project: A cluster of one or more activities with a single, clear purpose, usually a finitetime-span for implementation, and a single project management. One level of aggregationbelow the program level in a country program. For food aid, a portion of a cooperatingsponsor's approved Title II program.
Recipient Agency Agreements: A written agreement between the cooperating sponsor andthe recipient agency prior to the transfer to a recipient agency of commodities, monetizedproceeds, or other program income for distribution or implementation of an approved program.
Regulation 11: The primary USAID regulation containing detailed and specific terms andconditions governing the transfer and use of P.L. 480 Title II commodities in emergency reliefand non-emergency programs.
Result: A change in the condition of a customer or a change in the host country condition thathas a relationship to the customer. A result is brought about by the intervention of USAID inconcert with its development partners. Results are linked by causal relationships, i.e., a resultis achieved because related and/or interdependent outcomes were achieved. Strategicobjectives are the highest level result for which an operating unit is held accountable;intermediate results are those results that contribute to the achievement of a strategic objective.
Results Framework: The results framework represents the development hypothesis includingthose results necessary to achieve a strategic objective and their causal relationships andunderlying assumptions. The framework also establishes an organizing basis for measuring,analyzing, and reporting results of the operating unit. It typically is presented both in narrativeform and as a graphical representation.
Results Package: A results package (RP) consists of people, funding, authorities, activitiesand associated documentation required to achieve a specified result(s) within an establishedtime frame. An RP is managed by a strategic objective team (or a results package team ifestablished) which coordinates the development, negotiation, management, monitoring andevaluation of activities designed consistent with: (1) the principles for developing andmanaging activities; and (2) achievement of one or more results identified in the approvedresults framework. The purpose of a results package is to deliver a given result or set of resultscontributing to the achievement of the strategic objective.

COMMODITIES REFERENCE GUIDE ANNEX 1 – USAID DEFINITIONS
12
Section 416(b) of the Agricultural Act: Legislation of 1949, which allows for surpluscommodities to be donated for overseas aid, for instance as grants to PVOs and togovernments. Funds appropriated are not charged to the 150-budget account but are treated asdomestic programs because commodities generally are taken from the US agricultural pricesupport program. Effective December 1991, USDA took sole statutory responsibility for thesedonations, previously shared with AID under a memorandum of understanding. Legislatedtargets: Allocate a minimum of 500,000 MT of grains and oilseeds annually, 150,000 MT ofdairy products annually, 5% of the value of Section 416 to monetizations by PVOs andcooperatives and allocate a minimum of 75,000 to Food for Progress. The interest arising fromthe principal sum only.
Section 202(e) of Farm Bill: PL 480 legislation which as of 1990 provides nearly $20 millionper year to PVOs and WFP to cover complementary cash costs of food programs in the field.202(e) grants fund only in-country expenses toward improving the management and efficiencyof Title II programs.
Tariff: A tax levied by a national government on goods that are imported or, less often,exported across its borders. The amount collected is called the "duty" or "customs duty."
Third Country Monetization: A monetization in which commodities are sold in one countryand the foreign currency generated is used to support the implementation of a Title II programin that country and/or another country in the same region.
Transient Food Insecurity: Seasonal or annual fluctuations in food insecurity due to factorsthat may be expected to change from period to period, such as prices, weather or economicconditions. (See also Chronic Food Insecurity)
Transparency: Policy that mandates that all phases of the monetization process be carried outopenly with full public disclosure.
Triangular Transactions : Monetization activities through which the funds generated by salesin one country are used to purchase foods in surplus in another country which are thentransported to a third food-deficit country or region.
Usual Marketing Requirements (UMR): Analysis required under PL480 to ensure thatPL480 sales programs do not disrupt world commodity prices or normal commercial tradepatterns between the importing country and other friendly countries. The UMR (calculated byUSDA) is the minimum quantity of a commodity that the importing country must purchasecommercially in a year to maintain the U.S. and friendly country imports to that country.Usually, it is a five year average of the importing country's commercial imports of acommodity. The importing PVO needs to obtain certification from the USAID mission thateither no analysis is required because the volume to be imported is so small or that an analysisis required. UMR analysis must be included in the monetization proposal as part of theBellmon Analysis .

COMMODITIES REFERENCE GUIDE ANNEX 1 – USAID DEFINITIONS
13
Vulnerable Demographic Groups: Women, especially pregnant and lactating women, andyoung children (below 5 years of age) and the elderly are considered to be vulnerable becausethey are most likely to receive less than adequate food within a household and because theconsequences of poor nutrition are most severe in these groups as compared with others in acommunity. Also, the handicapped and persons afflicted with chronic disease, such asHIV/AIDS, are groups that are vulnerable to inadequate food security.
Vulnerable People: There are three basic groups of people categorized by the ability to takeadvantage of the development process: The potentially productive and mostly subsistence,chronically malnourished, landless, rural poor, urban under-employed, who typically buy orbarter more food than they produce and are continually food insecure. The unemployed inrural but mostly in urban settings, who fail to meet their energy needs and are susceptible toillnesses, which place an additional burden on the potential for earning income. Thechronically ill and disadvantaged whose ability to work is severely restricted.
Waybill (WB): A document issued by a carrier that contains the same information as a Bill ofLading (origin of goods, destination, consignor, consignee, description of shipment) but, unlikethe latter, does not represent a contract between the shipper and the carrier or a document ofthe title to the goods. It is generally a document used for tracking items sent for distribution, orfor transfer between warehouses.
World Food Programme (WFP): A UN agency operating in 80 countries and specializing infood assistance and logistics. WFP channels over $1 billion worth of goods and services ayear, representing approximately 1.4 million tons a year for emergencies and refugee feeding.Detailed information regarding WFP programs may be found online at http://www.wfp.org
B. SELECTED FOOD SECURITY RELATED DEFINITIONS
Activity: The work, services, or training performed under a project, as distinct from the modeof food distribution, the project's purposes, inputs or outputs.
Amino Acids : The building blocks of proteins, used throughout the body. 12 are required inthe diet (organic compounds possessing at least one amino group and one acidic carboxylgroup): isolucine, leucine, lysine, histidine, methionine, cystine, phenylalanine, tyrosine,threonine, tryptophan, and valine.
Anemia: A deficiency of oxygen-transport capacity of the blood that leads to fatigue,impaired work capacity increased maternal mortality, increased cardiac failure, and decreasedcognitive function in humans. Results from inadequate consumption, digestion or absorptionof iron, vitamin B12, vitamin B1, folic acid, or vitamin E. Outward signs include listlessness,lack of red veins evident in lining of the eyelids and whites of eyes, and pale fingernails.Anemia can also result from hemolytic (red blood cell destruction) bacterial infections,malaria, blood loss due to certain parasites or ulcers or by genetic disorders such as thalassemiaor G-6-PD deficiency.

COMMODITIES REFERENCE GUIDE ANNEX 1 – USAID DEFINITIONS
14
Anthropomorphic Measurement: Includes measures of distance across shoulders(biacromial), head circumference, pelvic width, arm length, skinfold (fat) thickness, and manyother indicators of human physical development. Anthropometric measures are used toindirectly assess the nutritional status of individuals. Specifically, those measurements usedcommonly in the growth monitoring of infants, children and school-aged children and tomonitor the health and diets of entire populations.
Basal Metabolic Rate (BMR): The portion of human energy, or kilocalorie, use involved inhomeostasis, or merely living and breathing. Excludes work activities, walking, standing,thinking, and digestion of foods. Typically measured on a daily basis and estimated torepresent between 60% and 70% of total minimum energy requirements. BMR can be as lowas 30% of total requirements among the physically active. It is important to know, forinstance, for calculating survival rations and food-for-work pay scales.
Bioavailability: The relative ability of nutrients in foods to be properly digested, andabsorbed. For example, the iron in vegetable foods is less absorbable than the iron in meatfoods. The bioavailability of iron in vegetables increases when vitamin C is also present,having been consumed during the same meal.
Body Mass Index (BMI): Measure of an individual's attained growth, measured as the bodyweight (kg) divided by the square of the height (meters). BMI is an indirect measure of leanbody mass and body fat mass.
Complementary Foods: These are required in appropriate quantities to complement breast-feeding or the "basic" foods by providing additional nutrients - especially vitamins andminerals.
Displaced Population: (see Internally Displaced Persons)
Drought: Prolonged and severe lack of water usually caused by a dearth of rainfall. Droughtcan occur when rainfall occurs at the wrong point in the harvest cycle. Drought also connotesthe agricultural crisis and economic challenges that follow water scarcity, including famine.
Famine : Period of starvation for large portions of a population. Famine often results from asharp downturn in food supply, such as two consecutive years of drought. Famine can alsooccur in situations where food is plentiful but entitlements to food sharply decrease, forinstance through massive recession, unemployment, civil strife, and because of low foreignexchange and income levels of the poor in conjunction with weak infrastructure and low portofftake capacity. Famines effectively redistribute income away from the poor. Mitigationactivities reduce the severity of impact. Short-cycle varieties of local crops (e.g. groundnuts ormillet) are helpful strategies during crop failures.
Food Aid Management (FAM): An association of 17 US PVOs formed in 1989 to improvethe efficiency and effectiveness of overseas food assistance. It promotes sharing of technicaland field information among its members and the development of shared PVO food securityprogram guidelines and operating standards. FAM’s goals are to: a) facilitate and promote the

COMMODITIES REFERENCE GUIDE ANNEX 1 – USAID DEFINITIONS
15
development of food aid standards, b) promote the food aid and food security knowledge baseof PVOs, USAID staff, and other collaborators through information exchange andcoordination, and c) facilitate collaboration between PVOs, USAID, and appropriatedevelopment and humanitarian professionals by organizing fora for discussions.
Food Basket: (see Food Ration)
General Feeding Program: A program in which food is provided to enable households tomeet their basic nutritional needs. Such programs may include all families within a specifiedpopulation, or be "targeted" on all members of selected sub-groups.
Hunger: Hunger is the experience of having an empty stomach. Hunger should bedistinguished from undernutrition, which is the process whereby a person fails to consumeadequate nutrients and/or the clinical state, which follows such a failure.
Intra-household food Distribution: The distribution of food within the household.
Iron Deficiency Anemia (IDA): Widespread and debilitating micronutrient deficiency thatimpairs mental development and labor productivity. Iron deficiency anemia is addressed byefforts to increase iron intake (e.g. through food fortification), iron absorption (e.g. makingconsumed iron more bioavailable), and to reduce iron losses due to blood loss from parasistes(e.g. reducing hookworm).
Malnutrition: Impairment of physical and/or mental health resulting from a failure to fulfillnutrient requirements. Malnutrition may result from consuming too little food, a shortage ofkey nutrients, or impaired absorption or metabolism due to disease.
Mid-Upper Arm Circumference (MUAC): Common measure of child nutritional status thatis fast, does not hinge on the accuracy of age reporting, and is quickly interpretable Used as arapid screening tool for identifying malnourishment in children under five in emergencysituations. Not suitable for monitoring the progress of individual children. MUAC ismeasured in centimeters.
Nutrition Security: Appropriate quantity and combination of food, nutrition, health services,and care takers time needed to ensure adequate nutrition status for an active and healthy life atall times for all people.
On-site or "wet" Feeding: When the food is cooked and distributed for consumption at thedistribution center. This type of feeding is generally used in supplementary feeding forselected, highly vulnerable groups.
Ration Package: A combination of selected food commodities in fixed amounts determinedfor the purpose of meeting nutritional needs or providing an incentive.

COMMODITIES REFERENCE GUIDE ANNEX 1 – USAID DEFINITIONS
16
Internally Displaced Persons (IDP): Persons who have fled their homes and villages becauseof persecution, civil strife, food insecurity or other emergency but remain within their countryof origin. This definition is used by those who distinguish between displaced and refugeecategories as non-overlapping. i.e., once a dislocated person crosses an international borderthey are no longer "displaced" and then and only then become a "refugee" or asylum seeker.
Micronutrients: Vitamins and minerals required for human health and survival. A lack ofmicronutrients can contribute significantly to morbidity and mortality. Micronutrients play andimportant part in short-term human health, risk of death, and in long-term human function.
PVO Monetization Manual: In FY98, the FAM Monetization Working Group commissionedthe publication of an updated monetization manual for use by all CSs engaged in themonetization of Title II commodities. The manual may be found online athttp://www.foodaid.org/manual.htm
Refugee: “Persons recognized as refugees under the 1951 United Nations Convention relatingto the Status of Refugees or its 1967 Protocol, the 1969 Organization of African Unity (OAU)Conventions Governing Specific Aspects of Refugee Problems in Africa, persons recognizedas refugees in accordance with the UNHCR Statute, persons granted humanitarian orcomparable status and those granted temporary protection.”
Starvation: Starvation is life-threatening undernutrition, when a poor nutritional stateunilaterally raises vulnerability to mortality through any means (De Waal 1991). Physical andbiological condition describing chronic lack of food, which leads to death.
Supplementary Feeding: A program in which food is provided to selected individuals toprevent or treat malnutrition. The beneficiaries are selected, according to prescribed criteria, asbeing malnourished and/or nutritionally at risk, and are discharged when it is determined thatthey are no longer malnourished or at risk. The rations are additional to what the beneficiarieswould normally receive as their share of the general household ration and food commoditiesselected reflect the unique physiological needs of this group.
Take-home or "Dry" Distribution: Food distributed in bulk and without cooking.Generally, several days or weeks' worth of supplies are provided. The food is expected to beshared by all family members.
Targeting: Any method by which an intervention is designed or implemented so that benefitsaccrue selectively to only a portion of the overall population. Targeting can be by geographicconcentration, eligibility requirements such as age, sex or health status, or by means tests thatassess household income. The efficiency of targeting decreases as the proportion of thepopulation that is food insecure increases. Targeting generally becomes inefficient when thetargeted group comprises 50% or more of the population.

COMMODITIES REFERENCE GUIDE ANNEX 1 – USAID DEFINITIONS
17
Weight-for-Age (underweight): Most common method of assessment is the proportion ofchildren below -2 standard deviations (S.D.) weight-for-age or less than 80% of the standardreference weight for age (measurement in kilograms compared with age in months in childrenunder five.)
Weight-for-Height (WFH) (wasting): Ratio of weight in grams to height in centimeters,WFH is the preferred measure for the nutritional status of children under five, because it can beused for both nutritional surveillance and for measuring individual progress. The raw WFHscore is compared with international norms and converted into either a percentage of areference median or a “Z” score. Children with a score less than 80% WFH or –2 Z areconsidered “wasted.” Children under 70% WFH or –3 Z are considered severelymalnourished.
Z Scores are a statistical parameter that measures the position of an observational value along anormal distribution (binomial, bell curve) continuum. In field assessments it is commonly usedto evaluate individual and groups of infants and children according to their physical growthand nutritional status. A Z score of -2.0 means that the individual falls two standard deviationsbelow the population standard. A -2.0 anthropometric measure indicates that 98% of healthychildren have higher growth. A Z score even lower, -2.5 to -3 is suggestive.

COMMODITIES REFERENCE GUIDE ANNEX II – PERFORMANCE MEASUREMENT
ANNEX II: Resources for Emergency, Food Security and NutritionRelated Performance Indicators
USAID’s Managing-for-Results Policy
The Government Performance and Results Act (GPRA) of 1993 requires all U.S. governmentdepartments and agencies to develop strategic plans and to measure performance againstobjectives. To comply with the GPRA, USAID developed a “Managing-for-Results” policy inconsultation with collaborating sponsors (CSs) and other donors. This policy led to thecreation of specific guidance, concepts, and terms for measuring the performance and impactof humanitarian assistance programs. For USAID’s Bureau for Humanitarian Response(BHR), the ultimate beneficiaries of this policy are vulnerable populations in targeted hostcountries. In an effort to measure the impact of Title II food aid programs on vulnerablepopulations, BHR’s Office of Food for Peace (FFP) urges that all food aid proposals includeperformance monitoring and measurement plans. These plans should include goal, objectiveand intermediate result statements, and each objective and intermediate result should have atleast one performance indicator to track progress toward achievement
Definition of Goal, Objectives and Intermediate Results
A goal is a longer-term result, which is usually not achievable over the life of a CS’s program.However, Title II program proposals should be designed to contribute toward the achievementof the goal. Strategic Objectives are defined as the end results that CSs seek to achievethrough the proposed program. Intermediate Results are interim result targets. Resultstatements are usually stated in the past tense of an action verb. Some examples are as follows:
§ Sustainable farm-level production capacity established§ Increased market access for small farmers§ Improved policy environment for broad-based food security programs
Definition of Indicators
Performance Indicators are variables with a particular characteristic or dimension used formeasuring progress toward achievement of objectives and intermediate results. Theseindicators determine whether progress is being made toward stated results, rather than astatement as to why such progress is not being made. Performance indicators must be direct,measurable and sufficiently sensitive to capture small changes over short periods of time.Further, the indicators must be relevant, practical and cost-effective. Performance indicatorsmay be visualized as signposts to indicate movement toward a destination. There are severaltypes of indicators.
An output/process indicator measures activity, such as the following:§ Percent of food aid managers trained in improved project accountability§ Number of vulnerable groups receiving emergency food aid§ Quantity of food delivered through school lunch programs

COMMODITIES REFERENCE GUIDE ANNEX II – PERFORMANCE MEASUREMENT
Effect indicators gauge the degree of behavioral change in the assisted population. Examplesof these indicators are changes in people’s attitudes on improved diet and nutrition, theimportance of pre-natal care or changes in perception on breast-feeding.
Impact indicators measure the fundamental changes in people’s well being. Some examplesare as follows:§ Average annual income per capita§ Morbidity and mortality rates§ Percent of population living below an established poverty line
Performance indicators can be measured quantitatively or qualitatively. Quantitativemeasures answer questions such as “how many?”, “how much?” and “what percent?”Examples of quantitative information are data from food delivery records, health clinic records,and death records. Qualitative measures are subjective (e.g., changes in people’s attitudes,perceptions and well being, etc.) and therefore, require indirect methods to quantify. Theseindirect methods include interviews, focus group discussions and rapid assessments.
Establishment of Performance Indicators
There are several reference documents that may be used to assist CSs in developingperformance indicators. Some of the more useful documents are identified below by category.
q Nutritional Status : Anthropometric Measures (height/age; weight/height; weight/age) aretypically used to measure the nutritional status of children, although it can also be used foradults. That said, Body Mass Index (BMI) is now considered to be a better measurementof nutritional status for adults. The BMI determines body mass by relating body weight tosurface area rather than height and is calculated by dividing the square of a person’s heightsquared divided by their weight. For detailed guidance on the use of anthropometrymeasurement, please see Annex 3 of WHO’s The Management of Nutrition in MajorEmergencies and the Antropometry Measurement Guide, which is listed under the FANTApublications in the Resource List at the end of this Annex.
q Maternal and Child Health and Nutrition (MCHN): For useful guidance on establishingindicators for food aid programs focused on improving the nutritional status of women andchildren, please see Annex 2 of UNHCR/WFP’s Supplementary Feeding for Mothers andChildren: Operational Guidelines; Measuring Household Food Consumption: AnalyzingData prepared by FANTA and Infant and Young Child Feeding Emergencies prepared byLINKAGES. Both documents are listed in the Resource List at the end of this Annex.
q Food Security: For a complete list of generic food security indicators, please see Appendix26 of FANTA’s Measuring Household Food Consumption: Analyzing Data.
q Emergency: For useful guidance on developing performance indicators for emergencyprograms, please see the chapter on Minimum Standards in Food Aid of the SPHEREProject’s Humanitarian Charter and Minimum Standards in Disaster Response;

COMMODITIES REFERENCE GUIDE ANNEX II – PERFORMANCE MEASUREMENT
UNHCR/WFP’s Guidelines for Selective Feeding Programmes in Emergency Situations;and Annex 7 of WHO’s The Management of Nutrition in Major Emergencies.
Development and Use of Baseline Data
For each performance indicator, a baseline is necessary. This is crucial in measuring progresstoward an intermediate result or objective. Depending on the type of performance indicatorbeing measured, the baseline data can be a point-in-time observation, a cumulative or anaverage value over a period of time.
One key to success with the Managing-for-Results approach is the involvement of allstakeholders in the design and implementation of Title II food aid programs. When allstakeholders are engaged, resources are better utilized, funds better leveraged, results are morerelevant and an efficient and effective transfer of program activities to local counterparts andinstitutions is more likely.
For more detailed guidance on performance monitoring and measurement, please see USAID’sManaging for Results Terminology in Annex 1 and USAID/CDIE’s Performance Monitoringand Evaluation Tips, which is available online at www.dec.org/usaid_eval.

COMMODITIES REFERENCE GUIDE ANNEX II – PERFORMANCE MEASUREMENT
RESOURCE LIST
1. Food and Nutrition Technical Assistance (FANTA) Project, Academy for EducationalDevelopment, 1825 Connecticut Avenue, NW, Washington, D.C., 20009-5721. Tel: 202-884-8000; Fax 202-884-8432. E-mail: [email protected]; Web sitehttp://www.fantaproject.org. FANTA has the following guides:
§ Agricultural Productivity Indicators Measurement Guide, Patrick Diskin§ Anthropometry Indicators Measurement Guide (draft)., Bruce Cogill§ Food Security Indicators and Framework for Use in the Monitoring and Evaluation of
Food Aid Programs, Frank Riely, Nancy Mock, Bruce Cogill, Laura Bailey, and EricKenefick
§ Household Food Consumption Indicators Measurement Guide, Anne Swindale andPunam Ohri-Vachaspati
§ Infant and Child Feeding Indicators Measurement Guide, Mary Lung’aho§ Measuring Household Food Consumption: A Technical Guide§ Measuring Household Food Consumption: Analyzing Data§ Sampling guide, Robert Magnani§ Water and Sanitation Indicators Measurement Guide, Patricia Billig, Diane Benahmane
and Anne Swindale
2. Food Aid Management (FAM), 1625 K Street, NW, 5th Floor Washington, DC 20006.Tel: (202) 223-4860, Fax: (202) 223-4862; Web site http://www.foodaid.org. ProvidesUSAID documents (FY 1990-ongoing).
3. Linkages Project. Recommended Feeding and Dietary Practices to Improve Infant andMaternal Nutrition, Academy for Educational Development, 1825 Connecticut Avenue,NW, Washington, D.C., 20009-5721. Tel: 202-884-8000; Fax: 202-884-8977; E-mail:[email protected].
4. Linkages Project. Infant and Young Child Feeding Emergencies, Academy for EducationalDevelopment, 1825 Connecticut Avenue, NW, Washington, DC 20009-5721, April 1997..Tel: 202-884-8000; Fax: 202-884-8977; E-mail: [email protected].
5. National Research Council. Recommended Dietary Allowances. National Academy Press,Washington, D.C., 1989.
6. The Sphere Project. Humanitarian Charter and Minimum Standards in Disaster Response,PO Box 372, 17 Chemin des Crets, CH-1211 Geneva 19, Switzerland, 2000. Tel: 011-41-22-730-4501; Fax: 011-41-22-730-4905; E-mail: [email protected]; Web site:http://www.sphereproject.org.
7. USAID/BHR. Menu of Sector-Specific Humanitarian Assistance Performance Indicators,Checchi-Louis Berger International, Inc., 1819 H Street, Suite 900, Washington, DC20006. Tel: 202-331-7775.

COMMODITIES REFERENCE GUIDE ANNEX II – PERFORMANCE MEASUREMENT
8. USAID/CDIE. Performance Monitoring and Evaluation Tips. 1996. Web site:http://www.usaid.gov/pubs/usaid_eval/#02
9. WFP/WHO Supplementary Feeding for Mothers and Children: OperationalGuidelines (Provisional), World Food Programme, Via Cesare Giulio Viola 68,Parco dé Medici, Rome 00148, Italy, August 1998. Tel: 011-3906-6513-1; Fax:011-3906-6590-632 or 637; E-Mail: [email protected] [email protected]. Web site: http://www.wfp.org.
10. WFP/UNHCR Selected Feeding Guidelines in Refugee and Emergency Situations,World Food Programme, Via Cesare Giulio Viola 68, Parco dé Medici, Rome00148, Italy. Tel: 011-3906-6513-1; Fax: 011-3906-6590-632 or 637; E-Mail:[email protected] and [email protected]. Web site:http://www.wfp.org.
11. WHO. The Management of Nutrition in Major Emergencies. Geneva, 2000.

COMMODITIES REFERENCE GUIDE ANNEX III – RECOMMENDED ENERGY ALLOWANCES
Annex III: Recommended Energy Allowances (REA)1
Table 1: REA for Light to Moderate Activity Levels
Category Age (years)or Condition
Weight(kg) (lb)
Height(cm) (in)
Kcalper kg
Totalkcal/day2
Infants 0.0-0.5 6 13 60 24 108 6500.5-1.0 9 20 71 28 98 850
Children 1-3 13 29 90 35 102 13004-6 20 44 112 44 90 18007-10 28 62 132 52 70 2000
Females 11-14 46 101 157 62 47 220015-18 55 120 163 64 40 220019-24 58 128 164 65 38 220025-50 63 138 163 64 36 220051+ 65 143 160 63 30 1900
Males 11-14 45 99 157 62 55 250015-18 66 145 176 69 45 300019-24 72 160 177 70 40 290025-50 79 174 176 70 37 290051+ 77 170 173 68 30 2300
Pregnant 1st trimester +02nd trimester +3003rd trimester +300
Lactating 1st 6 mo +5002nd 6 mo +500
Adapted from Table 3-5 in Recommended Dietary Allowances, National Research Council, National Academy Press, Washington,D.C. 1989 1 REA expressed in kcal/day2 In the range of light to moderate activity, the coefficient of variation is about 20%. Figures are rounded.
Table 2: REA for Breastfeeding Children 6 Months to 5 Years
Age inMonths
Daily EnergyRequirement1
Kilocalories needed from complementary foods per level ofBreastmilk (BM) intake2
High BM intake Average BM intake Low BM intake6-8 680 kcal 75 270 4659-11 830 kcal 230 450 67512-23 1090 kcal 490 750 1000
Adapted from Table 1 in Recommended Feeding and Dietary Practices to Improve Infant and Maternal Nutrition , 1999, by theLinkages Project 1 Figures are rounded.2 Estimates of average breastmilk intake are: 410 kcal for 6-8 mo old and 340 kcal for a 12-23 mo old. These estimates should beadjusted for the size of the infant.

COMMODITIES REFERENCE GUIDE ANNEX III – RECOMMENDED ENERGY ALLOWANCES
Annex III, Table 3: REA, Heavy Activity Level–Adults Based on multiples of Resting Energy Expended (REE)
Category Age (years)or Condition
Weight(kg) (lb)
Height(cm) (in)
REE1 Multipleof
REE2
Totalkcal/day3
Females 11-14 46 101 157 62 1310 1.82 240015-18 55 120 163 64 1370 1.82 250019-24 58 128 164 65 1350 1.82 250025-50 63 138 163 64 1380 1.82 250051+ 65 143 160 63 1280 1.82 2300
Males 11-14 45 99 157 62 1440 2.10 300015-18 66 145 176 69 1760 2.10 370019-24 72 160 177 70 1780 2.10 370025-50 79 174 176 70 1800 2.10 380051+ 77 170 173 68 1530 2.10 3200
Pregnant 1st trimester +02nd trimester +3003rd trimester +300
Lactating 1st 6 mo +5002nd 6 mo +500
Adapted from Table 3-5 Recommended Dietary Allowances, National Research Council, National Academy Press. Washington, D.C.1989 and WHO, 1985, Energy and Protein Requirements Report of a Joint FAO/WHO/UNU Expert Consultation, World HealthOrganization in Geneva, p.78.
1 Calculation based on WHO (1985) equations. These equations are derived from basal metobalic rate (bmr) data. Figures arerounded.2 These REE multiples are for heavy activity levels only and are based on WHO (1985) equations.3 Figures are rounded.

OMMODITIES REFERENCE GUIDE ANNEX IV – RECOMMENDED DIETARY ALLOWANCES
Annex IV: Recommended Dietary Allowancesa, Revised 1989
Fat-Soluble Vitamins Water-Soluble Vitamins Minerals
Vita- Vita- Vita- Vita- Vita- Thia- Ribo- Vita- Fo- Vitamin Cal- Phos- Mag- SeleAge (years) Weighta Heightb Protein min A min D min E min K min C min flavin Niacin min B6 late B12 cium phorus nesium Iron Zinc Iodine nium
Category or Condition (kg) (lb) (cm) (in) (g) (IU)c (IU) d (mg ∝-TE) e (µg) (mg) (mg) (mg) (mg NE) f (mg) (µg) (µg) (mg) (mg) (mg) (mg) (mg) (µg) (µg)Infants 0.0-0.5 6 13 60 24 13 1,249 300 3 5 30 0.3 0.4 5 0.3 25 0.3 400 300 40 6 5 40 10
0.5-1.0 9 20 71 28 14 1,249 400 4 10 35 0.4 0.5 6 0.6 35 0.5 600 500 60 10 5 50 15Children 1-3 13 29 90 35 16 1,332 400 6 15 40 0.7 0.8 9 1.0 50 0.7 800 800 80 10 10 70 20
4-6 20 44 112 44 24 1,665 400 7 20 45 0.9 1.1 12 1.1 75 1.0 800 800 120 10 10 90 207-10 28 62 132 52 28 2,331 400 7 30 45 1.0 1.2 13 1.4 100 1.4 800 800 170 10 10 120 30
Males 11-14 45 99 157 62 45 3,330 400 10 45 50 1.3 1.5 17 1.7 150 2.0 1,200 1,200 270 12 15 150 4015-18 66 145 176 69 59 3,330 400 10 65 60 1.5 1.8 20 2.0 200 2.0 1,200 1,200 400 12 15 150 5019-24 72 160 177 70 58 3,330 400 10 70 60 1.5 1.7 19 2.0 200 2.0 1,200 1,200 350 10 15 150 7025-50 79 174 176 70 63 3,330 200 10 80 60 1.5 1.7 19 2.0 200 2.0 800 800 350 10 15 150 7051 + 77 170 173 68 63 3,330 200 10 80 60 1.2 1.4 15 2.0 200 2.0 800 800 350 10 15 150 70
Females 11-14 46 101 157 62 46 2,664 400 8 45 50 1.1 1.3 15 1.4 150 2.0 1,200 1,200 280 15 12 150 4515-18 55 120 163 64 44 2,664 400 8 55 60 1.1 1.3 15 1.5 180 2.0 1,200 1,200 300 15 12 150 5019-24 58 128 164 65 46 2,664 400 8 60 60 1.1 1.3 15 1.6 180 2.0 1,200 1,200 280 15 12 150 5525-50 63 138 163 64 50 2,664 200 8 65 60 1.1 1.3 15 1.6 180 2.0 800 800 280 15 12 150 5551 + 65 143 160 63 50 2,664 200 8 65 60 1.0 1.2 13 1.6 180 2.0 800 800 280 10 12 150 55
Pregnant 60 2,664 400 10 65 70 1.5 1.6 17 2.2 400 2.2 1,200 1,200 320 30 15 175 65Lactating 1st 6 months 65 4,329 400 12 65 95 1.6 1.8 20 2.1 280 2.6 1,200 1,200 355 15 19 200 75
2nd 6 months 62 3,996 400 11 65 90 1.6 1.7 20 2.1 260 2.6 1,200 1,200 340 15 16 200 75
a The allowances, expressed as average daily intakes over time, are intended to provide for individual variations among most normal persons as they live in the United States under usual environmentalstresses. Diets should be based on a variety of common foods in order to provide other nutrients for which human requirements have been less well defined. See text for detailed discussion ofallowances and of nutrients not tabulated.
b Weights and heights of Reference Adults are actual medians for the U.S. population of the designated age, as reported by National Health and Nutrition Examination Survey (II), 1979. The medianweights and heights of those under 19 years of age were taken from Hamill et al. (1979). The use of these figures does not imply that the height-to-weight ratios are ideal.
c Conversion of IU to retinol equivalents (RE): 3.33 IU = 1 microgram (µg) of retinol = 1 RE or 6 µg, β-carotene.d As cholecalciferol. 10 µg cholecalciferol = 400 IU of vitamin D.e ∝-Tocopherol equivalents. 1 mg d-∝ tocopherol = 1 ∝-TE.f 1NE (niacin equivalent) is equal to 1 mg of niacin or 60 mg of dietary tryptophan.
(Source: Adapted from Recommended Dietary Allowances , National Research Council, National Academy Press. Washington, D.C. 1989)

COMMODITIES REFERENCE GUIDE ANNEX V: COMMODITY PRICES
ANNEX V: Illustrative Price List of Commodities 1
Table 1
Commodities $CCC Value per MT2
Beans, Black $818Beans, Great Northern 577
Beans, Kidney (All types) 700Beans, Navy (Pea Beans) 573
Beans, Pinto 401Bulgur (BW) 178
Bulgur, Soy-Fortified 191Corn (bagged, bulk) 122
Cornmeal 194Cornmeal, Soy-Fortified 209
Corn Soy Blend (CSB) 260Corn Soy Masa Flour 199
Lentils 374Peas, Green 277
Rice (milled, non-parboiled, bagged, bulk) 350Sorghum (bagged, bulk) 115
Sorghum Grits, Soy Fortified (SFSG) 250Soybeans (bulk) 220
Soybean Meal (bulk) 180Fortified Refined Vegetable Oil(4 Ltr) 725
Wheat (bulk, hard, red, winter) 123Wheat Flour (AP and bread flour) 228
Wheat Soy Blend (WSB) 376
*Illustrative prices, not all commodities shown.
1 As of June 20002 CCC define