commodities primer rbs (2009)
TRANSCRIPT
1 October 2009
Qu
arte
rly
Co
mm
od
ity
Co
mp
anio
n
Nick Moore
Head of Commodity Strategy
Stephen Briggs
Commodity Strategy
Daniel Major
Commodity Analyst
Jacques Cailloux
Chief European Economist
Brison Bickerton
Oil and Gas Analyst
Warren Edney
Mining Equity Analyst
www.rbsm.com/strategy
www.rbssempra.com
Source: Bloomberg, LME and RBS
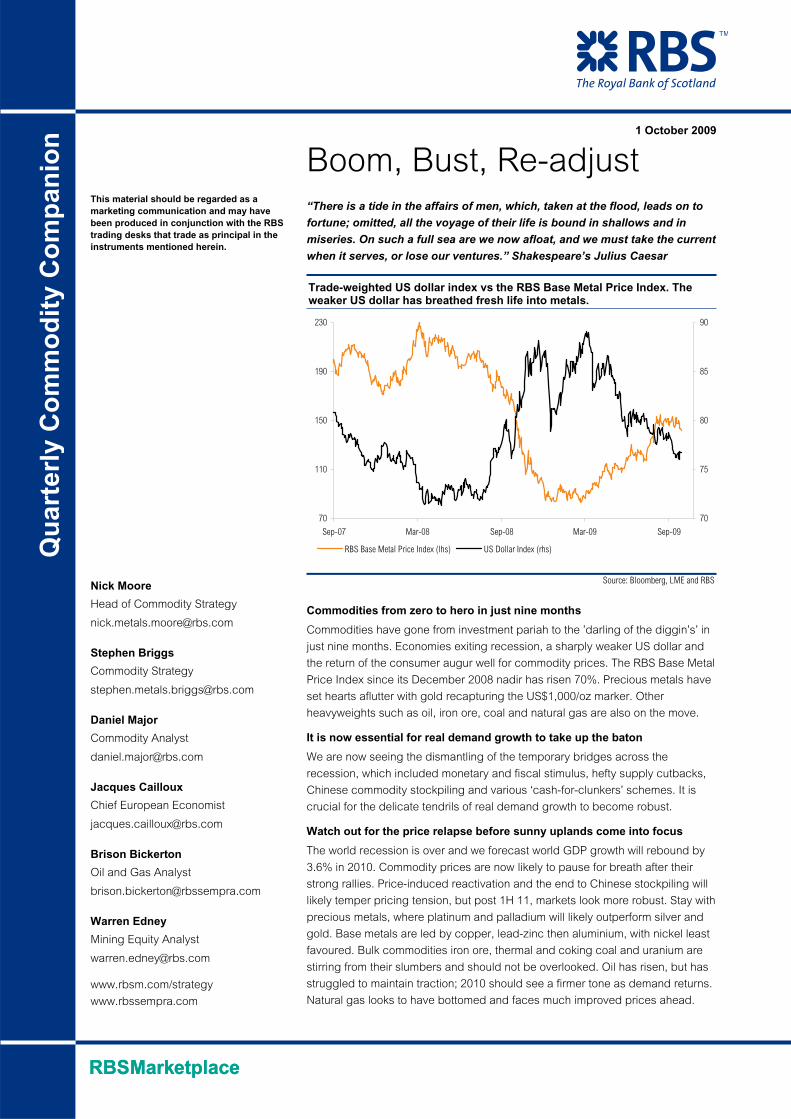
Trade-weighted US dollar index vs the RBS Base Metal Price Index. The weaker US dollar has breathed fresh life into metals.
70
110
150
190
230
Sep-07 Mar-08 Sep-08 Mar-09 Sep-09
70
75
80
85
90
RBS Base Metal Price Index (lhs) US Dollar Index (rhs)
Boom, Bust, Re-adjust “There is a tide in the affairs of men, which, taken at the flood, leads on to
fortune; omitted, all the voyage of their life is bound in shallows and in
miseries. On such a full sea are we now afloat, and we must take the current
when it serves, or lose our ventures.” Shakespeare’s Julius Caesar
Commodities from zero to hero in just nine months
Commodities have gone from investment pariah to the ’darling of the diggin’s’ in
just nine months. Economies exiting recession, a sharply weaker US dollar and
the return of the consumer augur well for commodity prices. The RBS Base Metal
Price Index since its December 2008 nadir has risen 70%. Precious metals have
set hearts aflutter with gold recapturing the US$1,000/oz marker. Other
heavyweights such as oil, iron ore, coal and natural gas are also on the move.
It is now essential for real demand growth to take up the baton
We are now seeing the dismantling of the temporary bridges across the
recession, which included monetary and fiscal stimulus, hefty supply cutbacks,
Chinese commodity stockpiling and various ‘cash-for-clunkers’ schemes. It is
crucial for the delicate tendrils of real demand growth to become robust.
Watch out for the price relapse before sunny uplands come into focus
The world recession is over and we forecast world GDP growth will rebound by
3.6% in 2010. Commodity prices are now likely to pause for breath after their
strong rallies. Price-induced reactivation and the end to Chinese stockpiling will
likely temper pricing tension, but post 1H 11, markets look more robust. Stay with
precious metals, where platinum and palladium will likely outperform silver and
gold. Base metals are led by copper, lead-zinc then aluminium, with nickel least
favoured. Bulk commodities iron ore, thermal and coking coal and uranium are
stirring from their slumbers and should not be overlooked. Oil has risen, but has
struggled to maintain traction; 2010 should see a firmer tone as demand returns.
Natural gas looks to have bottomed and faces much improved prices ahead.
This material should be regarded as a marketing communication and may have been produced in conjunction with the RBS trading desks that trade as principal in the instruments mentioned herein.

The Royal Bank of Scotland
Qu
arte
rly
Co
mm
od
ity
Co
mp
anio
n |
1 O
cto
ber
200
9
2
Companion contents Commodities in a nutshell 3
Commodity positioning 6
Overview – Boom, bust, re-adjust 7 Commodity price forecasts - 2009-13F 20
Economic focus – No straight line to sustained expansion 23 Economics – China special – The euphoria will fade 32
Commodity reviews
Industrial/base metals Aluminium – Economically geared metal faces huge challenges 34 Copper – Remains our most favoured base metal 42 Nickel – Back from the abyss - but too fast too early? 51 Zinc – Middle order batsman biding its time 59 Lead – Destined for even greater glory 65 Tin – This laggard should start catching up in 2010 70
Precious metals Gold – Agnostics become believers – well done gold! 72 Silver – Partying to the hilt 81 Platinum and palladium – PGMs comfortably eclipse gold 84
Bulk commodities Iron ore – Structural change in iron ore 91 Coal – No return to previous price lows 100
Energy Crude oil – Looking for Q4 09 economic recovery 111 US natural gas – Prompt prices have likely bottomed 117 Uranium – Uranium demand is on the rise 120
Quant analytics Commodity & FX relationships – Currencies predict commodity prices 128
Commodity Companion appendix Guide to everyday uses for commodities 131 A simple guide to commodity indices 134 Commodity indices – negative roll reduces returns 138 Precious metal ETFs – stabilisation 140 World’s top commodity producers and consumers 142 Global refined base & precious metal production and consumption 154 World’s top 50 central bank gold holdings 159 30-year real and nominal base and precious metal prices 160 Glossary of useful mining and industry websites 163
We thank our colleagues across asset classes for their invaluable contributions to this Commodity Companion.

The Royal Bank of Scotland
Qu
arte
rly
Co
mm
od
ity
Co
mp
anio
n |
1 O
cto
ber
200
9
3
Commodities in a nutshell
Aluminium (transport, packaging, construction)
Aluminium’s price recovery from the lows has been the most
muted among the base metals. It may well have the
greatest upside potential from current price levels in the
longer term but we take a broadly neutral stance for 2010.
Aluminium is economically geared and we expect demand
growth of 10% pa in 2010-11. But nearly half the producer
cutbacks of ~7mtpa have already been unwound and we
forecast that the market will remain in surplus in 2010.
However, industry stocks are very low and we expect the
market to be tightening rapidly by 2012. We forecast that
the aluminium price will top US$3,000/t in 2013.
RBS aluminium price forecasts
Current 2008 2009F 2010F 2011F 2012F 2013F LT
US¢/lb 84 117 75 90 100 115 130 110
US$/t 1,850 2,571 1,645 2,000 2,200 2,525 2,875 2,425
Source: LME, RBS forecasts
Nickel (stainless steels and alloys)
Nickel is our least preferred industrial metal. It is burdened
with a big overhang of excess inventory and idled capacity,
plus a parade of new mines. All this will take time to be
absorbed and we expect the nickel price to drift in 2010.
However, nickel is economically highly geared and after a
sharp decline since 2006, we forecast that demand will rise
by 10% pa in 2010-13. This should tip the market into deficit
in 2012-13 and finally lead to some pricing tension.
RBS nickel price forecasts
Current 2008 2009F 2010F 2011F 2012F 2013F LT
US$/lb 7.87 9.53 6.67 7.05 7.95 8.75 10.45 6.80
US$/t 17,340 21,020 14,700 15,500 17,500 19,250 23,000 15,000
Source: LME, RBS forecasts
Lead (lead-acid batteries)
Lead has been the best performer of 2009 to date, partly
due to the relative resilience of demand. Production from
scrap cannot on its own meet future demand growth and
the primary sector is hampered by lead’s by-product status.
We expect the lead market to return to deficit in 2011-13,
leaving it just as tight as in 2006-07. After consolidating in
2010, the lead price is forecast to reach US$2,750/t in 2013.
RBS lead price forecasts
Current 2008 2009F 2010F 2011F 2012F 2013F LT
US¢/lb 103 95 77 102 109 115 125 77
US$/t 2,275 2,084 1,700 2,250 2,400 2,525 2,750 1,700
Source: LME, RBS forecasts
Copper (electrical cable, wiring and tubing)
Copper remains our most preferred base metal. It may not
have the greatest upside from current levels but we expect
the copper price to reach a new all-time high by 2013.
Copper’s demand prospects are not among the best but we
believe copper producers will have the most difficulty in
keeping up with growing demand. We forecast an
underlying market deficit by 2011 and that by 2013 it will be
fast approaching pre-recession tightness.
Before then, copper still has some work to do. A large
surplus has been disguised by Chinese stockpiling and
some material may resurface, so easing the path to deficit.
RBS copper price forecasts
Current 2008 2009F 2010F 2011F 2012F 2013F LT
US¢/lb 278 315 230 305 330 375 410 225
US$/t 6,135 6,951 5,075 6,750 7,250 8,250 9,000 4,950
Source: LME, RBS forecasts
Zinc (galvanized steel for corrosion protection)
Zinc has been in the middle of the base metal pack in 2009
and we expect it to remain there in 2010-11 before it comes
into its own in 2012-13. We forecast that zinc will grind
higher next year but that it will top US$2,500/t by 2013.
The zinc market has been in hefty surplus in 2009 and we
expect it to stay in (smaller) surplus in 2010-11 as producer
restarts offset strong demand growth. But the lean pipeline
of new mine capacity points to large deficit from 2012.
RBS zinc price forecasts
Current 2008 2009F 2010F 2011F 2012F 2013F LT
US¢/lb 87 85 72 92 98 109 116 82
US$/t 1,910 1,870 1,585 2,025 2,150 2,400 2,550 1,800
Source: LME, RBS forecasts
Tin (solders, food/beverage tinplate cans)
Tin has had its own drama but has lagged behind in this
year’s price recovery. We expect it to start catching up in
2010 and forecast that tin will eventually hit US$18,000/t.
Tin demand has fallen heavily since 2006 and a sizeable
surplus has developed this year. But we forecast that
supply will barely keep up with recovering demand next
year and expect growing market tightness from 2011.
RBS tin price forecasts
Current 2008 2009F 2010F 2011F 2012F 2013F LT
US$/lb 6.85 8.39 6.25 7.25 7.80 8.05 8.15 6.80
US$/t 15,100 18,487 13,775 16,000 17,250 17,750 18,000 15,000
Source: LME, RBS forecasts
The Royal Bank of Scotland
Qu
arte
rly
Co
mm
od
ity
Co
mp
anio
n |
1 O
cto
ber
200
9
4
Gold (jewellery, investment, coins)
Gold set to average ~US$950/oz in 2009, will uniquely
among the metals, have had 8 consecutive years of higher
yoy average annual prices. An enviable track record.
Gold above the US$1,000/oz marker is the canary in the
mine. Gold is a classic harbinger of future inflation (watch
out bonds). It has also drawn strength from the weaker US
dollar and acute investor interest despite weak jewellery
sales. These should reverse as we enter the Gifting Season
Physically backed gold ETFs are now worth a record
US$55bn. A new Central Bank Gold Agreement has come
into force, but even central bankers like gold, with the
CBGA2 ending with the lowest annual sales in 10 years!
RBS gold price forecasts
Current 2008 2009F 2010F 2011F 2012F 2013F LT
US$/oz 1,000 872 950 1,000 975 1,000 1,150 825
Source: LBMA, RBS forecasts
Platinum (vehicle auto catalysts, jewellery, coins)
Even after its impressive price recovery this year, we expect
platinum to trend much higher through 2010-13, outshining
gold and eventually returning towards US$2,000/oz.
Industrial and jewellery demand should recover strongly in
2010-11. We forecast that platinum producers will struggle
to keep pace, and buoyant physical investment demand
may lead to real market tightness in the years ahead.
RBS platinum price forecasts
Current 2008 2009F 2010F 2011F 2012F 2013F LT
US$/oz 1,285 1,572 1,200 1,450 1,550 1,600 1,800 1,400
Source: LBMA, RBS forecasts
Coal (power generation, steel production)
Annual contract metallurgical coal prices for 2009/10
slumped by about 60%, but the market has already
tightened since on strong Chinese steel production. Indian
demand should be supportive too and we forecast a 17%
recovery in hard coking coal price contracts for 2010/11.
Thermal coal remains a buyer’s market. However, we
expect Indonesian exports to decline and Indian imports to
rise in the coming years, necessitating more investment in
Australian capacity. With costs proving sticky, we forecast
modestly higher thermal coal prices in 2010 and beyond.
RBS coal price forecasts
US$/tonne 2008 2009 2010F 2011F 2012F 2013F LT
Hard Coking
305 128 150 150 145 145 100
% yoy 211% -58% 17% 0% -3% 0%
Thermal 125 69 75 78 80 83 65
% yoy 125% -45% 9% 3% 3% 3%
Source: TEX, Platt’s, RBS forecast
Silver (photography, jewellery, investment)
In traditional fundamental terms, silver remains, in our view,
the weakest of the precious metals. Yet its price recovery
has been amongst the strongest. Silver is a geared play on
gold and investor appetite has been voracious.
Photography is likely to continue to decline and jewellery
demand is sensitive to price. Against this, scrap supply is
forecast to decline and mine output to stagnate, but we
expect underlying supply surplus to persist.
However, physical investment, chiefly through the ETFs, has
shown itself amply able to hoover up the surpluses. We see
no reason why this should not continue, given the outlook
for gold. Silver is forecast to trend up towards US$20/oz.
RBS silver price forecasts
Current 2008 2009F 2010F 2011F 2012F 2013F LT
US$/oz 16.40 14.99 14.50 17.50 16.00 16.75 19.00 13.00
Source: LBMA, RBS forecasts
Palladium (auto catalysts, jewellery, electronics)
We believe palladium has the most upside potential of all
exchange-traded metals and forecast that the price will
more than double in the next four years to US$700/oz plus.
Even with soaring scrap supply, rebounding industrial
demand will keep the palladium market in large underlying
deficit. Robust physical investment may further tighten the
market and crucial Russian state sales will eventually end.
RBS palladium price forecasts
Current 2008 2009F 2010F 2011F 2012F 2013F LT
US$/oz 290 351 250 350 400 475 650 400
Source: LBMA, RBS forecasts
Iron ore (raw material for steel production)
We have raised our forecast of the long-term iron ore price.
For fines we have raised it by fully 33%. With China, not
Japan, now the price setter, marginal costs in China must
be taken into account as well as the incentive price for
Australian and Brazilian production.
In the shorter term we still forecast a modest recovery in
annual contract iron ore prices for 2010/11 despite the
recent decline in spot prices. We expect a marginal under-
utilisation of iron ore production capacity in the next few
years but cutbacks in China should limit any surplus.
RBS iron ore price forecasts
US¢/dltu 2008 2009F 2010F 2011F 2012F 2013F LT
Fines 147 99 108 117 105 94 86
% yoy 80% -33% 10% 7% -10% -10%
Lump 205 114 125 135 124 112 102
% yoy 97% -44% 10% 8% -8% -10%
Source: TEX, Platt’s, RBS forecast
The Royal Bank of Scotland
Qu
arte
rly
Co
mm
od
ity
Co
mp
anio
n |
1 O
cto
ber
200
9
5
Crude oil (transport, petrochemicals)
The sharp contraction in global petroleum demand seen in
late 2008 and into 2009 led to the rapid build up of crude oil
and distillates inventories around the world.
Despite little recovery in real demand for petroleum
products and near record levels of crude and distillate
inventories, crude prices have rallied from their lows. YTD
crude oil has traded more in line with equity and currency
markets than the intrinsic supply/demand balance of crude.
Short term, oil markets need to see global distillate
inventories begin to draw down for WTI to trade significantly
above $80/bbl. Longer term we expect the upturn in the
business cycle drive a recovery in real demand that will
push prices back towards $100/bbl by 2013.
RBS crude oil price forecasts
US$/bbl Current 2008 2009F 2010F 2011F 2012F 2013F
WTI 67 99.75 62 78 85 90 100
% yoy 38% -38% 26% 10% 6% 11%
Brent 66 98.52 63 79 87 92 102
% yoy 36% -36% 26% 9% 6% 11%
Source: Bloomberg, RBS Sempra forecasts
US natural gas (heating, power generation)
We do not believe US production will exceed total storage
so as to cause an inventory glut in October. The prompt US
gas price has likely bottomed, but heavy inventories will
keep prices depressed until the onset of cold winter. The US year over year inventory surplus will slowly be
worked off over the course of this coming winter, supporting
prices in 2010. However, a bull market in US natural gas is
unlikely to develop in the near term without signs of a larger
than expected decline in domestic production. Longer term we expect to see the prompt US natgas price
back towards $7/MMBtu. The Baker Hughes US rig count
remains at heavily depressed levels. As a result, when gas
demand picks up the supply response may be delayed.
This should underpin stronger prices in the longer term.
RBS US natural gas price forecast – prompt NYMEX/Henry Hub
$/MMBtu Current 2008 2009F 2010F 2011F 2012F 2013F
H-Hub 4.80 8.90 4.25 6.25 6.50 6.75 7.00
% yoy 25% -52% 47% 4% 4% 4%
Source: Bloomberg, RBS Sempra forecasts
Uranium (power generation)
A steady stream of new reactors coming on line in the
coming years, predominantly in Russia and China, will
support stable uranium demand growth.
Supply of US-Russian HEU (highly enriched uranium) is due
to end in 2013. Forecast increases in mine production will
not offset the exit of US-Russian HEU; as a result we expect
the uranium market to move into deficit by 2014.
We believe the days of sub-US$20/lb uranium are history.
New mine operating costs are US$20-30/lb; this will provide
a firm floor to the uranium price. We forecast that the
uranium price will peak in late 2011 at US$95/lb as the
market tightens ahead of the expiry of the US-Russian HEU
down blending programme in 2013.
RBS spot uranium price forecasts
US$/lb 2008 2009F 2010F 2011F 2012F 2013F
63.4 47.4 58.8 82.5 82.5 65.0
% yoy -25% 24% 40% 0% -21%
Source: UxC , RBS forecasts

The Royal Bank of Scotland
Qu
arte
rly
Co
mm
od
ity
Co
mp
anio
n |
1 O
cto
ber
200
9
6
Ranked forecast price moves for key exchange traded commodities from September average price levels to the RBS forecasts 1 and 4 years ahead
Sept.’09 Av. Q4 10F Av. % Change H2 13F Av. % Change
Industrial
Aluminium US$/t 1,834 2,100 15% 3,000 64%
Copper US$/t 6,196 7,000 13% 9,500 53%
Zinc US$/t 1,884 2,100 11% 2,600 38%
Nickel US$/t 17,468 16,000 -8% 24,000 37%
Lead US$/t 2,204 2,250 2% 2,800 27%
Tin US$/t 14,858 16,500 11% 17,750 19%
Precious
Palladium US$/oz 293 375 28% 700 139%
Platinum US$/oz 1,289 1,500 16% 1,900 47%
Silver US$/oz 16.39 17.50 7% 20.00 22%
Gold US$/oz 997 1,000 0% 1,200 20%
Oil & Gas
H-Hub Natgas US$/MMBtu 3.46 6.50 88% 7.00 102%
Brent Crude Oil US$/bbl 68 82 21% 100 47%
Source: Bloomberg, RBS forecasts
Source: RBS
1-year preferences - Forecasts move from Sept. 09 average spot prices to RBS Q4 10F average forecasts
-8%
0%
2%
7%
11%
11%
13%
15%
16%
21%
28%
-20% -10% 0% 10% 20% 30% 40%
Nickel
Gold
Lead
Silver
Tin
Zinc
Copper
Aluminium
Platinum
Crude Oil
Palladium
Source: RBS
4-year preferences - Forecast move from Sept. 09 average spot prices to RBS H2 13F average forecasts
19%
20%
22%
27%
37%
38%
47%
47%
53%
64%
102%
139%
0% 20% 40% 60% 80% 100% 120% 140% 160%
Tin
Gold
Silver
Lead
Nickel
Zinc
Crude Oil
Platinum
Copper
Aluminium
Natgas
Palladium
Commodity positioning The table below shows our commodity preferences over two time frames. The
first is a year ahead. We have taken the average spot price in September 2009
and compared it with our price forecast averages for the final quarter of 2010.
On this analysis we are from current levels most bullish on natural gas (+88%),
palladium (+28%), oil (+21%) and platinum (+16%). Our least favoured are
nickel (-8%); gold (n/c) and lead (2%).
However, the rankings change if we view current prices in relation to our H2
2013 expectations for deep inventory-draining deficits to have emerged, the
world economy to be fully back into its stride and commodities in general to be in
effervescent mood. Our top picks on a four-year view are palladium (+139%),
natural gas (102%), aluminium (64%) and copper (53%).
The Royal Bank of Scotland
Qu
arte
rly
Co
mm
od
ity
Co
mp
anio
n |
1 O
cto
ber
200
9
7
Source: LME and RBS
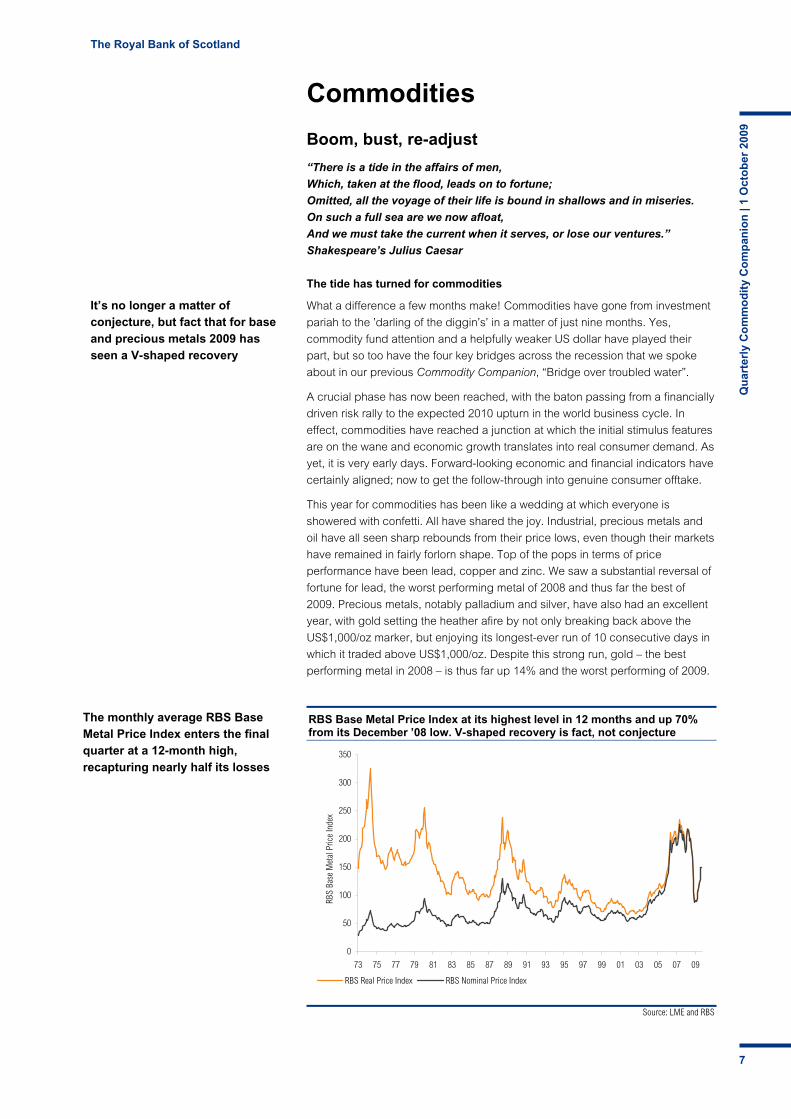
RBS Base Metal Price Index at its highest level in 12 months and up 70% from its December ’08 low. V-shaped recovery is fact, not conjecture
0
50
100
150
200
250
300
350
73 75 77 79 81 83 85 87 89 91 93 95 97 99 01 03 05 07 09
RBS
Base
Met
al P
rice
Inde
x
RBS Real Price Index RBS Nominal Price Index
Commodities
Boom, bust, re-adjust
“There is a tide in the affairs of men,
Which, taken at the flood, leads on to fortune;
Omitted, all the voyage of their life is bound in shallows and in miseries.
On such a full sea are we now afloat,
And we must take the current when it serves, or lose our ventures.”
Shakespeare’s Julius Caesar
The tide has turned for commodities
What a difference a few months make! Commodities have gone from investment
pariah to the ’darling of the diggin’s’ in a matter of just nine months. Yes,
commodity fund attention and a helpfully weaker US dollar have played their
part, but so too have the four key bridges across the recession that we spoke
about in our previous Commodity Companion, “Bridge over troubled water”.
A crucial phase has now been reached, with the baton passing from a financially
driven risk rally to the expected 2010 upturn in the world business cycle. In
effect, commodities have reached a junction at which the initial stimulus features
are on the wane and economic growth translates into real consumer demand. As
yet, it is very early days. Forward-looking economic and financial indicators have
certainly aligned; now to get the follow-through into genuine consumer offtake.
This year for commodities has been like a wedding at which everyone is
showered with confetti. All have shared the joy. Industrial, precious metals and
oil have all seen sharp rebounds from their price lows, even though their markets
have remained in fairly forlorn shape. Top of the pops in terms of price
performance have been lead, copper and zinc. We saw a substantial reversal of
fortune for lead, the worst performing metal of 2008 and thus far the best of
2009. Precious metals, notably palladium and silver, have also had an excellent
year, with gold setting the heather afire by not only breaking back above the
US$1,000/oz marker, but enjoying its longest-ever run of 10 consecutive days in
which it traded above US$1,000/oz. Despite this strong run, gold – the best
performing metal in 2008 – is thus far up 14% and the worst performing of 2009.
It’s no longer a matter of conjecture, but fact that for base and precious metals 2009 has seen a V-shaped recovery
The monthly average RBS Base Metal Price Index enters the final quarter at a 12-month high, recapturing nearly half its losses
The Royal Bank of Scotland
Qu
arte
rly
Co
mm
od
ity
Co
mp
anio
n |
1 O
cto
ber
200
9
8
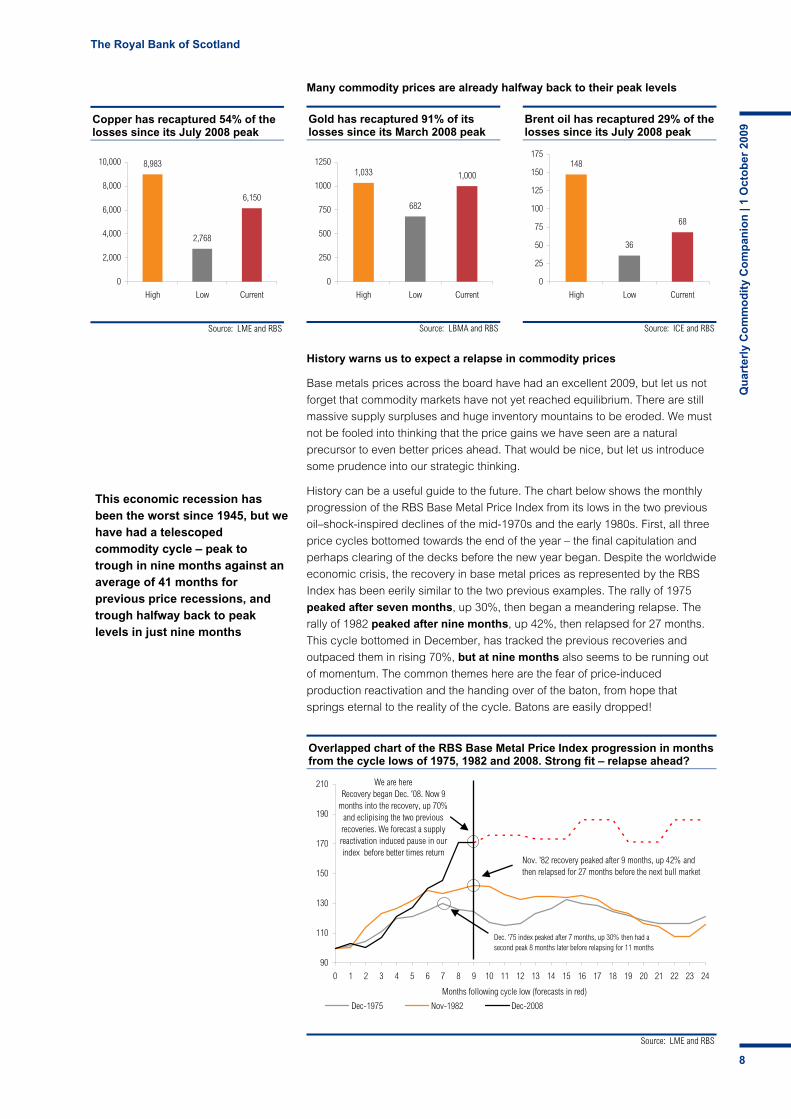
Source: ICE and RBS
Brent oil has recaptured 29% of the losses since its July 2008 peak
148
36
68
0
25
50
75
100
125
150
175
High Low Current
Source: LME and RBS
Copper has recaptured 54% of the losses since its July 2008 peak
8,983
2,768
6,150
0
2,000
4,000
6,000
8,000
10,000
High Low Current
Source: LBMA and RBS
Gold has recaptured 91% of its losses since its March 2008 peak
1,033
682
1,000
0
250
500
750
1000
1250
High Low Current
Source: LME and RBS
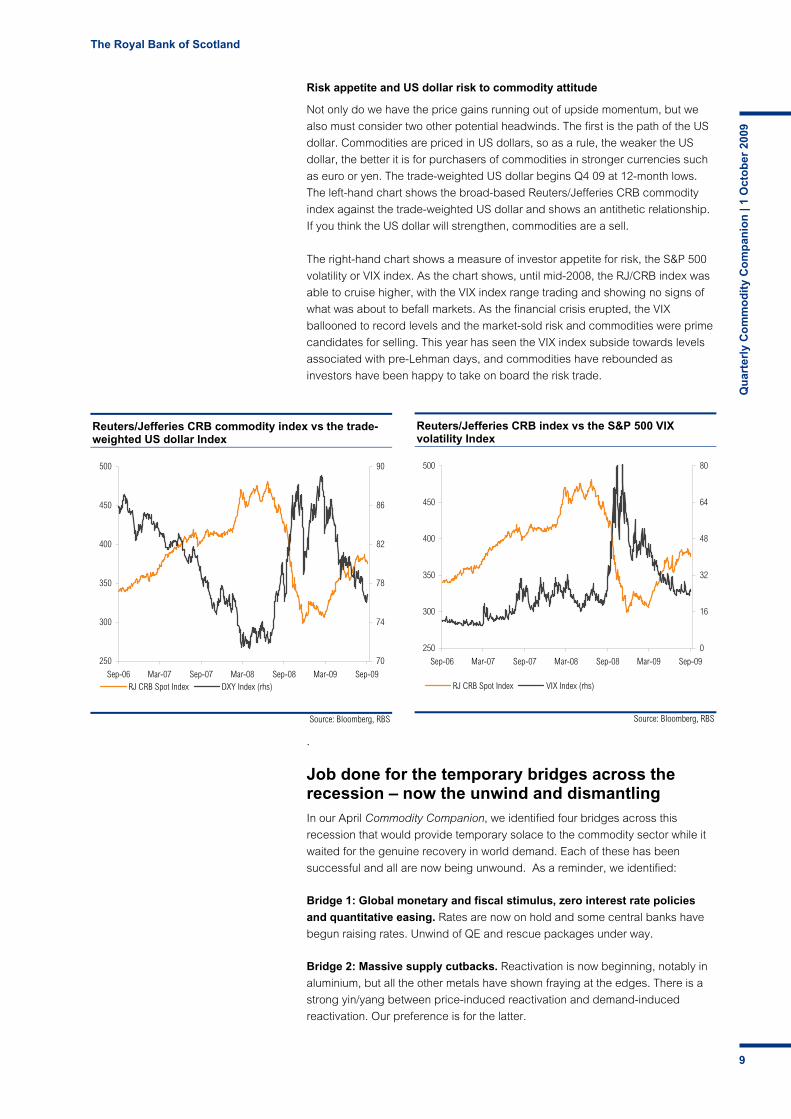
Overlapped chart of the RBS Base Metal Price Index progression in months from the cycle lows of 1975, 1982 and 2008. Strong fit – relapse ahead?
90
110
130
150
170
190
210
0 1 2 3 4 5 6 7 8 9 10 11 12 13 14 15 16 17 18 19 20 21 22 23 24
Months following cycle low (forecasts in red)
Dec-1975 Nov-1982 Dec-2008
We are here Recovery began Dec. '08. Now 9
months into the recovery, up 70% and eclipising the two previous recoveries. We forecast a supply reactivation induced pause in our index before better times return
Dec. '75 index peaked after 7 months, up 30% then had a second peak 8 months later before relapsing for 11 months
Nov. '82 recovery peaked after 9 months, up 42% and then relapsed for 27 months before the next bull market
Many commodity prices are already halfway back to their peak levels
History warns us to expect a relapse in commodity prices
Base metals prices across the board have had an excellent 2009, but let us not
forget that commodity markets have not yet reached equilibrium. There are still
massive supply surpluses and huge inventory mountains to be eroded. We must
not be fooled into thinking that the price gains we have seen are a natural
precursor to even better prices ahead. That would be nice, but let us introduce
some prudence into our strategic thinking.
History can be a useful guide to the future. The chart below shows the monthly
progression of the RBS Base Metal Price Index from its lows in the two previous
oil–shock-inspired declines of the mid-1970s and the early 1980s. First, all three
price cycles bottomed towards the end of the year – the final capitulation and
perhaps clearing of the decks before the new year began. Despite the worldwide
economic crisis, the recovery in base metal prices as represented by the RBS
Index has been eerily similar to the two previous examples. The rally of 1975
peaked after seven months, up 30%, then began a meandering relapse. The
rally of 1982 peaked after nine months, up 42%, then relapsed for 27 months.
This cycle bottomed in December, has tracked the previous recoveries and
outpaced them in rising 70%, but at nine months also seems to be running out
of momentum. The common themes here are the fear of price-induced
production reactivation and the handing over of the baton, from hope that
springs eternal to the reality of the cycle. Batons are easily dropped!
This economic recession has been the worst since 1945, but we have had a telescoped commodity cycle – peak to trough in nine months against an average of 41 months for previous price recessions, and trough halfway back to peak levels in just nine months
The Royal Bank of Scotland
Qu
arte
rly
Co
mm
od
ity
Co
mp
anio
n |
1 O
cto
ber
200
9
9
Source: Bloomberg, RBS
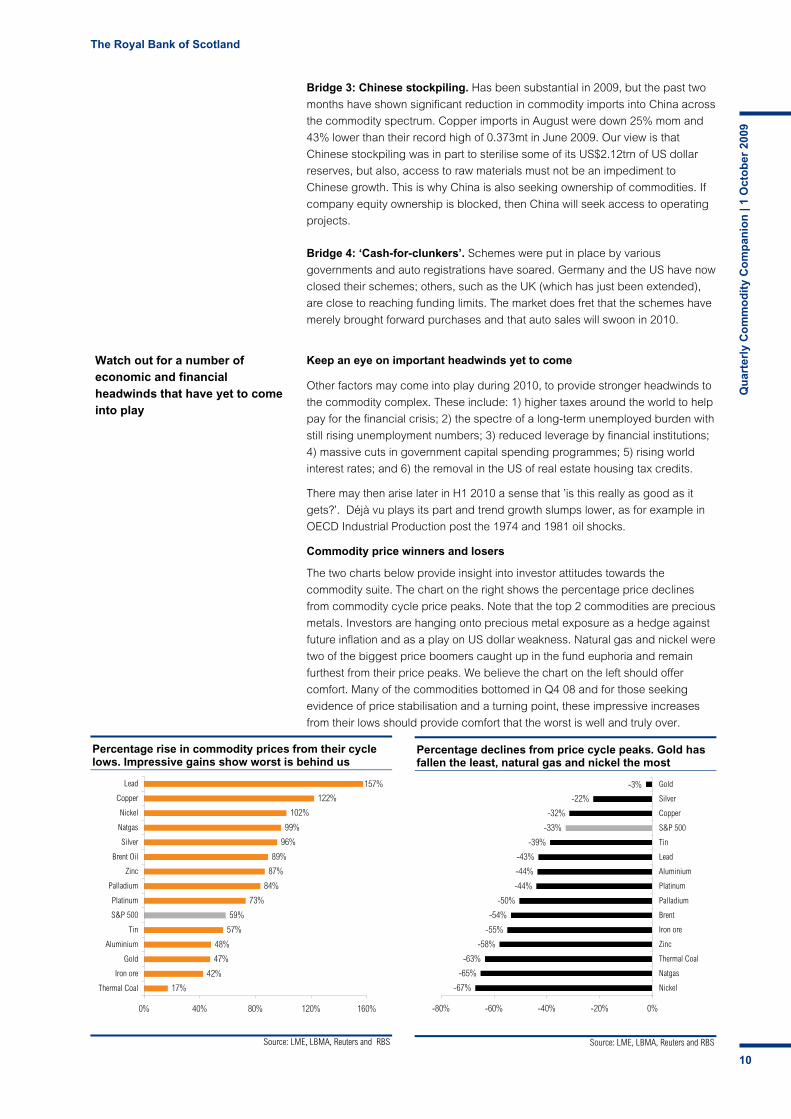
Reuters/Jefferies CRB commodity index vs the trade- weighted US dollar Index
250
300
350
400
450
500
Sep-06 Mar-07 Sep-07 Mar-08 Sep-08 Mar-09 Sep-09
70
74
78
82
86
90
RJ CRB Spot Index DXY Index (rhs)
Source: Bloomberg, RBS
Reuters/Jefferies CRB index vs the S&P 500 VIX volatility Index
250
300
350
400
450
500
Sep-06 Mar-07 Sep-07 Mar-08 Sep-08 Mar-09 Sep-09
0
16
32
48
64
80
RJ CRB Spot Index VIX Index (rhs)
Risk appetite and US dollar risk to commodity attitude
Not only do we have the price gains running out of upside momentum, but we
also must consider two other potential headwinds. The first is the path of the US
dollar. Commodities are priced in US dollars, so as a rule, the weaker the US
dollar, the better it is for purchasers of commodities in stronger currencies such
as euro or yen. The trade-weighted US dollar begins Q4 09 at 12-month lows.
The left-hand chart shows the broad-based Reuters/Jefferies CRB commodity
index against the trade-weighted US dollar and shows an antithetic relationship.
If you think the US dollar will strengthen, commodities are a sell.
The right-hand chart shows a measure of investor appetite for risk, the S&P 500
volatility or VIX index. As the chart shows, until mid-2008, the RJ/CRB index was
able to cruise higher, with the VIX index range trading and showing no signs of
what was about to befall markets. As the financial crisis erupted, the VIX
ballooned to record levels and the market-sold risk and commodities were prime
candidates for selling. This year has seen the VIX index subside towards levels
associated with pre-Lehman days, and commodities have rebounded as
investors have been happy to take on board the risk trade.
.
Job done for the temporary bridges across the recession – now the unwind and dismantling In our April Commodity Companion, we identified four bridges across this
recession that would provide temporary solace to the commodity sector while it
waited for the genuine recovery in world demand. Each of these has been
successful and all are now being unwound. As a reminder, we identified:
Bridge 1: Global monetary and fiscal stimulus, zero interest rate policies
and quantitative easing. Rates are now on hold and some central banks have
begun raising rates. Unwind of QE and rescue packages under way.
Bridge 2: Massive supply cutbacks. Reactivation is now beginning, notably in
aluminium, but all the other metals have shown fraying at the edges. There is a
strong yin/yang between price-induced reactivation and demand-induced
reactivation. Our preference is for the latter.
The Royal Bank of Scotland
Qu
arte
rly
Co
mm
od
ity
Co
mp
anio
n |
1 O
cto
ber
200
9
10
Source: LME, LBMA, Reuters and RBS
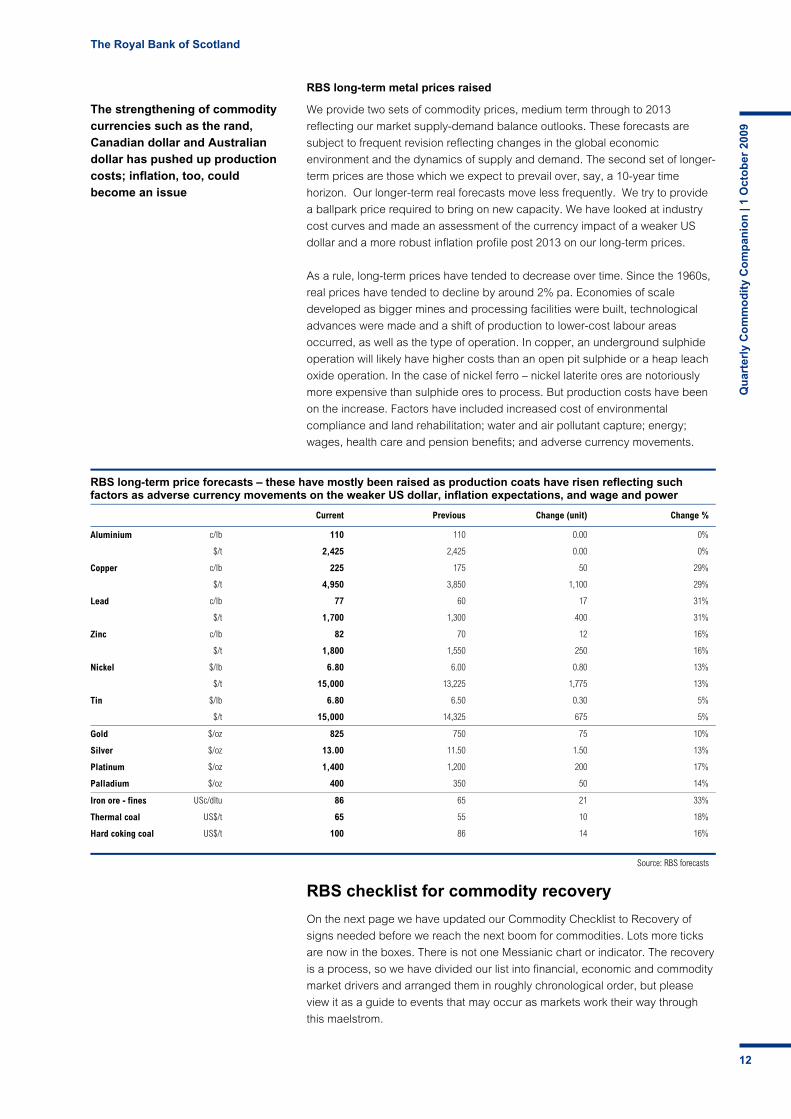
Percentage rise in commodity prices from their cycle lows. Impressive gains show worst is behind us
17%
42%
47%
48%
57%
59%
73%
84%
87%
89%
96%
99%
102%
122%
157%
0% 40% 80% 120% 160%
Thermal Coal
Iron ore
Gold
Aluminium
Tin
S&P 500
Platinum
Palladium
Zinc
Brent Oil
Silver
Natgas
Nickel
Copper
Lead
Source: LME, LBMA, Reuters and RBS
Percentage declines from price cycle peaks. Gold has fallen the least, natural gas and nickel the most
-67%
-65%
-63%
-58%
-55%
-54%
-50%
-44%
-44%
-43%
-39%
-33%
-32%
-22%
-3%
-80% -60% -40% -20% 0%
Nickel
Natgas
Thermal Coal
Zinc
Iron ore
Brent
Palladium
Platinum
Aluminium
Lead
Tin
S&P 500
Copper
Silver
Gold
Bridge 3: Chinese stockpiling. Has been substantial in 2009, but the past two
months have shown significant reduction in commodity imports into China across
the commodity spectrum. Copper imports in August were down 25% mom and
43% lower than their record high of 0.373mt in June 2009. Our view is that
Chinese stockpiling was in part to sterilise some of its US$2.12trn of US dollar
reserves, but also, access to raw materials must not be an impediment to
Chinese growth. This is why China is also seeking ownership of commodities. If
company equity ownership is blocked, then China will seek access to operating
projects.
Bridge 4: ‘Cash-for-clunkers’. Schemes were put in place by various
governments and auto registrations have soared. Germany and the US have now
closed their schemes; others, such as the UK (which has just been extended),
are close to reaching funding limits. The market does fret that the schemes have
merely brought forward purchases and that auto sales will swoon in 2010.
Keep an eye on important headwinds yet to come
Other factors may come into play during 2010, to provide stronger headwinds to
the commodity complex. These include: 1) higher taxes around the world to help
pay for the financial crisis; 2) the spectre of a long-term unemployed burden with
still rising unemployment numbers; 3) reduced leverage by financial institutions;
4) massive cuts in government capital spending programmes; 5) rising world
interest rates; and 6) the removal in the US of real estate housing tax credits.
There may then arise later in H1 2010 a sense that ’is this really as good as it
gets?’. Déjà vu plays its part and trend growth slumps lower, as for example in
OECD Industrial Production post the 1974 and 1981 oil shocks.
Commodity price winners and losers
The two charts below provide insight into investor attitudes towards the
commodity suite. The chart on the right shows the percentage price declines
from commodity cycle price peaks. Note that the top 2 commodities are precious
metals. Investors are hanging onto precious metal exposure as a hedge against
future inflation and as a play on US dollar weakness. Natural gas and nickel were
two of the biggest price boomers caught up in the fund euphoria and remain
furthest from their price peaks. We believe the chart on the left should offer
comfort. Many of the commodities bottomed in Q4 08 and for those seeking
evidence of price stabilisation and a turning point, these impressive increases
from their lows should provide comfort that the worst is well and truly over.
Watch out for a number of economic and financial headwinds that have yet to come into play

The Royal Bank of Scotland
Qu
arte
rly
Co
mm
od
ity
Co
mp
anio
n |
1 O
cto
ber
200
9
11
Source: Company releases and RBS
Producer cutbacks and restarts as a percentage of 2008 world output – restarts are mounting, stark and worrying differences between the metals
0% 5% 10% 15% 20% 25%
Nickel (mine)
Aluminium
Zinc (smelter)
Zinc (mine) *
Lead (refinery)
Lead (mine) *
Copper (smelter)
Copper (mine)
Cutbacks still in place Restarts * Excludes China
Forget cutbacks; production restarts have begun
The flood of producer cutbacks in the base metal industry in Q4 08 and Q1 09
slowed to a mere rivulet in Q2 09 as price stabilisation hardened into recovery.
Moreover, there were just a handful of further cutbacks in the third quarter,
outnumbered by announcements of restarts as prices continued to firm. Even in
the second quarter China, which had been in the forefront of the cutbacks, was
quietly and not so quietly reactivating capacity across most base metal
industries, and it was joined in Q3 by several producers elsewhere.
We see some potentially worrying aspects to recent developments. In the first
place, restarts have been induced more by price than by demand. Chinese
stockpiling, which by its nature may be only temporary, played a significant
behind-the-scenes role in triggering reactivation within China, and globally, there
were still only tentative signs of a pick-up in genuine base metal demand.
Second, the restarts paradoxically have been heavily concentrated in one of the
most oversupplied markets, aluminium. Third, there remains a huge overhang of
closed nickel capacity. Ironically, few of the admittedly modest cutbacks in the
fundamentally strongest market, copper mining, have yet been reversed.
Our chart below shows estimates of the capacity cutback since mid-2008 and
the reactivation of that capacity, both expressed as a percentage of 2008 world
production. Although our figures do not capture big, hard-to-monitor cutbacks
and restarts in the Chinese lead/zinc mining industry, aluminium really stands
out. We estimate that the proportion of previously closed aluminium smelter
capacity (over 7mtpa at its peak) that has now restarted is fast approaching
50%. In aluminium, both cutbacks and restarts have been dominated by China.
Our estimates probably do not capture all the mines feeding the Chinese nickel
pig iron industry, but the chart shows that there remains a huge overhang of
idled nickel mine capacity worldwide, representing c20% of 2008 world output.
With the exception of copper and perhaps lead, we would urge producers to
be very cautious about embarking on price-induced as opposed to demand-
induced reactivation. For some metals, notably aluminium and nickel, this would
risk derailing the impressive recovery seen this year.
Producer cutbacks have ended and reactivation is now the theme; nickel and aluminium saw the biggest cuts as a percentage of world output
We prefer demand-induced reactivation, but some producers will not wait and will implement more risky price-induced reactivation
The Royal Bank of Scotland
Qu
arte
rly
Co
mm
od
ity
Co
mp
anio
n |
1 O
cto
ber
200
9
12
RBS long-term metal prices raised
We provide two sets of commodity prices, medium term through to 2013
reflecting our market supply-demand balance outlooks. These forecasts are
subject to frequent revision reflecting changes in the global economic
environment and the dynamics of supply and demand. The second set of longer-
term prices are those which we expect to prevail over, say, a 10-year time
horizon. Our longer-term real forecasts move less frequently. We try to provide
a ballpark price required to bring on new capacity. We have looked at industry
cost curves and made an assessment of the currency impact of a weaker US
dollar and a more robust inflation profile post 2013 on our long-term prices.
As a rule, long-term prices have tended to decrease over time. Since the 1960s,
real prices have tended to decline by around 2% pa. Economies of scale
developed as bigger mines and processing facilities were built, technological
advances were made and a shift of production to lower-cost labour areas
occurred, as well as the type of operation. In copper, an underground sulphide
operation will likely have higher costs than an open pit sulphide or a heap leach
oxide operation. In the case of nickel ferro – nickel laterite ores are notoriously
more expensive than sulphide ores to process. But production costs have been
on the increase. Factors have included increased cost of environmental
compliance and land rehabilitation; water and air pollutant capture; energy;
wages, health care and pension benefits; and adverse currency movements.
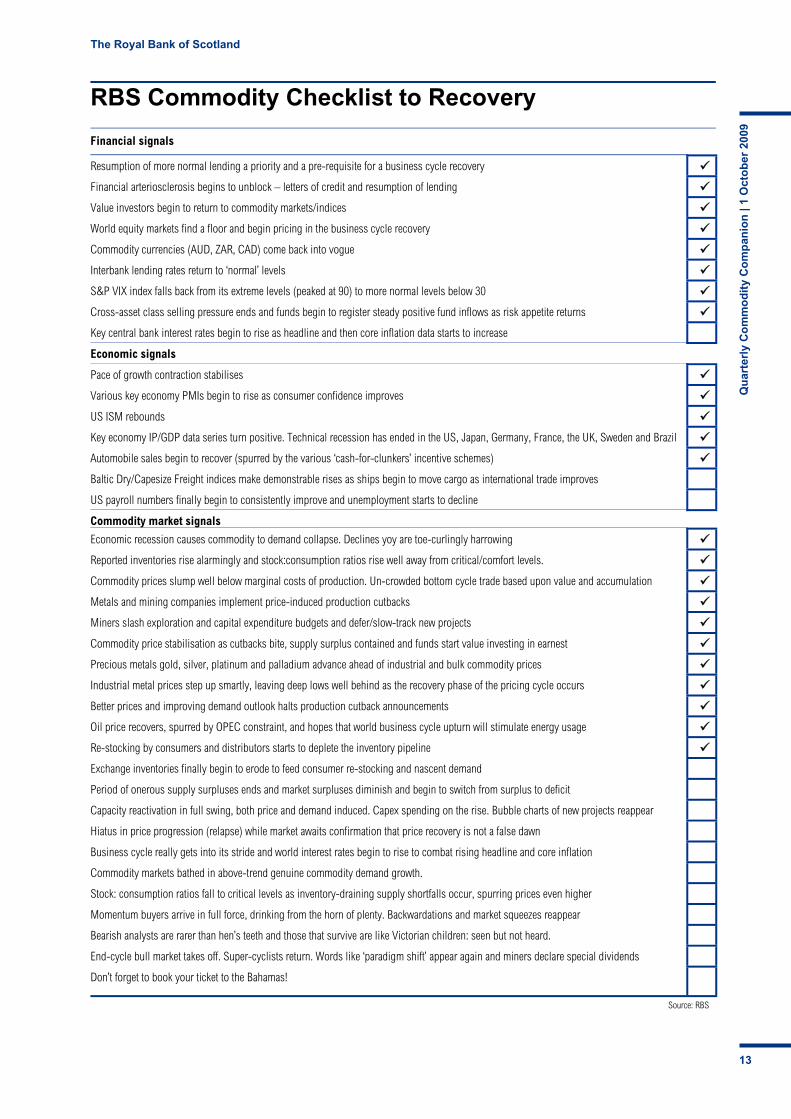
RBS checklist for commodity recovery
On the next page we have updated our Commodity Checklist to Recovery of
signs needed before we reach the next boom for commodities. Lots more ticks
are now in the boxes. There is not one Messianic chart or indicator. The recovery
is a process, so we have divided our list into financial, economic and commodity
market drivers and arranged them in roughly chronological order, but please
view it as a guide to events that may occur as markets work their way through
this maelstrom.
The strengthening of commodity currencies such as the rand, Canadian dollar and Australian dollar has pushed up production costs; inflation, too, could become an issue
RBS long-term price forecasts – these have mostly been raised as production coats have risen reflecting such factors as adverse currency movements on the weaker US dollar, inflation expectations, and wage and power
Current Previous Change (unit) Change %
Aluminium c/lb 110 110 0.00 0%
$/t 2,425 2,425 0.00 0%
Copper c/lb 225 175 50 29%
$/t 4,950 3,850 1,100 29%
Lead c/lb 77 60 17 31%
$/t 1,700 1,300 400 31%
Zinc c/lb 82 70 12 16%
$/t 1,800 1,550 250 16%
Nickel $/lb 6.80 6.00 0.80 13%
$/t 15,000 13,225 1,775 13%
Tin $/lb 6.80 6.50 0.30 5%
$/t 15,000 14,325 675 5%
Gold $/oz 825 750 75 10%
Silver $/oz 13.00 11.50 1.50 13%
Platinum $/oz 1,400 1,200 200 17%
Palladium $/oz 400 350 50 14%
Iron ore - fines USc/dltu 86 65 21 33%
Thermal coal US$/t 65 55 10 18%
Hard coking coal US$/t 100 86 14 16%
Source: RBS forecasts
The Royal Bank of Scotland
Qu
arte
rly
Co
mm
od
ity
Co
mp
anio
n |
1 O
cto
ber
200
9
13
RBS Commodity Checklist to Recovery
Financial signals
Resumption of more normal lending a priority and a pre-requisite for a business cycle recovery
Financial arteriosclerosis begins to unblock – letters of credit and resumption of lending
Value investors begin to return to commodity markets/indices
World equity markets find a floor and begin pricing in the business cycle recovery
Commodity currencies (AUD, ZAR, CAD) come back into vogue
Interbank lending rates return to ‘normal’ levels
S&P VIX index falls back from its extreme levels (peaked at 90) to more normal levels below 30
Cross-asset class selling pressure ends and funds begin to register steady positive fund inflows as risk appetite returns
Key central bank interest rates begin to rise as headline and then core inflation data starts to increase
Economic signals
Pace of growth contraction stabilises
Various key economy PMIs begin to rise as consumer confidence improves
US ISM rebounds
Key economy IP/GDP data series turn positive. Technical recession has ended in the US, Japan, Germany, France, the UK, Sweden and Brazil
Automobile sales begin to recover (spurred by the various ‘cash-for-clunkers’ incentive schemes)
Baltic Dry/Capesize Freight indices make demonstrable rises as ships begin to move cargo as international trade improves
US payroll numbers finally begin to consistently improve and unemployment starts to decline
Commodity market signals
Economic recession causes commodity to demand collapse. Declines yoy are toe-curlingly harrowing
Reported inventories rise alarmingly and stock:consumption ratios rise well away from critical/comfort levels.
Commodity prices slump well below marginal costs of production. Un-crowded bottom cycle trade based upon value and accumulation
Metals and mining companies implement price-induced production cutbacks
Miners slash exploration and capital expenditure budgets and defer/slow-track new projects
Commodity price stabilisation as cutbacks bite, supply surplus contained and funds start value investing in earnest
Precious metals gold, silver, platinum and palladium advance ahead of industrial and bulk commodity prices
Industrial metal prices step up smartly, leaving deep lows well behind as the recovery phase of the pricing cycle occurs
Better prices and improving demand outlook halts production cutback announcements
Oil price recovers, spurred by OPEC constraint, and hopes that world business cycle upturn will stimulate energy usage
Re-stocking by consumers and distributors starts to deplete the inventory pipeline
Exchange inventories finally begin to erode to feed consumer re-stocking and nascent demand
Period of onerous supply surpluses ends and market surpluses diminish and begin to switch from surplus to deficit
Capacity reactivation in full swing, both price and demand induced. Capex spending on the rise. Bubble charts of new projects reappear
Hiatus in price progression (relapse) while market awaits confirmation that price recovery is not a false dawn
Business cycle really gets into its stride and world interest rates begin to rise to combat rising headline and core inflation
Commodity markets bathed in above-trend genuine commodity demand growth.
Stock: consumption ratios fall to critical levels as inventory-draining supply shortfalls occur, spurring prices even higher
Momentum buyers arrive in full force, drinking from the horn of plenty. Backwardations and market squeezes reappear
Bearish analysts are rarer than hen’s teeth and those that survive are like Victorian children: seen but not heard.
End-cycle bull market takes off. Super-cyclists return. Words like ‘paradigm shift’ appear again and miners declare special dividends
Don’t forget to book your ticket to the Bahamas!
Source: RBS
The Royal Bank of Scotland
Qu
arte
rly
Co
mm
od
ity
Co
mp
anio
n |
1 O
cto
ber
200
9
14
Source: IMF, LME and RBS economic forecasts
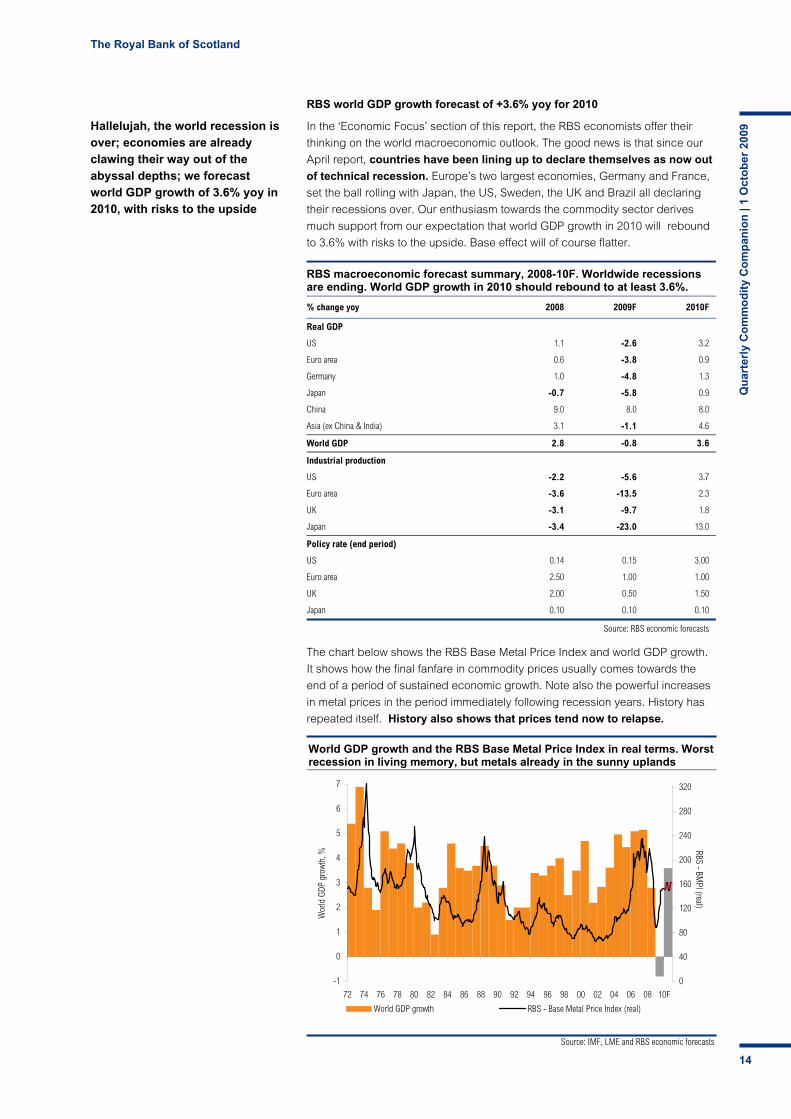
World GDP growth and the RBS Base Metal Price Index in real terms. Worst recession in living memory, but metals already in the sunny uplands
-1
0
1
2
3
4
5
6
7
72 74 76 78 80 82 84 86 88 90 92 94 96 98 00 02 04 06 08 10F
Wor
ld G
DP g
rowt
h, %
0
40
80
120
160
200
240
280
320
RBS - BMPI (real)
World GDP growth RBS - Base Metal Price Index (real)
RBS world GDP growth forecast of +3.6% yoy for 2010
In the ‘Economic Focus’ section of this report, the RBS economists offer their
thinking on the world macroeconomic outlook. The good news is that since our
April report, countries have been lining up to declare themselves as now out
of technical recession. Europe’s two largest economies, Germany and France,
set the ball rolling with Japan, the US, Sweden, the UK and Brazil all declaring
their recessions over. Our enthusiasm towards the commodity sector derives
much support from our expectation that world GDP growth in 2010 will rebound
to 3.6% with risks to the upside. Base effect will of course flatter.
The chart below shows the RBS Base Metal Price Index and world GDP growth.
It shows how the final fanfare in commodity prices usually comes towards the
end of a period of sustained economic growth. Note also the powerful increases
in metal prices in the period immediately following recession years. History has
repeated itself. History also shows that prices tend now to relapse.
Hallelujah, the world recession is over; economies are already clawing their way out of the abyssal depths; we forecast world GDP growth of 3.6% yoy in 2010, with risks to the upside
RBS macroeconomic forecast summary, 2008-10F. Worldwide recessions are ending. World GDP growth in 2010 should rebound to at least 3.6%.
% change yoy 2008 2009F 2010F
Real GDP
US 1.1 -2.6 3.2
Euro area 0.6 -3.8 0.9
Germany 1.0 -4.8 1.3
Japan -0.7 -5.8 0.9
China 9.0 8.0 8.0
Asia (ex China & India) 3.1 -1.1 4.6
World GDP 2.8 -0.8 3.6
Industrial production
US -2.2 -5.6 3.7
Euro area -3.6 -13.5 2.3
UK -3.1 -9.7 1.8
Japan -3.4 -23.0 13.0
Policy rate (end period)
US 0.14 0.15 3.00
Euro area 2.50 1.00 1.00
UK 2.00 0.50 1.50
Japan 0.10 0.10 0.10
Source: RBS economic forecasts

The Royal Bank of Scotland
Qu
arte
rly
Co
mm
od
ity
Co
mp
anio
n |
1 O
cto
ber
200
9
15
Source: LME and RBS
Total LME warehouse inventory is at record levels of 5.72mt – and is dominated by aluminium. Total inventory worth over a record US$14bn
0
1,000
2,000
3,000
4,000
5,000
6,000
83 85 87 89 91 93 95 97 99 01 03 05 07 09
'000
tonn
es
45
80
115
150
185
220
255
RBS Base Metal Index (real term
s)
Total LME inventory (lhs) RBS Base Metal Price Index in Real Terms (rhs)
Source: LME, RBS
Aluminium is 81% of total LME inventory and copper just 6%
81%
8% 6%2% 2% 0.4%
0%
15%
30%
45%
60%
75%
90%
Al Zn Cu Pb Ni Sn
Source: LME, RBS
But by value, aluminium is 60% with copper 15% (US$bn)
60%
15% 14%
6%2% 2%
0
2
3
5
6
8
9
Al Cu Ni Zn Sn Pb
LME inventories still at record highs
Total LME warehouse inventories at 5.72mt have now exceeded the previous
record high of 4.77mt seen at the end of April 1993. Industry destocking and
collapsing consumption have enabled the LME to live up to its mantra of being
the market of last resort. Warehouse inventory is now valued at over US$14bn.
The good news is that the pace of inventory accretion is slowing. Indeed,
September saw the lowest level of inventory build in 17 months.
Metal held in LME-registered warehouses is dominated by aluminium holdings.
Aluminium accounts for 81% of the inventory tonnage, zinc 8% and copper 6%.
In terms of inventory value, aluminium is 60%, copper 15% and nickel 14%.
Base metal refined production and consumption should rise in 2010F
Base metal refined production and consumption will contract across the board in
2009, with aluminium showing the worst demand fall, down 7.5% yoy and
stainless steel the biggest production slump down 12%. For much of the
commodity boom, we had price- and demand-induced capacity expansion and
price-induced demand destruction. The phase of price-induced production cuts
and the concept of idling swing capacity are also coming to an end. The game
now is about reactivation and first mover advantage. We forecast that all metals
will show yoy production expansion in 2010, with nickel and stainless steel
showing the greatest rises. This should be but the first year of significant
production additions from reactivated as well as new and expanded operations.
Contraction in world supply and demand in 2009; shared pain, shared gain as producers rapidly implemented closures; watch out now for across-the-board reactivation
Base metal annual yoy refined metal production growth, 2006-13F (%)
2006 2007 2008 2009F 2010F 2011F 2012F 2013F
Aluminium 5.9% 12.4% 5.3% -6.6% 4.0% 8.3% 6.5% 6.7%
Copper 4.3% 3.9% 0.9% -3.8% 3.2% 4.2% 4.0% 4.0%
Nickel 5.1% 6.3% -3.5% -7.5% 9.0% 6.5% 9.0% 6.5%
Stainless steel 14.4% -1.0% -6.0% -12.0% 10.0% 9.0% 14.0% 8.0%
Zinc 4.6% 7.3% 2.3% -7.0% 4.6% 6.6% 3.3% 3.2%
Lead 3.5% 2.5% 6.0% -4.1% 4.2% 4.7% 4.2% 4.8%
Source: CRU, RBS forecasts
The Royal Bank of Scotland
Qu
arte
rly
Co
mm
od
ity
Co
mp
anio
n |
1 O
cto
ber
200
9
16
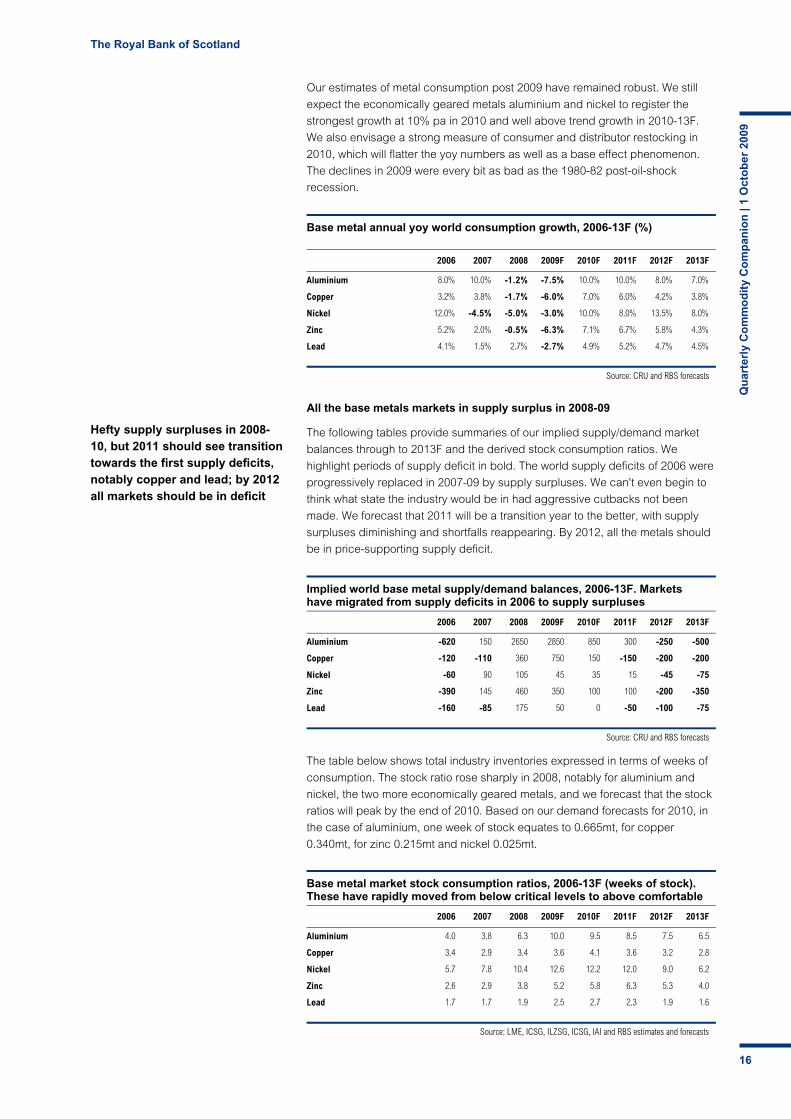
Our estimates of metal consumption post 2009 have remained robust. We still
expect the economically geared metals aluminium and nickel to register the
strongest growth at 10% pa in 2010 and well above trend growth in 2010-13F.
We also envisage a strong measure of consumer and distributor restocking in
2010, which will flatter the yoy numbers as well as a base effect phenomenon.
The declines in 2009 were every bit as bad as the 1980-82 post-oil-shock
recession.
All the base metals markets in supply surplus in 2008-09
The following tables provide summaries of our implied supply/demand market
balances through to 2013F and the derived stock consumption ratios. We
highlight periods of supply deficit in bold. The world supply deficits of 2006 were
progressively replaced in 2007-09 by supply surpluses. We can’t even begin to
think what state the industry would be in had aggressive cutbacks not been
made. We forecast that 2011 will be a transition year to the better, with supply
surpluses diminishing and shortfalls reappearing. By 2012, all the metals should
be in price-supporting supply deficit.
The table below shows total industry inventories expressed in terms of weeks of
consumption. The stock ratio rose sharply in 2008, notably for aluminium and
nickel, the two more economically geared metals, and we forecast that the stock
ratios will peak by the end of 2010. Based on our demand forecasts for 2010, in
the case of aluminium, one week of stock equates to 0.665mt, for copper
0.340mt, for zinc 0.215mt and nickel 0.025mt.
Base metal annual yoy world consumption growth, 2006-13F (%)
2006 2007 2008 2009F 2010F 2011F 2012F 2013F
Aluminium 8.0% 10.0% -1.2% -7.5% 10.0% 10.0% 8.0% 7.0%
Copper 3.2% 3.8% -1.7% -6.0% 7.0% 6.0% 4.2% 3.8%
Nickel 12.0% -4.5% -5.0% -3.0% 10.0% 8.0% 13.5% 8.0%
Zinc 5.2% 2.0% -0.5% -6.3% 7.1% 6.7% 5.8% 4.3%
Lead 4.1% 1.5% 2.7% -2.7% 4.9% 5.2% 4.7% 4.5%
Source: CRU and RBS forecasts
Hefty supply surpluses in 2008-10, but 2011 should see transition towards the first supply deficits, notably copper and lead; by 2012 all markets should be in deficit
Implied world base metal supply/demand balances, 2006-13F. Markets have migrated from supply deficits in 2006 to supply surpluses
2006 2007 2008 2009F 2010F 2011F 2012F 2013F
Aluminium -620 150 2650 2850 850 300 -250 -500
Copper -120 -110 360 750 150 -150 -200 -200
Nickel -60 90 105 45 35 15 -45 -75
Zinc -390 145 460 350 100 100 -200 -350
Lead -160 -85 175 50 0 -50 -100 -75
Source: CRU and RBS forecasts
Base metal market stock consumption ratios, 2006-13F (weeks of stock). These have rapidly moved from below critical levels to above comfortable
2006 2007 2008 2009F 2010F 2011F 2012F 2013F
Aluminium 4.0 3.8 6.3 10.0 9.5 8.5 7.5 6.5
Copper 3.4 2.9 3.4 3.6 4.1 3.6 3.2 2.8
Nickel 5.7 7.8 10.4 12.6 12.2 12.0 9.0 6.2
Zinc 2.6 2.9 3.8 5.2 5.8 6.3 5.3 4.0
Lead 1.7 1.7 1.9 2.5 2.7 2.3 1.9 1.6
Source: LME, ICSG, ILZSG, ICSG, IAI and RBS estimates and forecasts

The Royal Bank of Scotland
Qu
arte
rly
Co
mm
od
ity
Co
mp
anio
n |
1 O
cto
ber
200
9
17
Source: Bloomberg and RBS
Gains in our commodity suite since end 2008 in US dollars have been eye-catching...
-12%
13%
15%
23%
42%
43%
44%
49%
56%
59%
65%
106%
128%
-50% -25% 0% 25% 50% 75% 100% 125% 150%
Thermal Coal
Iron Ore
Gold
Aluminium
Platinum
Brent Oil
Tin
Silver
Nickel
Palladium
Zinc
Copper
Lead
Source: Bloomberg and RBS
… but in stronger South African rand the gains are lower and indeed some gains have turned to losses
-31%
-12%
-11%
-5%
10%
11%
12%
16%
21%
24%
29%
60%
77%
-50% -25% 0% 25% 50% 75% 100% 125% 150%
Thermal Coal
Iron Ore
Gold
Aluminium
Platinum
Brent Oil
Tin
Silver
Nickel
Palladium
Zinc
Copper
Lead
Weaker US dollar currency impact has been dramatic
The world has now moved away from a strong US dollar environment. Indeed,
the trade-weighted US dollar begins Q4 09 at its lowest level in over 12 months.
The two charts below show the impact of the weaker US dollar on a suite of spot
commodity prices. We have chosen the South African rand as our example, but
a similar though less extreme picture emerges for the Canadian and Australian
dollars.
The charts show that the percentage gains in commodity prices when translated
into local currency terms are dramatically lower. South African miners with costs
in appreciating rand (not to mention higher wage settlements and Eskom power
tariffs) but product revenues in weaker US dollars face a tough margin squeeze.
The value and accumulation trade now completed
In 2008, with the exception of gold, every one of the key traded commodities
experienced significant price declines of 30-60%. By year-end, commodities had
fallen so far and so deep into industry cost curves that they offered financial
funds a bargain basement entry opportunity. Philanthropy is not a feature of the
mining industry and by and large, miners are not going to produce at a loss for
too long. That said, there has been an element of shared-pain, shared-gain
about this cycle.
Given the often extreme price volatility and daily moves of above 5% for a metal
are not uncommon, entry into the commodity space in Q4 08 was very much for
the brave hearted and it was all about executing the bottom of the cycle trade.
This tends not to be a crowded trade, but one where given the oversold nature of
commodities; longer-term investors are attracted by value and the opportunity
to accumulate exposure. Those who this year have followed the risk trade rather
than the economic trade have been handsomely rewarded.
Commodity markets are now entering the twilight zone, where the baton has to
be handed over from hope and anticipation to genuine economic demand pull
as the business cycle recovers. It becomes more and more a macroeconomic
trade as the business cycle moves into recovery and expansion. This is about
momentum and value stretch and will become a much more crowded trade.
Risks remain, such as a relapse in the pace and magnitude of the economic recovery; that producers prematurely reactivate too much idled capacity; the ending of Chinese SRB buying and even perhaps stockpile selling, prompts a sell-off

The Royal Bank of Scotland
Qu
arte
rly
Co
mm
od
ity
Co
mp
anio
n |
1 O
cto
ber
200
9
18
Source: RBS
The four phases of a typical business cycle. Many economies have now declared the technical recession over. Now in Phase 4 - Recovery
Recovery
Expansion SlowdownExpansion
Recession
Momentum
Time
Growth
1 2 1
3 4
Source: RBS
RBS Business Cycle Screener: Dynamics of the four different phases of a typical business driven by Growth and Momentum
Recovery: Growth remains negative and momentum
turns positive
Expansion: Growth turns positive and the momentum remains positive
Slowdown: Growth remains positive and the momentum turns negative
Recession: Growth turns negative and the momentum remains negative
Direction of the Business Cycle
MO
ME
NTU
M
GROWTH
1
23
4
We are now in the recovery phase of the business cycle
As we said earlier, for commodity markets, 2009 has all been about recovery in
prices from dismally low levels, levels that were deep into industry cost curves
and in which huge swathes of the industry were losing money. By definition,
economic commodity production must be that which can be
extracted/produced at a profit (some state-owned enterprises seem to operate
for quota and have a subtle shift along the lines of merely that which can be
extracted). It has been about recession in key developed world economies and
temporary bridges to stimulate growth, not very much about the macroeconomic
environment. This is now changing. It is now all about the macro.
So where are we in the business cycle? The two diagrams below are from the
RBS Business Cycle Screener published by our colleagues in European
Economics. Commodity markets have – correctly in our opinion – this year been
discounting that the world business cycle is moving from Recession Red Phase
3 into Recovery - Red Phase 4. As shown in our explanatory boxes below, Phase
4 is when growth remains in negative territory but momentum turns positive.
Crucially, although the phases of this cycle have been pretty much textbook, the
speed at which the slowdown and recession phases have completed their
moves has been staggeringly swift. In our January Commodity Companion,
“Metamorphosis”, we noted that historically, base metal prices as represented
by the RBS Base Metal Price Index have taken 41 months to move from peak to
trough. This time around, that journey was achieved in just nine months
from March to December 2008 – a telescoped cycle. But look at the symmetry.
It has also taken just nine months for our index to rise 70%, recapturing half its
losses. Meanwhile, governments around the world are declaring their recessions
(as defined as two consecutive quarters of negative GDP growth) over.

The Royal Bank of Scotland
Qu
arte
rly
Co
mm
od
ity
Co
mp
anio
n |
1 O
cto
ber
200
9
19
Source: IMF, LME, RBS forecasts
Metals have experienced a telescoped price cycle and have had their very own V-shaped recovery. Time now to pause for breath before greater glory
0
50
100
150
200
250
300
350
72 74 76 78 80 82 84 86 88 90 92 94 96 98 00 02 04 06 08 10F 12F
RBS Real Base Metal Price Index RBS Nominal Base Metal Price Index
London Metal Exchange Week 12 October − coming into focus
It’s that time of year again for the annual LME Week, kicking off what is known
affectionately in the metals world as the “mating season”. LME Week this year
begins on Columbus Day, Monday 12 October, and will see thousands of
commodity producers, consumers, traders, analysts and media descend on
London for a week-long festival of metal markets and their outlooks. It provides
an opportunity for crystal ball gazing into 2010. It will be held in a much better
price and financial environment to that of October 2008, when the world was
already sliding into the depths of the recession. With just three months of the
year remaining, 2009 should go down as a banner year for commodities, a year
in which gold spent its longest period above the US$1,000/oz marker and a year
in which many of the world’s key commodities – oil, copper, lead and nickel –
doubled in price during the worst recession in living memory.
The chart below shows the RBS Base Metal Price Index in real and nominal
terms and our forecast (in red) for the index. The message is that base metals
have had their very own V-shaped price recovery. We forecast that in common
with previous price cycle recoveries, which relapsed after 7-9 months,
commodities in general are likely to pause for breath while the fundamentals
catch up with the business cycle recovery. It will be crucial for real demand in
western developed world economies to flourish and compensate for the ending
of temporary stimulus packages and Chinese stockpiling. The path of the US
dollar, attitudes to risk appetite and the macroeconomic outlook are now
the three key common denominators for the commodity complex.
If our forecasts are fulfilled, then commodity prices of base and precious metals
through to bulks and energy appear set to enjoy handsome gains through to
2013. We forecast the RBS Base Metal Price Index will track essentially sideways
and rise around 17% in US dollar terms by Q2 11 as producer reactivation
delivers hundreds of thousands of tonnes of commodities into world markets.
This phase will coincide with fears of economic growth relapse and with a
number of financial and economic headwinds such as higher taxes, hefty cuts in
government capital spending programmes and of course rising interest rates.
Beginning in H2 11, we expect commodity markets to get truly into their stride.
Supply deficits should re-emerge; inventories should be drawn down; capacity
utilisation rates should rise to high levels; freight rates should rise sharply and all
the ingredients should then be in place for a good old-fashioned bull market. We
forecast a 35% rise in the RBS Base Metal Index from H1 11 to H2 13, providing
an overall rise in our index from current to end-2013 of an impressive 60%.
The Royal Bank of Scotland
Qu
arte
rly
Co
mm
od
ity
Co
mp
anio
n |
1 O
cto
ber
200
9
20
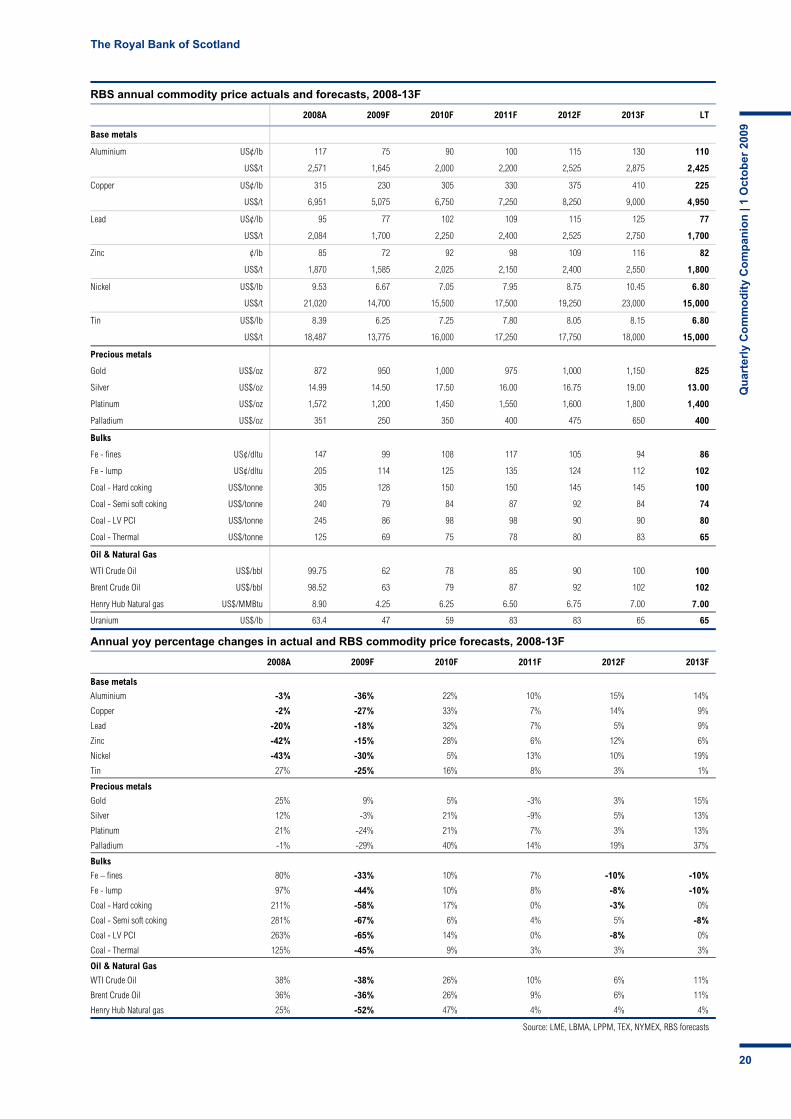
RBS annual commodity price actuals and forecasts, 2008-13F
2008A 2009F 2010F 2011F 2012F 2013F LT
Base metals
Aluminium US¢/lb 117 75 90 100 115 130 110
US$/t 2,571 1,645 2,000 2,200 2,525 2,875 2,425
Copper US¢/lb 315 230 305 330 375 410 225
US$/t 6,951 5,075 6,750 7,250 8,250 9,000 4,950
Lead US¢/lb 95 77 102 109 115 125 77
US$/t 2,084 1,700 2,250 2,400 2,525 2,750 1,700
Zinc ¢/lb 85 72 92 98 109 116 82
US$/t 1,870 1,585 2,025 2,150 2,400 2,550 1,800
Nickel US$/lb 9.53 6.67 7.05 7.95 8.75 10.45 6.80
US$/t 21,020 14,700 15,500 17,500 19,250 23,000 15,000
Tin US$/lb 8.39 6.25 7.25 7.80 8.05 8.15 6.80
US$/t 18,487 13,775 16,000 17,250 17,750 18,000 15,000
Precious metals
Gold US$/oz 872 950 1,000 975 1,000 1,150 825
Silver US$/oz 14.99 14.50 17.50 16.00 16.75 19.00 13.00
Platinum US$/oz 1,572 1,200 1,450 1,550 1,600 1,800 1,400
Palladium US$/oz 351 250 350 400 475 650 400
Bulks
Fe - fines US¢/dltu 147 99 108 117 105 94 86
Fe - lump US¢/dltu 205 114 125 135 124 112 102
Coal - Hard coking US$/tonne 305 128 150 150 145 145 100
Coal - Semi soft coking US$/tonne 240 79 84 87 92 84 74
Coal - LV PCI US$/tonne 245 86 98 98 90 90 80
Coal - Thermal US$/tonne 125 69 75 78 80 83 65
Oil & Natural Gas
WTI Crude Oil US$/bbl 99.75 62 78 85 90 100 100
Brent Crude Oil US$/bbl 98.52 63 79 87 92 102 102
Henry Hub Natural gas US$/MMBtu 8.90 4.25 6.25 6.50 6.75 7.00 7.00
Uranium US$/lb 63.4 47 59 83 83 65 65
Annual yoy percentage changes in actual and RBS commodity price forecasts, 2008-13F
2008A 2009F 2010F 2011F 2012F 2013F
Base metals
Aluminium -3% -36% 22% 10% 15% 14%
Copper -2% -27% 33% 7% 14% 9%
Lead -20% -18% 32% 7% 5% 9%
Zinc -42% -15% 28% 6% 12% 6%
Nickel -43% -30% 5% 13% 10% 19%
Tin 27% -25% 16% 8% 3% 1%
Precious metals
Gold 25% 9% 5% -3% 3% 15%
Silver 12% -3% 21% -9% 5% 13%
Platinum 21% -24% 21% 7% 3% 13%
Palladium -1% -29% 40% 14% 19% 37%
Bulks
Fe – fines 80% -33% 10% 7% -10% -10%
Fe - lump 97% -44% 10% 8% -8% -10%
Coal - Hard coking 211% -58% 17% 0% -3% 0%
Coal - Semi soft coking 281% -67% 6% 4% 5% -8%
Coal - LV PCI 263% -65% 14% 0% -8% 0%
Coal - Thermal 125% -45% 9% 3% 3% 3%
Oil & Natural Gas
WTI Crude Oil 38% -38% 26% 10% 6% 11%
Brent Crude Oil 36% -36% 26% 9% 6% 11%
Henry Hub Natural gas 25% -52% 47% 4% 4% 4%
Source: LME, LBMA, LPPM, TEX, NYMEX, RBS forecasts

The Royal Bank of Scotland
Qu
arte
rly
Co
mm
od
ity
Co
mp
anio
n |
1 O
cto
ber
200
9
21
RBS quarterly average commodity price forecasts, 2009-10F
2009F 2010F
1QA 2QA 3QA 4QF 2009F 1QF 2QF 3QF 4QF 2010F
Base metals
Aluminium US¢/lb 62 67 82 87 75 85 95 85 95 90
US$/t 1,360 1,488 1,806 1,925 1,645 1,900 2,100 1,900 2,100 2,000
Copper US¢/lb 156 212 265 290 230 295 320 295 320 305
US$/t 3,435 4,675 5,839 6,350 5,075 6,500 7,000 6,500 7,000 6,750
Lead US¢/lb 53 68 87 101 77 102 107 98 102 102
US$/t 1,159 1,505 1,924 2,225 1,700 2,250 2,350 2,150 2,250 2,250
Zinc US¢/lb 53 67 80 87 72 88 95 88 95 92
US$/t 1,173 1,475 1,756 1,925 1,585 1,950 2,100 1,950 2,100 2,025
Nickel US$/lb 4.74 5.89 8.00 8.05 6.67 7.25 7.05 6.60 7.25 7.05
US$/t 10,455 12,986 17,608 17,750 14,700 16,000 15,500 14,500 16,000 15,500
Tin US$/lb 5.00 6.14 6.60 7.25 6.25 7.05 7.50 7.05 7.50 7.25
US$/t 11,012 13,538 14,563 16,000 13,775 15,500 16,500 15,500 16,500 16,000
Precious metals
Gold US$/oz 908 922 960 1,010 950 1,050 1,000 950 1,000 1,000
Silver US$/oz 12.60 13.76 14.69 17.00 14.50 18.50 17.50 16.50 17.50 17.50
Platinum US$/oz 1,023 1,172 1,230 1,375 1,200 1,400 1,450 1,450 1,500 1,450
Palladium US$/oz 199 234 272 295 250 325 350 350 375 350
Oil & Natgas
WTI Crude Oil US$/bbl 43 60 68 75 62 75 75 80 80 78
Brent Crude Oil US$/bbl 46 60 69 77 63 77 77 82 82 79
Henry Hub Natural gas
US$/MMBtu
4.47 3.81 3.44 5.25 4.25 5.75 6.25 6.50 6.50 6.25
Half-year average price assumptions, 2009-13F
2009F 2010F 2011F 2012F 2013F
1HA 2HF 1HF 2HF 1HF 2HF 1HF 2HF 1HF 2HF
Base metals
Aluminium US¢/lb 65 85 90 90 95 105 110 120 125 135
US$/t 1,424 1,865 2,000 2,000 2,100 2,300 2,425 2,625 2,750 3,000
Copper US¢/lb 185 278 308 308 320 340 365 385 385 430
US$/t 4,055 6,095 6,750 6,750 7,000 7,500 8,000 8,500 8,500 9,500
Lead US¢/lb 60 94 105 100 107 111 111 118 120 125
US$/t 1,332 2,075 2,300 2,200 2,350 2,450 2,450 2,600 2,700 2,800
Zinc US¢/lb 60 84 92 92 95 100 107 111 115 120
US$/t 1,324 1,841 2,025 2,025 2,100 2,200 2,350 2,450 2,500 2,600
Nickel US$/lb 5.30 8.03 7.15 6.90 7.50 8.40 8.40 9.05 10.00 10.90
US$/t 11,721 17,679 15,750 15,250 16,500 18,500 18,500 20,000 22,000 24,000
Tin US$/lb 5.55 6.93 7.25 7.25 7.70 7.95 7.95 8.15 8.30 8.05
US$/t 12,275 15,281 16,000 16,000 17,000 17,500 17,500 18,000 18,250 17,750
Precious metals
Gold US$/oz 915 985 1,025 975 1,000 950 1,000 1,000 1,100 1,200
Silver US$/oz 13.18 15.85 18.00 17.00 16.50 15.50 16.50 17.00 18.00 20.00
Platinum US$/oz 1,098 1,303 1,425 1,475 1,600 1,500 1,600 1,600 1,700 1,900
Palladium US$/oz 217 284 338 363 400 400 450 500 600 700
Source: LME, LBMA, LPPM, TEX, NYMEX, RBS forecasts
The Royal Bank of Scotland
Qu
arte
rly
Co
mm
od
ity
Co
mp
anio
n |
1 O
cto
ber
200
9
22
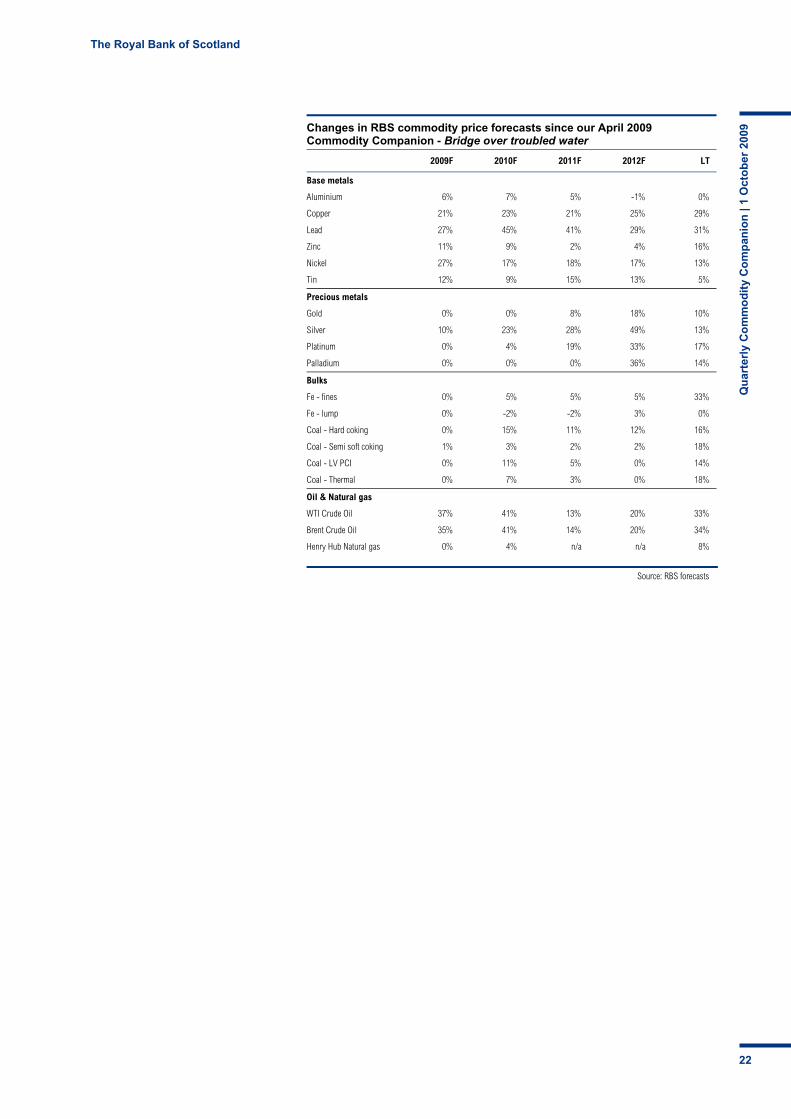
Changes in RBS commodity price forecasts since our April 2009 Commodity Companion - Bridge over troubled water
2009F 2010F 2011F 2012F LT
Base metals
Aluminium 6% 7% 5% -1% 0%
Copper 21% 23% 21% 25% 29%
Lead 27% 45% 41% 29% 31%
Zinc 11% 9% 2% 4% 16%
Nickel 27% 17% 18% 17% 13%
Tin 12% 9% 15% 13% 5%
Precious metals
Gold 0% 0% 8% 18% 10%
Silver 10% 23% 28% 49% 13%
Platinum 0% 4% 19% 33% 17%
Palladium 0% 0% 0% 36% 14%
Bulks
Fe - fines 0% 5% 5% 5% 33%
Fe - lump 0% -2% -2% 3% 0%
Coal - Hard coking 0% 15% 11% 12% 16%
Coal - Semi soft coking 1% 3% 2% 2% 18%
Coal - LV PCI 0% 11% 5% 0% 14%
Coal - Thermal 0% 7% 3% 0% 18%
Oil & Natural gas
WTI Crude Oil 37% 41% 13% 20% 33%
Brent Crude Oil 35% 41% 14% 20% 34%
Henry Hub Natural gas 0% 4% n/a n/a 8%
Source: RBS forecasts

The Royal Bank of Scotland
Qu
arte
rly
Co
mm
od
ity
Co
mp
anio
n |
1 O
cto
ber
200
9
23
Economic focus
No straight line to sustained expansion
Q3 09 back to expansion: Q3 GDP reports and the earnings season is still a
month away but the evidence available to date suggest that G7 GDP will be up
around 2.5% q/q annualised. This would follow deepest and longest post war
contraction of close to 6% on average over the previous 3 quarters. Q3 G7 GDP
is now forecast to be a little stronger than was the case a month ago, as the
upside risks we had highlighted in Europe have materialised.
However, in light of the contraction experienced, this would still be a relative
modest expansion, leaving G7 output close to 4% lower than a year ago. With
the global economy having successfully returned to positive growth in Q3, the
focus remains squarely on its ability to sustain any expansion into next year.
Importantly, we expect the economic news flow to become more mixed over Q4,
a development which will no doubt leave the debate about the shape of the
recovery wide open.
Fears of double dip to regain traction momentarily: Our view that the
probability of double dip is low remains unchanged. At the same, we recognise
that the path to sustainable recovery is unlikely to be a straight line. The first
important test to that view will come in the coming weeks as we expect a
temporary slowdown in the pace of expansion in G7 output in Q4. This forecast
is largely based on the idea that part of the expansion in Q3, especially in the
US, was borrowed from Q4/Q1. A temporary contraction in US consumer
spending in Q4 – which remains our base case scenario – will likely be the most
significant bad news to digest for the market as this will no doubt revive fears of
a double dip.
The end of the “cash for clunkers” and of the homebuyer tax credit
(expiring on November 30th) are the main culprits behind this moderation in
growth in Q4. Europe also appears to be exposed in the short term to the
phasing out of the car scrappage incentive schemes which is expected to
dampen euro area GDP in Q4 relative to Q3.
Road to sustainable recovery unlikely to be a straight line: Navigating
through what we believe is going to be a much more mixed batch of economic
data will not be easy. In that context, labour market developments will become
the most relevant gauge to assess how sustainable the recovery will be. The key
signposts are in the US, a bottoming out of the contraction in payrolls over Q4
and in Europe a further slow down in the pace of increase in unemployment.
Should labour market developments depart significantly from our expectation,
we would be forced to reassess our forecast for H1.
Economics editor Jacques Cailloux Chief European Economist [email protected] + 44 207 085 4757
Economics - contents
Page
Key economics and FX forecasts 24
Regional updates
United States 25
Euro area 27
Japan 29
Non-Japan Asia 30
FX 31
China Special 32
The Royal Bank of Scotland
Qu
arte
rly
Co
mm
od
ity
Co
mp
anio
n |
1 O
cto
ber
200
9
24
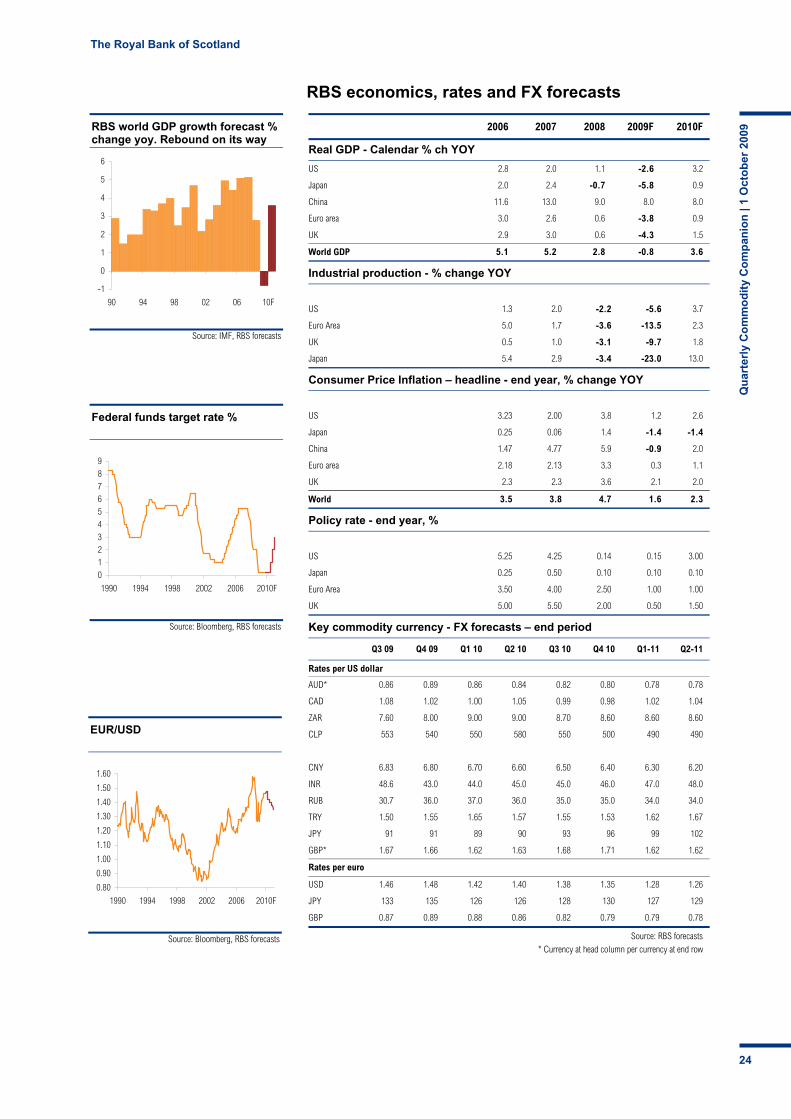
2006 2007 2008 2009F 2010F
Real GDP - Calendar % ch YOY
US 2.8 2.0 1.1 -2.6 3.2
Japan 2.0 2.4 -0.7 -5.8 0.9
China 11.6 13.0 9.0 8.0 8.0
Euro area 3.0 2.6 0.6 -3.8 0.9
UK 2.9 3.0 0.6 -4.3 1.5
World GDP 5.1 5.2 2.8 -0.8 3.6
Industrial production - % change YOY
US 1.3 2.0 -2.2 -5.6 3.7
Euro Area 5.0 1.7 -3.6 -13.5 2.3
UK 0.5 1.0 -3.1 -9.7 1.8
Japan 5.4 2.9 -3.4 -23.0 13.0
Consumer Price Inflation – headline - end year, % change YOY
US 3.23 2.00 3.8 1.2 2.6
Japan 0.25 0.06 1.4 -1.4 -1.4
China 1.47 4.77 5.9 -0.9 2.0
Euro area 2.18 2.13 3.3 0.3 1.1
UK 2.3 2.3 3.6 2.1 2.0
World 3.5 3.8 4.7 1.6 2.3
Policy rate - end year, %
US 5.25 4.25 0.14 0.15 3.00
Japan 0.25 0.50 0.10 0.10 0.10
Euro Area 3.50 4.00 2.50 1.00 1.00
UK 5.00 5.50 2.00 0.50 1.50
Key commodity currency - FX forecasts – end period
Q3 09 Q4 09 Q1 10 Q2 10 Q3 10 Q4 10 Q1-11 Q2-11
Rates per US dollar
AUD* 0.86 0.89 0.86 0.84 0.82 0.80 0.78 0.78
CAD 1.08 1.02 1.00 1.05 0.99 0.98 1.02 1.04
ZAR 7.60 8.00 9.00 9.00 8.70 8.60 8.60 8.60
CLP 553 540 550 580 550 500 490 490
CNY 6.83 6.80 6.70 6.60 6.50 6.40 6.30 6.20
INR 48.6 43.0 44.0 45.0 45.0 46.0 47.0 48.0
RUB 30.7 36.0 37.0 36.0 35.0 35.0 34.0 34.0
TRY 1.50 1.55 1.65 1.57 1.55 1.53 1.62 1.67
JPY 91 91 89 90 93 96 99 102
GBP* 1.67 1.66 1.62 1.63 1.68 1.71 1.62 1.62
Rates per euro
USD 1.46 1.48 1.42 1.40 1.38 1.35 1.28 1.26
JPY 133 135 126 126 128 130 127 129
GBP 0.87 0.89 0.88 0.86 0.82 0.79 0.79 0.78
Source: RBS forecasts
* Currency at head column per currency at end row
Source: IMF, RBS forecasts
RBS world GDP growth forecast % change yoy. Rebound on its way
-1
0
1
2
3
4
5
6
90 94 98 02 06 10F
Source: Bloomberg, RBS forecasts
Federal funds target rate %
0123456789
1990 1994 1998 2002 2006 2010F
Source: Bloomberg, RBS forecasts
EUR/USD
0.80
0.90
1.00
1.10
1.20
1.30
1.40
1.50
1.60
1990 1994 1998 2002 2006 2010F
RBS economics, rates and FX forecasts
The Royal Bank of Scotland
Qu
arte
rly
Co
mm
od
ity
Co
mp
anio
n |
1 O
cto
ber
200
9
25
US
Minding our levels and changes
There are instances when the economy is especially difficult to forecast, most
notably around turning points. The present situation is particularly tricky, even for
a turning point, for a variety of reasons. This recession has been the longest and
most severe since the 1930s, and has included a major financial sector crisis
that has not been entirely resolved. Thus, at this stage, there are very few
appropriate precedents to fall back on, especially since the only two recessions
in the past 25 years were both extraordinarily shallow and short, followed by
extended periods of halting, sub-par growth.
One distinction that is absolutely critical is the difference between levels and
changes. This sounds simple enough, but judging from the discussions in the
markets over the past few months, it has proven quite difficult. This distinction is
most critical when coming out of a recession, especially a deep one, since the
level of activity is low (disastrously so in the current episode) and will remain so
for quite some time no matter how fast the economy recovers. It may seem
paradoxical to some, but the lower the level of activity, the more vigorously
growth can (and should) rebound to bring the economy back toward equilibrium.
Indeed, this idea is embodied in the so-called Zarnowitz rule (named after Victor
Zarnowitz): deep recessions are almost always followed by rapid rebounds.
The Zarnowitz rule amounts to empirical support for a V-shaped recovery, but
there is widespread skepticism that the economy will be able to generate
momentum, even from the current depressed levels of activity. Indeed, even our
relatively optimistic forecast falls well short of a full-fledged V-shaped recovery
(in the 1970s and 1980s, recessions that were severe but less so than the latest
one were followed by bursts of around 6% real growth in the first year of
recovery). Still, we believe that at least some of the pessimism currently being
exhibited regarding the forthcoming recovery reflects confusion between levels
and changes. In particular, because the focus is almost always on changes (we
typically think about output in terms of GDP growth, about prices in terms of
inflation, and employment in terms of the change in payroll jobs), many ideas
these days are being applied to changes that more appropriately should be
thought about in level terms.
Two concepts may help to clarify the distinction
1. Activity will be depressed for a long time but growth can be explosive.
Having contracted by about 4% over the past 18 months, the economy stands at
incredibly low levels of activity, as illustrated by an unemployment rate nearing
10% and a capacity utilisation rate below 70%.
Indeed, in a variety of sectors, the level of activity swooned to an unsustainably
depressed level in early 2009, as businesses and households were paralysed by
uncertainty amid a financial and economic crisis. The best example is residential
construction, but a similar story can be told to varying degrees for other sectors,
such as auto sales and business investment in equipment and software.
Changes in production (ie output) tend to be even more volatile than demand
coming out of a deep recession due to the inventory cycle. In the early stages of
a recession, firms tend to be caught flat-footed, and they do not adjust output
downward fast enough to keep up with weakening sales. At some point in the
cycle, businesses slash production to a level that is even lower than the
depressed pace of sales (eg the automakers in the spring).
Stephen Stanley Chief US Economist [email protected] +1 203 897 2818
The Royal Bank of Scotland
Qu
arte
rly
Co
mm
od
ity
Co
mp
anio
n |
1 O
cto
ber
200
9
26
The early stages of a recovery often involve the sharp adjustment of output back
into line with demand once inventories are brought under control. This dynamic
is playing out now and will likely provide a significant chunk of (if not the majority
of) growth in H2 09. This dynamic has historically represented an important part
of the patterns behind the Zarnowitz rule. In short, it is dangerous to think in
terms of changes at the bottom of a recession, when the level of demand is
unsustainably low and output is depressed relative to that demand.
2. ‘New normal’ and potential growth rates. A related misconception is that
growth must be tepid due to the headwinds facing the economy (rising savings
rates, tight credit, etc). Debate has been lively about whether the potential/trend
growth rate of the economy will be noticeably lower than before, but the problem
is that many market participants are applying a lower trend rate of growth (the
change argument) to the current low level of activity.
Inevitably, a recession takes the level of activity below the long-term trend. In
severe recessions, output tends to fall well below trend. A variety of observers
has suggested that the recovery will be sluggish because trend growth will be
slower than before. The problem is that many look for growth to settle into this
sluggish pattern right away.
The problem with this view is that it skips the recovery phase of the cycle,
leaving the level of activity permanently depressed relative to trend. History
clearly shows that following deep recessions, there has always been a period of
above-trend growth that helps speed the economy along back to equilibrium (ie
trend). This was true even in the Great Depression in the US and during the
1990s in Japan. In the wake of the most severe recession since World War II, this
necessitates a substantial rebound at some point. To be sure, there can be
legitimate debate about the timing and pattern of a recovery (ie whether it will be
shaped like a V, a U, or even a W), but there will be a strong recovery period.
One can plausibly argue that the potential rate of GDP growth will be noticeably
lower going forward than it was before. We are sceptical of this view, believing
the long-term trend growth rate should be determined predominantly by the
pace of advances in productivity and the labour force, neither of which should
be affected much by the sorts of negative forces cited as headwinds.
Nevertheless, even if the potential growth rate is lower going forward, the
economy is still currently operating far below its potential and will need to see a
substantial initial burst in the process of getting back to its trend level.
Third-quarter GDP update
Since late August, RBS’s Q3 real GDP forecast has improved somewhat. Our
headline growth estimate has inched up from a 2.5% annualised pace to around
2.8%, but this has occurred even as we project bigger drags from inventories
and trade than we were previously assuming. Real consumer spending may
advance somewhat faster in Q3 than previously thought, but the bigger story
over the past month has been the upgrades in the housing and capital
equipment sectors.
These categories of GDP both posted contractions of close to 40% annualised in
Q1 (-39.2% and -43.6%, respectively), but based on surprisingly robust monthly
data, now seem poised to move into positive territory in Q3. In addition, beyond
the current period, we have nudged up our growth forecasts for Q4 and most of
2010. Our estimates still are nowhere near a full-fledged V-shaped recovery (at
least as we would define it), but the string of stronger-than-expected economic
releases over the last few months has underscored our conviction that the
economy will expand at a well-above-trend pace in 2010.
The Royal Bank of Scotland
Qu
arte
rly
Co
mm
od
ity
Co
mp
anio
n |
1 O
cto
ber
200
9
27
Euro area
Beware of the hawks
The relative country performance over the quarter is likely to show Germany
growing most since March 2008 (we forecast +1% q/q) followed by France
(+0.4% q/q). Countries such as Italy and Spain are still expected to perform
poorly moving from contraction in Q2 to about stagnation in Q3. According to our
new GDP indicator (see On track for Q3 growth | RBS GDP Tracker: euro area),
the improvement should come mostly from an increase in manufacturing output
of about 1.5% q/q, the first increase since Q1 2008.
End of car scrappage schemes unlikely to jeopardise recovery
The outlook for Q4 09 is positive with industrial production likely to be yet again
the prime driver. The key short term uncertainty is related to the end of the
vehicle scrappage programmes in some euro area countries and in particular in
Germany. Euro area car sales were up about 12% in Q2 q/q (4.5% y/y) and will
likely be slightly positive in Q3. Some softening in car sales in Q4 is quite likely
although it is unlikely that they will fall off a cliff. Indeed, a number of countries
have already stated that they will try and smooth the phasing out of these
pragmatic incentive schemes.
To date, France has already said that its programme will continue into 2011 to
avoid any major collapse in car sales whilst the UK has extended its scheme to
embrace a further 100,000 vehicles. Meanwhile, Italy is said to be readying an
extension of its scrapping plan which was launched in May if there were signs of
plunging sales at the end of the year when the programme is due to elapse.
In Spain, the government programme to subsidise new purchases was
implemented in May and seems to have started having a positive impact only in
September (with industry reports suggesting a rise in car sales of about 10%
y/y). The programme was designed to run for a year or up to a budget of 100
million. At the end of September, about 40% of the funds had been used
suggesting no imminent need to increase the programme.
So the key uncertainty comes from Germany. Its scrappage scheme which was
the first to be implemented in the euro area expired earlier this month. The
programme is said to have boosted car sales by 2 million unit. However,
although the subsidy is now closed, the government is allowing delayed
deliveries under the scheme through into 2010.
Labour market is turning
The euro area labour market turned at the end of Q1 when unemployment rose
by 1.3 million, the largest increase since the 1992 recession. Since then the pace
of increase in joblessness has been declining steadily. In the 3 months to July,
euro area unemployment rose by 500k almost a third of the increase in Q1.
The euro area labour market adjustment has been most unusual with for
example, 60 % of the increase in euro area unemployment since the beginning
of 2008 entirely explained by the end of short term contracts in the Spanish
construction and manufacturing sectors! On the other extreme, the German
labour market has seen one of the smallest deteriorations across the region
despite the fact that the German economy is experiencing one of the largest
contractions in output in the euro area. This very unusual development is related
to the short time allowance programme which currently has around 1.2 million
Jacques Cailloux Chief European Economist [email protected] + 44 207 085 4757
The Royal Bank of Scotland
Qu
arte
rly
Co
mm
od
ity
Co
mp
anio
n |
1 O
cto
ber
200
9
28
participating employees. This programme has proven very efficient in providing
firms with a high degree of flexibility to navigate through the downturn by
slashing hours worked rather than employment. We disagree with the consensus
view which expects a sudden massive deterioration in the German labour market
as labour costs remain high and demand remains weak. Indeed, the programme
has been extended for the second time to 2011 and there are early signs that
firms are actually scaling back their restructuring plans. This suggests that the
unemployment rate in Germany is unlikely to rise by as much as people fear. At
the same time hours worked will have first to rise very significantly before any
meaningful hiring can take place. This is true in particular for the manufacturing
sector but less the case in the services sector.
A turning point in the labour market at this time of the recovery suggests that the
chances of double dip remain low.
ECB rhetoric to gradually shift to a more hawkish stance
We have been arguing since the ECB September meeting that the rhetoric of the
ECB will not get any more dovish from here. We remain of that view. At this
stage, the Council has spoken with one voice claiming that the recovery remains
unsustainable.
In the coming months, this rhetoric is likely to evolve with the usual more hawkish
members likely to depart from the consensus. In particular, we expect the
Bundesbank to strike a more positive note about the recovery as soon as the
hard data in Germany supports this view. In that respect, the key event risks are
the August German industrial production (Oct 8th, RBS +4% m/m) and German
(November 13th, RBS: +1% q/q). A reassessment of the German labour market
situation by the Bundesbank is also in the offing. Indeed, Bundesbank Weber
stated recently that he expected the unemployment rate to rise well into 2011.
Hawks to remain in the minority for some time
A more hawkish Bundesbank will not be sufficient to turn the tide and convince
the whole council that the time to reign in some of the stimulus has come.
Indeed, we believe that the Council will need more evidence that the recovery is
indeed sustainable. This probably includes the publication of both Q3 and Q4
GDP which brings us to March as the earliest for the Council to feel comfortable
to talk about sustainable recovery.
At that time though, a number of other considerations will likely prevent the Bank
from becoming overly aggressive:
(i) the ECB inflation projection at the time will still likely be below its comfort zone
for both 2010 and 2011. The wage dynamics around the euro area will be very
subdued, with the IG Metall negotiations at the end of Q1 likely to come on the
low side;
(ii) Monetary and credit developments will likely be in negative territory on a y/y
basis by the end of Q1, a development which should keep the monetarist on the
cautious side; and
(iii) the ECB will still be wary of past policy mistakes (notably those of 1936 in the
US and 1996 in Japan) when policy accommodation was removed too early.
The Royal Bank of Scotland
Qu
arte
rly
Co
mm
od
ity
Co
mp
anio
n |
1 O
cto
ber
200
9
29
Japan
Short-term euphoria made by the government
Key economic fundamentals: short-term euphoria made by new government
Japan’s Q2 GDP was unexpectedly revised down from +3.7% qoq annualised to
+2.3%, due to a reduction in private inventory and corporate capex. However,
this is not necessarily negative for the near-term economic outlook – the
downgrade in corporate inventory signals a recovery in factory production at the
early stages of an economic recovery. Significant downside risks to the economy
remain, from domestic as well as external demand, but we expect continued
positive growth on weakening of inventory liquidation and on government
support. We revised our GDP forecast for 2009 down, from -5.5% to -5.8%, and
for 2010 from +1.2% to +0.9% given the downward revision of GDP and the
government’s decision to suspend part of supplementary budget for FY09.
On the price front, July nationwide core CPI fell to -2.2% yoy vs -1.7% yoy in
June primarily due to a base effect from last year, a widening negative output
gap, estimated to be -7.8% in Q2 this year and the yen’s appreciation against
the US dollar. The negative output gap and the yen’s appreciation are highly
likely to weigh on underlying trend of core CPI even after the base effect
disappears. Given the recent yen appreciation and the government’s decision to
abolish the gasoline tax from April 2010, we revised our core CPI forecast for
2010 down from -1.2% yoy to -1.4% yoy.
Policy outlook
A lot of attention is being garnered for the next action of the new administration,
but it seems the Bank of Japan (BoJ) has enough time on its side to assess the
impact of monetary policies that it implemented from late last year. In
September’s policy meeting, the BoJ slightly raised its economic assessment,
but kept stressing the downside risks of the economy and the risk of deflation. In
terms of credit easing policy, such as outright purchase of CP and limitless
collateralised lending (so called ‘monster operation’), the bank did not mention
whether its discussed extending those measures again from the current year-
end to the end of March next year or beyond. However, it is too early to judge the
step as normalisation of accommodative policy. Given the still-tight funding
conditions – especially in SMEs – and mounting deflationary pressure, the bank
may extend those measures again by the end of this fiscal year. After the regime
change in the government administration, we think the new government will
eventually push the BoJ to buy more JGBs so that the administration can fulfil
additional economic stimulus packages for the coming years funded by JGB
issuance.
How the government and the BoJ will react to the yen’s appreciation is another
important issue. When the USD/JPY trades below 90 yen, we think the Japanese
authorities likely will turn cautious in allowing further appreciation, which would
cause a decline in corporate profit and deflationary pressure. At the moment, the
DPJ-led new government appears unmotivated to intervene in the currency
because it aims to promote a more consumer-driven economy. In fact, Minister
of Finance Hirohisa Fujii said that ‘the merit of the yen’s appreciation is
significant for a domestic demand-driven economy’….’we should not intervene in
the market except in times of emergency.’ But, we think its policy may change
when expectations about a regime shift subside and yen-appreciation risks to
the economy come to the fore.
Junko Nishioka Chief Japan Economist [email protected] +81 3 6266 3589
The Royal Bank of Scotland
Qu
arte
rly
Co
mm
od
ity
Co
mp
anio
n |
1 O
cto
ber
200
9
30
Non-Japan Asia
Near-term growth momentum should remain strong
Underpinnings to near-term Asian growth have strengthened considerably and
risks to forthcoming data are to the upside. The main indicators that support our
view are:
1) inventory replenishment, particularly in the electronics sector;
2) high headroom for fiscal expansion; and
3) ongoing recovery in asset prices.
Recovering growth momentum and easy global liquidity conditions provide a
favourable backdrop for sustaining asset price expansion in the region.
We briefly discuss these indicators. The potential scale of inventory
replenishment is evident from the relative ratio of new orders to inventory
subcomponents in the US manufacturing ISM. Equally, the semiconductor
equipment book-to-bill ratio has moved up to above 1, consistent with rising
demand for electronics exports. Electronics are Asia’s dominant export product.
Finally, we also note that ytd fiscal deficit levels fall short of projected targets
mainly due to delays in public spending. Considering that fiscal stimulus
programmes are intended to run through 2010, they could provide critical
support in the event of a relapse in global demand.
Inflationary pressures in the region are still tame. Food prices are the only form of
inflationary pressure at this stage. Broader inflationary pressures are absent,
reflecting a combination of still large output gaps and currency appreciation. The
more serious policy issue at this stage is asset price inflation and property prices
in particular. Property prices have started to turn around almost across the
region and are gradually becoming a policy issue. Our best guess is that
policymakers will first opt for regulatory measures and subsequently withdraw
liquidity. Conventional tightening in the form of higher policy rates is likely to be
the last option.
The rebuilding of FX reserves has continued apace over the past month as
global liquidity is finding its way into the region; external reserves have been
rebuilt to 2008 peak levels in most countries. The laggards are Korea, India and
Malaysia but even in these countries, reserve accumulation is progressing at a
rapid pace. We believe that central banks in the region will continue to rebuild
external reserves, but would also become increasingly tolerant of FX
appreciation.
Sanjay Mathur Chief Emerging Asia Economist sanjay. [email protected] +65 6518 5165
The Royal Bank of Scotland
Qu
arte
rly
Co
mm
od
ity
Co
mp
anio
n |
1 O
cto
ber
200
9
31
FX
The burden of proof
What’s become apparent since the our forecast update is that bearish views on
the US dollar have become entrenched. We previously asserted that "fiscal
stimulus, pent-up demand, and inventory rebuilding should maintain growth
momentum into year-end”. These views have now become the market
consensus. The idea that risk will turn US dollar-supportive by the end of 2009
looks a minimum of a quarter too early; meanwhile, the market can digest upside
European growth surprises and negative year-end US dollar seasonals. One
additional negative US dollar surprise has been a slight shift in rate spreads
against the US dollar, despite the move away from QE.
We see year-end EUR/USD at 1.48; however, before year-end US infrastructure
spending should kick in (less than 20% of allocated funds have been spent at
the time of writing), and for a short time fiscal policies will become a relative US
dollar boon and not a burden, as it temporarily adds to relative US growth. The
US dollar will also play some role in reallocating growth and is another reason
we’re hanging on to a view of fading relative euro strength toward 1.50.
Although the G5 cycles have been synchronised and the fiscal boost may
support some relative US growth acceleration, this is not shaping up into a
traditional pattern of first into, first out of recession. On the contrary, this is more
of a first in, last out (most of the G5); last in, first out (emerging Asia and
commodity-based countries) cycle. In the G10 world, those who pushed to the
limits of the zero bound and pursued various forms of unorthodox policy should
be the last to tighten. In contrast, those with the smallest output gaps are inclined
to see their central banks first out of the gate – Australia and Norway this year
and the rest some time in H2:10 at the very earliest. This represents the most
important point of differentiation in the G10 world. The Australian dollar already
looks fully valued, but could extend to a little shy of 0.90 vs the US dollar.
But what is the best funding currency? The US dollar stands out for its liquidity
and is the current favourite. The euro, however, is a better long-term choice, we
believe, given it is overvalued against the US dollar, sterling and Scandinavian
currencies, based on our short and long-term models. And if the euro is
preferred why not use the Swiss franc as a funder, keeping the SNB on your
side? A notable absentee among funders is the yen, which is caught in an array
of inseparable factors, including incentivised dividend repatriation and DPJ
policy uncertainties. Level heads should prevail in the new government,
protecting USD/JPY’s downside, well ahead of the 1yr straddle breakeven
(currently 83.8).
Sterling should remain crucially short of carry over the next six months amid
concerns about the sustainability of the upswing in UK surveys. This will
dominate already stretched long-term valuations and sterling could remain
unloved for the majority of the year. But, as the prospects for the US dollar
haven’t brightened as we’d expected, our year-end forecast stand at 1.66.
The biggest challenge to our view that the US dollar will underperform the rest of
this year is from expectations for US interest rates. If the market starts pricing in
earlier Federal Reserve interest rate hikes, this would be taken as a positive for
the US dollar. Conversely, the biggest challenge to our view that the euro’s value
is already stretched would come with a deterioration in the US external accounts.
However, we find it more likely the US export sector will continue to outperform
its euro-area counterpart, providing the valuation-based real economy
foundation, for a turn in EUR/USD.
Alan Ruskin Head of Currency Strategy [email protected] +1 203 897 6402
The Royal Bank of Scotland
Qu
arte
rly
Co
mm
od
ity
Co
mp
anio
n |
1 O
cto
ber
200
9
32
Economics – China special
The euphoria will fade
The speed of China’s recovery has so far impressed. Fiscal stimulus laid the
foundations for a rapid strengthening in activity, and GDP growth accelerated in
2Q to reach 7.8%.
The euphoria over a V-shaped recovery should grow in 2H 09. Year-ago
changes in the monthly economic data should rise sharply regardless of the
underlying trend – economic activity collapsed this time last year, providing a
low base of comparison against which to measure this year’s activity. Industrial
production, for instance, is forecast to reach near 20% yoy in the final months of
the year. Electricity production may rise at even more notable rates.
The rapid narrowing of deflation should also appear to confirm the strengthening
of economic activity. Food prices have started rising on a month-ago basis. The
rate of decline in rental prices is also slowing following stabilisation in the
housing market. Certainly manufacturing overcapacity could exert downward
pressure on core-consumer goods prices. But food prices are the largest and
most volatile driver of the CPI. Inflation may return as early as 4Q.
There is already discussion among academics about the need to tighten
monetary policy. The PBOC and banking regulators have used a combination of
verbal warnings and regulatory changes to slow credit growth from its surging
1H pace. The State Council ultimately decides monetary policy, and it has yet to
signal a change in the policy stance. But the market is likely to shortly start
pricing in a rising 1-year lending rate, the policy rate.
However, I maintain my bearish view on the outlook. Restocking played an
important role in the 1H recovery. The composition of growth also remains
imbalanced and overly reliant on public and residential investment. I thus
forecast 2010 GDP at 8%, unchanged from this year’s forecast. I expect my
more bearish view will gain traction in 1H10 as the monthly data starts to record
slower year-ago growth rates on unfavourable base effects and the scope of the
structural challenges becomes more evident.
The lack of economic reform is central to this view. In the late 1990s, the
government faced similarly large challenges as GDP growth slowed to below
7%. Fiscal stimulus was the initial response to the crisis. But it was later followed
by a series of “big-bang” reforms, including liberalisation of the housing sector,
state-owned enterprise reform and entry to the World Trade Organization. It was
the later series of economic reforms, not fiscal stimulus, that produced the
impressive growth rates of the past decade.
The government has not introduced a single “big-bang” reform in the currency
period. And there is a chance that it has failed to appreciate the risks of a long
retrenchment in global consumption. If so, the economy remains dangerously
reliant on public and residential investment.
I expect private business investment will remain weak in 2010, plagued by
overcapacity and a dearth of new investment opportunities. The lack of quarterly
expenditure-based GDP makes it difficult to observe such spending. However,
the National Development and Reform Commission, the country’s state planner,
recently proposed measures to spur private business investment, while the US
dollar value of exports is still 25% below its peaks, implying significant
overcapacity in the light manufacturing sector.
Ben Simpfendorfer Chief China Economist [email protected] +852 2966 2531

The Royal Bank of Scotland
Qu
arte
rly
Co
mm
od
ity
Co
mp
anio
n |
1 O
cto
ber
200
9
33
Source: CEIC; RBS
Base effects will spur yoy growth of industrial and electricity production in 2H
-20
-15
-10
-5
0
5
10
15
20
25
Ja n-07 Ju l-07 Ja n-08 J u l-08 Ja n-09 Ju l-09
Indus tria l p roduc tion E le c tric ity p roduc tion
%Y
oY
Source: CEIC; RBS
Urban fixed investment growth is strong on public and residential investment
15
20
25
30
35
40
05 07 09
%Y
oY
The government is talking of resolving demand-side obstacles, such as spurring
private consumption. However, reform is slow, and this is a decade(s)-long
project that will owe as much to generational change as improving social welfare
and reducing health and education costs. More attention must be paid to supply
side obstacles, in particular liberalising the services sector, such as the logistics
sector. To date, the services sector remains fragmented or subject to
government monopolies.
A failure to reform raises the risks to medium-term growth prospects. However,
the implications for commodities demand are less bearish than they are for the
overall economy. I expect that the government will respond to any downside
growth surprises by spurring spending on public infrastructure and residential
property. Spending in these two sectors is largely responsible for the rapid
acceleration in the nominal monthly fixed investment data to above 30% yoy in
1H.
It is popular to talk about “bridges to nowhere”. But China’s GDP per capita, on a
PPP-basis, is ranked 99 in the world, and the rural areas still lack basic water
and electricity services and a target for new spending. (Indeed, the latter is an
obstacle to subsidies aimed at spurring rural consumption of household
electrical goods). There will be instances of waste and overcapacity, but we
believe the government has the capacity to sustain public investment spending
for a number of years even if this fails to resolve economic imbalances.
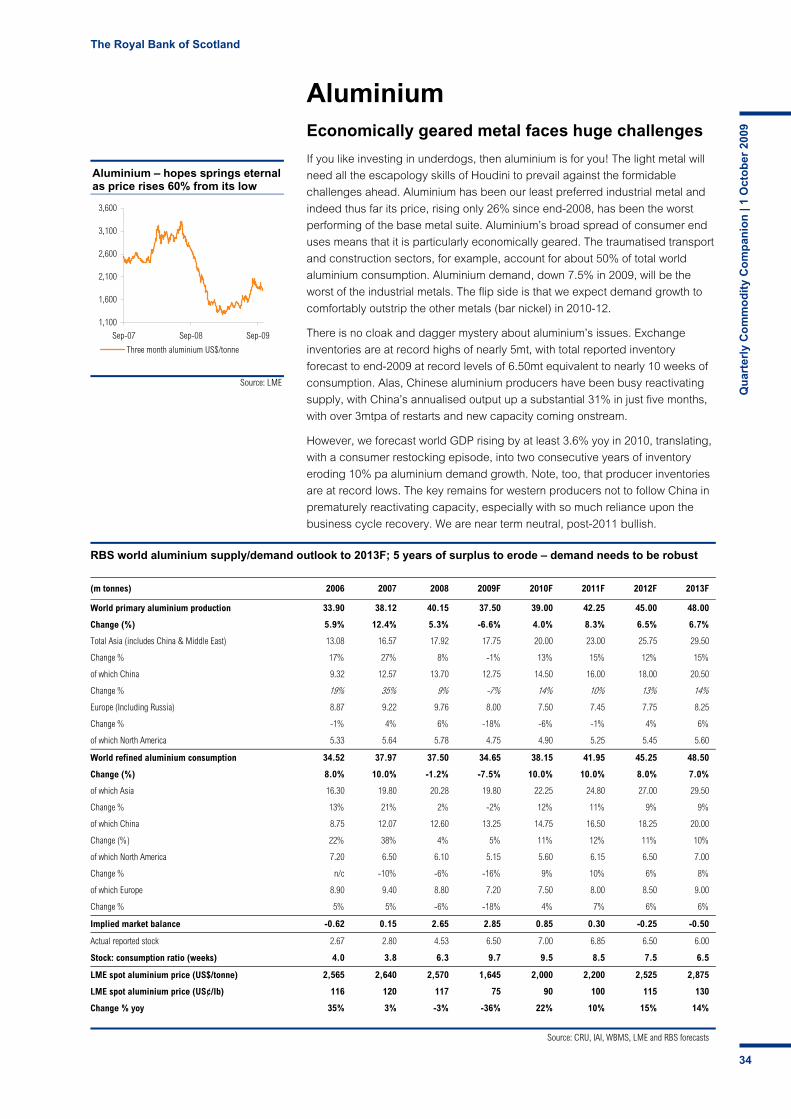
The Royal Bank of Scotland
Qu
arte
rly
Co
mm
od
ity
Co
mp
anio
n |
1 O
cto
ber
200
9
34
Source: LME
Aluminium – hopes springs eternal as price rises 60% from its low
1,100
1,600
2,100
2,600
3,100
3,600
Sep-07 Sep-08 Sep-09
Three month aluminium US$/tonne
Aluminium Economically geared metal faces huge challenges
If you like investing in underdogs, then aluminium is for you! The light metal will
need all the escapology skills of Houdini to prevail against the formidable
challenges ahead. Aluminium has been our least preferred industrial metal and
indeed thus far its price, rising only 26% since end-2008, has been the worst
performing of the base metal suite. Aluminium’s broad spread of consumer end
uses means that it is particularly economically geared. The traumatised transport
and construction sectors, for example, account for about 50% of total world
aluminium consumption. Aluminium demand, down 7.5% in 2009, will be the
worst of the industrial metals. The flip side is that we expect demand growth to
comfortably outstrip the other metals (bar nickel) in 2010-12.
There is no cloak and dagger mystery about aluminium’s issues. Exchange
inventories are at record highs of nearly 5mt, with total reported inventory
forecast to end-2009 at record levels of 6.50mt equivalent to nearly 10 weeks of
consumption. Alas, Chinese aluminium producers have been busy reactivating
supply, with China’s annualised output up a substantial 31% in just five months,
with over 3mtpa of restarts and new capacity coming onstream.
However, we forecast world GDP rising by at least 3.6% yoy in 2010, translating,
with a consumer restocking episode, into two consecutive years of inventory
eroding 10% pa aluminium demand growth. Note, too, that producer inventories
are at record lows. The key remains for western producers not to follow China in
prematurely reactivating capacity, especially with so much reliance upon the
business cycle recovery. We are near term neutral, post-2011 bullish.
RBS world aluminium supply/demand outlook to 2013F; 5 years of surplus to erode – demand needs to be robust
(m tonnes) 2006 2007 2008 2009F 2010F 2011F 2012F 2013F
World primary aluminium production 33.90 38.12 40.15 37.50 39.00 42.25 45.00 48.00
Change (%) 5.9% 12.4% 5.3% -6.6% 4.0% 8.3% 6.5% 6.7%
Total Asia (includes China & Middle East) 13.08 16.57 17.92 17.75 20.00 23.00 25.75 29.50
Change % 17% 27% 8% -1% 13% 15% 12% 15%
of which China 9.32 12.57 13.70 12.75 14.50 16.00 18.00 20.50
Change % 19% 35% 9% -7% 14% 10% 13% 14%
Europe (Including Russia) 8.87 9.22 9.76 8.00 7.50 7.45 7.75 8.25
Change % -1% 4% 6% -18% -6% -1% 4% 6%
of which North America 5.33 5.64 5.78 4.75 4.90 5.25 5.45 5.60
World refined aluminium consumption 34.52 37.97 37.50 34.65 38.15 41.95 45.25 48.50
Change (%) 8.0% 10.0% -1.2% -7.5% 10.0% 10.0% 8.0% 7.0%
of which Asia 16.30 19.80 20.28 19.80 22.25 24.80 27.00 29.50
Change % 13% 21% 2% -2% 12% 11% 9% 9%
of which China 8.75 12.07 12.60 13.25 14.75 16.50 18.25 20.00
Change (%) 22% 38% 4% 5% 11% 12% 11% 10%
of which North America 7.20 6.50 6.10 5.15 5.60 6.15 6.50 7.00
Change % n/c -10% -6% -16% 9% 10% 6% 8%
of which Europe 8.90 9.40 8.80 7.20 7.50 8.00 8.50 9.00
Change % 5% 5% -6% -18% 4% 7% 6% 6%
Implied market balance -0.62 0.15 2.65 2.85 0.85 0.30 -0.25 -0.50
Actual reported stock 2.67 2.80 4.53 6.50 7.00 6.85 6.50 6.00
Stock: consumption ratio (weeks) 4.0 3.8 6.3 9.7 9.5 8.5 7.5 6.5
LME spot aluminium price (US$/tonne) 2,565 2,640 2,570 1,645 2,000 2,200 2,525 2,875
LME spot aluminium price (US¢/lb) 116 120 117 75 90 100 115 130
Change % yoy 35% 3% -3% -36% 22% 10% 15% 14%
Source: CRU, IAI, WBMS, LME and RBS forecasts

The Royal Bank of Scotland
Qu
arte
rly
Co
mm
od
ity
Co
mp
anio
n |
1 O
cto
ber
200
9
35
Source: CRU
Aluminium consumption by key sector offtake
Transport28%
Packaging18%
Construction20%
Other34%
Source: Bloomberg and RBS
Total US auto sales hit 17-year lows in Jan’09, but rose to 15-month highs (units of vehicle sales)
600
800
1,000
1,200
1,400
1,600
1,800
91 92 94 95 97 98 00 01 03 04 06 07 09
US auto sales - monthly 12 mth moving average
Source: ACEA and RBS
Percentage change in monthly EU passenger car registrations (% ch yoy)
-25%
-20%
-15%
-10%
-5%
0%
5%
10%
Jan-08 M ay-08 Sep-08 Jan-09 M ay-09
EU (15) yoy EU (15) 3m M A
Demand – looks set for robust rebound in 2010-11F
World aluminium consumption has just endured two consecutive years of
contraction, during which time offtake has fallen by 9%, equivalent to 3.32mt of
metal lost to the recession. Aluminium is used in a broad range of end-use
sectors embracing transport, construction, packaging, electrical and consumer
durables, hence aluminium consumption is economically geared and the dismal
macroeconomic environment has taken a heavy toll upon aluminium
consumption. But so too the reverse. Historically, aluminium (along with nickel)
has been a metal showing potent demand growth in upswings of the world
economy. This potency will derive from real consumption growth augmented by
consumer and distributor restocking. Our long-run trend growth forecast for
world aluminium demand is 4% pa, but for the above reasons, we forecast that
the next two years will enjoy well above trend 10% pa increases.
‘Cash-for-clunkers’ schemes – mission accomplished
Aluminium’s use in vehicles arises from properties such as its weight-saving
advantages over steel. Aluminium has a range of applications such as engine
blocks, alloy wheels and vehicle space frames. One of the key areas for renewed
aluminium demand growth should arise from the very successful governmental
cash-for-clunkers subsidy schemes. These have reversed the substantial
production cuts made by many of the world’s key automobile manufacturers. For
example, so successful was the US clunkers scheme that barely a month after it
was introduced, the scheme was closed for fear of breaching the US$3bn ceiling
allocated by Congress. Industry estimates suggest that nearly 700,000 new
sales were generated by the US scheme. The chart below shows the astonishing
rebound in US auto sales, which in August at 1.261m units was the strongest in
15 months and up over 90% from the January 2009 nadir.
This most pragmatic of consumer stimulus schemes began in Europe, led by
Germany. The right-hand chart above shows data from the European Automobile
Manufacturers’ Association (ACEA) for the European Union. Contraction in EU
passenger car sales has come to an emergency halt and they have now
rebounded to post three consecutive months of net increase with registrations at
16-month highs. Yes, we are concerned that the scrappage schemes have
merely brought forward future sales and 2010 may see a relapse when the
schemes expire. However, we note that such has been the success of the
schemes that some EU countries are showing signs of supporting the schemes

The Royal Bank of Scotland
Qu
arte
rly
Co
mm
od
ity
Co
mp
anio
n |
1 O
cto
ber
200
9
36
Source: CRU and RBS
Yoy change in world aluminium consumption 2001-2013F
-9%
-6%
-3%
0%
3%
6%
9%
12%
01 03 05 07 09F 11F 13F
Source: RBS, Motor Associations
Chinese auto sales vs US light vehicle sales; catching up (000)
0
400
800
1,200
1,600
2,000
Aug-05 Aug-07 Aug-09
US China
Source: WBMS and RBS
China’s share of world aluminium demand has risen from 4% to 38%
4%
23%
38%
13%
0%
10%
20%
30%
40%
50%
China USA
World aluminium market share in 1990 (%)
World aluminium market share in 2008 (%)
into 2010 with Germany allowing delayed deliveries under its scheme into 2010.
Whatever the ethics of scrapping perfectly functional vehicles, the net effect will
be to reduce the average age of the vehicle fleet; replacing vehicles with poor
emission levels with more fuel-efficient, lower emission vehicles and with better
safety features. One other feature is that many of the new vehicles being
purchased are smaller than those scrapped.
In Germany, the €5bn scheme (now ended) that began in February offered
€2,500 for vehicles more than 9 years old. Over 600,000 new car registrations
and 1m applications have been received. Other EU countries, such as France,
Italy, Spain and the UK, have adopted similar schemes. The UK scheme, which
began in May and was set to last until February 2010, provides a £2,000
incentive split equally between the government and the motor manufacturer. This
scheme has just been extended to embrace a further 100,000 vehicles having
been close to reaching its funding limit. Scrappage has also been a roaring
success in China which introduced its own incentives and the China Association
of Automobile Manufacturers reported that passenger auto sales were up 90%
yoy in August, with a total of 858,300 passenger cars sold vs 451,400 in August
2008. As our sidebar chart shows, at one stage Chinese vehicle sales overtook
those of the US, prior to the US scrappage scheme stimulus.
Watch for rebound in demand from dismal lows as business cycle recovers
World aluminium consumption in 2008-09 underwent a significant growth
dislocation, not unlike that seen after the two oil shocks of the mid-1970s and
early 1980s. Between 2001 and 2007, world aluminium demand increased at a
CAGR 8% pa, double the 4% pa growth rate of the second half of the 1990s. The
key reason for this above-trend growth was the boost that aluminium demand
received from rapidly growing Chinese consumption, which averaged a CAGR of
23% pa over 2001-07. But 2007 proved to be a watershed for aluminium
demand. Growth of 10% yoy took world demand to a record 37.97mt, with China
slotting in a headline-grabbing 38%. The 2008 year saw world demand contract
1.2% and we forecast an additional contraction of nearly 8% in 2009, to 34.65mt.
We view 2010 as a year in which most of the key consuming regions will claw
their way out of the abyss. Evidence is already gathering. US housing starts and
auto production on the rise; we see exciting data from China on auto sales but
also on rising floor space under construction, all part of the Chinese urbanisation
and industrialisation theme. The key point here is the shift in the rural population
towards the cities. In 1990, around 28% of the population lived in cities against a
current level of around 45%. This has meant rising incomes and aluminium
consumption per capita in China remains on a rising curve. We note that China
has been a significant importer of aluminium and products in 2009 via its state-
sponsored stockpiling initiative at both the provincial and state level – eg Henan
Province buying 0.500mt of metal and SRB stockpiling 0.590mt.
Our economists forecast that world GDP will soon be on a sharply rising
trajectory and increase by 3.6% in 2010. We expect this to have dramatic
implications for world aluminium offtake, which we forecast will increase by more
than double that growth rate to 10% in 2010 and in 2011. Typically, as consumer
confidence returns, low-ticket item purchases such as white goods
(dishwashers, washing machines, freezers etc.) recover first. Off a low 2009
base of 34.65mt, we forecast that world aluminium demand, augmented by
consumer restocking, will rise by 3.50mt in 2010 to 38.15mt and a further 3.80mt
in 2011. Growth will likely moderate thereafter, but between end-2009 and 2013,
we forecast world aluminium demand will rise by 13.85mt a CAGR of 8.8% pa.
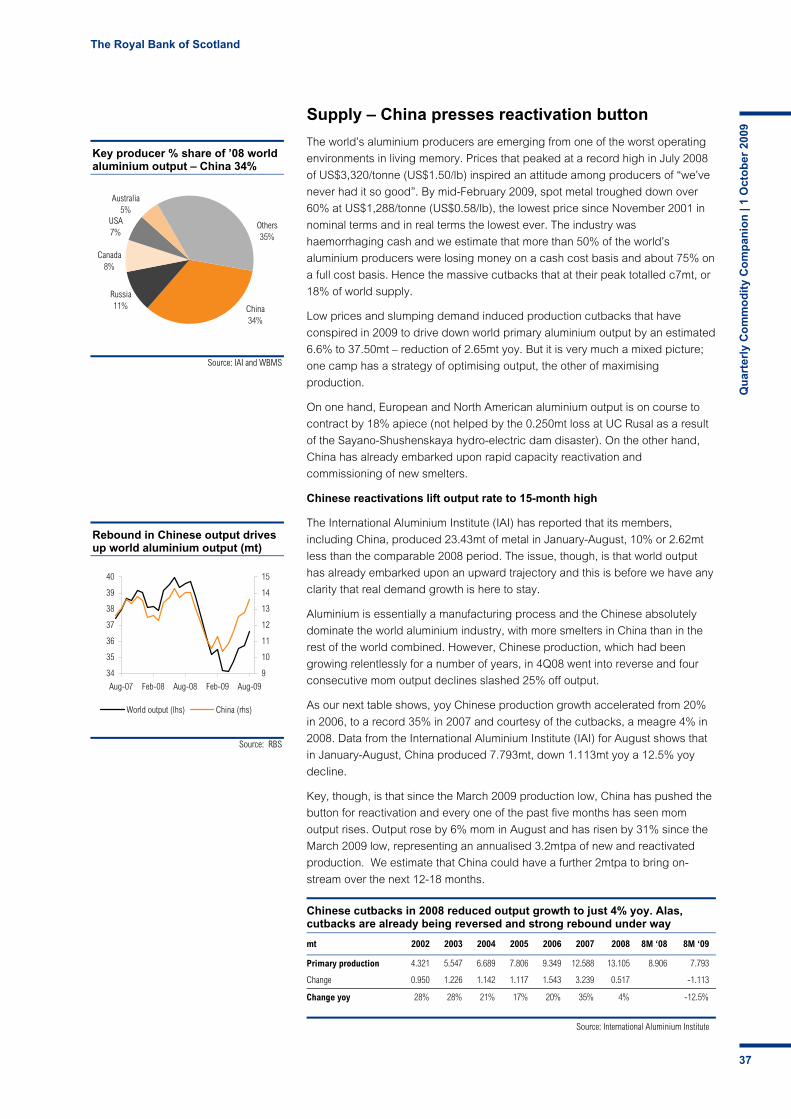
The Royal Bank of Scotland
Qu
arte
rly
Co
mm
od
ity
Co
mp
anio
n |
1 O
cto
ber
200
9
37
Source: IAI and WBMS
Key producer % share of ’08 world aluminium output – China 34%
Russia11%
Others35%
China34%
Canada8%
USA7%
Australia5%
Source: RBS
Rebound in Chinese output drives up world aluminium output (mt)
34
35
36
37
38
39
40
Aug-07 Feb-08 Aug-08 Feb-09 Aug-09
9
10
11
12
13
14
15
World output (lhs) China (rhs)
Supply – China presses reactivation button
The world’s aluminium producers are emerging from one of the worst operating
environments in living memory. Prices that peaked at a record high in July 2008
of US$3,320/tonne (US$1.50/lb) inspired an attitude among producers of “we’ve
never had it so good”. By mid-February 2009, spot metal troughed down over
60% at US$1,288/tonne (US$0.58/lb), the lowest price since November 2001 in
nominal terms and in real terms the lowest ever. The industry was
haemorrhaging cash and we estimate that more than 50% of the world’s
aluminium producers were losing money on a cash cost basis and about 75% on
a full cost basis. Hence the massive cutbacks that at their peak totalled c7mt, or
18% of world supply.
Low prices and slumping demand induced production cutbacks that have
conspired in 2009 to drive down world primary aluminium output by an estimated
6.6% to 37.50mt – reduction of 2.65mt yoy. But it is very much a mixed picture;
one camp has a strategy of optimising output, the other of maximising
production.
On one hand, European and North American aluminium output is on course to
contract by 18% apiece (not helped by the 0.250mt loss at UC Rusal as a result
of the Sayano-Shushenskaya hydro-electric dam disaster). On the other hand,
China has already embarked upon rapid capacity reactivation and
commissioning of new smelters.
Chinese reactivations lift output rate to 15-month high
The International Aluminium Institute (IAI) has reported that its members,
including China, produced 23.43mt of metal in January-August, 10% or 2.62mt
less than the comparable 2008 period. The issue, though, is that world output
has already embarked upon an upward trajectory and this is before we have any
clarity that real demand growth is here to stay.
Aluminium is essentially a manufacturing process and the Chinese absolutely
dominate the world aluminium industry, with more smelters in China than in the
rest of the world combined. However, Chinese production, which had been
growing relentlessly for a number of years, in 4Q08 went into reverse and four
consecutive mom output declines slashed 25% off output.
As our next table shows, yoy Chinese production growth accelerated from 20%
in 2006, to a record 35% in 2007 and courtesy of the cutbacks, a meagre 4% in
2008. Data from the International Aluminium Institute (IAI) for August shows that
in January-August, China produced 7.793mt, down 1.113mt yoy a 12.5% yoy
decline.
Key, though, is that since the March 2009 production low, China has pushed the
button for reactivation and every one of the past five months has seen mom
output rises. Output rose by 6% mom in August and has risen by 31% since the
March 2009 low, representing an annualised 3.2mtpa of new and reactivated
production. We estimate that China could have a further 2mtpa to bring on-
stream over the next 12-18 months.
Chinese cutbacks in 2008 reduced output growth to just 4% yoy. Alas, cutbacks are already being reversed and strong rebound under way
mt 2002 2003 2004 2005 2006 2007 2008 8M ‘08 8M ‘09
Primary production 4.321 5.547 6.689 7.806 9.349 12.588 13.105 8.906 7.793
Change 0.950 1.226 1.142 1.117 1.543 3.239 0.517 -1.113
Change yoy 28% 28% 21% 17% 20% 35% 4% -12.5%
Source: International Aluminium Institute
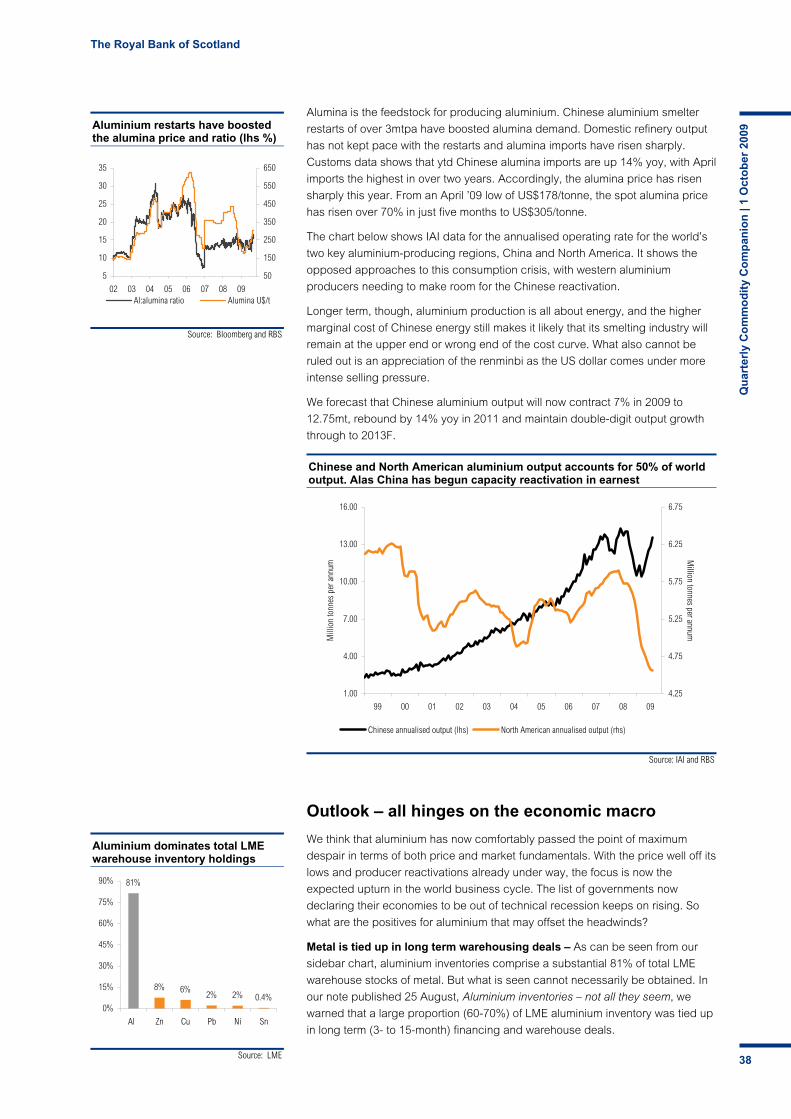
The Royal Bank of Scotland
Qu
arte
rly
Co
mm
od
ity
Co
mp
anio
n |
1 O
cto
ber
200
9
38
Source: IAI and RBS
Chinese and North American aluminium output accounts for 50% of world output. Alas China has begun capacity reactivation in earnest
1.00
4.00
7.00
10.00
13.00
16.00
99 00 01 02 03 04 05 06 07 08 09
Mill
ion
tonn
es p
er a
nnum
4.25
4.75
5.25
5.75
6.25
6.75
Million tonnes per annum
Chinese annualised output (lhs) North American annualised output (rhs)
Source: LME
Aluminium dominates total LME warehouse inventory holdings
81%
8% 6%2% 2% 0.4%
0%
15%
30%
45%
60%
75%
90%
Al Zn Cu Pb Ni Sn
Source: Bloomberg and RBS
Aluminium restarts have boosted the alumina price and ratio (lhs %)
5
10
15
20
25
30
35
02 03 04 05 06 07 08 09
50
150
250
350
450
550
650
Al:alumina ratio Alumina U$/t
Alumina is the feedstock for producing aluminium. Chinese aluminium smelter
restarts of over 3mtpa have boosted alumina demand. Domestic refinery output
has not kept pace with the restarts and alumina imports have risen sharply.
Customs data shows that ytd Chinese alumina imports are up 14% yoy, with April
imports the highest in over two years. Accordingly, the alumina price has risen
sharply this year. From an April ’09 low of US$178/tonne, the spot alumina price
has risen over 70% in just five months to US$305/tonne.
The chart below shows IAI data for the annualised operating rate for the world’s
two key aluminium-producing regions, China and North America. It shows the
opposed approaches to this consumption crisis, with western aluminium
producers needing to make room for the Chinese reactivation.
Longer term, though, aluminium production is all about energy, and the higher
marginal cost of Chinese energy still makes it likely that its smelting industry will
remain at the upper end or wrong end of the cost curve. What also cannot be
ruled out is an appreciation of the renminbi as the US dollar comes under more
intense selling pressure.
We forecast that Chinese aluminium output will now contract 7% in 2009 to
12.75mt, rebound by 14% yoy in 2011 and maintain double-digit output growth
through to 2013F.
Outlook – all hinges on the economic macro
We think that aluminium has now comfortably passed the point of maximum
despair in terms of both price and market fundamentals. With the price well off its
lows and producer reactivations already under way, the focus is now the
expected upturn in the world business cycle. The list of governments now
declaring their economies to be out of technical recession keeps on rising. So
what are the positives for aluminium that may offset the headwinds?
Metal is tied up in long term warehousing deals – As can be seen from our
sidebar chart, aluminium inventories comprise a substantial 81% of total LME
warehouse stocks of metal. But what is seen cannot necessarily be obtained. In
our note published 25 August, Aluminium inventories – not all they seem, we
warned that a large proportion (60-70%) of LME aluminium inventory was tied up
in long term (3- to 15-month) financing and warehouse deals.
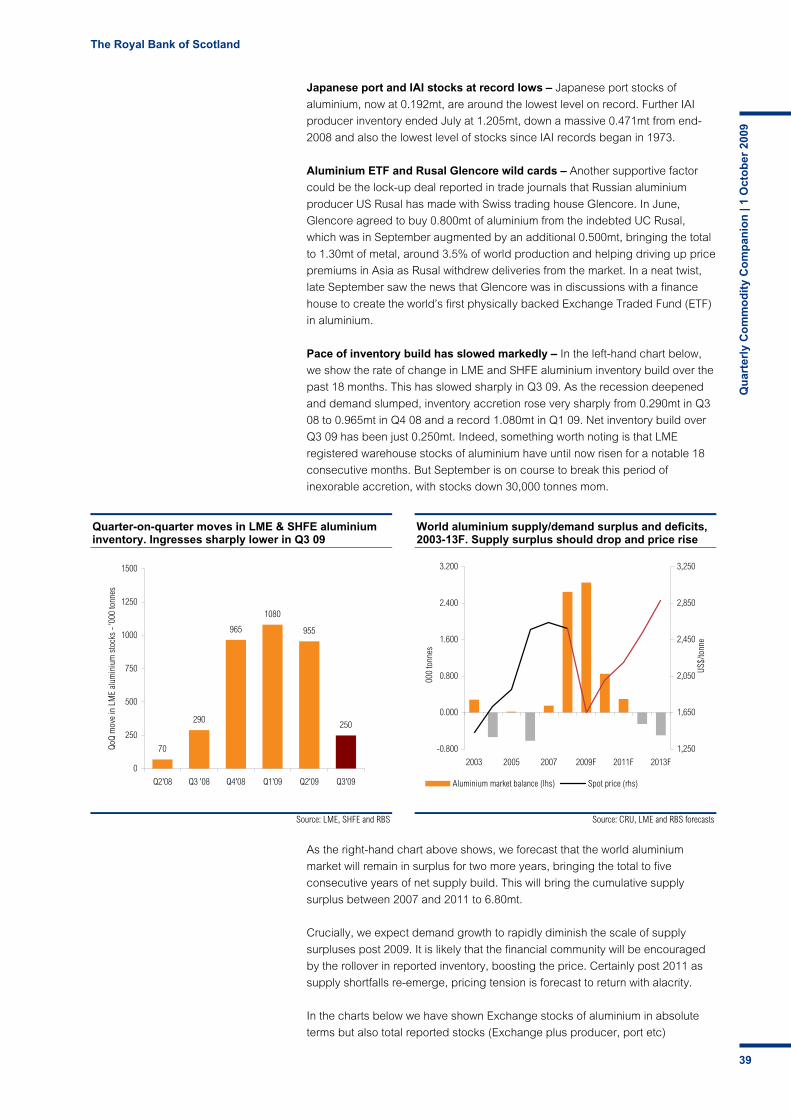
The Royal Bank of Scotland
Qu
arte
rly
Co
mm
od
ity
Co
mp
anio
n |
1 O
cto
ber
200
9
39
Source: LME, SHFE and RBS
Quarter-on-quarter moves in LME & SHFE aluminium inventory. Ingresses sharply lower in Q3 09
70
290
965
1080
955
250
0
250
500
750
1000
1250
1500
Q2'08 Q3 '08 Q4'08 Q1'09 Q2'09 Q3'09
QoQ
mov
e in
LM
E al
umin
ium
sto
cks
- '00
0 to
nnes
Source: CRU, LME and RBS forecasts
World aluminium supply/demand surplus and deficits, 2003-13F. Supply surplus should drop and price rise
-0.800
0.000
0.800
1.600
2.400
3.200
2003 2005 2007 2009F 2011F 2013F
000
tonn
es
1,250
1,650
2,050
2,450
2,850
3,250
US$/
tonn
e
Aluminium market balance (lhs) Spot price (rhs)
Japanese port and IAI stocks at record lows – Japanese port stocks of
aluminium, now at 0.192mt, are around the lowest level on record. Further IAI
producer inventory ended July at 1.205mt, down a massive 0.471mt from end-
2008 and also the lowest level of stocks since IAI records began in 1973.
Aluminium ETF and Rusal Glencore wild cards – Another supportive factor
could be the lock-up deal reported in trade journals that Russian aluminium
producer US Rusal has made with Swiss trading house Glencore. In June,
Glencore agreed to buy 0.800mt of aluminium from the indebted UC Rusal,
which was in September augmented by an additional 0.500mt, bringing the total
to 1.30mt of metal, around 3.5% of world production and helping driving up price
premiums in Asia as Rusal withdrew deliveries from the market. In a neat twist,
late September saw the news that Glencore was in discussions with a finance
house to create the world’s first physically backed Exchange Traded Fund (ETF)
in aluminium.
Pace of inventory build has slowed markedly – In the left-hand chart below,
we show the rate of change in LME and SHFE aluminium inventory build over the
past 18 months. This has slowed sharply in Q3 09. As the recession deepened
and demand slumped, inventory accretion rose very sharply from 0.290mt in Q3
08 to 0.965mt in Q4 08 and a record 1.080mt in Q1 09. Net inventory build over
Q3 09 has been just 0.250mt. Indeed, something worth noting is that LME
registered warehouse stocks of aluminium have until now risen for a notable 18
consecutive months. But September is on course to break this period of
inexorable accretion, with stocks down 30,000 tonnes mom.
As the right-hand chart above shows, we forecast that the world aluminium
market will remain in surplus for two more years, bringing the total to five
consecutive years of net supply build. This will bring the cumulative supply
surplus between 2007 and 2011 to 6.80mt.
Crucially, we expect demand growth to rapidly diminish the scale of supply
surpluses post 2009. It is likely that the financial community will be encouraged
by the rollover in reported inventory, boosting the price. Certainly post 2011 as
supply shortfalls re-emerge, pricing tension is forecast to return with alacrity.
In the charts below we have shown Exchange stocks of aluminium in absolute
terms but also total reported stocks (Exchange plus producer, port etc)

The Royal Bank of Scotland
Qu
arte
rly
Co
mm
od
ity
Co
mp
anio
n |
1 O
cto
ber
200
9
40
Source: LME, SHFE and RBS
Total Exchange stocks of aluminium at record highs. But watch them come down when demand accelerates
0
1,000
2,000
3,000
4,000
5,000
87 89 91 93 95 97 99 01 03 05 07 09
'000
tonn
es
40
65
90
115
140
165
USc/lb
Total aluminium inventory on Metal Exchanges(lhs)
LME monthly average spot aluminium (rhs)
Source: IAI, WBMS, LME, SHFE and RBS
Aluminium stock:consumption ratio vs real price. We forecast stock ratio will start declining post 2009
0
2
4
6
8
10
12
14
16
18
1988 1992 1996 2000 2005 2009F 2013F
1,000
1,500
2,000
2,500
3,000
3,500
4,000
4,500
5,000
5,500
Stock:consumption ratio - weeks Real Prices US$/t (rhs)
expressed in terms of a stock:consumption ratio. We forecast total reported
inventories at end-2009 will reach 6.50mt, equivalent to 19% of 2009 world
consumption. By 2013F, we think that inventory will have been eroded to around
12% of world demand. Typically, as the right-hand chart below shows, less than
five weeks of stock has been a trigger for markedly higher aluminium prices. We
estimate that by end-2009, the aluminium market will be double this level at 10
weeks the highest stock ratio in 15 years. This equates to 6.50mt, thus over 3mt
needs to be eroded.
Next few months will be crucial to getting the recovery under way
We have left unchanged our long-term aluminium price at US$2,425/tonne
(US$1.10/lb). Rising cost pressures from a weaker US dollar have been offset by
lower energy and raw material inputs, whilst the inventory overhang and idled
capacity will likely defer plans for too many new smelters to come to the drawing
board for a while.
We have raised our aluminium price profile only slightly since our April
Commodity Companion, by 5-7% for the 2009-11F years. Thereafter we have
retained our enthusiasm for the price profile. Having averaged 2008 at
US$2,570/tonne (US$1.17/lb), our forecast for a 2009 spot price average of
US$1,655/tonne (US$0.75/lb) will represent a 36% yoy price decline. We expect
modest price progression in 2010-11 as the supply surplus is reduced.
The real fireworks should begin in 2012, when we expect the first supply deficit
in 5 years to emerge. By 2013, we expect a 0.500mt supply shortfall, leading us
to pencil in an aluminium price average more than 70% higher than in 2009 at
US$2,875/tonne (US$1.30/lb). The aluminium market is on the mend and has
already been able to contend with the reactivation of around 50% of its idled
capacity. Our outlook stance is near-term neutral, post 2011 bullish.

The Royal Bank of Scotland
Qu
arte
rly
Co
mm
od
ity
Co
mp
anio
n |
1 O
cto
ber
200
9
41
Selected price-related production cutbacks in the aluminium industry since mid-2008 – (red indicates reactivation)
Plant, company, country Date announced/implemented Annualised tonnage cut Notes
Alumina refineries Shandong, Weiqiao, China Implemented September 2008 Cut 2mt/y of 4mt/y capacity Shandong, Lubei, China Announced October 2008 To close 1mt/y refinery Point Comfort, Alcoa, US Implemented November 2008 Cut by 550kt/y Zaporozhye, Rusal, Ukraine Announced November 2008/March 2009 Unspecified cut at 265kt/y plant Chalco, China Announced November 2008/March 2009 Closing ~4.3mt/y of cap. (39% of total) Restarting 670kt/y by August 2009Alcoa Implemented November 2008 Unspecified cuts of ~700kt/y Believed to be in addition to Pt. ComfortPodgorica, KAP, Montenegro Announced November 2008 Unspecified cut at 280kt/y plant Eurallumina, RUSAL/Glencore, Italy Announced December 2008/February 2009 Cut by 50%, then to close 1.1mt/y plant Ewarton/Kirkvine, Windalco (RUSAL), Jamaica Announced December 2008/February 2009 To cut by 35% of combined cap., then close Combined capacity 1.3mt/yHenan Wanji, China Announced January/April 2009 Cut to 50% at 800kt/y plant, then up to 80% Alcoa Announced January 2009 Unspecified cut of a further ~250kt/y Nain, Alpart, Jamaica Announced January/March 2009 To cut by 50%, then close 1.65mt/y plant Vaudreuil, Rio Tinto Alcan, Canada Announced January 2009 To cut by 25%, or 400kt/y Back to full capacity September 2009Gardanne, Rio Tinto Alcan, France Announced January 2009 To cut by 15%, or ~105kt/y Aughinish, RUSAL/Glencore, Ireland Announced February 2009 To cut by 37% at 2mt/y plant Gramercy, Noranda Al, US Announced Q1 09 Cut by 50% at 1.2mt/y plant Back to full production Q4 09Birac, Bosnia Announced April 2009 Cutting by ~180kt to 120kt Cap. 600kt/y but recent output ~300kt/yCorpus Christi, Sherwin Alumina, US Implemented April 2009 Cut 40% of 1.4mt/y metallurgical capacity Paranam, Suralco (Alcoa), Surinam Announced May 2009 To cut by ~40% at 2.2mt/y plant Friguia, RUSAL, Guinea Announced June 2009 To cut by ~385kt/y at 850kt/y plant For one month, back to normal Aug 09Aluminium smelters Columbia Falls, Glencore, US Implemented July 2008/January 2009 Closed 11/2 of 2 potlines at 168kt/y plant Other three potlines already closed Sichuan Aostar, China Implemented September/December 2008 Cut by 40kt/y, then total of 250kt/y But began full restart in March 2009Puerto Ordaz, Alcasa, Venezuela Implemented September 2008/February 2009 Cumulatively cut to 75% of 210kt/y capacity But has rarely produced at capacityRockdale, Alcoa, US Implemented June, October 2008 Cut by 120kt/y, closure of rest (145kt/y) Vimetco, China Implemented October 2008/January 2009 Cut in stages by 145kt/y Emeishan Aluminium, China Implemented October 2008 Has cut by 50kt/y of 150kt/y Zhongfu, China Has cut 50kt/y of 300kt/y plant Longquan Aluminium, China Has cut 40kt/y of 600 kt/y HMHJ Aluminium, China Has cut ~30kt/y of 300kt/y Shandong, Chalco, China To close 70kt/y plant Zhengzhou, Chalco, China To cut 40kt/y of 60kt/y plant Yunnan Aluminium, China To cut by 10-15% of 400kt/y capacity Rio Tinto Alcan, Norway/UK Announced October/December 2008 Cuts across various smelters of ~150kt/y 60kt UK, 90kt NorwayDunkirk/St Jean, Rio Tinto Alcan, France Announced November 2008 Cut of 29kt/y Dunkirk, 23kt/y St Jean Dunkirk cut to be reversed by June 2009Chalco, China Announced October 2008/March 2009 Cut by ~950kt/y across company Restarting almost all by Q4 09Sepetiba Bay, Valesul (Vale), Brazil Announced October 2008 To cut by ~57kt/y of 95kt/y Zaporozhye, RUSAL, Ukraine Announced November 2008/March 2009 Closing 3 of 4 potlines at 115kt/y plant Alcoa, incl. Ferndale, US, Baie Comeau, Canada Implemented November 2008 Cuts amounting to 350kt/y Ningxia Qinyi Zhongning, Rio Tinto Alcan, China Implemented November 2008 Unspecified cuts at 150kt/y smelter Karmoy, Hydro Aluminium, Norway Implemented/announced December 2008 To cut by 24kt/y at 120kt/y line Then to close in Q1 09 instead of end 09Aluminij Mostar, Bosnia Announced November/December 2008 To cut by 25% at 140kt/y plant Started to return to full cap. Sept 09Podgorica, KAP, Montenegro Announced November 2008 To cut by 60-65kt/y of 125kt/y Mettur, Malco (Vedanta), India Implemented November/December 2008 Cut 40kt/y plant by 60%, then close Konin, Impexmetal, Poland Announced November 2008 To close 55kt/y plant in H1 09 Essen, Trimet, Germany Implemented November 2008/January 2009 Closed 1 then 2 of 3 lines at 170kt/y plant But partial restart May 2009Portland, Alcoa, Australia Implemented December 2008/April 2009 Cut by 15kt/y then to 53kt/y at 358kt/y plant Danjiangkou, China Implemented December 2008/February 2009 Cut by 30kt/y at 120kt/y plant Husnes, Soral (Hydro/Rio Tinto Alcan), Norway Announced December 2008/February 2009 Cutting in two stages to 50% of capacity Capacity 173kt/yBogoslovsk/Uralsky, RUSAL, Russia Announced December 2008 To cut by 180kt/y Combined cap. 325kt/y, cuts mainly hereTursunzade, Talco, Tajikistan Announced December 2008/April 2009 Cut by ~25%, ~100kt/y at least in Q1 09 Started raising output July, full end 09Ravenswood, Century Aluminium, US Implemented December 2008/February 2009 Cut by 42kt/y, the closed 170kt/y plant Slatina, Vimetco, Romania Implemented January/February 2009 Cut in two stages by 65kt/y of 270kt/y Alcoa Tennessee, Alcoa, US Announced January 2009 To close 220kt/y plant ~85kt/y had already been cutShanxi Guanlu, China Announced January 2009 To cut 40kt/y at 110kt/y plant Holyhead, Rio Tinto Alcan/Kaiser, UK Announced January/August 2009 To close 145kt/y plant in Sept. 2009 Beauharnois, Rio Tinto Alcan, Canada Announced January 2009 To close 52kt/y plant in Q2 09 Korba, Balco (Vedanta), India Implemented January 2009 Cut of ~20% at 110kt/y line Neuss (Norf), Norsk Hydro, Germany Announced January/April 2009 Gradual cut to 21% of 230 kt/y capacity State aid plan to reverse H2 09 closureRUSAL, Russia Announced February 2009 To cut by further 320k/y At unspecified plants in RussiaHamburg, Trimet, Germany Implemented February 2009 Cut of 30% at 130kt/y plant Hawesville, Century Aluminium, US Implemented March/May 2009 Cut one 52kt/y potline, then ~14kt/y at others Five potlines, combined capacity 250kt/yGuangxi Yinhai, China Implemented March 2009 Cut by ~33% of 250kt/y capacity Back to full production by October 2009Sunndal, Hydro Aluminium, Norway Announced March 2009 To cut by 25% at 400kt/y plant Massena East, Alcoa, US Announced March 2009 To cut by 120kt/y Novokuznetsk, RUSAL, Russia Implemented April 2009 Cutting by 33% at 320kt/y plant San Ciprian/Aviles/La Coruna, Alcoa, Spain Announced May 2009 Cut by 18% of combined capacity 408kt/y Implemented in Q1 09Hannibal, Ormet, US Implemented May/August 2009 Closed 1 then 2 of 6 lines at 270kt/y plant Alumina dispute with GlencoreEstimated unidentified cuts, mainly in China ~1,750kt/y But 3mt/y + restarts in China by mid-2009
Source: Company reports, Reuters, Bloomberg, RBS
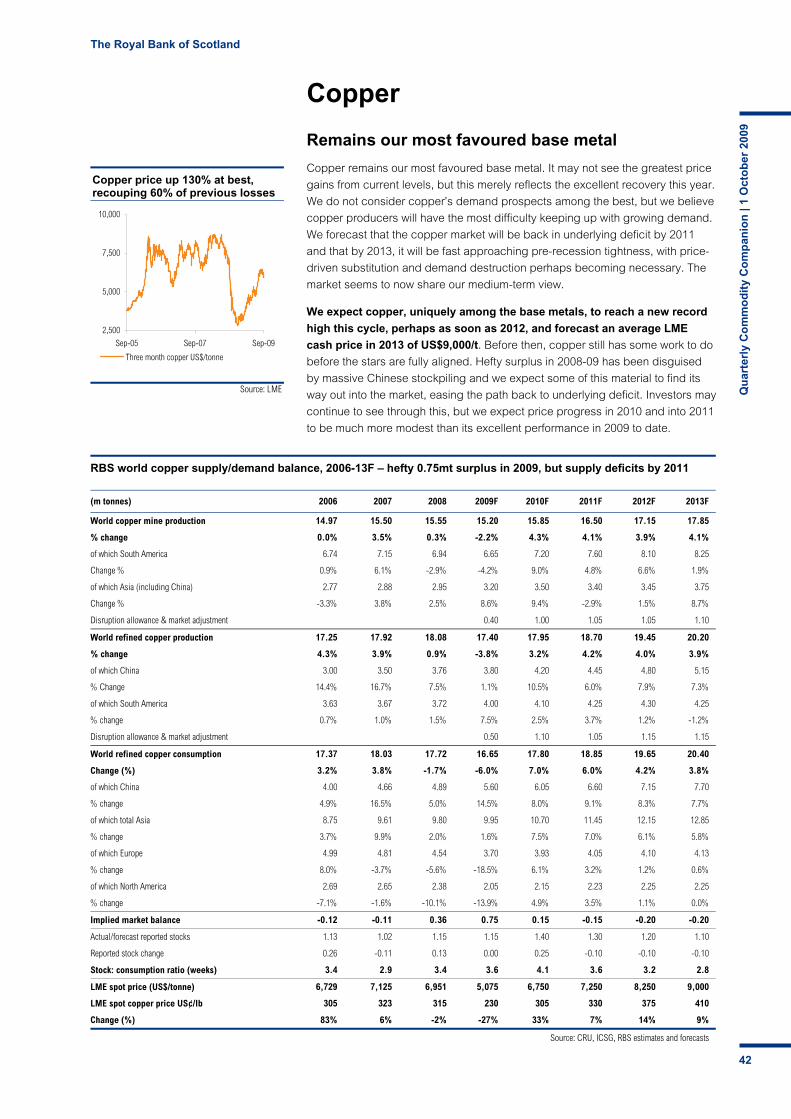
The Royal Bank of Scotland
Qu
arte
rly
Co
mm
od
ity
Co
mp
anio
n |
1 O
cto
ber
200
9
42
Source: LME
Copper price up 130% at best, recouping 60% of previous losses
2,500
5,000
7,500
10,000
Sep-05 Sep-07 Sep-09
Three month copper US$/tonne
Copper
Remains our most favoured base metal
Copper remains our most favoured base metal. It may not see the greatest price
gains from current levels, but this merely reflects the excellent recovery this year.
We do not consider copper’s demand prospects among the best, but we believe
copper producers will have the most difficulty keeping up with growing demand.
We forecast that the copper market will be back in underlying deficit by 2011
and that by 2013, it will be fast approaching pre-recession tightness, with price-
driven substitution and demand destruction perhaps becoming necessary. The
market seems to now share our medium-term view.
We expect copper, uniquely among the base metals, to reach a new record
high this cycle, perhaps as soon as 2012, and forecast an average LME
cash price in 2013 of US$9,000/t. Before then, copper still has some work to do
before the stars are fully aligned. Hefty surplus in 2008-09 has been disguised
by massive Chinese stockpiling and we expect some of this material to find its
way out into the market, easing the path back to underlying deficit. Investors may
continue to see through this, but we expect price progress in 2010 and into 2011
to be much more modest than its excellent performance in 2009 to date.
RBS world copper supply/demand balance, 2006-13F – hefty 0.75mt surplus in 2009, but supply deficits by 2011
(m tonnes) 2006 2007 2008 2009F 2010F 2011F 2012F 2013F
World copper mine production 14.97 15.50 15.55 15.20 15.85 16.50 17.15 17.85
% change 0.0% 3.5% 0.3% -2.2% 4.3% 4.1% 3.9% 4.1%
of which South America 6.74 7.15 6.94 6.65 7.20 7.60 8.10 8.25
Change % 0.9% 6.1% -2.9% -4.2% 9.0% 4.8% 6.6% 1.9%
of which Asia (including China) 2.77 2.88 2.95 3.20 3.50 3.40 3.45 3.75
Change % -3.3% 3.8% 2.5% 8.6% 9.4% -2.9% 1.5% 8.7%
Disruption allowance & market adjustment 0.40 1.00 1.05 1.05 1.10
World refined copper production 17.25 17.92 18.08 17.40 17.95 18.70 19.45 20.20
% change 4.3% 3.9% 0.9% -3.8% 3.2% 4.2% 4.0% 3.9%
of which China 3.00 3.50 3.76 3.80 4.20 4.45 4.80 5.15
% Change 14.4% 16.7% 7.5% 1.1% 10.5% 6.0% 7.9% 7.3%
of which South America 3.63 3.67 3.72 4.00 4.10 4.25 4.30 4.25
% change 0.7% 1.0% 1.5% 7.5% 2.5% 3.7% 1.2% -1.2%
Disruption allowance & market adjustment 0.50 1.10 1.05 1.15 1.15
World refined copper consumption 17.37 18.03 17.72 16.65 17.80 18.85 19.65 20.40
Change (%) 3.2% 3.8% -1.7% -6.0% 7.0% 6.0% 4.2% 3.8%
of which China 4.00 4.66 4.89 5.60 6.05 6.60 7.15 7.70
% change 4.9% 16.5% 5.0% 14.5% 8.0% 9.1% 8.3% 7.7%
of which total Asia 8.75 9.61 9.80 9.95 10.70 11.45 12.15 12.85
% change 3.7% 9.9% 2.0% 1.6% 7.5% 7.0% 6.1% 5.8%
of which Europe 4.99 4.81 4.54 3.70 3.93 4.05 4.10 4.13
% change 8.0% -3.7% -5.6% -18.5% 6.1% 3.2% 1.2% 0.6%
of which North America 2.69 2.65 2.38 2.05 2.15 2.23 2.25 2.25
% change -7.1% -1.6% -10.1% -13.9% 4.9% 3.5% 1.1% 0.0%
Implied market balance -0.12 -0.11 0.36 0.75 0.15 -0.15 -0.20 -0.20
Actual/forecast reported stocks 1.13 1.02 1.15 1.15 1.40 1.30 1.20 1.10
Reported stock change 0.26 -0.11 0.13 0.00 0.25 -0.10 -0.10 -0.10
Stock: consumption ratio (weeks) 3.4 2.9 3.4 3.6 4.1 3.6 3.2 2.8
LME spot price (US$/tonne) 6,729 7,125 6,951 5,075 6,750 7,250 8,250 9,000
LME spot copper price US¢/lb 305 323 315 230 305 330 375 410
Change (%) 83% 6% -2% -27% 33% 7% 14% 9%
Source: CRU, ICSG, RBS estimates and forecasts
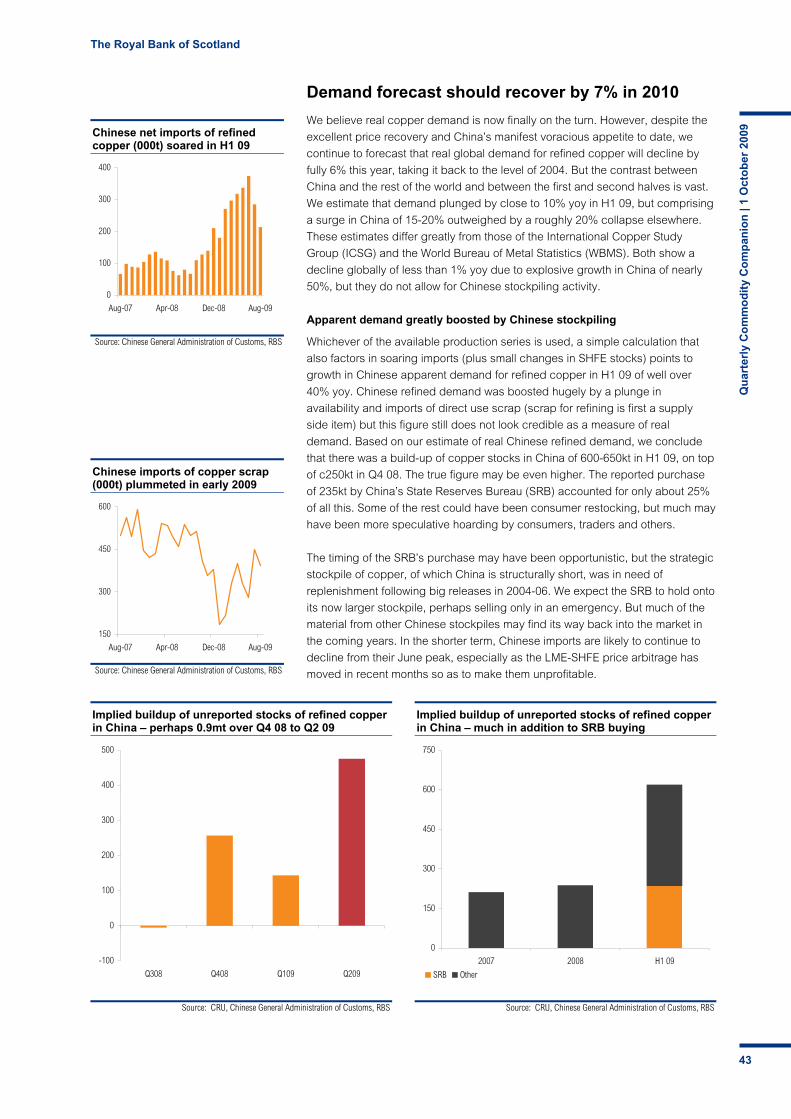
The Royal Bank of Scotland
Qu
arte
rly
Co
mm
od
ity
Co
mp
anio
n |
1 O
cto
ber
200
9
43
Source: Chinese General Administration of Customs, RBS
Chinese net imports of refined copper (000t) soared in H1 09
0
100
200
300
400
Aug-07 Apr-08 Dec-08 Aug-09
Source: Chinese General Administration of Customs, RBS
Chinese imports of copper scrap (000t) plummeted in early 2009
150
300
450
600
Aug-07 Apr-08 Dec-08 Aug-09
Source: CRU, Chinese General Administration of Customs, RBS
Implied buildup of unreported stocks of refined copper in China – perhaps 0.9mt over Q4 08 to Q2 09
-100
0
100
200
300
400
500
Q308 Q408 Q109 Q209
Source: CRU, Chinese General Administration of Customs, RBS
Implied buildup of unreported stocks of refined copper in China – much in addition to SRB buying
0
150
300
450
600
750
2007 2008 H1 09
SRB Other
Demand forecast should recover by 7% in 2010
We believe real copper demand is now finally on the turn. However, despite the
excellent price recovery and China’s manifest voracious appetite to date, we
continue to forecast that real global demand for refined copper will decline by
fully 6% this year, taking it back to the level of 2004. But the contrast between
China and the rest of the world and between the first and second halves is vast.
We estimate that demand plunged by close to 10% yoy in H1 09, but comprising
a surge in China of 15-20% outweighed by a roughly 20% collapse elsewhere.
These estimates differ greatly from those of the International Copper Study
Group (ICSG) and the World Bureau of Metal Statistics (WBMS). Both show a
decline globally of less than 1% yoy due to explosive growth in China of nearly
50%, but they do not allow for Chinese stockpiling activity.
Apparent demand greatly boosted by Chinese stockpiling
Whichever of the available production series is used, a simple calculation that
also factors in soaring imports (plus small changes in SHFE stocks) points to
growth in Chinese apparent demand for refined copper in H1 09 of well over
40% yoy. Chinese refined demand was boosted hugely by a plunge in
availability and imports of direct use scrap (scrap for refining is first a supply
side item) but this figure still does not look credible as a measure of real
demand. Based on our estimate of real Chinese refined demand, we conclude
that there was a build-up of copper stocks in China of 600-650kt in H1 09, on top
of c250kt in Q4 08. The true figure may be even higher. The reported purchase
of 235kt by China’s State Reserves Bureau (SRB) accounted for only about 25%
of all this. Some of the rest could have been consumer restocking, but much may
have been more speculative hoarding by consumers, traders and others.
The timing of the SRB’s purchase may have been opportunistic, but the strategic
stockpile of copper, of which China is structurally short, was in need of
replenishment following big releases in 2004-06. We expect the SRB to hold onto
its now larger stockpile, perhaps selling only in an emergency. But much of the
material from other Chinese stockpiles may find its way back into the market in
the coming years. In the shorter term, Chinese imports are likely to continue to
decline from their June peak, especially as the LME-SHFE price arbitrage has
moved in recent months so as to make them unprofitable.
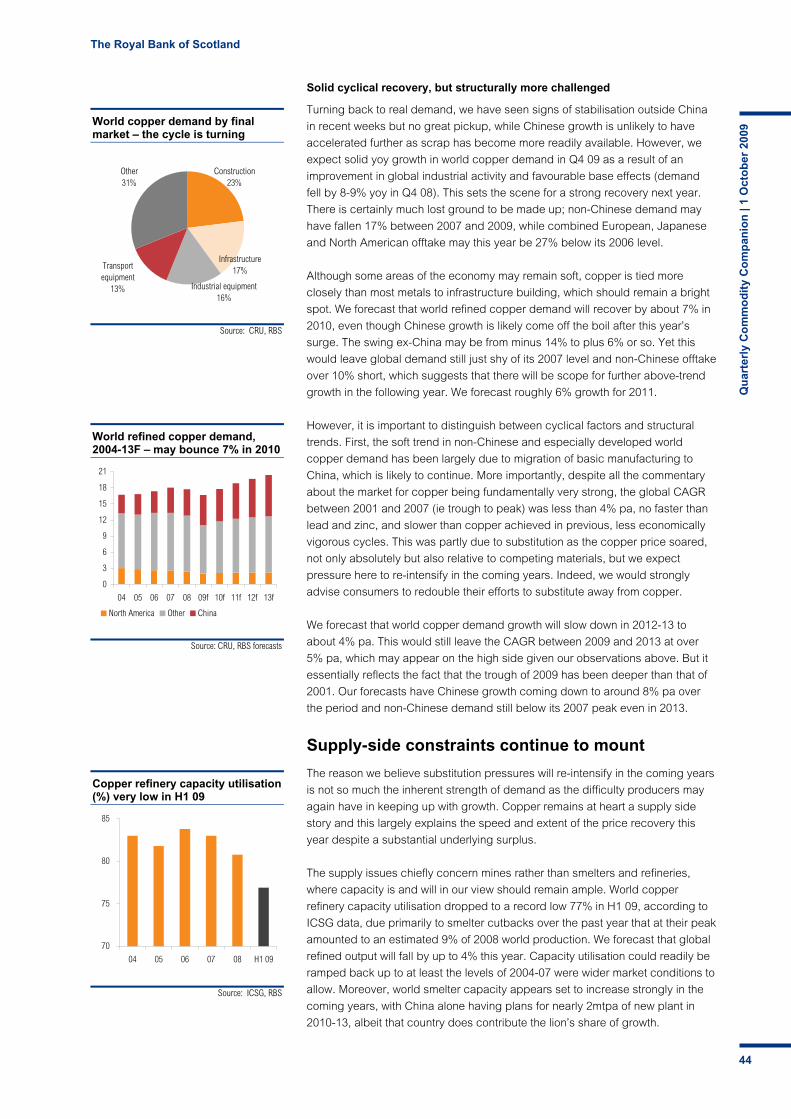
The Royal Bank of Scotland
Qu
arte
rly
Co
mm
od
ity
Co
mp
anio
n |
1 O
cto
ber
200
9
44
Source: CRU, RBS forecasts
World refined copper demand, 2004-13F – may bounce 7% in 2010
0
3
6
9
12
15
18
21
04 05 06 07 08 09f 10f 11f 12f 13f
North America Other China
Source: CRU, RBS
World copper demand by final market – the cycle is turning
Construction23%
Infrastructure17%
Industrial equipment16%
Transportequipment
13%
Other31%
Source: ICSG, RBS
Copper refinery capacity utilisation (%) very low in H1 09
70
75
80
85
04 05 06 07 08 H1 09
Solid cyclical recovery, but structurally more challenged
Turning back to real demand, we have seen signs of stabilisation outside China
in recent weeks but no great pickup, while Chinese growth is unlikely to have
accelerated further as scrap has become more readily available. However, we
expect solid yoy growth in world copper demand in Q4 09 as a result of an
improvement in global industrial activity and favourable base effects (demand
fell by 8-9% yoy in Q4 08). This sets the scene for a strong recovery next year.
There is certainly much lost ground to be made up; non-Chinese demand may
have fallen 17% between 2007 and 2009, while combined European, Japanese
and North American offtake may this year be 27% below its 2006 level.
Although some areas of the economy may remain soft, copper is tied more
closely than most metals to infrastructure building, which should remain a bright
spot. We forecast that world refined copper demand will recover by about 7% in
2010, even though Chinese growth is likely come off the boil after this year’s
surge. The swing ex-China may be from minus 14% to plus 6% or so. Yet this
would leave global demand still just shy of its 2007 level and non-Chinese offtake
over 10% short, which suggests that there will be scope for further above-trend
growth in the following year. We forecast roughly 6% growth for 2011.
However, it is important to distinguish between cyclical factors and structural
trends. First, the soft trend in non-Chinese and especially developed world
copper demand has been largely due to migration of basic manufacturing to
China, which is likely to continue. More importantly, despite all the commentary
about the market for copper being fundamentally very strong, the global CAGR
between 2001 and 2007 (ie trough to peak) was less than 4% pa, no faster than
lead and zinc, and slower than copper achieved in previous, less economically
vigorous cycles. This was partly due to substitution as the copper price soared,
not only absolutely but also relative to competing materials, but we expect
pressure here to re-intensify in the coming years. Indeed, we would strongly
advise consumers to redouble their efforts to substitute away from copper.
We forecast that world copper demand growth will slow down in 2012-13 to
about 4% pa. This would still leave the CAGR between 2009 and 2013 at over
5% pa, which may appear on the high side given our observations above. But it
essentially reflects the fact that the trough of 2009 has been deeper than that of
2001. Our forecasts have Chinese growth coming down to around 8% pa over
the period and non-Chinese demand still below its 2007 peak even in 2013.
Supply-side constraints continue to mount
The reason we believe substitution pressures will re-intensify in the coming years
is not so much the inherent strength of demand as the difficulty producers may
again have in keeping up with growth. Copper remains at heart a supply side
story and this largely explains the speed and extent of the price recovery this
year despite a substantial underlying surplus.
The supply issues chiefly concern mines rather than smelters and refineries,
where capacity is and will in our view should remain ample. World copper
refinery capacity utilisation dropped to a record low 77% in H1 09, according to
ICSG data, due primarily to smelter cutbacks over the past year that at their peak
amounted to an estimated 9% of 2008 world production. We forecast that global
refined output will fall by up to 4% this year. Capacity utilisation could readily be
ramped back up to at least the levels of 2004-07 were wider market conditions to
allow. Moreover, world smelter capacity appears set to increase strongly in the
coming years, with China alone having plans for nearly 2mtpa of new plant in
2010-13, albeit that country does contribute the lion’s share of growth.
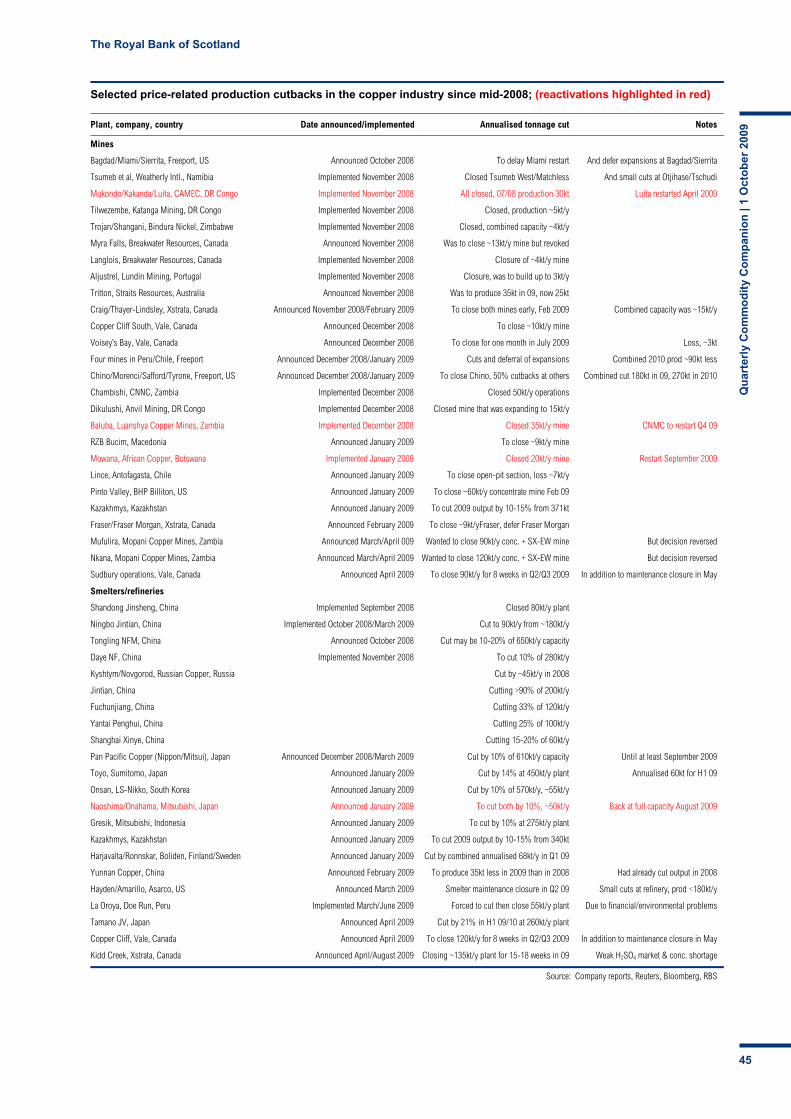
The Royal Bank of Scotland
Qu
arte
rly
Co
mm
od
ity
Co
mp
anio
n |
1 O
cto
ber
200
9
45
Selected price-related production cutbacks in the copper industry since mid-2008; (reactivations highlighted in red)
Plant, company, country Date announced/implemented Annualised tonnage cut Notes
Mines
Bagdad/Miami/Sierrita, Freeport, US Announced October 2008 To delay Miami restart And defer expansions at Bagdad/Sierrita
Tsumeb et al, Weatherly Intl., Namibia Implemented November 2008 Closed Tsumeb West/Matchless And small cuts at Otjihase/Tschudi
Mukondo/Kakanda/Luita, CAMEC, DR Congo Implemented November 2008 All closed, 07/08 production 30kt Luita restarted April 2009
Tilwezembe, Katanga Mining, DR Congo Implemented November 2008 Closed, production ~5kt/y
Trojan/Shangani, Bindura Nickel, Zimbabwe Implemented November 2008 Closed, combined capacity ~4kt/y
Myra Falls, Breakwater Resources, Canada Announced November 2008 Was to close ~13kt/y mine but revoked
Langlois, Breakwater Resources, Canada Implemented November 2008 Closure of ~4kt/y mine
Aljustrel, Lundin Mining, Portugal Implemented November 2008 Closure, was to build up to 3kt/y
Tritton, Straits Resources, Australia Announced November 2008 Was to produce 35kt in 09, now 25kt
Craig/Thayer-Lindsley, Xstrata, Canada Announced November 2008/February 2009 To close both mines early, Feb 2009 Combined capacity was ~15kt/y
Copper Cliff South, Vale, Canada Announced December 2008 To close ~10kt/y mine
Voisey’s Bay, Vale, Canada Announced December 2008 To close for one month in July 2009 Loss, ~3kt
Four mines in Peru/Chile, Freeport Announced December 2008/January 2009 Cuts and deferral of expansions Combined 2010 prod ~90kt less
Chino/Morenci/Safford/Tyrone, Freeport, US Announced December 2008/January 2009 To close Chino, 50% cutbacks at others Combined cut 180kt in 09, 270kt in 2010
Chambishi, CNNC, Zambia Implemented December 2008 Closed 50kt/y operations
Dikulushi, Anvil Mining, DR Congo Implemented December 2008 Closed mine that was expanding to 15kt/y
Baluba, Luanshya Copper Mines, Zambia Implemented December 2008 Closed 35kt/y mine CNMC to restart Q4 09
RZB Bucim, Macedonia Announced January 2009 To close ~9kt/y mine
Mowana, African Copper, Botswana Implemented January 2009 Closed 20kt/y mine Restart September 2009
Lince, Antofagasta, Chile Announced January 2009 To close open-pit section, loss ~7kt/y
Pinto Valley, BHP Billiton, US Announced January 2009 To close ~60kt/y concentrate mine Feb 09
Kazakhmys, Kazakhstan Announced January 2009 To cut 2009 output by 10-15% from 371kt
Fraser/Fraser Morgan, Xstrata, Canada Announced February 2009 To close ~9kt/yFraser, defer Fraser Morgan
Mufulira, Mopani Copper Mines, Zambia Announced March/April 009 Wanted to close 90kt/y conc. + SX-EW mine But decision reversed
Nkana, Mopani Copper Mines, Zambia Announced March/April 2009 Wanted to close 120kt/y conc. + SX-EW mine But decision reversed
Sudbury operations, Vale, Canada Announced April 2009 To close 90kt/y for 8 weeks in Q2/Q3 2009 In addition to maintenance closure in May
Smelters/refineries
Shandong Jinsheng, China Implemented September 2008 Closed 80kt/y plant
Ningbo Jintian, China Implemented October 2008/March 2009 Cut to 90kt/y from ~180kt/y
Tongling NFM, China Announced October 2008 Cut may be 10-20% of 650kt/y capacity
Daye NF, China Implemented November 2008 To cut 10% of 280kt/y
Kyshtym/Novgorod, Russian Copper, Russia Cut by ~45kt/y in 2008
Jintian, China Cutting >90% of 200kt/y
Fuchunjiang, China Cutting 33% of 120kt/y
Yantai Penghui, China Cutting 25% of 100kt/y
Shanghai Xinye, China Cutting 15-20% of 60kt/y
Pan Pacific Copper (Nippon/Mitsui), Japan Announced December 2008/March 2009 Cut by 10% of 610kt/y capacity Until at least September 2009
Toyo, Sumitomo, Japan Announced January 2009 Cut by 14% at 450kt/y plant Annualised 60kt for H1 09
Onsan, LS-Nikko, South Korea Announced January 2009 Cut by 10% of 570kt/y, ~55kt/y
Naoshima/Onahama, Mitsubishi, Japan Announced January 2009 To cut both by 10%, ~50kt/y Back at full capacity August 2009
Gresik, Mitsubishi, Indonesia Announced January 2009 To cut by 10% at 275kt/y plant
Kazakhmys, Kazakhstan Announced January 2009 To cut 2009 output by 10-15% from 340kt
Harjavalta/Ronnskar, Boliden, Finland/Sweden Announced January 2009 Cut by combined annualised 68kt/y in Q1 09
Yunnan Copper, China Announced February 2009 To produce 35kt less in 2009 than in 2008 Had already cut output in 2008
Hayden/Amarillo, Asarco, US Announced March 2009 Smelter maintenance closure in Q2 09 Small cuts at refinery, prod <180kt/y
La Oroya, Doe Run, Peru Implemented March/June 2009 Forced to cut then close 55kt/y plant Due to financial/environmental problems
Tamano JV, Japan Announced April 2009 Cut by 21% in H1 09/10 at 260kt/y plant
Copper Cliff, Vale, Canada Announced April 2009 To close 120kt/y for 8 weeks in Q2/Q3 2009 In addition to maintenance closure in May
Kidd Creek, Xstrata, Canada Announced April/August 2009 Closing ~135kt/y plant for 15-18 weeks in 09 Weak H2SO4 market & conc. shortage
Source: Company reports, Reuters, Bloomberg, RBS

The Royal Bank of Scotland
Qu
arte
rly
Co
mm
od
ity
Co
mp
anio
n |
1 O
cto
ber
200
9
46
Source: ICSG, RBS
Copper mine capacity utilisation has been deteriorating for several years – so much so that it is very likely that the ICSG overstates effective capacity
65
75
85
95
96 97 98 99 00 01 02 03 04 05 06 07 08 H1 09
Mine capacity utilisation, % Average utilisation 1996-2008, %
Source: RBS
Mine cutbacks as % of 2008 world output – little action in copper
0% 5% 10% 15% 20% 25%
Nickel
Copper
A substantial portion of the decline in refined copper production this year has
come from a decrease in the processing of secondary material; the ICSG
estimates a drop in world secondary refined output in H1 09 of 7% yoy. This is
partly due to the cutbacks, but in addition, less scrap feed has been available.
Availability should improve as economic activity picks up and we expect a
secular uptrend as industrialisation broadens and deepens among developing
nations. So we come back to whether there will be sufficient mined copper.
Potential growth in copper mine production can be put into three broad
categories: 1) reactivation of capacity closed in late 2008 and 2009 in response
to poor market conditions; 2) possible improvement in operating performance;
and 3) net capacity growth.
Few copper mine cutbacks, so few restarts
We estimate that about 0.5mtpa of copper mine capacity closed in response to
the collapse in demand and price of H2 08, representing little more than 3% of
world mine production in 2008, far less than in other base metal industries.
This is not surprising to us because copper was the last metal to succumb to the
recession and even when it hit bottom in December 2008, the bulk of the mining
industry was cash positive. Yet little of the closed copper capacity has so far
restarted. The appreciation of key producer currencies has put upward pressure
on costs, a portion of the capacity is dependent on other metals and some
producers may still be wary of the economic outlook. Nevertheless, we expect
most of the shut mine capacity to reopen over the next 12 months. But the plain
fact is that in contrast to other metals, there is simply not that much to be
restarted.
We forecast that world mine production will decline by only about 2% this year,
assuming there are no major supply disruptions in the final months, in particular
strikes in Chile. But by the same token, restarts alone will only boost it by 3%
annualised over 2010-11, a period in which demand is expected to rebound by
much more. The restarts on their own will barely do more than take capacity
utilisation back up to the very low level of last year, as estimated by the ICSG.
Mine capacity utilisation shows few signs of improving
Even before the recent cutbacks had a material impact, between 2002 and 2008
world copper mine production rose by only about 15%, or less than 2.5% pa,
despite the copper price more than quadrupling over the period. This must ring
alarm bells for the supply outlook.
ICSG data suggests the slow pace of growth was due not so much to sluggish
capacity growth over the period, which it puts at a reasonably healthy 3.5% pa or

The Royal Bank of Scotland
Qu
arte
rly
Co
mm
od
ity
Co
mp
anio
n |
1 O
cto
ber
200
9
47
Source: CRU, RBS
Weighted average global copper head grade (%) has declined sharply in recent years
0.75
0.80
0.85
0.90
96 97 98 99 00 01 02 03 04 05 06 07 08
Source: CRU, RBS
Weighted average copper head grade in Chile, %
0.8
1.0
1.2
1.4
1.6
96 98 00 02 04 06 08
so, as to a sharp decline in capacity utilisation. The ICSG’s latest estimate is that
world copper mine capacity utilisation in H1 09 was 2 percentage points down
from the average last year. This looks plausible given the cutbacks, but harder to
explain is the heavy fall since at least 2004 to less than 80%. It might appear to
point to much potential for improvement, but so remorseless has the decline
been that we think it likely that the ICSG has increasingly overstated effective
(as opposed to theoretical nameplate) global capacity.
One factor holding back copper production growth in recent years and probably
contributing to the overstatement of capacity has been the tendency of new
mines and expansions to start up late and take longer than planned to reach full
output. This has been due to a range of constraints including shortages of
manpower, materials and equipment. More significant is that many existing
mines have struggled to maintain production levels in the face of the same and
other constraints such as shortages of replacement trucks and tyres, energy and
water. Copper mines have been particularly exposed to such constraints. The
copper industry has also been hit harder than most by equipment breakdowns,
accidents and strikes. Perhaps most significant of all has been a decline in ore
grades. The giant Escondida mine is an albeit extreme example of such
problems, with copper-in-concentrate production in H1 09 down fully 40% yoy.
Some of the constraints of recent years were in part creatures of the commodity
and wider economic boom, so are likely to have eased as recession has
reduced strains on infrastructure generally and on energy and water supplies in
particular. However, cuts in investment mean that such problems may well
re-intensify in the medium term, while they are chronic in certain key copper
regions, notably Chile (water) and Zambia (electricity). Likewise, faults and
accidents caused by plants being pushed hard in the boom times may now be
replaced by problems resulting from cuts in maintenance expenditure and the
paring of inventories of replacement equipment. Neither do we see any reason to
believe natural hazards such as earthquakes will diminish.
Research by CRU shows that after a decade of trending up, the weighted
average global head grade at copper mines declined by 15% between 2002 and
2008. Geographically, this was driven mainly by developments in Chile, where
grades have been falling sharply ever since the mid-1990s. Globally, it has been
due both to lower tallies at new capacity and declines at existing mines, where
producers have struggled to compensate by boosting ore throughput. The
coincidence between the aggregate trend and the decline in ICSG mine
capacity utilisation is striking, even if it can provide only a very partial
explanation of the latter. Although new projects in the African Copperbelt could
slightly raise the world average grade in the short term, we expect the downward
trend to resume in the medium term and probably longer term, too.
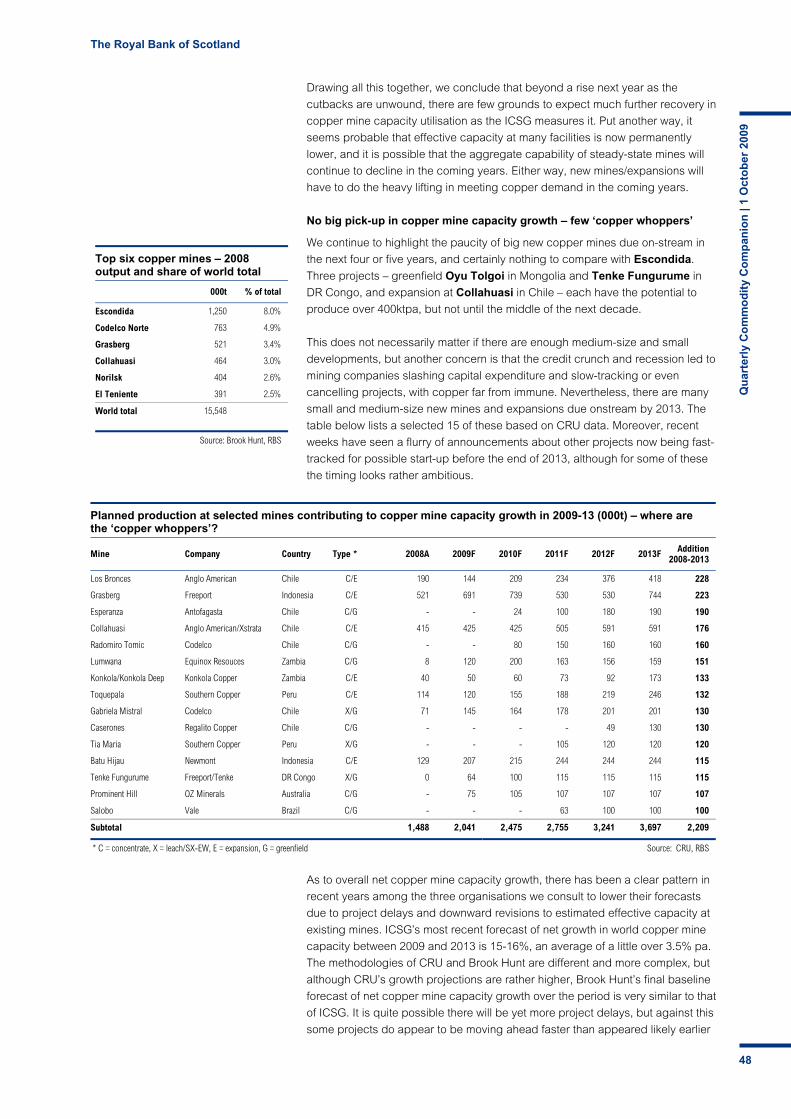
The Royal Bank of Scotland
Qu
arte
rly
Co
mm
od
ity
Co
mp
anio
n |
1 O
cto
ber
200
9
48
Drawing all this together, we conclude that beyond a rise next year as the
cutbacks are unwound, there are few grounds to expect much further recovery in
copper mine capacity utilisation as the ICSG measures it. Put another way, it
seems probable that effective capacity at many facilities is now permanently
lower, and it is possible that the aggregate capability of steady-state mines will
continue to decline in the coming years. Either way, new mines/expansions will
have to do the heavy lifting in meeting copper demand in the coming years.
No big pick-up in copper mine capacity growth – few ‘copper whoppers’
We continue to highlight the paucity of big new copper mines due on-stream in
the next four or five years, and certainly nothing to compare with Escondida.
Three projects – greenfield Oyu Tolgoi in Mongolia and Tenke Fungurume in
DR Congo, and expansion at Collahuasi in Chile – each have the potential to
produce over 400ktpa, but not until the middle of the next decade.
This does not necessarily matter if there are enough medium-size and small
developments, but another concern is that the credit crunch and recession led to
mining companies slashing capital expenditure and slow-tracking or even
cancelling projects, with copper far from immune. Nevertheless, there are many
small and medium-size new mines and expansions due onstream by 2013. The
table below lists a selected 15 of these based on CRU data. Moreover, recent
weeks have seen a flurry of announcements about other projects now being fast-
tracked for possible start-up before the end of 2013, although for some of these
the timing looks rather ambitious.
As to overall net copper mine capacity growth, there has been a clear pattern in
recent years among the three organisations we consult to lower their forecasts
due to project delays and downward revisions to estimated effective capacity at
existing mines. ICSG’s most recent forecast of net growth in world copper mine
capacity between 2009 and 2013 is 15-16%, an average of a little over 3.5% pa.
The methodologies of CRU and Brook Hunt are different and more complex, but
although CRU’s growth projections are rather higher, Brook Hunt’s final baseline
forecast of net copper mine capacity growth over the period is very similar to that
of ICSG. It is quite possible there will be yet more project delays, but against this
some projects do appear to be moving ahead faster than appeared likely earlier
Top six copper mines – 2008 output and share of world total
000t % of total
Escondida 1,250 8.0%
Codelco Norte 763 4.9%
Grasberg 521 3.4%
Collahuasi 464 3.0%
Norilsk 404 2.6%
El Teniente 391 2.5%
World total 15,548
Source: Brook Hunt, RBS
Planned production at selected mines contributing to copper mine capacity growth in 2009-13 (000t) – where are the ‘copper whoppers’?
Mine Company Country Type * 2008A 2009F 2010F 2011F 2012F 2013F Addition 2008-2013
Los Bronces Anglo American Chile C/E 190 144 209 234 376 418 228
Grasberg Freeport Indonesia C/E 521 691 739 530 530 744 223
Esperanza Antofagasta Chile C/G - - 24 100 180 190 190
Collahuasi Anglo American/Xstrata Chile C/E 415 425 425 505 591 591 176
Radomiro Tomic Codelco Chile C/G - - 80 150 160 160 160
Lumwana Equinox Resouces Zambia C/G 8 120 200 163 156 159 151
Konkola/Konkola Deep Konkola Copper Zambia C/E 40 50 60 73 92 173 133
Toquepala Southern Copper Peru C/E 114 120 155 188 219 246 132
Gabriela Mistral Codelco Chile X/G 71 145 164 178 201 201 130
Caserones Regalito Copper Chile C/G - - - - 49 130 130
Tia Maria Southern Copper Peru X/G - - - 105 120 120 120
Batu Hijau Newmont Indonesia C/E 129 207 215 244 244 244 115
Tenke Fungurume Freeport/Tenke DR Congo X/G 0 64 100 115 115 115 115
Prominent Hill OZ Minerals Australia C/G - 75 105 107 107 107 107
Salobo Vale Brazil C/G - - - 63 100 100 100
Subtotal 1,488 2,041 2,475 2,755 3,241 3,697 2,209
* C = concentrate, X = leach/SX-EW, E = expansion, G = greenfield Source: CRU, RBS
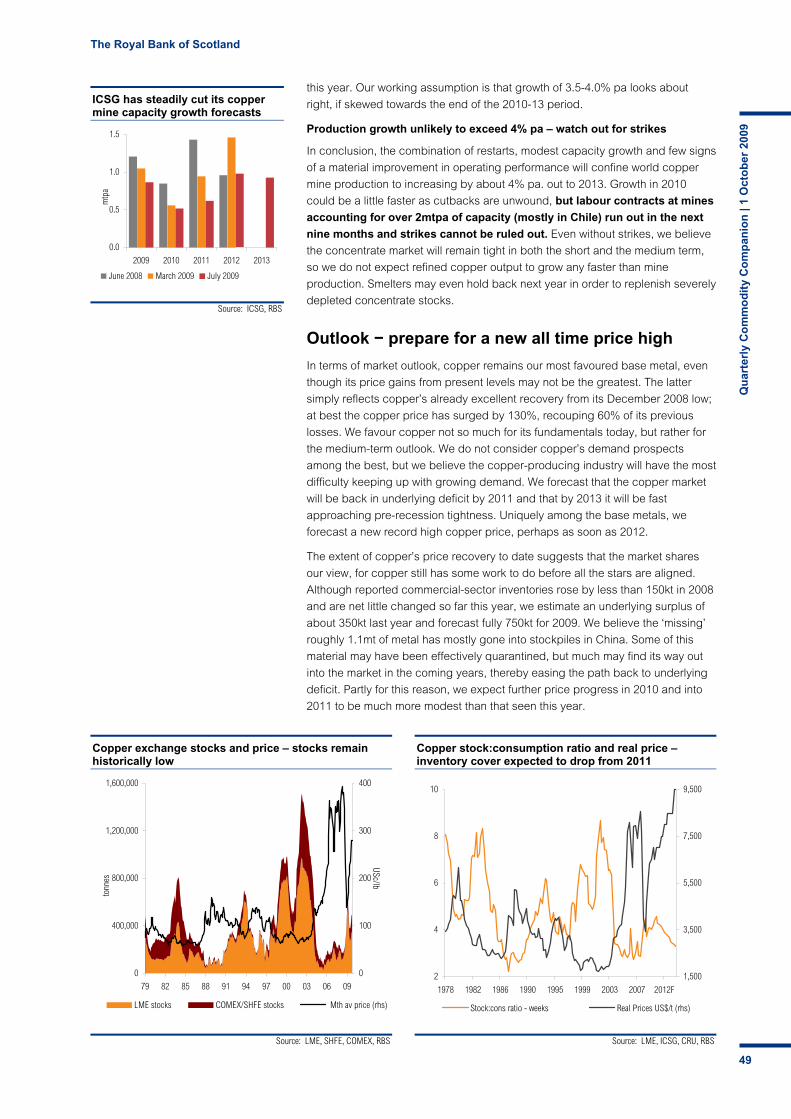
The Royal Bank of Scotland
Qu
arte
rly
Co
mm
od
ity
Co
mp
anio
n |
1 O
cto
ber
200
9
49
Source: ICSG, RBS
ICSG has steadily cut its copper mine capacity growth forecasts
0.0
0.5
1.0
1.5
2009 2010 2011 2012 2013
mtp
a
June 2008 March 2009 July 2009
Source: LME, SHFE, COMEX, RBS
Copper exchange stocks and price – stocks remain historically low
0
400,000
800,000
1,200,000
1,600,000
79 82 85 88 91 94 97 00 03 06 09
tonn
es
0
100
200
300
400
USc/lb
LME stocks COMEX/SHFE stocks Mth av price (rhs)
Source: LME, ICSG, CRU, RBS
Copper stock:consumption ratio and real price – inventory cover expected to drop from 2011
2
4
6
8
10
1978 1982 1986 1990 1995 1999 2003 2007 2012F
1,500
3,500
5,500
7,500
9,500
Stock:cons ratio - weeks Real Prices US$/t (rhs)
this year. Our working assumption is that growth of 3.5-4.0% pa looks about
right, if skewed towards the end of the 2010-13 period.
Production growth unlikely to exceed 4% pa – watch out for strikes
In conclusion, the combination of restarts, modest capacity growth and few signs
of a material improvement in operating performance will confine world copper
mine production to increasing by about 4% pa. out to 2013. Growth in 2010
could be a little faster as cutbacks are unwound, but labour contracts at mines
accounting for over 2mtpa of capacity (mostly in Chile) run out in the next
nine months and strikes cannot be ruled out. Even without strikes, we believe
the concentrate market will remain tight in both the short and the medium term,
so we do not expect refined copper output to grow any faster than mine
production. Smelters may even hold back next year in order to replenish severely
depleted concentrate stocks.
Outlook − prepare for a new all time price high
In terms of market outlook, copper remains our most favoured base metal, even
though its price gains from present levels may not be the greatest. The latter
simply reflects copper’s already excellent recovery from its December 2008 low;
at best the copper price has surged by 130%, recouping 60% of its previous
losses. We favour copper not so much for its fundamentals today, but rather for
the medium-term outlook. We do not consider copper’s demand prospects
among the best, but we believe the copper-producing industry will have the most
difficulty keeping up with growing demand. We forecast that the copper market
will be back in underlying deficit by 2011 and that by 2013 it will be fast
approaching pre-recession tightness. Uniquely among the base metals, we
forecast a new record high copper price, perhaps as soon as 2012.
The extent of copper’s price recovery to date suggests that the market shares
our view, for copper still has some work to do before all the stars are aligned.
Although reported commercial-sector inventories rose by less than 150kt in 2008
and are net little changed so far this year, we estimate an underlying surplus of
about 350kt last year and forecast fully 750kt for 2009. We believe the ‘missing’
roughly 1.1mt of metal has mostly gone into stockpiles in China. Some of this
material may have been effectively quarantined, but much may find its way out
into the market in the coming years, thereby easing the path back to underlying
deficit. Partly for this reason, we expect further price progress in 2010 and into
2011 to be much more modest than that seen this year.

The Royal Bank of Scotland
Qu
arte
rly
Co
mm
od
ity
Co
mp
anio
n |
1 O
cto
ber
200
9
50
Source: CRU, LME and RBS forecasts
World copper supply/demand surplus and deficits, 2003-13F; back to underlying deficit from 2011, price forecast to hit new record highs
(900)
(600)
(300)
0
300
600
900
2003 2004 2005 2006 2007 2008 2009F 2010F 2011F 2012F 2013F
1500
2750
4000
5250
6500
7750
9000
Copper market balance 000t (lhs) Spot copper price US$/t (rhs)
Nevertheless, we forecast that the average LME cash copper price will leap by
over 30% next year and that in 2011 it will reach or slightly exceed the record
level of 2007. Thereafter, we expect the price to escalate further forcing
substitution and demand destruction, and market conditions may be such as to
persuade China’s State Reserves Bureau to release some material from its
strategic stockpile. We forecast a mean copper price in 2013 of $9,000/t, above
even the fleeting peak of mid-2008. Fireworks indeed.
Our new price forecasts for 2010-12 represent upward revisions of 20-25%.
Whilst we see clear downside risks on the economic front, so bullish are the
supply side fundamentals that the biggest risk to our projections may be of price
escalation being brought forward.
We have also raised our forecast of the long-term average copper price, by
nearly 30% to $4,950/t (US$2.25/lb). This is partly on currency considerations,
not only the recent weakening of the US dollar but also the strengthening of key
producer currencies. Given too the serious market tightness expected in 2012-
13 and potentially beyond, it seems likely that a higher price will be needed to
entice onstream enough new mines to balance the copper market over the
longer term.
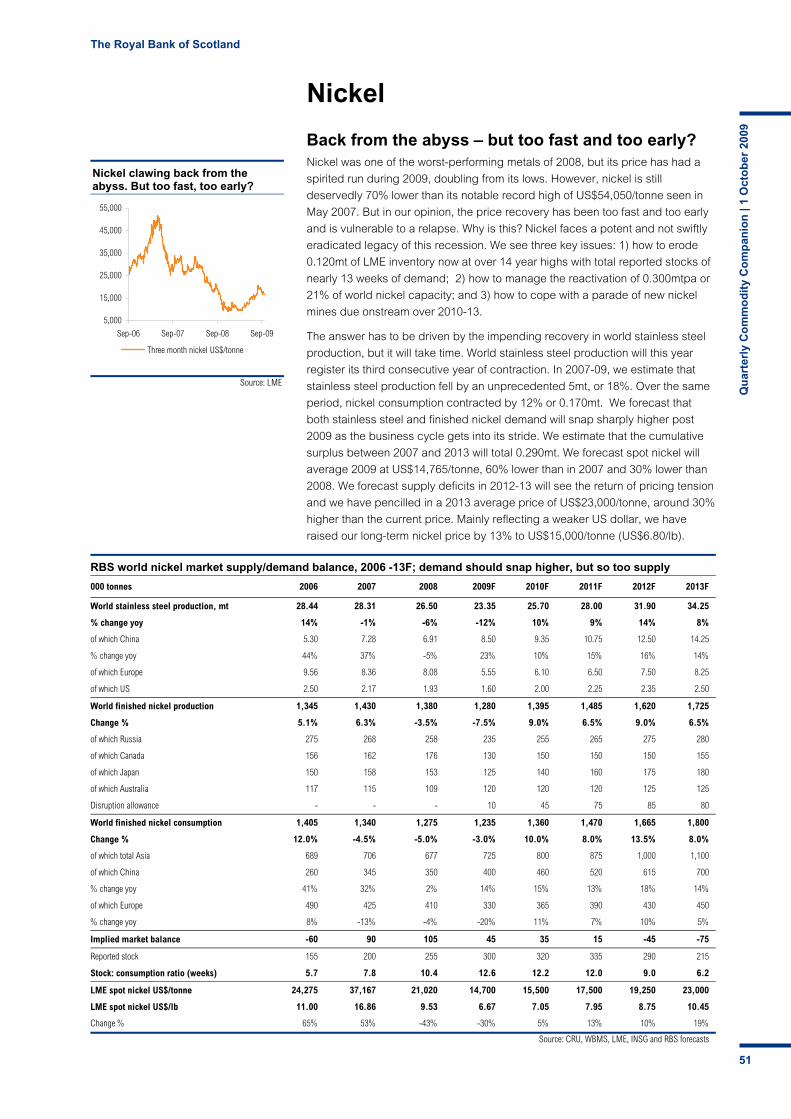
The Royal Bank of Scotland
Qu
arte
rly
Co
mm
od
ity
Co
mp
anio
n |
1 O
cto
ber
200
9
51
Source: LME
Nickel clawing back from the abyss. But too fast, too early?
5,000
15,000
25,000
35,000
45,000
55,000
Sep-06 Sep-07 Sep-08 Sep-09
Three month nickel US$/tonne
Nickel
Back from the abyss – but too fast and too early? Nickel was one of the worst-performing metals of 2008, but its price has had a
spirited run during 2009, doubling from its lows. However, nickel is still
deservedly 70% lower than its notable record high of US$54,050/tonne seen in
May 2007. But in our opinion, the price recovery has been too fast and too early
and is vulnerable to a relapse. Why is this? Nickel faces a potent and not swiftly
eradicated legacy of this recession. We see three key issues: 1) how to erode
0.120mt of LME inventory now at over 14 year highs with total reported stocks of
nearly 13 weeks of demand; 2) how to manage the reactivation of 0.300mtpa or
21% of world nickel capacity; and 3) how to cope with a parade of new nickel
mines due onstream over 2010-13.
The answer has to be driven by the impending recovery in world stainless steel
production, but it will take time. World stainless steel production will this year
register its third consecutive year of contraction. In 2007-09, we estimate that
stainless steel production fell by an unprecedented 5mt, or 18%. Over the same
period, nickel consumption contracted by 12% or 0.170mt. We forecast that
both stainless steel and finished nickel demand will snap sharply higher post
2009 as the business cycle gets into its stride. We estimate that the cumulative
surplus between 2007 and 2013 will total 0.290mt. We forecast spot nickel will
average 2009 at US$14,765/tonne, 60% lower than in 2007 and 30% lower than
2008. We forecast supply deficits in 2012-13 will see the return of pricing tension
and we have pencilled in a 2013 average price of US$23,000/tonne, around 30%
higher than the current price. Mainly reflecting a weaker US dollar, we have
raised our long-term nickel price by 13% to US$15,000/tonne (US$6.80/lb).
RBS world nickel market supply/demand balance, 2006 -13F; demand should snap higher, but so too supply
000 tonnes 2006 2007 2008 2009F 2010F 2011F 2012F 2013F
World stainless steel production, mt 28.44 28.31 26.50 23.35 25.70 28.00 31.90 34.25
% change yoy 14% -1% -6% -12% 10% 9% 14% 8%
of which China 5.30 7.28 6.91 8.50 9.35 10.75 12.50 14.25
% change yoy 44% 37% -5% 23% 10% 15% 16% 14%
of which Europe 9.56 8.36 8.08 5.55 6.10 6.50 7.50 8.25
of which US 2.50 2.17 1.93 1.60 2.00 2.25 2.35 2.50
World finished nickel production 1,345 1,430 1,380 1,280 1,395 1,485 1,620 1,725
Change % 5.1% 6.3% -3.5% -7.5% 9.0% 6.5% 9.0% 6.5%
of which Russia 275 268 258 235 255 265 275 280
of which Canada 156 162 176 130 150 150 150 155
of which Japan 150 158 153 125 140 160 175 180
of which Australia 117 115 109 120 120 120 125 125
Disruption allowance - - - 10 45 75 85 80
World finished nickel consumption 1,405 1,340 1,275 1,235 1,360 1,470 1,665 1,800
Change % 12.0% -4.5% -5.0% -3.0% 10.0% 8.0% 13.5% 8.0%
of which total Asia 689 706 677 725 800 875 1,000 1,100
of which China 260 345 350 400 460 520 615 700
% change yoy 41% 32% 2% 14% 15% 13% 18% 14%
of which Europe 490 425 410 330 365 390 430 450
% change yoy 8% -13% -4% -20% 11% 7% 10% 5%
Implied market balance -60 90 105 45 35 15 -45 -75
Reported stock 155 200 255 300 320 335 290 215
Stock: consumption ratio (weeks) 5.7 7.8 10.4 12.6 12.2 12.0 9.0 6.2
LME spot nickel US$/tonne 24,275 37,167 21,020 14,700 15,500 17,500 19,250 23,000
LME spot nickel US$/lb 11.00 16.86 9.53 6.67 7.05 7.95 8.75 10.45
Change % 65% 53% -43% -30% 5% 13% 10% 19%
Source: CRU, WBMS, LME, INSG and RBS forecasts

The Royal Bank of Scotland
Qu
arte
rly
Co
mm
od
ity
Co
mp
anio
n |
1 O
cto
ber
200
9
52
Source: CRU and RBS forecasts
Swings in annual world stainless steel growth, 2003-13F (%)
-15%
-10%
-5%
0%
5%
10%
15%
03 04 05 06 07 08 09F 10F 11F 12F 13F
Source: CRU and RBS forecasts
Chinese stainless steel production declined 5% in 2008, but already snapping back and set to rise over 20% in 2009.
0.80 0.911.90
2.47
3.69
5.30
7.28 6.91
8.509.35
10.75
12.50
14.25
0.00
2.00
4.00
6.00
8.00
10.00
12.00
14.00
16.00
01 02 03 04 05 06 07 08 09F 10F 11F 12F 13F
Stai
nles
s st
eel o
utpu
t Mt
World recession and sharply lower domestic production due to cutbacks has crimped Chinese stainless output growth which in 2007 rose by 37%. 2008 saw its first annual decline of 5% - set to rebound strongly
Demand – stainless steel output is recovering
Austenitic stainless steel (has a nickel content of at least 7%) is nickel’s dominant
end-use demand sector, accounting for about 60% of world refined nickel
consumption. Non-stainless steel applications include nickel super-alloys in
aerospace, castings and in batteries. Historically, world stainless steel
production has grown at a trend rate of about 5% pa, well above the other
metals. Growth rates yoy, however, exhibit wide swings, reflecting stocking and
destocking cycles as well as periods of capacity additions and cutbacks. We
forecast world stainless steel production in 2009 will fall 12% yoy to 23.35mt,
taking output to a six-year low. The past three years of contracting stainless steel
output have seen an 18% slump and wiped out over 5mt off world output.
However, although there is as yet no major improvement in underlying demand,
we now see signs that the worst is behind the stainless market. Destocking by
distributors appears to be over and European and North American stainless
producers are beginning to express optimism in forward order books and
production rates. Price rises have helped. For example, European stainless steel
prices have risen 50% from their February 2009 low of €820-900/tonne to €1,230-
1,280/tonne. Major European stainless producer Outokumpu, which operated at
50-60% capacity utilisation in H1 09, has announced that due to increased order
intake, it will be increasing production capability at its key Tornio plant in Finland.
In the US, Allegheny Ludlum in July announced its sixth price rise of the year for
stainless cold rolled and hot rolled sheet and strip. Alloy surcharges have also
risen, reflecting the rise in price of alloying metals such as nickel, ferrochrome,
molybdenum and steel scrap.
But Chinese stainless output is leading the way, with several producers, such as
Baosteel, now operating at high production rates. We estimate that Chinese
stainless output will rise 23% in 2009 to a record 8.50mt. We expect CAGR
growth from the world’s biggest stainless steel producer of 14% pa through to
2013, when we forecast Chinese output will have added 5.75mt to 14.25mt.
Other key producers should not be far behind and given stainless steel’s
leverage to world growth plus the base effect of three years of contraction, we
forecast a handsome 10% rise in 2010 in world stainless steel output to 25.70mt.
Between 2009 and 2013F, we have pencilled in an additional 10.90mt of output
with a CAGR of 10% pa.
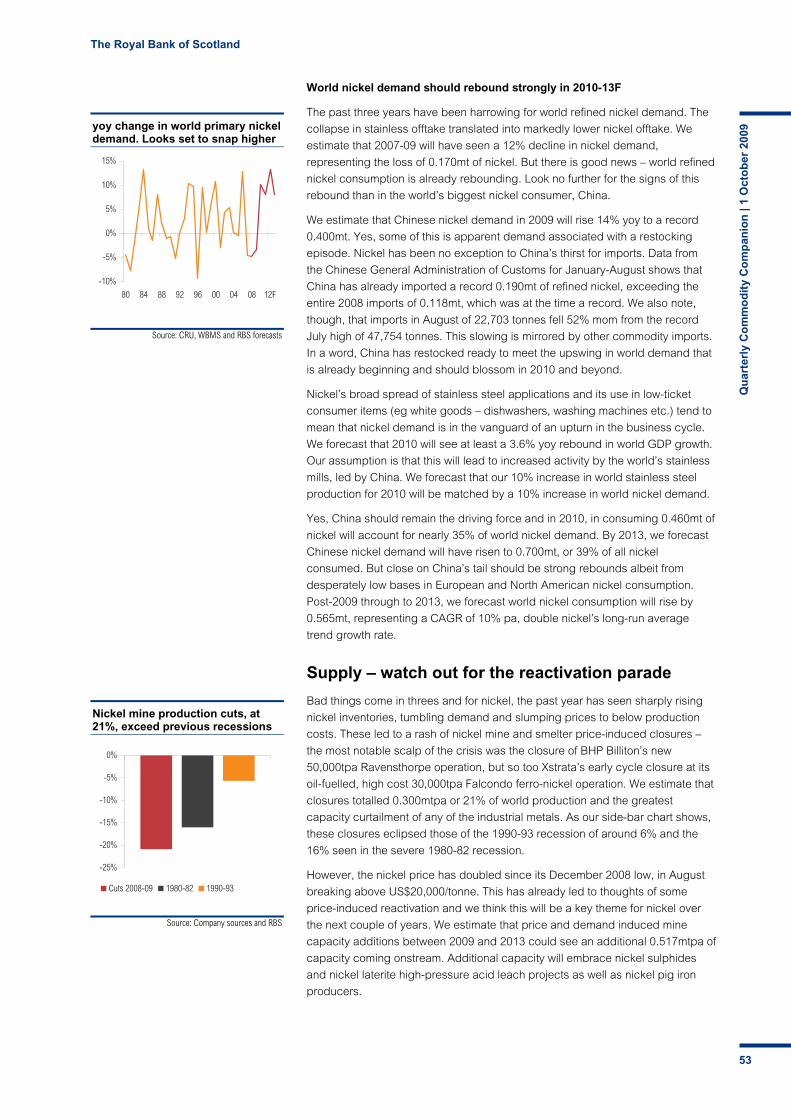
The Royal Bank of Scotland
Qu
arte
rly
Co
mm
od
ity
Co
mp
anio
n |
1 O
cto
ber
200
9
53
Source: Company sources and RBS
Nickel mine production cuts, at 21%, exceed previous recessions
-25%
-20%
-15%
-10%
-5%
0%
Cuts 2008-09 1980-82 1990-93
Source: CRU, WBMS and RBS forecasts
yoy change in world primary nickel demand. Looks set to snap higher
-10%
-5%
0%
5%
10%
15%
80 84 88 92 96 00 04 08 12F
World nickel demand should rebound strongly in 2010-13F
The past three years have been harrowing for world refined nickel demand. The
collapse in stainless offtake translated into markedly lower nickel offtake. We
estimate that 2007-09 will have seen a 12% decline in nickel demand,
representing the loss of 0.170mt of nickel. But there is good news – world refined
nickel consumption is already rebounding. Look no further for the signs of this
rebound than in the world’s biggest nickel consumer, China.
We estimate that Chinese nickel demand in 2009 will rise 14% yoy to a record
0.400mt. Yes, some of this is apparent demand associated with a restocking
episode. Nickel has been no exception to China’s thirst for imports. Data from
the Chinese General Administration of Customs for January-August shows that
China has already imported a record 0.190mt of refined nickel, exceeding the
entire 2008 imports of 0.118mt, which was at the time a record. We also note,
though, that imports in August of 22,703 tonnes fell 52% mom from the record
July high of 47,754 tonnes. This slowing is mirrored by other commodity imports.
In a word, China has restocked ready to meet the upswing in world demand that
is already beginning and should blossom in 2010 and beyond.
Nickel’s broad spread of stainless steel applications and its use in low-ticket
consumer items (eg white goods – dishwashers, washing machines etc.) tend to
mean that nickel demand is in the vanguard of an upturn in the business cycle.
We forecast that 2010 will see at least a 3.6% yoy rebound in world GDP growth.
Our assumption is that this will lead to increased activity by the world’s stainless
mills, led by China. We forecast that our 10% increase in world stainless steel
production for 2010 will be matched by a 10% increase in world nickel demand.
Yes, China should remain the driving force and in 2010, in consuming 0.460mt of
nickel will account for nearly 35% of world nickel demand. By 2013, we forecast
Chinese nickel demand will have risen to 0.700mt, or 39% of all nickel
consumed. But close on China’s tail should be strong rebounds albeit from
desperately low bases in European and North American nickel consumption.
Post-2009 through to 2013, we forecast world nickel consumption will rise by
0.565mt, representing a CAGR of 10% pa, double nickel’s long-run average
trend growth rate.
Supply – watch out for the reactivation parade
Bad things come in threes and for nickel, the past year has seen sharply rising
nickel inventories, tumbling demand and slumping prices to below production
costs. These led to a rash of nickel mine and smelter price-induced closures –
the most notable scalp of the crisis was the closure of BHP Billiton’s new
50,000tpa Ravensthorpe operation, but so too Xstrata’s early cycle closure at its
oil-fuelled, high cost 30,000tpa Falcondo ferro-nickel operation. We estimate that
closures totalled 0.300mtpa or 21% of world production and the greatest
capacity curtailment of any of the industrial metals. As our side-bar chart shows,
these closures eclipsed those of the 1990-93 recession of around 6% and the
16% seen in the severe 1980-82 recession.
However, the nickel price has doubled since its December 2008 low, in August
breaking above US$20,000/tonne. This has already led to thoughts of some
price-induced reactivation and we think this will be a key theme for nickel over
the next couple of years. We estimate that price and demand induced mine
capacity additions between 2009 and 2013 could see an additional 0.517mtpa of
capacity coming onstream. Additional capacity will embrace nickel sulphides
and nickel laterite high-pressure acid leach projects as well as nickel pig iron
producers.
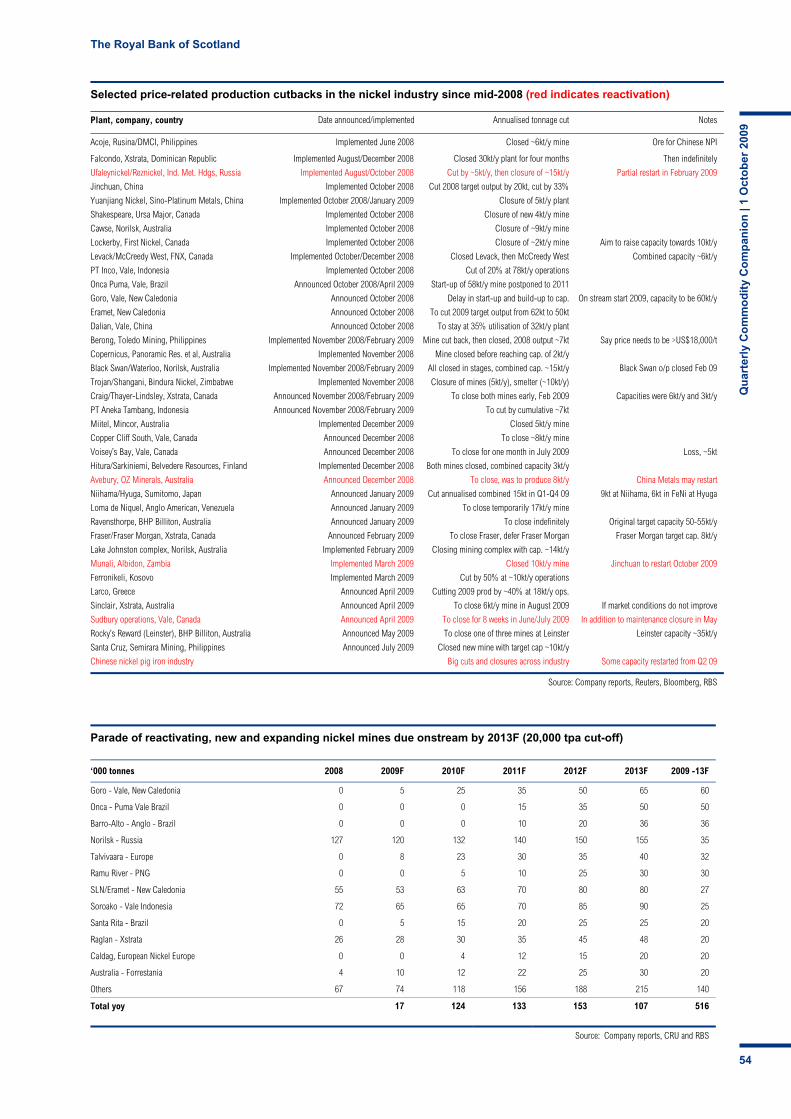
The Royal Bank of Scotland
Qu
arte
rly
Co
mm
od
ity
Co
mp
anio
n |
1 O
cto
ber
200
9
54
Selected price-related production cutbacks in the nickel industry since mid-2008 (red indicates reactivation)
Plant, company, country Date announced/implemented Annualised tonnage cut Notes
Acoje, Rusina/DMCI, Philippines Implemented June 2008 Closed ~6kt/y mine Ore for Chinese NPI
Falcondo, Xstrata, Dominican Republic Implemented August/December 2008 Closed 30kt/y plant for four months Then indefinitely
Ufaleynickel/Reznickel, Ind. Met. Hdgs, Russia Implemented August/October 2008 Cut by ~5kt/y, then closure of ~15kt/y Partial restart in February 2009
Jinchuan, China Implemented October 2008 Cut 2008 target output by 20kt, cut by 33%
Yuanjiang Nickel, Sino-Platinum Metals, China Implemented October 2008/January 2009 Closure of 5kt/y plant
Shakespeare, Ursa Major, Canada Implemented October 2008 Closure of new 4kt/y mine
Cawse, Norilsk, Australia Implemented October 2008 Closure of ~9kt/y mine
Lockerby, First Nickel, Canada Implemented October 2008 Closure of ~2kt/y mine Aim to raise capacity towards 10kt/y
Levack/McCreedy West, FNX, Canada Implemented October/December 2008 Closed Levack, then McCreedy West Combined capacity ~6kt/y
PT Inco, Vale, Indonesia Implemented October 2008 Cut of 20% at 78kt/y operations
Onca Puma, Vale, Brazil Announced October 2008/April 2009 Start-up of 58kt/y mine postponed to 2011
Goro, Vale, New Caledonia Announced October 2008 Delay in start-up and build-up to cap. On stream start 2009, capacity to be 60kt/y
Eramet, New Caledonia Announced October 2008 To cut 2009 target output from 62kt to 50kt
Dalian, Vale, China Announced October 2008 To stay at 35% utilisation of 32kt/y plant
Berong, Toledo Mining, Philippines Implemented November 2008/February 2009 Mine cut back, then closed, 2008 output ~7kt Say price needs to be >US$18,000/t
Copernicus, Panoramic Res. et al, Australia Implemented November 2008 Mine closed before reaching cap. of 2kt/y
Black Swan/Waterloo, Norilsk, Australia Implemented November 2008/February 2009 All closed in stages, combined cap. ~15kt/y Black Swan o/p closed Feb 09
Trojan/Shangani, Bindura Nickel, Zimbabwe Implemented November 2008 Closure of mines (5kt/y), smelter (~10kt/y)
Craig/Thayer-Lindsley, Xstrata, Canada Announced November 2008/February 2009 To close both mines early, Feb 2009 Capacities were 6kt/y and 3kt/y
PT Aneka Tambang, Indonesia Announced November 2008/February 2009 To cut by cumulative ~7kt
Miitel, Mincor, Australia Implemented December 2009 Closed 5kt/y mine
Copper Cliff South, Vale, Canada Announced December 2008 To close ~8kt/y mine
Voisey’s Bay, Vale, Canada Announced December 2008 To close for one month in July 2009 Loss, ~5kt
Hitura/Sarkiniemi, Belvedere Resources, Finland Implemented December 2008 Both mines closed, combined capacity 3kt/y
Avebury, OZ Minerals, Australia Announced December 2008 To close, was to produce 8kt/y China Metals may restart
Niihama/Hyuga, Sumitomo, Japan Announced January 2009 Cut annualised combined 15kt in Q1-Q4 09 9kt at Niihama, 6kt in FeNi at Hyuga
Loma de Niquel, Anglo American, Venezuela Announced January 2009 To close temporarily 17kt/y mine
Ravensthorpe, BHP Billiton, Australia Announced January 2009 To close indefinitely Original target capacity 50-55kt/y
Fraser/Fraser Morgan, Xstrata, Canada Announced February 2009 To close Fraser, defer Fraser Morgan Fraser Morgan target cap. 8kt/y
Lake Johnston complex, Norilsk, Australia Implemented February 2009 Closing mining complex with cap. ~14kt/y
Munali, Albidon, Zambia Implemented March 2009 Closed 10kt/y mine Jinchuan to restart October 2009
Ferronikeli, Kosovo Implemented March 2009 Cut by 50% at ~10kt/y operations
Larco, Greece Announced April 2009 Cutting 2009 prod by ~40% at 18kt/y ops.
Sinclair, Xstrata, Australia Announced April 2009 To close 6kt/y mine in August 2009 If market conditions do not improve
Sudbury operations, Vale, Canada Announced April 2009 To close for 8 weeks in June/July 2009 In addition to maintenance closure in May
Rocky’s Reward (Leinster), BHP Billiton, Australia Announced May 2009 To close one of three mines at Leinster Leinster capacity ~35kt/y
Santa Cruz, Semirara Mining, Philippines Announced July 2009 Closed new mine with target cap ~10kt/y
Chinese nickel pig iron industry Big cuts and closures across industry Some capacity restarted from Q2 09
Source: Company reports, Reuters, Bloomberg, RBS
Parade of reactivating, new and expanding nickel mines due onstream by 2013F (20,000 tpa cut-off)
‘000 tonnes 2008 2009F 2010F 2011F 2012F 2013F 2009 -13F
Goro - Vale, New Caledonia 0 5 25 35 50 65 60
Onca - Puma Vale Brazil 0 0 0 15 35 50 50
Barro-Alto - Anglo - Brazil 0 0 0 10 20 36 36
Norilsk - Russia 127 120 132 140 150 155 35
Talvivaara - Europe 0 8 23 30 35 40 32
Ramu River - PNG 0 0 5 10 25 30 30
SLN/Eramet - New Caledonia 55 53 63 70 80 80 27
Soroako - Vale Indonesia 72 65 65 70 85 90 25
Santa Rita - Brazil 0 5 15 20 25 25 20
Raglan - Xstrata 26 28 30 35 45 48 20
Caldag, European Nickel Europe 0 0 4 12 15 20 20
Australia - Forrestania 4 10 12 22 25 30 20
Others 67 74 118 156 188 215 140
Total yoy 17 124 133 153 107 516
Source: Company reports, CRU and RBS

The Royal Bank of Scotland
Qu
arte
rly
Co
mm
od
ity
Co
mp
anio
n |
1 O
cto
ber
200
9
55
Source: Chinese General Administration of Customs
Rapid recovery in imports of low grade ore to China for NPI ‘000t
0
500
1,000
1,500
2,000
2,500
Jan-07 Jul-07 Jan-08 Jul-08 Jan-09 Jul-09Nickel ore/conc imports
Source: CRU and RBS
World nickel mine production about to surge post 2009. We forecast an additional 0.600mtpa on an undisrupted basis.
250
450
650
850
1,050
1,250
1,450
1,650
1,850
2,050
2002 2003 2004 2005 2006 2007 2008 2009F 2010F 2011F 2012F 2013F
Cont
aine
d ni
ckel
- to
nnes
Undisrupted world nickel mine production
Undisrupted world nickel mine output slumped over 7% in 2009 due to cutbacks. Set to rise sharply as reactivations get underway
The big projects to watch out for are Vale’s 60,000tpa Goro and Vale’s
50,000tpa Onca-Puma in Brazil. Anglo American report that its 36,000tpa Barro
Alto mine, also in Brazil, is now 66% complete. Barro Alto has a 26-year mine life
and is scheduled to come onstream in Q1 2011, with full production by Q3 2012.
In Europe, increases at Norilsk should add 35,000tpa, while Talvivaara has
confirmed that its new mine in Finland will reach 30,000tpa in 2010 and advised
of plans to expand to 50,000tpa post 2012.
Meanwhile, Japan’s largest nickel producer Sumitomo Metal Mining recently
announced that it will start construction in March 2010 of its 30-year nickel-cobalt
US$1.3bn Taganito project in the Philippines. The 30,000tpa Taganito will use a
high pressure acid leach process and is scheduled to be onstream in August
2013. Vale’s 46,000tpa Vermelho project is not expected onstream before 2013
and thus is not in our numbers. On the 2012-13 cusp is Xstrata’s 60,000tpa
Koniambo. The project was approved in October 2007, when spot nickel was
around twice as high as it now at US$35,000/tonne (US$16/lb).
Chinese nickel pig iron storms back on the scene
But watch out, nickel pig iron is also back on the scene. It’s hard to believe, but
pre-2004 therfe wasn’t a Chinese ferro-nickel nickel pig-iron (NPI) business worth
mentioning. However, the sustained period of elevated nickel prices in 2004-08
with a floor of US$15,000/tonne all the way up to the US$50,000/tonne marker
opened the way for a whole new industry to develop. Record nickel prices made
it economic to import low-grade limonite ores from the Philippines, Indonesia and
New Caledonia. In 2003, ore imports were just 0.01mt, by 2006 3.78mt and in
2007 reached a substantial 15.56mt. The combination of onerous energy prices,
high freight and the collapse in the nickel price saw port stocks of ore balloon
and shipments plunge.
However, much has changed. Crude NPI blast furnaces have been upgraded,
with more efficient electric arc furnaces that can service both 200 and 300 series
stainless steel feed. Freight rates are a fraction of what they were and the oil
price has halved, whilst the nickel price has snapped upwards. As a result,
imports of ores are on the rise with imports in January-August 2009, though
down 8% yoy, hitting 2.20mt in July, the second highest ever.

The Royal Bank of Scotland
Qu
arte
rly
Co
mm
od
ity
Co
mp
anio
n |
1 O
cto
ber
200
9
56
NPI production costs are now significantly lower. Back in October 2007, industry
estimates put production costs in the US$20,000-28,000/tonne (US$9-13/lb)
range. CRU now estimates production costs much lower, in the US$11,000-
17,000/tonne (US$5-7.75/lb) range. But it is not all clear sailing, with reports that
NPI producers in China’s Hebei and Shanxi provinces are cutting output due to
inventory build and sluggish offtake from major steel mills. We expect NPI post
2009 to contribute at least 100,000tpa to nickel market supply.
Finished nickel production set to surge 35% by 2013F
We estimate that refined nickel supply fell by 7.5% in 2009 to 1.280mt – the
lowest output in four years and the second consecutive year of supply
contraction. Between end 2007 and end-2009, we estimate that world nickel
supply contracted by 11%, wiping over 0.150mt off supply. Canada and Japan
suffered the greatest contraction, falling 20% each over this period. The nickel
price collapse brought to an abrupt halt many projects that had been years in
preparation, none more so than BHPBilliton’s Ravensthorpe in Western Australia,
the first major nickel laterite project in production in a decade.
Crucially, many of these projects are merely in a state of suspended animation,
awaiting a better price and demand environment. That better price environment
is already under way and for 2010-13, we forecast that the nickel price will trade
comfortably above the US$15,000/tonne marker and from H2 12 to be above
US$20,000/tonne. Price-induced reactivations will be a strong theme. We
forecast output in 2010 will rise 9% to 1.395mt and in 2011 by 6.5% to 1.485mt.
By the end of 2013, we estimate 0.445mt of additional supply will have been
brought onstream, representing a CAGR of 7.7% pa.
Outlook – could try harder – long slog ahead
In our view, it is now the time for nickel demand growth to ride to the rescue of
the nickel market. Nickel producers have certainly done their part; no more
should be asked of them. Collective cutbacks around the world resulted in over
0.300mtpa of capacity being shuttered – some of it probably permanently. At
over 21%, the idled capacity was comfortably the biggest production hit that any
of the base metal producers has had to endure. Nickel cutbacks have now
ceased and thoughts have turned to reactivation. Our plea is that nickel
Imports of low grade nickel ores & concentrates into China are recovering with alarming speed. Nickel pig iron output already surging (tonnes)
2005 2006 2007 2008 2009 YoY % MoM%
Jan 1,516 18,081 596,640 1,235,096 507,268 -59% -30% Feb 6,401 18,002 573,516 1,039,435 615,969 -41% 21% Mar 19,807 143,545 1,034,759 1,284,450 573,280 -55% -7%
Apr 519 168,179 1,593,772 1,995,420 1,073,383 -46% 87% May 10,075 150,614 1,641,898 2,029,098 939,708 -54% -12%
Jun 18,943 257,258 1,530,707 1,179,256 1,700,927 44% 81% Jul 20,931 257,815 2,277,956 530,983 2,198,078 314% 29%
Aug 60,030 462,600 1,730,570 497,323 1,449,221 191% -34% Sep 30,406 743,587 1,130,459 672,370 Oct 11,613 645,487 1,062,226 704,254 Nov 115,233 570,964 1,167,077 483,462 Dec 188,409 352,095 1,286,594 721,439
Total 483,887 3,777,842 15,563,948 12,318,023 9,053,345
Change 1036% 681% 312% -21%
Change 441,299 3,293,955 11,786,106 -3,245,925
YTD 9,791,061 9,053,345
Change -737,716 -8%
Source: Chinese General Administration of Customs
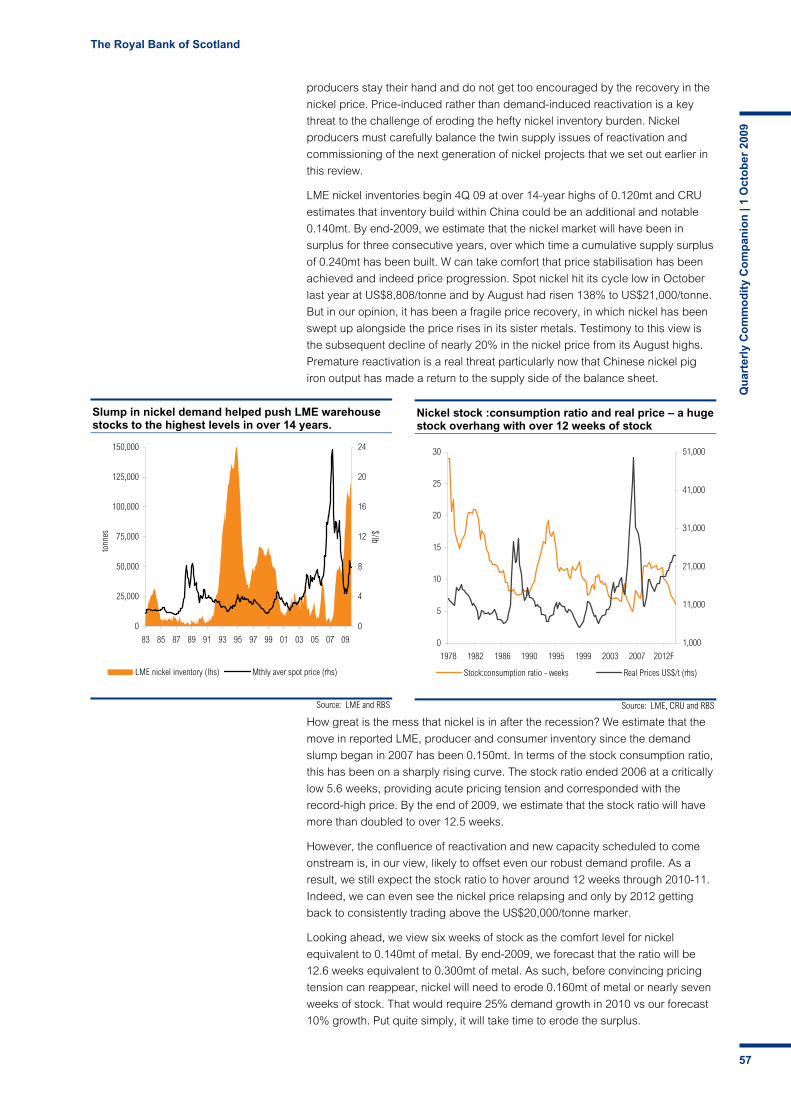
The Royal Bank of Scotland
Qu
arte
rly
Co
mm
od
ity
Co
mp
anio
n |
1 O
cto
ber
200
9
57
Source: LME and RBS
Slump in nickel demand helped push LME warehouse stocks to the highest levels in over 14 years.
0
25,000
50,000
75,000
100,000
125,000
150,000
83 85 87 89 91 93 95 97 99 01 03 05 07 09
tonn
es
0
4
8
12
16
20
24
$/lb
LME nickel inventory (lhs) Mthly aver spot price (rhs)
Source: LME, CRU and RBS
Nickel stock :consumption ratio and real price – a huge stock overhang with over 12 weeks of stock
0
5
10
15
20
25
30
1978 1982 1986 1990 1995 1999 2003 2007 2012F
1,000
11,000
21,000
31,000
41,000
51,000
Stock:consumption ratio - weeks Real Prices US$/t (rhs)
producers stay their hand and do not get too encouraged by the recovery in the
nickel price. Price-induced rather than demand-induced reactivation is a key
threat to the challenge of eroding the hefty nickel inventory burden. Nickel
producers must carefully balance the twin supply issues of reactivation and
commissioning of the next generation of nickel projects that we set out earlier in
this review.
LME nickel inventories begin 4Q 09 at over 14-year highs of 0.120mt and CRU
estimates that inventory build within China could be an additional and notable
0.140mt. By end-2009, we estimate that the nickel market will have been in
surplus for three consecutive years, over which time a cumulative supply surplus
of 0.240mt has been built. W can take comfort that price stabilisation has been
achieved and indeed price progression. Spot nickel hit its cycle low in October
last year at US$8,808/tonne and by August had risen 138% to US$21,000/tonne.
But in our opinion, it has been a fragile price recovery, in which nickel has been
swept up alongside the price rises in its sister metals. Testimony to this view is
the subsequent decline of nearly 20% in the nickel price from its August highs.
Premature reactivation is a real threat particularly now that Chinese nickel pig
iron output has made a return to the supply side of the balance sheet.
How great is the mess that nickel is in after the recession? We estimate that the
move in reported LME, producer and consumer inventory since the demand
slump began in 2007 has been 0.150mt. In terms of the stock consumption ratio,
this has been on a sharply rising curve. The stock ratio ended 2006 at a critically
low 5.6 weeks, providing acute pricing tension and corresponded with the
record-high price. By the end of 2009, we estimate that the stock ratio will have
more than doubled to over 12.5 weeks.
However, the confluence of reactivation and new capacity scheduled to come
onstream is, in our view, likely to offset even our robust demand profile. As a
result, we still expect the stock ratio to hover around 12 weeks through 2010-11.
Indeed, we can even see the nickel price relapsing and only by 2012 getting
back to consistently trading above the US$20,000/tonne marker.
Looking ahead, we view six weeks of stock as the comfort level for nickel
equivalent to 0.140mt of metal. By end-2009, we forecast that the ratio will be
12.6 weeks equivalent to 0.300mt of metal. As such, before convincing pricing
tension can reappear, nickel will need to erode 0.160mt of metal or nearly seven
weeks of stock. That would require 25% demand growth in 2010 vs our forecast
10% growth. Put quite simply, it will take time to erode the surplus.

The Royal Bank of Scotland
Qu
arte
rly
Co
mm
od
ity
Co
mp
anio
n |
1 O
cto
ber
200
9
58
Source: CRU, LME and RBS forecasts
Cumulative nickel surplus in 2007-11F nearly 0.300mt. Watch for reactivation. By 2012F, deficits should return and better prices.
-100
-70
-40
-10
20
50
80
110
2000 2002 2004 2006 2008 2010F 2012F'0
00 to
nnes
of s
urpl
us/d
efic
it0
5,000
10,000
15,000
20,000
25,000
30,000
35,000
40,000
US$/tonne
Nickel market surplus or deficit Nickel price (rhs)
Since our previous review, the nickel price has performed better than we had
expected. Yes, we have now halved our expected refined metal demand
contraction from -6% to -3%, mainly due to the resumption of Chinese stainless
demand. However, the fundamental position for nickel in terms of the stock
ratio has actually deteriorated since our April review. LME inventory has
grown by another 20,000 tonnes and unreported stocks within China have
mushroomed. All provide headwinds to the price in the months ahead.
What has not changed is that we still expect diminishing supply surpluses with
the market to turn to a supply shortfall in 2012 of 0.045mt, the first deficit market
in five years. The real fireworks are reserved for 2013, when a 75,000 tonne
supply shortfall should bring the stock ratio to six weeks with commensurately
higher prices.
We have raised our 2010 spot price forecast by 17% to US$15,500/tonne
(US$7.05/lb), but in a nod to what we believe is an overexuberant price, this is
only 5% higher yoy from our 2009 spot average of US$14,765/tonne. We forecast
annual price averages will make a more demonstrable move higher post 2011,
when demand growth finally burns off supply additions and the first supply
deficit in five years appears. By 2013, we can see the price reaching
US$23,000/tonne (US$10.45/lb) – a gain of more than 50% on the 2009 forecast
average price.
We have also had our annual look at our long term nickel price. Viewing the mix
of higher cost ferro-nickel capacity, the re-entry of nickel pig iron and stronger
producer currencies, we have taken the opportunity to raise our long term price
(which kicks in post 2013) by 13% to US$15,000/tonne (US$6.80/lb).
So we expect the good times to return, but first two years of heavy lifting by
nickel demand should redress the supply imbalance. Were the nickel price to be
stronger than we forecast, it would merely accelerate supply reactivation. As
such, the period ahead is one in which demand growth cannot afford to suffer
relapse.

The Royal Bank of Scotland
Qu
arte
rly
Co
mm
od
ity
Co
mp
anio
n |
1 O
cto
ber
200
9
59
Source: LME
Zinc price has recovered by c90% but remains far below its peak
1,000
2,000
3,000
4,000
5,000
Sep-06 Sep-07 Sep-08 Sep-09Three month zinc US$/tonne
Source: CRU, ILZSG, RBS forecasts
World refined zinc demand (mt), 2004-13F – may bounce 7% in 2010
0
3
6
9
12
15
04 05 06 07 08 09f 10f 11f 12f 13f
World excluding China China
Zinc
A middle order batsman biding its time
Zinc has trodden a middle path in this year’s base metal price recovery, in line
with its position in the fundamental pecking order. The market has remained in
substantial underlying surplus, even if this has been mitigated by Chinese
stockpiling, and we expect it to stay in surplus in 2010-11 (albeit shrinking
rapidly) as producer restarts offset strong demand growth. However, the pipeline
of new mine capacity is thin and we forecast that zinc will shift into hefty deficit in
2012-13, quickly eroding excess stocks. Zinc’s prospects appear less enticing
than those of copper and lead, and we expect the LME price to grind higher
rather than lead the pack in 2010. But zinc should come to the fore thereafter
and we forecast an average price in 2013 of $2,550/t. A key risk is of price
escalation being brought forward as investors anticipate the tighter market.
Demand – strong revival ahead
In our April 2009 Commodity Companion, we suggested world demand for zinc
was then holding up better than the other big base metals and forecast that it
would decline this year by ‘only’ 5.5%. But we did warn that the risks were on the
downside and we now expect real demand to fall by 6.0-6.5% in 2009.
However, our downward revision reflects a worse-than-expected outcome in the
first half, not a weaker recovery in H2. Although ILZSG figures indicate a drop of
11-12% yoy in H1, this includes growth in China of 13%, which looks unlikely to
us, as discussed below. We estimate that true world demand plunged by 15% in
H1. But we can now be more confident about recovery in H2, especially in Q4,
when demand could bounce by up to 10% yoy as favourable base effects kick
in. This sets the scene for a strong performance in 2010. Regional developments
are now supportive, too. Buoyant China accounts for nearly 40% of global zinc
demand, while non-Chinese demand has slumped by over 15% since 2007, due
largely to ferocious destocking that is now coming to an end.
RBS world zinc supply/demand balance, 2006-13F – surplus will shrink greatly in 2010-11, hefty deficit in 2012-13
(m tonnes) 2006 2007 2008 2009F 2010F 2011F 2012F 2013F
World zinc mine production 10.29 11.17 11.59 10.95 11.25 11.60 12.00 12.45
Change % 4.6% 8.6% 3.7% -5.5% 2.7% 3.1% 3.4% 3.7%
of which China 2.70 3.05 2.98 2.70 2.80 2.85 3.05 3.25
Change % 16.1% 13.0% -2.5% -9.2% 3.7% 1.8% 7.0% 6.6%
World refined zinc production 10.65 11.41 11.67 10.85 11.35 12.10 12.50 12.90
Change % 4.6% 7.3% 2.3% -7.0% 4.6% 6.6% 3.3% 3.2%
of which China 3.22 3.84 3.97 4.00 4.25 4.60 4.90 5.25
Change % 15.4% 19.1% 3.5% 0.8% 6.3% 8.2% 6.5% 7.1%
World refined zinc consumption 11.04 11.26 11.21 10.50 11.25 12.00 12.70 13.25
Change % 5.2% 2.0% -0.5% -6.3% 7.1% 6.7% 5.8% 4.3%
of which China 3.30 3.60 3.88 4.05 4.35 4.70 5.10 5.50
Change % 13.8% 9.1% 7.6% 4.5% 7.4% 8.0% 8.5% 7.8%
Implied market balance -0.39 0.15 0.46 0.35 0.10 0.10 -0.20 -0.35
Actual reported inventory 0.55 0.63 0.83 1.05 1.25 1.45 1.30 1.00
Reported change in inventory -0.28 0.09 0.19 0.22 0.20 0.20 -0.15 -0.30
Stock: consumption ratio (weeks) 2.6 2.9 3.8 5.2 5.8 6.3 5.3 3.9
LME spot price US$/tonne 3,272 3,249 1,870 1,585 2,025 2,150 2,400 2,550
LME spot zinc price US¢/lb 148 147 85 72 92 98 109 116
Change % 137% -1% -42% -15% 28% 6% 12% 6%
Source: CRU, ILZSG, RBS estimates and forecasts
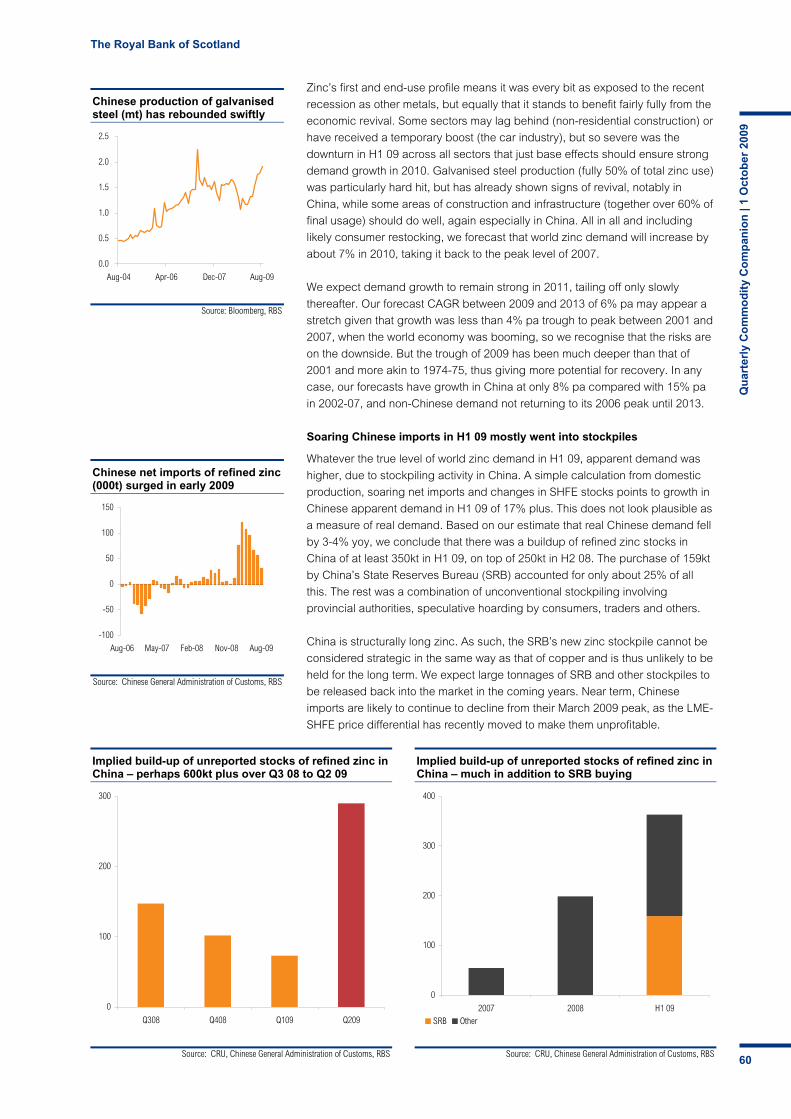
The Royal Bank of Scotland
Qu
arte
rly
Co
mm
od
ity
Co
mp
anio
n |
1 O
cto
ber
200
9
60
Source: Bloomberg, RBS
Chinese production of galvanised steel (mt) has rebounded swiftly
0.0
0.5
1.0
1.5
2.0
2.5
Aug-04 Apr-06 Dec-07 Aug-09
Source: CRU, Chinese General Administration of Customs, RBS
Implied build-up of unreported stocks of refined zinc in China – perhaps 600kt plus over Q3 08 to Q2 09
0
100
200
300
Q308 Q408 Q109 Q209
Source: CRU, Chinese General Administration of Customs, RBS
Implied build-up of unreported stocks of refined zinc in China – much in addition to SRB buying
0
100
200
300
400
2007 2008 H1 09SRB Other
Source: Chinese General Administration of Customs, RBS
Chinese net imports of refined zinc (000t) surged in early 2009
-100
-50
0
50
100
150
Aug-06 May-07 Feb-08 Nov-08 Aug-09
Zinc’s first and end-use profile means it was every bit as exposed to the recent
recession as other metals, but equally that it stands to benefit fairly fully from the
economic revival. Some sectors may lag behind (non-residential construction) or
have received a temporary boost (the car industry), but so severe was the
downturn in H1 09 across all sectors that just base effects should ensure strong
demand growth in 2010. Galvanised steel production (fully 50% of total zinc use)
was particularly hard hit, but has already shown signs of revival, notably in
China, while some areas of construction and infrastructure (together over 60% of
final usage) should do well, again especially in China. All in all and including
likely consumer restocking, we forecast that world zinc demand will increase by
about 7% in 2010, taking it back to the peak level of 2007.
We expect demand growth to remain strong in 2011, tailing off only slowly
thereafter. Our forecast CAGR between 2009 and 2013 of 6% pa may appear a
stretch given that growth was less than 4% pa trough to peak between 2001 and
2007, when the world economy was booming, so we recognise that the risks are
on the downside. But the trough of 2009 has been much deeper than that of
2001 and more akin to 1974-75, thus giving more potential for recovery. In any
case, our forecasts have growth in China at only 8% pa compared with 15% pa
in 2002-07, and non-Chinese demand not returning to its 2006 peak until 2013.
Soaring Chinese imports in H1 09 mostly went into stockpiles
Whatever the true level of world zinc demand in H1 09, apparent demand was
higher, due to stockpiling activity in China. A simple calculation from domestic
production, soaring net imports and changes in SHFE stocks points to growth in
Chinese apparent demand in H1 09 of 17% plus. This does not look plausible as
a measure of real demand. Based on our estimate that real Chinese demand fell
by 3-4% yoy, we conclude that there was a buildup of refined zinc stocks in
China of at least 350kt in H1 09, on top of 250kt in H2 08. The purchase of 159kt
by China’s State Reserves Bureau (SRB) accounted for only about 25% of all
this. The rest was a combination of unconventional stockpiling involving
provincial authorities, speculative hoarding by consumers, traders and others.
China is structurally long zinc. As such, the SRB’s new zinc stockpile cannot be
considered strategic in the same way as that of copper and is thus unlikely to be
held for the long term. We expect large tonnages of SRB and other stockpiles to
be released back into the market in the coming years. Near term, Chinese
imports are likely to continue to decline from their March 2009 peak, as the LME-
SHFE price differential has recently moved to make them unprofitable.
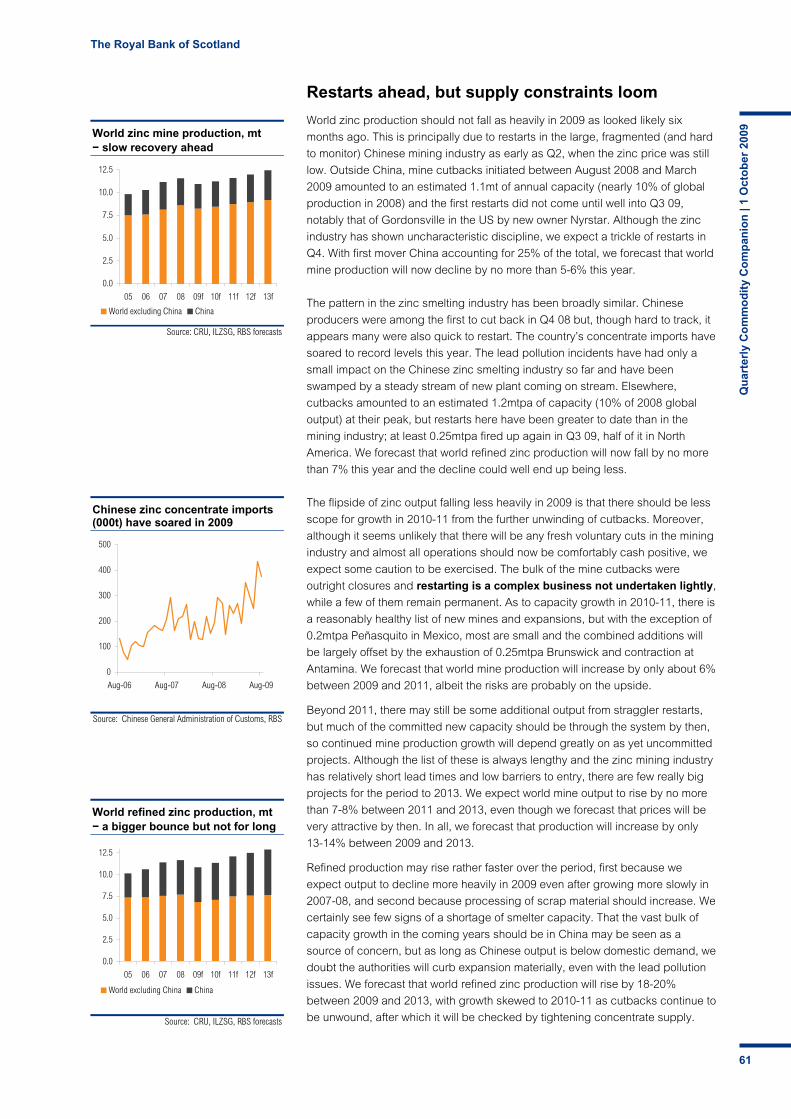
The Royal Bank of Scotland
Qu
arte
rly
Co
mm
od
ity
Co
mp
anio
n |
1 O
cto
ber
200
9
61
Source: CRU, ILZSG, RBS forecasts
World zinc mine production, mt − slow recovery ahead
0.0
2.5
5.0
7.5
10.0
12.5
05 06 07 08 09f 10f 11f 12f 13f
World excluding China China
Source: Chinese General Administration of Customs, RBS
Chinese zinc concentrate imports (000t) have soared in 2009
0
100
200
300
400
500
Aug-06 Aug-07 Aug-08 Aug-09
Source: CRU, ILZSG, RBS forecasts
World refined zinc production, mt − a bigger bounce but not for long
0.0
2.5
5.0
7.5
10.0
12.5
05 06 07 08 09f 10f 11f 12f 13f
World excluding China China
Restarts ahead, but supply constraints loom
World zinc production should not fall as heavily in 2009 as looked likely six
months ago. This is principally due to restarts in the large, fragmented (and hard
to monitor) Chinese mining industry as early as Q2, when the zinc price was still
low. Outside China, mine cutbacks initiated between August 2008 and March
2009 amounted to an estimated 1.1mt of annual capacity (nearly 10% of global
production in 2008) and the first restarts did not come until well into Q3 09,
notably that of Gordonsville in the US by new owner Nyrstar. Although the zinc
industry has shown uncharacteristic discipline, we expect a trickle of restarts in
Q4. With first mover China accounting for 25% of the total, we forecast that world
mine production will now decline by no more than 5-6% this year.
The pattern in the zinc smelting industry has been broadly similar. Chinese
producers were among the first to cut back in Q4 08 but, though hard to track, it
appears many were also quick to restart. The country’s concentrate imports have
soared to record levels this year. The lead pollution incidents have had only a
small impact on the Chinese zinc smelting industry so far and have been
swamped by a steady stream of new plant coming on stream. Elsewhere,
cutbacks amounted to an estimated 1.2mtpa of capacity (10% of 2008 global
output) at their peak, but restarts here have been greater to date than in the
mining industry; at least 0.25mtpa fired up again in Q3 09, half of it in North
America. We forecast that world refined zinc production will now fall by no more
than 7% this year and the decline could well end up being less.
The flipside of zinc output falling less heavily in 2009 is that there should be less
scope for growth in 2010-11 from the further unwinding of cutbacks. Moreover,
although it seems unlikely that there will be any fresh voluntary cuts in the mining
industry and almost all operations should now be comfortably cash positive, we
expect some caution to be exercised. The bulk of the mine cutbacks were
outright closures and restarting is a complex business not undertaken lightly,
while a few of them remain permanent. As to capacity growth in 2010-11, there is
a reasonably healthy list of new mines and expansions, but with the exception of
0.2mtpa Peñasquito in Mexico, most are small and the combined additions will
be largely offset by the exhaustion of 0.25mtpa Brunswick and contraction at
Antamina. We forecast that world mine production will increase by only about 6%
between 2009 and 2011, albeit the risks are probably on the upside.
Beyond 2011, there may still be some additional output from straggler restarts,
but much of the committed new capacity should be through the system by then,
so continued mine production growth will depend greatly on as yet uncommitted
projects. Although the list of these is always lengthy and the zinc mining industry
has relatively short lead times and low barriers to entry, there are few really big
projects for the period to 2013. We expect world mine output to rise by no more
than 7-8% between 2011 and 2013, even though we forecast that prices will be
very attractive by then. In all, we forecast that production will increase by only
13-14% between 2009 and 2013.
Refined production may rise rather faster over the period, first because we
expect output to decline more heavily in 2009 even after growing more slowly in
2007-08, and second because processing of scrap material should increase. We
certainly see few signs of a shortage of smelter capacity. That the vast bulk of
capacity growth in the coming years should be in China may be seen as a
source of concern, but as long as Chinese output is below domestic demand, we
doubt the authorities will curb expansion materially, even with the lead pollution
issues. We forecast that world refined zinc production will rise by 18-20%
between 2009 and 2013, with growth skewed to 2010-11 as cutbacks continue to
be unwound, after which it will be checked by tightening concentrate supply.
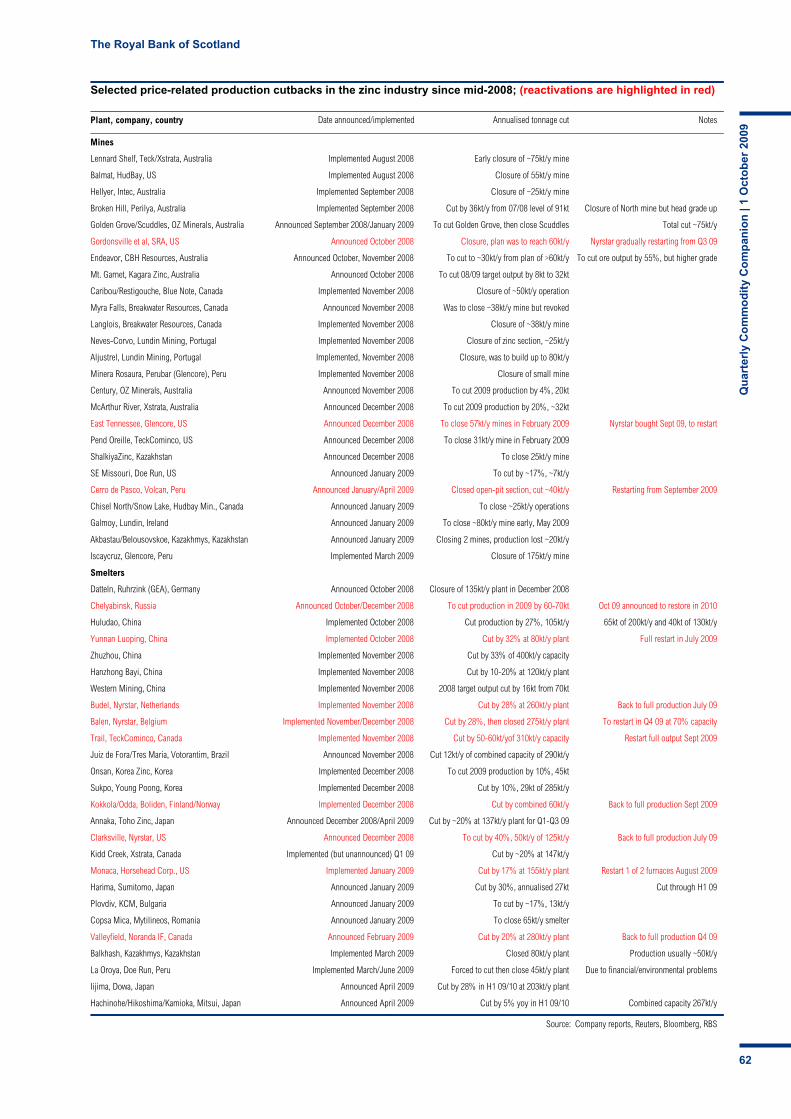
The Royal Bank of Scotland
Qu
arte
rly
Co
mm
od
ity
Co
mp
anio
n |
1 O
cto
ber
200
9
62
Selected price-related production cutbacks in the zinc industry since mid-2008; (reactivations are highlighted in red)
Plant, company, country Date announced/implemented Annualised tonnage cut Notes
Mines
Lennard Shelf, Teck/Xstrata, Australia Implemented August 2008 Early closure of ~75kt/y mine
Balmat, HudBay, US Implemented August 2008 Closure of 55kt/y mine
Hellyer, Intec, Australia Implemented September 2008 Closure of ~25kt/y mine
Broken Hill, Perilya, Australia Implemented September 2008 Cut by 36kt/y from 07/08 level of 91kt Closure of North mine but head grade up
Golden Grove/Scuddles, OZ Minerals, Australia Announced September 2008/January 2009 To cut Golden Grove, then close Scuddles Total cut ~75kt/y
Gordonsville et al, SRA, US Announced October 2008 Closure, plan was to reach 60kt/y Nyrstar gradually restarting from Q3 09
Endeavor, CBH Resources, Australia Announced October, November 2008 To cut to ~30kt/y from plan of >60kt/y To cut ore output by 55%, but higher grade
Mt. Garnet, Kagara Zinc, Australia Announced October 2008 To cut 08/09 target output by 8kt to 32kt
Caribou/Restigouche, Blue Note, Canada Implemented November 2008 Closure of ~50kt/y operation
Myra Falls, Breakwater Resources, Canada Announced November 2008 Was to close ~38kt/y mine but revoked
Langlois, Breakwater Resources, Canada Implemented November 2008 Closure of ~38kt/y mine
Neves-Corvo, Lundin Mining, Portugal Implemented November 2008 Closure of zinc section, ~25kt/y
Aljustrel, Lundin Mining, Portugal Implemented, November 2008 Closure, was to build up to 80kt/y
Minera Rosaura, Perubar (Glencore), Peru Implemented November 2008 Closure of small mine
Century, OZ Minerals, Australia Announced November 2008 To cut 2009 production by 4%, 20kt
McArthur River, Xstrata, Australia Announced December 2008 To cut 2009 production by 20%, ~32kt
East Tennessee, Glencore, US Announced December 2008 To close 57kt/y mines in February 2009 Nyrstar bought Sept 09, to restart
Pend Oreille, TeckCominco, US Announced December 2008 To close 31kt/y mine in February 2009
ShalkiyaZinc, Kazakhstan Announced December 2008 To close 25kt/y mine
SE Missouri, Doe Run, US Announced January 2009 To cut by ~17%, ~7kt/y
Cerro de Pasco, Volcan, Peru Announced January/April 2009 Closed open-pit section, cut ~40kt/y Restarting from September 2009
Chisel North/Snow Lake, Hudbay Min., Canada Announced January 2009 To close ~25kt/y operations
Galmoy, Lundin, Ireland Announced January 2009 To close ~80kt/y mine early, May 2009
Akbastau/Belousovskoe, Kazakhmys, Kazakhstan Announced January 2009 Closing 2 mines, production lost ~20kt/y
Iscaycruz, Glencore, Peru Implemented March 2009 Closure of 175kt/y mine
Smelters
Datteln, Ruhrzink (GEA), Germany Announced October 2008 Closure of 135kt/y plant in December 2008
Chelyabinsk, Russia Announced October/December 2008 To cut production in 2009 by 60-70kt Oct 09 announced to restore in 2010
Huludao, China Implemented October 2008 Cut production by 27%, 105kt/y 65kt of 200kt/y and 40kt of 130kt/y
Yunnan Luoping, China Implemented October 2008 Cut by 32% at 80kt/y plant Full restart in July 2009
Zhuzhou, China Implemented November 2008 Cut by 33% of 400kt/y capacity
Hanzhong Bayi, China Implemented November 2008 Cut by 10-20% at 120kt/y plant
Western Mining, China Implemented November 2008 2008 target output cut by 16kt from 70kt
Budel, Nyrstar, Netherlands Implemented November 2008 Cut by 28% at 260kt/y plant Back to full production July 09
Balen, Nyrstar, Belgium Implemented November/December 2008 Cut by 28%, then closed 275kt/y plant To restart in Q4 09 at 70% capacity
Trail, TeckCominco, Canada Implemented November 2008 Cut by 50-60kt/yof 310kt/y capacity Restart full output Sept 2009
Juiz de Fora/Tres Maria, Votorantim, Brazil Announced November 2008 Cut 12kt/y of combined capacity of 290kt/y
Onsan, Korea Zinc, Korea Implemented December 2008 To cut 2009 production by 10%, 45kt
Sukpo, Young Poong, Korea Implemented December 2008 Cut by 10%, 29kt of 285kt/y
Kokkola/Odda, Boliden, Finland/Norway Implemented December 2008 Cut by combined 60kt/y Back to full production Sept 2009
Annaka, Toho Zinc, Japan Announced December 2008/April 2009 Cut by ~20% at 137kt/y plant for Q1-Q3 09
Clarksville, Nyrstar, US Announced December 2008 To cut by 40%, 50kt/y of 125kt/y Back to full production July 09
Kidd Creek, Xstrata, Canada Implemented (but unannounced) Q1 09 Cut by ~20% at 147kt/y
Monaca, Horsehead Corp., US Implemented January 2009 Cut by 17% at 155kt/y plant Restart 1 of 2 furnaces August 2009
Harima, Sumitomo, Japan Announced January 2009 Cut by 30%, annualised 27kt Cut through H1 09
Plovdiv, KCM, Bulgaria Announced January 2009 To cut by ~17%, 13kt/y
Copsa Mica, Mytilineos, Romania Announced January 2009 To close 65kt/y smelter
Valleyfield, Noranda IF, Canada Announced February 2009 Cut by 20% at 280kt/y plant Back to full production Q4 09
Balkhash, Kazakhmys, Kazakhstan Implemented March 2009 Closed 80kt/y plant Production usually ~50kt/y
La Oroya, Doe Run, Peru Implemented March/June 2009 Forced to cut then close 45kt/y plant Due to financial/environmental problems
Iijima, Dowa, Japan Announced April 2009 Cut by 28% in H1 09/10 at 203kt/y plant
Hachinohe/Hikoshima/Kamioka, Mitsui, Japan Announced April 2009 Cut by 5% yoy in H1 09/10 Combined capacity 267kt/y
Source: Company reports, Reuters, Bloomberg, RBS
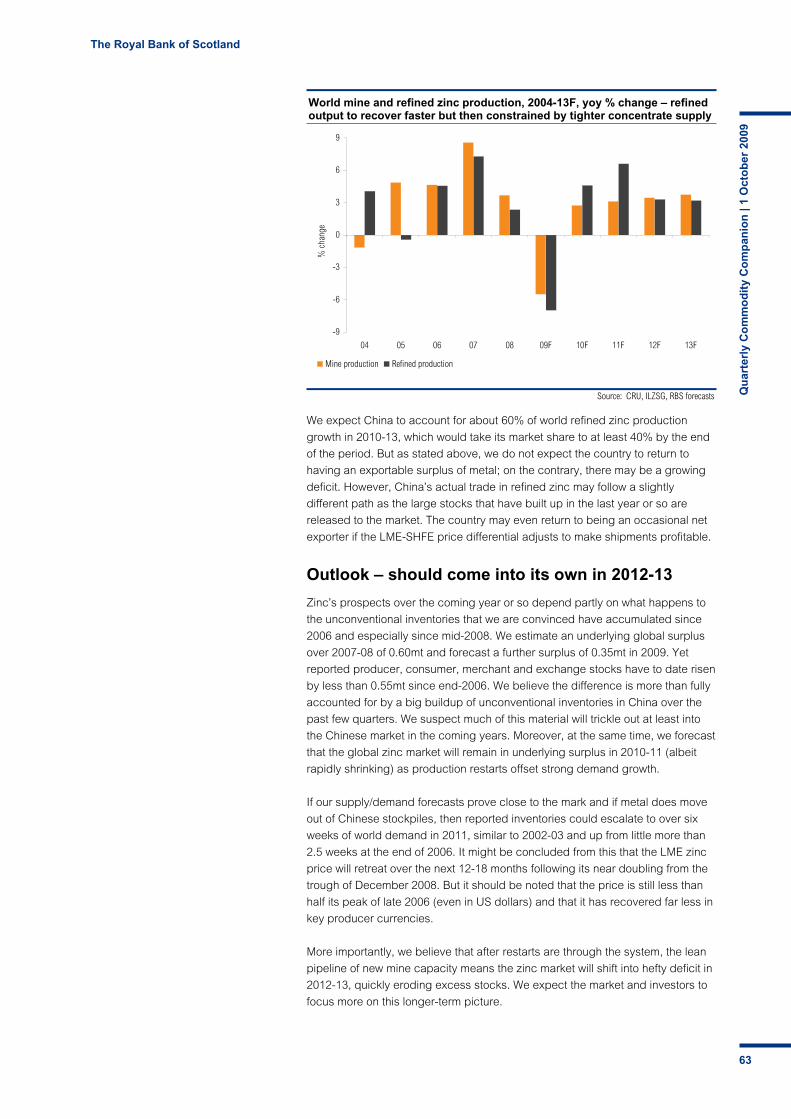
The Royal Bank of Scotland
Qu
arte
rly
Co
mm
od
ity
Co
mp
anio
n |
1 O
cto
ber
200
9
63
World mine and refined zinc production, 2004-13F, yoy % change – refined output to recover faster but then constrained by tighter concentrate supply
-9
-6
-3
0
3
6
9
04 05 06 07 08 09F 10F 11F 12F 13F
% c
hang
e
Mine production Refined production
Source: CRU, ILZSG, RBS forecasts
We expect China to account for about 60% of world refined zinc production
growth in 2010-13, which would take its market share to at least 40% by the end
of the period. But as stated above, we do not expect the country to return to
having an exportable surplus of metal; on the contrary, there may be a growing
deficit. However, China’s actual trade in refined zinc may follow a slightly
different path as the large stocks that have built up in the last year or so are
released to the market. The country may even return to being an occasional net
exporter if the LME-SHFE price differential adjusts to make shipments profitable.
Outlook – should come into its own in 2012-13
Zinc’s prospects over the coming year or so depend partly on what happens to
the unconventional inventories that we are convinced have accumulated since
2006 and especially since mid-2008. We estimate an underlying global surplus
over 2007-08 of 0.60mt and forecast a further surplus of 0.35mt in 2009. Yet
reported producer, consumer, merchant and exchange stocks have to date risen
by less than 0.55mt since end-2006. We believe the difference is more than fully
accounted for by a big buildup of unconventional inventories in China over the
past few quarters. We suspect much of this material will trickle out at least into
the Chinese market in the coming years. Moreover, at the same time, we forecast
that the global zinc market will remain in underlying surplus in 2010-11 (albeit
rapidly shrinking) as production restarts offset strong demand growth.
If our supply/demand forecasts prove close to the mark and if metal does move
out of Chinese stockpiles, then reported inventories could escalate to over six
weeks of world demand in 2011, similar to 2002-03 and up from little more than
2.5 weeks at the end of 2006. It might be concluded from this that the LME zinc
price will retreat over the next 12-18 months following its near doubling from the
trough of December 2008. But it should be noted that the price is still less than
half its peak of late 2006 (even in US dollars) and that it has recovered far less in
key producer currencies.
More importantly, we believe that after restarts are through the system, the lean
pipeline of new mine capacity means the zinc market will shift into hefty deficit in
2012-13, quickly eroding excess stocks. We expect the market and investors to
focus more on this longer-term picture.
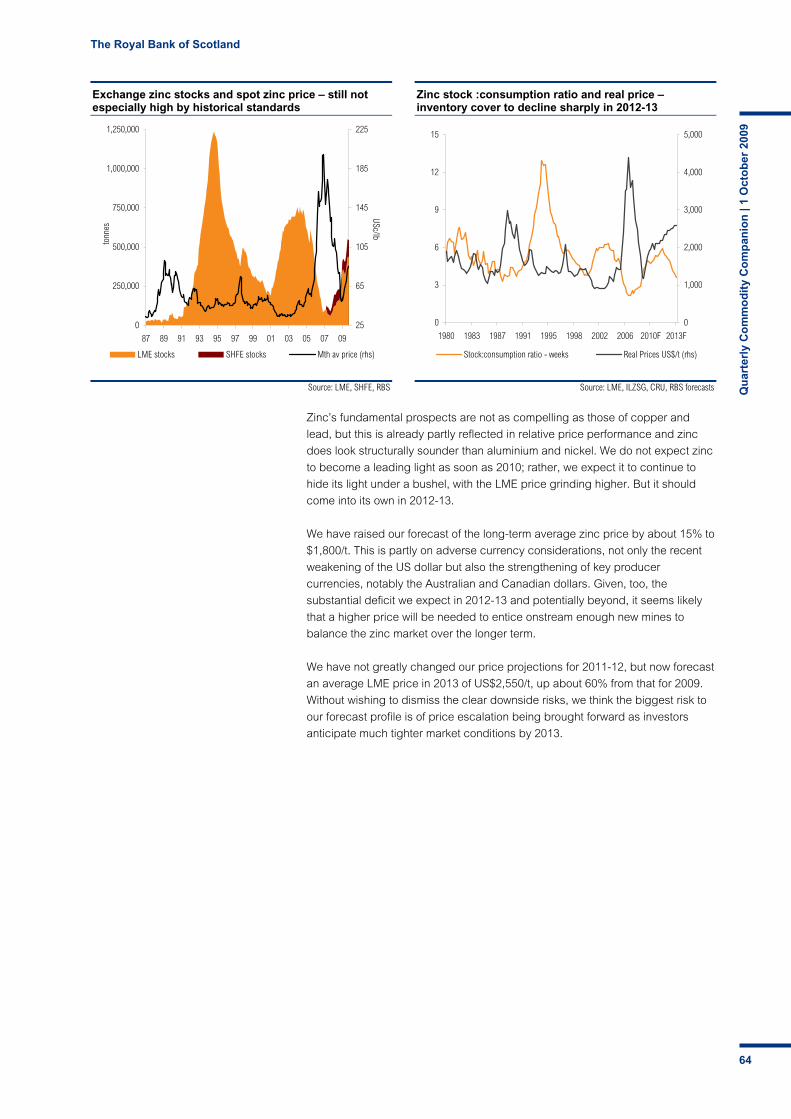
The Royal Bank of Scotland
Qu
arte
rly
Co
mm
od
ity
Co
mp
anio
n |
1 O
cto
ber
200
9
64
Source: LME, SHFE, RBS
Exchange zinc stocks and spot zinc price – still not especially high by historical standards
0
250,000
500,000
750,000
1,000,000
1,250,000
87 89 91 93 95 97 99 01 03 05 07 09
tonn
es
25
65
105
145
185
225
USc/lb
LME stocks SHFE stocks Mth av price (rhs)
Source: LME, ILZSG, CRU, RBS forecasts
Zinc stock :consumption ratio and real price – inventory cover to decline sharply in 2012-13
0
3
6
9
12
15
1980 1983 1987 1991 1995 1998 2002 2006 2010F 2013F
0
1,000
2,000
3,000
4,000
5,000
Stock:consumption ratio - weeks Real Prices US$/t (rhs)
Zinc’s fundamental prospects are not as compelling as those of copper and
lead, but this is already partly reflected in relative price performance and zinc
does look structurally sounder than aluminium and nickel. We do not expect zinc
to become a leading light as soon as 2010; rather, we expect it to continue to
hide its light under a bushel, with the LME price grinding higher. But it should
come into its own in 2012-13.
We have raised our forecast of the long-term average zinc price by about 15% to
$1,800/t. This is partly on adverse currency considerations, not only the recent
weakening of the US dollar but also the strengthening of key producer
currencies, notably the Australian and Canadian dollars. Given, too, the
substantial deficit we expect in 2012-13 and potentially beyond, it seems likely
that a higher price will be needed to entice onstream enough new mines to
balance the zinc market over the longer term.
We have not greatly changed our price projections for 2011-12, but now forecast
an average LME price in 2013 of US$2,550/t, up about 60% from that for 2009.
Without wishing to dismiss the clear downside risks, we think the biggest risk to
our forecast profile is of price escalation being brought forward as investors
anticipate much tighter market conditions by 2013.

The Royal Bank of Scotland
Qu
arte
rly
Co
mm
od
ity
Co
mp
anio
n |
1 O
cto
ber
200
9
65
Source: LME
Lead price nearly triples at best, recoups half previous losses
0
1,000
2,000
3,000
4,000
Sep-05 Sep-07 Sep-09
Three month lead US$/tonne
Source: Brook Hunt, RBS
Estimated world lead demand by end use – less cyclical
Batteries - Replacement SLI - 45%
Batteries - Original Equip. SLI - 13%
Batteries - Industrial,standby - 12%
Non-battery uses - 20%
Batteries -Industrial,motive - 10%
Lead
Destined for even greater glory
Even after its excellent price recovery of the past nine months, we believe the
medium-term outlook for lead remains very bullish and it is one of our top metal
picks. Lead demand has held up well through the recession and whilst its
cyclical recovery should be relatively muted, underlying trends appear firm.
Secondary production cannot on its own satisfy all the additional demand
through the cycle. Meanwhile, the primary sector remains hampered by lead’s
by-product status in most of the mining industry. Although reported stocks may
continue to tick up over the next 6-12 months, we expect them to remain
historically low and forecast that the market will return to deficit in 2011-13,
leaving it at least as tight as in 2006-07. The absolute price peak of the last bull
market may be out of reach, but we forecast that after consolidation in 2010, the
annual average LME price will hit a new record high in 2013 of US$2,750/t.
Demand – less cyclical, but firm underlying trend
World lead demand has not held up quite as well this year as we had expected,
but with a decline that we now forecast at 2.5-3.0%, it should still have been
more resilient than other base metals. The ILZSG estimates that demand actually
rose by 2.5% yoy in H1 09, but this includes growth in China of fully 35%, which
to us looks highly unlikely, of which more below. We expect Chinese growth to
slow to about 6% this year, with demand elsewhere falling by as much as 8%.
Lead’s resilient, if slightly disappointing, record is illustrated by North American
automotive battery shipments. Original equipment (OE) units collapsed by 39%
yoy in Jan-July, but the far bigger and largely (yet clearly not wholly) recession-
proof replacement sector shrank by 2%, leaving the combined total down 8%.
The OE sector has fared less badly elsewhere, but we expect global light vehicle
sales to fall by 10% this year. With industrial batteries and non-battery use poor,
too, replacement batteries may account for 45% of total lead demand in 2009.
RBS world lead supply-demand balance, 2006-13F; return to deficit by 2011, severe tightness by 2013
(m tonnes) 2006 2007 2008 2009F 2010F 2011F 2012F 2013F
World lead mine production 3.60 3.67 3.84 3.75 3.90 4.05 4.25 4.40
Change % 1.3% 2.0% 4.4% -2.2% 4.0% 3.8% 4.9% 3.5%
World primary refined production 3.61 3.59 3.83 3.55 3.75 3.95 4.13 4.33
World secondary refined production 4.31 4.54 4.78 4.70 4.85 5.05 5.25 5.50
World refined lead production (incl. US DNSC sales) 7.93 8.12 8.61 8.25 8.60 9.00 9.38 9.83
Change % 3.5% 2.5% 6.0% -4.1% 4.2% 4.7% 4.2% 4.8%
of which China 2.72 2.79 3.15 3.20 3.35 3.65 3.90 4.20
Change % 13.6% 2.7% 13.0% 1.6% 4.7% 9.0% 6.8% 7.7%
World refined lead consumption 8.09 8.21 8.43 8.20 8.60 9.05 9.48 9.90
Change % 4.1% 1.5% 2.7% -2.7% 4.9% 5.2% 4.7% 4.5%
of which China 2.21 2.57 3.06 3.25 3.53 3.78 4.00 4.25
Change % 15.1% 16.3% 19.0% 6.2% 8.6% 7.1% 5.8% 6.3%
Implied market balance -0.16 -0.09 0.18 0.05 0.00 -0.05 -0.10 -0.08
Actual reported inventory 0.27 0.27 0.31 0.40 0.45 0.40 0.35 0.30
Reported change in inventory -0.02 -0.00 0.04 0.09 0.05 -0.05 -0.05 -0.05
Stock: consumption ratio (weeks) 1.7 1.7 1.9 2.5 2.7 2.3 1.9 1.6
LME spot price US$/tonne 1,287 2,594 2,084 1,700 2,250 2,400 2,525 2,750
LME spot price USc/lb 58 118 95 77 102 109 115 125
Change % 32% 102% -20% -18% 32% 7% 5% 9%
Source: CRU, ILZSG, RBS estimates and forecasts
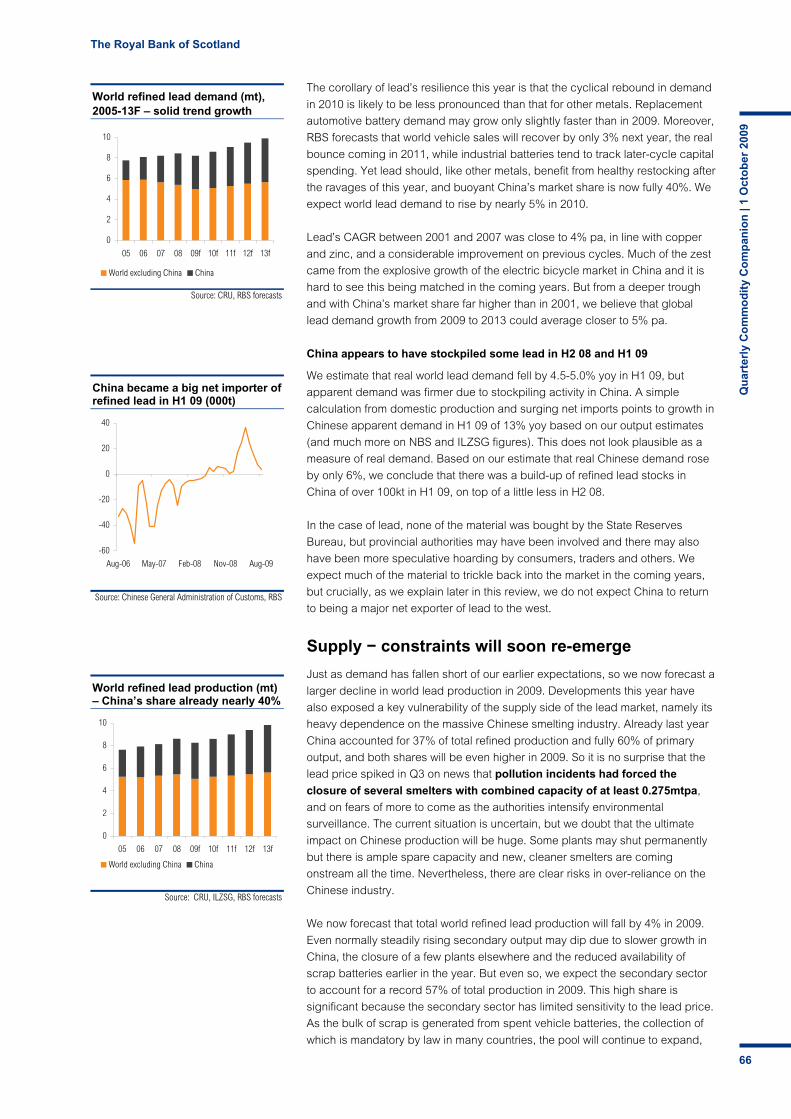
The Royal Bank of Scotland
Qu
arte
rly
Co
mm
od
ity
Co
mp
anio
n |
1 O
cto
ber
200
9
66
Source: CRU, RBS forecasts
World refined lead demand (mt), 2005-13F – solid trend growth
0
2
4
6
8
10
05 06 07 08 09f 10f 11f 12f 13f
World excluding China China
Source: Chinese General Administration of Customs, RBS
China became a big net importer of refined lead in H1 09 (000t)
-60
-40
-20
0
20
40
Aug-06 May-07 Feb-08 Nov-08 Aug-09
Source: CRU, ILZSG, RBS forecasts
World refined lead production (mt) – China’s share already nearly 40%
0
2
4
6
8
10
05 06 07 08 09f 10f 11f 12f 13f
World excluding China China
The corollary of lead’s resilience this year is that the cyclical rebound in demand
in 2010 is likely to be less pronounced than that for other metals. Replacement
automotive battery demand may grow only slightly faster than in 2009. Moreover,
RBS forecasts that world vehicle sales will recover by only 3% next year, the real
bounce coming in 2011, while industrial batteries tend to track later-cycle capital
spending. Yet lead should, like other metals, benefit from healthy restocking after
the ravages of this year, and buoyant China’s market share is now fully 40%. We
expect world lead demand to rise by nearly 5% in 2010.
Lead’s CAGR between 2001 and 2007 was close to 4% pa, in line with copper
and zinc, and a considerable improvement on previous cycles. Much of the zest
came from the explosive growth of the electric bicycle market in China and it is
hard to see this being matched in the coming years. But from a deeper trough
and with China’s market share far higher than in 2001, we believe that global
lead demand growth from 2009 to 2013 could average closer to 5% pa.
China appears to have stockpiled some lead in H2 08 and H1 09
We estimate that real world lead demand fell by 4.5-5.0% yoy in H1 09, but
apparent demand was firmer due to stockpiling activity in China. A simple
calculation from domestic production and surging net imports points to growth in
Chinese apparent demand in H1 09 of 13% yoy based on our output estimates
(and much more on NBS and ILZSG figures). This does not look plausible as a
measure of real demand. Based on our estimate that real Chinese demand rose
by only 6%, we conclude that there was a build-up of refined lead stocks in
China of over 100kt in H1 09, on top of a little less in H2 08.
In the case of lead, none of the material was bought by the State Reserves
Bureau, but provincial authorities may have been involved and there may also
have been more speculative hoarding by consumers, traders and others. We
expect much of the material to trickle back into the market in the coming years,
but crucially, as we explain later in this review, we do not expect China to return
to being a major net exporter of lead to the west.
Supply − constraints will soon re-emerge
Just as demand has fallen short of our earlier expectations, so we now forecast a
larger decline in world lead production in 2009. Developments this year have
also exposed a key vulnerability of the supply side of the lead market, namely its
heavy dependence on the massive Chinese smelting industry. Already last year
China accounted for 37% of total refined production and fully 60% of primary
output, and both shares will be even higher in 2009. So it is no surprise that the
lead price spiked in Q3 on news that pollution incidents had forced the
closure of several smelters with combined capacity of at least 0.275mtpa,
and on fears of more to come as the authorities intensify environmental
surveillance. The current situation is uncertain, but we doubt that the ultimate
impact on Chinese production will be huge. Some plants may shut permanently
but there is ample spare capacity and new, cleaner smelters are coming
onstream all the time. Nevertheless, there are clear risks in over-reliance on the
Chinese industry.
We now forecast that total world refined lead production will fall by 4% in 2009.
Even normally steadily rising secondary output may dip due to slower growth in
China, the closure of a few plants elsewhere and the reduced availability of
scrap batteries earlier in the year. But even so, we expect the secondary sector
to account for a record 57% of total production in 2009. This high share is
significant because the secondary sector has limited sensitivity to the lead price.
As the bulk of scrap is generated from spent vehicle batteries, the collection of
which is mandatory by law in many countries, the pool will continue to expand,
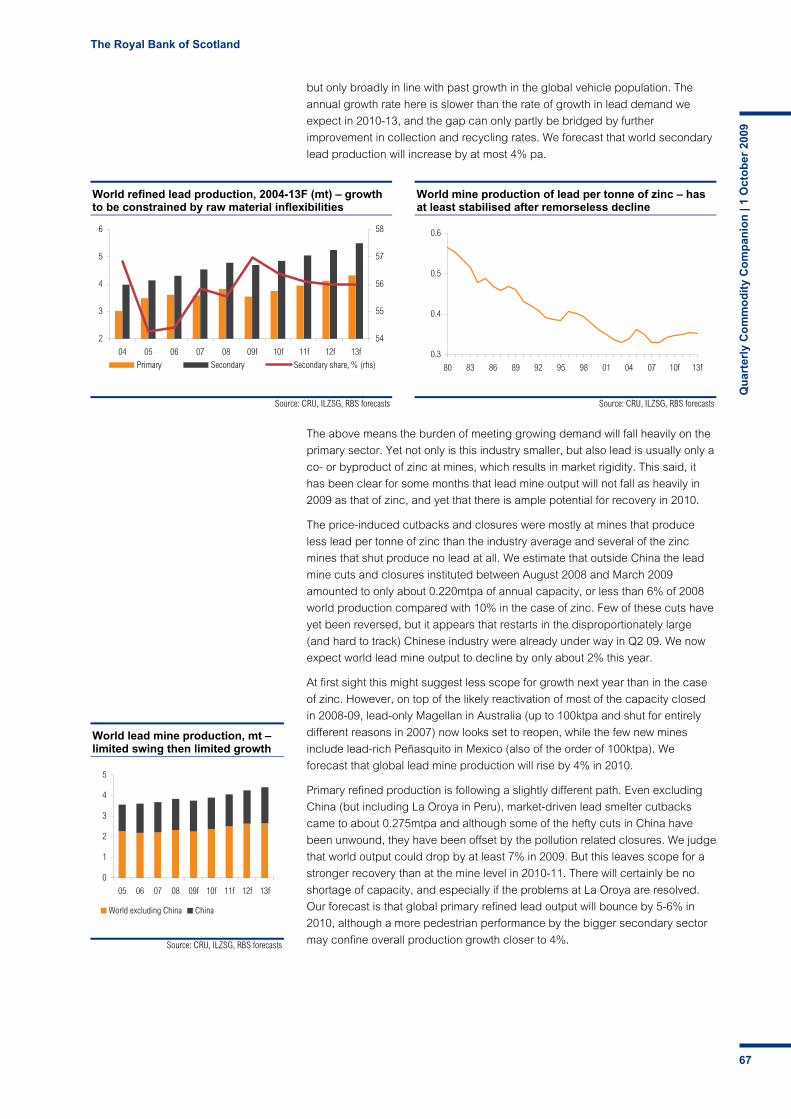
The Royal Bank of Scotland
Qu
arte
rly
Co
mm
od
ity
Co
mp
anio
n |
1 O
cto
ber
200
9
67
Source: CRU, ILZSG, RBS forecasts
World refined lead production, 2004-13F (mt) – growth to be constrained by raw material inflexibilities
2
3
4
5
6
04 05 06 07 08 09f 10f 11f 12f 13f
54
55
56
57
58
Primary Secondary Secondary share, % (rhs)
Source: CRU, ILZSG, RBS forecasts
World mine production of lead per tonne of zinc – has at least stabilised after remorseless decline
0.3
0.4
0.5
0.6
80 83 86 89 92 95 98 01 04 07 10f 13f
Source: CRU, ILZSG, RBS forecasts
World lead mine production, mt – limited swing then limited growth
0
1
2
3
4
5
05 06 07 08 09f 10f 11f 12f 13f
World excluding China China
but only broadly in line with past growth in the global vehicle population. The
annual growth rate here is slower than the rate of growth in lead demand we
expect in 2010-13, and the gap can only partly be bridged by further
improvement in collection and recycling rates. We forecast that world secondary
lead production will increase by at most 4% pa.
The above means the burden of meeting growing demand will fall heavily on the
primary sector. Yet not only is this industry smaller, but also lead is usually only a
co- or byproduct of zinc at mines, which results in market rigidity. This said, it
has been clear for some months that lead mine output will not fall as heavily in
2009 as that of zinc, and yet that there is ample potential for recovery in 2010.
The price-induced cutbacks and closures were mostly at mines that produce
less lead per tonne of zinc than the industry average and several of the zinc
mines that shut produce no lead at all. We estimate that outside China the lead
mine cuts and closures instituted between August 2008 and March 2009
amounted to only about 0.220mtpa of annual capacity, or less than 6% of 2008
world production compared with 10% in the case of zinc. Few of these cuts have
yet been reversed, but it appears that restarts in the disproportionately large
(and hard to track) Chinese industry were already under way in Q2 09. We now
expect world lead mine output to decline by only about 2% this year.
At first sight this might suggest less scope for growth next year than in the case
of zinc. However, on top of the likely reactivation of most of the capacity closed
in 2008-09, lead-only Magellan in Australia (up to 100ktpa and shut for entirely
different reasons in 2007) now looks set to reopen, while the few new mines
include lead-rich Peñasquito in Mexico (also of the order of 100ktpa). We
forecast that global lead mine production will rise by 4% in 2010.
Primary refined production is following a slightly different path. Even excluding
China (but including La Oroya in Peru), market-driven lead smelter cutbacks
came to about 0.275mtpa and although some of the hefty cuts in China have
been unwound, they have been offset by the pollution related closures. We judge
that world output could drop by at least 7% in 2009. But this leaves scope for a
stronger recovery than at the mine level in 2010-11. There will certainly be no
shortage of capacity, and especially if the problems at La Oroya are resolved.
Our forecast is that global primary refined lead output will bounce by 5-6% in
2010, although a more pedestrian performance by the bigger secondary sector
may confine overall production growth closer to 4%.
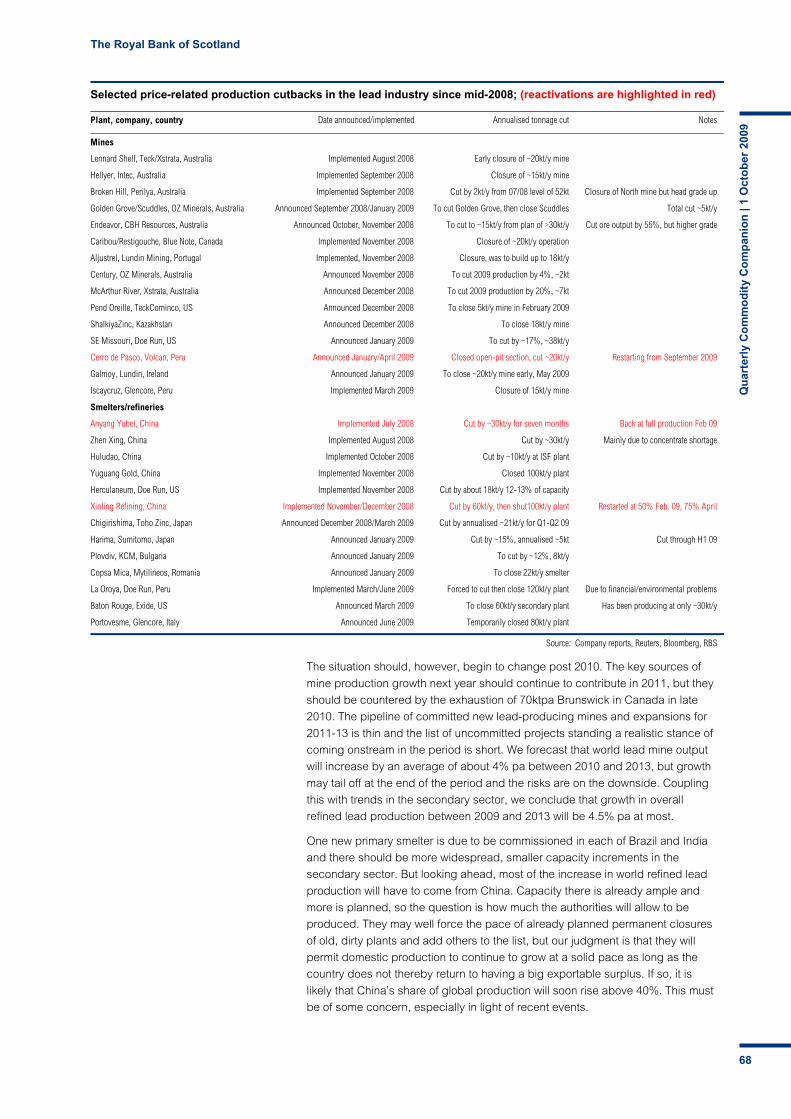
The Royal Bank of Scotland
Qu
arte
rly
Co
mm
od
ity
Co
mp
anio
n |
1 O
cto
ber
200
9
68
The situation should, however, begin to change post 2010. The key sources of
mine production growth next year should continue to contribute in 2011, but they
should be countered by the exhaustion of 70ktpa Brunswick in Canada in late
2010. The pipeline of committed new lead-producing mines and expansions for
2011-13 is thin and the list of uncommitted projects standing a realistic stance of
coming onstream in the period is short. We forecast that world lead mine output
will increase by an average of about 4% pa between 2010 and 2013, but growth
may tail off at the end of the period and the risks are on the downside. Coupling
this with trends in the secondary sector, we conclude that growth in overall
refined lead production between 2009 and 2013 will be 4.5% pa at most.
One new primary smelter is due to be commissioned in each of Brazil and India
and there should be more widespread, smaller capacity increments in the
secondary sector. But looking ahead, most of the increase in world refined lead
production will have to come from China. Capacity there is already ample and
more is planned, so the question is how much the authorities will allow to be
produced. They may well force the pace of already planned permanent closures
of old, dirty plants and add others to the list, but our judgment is that they will
permit domestic production to continue to grow at a solid pace as long as the
country does not thereby return to having a big exportable surplus. If so, it is
likely that China’s share of global production will soon rise above 40%. This must
be of some concern, especially in light of recent events.
Selected price-related production cutbacks in the lead industry since mid-2008; (reactivations are highlighted in red)
Plant, company, country Date announced/implemented Annualised tonnage cut Notes
Mines
Lennard Shelf, Teck/Xstrata, Australia Implemented August 2008 Early closure of ~20kt/y mine
Hellyer, Intec, Australia Implemented September 2008 Closure of ~15kt/y mine
Broken Hill, Perilya, Australia Implemented September 2008 Cut by 2kt/y from 07/08 level of 52kt Closure of North mine but head grade up
Golden Grove/Scuddles, OZ Minerals, Australia Announced September 2008/January 2009 To cut Golden Grove, then close Scuddles Total cut ~5kt/y
Endeavor, CBH Resources, Australia Announced October, November 2008 To cut to ~15kt/y from plan of >30kt/y Cut ore output by 55%, but higher grade
Caribou/Restigouche, Blue Note, Canada Implemented November 2008 Closure of ~20kt/y operation
Aljustrel, Lundin Mining, Portugal Implemented, November 2008 Closure, was to build up to 18kt/y
Century, OZ Minerals, Australia Announced November 2008 To cut 2009 production by 4%, ~2kt
McArthur River, Xstrata, Australia Announced December 2008 To cut 2009 production by 20%, ~7kt
Pend Oreille, TeckCominco, US Announced December 2008 To close 5kt/y mine in February 2009
ShalkiyaZinc, Kazakhstan Announced December 2008 To close 18kt/y mine
SE Missouri, Doe Run, US Announced January 2009 To cut by ~17%, ~38kt/y
Cerro de Pasco, Volcan, Peru Announced January/April 2009 Closed open-pit section, cut ~20kt/y Restarting from September 2009
Galmoy, Lundin, Ireland Announced January 2009 To close ~20kt/y mine early, May 2009
Iscaycruz, Glencore, Peru Implemented March 2009 Closure of 15kt/y mine
Smelters/refineries
Anyang Yubei, China Implemented July 2008 Cut by ~30kt/y for seven months Back at full production Feb 09
Zhen Xing, China Implemented August 2008 Cut by ~30kt/y Mainly due to concentrate shortage
Huludao, China Implemented October 2008 Cut by ~10kt/y at ISF plant
Yuguang Gold, China Implemented November 2008 Closed 100kt/y plant
Herculaneum, Doe Run, US Implemented November 2008 Cut by about 18kt/y 12-13% of capacity
Xinling Refining, China Implemented November/December 2008 Cut by 60kt/y, then shut100kt/y plant Restarted at 50% Feb. 09, 75% April
Chigirishima, Toho Zinc, Japan Announced December 2008/March 2009 Cut by annualised ~21kt/y for Q1-Q2 09
Harima, Sumitomo, Japan Announced January 2009 Cut by ~15%, annualised ~5kt Cut through H1 09
Plovdiv, KCM, Bulgaria Announced January 2009 To cut by ~12%, 8kt/y
Copsa Mica, Mytilineos, Romania Announced January 2009 To close 22kt/y smelter
La Oroya, Doe Run, Peru Implemented March/June 2009 Forced to cut then close 120kt/y plant Due to financial/environmental problems
Baton Rouge, Exide, US Announced March 2009 To close 60kt/y secondary plant Has been producing at only ~30kt/y
Portovesme, Glencore, Italy Announced June 2009 Temporarily closed 80kt/y plant
Source: Company reports, Reuters, Bloomberg, RBS

The Royal Bank of Scotland
Qu
arte
rly
Co
mm
od
ity
Co
mp
anio
n |
1 O
cto
ber
200
9
69
Source: LME, RBS
LME lead inventories and spot lead price – stocks up sharply but still historically low
0
100,000
200,000
300,000
400,000
81 83 85 87 89 91 93 95 97 99 01 03 05 07 09
tonn
es
0
50
100
150
200
USc/
lb
LME stocks Monthly average spot LME price (rhs)
Source: LME, ILZSG, CRU, RBS forecasts
Lead stock:consumption ratio and real price – ratio to fall back sharply, price to rocket further
0
2
4
6
8
1980 1983 1987 1991 1995 1998 2002 2006 2010F 2013F
0
1,000
2,000
3,000
4,000
Stock:consumption ratio - weeks Real Prices US$/t (rhs)
Outlook – return to severe tightness by 2013
We believe the lead market faces the prospect of returning to the fundamental
tightness of 2006-07 by 2013. It is no longer the slow-growing market of past
decades, even if demand for lead is less cyclical than that for other metals.
Secondary production cannot on its own satisfy all the additional demand
through the cycle and the primary sector remains hampered by lead’s by- or at
best co-product status in most of the mining industry. It is hard to see mining
companies collectively retooling to prioritise lead any time soon. We forecast a
cumulative underlying deficit in 2011-13 of at least 0.225mt, which may take the
reported stocks to consumption ratio down towards just 1.5 weeks.
As to the shorter-term future, reported stocks may continue to tick up over the
next 6-12 months, especially if the unreported inventory that we believe built up
in 2008 and H1 09 (mainly in China) begins to trickle back into the market. But
despite the sharp rise on the LME this year, overall reported inventories remain
historically low and we do not expect the stock: consumption ratio to escalate
even to the levels of 2002 before it starts to decline steadily. For lead, the
transition year to supply deficit is 2010, in our view, sooner than for most metals.
Even after its impressive recovery this year, we believe the outlook for the lead
price remains bullish. The recent brief spike to about $2,500/t may be just a
taster of what is to come. Although the absolute peak of the last bull market (near
$4,000/t) may be out of reach, we forecast that the annual average LME cash
price will hit a new record high in 2013 of US$2,750/t, eclipsing that of 2007.
There may be a period of correction in 2010 (even though we expect it to be the
year in which the mean price records its largest yoy gain this cycle). But we
believe the biggest risk to our forecast profile is that price escalation will be
brought forward as investors anticipate severe market tightness.
In addition to substantial upward revisions to our short-to-medium term price
projections, we have raised our long-term average price forecast by fully 30% to
US$1,700/t. This reflects our belief that with demand trends firm and the
secondary sector able to contribute only so much, greatly increased investment
in the lead mining industry will be needed if the market is to reach a sustainable
balance. Our upgrade also reflects the recent weakening of the US dollar and
the strengthening of key producer currencies, notably the Australian dollar.
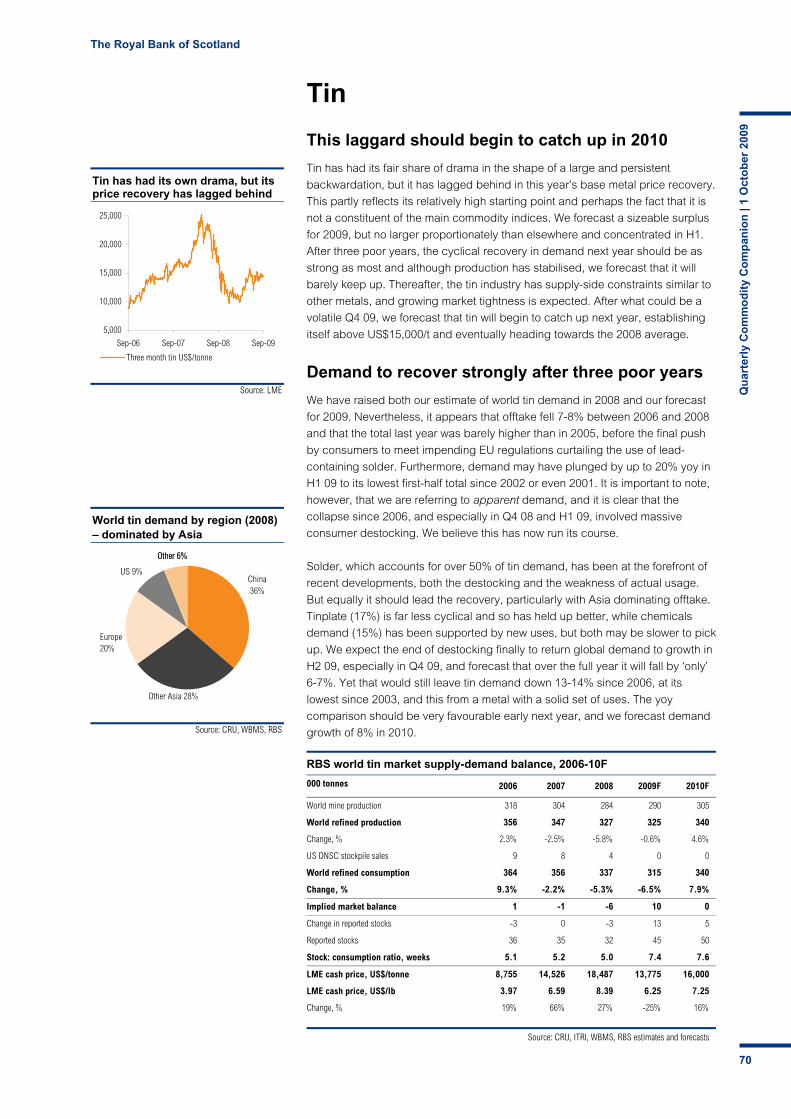
The Royal Bank of Scotland
Qu
arte
rly
Co
mm
od
ity
Co
mp
anio
n |
1 O
cto
ber
200
9
70
Source: LME
Tin has had its own drama, but its price recovery has lagged behind
5,000
10,000
15,000
20,000
25,000
Sep-06 Sep-07 Sep-08 Sep-09
Three month tin US$/tonne
Source: CRU, WBMS, RBS
World tin demand by region (2008) – dominated by Asia
China, 36%
Other Asia 28%
Europe, 20%
US, 9%Other, 6%
China 36%
Other Asia 28%
Europe20%
US 9%
Other 6%Other 6%
Tin
This laggard should begin to catch up in 2010
Tin has had its fair share of drama in the shape of a large and persistent
backwardation, but it has lagged behind in this year’s base metal price recovery.
This partly reflects its relatively high starting point and perhaps the fact that it is
not a constituent of the main commodity indices. We forecast a sizeable surplus
for 2009, but no larger proportionately than elsewhere and concentrated in H1.
After three poor years, the cyclical recovery in demand next year should be as
strong as most and although production has stabilised, we forecast that it will
barely keep up. Thereafter, the tin industry has supply-side constraints similar to
other metals, and growing market tightness is expected. After what could be a
volatile Q4 09, we forecast that tin will begin to catch up next year, establishing
itself above US$15,000/t and eventually heading towards the 2008 average.
Demand to recover strongly after three poor years
We have raised both our estimate of world tin demand in 2008 and our forecast
for 2009. Nevertheless, it appears that offtake fell 7-8% between 2006 and 2008
and that the total last year was barely higher than in 2005, before the final push
by consumers to meet impending EU regulations curtailing the use of lead-
containing solder. Furthermore, demand may have plunged by up to 20% yoy in
H1 09 to its lowest first-half total since 2002 or even 2001. It is important to note,
however, that we are referring to apparent demand, and it is clear that the
collapse since 2006, and especially in Q4 08 and H1 09, involved massive
consumer destocking. We believe this has now run its course.
Solder, which accounts for over 50% of tin demand, has been at the forefront of
recent developments, both the destocking and the weakness of actual usage.
But equally it should lead the recovery, particularly with Asia dominating offtake.
Tinplate (17%) is far less cyclical and so has held up better, while chemicals
demand (15%) has been supported by new uses, but both may be slower to pick
up. We expect the end of destocking finally to return global demand to growth in
H2 09, especially in Q4 09, and forecast that over the full year it will fall by ‘only’
6-7%. Yet that would still leave tin demand down 13-14% since 2006, at its
lowest since 2003, and this from a metal with a solid set of uses. The yoy
comparison should be very favourable early next year, and we forecast demand
growth of 8% in 2010.
RBS world tin market supply-demand balance, 2006-10F
000 tonnes 2006 2007 2008 2009F 2010F
World mine production 318 304 284 290 305
World refined production 356 347 327 325 340
Change, % 2.3% -2.5% -5.8% -0.6% 4.6%
US DNSC stockpile sales 9 8 4 0 0
World refined consumption 364 356 337 315 340
Change, % 9.3% -2.2% -5.3% -6.5% 7.9%
Implied market balance 1 -1 -6 10 0
Change in reported stocks -3 0 -3 13 5
Reported stocks 36 35 32 45 50
Stock: consumption ratio, weeks 5.1 5.2 5.0 7.4 7.6
LME cash price, US$/tonne 8,755 14,526 18,487 13,775 16,000
LME cash price, US$/lb 3.97 6.59 8.39 6.25 7.25
Change, % 19% 66% 27% -25% 16%
Source: CRU, ITRI, WBMS, RBS estimates and forecasts
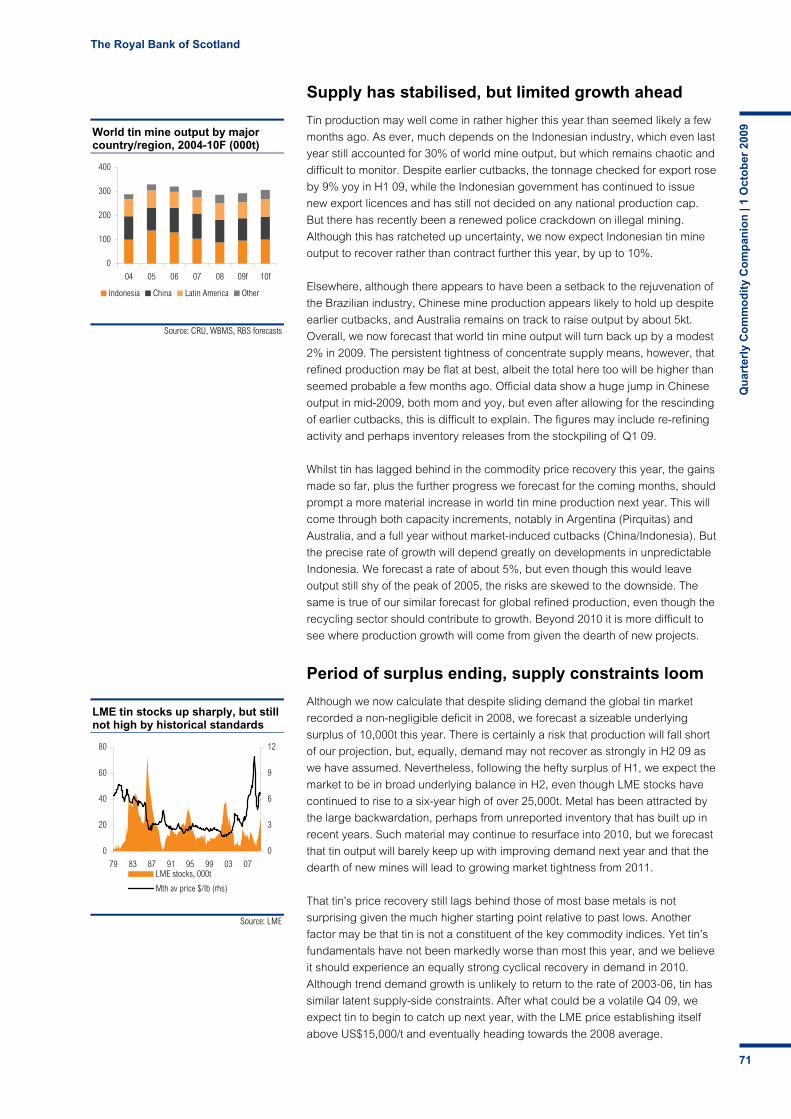
The Royal Bank of Scotland
Qu
arte
rly
Co
mm
od
ity
Co
mp
anio
n |
1 O
cto
ber
200
9
71
Source: LME
LME tin stocks up sharply, but still not high by historical standards
0
20
40
60
80
79 83 87 91 95 99 03 07
0
3
6
9
12
LME stocks, 000t
Mth av price $/lb (rhs)
Source: CRU, WBMS, RBS forecasts
World tin mine output by major country/region, 2004-10F (000t)
0
100
200
300
400
04 05 06 07 08 09f 10f
Indonesia China Latin America Other
Supply has stabilised, but limited growth ahead
Tin production may well come in rather higher this year than seemed likely a few
months ago. As ever, much depends on the Indonesian industry, which even last
year still accounted for 30% of world mine output, but which remains chaotic and
difficult to monitor. Despite earlier cutbacks, the tonnage checked for export rose
by 9% yoy in H1 09, while the Indonesian government has continued to issue
new export licences and has still not decided on any national production cap.
But there has recently been a renewed police crackdown on illegal mining.
Although this has ratcheted up uncertainty, we now expect Indonesian tin mine
output to recover rather than contract further this year, by up to 10%.
Elsewhere, although there appears to have been a setback to the rejuvenation of
the Brazilian industry, Chinese mine production appears likely to hold up despite
earlier cutbacks, and Australia remains on track to raise output by about 5kt.
Overall, we now forecast that world tin mine output will turn back up by a modest
2% in 2009. The persistent tightness of concentrate supply means, however, that
refined production may be flat at best, albeit the total here too will be higher than
seemed probable a few months ago. Official data show a huge jump in Chinese
output in mid-2009, both mom and yoy, but even after allowing for the rescinding
of earlier cutbacks, this is difficult to explain. The figures may include re-refining
activity and perhaps inventory releases from the stockpiling of Q1 09.
Whilst tin has lagged behind in the commodity price recovery this year, the gains
made so far, plus the further progress we forecast for the coming months, should
prompt a more material increase in world tin mine production next year. This will
come through both capacity increments, notably in Argentina (Pirquitas) and
Australia, and a full year without market-induced cutbacks (China/Indonesia). But
the precise rate of growth will depend greatly on developments in unpredictable
Indonesia. We forecast a rate of about 5%, but even though this would leave
output still shy of the peak of 2005, the risks are skewed to the downside. The
same is true of our similar forecast for global refined production, even though the
recycling sector should contribute to growth. Beyond 2010 it is more difficult to
see where production growth will come from given the dearth of new projects.
Period of surplus ending, supply constraints loom
Although we now calculate that despite sliding demand the global tin market
recorded a non-negligible deficit in 2008, we forecast a sizeable underlying
surplus of 10,000t this year. There is certainly a risk that production will fall short
of our projection, but, equally, demand may not recover as strongly in H2 09 as
we have assumed. Nevertheless, following the hefty surplus of H1, we expect the
market to be in broad underlying balance in H2, even though LME stocks have
continued to rise to a six-year high of over 25,000t. Metal has been attracted by
the large backwardation, perhaps from unreported inventory that has built up in
recent years. Such material may continue to resurface into 2010, but we forecast
that tin output will barely keep up with improving demand next year and that the
dearth of new mines will lead to growing market tightness from 2011.
That tin’s price recovery still lags behind those of most base metals is not
surprising given the much higher starting point relative to past lows. Another
factor may be that tin is not a constituent of the key commodity indices. Yet tin’s
fundamentals have not been markedly worse than most this year, and we believe
it should experience an equally strong cyclical recovery in demand in 2010.
Although trend demand growth is unlikely to return to the rate of 2003-06, tin has
similar latent supply-side constraints. After what could be a volatile Q4 09, we
expect tin to begin to catch up next year, with the LME price establishing itself
above US$15,000/t and eventually heading towards the 2008 average.
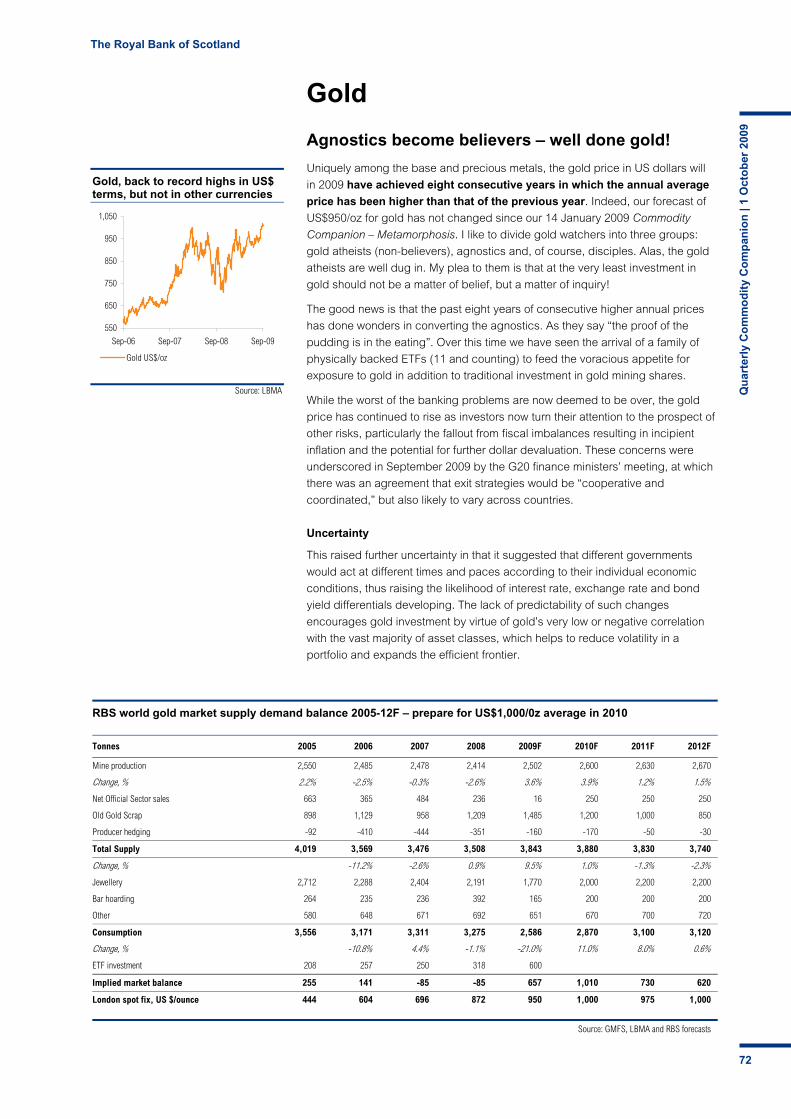
The Royal Bank of Scotland
Qu
arte
rly
Co
mm
od
ity
Co
mp
anio
n |
1 O
cto
ber
200
9
72
Source: LBMA
Gold, back to record highs in US$ terms, but not in other currencies
550
650
750
850
950
1,050
Sep-06 Sep-07 Sep-08 Sep-09
Gold US$/oz
RBS world gold market supply demand balance 2005-12F – prepare for US$1,000/0z average in 2010
Tonnes 2005 2006 2007 2008 2009F 2010F 2011F 2012F
Mine production 2,550 2,485 2,478 2,414 2,502 2,600 2,630 2,670
Change, % 2.2% -2.5% -0.3% -2.6% 3.6% 3.9% 1.2% 1.5%
Net Official Sector sales 663 365 484 236 16 250 250 250
Old Gold Scrap 898 1,129 958 1,209 1,485 1,200 1,000 850
Producer hedging -92 -410 -444 -351 -160 -170 -50 -30
Total Supply 4,019 3,569 3,476 3,508 3,843 3,880 3,830 3,740
Change, % -11.2% -2.6% 0.9% 9.5% 1.0% -1.3% -2.3%
Jewellery 2,712 2,288 2,404 2,191 1,770 2,000 2,200 2,200
Bar hoarding 264 235 236 392 165 200 200 200
Other 580 648 671 692 651 670 700 720
Consumption 3,556 3,171 3,311 3,275 2,586 2,870 3,100 3,120
Change, % -10.8% 4.4% -1.1% -21.0% 11.0% 8.0% 0.6%
ETF investment 208 257 250 318 600
Implied market balance 255 141 -85 -85 657 1,010 730 620
London spot fix, US $/ounce 444 604 696 872 950 1,000 975 1,000
Source: GMFS, LBMA and RBS forecasts
Gold
Agnostics become believers – well done gold!
Uniquely among the base and precious metals, the gold price in US dollars will
in 2009 have achieved eight consecutive years in which the annual average
price has been higher than that of the previous year. Indeed, our forecast of
US$950/oz for gold has not changed since our 14 January 2009 Commodity
Companion – Metamorphosis. I like to divide gold watchers into three groups:
gold atheists (non-believers), agnostics and, of course, disciples. Alas, the gold
atheists are well dug in. My plea to them is that at the very least investment in
gold should not be a matter of belief, but a matter of inquiry!
The good news is that the past eight years of consecutive higher annual prices
has done wonders in converting the agnostics. As they say “the proof of the
pudding is in the eating”. Over this time we have seen the arrival of a family of
physically backed ETFs (11 and counting) to feed the voracious appetite for
exposure to gold in addition to traditional investment in gold mining shares.
While the worst of the banking problems are now deemed to be over, the gold
price has continued to rise as investors now turn their attention to the prospect of
other risks, particularly the fallout from fiscal imbalances resulting in incipient
inflation and the potential for further dollar devaluation. These concerns were
underscored in September 2009 by the G20 finance ministers’ meeting, at which
there was an agreement that exit strategies would be “cooperative and
coordinated,” but also likely to vary across countries.
Uncertainty
This raised further uncertainty in that it suggested that different governments
would act at different times and paces according to their individual economic
conditions, thus raising the likelihood of interest rate, exchange rate and bond
yield differentials developing. The lack of predictability of such changes
encourages gold investment by virtue of gold’s very low or negative correlation
with the vast majority of asset classes, which helps to reduce volatility in a
portfolio and expands the efficient frontier.
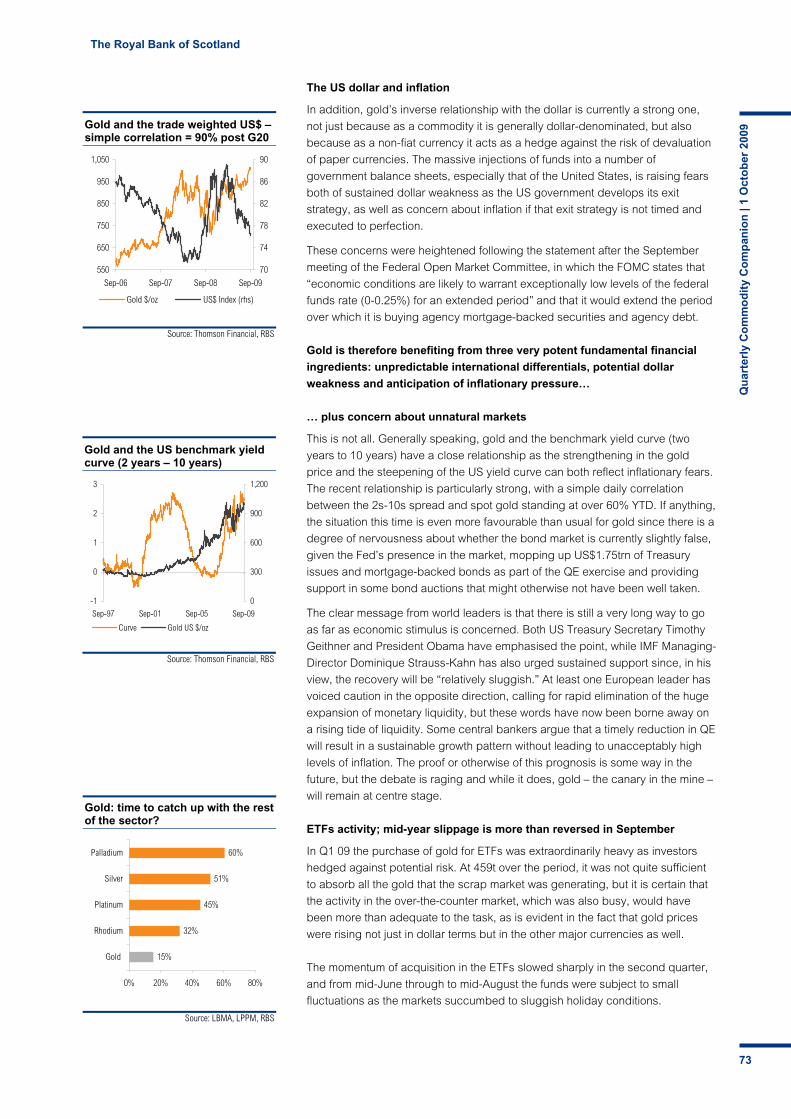
The Royal Bank of Scotland
Qu
arte
rly
Co
mm
od
ity
Co
mp
anio
n |
1 O
cto
ber
200
9
73
Source: Thomson Financial, RBS
Gold and the US benchmark yield curve (2 years – 10 years)
-1
0
1
2
3
Sep-97 Sep-01 Sep-05 Sep-09
0
300
600
900
1,200
Curve Gold US $/oz
Source: LBMA, LPPM, RBS
Gold: time to catch up with the rest of the sector?
15%
32%
45%
51%
60%
0% 20% 40% 60% 80%
Gold
Rhodium
Platinum
Silver
Palladium
Source: Thomson Financial, RBS
Gold and the trade weighted US$ – simple correlation = 90% post G20
550
650
750
850
950
1,050
Sep-06 Sep-07 Sep-08 Sep-09
70
74
78
82
86
90
Gold $/oz US$ Index (rhs)
The US dollar and inflation
In addition, gold’s inverse relationship with the dollar is currently a strong one,
not just because as a commodity it is generally dollar-denominated, but also
because as a non-fiat currency it acts as a hedge against the risk of devaluation
of paper currencies. The massive injections of funds into a number of
government balance sheets, especially that of the United States, is raising fears
both of sustained dollar weakness as the US government develops its exit
strategy, as well as concern about inflation if that exit strategy is not timed and
executed to perfection.
These concerns were heightened following the statement after the September
meeting of the Federal Open Market Committee, in which the FOMC states that
“economic conditions are likely to warrant exceptionally low levels of the federal
funds rate (0-0.25%) for an extended period” and that it would extend the period
over which it is buying agency mortgage-backed securities and agency debt.
Gold is therefore benefiting from three very potent fundamental financial
ingredients: unpredictable international differentials, potential dollar
weakness and anticipation of inflationary pressure…
… plus concern about unnatural markets
This is not all. Generally speaking, gold and the benchmark yield curve (two
years to 10 years) have a close relationship as the strengthening in the gold
price and the steepening of the US yield curve can both reflect inflationary fears.
The recent relationship is particularly strong, with a simple daily correlation
between the 2s-10s spread and spot gold standing at over 60% YTD. If anything,
the situation this time is even more favourable than usual for gold since there is a
degree of nervousness about whether the bond market is currently slightly false,
given the Fed’s presence in the market, mopping up US$1.75trn of Treasury
issues and mortgage-backed bonds as part of the QE exercise and providing
support in some bond auctions that might otherwise not have been well taken.
The clear message from world leaders is that there is still a very long way to go
as far as economic stimulus is concerned. Both US Treasury Secretary Timothy
Geithner and President Obama have emphasised the point, while IMF Managing-
Director Dominique Strauss-Kahn has also urged sustained support since, in his
view, the recovery will be “relatively sluggish.” At least one European leader has
voiced caution in the opposite direction, calling for rapid elimination of the huge
expansion of monetary liquidity, but these words have now been borne away on
a rising tide of liquidity. Some central bankers argue that a timely reduction in QE
will result in a sustainable growth pattern without leading to unacceptably high
levels of inflation. The proof or otherwise of this prognosis is some way in the
future, but the debate is raging and while it does, gold – the canary in the mine –
will remain at centre stage.
ETFs activity; mid-year slippage is more than reversed in September
In Q1 09 the purchase of gold for ETFs was extraordinarily heavy as investors
hedged against potential risk. At 459t over the period, it was not quite sufficient
to absorb all the gold that the scrap market was generating, but it is certain that
the activity in the over-the-counter market, which was also busy, would have
been more than adequate to the task, as is evident in the fact that gold prices
were rising not just in dollar terms but in the other major currencies as well.
The momentum of acquisition in the ETFs slowed sharply in the second quarter,
and from mid-June through to mid-August the funds were subject to small
fluctuations as the markets succumbed to sluggish holiday conditions.
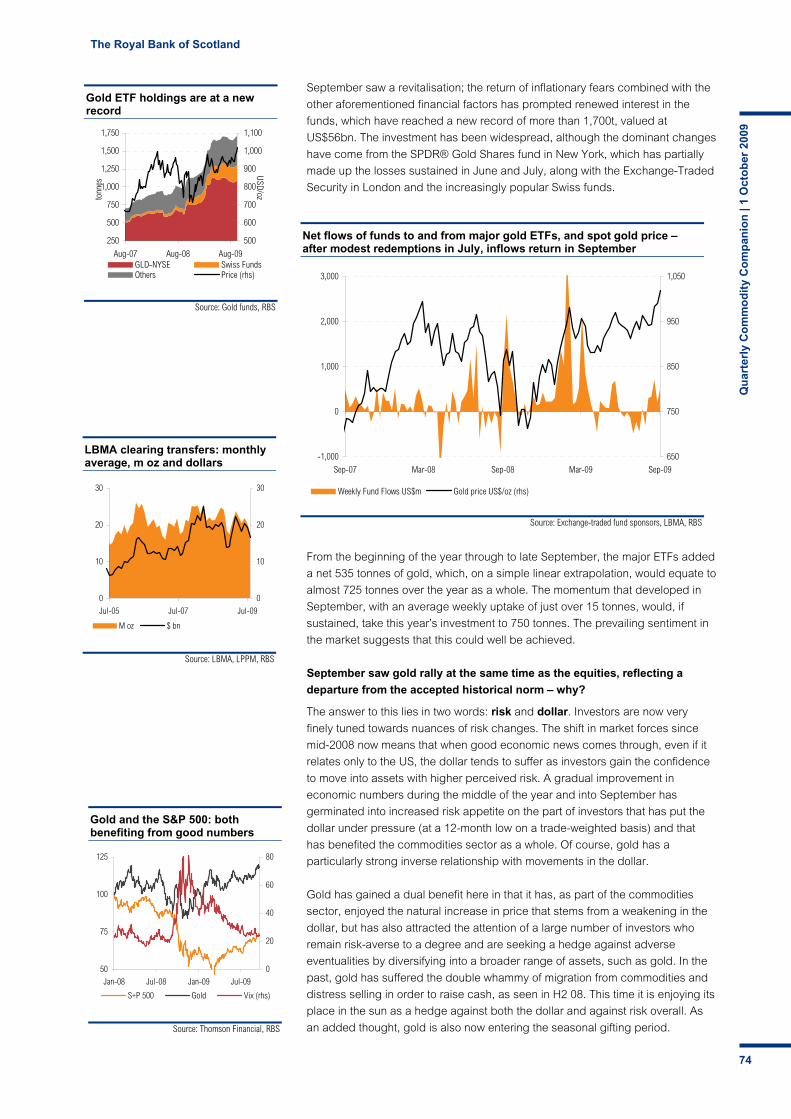
The Royal Bank of Scotland
Qu
arte
rly
Co
mm
od
ity
Co
mp
anio
n |
1 O
cto
ber
200
9
74
Source: Thomson Financial, RBS
Gold and the S&P 500: both benefiting from good numbers
50
75
100
125
Jan-08 Jul-08 Jan-09 Jul-09
0
20
40
60
80
S+P 500 Gold Vix (rhs)
Source: Exchange-traded fund sponsors, LBMA, RBS
Net flows of funds to and from major gold ETFs, and spot gold price – after modest redemptions in July, inflows return in September
-1,000
0
1,000
2,000
3,000
Sep-07 Mar-08 Sep-08 Mar-09 Sep-09
650
750
850
950
1,050
Weekly Fund Flows US$m Gold price US$/oz (rhs)
Source: LBMA, LPPM, RBS
LBMA clearing transfers: monthly average, m oz and dollars
0
10
20
30
Jul-05 Jul-07 Jul-09
0
10
20
30
M oz $ bn
Source: Gold funds, RBS
Gold ETF holdings are at a new record
250
500
750
1,000
1,250
1,500
1,750
Aug-07 Aug-08 Aug-09
tonn
es
500
600
700
800
900
1,000
1,100
USD/oz
GLD-NYSE Swiss FundsOthers Price (rhs)
September saw a revitalisation; the return of inflationary fears combined with the
other aforementioned financial factors has prompted renewed interest in the
funds, which have reached a new record of more than 1,700t, valued at
US$56bn. The investment has been widespread, although the dominant changes
have come from the SPDR® Gold Shares fund in New York, which has partially
made up the losses sustained in June and July, along with the Exchange-Traded
Security in London and the increasingly popular Swiss funds.
From the beginning of the year through to late September, the major ETFs added
a net 535 tonnes of gold, which, on a simple linear extrapolation, would equate to
almost 725 tonnes over the year as a whole. The momentum that developed in
September, with an average weekly uptake of just over 15 tonnes, would, if
sustained, take this year’s investment to 750 tonnes. The prevailing sentiment in
the market suggests that this could well be achieved.
September saw gold rally at the same time as the equities, reflecting a
departure from the accepted historical norm – why?
The answer to this lies in two words: risk and dollar. Investors are now very
finely tuned towards nuances of risk changes. The shift in market forces since
mid-2008 now means that when good economic news comes through, even if it
relates only to the US, the dollar tends to suffer as investors gain the confidence
to move into assets with higher perceived risk. A gradual improvement in
economic numbers during the middle of the year and into September has
germinated into increased risk appetite on the part of investors that has put the
dollar under pressure (at a 12-month low on a trade-weighted basis) and that
has benefited the commodities sector as a whole. Of course, gold has a
particularly strong inverse relationship with movements in the dollar.
Gold has gained a dual benefit here in that it has, as part of the commodities
sector, enjoyed the natural increase in price that stems from a weakening in the
dollar, but has also attracted the attention of a large number of investors who
remain risk-averse to a degree and are seeking a hedge against adverse
eventualities by diversifying into a broader range of assets, such as gold. In the
past, gold has suffered the double whammy of migration from commodities and
distress selling in order to raise cash, as seen in H2 08. This time it is enjoying its
place in the sun as a hedge against both the dollar and against risk overall. As
an added thought, gold is also now entering the seasonal gifting period.

The Royal Bank of Scotland
Qu
arte
rly
Co
mm
od
ity
Co
mp
anio
n |
1 O
cto
ber
200
9
75
Source: GFMS, WGC and RBS
Annual gold sales under CBGA 1 & 2. Sales in 2008-09 were less than 160t, the lowest in 10 years. Ceiling for CBGA3 reduced from 500 tpa to 400 tpa
0
100
200
300
400
500
600
99-00 00-01 01-02 02-03 03-04 04-05 05-06 06-07 07-08 08-09 09-10 09-11
Tonn
es
200
300
400
500
600
700
800
900
US$/oz
Total gold sales Sales Ceiling Average Gold Price (rhs)
Source: CFTC, RBS
Net speculative long position on COMEX surges to record high
100
300
500
700
900
Sep-05 Sep-07 Sep-09
300
500
700
900
1,100
Tonnes Price US$/oz (rhs)
Source: WGC, IMF RBS
Major central bank gold holdings, September 2009
US27%
IMF11%
Italy8%
France8%
Other 34%
Germany12%
US27%
Germany11%
IMF11%
Italy8%
France8%
Other 35%
Speculators as enthusiastic as investors; gold net longs were also at a
record in late September. Will this party lead to a hangover?
The speculative long position on COMEX also drifted lower during the latter part
of June, but began to pick up in July, a month before the professional investment
market took a renewed interest in gold. In late September, the net position was a
record 895 tonnes, comprising 1,057 tonnes of longs (also a record) and 162
tonnes of shorts. These figures are recorded on a weekly basis. The increase in
the net speculative position since the end of 2008 is 450 tonnes.
While the speculative position and the ETFs are ‘apples and pears’ since one is
physical and the other is a margined, paper position, the combined increase of
nearly 1,000 tonnes this year has been the key technical factor driving prices
higher. The essential question is whether the physical market can sustain these
higher prices from this point forward.
As we discuss next, we believe the answer is yes, and that the market will
challenge US$1,050/oz before year-end and maintain high prices through 2010;
much higher than that, however, is unlikely to be sustainable, in our view. The
key is to also look at gold in, say, euro terms, where gold is still more than 15%
below its record €790/oz price seen in March this year. To recapture that euro
high would require a translated price of US$1,150/oz.
The official sector – getting really interesting
The IMF may make up part of the likely CBGA3 shortfalls, always assuming
that its 403 tonnes of metal comes into the open market
The new Central Bank Gold Agreement (CBGA 3) commenced on 27 September
2009, with the same signatories as CBGA 2, but with an annual cap of 400
tonnes of gold sales, back to the level of CBGA 1, whereas CBGA 2 had been
500 tpa. The new agreement also removes restrictions on gold lending and
derivatives activity that were in place in the first two agreements. Sales under
CBGA 2 were less than 1,900 tonnes, nearly 620 tonnes (or about 25%) below
the nominated 2,500 quota.
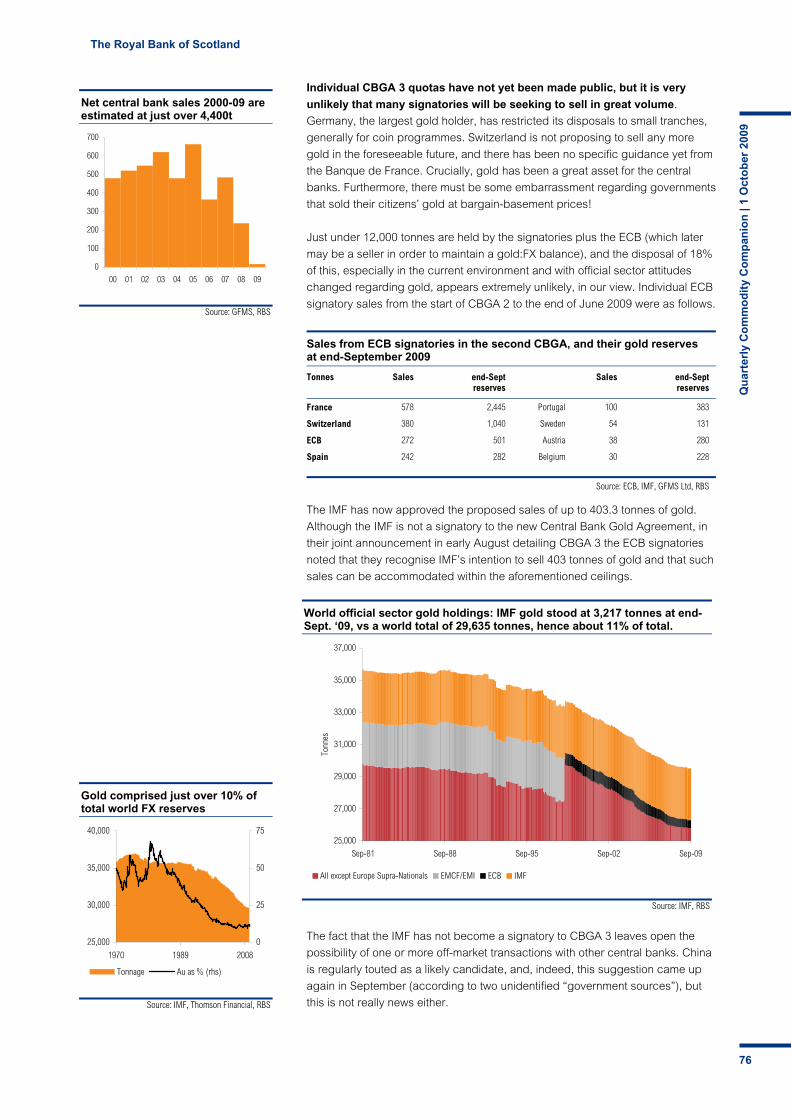
The Royal Bank of Scotland
Qu
arte
rly
Co
mm
od
ity
Co
mp
anio
n |
1 O
cto
ber
200
9
76
Source: IMF, Thomson Financial, RBS
Gold comprised just over 10% of total world FX reserves
25,000
30,000
35,000
40,000
1970 1989 2008
0
25
50
75
Tonnage Au as % (rhs)
Source: IMF, RBS
World official sector gold holdings: IMF gold stood at 3,217 tonnes at end-Sept. ‘09, vs a world total of 29,635 tonnes, hence about 11% of total.
25,000
27,000
29,000
31,000
33,000
35,000
37,000
Sep-81 Sep-88 Sep-95 Sep-02 Sep-09
Tonn
es
All except Europe Supra-Nationals EMCF/EMI ECB IMF
Individual CBGA 3 quotas have not yet been made public, but it is very
unlikely that many signatories will be seeking to sell in great volume.
Germany, the largest gold holder, has restricted its disposals to small tranches,
generally for coin programmes. Switzerland is not proposing to sell any more
gold in the foreseeable future, and there has been no specific guidance yet from
the Banque de France. Crucially, gold has been a great asset for the central
banks. Furthermore, there must be some embarrassment regarding governments
that sold their citizens’ gold at bargain-basement prices!
Just under 12,000 tonnes are held by the signatories plus the ECB (which later
may be a seller in order to maintain a gold:FX balance), and the disposal of 18%
of this, especially in the current environment and with official sector attitudes
changed regarding gold, appears extremely unlikely, in our view. Individual ECB
signatory sales from the start of CBGA 2 to the end of June 2009 were as follows.
The IMF has now approved the proposed sales of up to 403.3 tonnes of gold.
Although the IMF is not a signatory to the new Central Bank Gold Agreement, in
their joint announcement in early August detailing CBGA 3 the ECB signatories
noted that they recognise IMF’s intention to sell 403 tonnes of gold and that such
sales can be accommodated within the aforementioned ceilings.
The fact that the IMF has not become a signatory to CBGA 3 leaves open the
possibility of one or more off-market transactions with other central banks. China
is regularly touted as a likely candidate, and, indeed, this suggestion came up
again in September (according to two unidentified “government sources”), but
this is not really news either.
Sales from ECB signatories in the second CBGA, and their gold reserves at end-September 2009
Tonnes Sales end-Sept reserves
Sales end-Sept reserves
France 578 2,445 Portugal 100 383
Switzerland 380 1,040 Sweden 54 131
ECB 272 501 Austria 38 280
Spain 242 282 Belgium 30 228
Source: ECB, IMF, GFMS Ltd, RBS
Source: GFMS, RBS
Net central bank sales 2000-09 are estimated at just over 4,400t
0
100
200
300
400
500
600
700
00 01 02 03 04 05 06 07 08 09
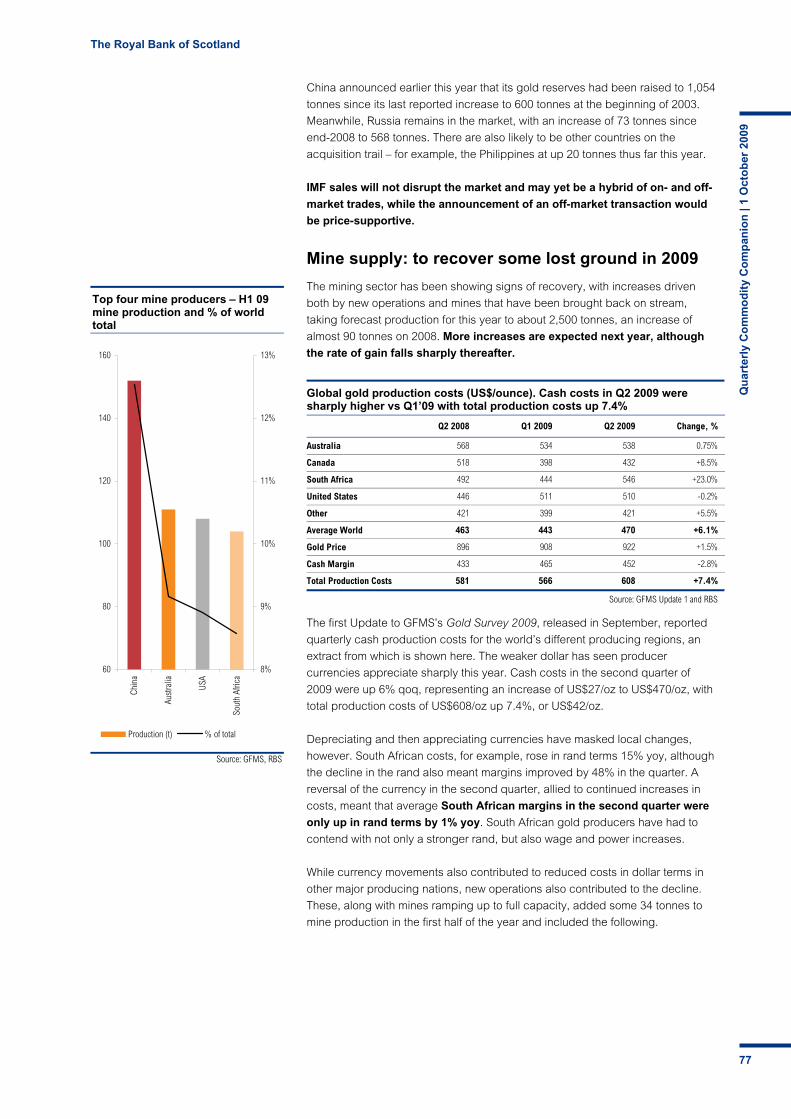
The Royal Bank of Scotland
Qu
arte
rly
Co
mm
od
ity
Co
mp
anio
n |
1 O
cto
ber
200
9
77
Source: GFMS, RBS
Top four mine producers – H1 09 mine production and % of world total
60
80
100
120
140
160
Chin
a
Aust
ralia
USA
Sout
h Af
rica
8%
9%
10%
11%
12%
13%
Production (t) % of total
China announced earlier this year that its gold reserves had been raised to 1,054
tonnes since its last reported increase to 600 tonnes at the beginning of 2003.
Meanwhile, Russia remains in the market, with an increase of 73 tonnes since
end-2008 to 568 tonnes. There are also likely to be other countries on the
acquisition trail – for example, the Philippines at up 20 tonnes thus far this year.
IMF sales will not disrupt the market and may yet be a hybrid of on- and off-
market trades, while the announcement of an off-market transaction would
be price-supportive.
Mine supply: to recover some lost ground in 2009
The mining sector has been showing signs of recovery, with increases driven
both by new operations and mines that have been brought back on stream,
taking forecast production for this year to about 2,500 tonnes, an increase of
almost 90 tonnes on 2008. More increases are expected next year, although
the rate of gain falls sharply thereafter.
The first Update to GFMS’s Gold Survey 2009, released in September, reported
quarterly cash production costs for the world’s different producing regions, an
extract from which is shown here. The weaker dollar has seen producer
currencies appreciate sharply this year. Cash costs in the second quarter of
2009 were up 6% qoq, representing an increase of US$27/oz to US$470/oz, with
total production costs of US$608/oz up 7.4%, or US$42/oz.
Depreciating and then appreciating currencies have masked local changes,
however. South African costs, for example, rose in rand terms 15% yoy, although
the decline in the rand also meant margins improved by 48% in the quarter. A
reversal of the currency in the second quarter, allied to continued increases in
costs, meant that average South African margins in the second quarter were
only up in rand terms by 1% yoy. South African gold producers have had to
contend with not only a stronger rand, but also wage and power increases.
While currency movements also contributed to reduced costs in dollar terms in
other major producing nations, new operations also contributed to the decline.
These, along with mines ramping up to full capacity, added some 34 tonnes to
mine production in the first half of the year and included the following.
Global gold production costs (US$/ounce). Cash costs in Q2 2009 were sharply higher vs Q1’09 with total production costs up 7.4%
Q2 2008 Q1 2009 Q2 2009 Change, %
Australia 568 534 538 0.75%
Canada 518 398 432 +8.5%
South Africa 492 444 546 +23.0%
United States 446 511 510 -0.2%
Other 421 399 421 +5.5%
Average World 463 443 470 +6.1%
Gold Price 896 908 922 +1.5%
Cash Margin 433 465 452 -2.8%
Total Production Costs 581 566 608 +7.4%
Source: GFMS Update 1 and RBS
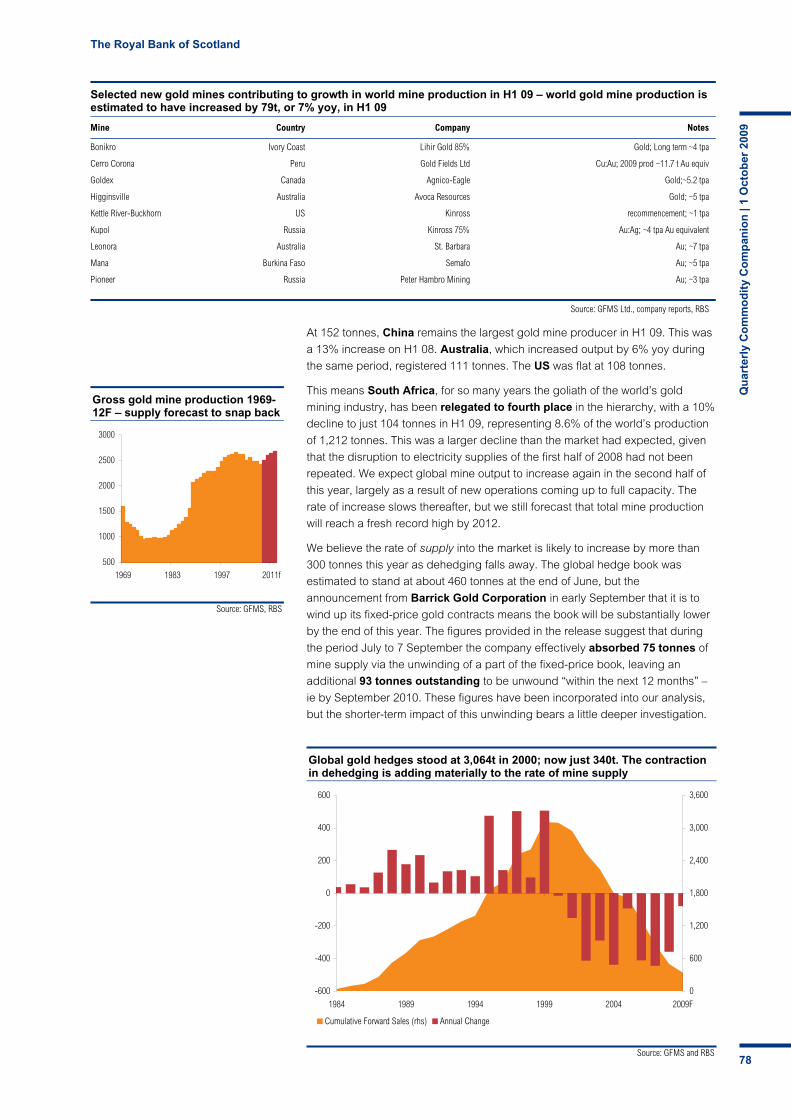
The Royal Bank of Scotland
Qu
arte
rly
Co
mm
od
ity
Co
mp
anio
n |
1 O
cto
ber
200
9
78Source: GFMS and RBS
Global gold hedges stood at 3,064t in 2000; now just 340t. The contraction in dehedging is adding materially to the rate of mine supply
-600
-400
-200
0
200
400
600
1984 1989 1994 1999 2004 2009F
0
600
1,200
1,800
2,400
3,000
3,600
Cumulative Forward Sales (rhs) Annual Change
Source: GFMS, RBS
Gross gold mine production 1969-12F – supply forecast to snap back
500
1000
1500
2000
2500
3000
1969 1983 1997 2011f
At 152 tonnes, China remains the largest gold mine producer in H1 09. This was
a 13% increase on H1 08. Australia, which increased output by 6% yoy during
the same period, registered 111 tonnes. The US was flat at 108 tonnes.
This means South Africa, for so many years the goliath of the world’s gold
mining industry, has been relegated to fourth place in the hierarchy, with a 10%
decline to just 104 tonnes in H1 09, representing 8.6% of the world’s production
of 1,212 tonnes. This was a larger decline than the market had expected, given
that the disruption to electricity supplies of the first half of 2008 had not been
repeated. We expect global mine output to increase again in the second half of
this year, largely as a result of new operations coming up to full capacity. The
rate of increase slows thereafter, but we still forecast that total mine production
will reach a fresh record high by 2012.
We believe the rate of supply into the market is likely to increase by more than
300 tonnes this year as dehedging falls away. The global hedge book was
estimated to stand at about 460 tonnes at the end of June, but the
announcement from Barrick Gold Corporation in early September that it is to
wind up its fixed-price gold contracts means the book will be substantially lower
by the end of this year. The figures provided in the release suggest that during
the period July to 7 September the company effectively absorbed 75 tonnes of
mine supply via the unwinding of a part of the fixed-price book, leaving an
additional 93 tonnes outstanding to be unwound “within the next 12 months” –
ie by September 2010. These figures have been incorporated into our analysis,
but the shorter-term impact of this unwinding bears a little deeper investigation.
Selected new gold mines contributing to growth in world mine production in H1 09 – world gold mine production is estimated to have increased by 79t, or 7% yoy, in H1 09
Mine Country Company Notes
Bonikro Ivory Coast Lihir Gold 85% Gold; Long term ~4 tpa
Cerro Corona Peru Gold Fields Ltd Cu:Au; 2009 prod ~11.7 t Au equiv
Goldex Canada Agnico-Eagle Gold;~5.2 tpa
Higginsville Australia Avoca Resources Gold; ~5 tpa
Kettle River-Buckhorn US Kinross recommencement; ~1 tpa
Kupol Russia Kinross 75% Au:Ag; ~4 tpa Au equivalent
Leonora Australia St. Barbara Au; ~7 tpa
Mana Burkina Faso Semafo Au; ~5 tpa
Pioneer Russia Peter Hambro Mining Au; ~3 tpa
Source: GFMS Ltd., company reports, RBS
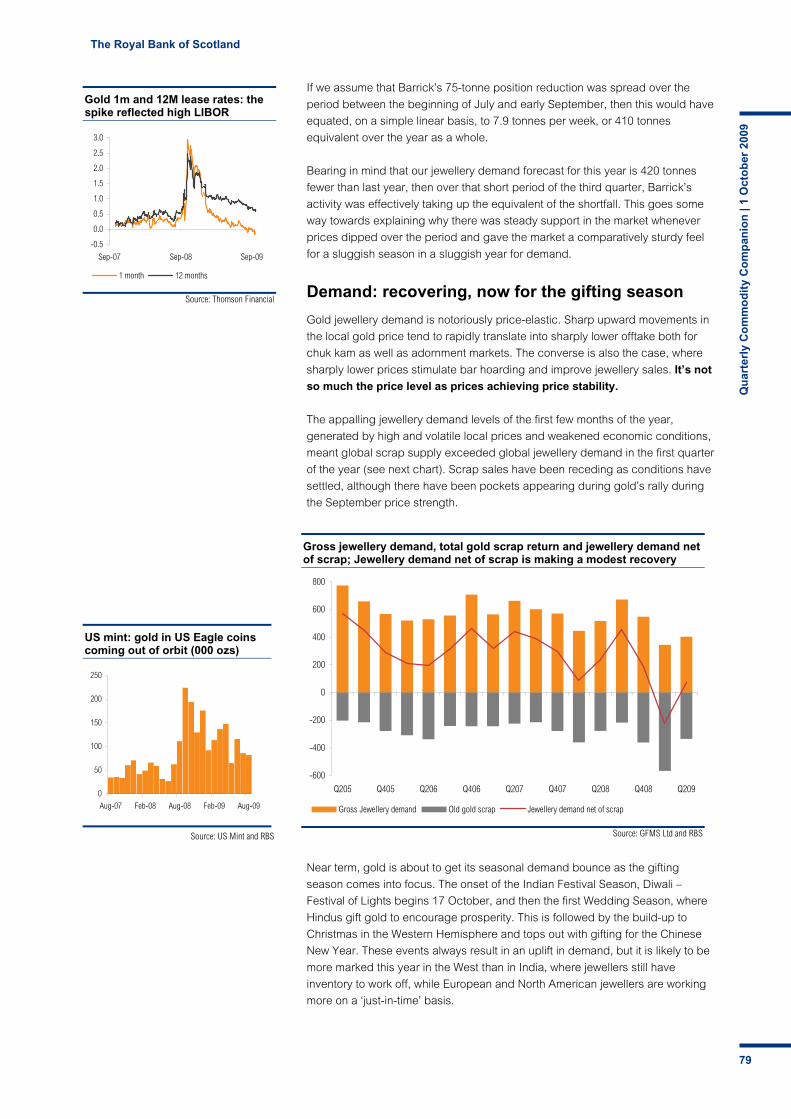
The Royal Bank of Scotland
Qu
arte
rly
Co
mm
od
ity
Co
mp
anio
n |
1 O
cto
ber
200
9
79
Source: US Mint and RBS
US mint: gold in US Eagle coins coming out of orbit (000 ozs)
0
50
100
150
200
250
Aug-07 Feb-08 Aug-08 Feb-09 Aug-09
Source: GFMS Ltd and RBS
Gross jewellery demand, total gold scrap return and jewellery demand net of scrap; Jewellery demand net of scrap is making a modest recovery
-600
-400
-200
0
200
400
600
800
Q205 Q405 Q206 Q406 Q207 Q407 Q208 Q408 Q209
Gross Jewellery demand Old gold scrap Jewellery demand net of scrap
Source: Thomson Financial
Gold 1m and 12M lease rates: the spike reflected high LIBOR
-0.5
0.0
0.5
1.0
1.5
2.0
2.5
3.0
Sep-07 Sep-08 Sep-09
1 month 12 months
If we assume that Barrick’s 75-tonne position reduction was spread over the
period between the beginning of July and early September, then this would have
equated, on a simple linear basis, to 7.9 tonnes per week, or 410 tonnes
equivalent over the year as a whole.
Bearing in mind that our jewellery demand forecast for this year is 420 tonnes
fewer than last year, then over that short period of the third quarter, Barrick’s
activity was effectively taking up the equivalent of the shortfall. This goes some
way towards explaining why there was steady support in the market whenever
prices dipped over the period and gave the market a comparatively sturdy feel
for a sluggish season in a sluggish year for demand.
Demand: recovering, now for the gifting season
Gold jewellery demand is notoriously price-elastic. Sharp upward movements in
the local gold price tend to rapidly translate into sharply lower offtake both for
chuk kam as well as adornment markets. The converse is also the case, where
sharply lower prices stimulate bar hoarding and improve jewellery sales. It’s not
so much the price level as prices achieving price stability.
The appalling jewellery demand levels of the first few months of the year,
generated by high and volatile local prices and weakened economic conditions,
meant global scrap supply exceeded global jewellery demand in the first quarter
of the year (see next chart). Scrap sales have been receding as conditions have
settled, although there have been pockets appearing during gold’s rally during
the September price strength.
Near term, gold is about to get its seasonal demand bounce as the gifting
season comes into focus. The onset of the Indian Festival Season, Diwali –
Festival of Lights begins 17 October, and then the first Wedding Season, where
Hindus gift gold to encourage prosperity. This is followed by the build-up to
Christmas in the Western Hemisphere and tops out with gifting for the Chinese
New Year. These events always result in an uplift in demand, but it is likely to be
more marked this year in the West than in India, where jewellers still have
inventory to work off, while European and North American jewellers are working
more on a ‘just-in-time’ basis.

The Royal Bank of Scotland
Qu
arte
rly
Co
mm
od
ity
Co
mp
anio
n |
1 O
cto
ber
200
9
80
Source: LBMA and RBS forecasts
Gold price in US dollars – real vs nominal, 1972 -2013F. Despite the rise, still plenty of upside in real terms -US$/oz
0
200
400
600
800
1,000
1,200
1,400
1,600
1,800
2,000
72 74 76 78 80 82 84 86 88 90 92 94 96 98 00 02 04 06 08 10F 12F
Real Nominal
The expected improvement in spending in the fourth quarter is likely, therefore,
to feed through to the international market relatively quickly – although gold has
lost some small market share to high-end silver prices and it is not yet clear
whether it can reclaim that lost ground.
We believe the gradual increase in consumer confidence, and the fact that price-
responsive buyers are becoming accustomed to higher price ranges, points to a
healthy improvement in activity in the fourth quarter, which should reinforce what
had been an important, but crumbling, prop of support in the market.
Our counsel is to have some gold exposure
We are absolutely wedded to our long-held bullishness for gold. There are many
strings to its bow. Some like its inverse relationship to the US dollar and are
buying it on expected further dollar weakness. Others hold gold as an inflation
hedge and fret about the re-appearance of inflation at both the headline and
core levels. Others like gold as a commodity, where it proves itself time and time
again. Indeed, what a timely reminder of man’s enduring desire for gold when in
September the UK’s largest-ever hoard of Anglo-Saxon gold was found in a
Staffordshire field. The 1,500 exquisite pieces of gold and silver, some bedecked
with jewels, date to the 7th century. The discovery comes a few months after the
discovery of the largest hoard of Iron Age gold coins, dated to 40 BC. It’s a
reminder of a time when gold was money and money was gold – a message to
us all in today’s ‘sophisticated’ world!
Gold has proved itself not to be a barbaric relic, but has come of age during this
crisis as a serious component to an investment portfolio. Governments are
stating that they will address the imbalances in the fiscal system, but the public
is somewhat sceptical about the likely outcome, and fears of inflation and
currency volatility should rightly sustain gold investment. Holdings in the
Exchange Traded Funds may see some slight erosion from time to time as part
of the normal course of market activity, but in general the metal is in firm hands.
Whether the funds can continue to sustain their rate of uptake is an important
question, and we have erred on the side of caution in that we are not looking for
a large-scale, investment-driven change of price range in the coming months,
but we do expect the market to sustain gold at its new higher levels, where
US$1,000/oz will be viewed as normal rather than abnormal!
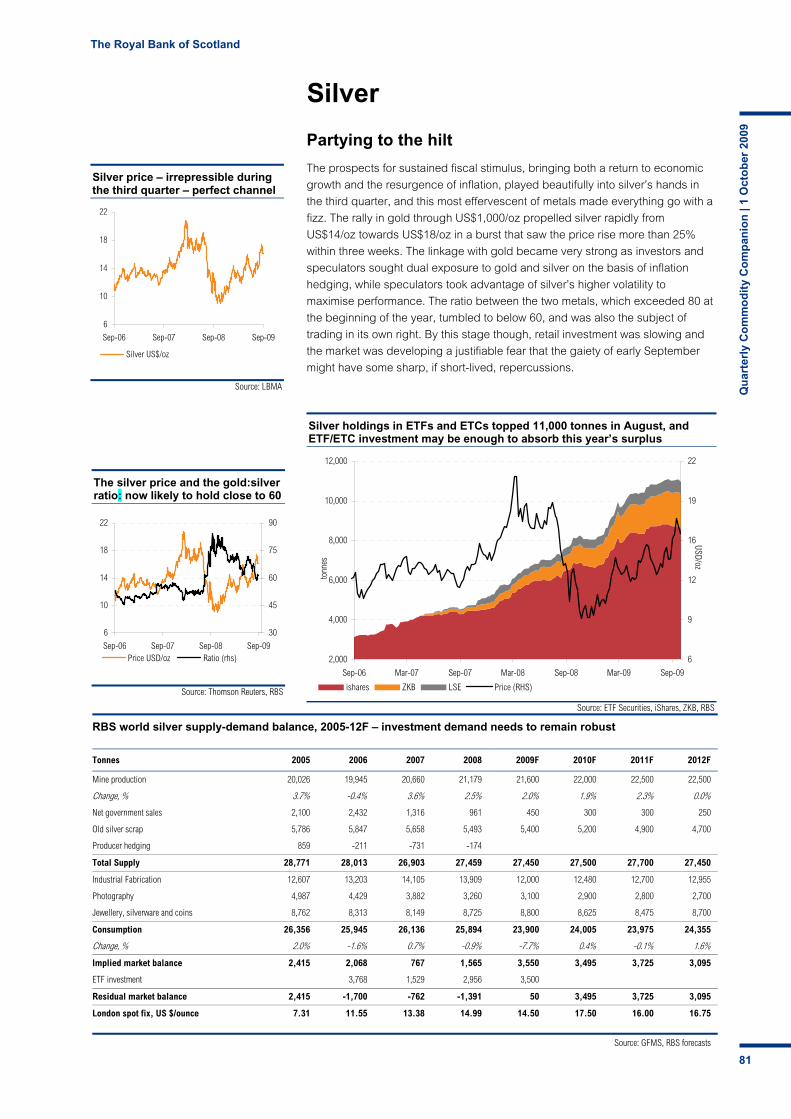
The Royal Bank of Scotland
Qu
arte
rly
Co
mm
od
ity
Co
mp
anio
n |
1 O
cto
ber
200
9
81
Source: ETF Securities, iShares, ZKB, RBS
Silver holdings in ETFs and ETCs topped 11,000 tonnes in August, and ETF/ETC investment may be enough to absorb this year’s surplus
2,000
4,000
6,000
8,000
10,000
12,000
Sep-06 Mar-07 Sep-07 Mar-08 Sep-08 Mar-09 Sep-09
tonn
es
6
9
12
16
19
22
USD/oz
ishares ZKB LSE Price (RHS)
Source: LBMA
Silver price – irrepressible during the third quarter – perfect channel
6
10
14
18
22
Sep-06 Sep-07 Sep-08 Sep-09
Silver US$/oz
Source: Thomson Reuters, RBS
The silver price and the gold:silver ratio: now likely to hold close to 60
6
10
14
18
22
Sep-06 Sep-07 Sep-08 Sep-09
30
45
60
75
90
Price USD/oz Ratio (rhs)
RBS world silver supply-demand balance, 2005-12F – investment demand needs to remain robust
Tonnes 2005 2006 2007 2008 2009F 2010F 2011F 2012F
Mine production 20,026 19,945 20,660 21,179 21,600 22,000 22,500 22,500
Change, % 3.7% -0.4% 3.6% 2.5% 2.0% 1.9% 2.3% 0.0%
Net government sales 2,100 2,432 1,316 961 450 300 300 250
Old silver scrap 5,786 5,847 5,658 5,493 5,400 5,200 4,900 4,700
Producer hedging 859 -211 -731 -174
Total Supply 28,771 28,013 26,903 27,459 27,450 27,500 27,700 27,450
Industrial Fabrication 12,607 13,203 14,105 13,909 12,000 12,480 12,700 12,955
Photography 4,987 4,429 3,882 3,260 3,100 2,900 2,800 2,700
Jewellery, silverware and coins 8,762 8,313 8,149 8,725 8,800 8,625 8,475 8,700
Consumption 26,356 25,945 26,136 25,894 23,900 24,005 23,975 24,355
Change, % 2.0% -1.6% 0.7% -0.9% -7.7% 0.4% -0.1% 1.6%
Implied market balance 2,415 2,068 767 1,565 3,550 3,495 3,725 3,095
ETF investment 3,768 1,529 2,956 3,500
Residual market balance 2,415 -1,700 -762 -1,391 50 3,495 3,725 3,095
London spot fix, US $/ounce 7.31 11.55 13.38 14.99 14.50 17.50 16.00 16.75
Source: GFMS, RBS forecasts
Silver
Partying to the hilt
The prospects for sustained fiscal stimulus, bringing both a return to economic
growth and the resurgence of inflation, played beautifully into silver’s hands in
the third quarter, and this most effervescent of metals made everything go with a
fizz. The rally in gold through US$1,000/oz propelled silver rapidly from
US$14/oz towards US$18/oz in a burst that saw the price rise more than 25%
within three weeks. The linkage with gold became very strong as investors and
speculators sought dual exposure to gold and silver on the basis of inflation
hedging, while speculators took advantage of silver’s higher volatility to
maximise performance. The ratio between the two metals, which exceeded 80 at
the beginning of the year, tumbled to below 60, and was also the subject of
trading in its own right. By this stage though, retail investment was slowing and
the market was developing a justifiable fear that the gaiety of early September
might have some sharp, if short-lived, repercussions.
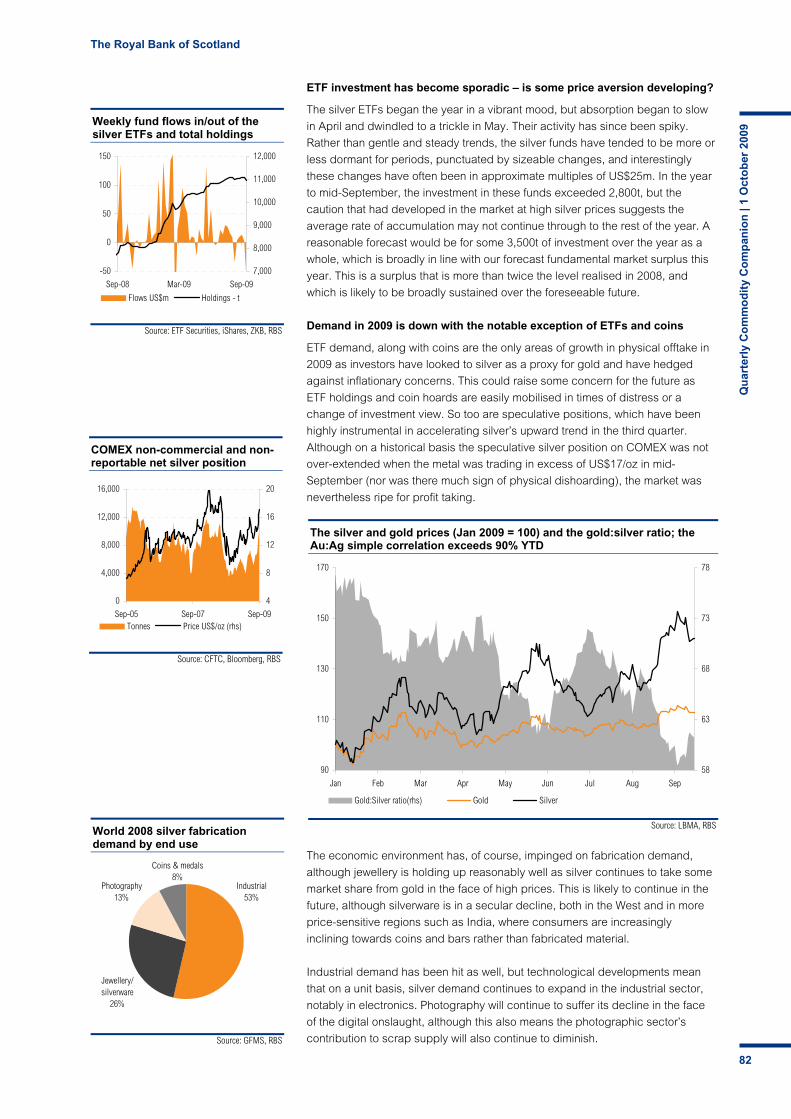
The Royal Bank of Scotland
Qu
arte
rly
Co
mm
od
ity
Co
mp
anio
n |
1 O
cto
ber
200
9
82
Source: ETF Securities, iShares, ZKB, RBS
Weekly fund flows in/out of the silver ETFs and total holdings
-50
0
50
100
150
Sep-08 Mar-09 Sep-09
7,000
8,000
9,000
10,000
11,000
12,000
Flows US$m Holdings - t
Source: CFTC, Bloomberg, RBS
COMEX non-commercial and non-reportable net silver position
0
4,000
8,000
12,000
16,000
Sep-05 Sep-07 Sep-09
4
8
12
16
20
Tonnes Price US$/oz (rhs)
Source: LBMA, RBS
The silver and gold prices (Jan 2009 = 100) and the gold:silver ratio; the Au:Ag simple correlation exceeds 90% YTD
90
110
130
150
170
Jan Feb Mar Apr May Jun Jul Aug Sep
58
63
68
73
78
Gold:Silver ratio(rhs) Gold Silver
Source: GFMS, RBS
World 2008 silver fabrication demand by end use
Coins & medals
8%Photography
13%
Jewellery/ silverware
26%
Industrial53%
Industrial53%
Jewellery/ silverware
26%
Photography13%
Coins & medals8%
ETF investment has become sporadic – is some price aversion developing?
The silver ETFs began the year in a vibrant mood, but absorption began to slow
in April and dwindled to a trickle in May. Their activity has since been spiky.
Rather than gentle and steady trends, the silver funds have tended to be more or
less dormant for periods, punctuated by sizeable changes, and interestingly
these changes have often been in approximate multiples of US$25m. In the year
to mid-September, the investment in these funds exceeded 2,800t, but the
caution that had developed in the market at high silver prices suggests the
average rate of accumulation may not continue through to the rest of the year. A
reasonable forecast would be for some 3,500t of investment over the year as a
whole, which is broadly in line with our forecast fundamental market surplus this
year. This is a surplus that is more than twice the level realised in 2008, and
which is likely to be broadly sustained over the foreseeable future.
Demand in 2009 is down with the notable exception of ETFs and coins
ETF demand, along with coins are the only areas of growth in physical offtake in
2009 as investors have looked to silver as a proxy for gold and have hedged
against inflationary concerns. This could raise some concern for the future as
ETF holdings and coin hoards are easily mobilised in times of distress or a
change of investment view. So too are speculative positions, which have been
highly instrumental in accelerating silver’s upward trend in the third quarter.
Although on a historical basis the speculative silver position on COMEX was not
over-extended when the metal was trading in excess of US$17/oz in mid-
September (nor was there much sign of physical dishoarding), the market was
nevertheless ripe for profit taking.
The economic environment has, of course, impinged on fabrication demand,
although jewellery is holding up reasonably well as silver continues to take some
market share from gold in the face of high prices. This is likely to continue in the
future, although silverware is in a secular decline, both in the West and in more
price-sensitive regions such as India, where consumers are increasingly
inclining towards coins and bars rather than fabricated material.
Industrial demand has been hit as well, but technological developments mean
that on a unit basis, silver demand continues to expand in the industrial sector,
notably in electronics. Photography will continue to suffer its decline in the face
of the digital onslaught, although this also means the photographic sector’s
contribution to scrap supply will also continue to diminish.

The Royal Bank of Scotland
Qu
arte
rly
Co
mm
od
ity
Co
mp
anio
n |
1 O
cto
ber
200
9
83
Source: GFMS Ltd, RBS
World silver supply/demand and price, 2005-12F. Hefty supply surpluses forecast out to 2012, investment demand will have to take up the slack
-2,000
-1,000
0
1,000
2,000
3,000
4,000
2005 2006 2007 2008 2009f 2010f 2011f 2012f
Tonn
es o
f sur
plus
/def
icit
6
8
10
12
14
16
18
US$/oz
Market Balance Silver price
Source: GFMS, RBS
Silver mine supply by source, %
Lead-zinc36%
Silver28%
Gold22%
Copper13%
Other1%
Source: Bloomberg, RBS
Silver implied lease rates (%) slide
0
1
2
3
4
5
6
Sep-07 Sep-08 Sep-09
12month 3Month
Silver supply is price-inelastic and on the increase
While demand has been under pressure but is now expected to stabilise, supply
is beginning to increase and, although the increments are relatively small, they
are nonetheless significant in terms of the marginal balance in the market. Cash
costs of primary silver mine production are estimated to be in the region of
US$5/oz today. Primary mine production accounts for about 28% of global mine
production, and when industrial scrap return is included, primary silver mines are
responsible for 22-23% of total supplies. At current silver prices, or even at
prices considerably below prevailing levels, virtually all silver supply is price-
inelastic (with the exception, of course, of bouts of dishoarding).
The possible exception to this is forward selling into price strength, but the
forward market is thin and producers tend to prefer silver stream contracts,
whereby they enter into long-term contracts with commercial counterparties,
rather than risk skewing a thinly populated forward market. A good example of
this is the recent deal between Barrick Gold and Silver Wheaton. Barrick sold
silver production from selected mines plus a proportion of future output from the
massive Pascua-Lama deposit (due on stream 2012) to Silver Wheaton, thereby
securing financing for one party and a metal stream for the other.
Poor industrial fundamentals – but high prices
On the basis of the aforementioned fundamentals, a case can be made that
silver ought to be trading at between US$5/oz and US$10/oz. In the current
environment, however, with gold likely to remain strong on the basis of
inflationary and fiscal concerns, silver now appears likely to continue to sustain
prices in the double digits as long as there is buoyancy in gold investment for
risk-related reasons. Physical investment in silver, both the ETFs and coins/bars,
has, despite some wobbles, been remarkably robust and it may continue to
absorb the fundamental surplus.
Once gold does lose momentum, however, either in the short term or the long
term, we believe investors must be prepared for the short sharp shocks that
silver is capable of administering. This metal is renowned for volatile price
movements and its falls can be sharper than its rises.

The Royal Bank of Scotland
Qu
arte
rly
Co
mm
od
ity
Co
mp
anio
n |
1 O
cto
ber
200
9
84Source: GFMS, RBS
Cumulative release of palladium from global stockpiles − the rundown of stocks cannot continue for ever
0
2000
4000
6000
8000
10000
12000
1999 2000 2001 2002 2003 2004 2005 2006 2007 2008
000
ounc
es
Source: GFMS, RBS
Changes in palladium’s residual market balance results from government and other stock movements
-2,000
0
2,000
4,000
6,000
1999 2000 2001 2002 2003 2004 2005 2006 2007 2008
000
ounc
es
Source: LPPM
Palladium the best of the precious metals since end-2008, up 60%...
150
250
350
450
550
Sep-06 Sep-07 Sep-08 Sep-09
Palladium US$/oz
Source: LPPM
… while platinum added 40%; both are set for further increases
750
1,050
1,350
1,650
1,950
2,250
Sep-06 Sep-07 Sep-08 Sep-09
Platinum US$/oz
Platinum and palladium
Platinum Group Metals comfortably eclipse gold
Platinum and palladium have remained the strongest metals in the precious
complex and we continue to expect both metals to stage further gains in price,
although there are arguments for a period of respite from their sustained bull
runs before more improvements later this year and into 2010. There are key
issues on both the supply and demand side of each metal’s fundamentals, with
platinum looking to the state of the South African mining sector and palladium
pondering the prospects for Russian exports. Both factors have been supportive
during the middle of the year as South African producers have faced falling
profits and rising costs, while Russian exports have been running at lower levels
than usual. There are some market nerves about the possible resumption of
heavy Russian palladium shipments, but this is by no means cast in stone and, in
our view this year’s overall palladium deficit is likely to be a big one.
Demand for both metals was boosted in recent months as a result of the various
automotive scrappage incentives, but will likely come under pressure in the
months ahead as these programmes tail away. Platinum jewellery demand is
staging a strong comeback, and consumers appear in the main to be accepting
rising prices. Investment in ETFs has remained steady, while speculative
positions on NYMEX have reached record levels, and this could result in some
temporary overhead pressure. There is no news yet on the progress of the
applications for Exchange Traded Instruments in the US, but this is nothing to
worry about, in our view, as the ‘quiet period’ can last many months while the
authorities conduct their due diligence.
Platinum has sustained the bull market that it started in October 2008, although
the shifting sands of investors’ risk appetite has meant that the run has been
punctuated by more than one period of reasonably deep correction. In mid-
September, platinum challenged US$1,350/oz, a 12-month high and a gain of
40% from the beginning of 2009. Palladium turned upward last December and
breached US$300/oz in mid-September, also a 12-month high and a gain of 60%
since the beginning of the year, while rhodium has gained 33%, not enough to
help producers’ margins by much. We expect the platinum market to be broadly
balanced and the palladium market to sustain fundamental deficits, prior to
investment, for the next few years and we continue to recommend exposure to
these metals.

The Royal Bank of Scotland
Qu
arte
rly
Co
mm
od
ity
Co
mp
anio
n |
1 O
cto
ber
200
9
85
RBS world platinum supply-demand balance, 2005-12F – we expect the platinum market to be broadly balanced in the coming years, but only prior to ETF investment
000 oz 2005 2006 2007 2008 2009F 2010F 2011F 2012F
South African mine production 5,054 5,447 5,074 4,671 4,550 4,765 5,015 5,315
Other mine production 1,570 1,577 1,509 1,480 1,380 1,430 1,460 1,480
Total mine production 6,624 7,024 6,583 6,151 5,930 6,195 6,475 6,795
Change, % 3.3% 6.0% -6.3% -6.6% -3.6% 4.5% 4.5% 4.9%
Autocatalyst scrap 802 836 921 998 850 1,200 1,200 1,300
Jewellery scrap 340 350 543 910 299 330 300 330
Total supply 7,766 8,210 8,047 8,059 7,079 7,725 7,975 8,425
Change % 6% -2% 0% -12% 9% 3% 6%
Emission control catalysts 3,858 4,043 4,139 3,814 3,025 3,150 3,450 3,600
Jewellery 2,132 2,032 1,872 1,646 1,650 2,000 2,100 2,200
Other industrial use 1,821 1,776 1,950 2,334 2,390 2,450 2,500 2,500
Consumption 7,811 7,851 7,961 7,794 7,065 7,600 8,050 8,300
Change, % 2.4% 0.5% 1.4% -2.1% -9.4% 7.6% 5.9% 3.1%
Implied market balance -45 359 86 265 14 125 -75 125
ETF investment 194 102 300
Implied residual balance -45 359 -108 163 -286 125 -75 125
London spot fix, US$/oz 897 1,142 1,305 1,572 1,200 1,450 1,550 1,600
Source: GFMS, RBS forecasts
The supply side – hanging on by the skin of its teeth, Anglo Platinum to be
the swing producer
The majority of South African platinum producers are struggling under weighty
burdens, and the financial results announced in the third quarter of the year
brought this home. There have been very few published amendments to
production schedules during the period (but equally no reinstatements of
previously announced cuts, as detailed in our April 2009 Commodity
Companion).
Anglo Platinum, the world’s largest platinum producer, did make an interesting
statement in its interim results, in which it recorded a 95% collapse in headline
earnings. The company had already stated that it was managing its mine output
(first-half platinum production was 1.06m oz; sales 1.22m oz) and announced
that its target of 2.4m oz for the full year remained in place.
Anglo Platinum’s CEO stated in the report, however, that the company would
utilise process pipeline inventory stocks “as required to meet market demand.”
Our forecast for the year shows the platinum market broadly in balance overall
(prior to investment activity) and, although auto demand is dipping towards the
end of the third quarter, this balance is likely to have been composed of a
surplus in the early months of the year, moving latterly towards deficit.
Source: Company reports, Reuters, RBS
South African platinum miners; earnings changes and cost considerations, mid-2009
Company Earnings change yoy Cost comments Strike-induced production losses
Anglo American Platinum -95%; six months period to end-June Cash operating costs down 6.4% on H1 2008 n.a.
Impala -52%; full year to June Unit costs up 32% per platinum ounce ~50,000 oz, revenue R720m
Lonmin Into a loss, six-month period to end-March Expecting gross operating rand costs to be down for full-year 2009 n.a.
Northam -57%, full year to end-June Cash costs up 14%
Aquarius Net loss reduced via production improvement Cash costs per PGM ounce up 22% yoy 15,000-20,000 oz of PGM
Platmin n.a. n.a. Ramp-up delayed; working to minimise impact in terms of time

The Royal Bank of Scotland
Qu
arte
rly
Co
mm
od
ity
Co
mp
anio
n |
1 O
cto
ber
200
9
86
Source: Global Trade Navigator
Recorded Swiss imports of palladium from Russia (tonnes)
0
4
8
12
16
Jul-05 Jul-07 Jul-093 Month Moving Average
Source: Bloomberg, RBS
The platinum-gold premium has averaged just US$210 year-to-date
-200
0
200
400
600
800
1,000
1,200
1,400
Sep-05 Sep-07 Sep-09
This statement implies that Anglo Platinum is prepared to act as swing
producer to prevent excessive price volatility, thereby conserving price-elastic
demand sectors, notably jewellery.
The miners have been battling to contain production costs, while the prices of
the four PGMs have been substantially reduced in rand terms. Platinum, for
example, averaged 33% less in rand terms in the first half of this year than in H1
08 – the weakening of the rand at that point had cushioned losses, given that the
dollar average was down 44% − while in the third quarter to date the rand and
dollar prices of platinum are down by 24% and 26% yoy, respectively. The
palladium average price was down 51% in dollar terms and 42% in rand terms in
the first half, and by 25% and 23% in the third quarter to date. The average dollar
price of rhodium was down by a whopping 86% in H1 09 and by 77% in rand
terms; in the third quarter so far the decline is 23% and 22%. While gold was
similar in rand terms in the first half, and averaged 11% higher in the third
quarter to date, this was by no means enough fully to mitigate the effects of the
declines in the PGM prices on the operating margins of the miners.
Although PGM prices are rising, mining companies will remain under pressure
for some time to come. While some operations are ramping up to full production,
the other expansions or greenfield developments that were deferred or delayed
in 2008 are unlikely to be reinstated in the foreseeable future, in our view.
Palladium supply − Russian shipments have declined as expected and the
market appears strong enough to absorb any later increase
Norilsk’s results for H1 09 show production of 1.282m oz of palladium and
300,000 oz of platinum. This was 156,000 oz of palladium and 38,000 oz of
platinum less than in H1 08, but only very fractionally below the production rates
of the second half of 2008. Norilsk is concentrating on stable production levels
with a view towards maximising sales, and again the market’s concentration is on
total Russian exports and the implied amount of metal that may be coming from
state inventories.
In our April Commodity Companion we noted that a senior Almaz official had
forecast a dwindling in palladium exports from Russia during the middle of the
year as the new legislation revoking Almaz’s previous monopoly on palladium
exports was put into place. Exports have indeed fallen, but while we believe the
Almaz theory holds water, we believe it is also possible that sales have been
constrained in response to the reduced requirements of the market.
Russia’s exports to its major palladium trading partners were down by about
420,000 oz in the first seven months of this year compared with January-July
2008, a decline of 23%. We expect a decline in net palladium demand of half a
million ounces, with the pattern similar to that of platinum – ie a stronger rate of
demand in H2 than in H1. There is therefore, in essence, scope for the market to
absorb any resurgence in supply. Or is there? Russian exports to Switzerland –
platinum and palladium’s terminal market – were virtually zero in March to July,
but we must still remember that implied inventories in Switzerland have
increased by 1.9m oz since the beginning of 2005 and that there is, in theory at
least, plenty of metal available to the market should there be a requirement for it.
What is not clear, of course, is the price at which such metal might become
available.
Russian imports into Japan and the US combined were down by a million ounces
in the first seven months of this year, while exports to Hong Kong and China are
up by almost 200,000 oz, reflecting the dynamics of market demand.

The Royal Bank of Scotland
Qu
arte
rly
Co
mm
od
ity
Co
mp
anio
n |
1 O
cto
ber
200
9
87
Source: Thomson Reuters, RBS
Platinum in US dollar, euro and rand terms (September 2007 = 100)
50
100
150
200
Sep-07 Mar-08 Sep-08 Mar-09 Sep-09USD ZAR EUR
Source: Thomson Reuters, RBS
Platinum, palladium and rhodium US dollar prices (September 2007 = 100)
0
50
100
150
200
Sep-07 Mar-08 Sep-08 Mar-09 Sep-09
Platinum Palladium Rhodium
Source: Global Trade Navigator
China platinum imports + Hong Kong’s exports to China (tonnes)
0
1
2
3
4
5
Jul-05 Jul-07 Jul-09
China HK to China
Demand − both metals are now looking at a temporary slowdown in
automotive offtake, while platinum jewellery remains reasonably robust
The chart at the left shows how Chinese demand for platinum appears to have
remained resilient even in the face of the recovery in prices this year. The market
for jewellery is by no means mature in China and so far has been concentrated
(with the exception of bridal ware) largely in the major conurbations. After
peaking at more than 1.2m oz in 2002, it embarked on a price-driven decline as
gold fought back and palladium made its mark as a potential substitute. The
market bottomed in 2006 and has been making a steady recovery. It had
appeared for a good part of this year as if the US$1,200/oz level was an
important tipping point of the market, but as we have moved through the third
quarter this price has become more acceptable and the entry barrier has been
rising, especially as platinum’s premium over gold has been narrow by recent
historical standards.
Chinese imports not quite what they seem, but we believe probably no
cause for concern
One cautionary note is that the high level of imports into China and Hong Kong
are bound to reflect a degree of inventory building, whether for strategic or
industrial reasons. However, in our view this is not necessarily as ominous as it
looks. With the exceptions of vehicle emission control catalysts, jewellery and
electronics the vast majority of other end uses of platinum are in-process
catalysts. Thus platinum-rhodium gauze is important for oxidising ammonia to
nitric acid, for example, while platinum is used in bushings for the manufacture of
fibre glass and platinum catalysts are used for petroleum reforming and catalytic
cracking. This means that day-to-day demand for platinum in these sectors is for
the metal necessary for the regeneration of spent catalyst, and the losses on
these catalysts are generally minimal.
However, for a catalyst to be ‘spent’ it must first be installed, and the amount of
fixed investment in the Chinese (and other Asian) economies suggests that much
of this metal may have been taken to equip new plant. It may therefore be a ‘one
off’ and does not mean necessarily that this material has gone into stockpile for
subsequent release on a change of investment view. We believe it is probably
safe to argue that it has gone off-market – but, equally, that these levels of
imports may not be the sign of things to come.

The Royal Bank of Scotland
Qu
arte
rly
Co
mm
od
ity
Co
mp
anio
n |
1 O
cto
ber
200
9
88
RBS world palladium supply-demand balance, 2005-12F – we expect the palladium market to sustain fundamental deficits in the coming years, even prior to ETF investment
000 oz 2005 2006 2007 2008 2009F 2010F 2011F 2012F
Russian mine production 3,133 3,164 3,049 2,712 2,660 2,660 2,660 2,660
Other mine production 3,822 4,191 4,032 3,669 3,500 3,700 4,050 4,050
Total mine production 6,955 7,355 7,081 6,381 6,160 6,360 6,710 6,710
Change, % 5.8% -3.7% -9.9% -3.5% 3.2% 5.5% 0.0%
Autocatalyst scrap 626 744 951 1,184 950 1,350 1,800 2,000
Jewellery scrap 103 234 184 195 150 130 130 150
Total supply 7,684 8,333 8,216 7,760 7,260 7,840 8,640 8,860
Change, % 8% -1% -6% -6% 8% 10% 3%
Emission control catalysts 3,924 4,330 4,719 4,416 4,000 4,500 5,000 5,200
Jewellery 1,363 1,281 1,283 1,301 1,300 1,430 1,500 1,500
Other industrial use 2,477 2,549 2,535 2,682 2,600 2,650 2,750 2,800
Consumption 7,764 8,160 8,537 8,399 7,900 8,580 9,250 9,500
Change, % 5.1% 4.6% -1.6% -5.9% 8.6% 7.8% 2.7%
Implied market balance -80 173 -321 -639 -640 -740 -610 -640
Stock movements 1,858 1,613 900 1,300
ETF investment 280 381 450
Implied residual balance 1,778 1,786 299 280 -1,090 -740 -610 -640
London spot fix, US$/oz 201 320 355 351 250 350 400 475
Source: GFMS, RBS
Source: ACEA, RBS
Monthly EU passenger car registrations – % change yoy
-25%
-20%
-15%
-10%
-5%
0%
5%
10%
Feb-08 Aug-08 Feb-09 Aug-09
EU (15) yoy EU (15) 3m MA
The automotive sector − good times, bad times
We have written at length about the state of the auto sector in our weekly
Precious Metals Review and Commodity Compendium. The latest position is that
the US cash-for-clunkers programme closed after just a month, and over 90% of
the dealers’ claims have been approved for payment from central funds. The
US$3bn programme resulted in the sale of more than 690,000 new light vehicles
in the US, and we have postulated that, if the August-December average sales
rate equals that of January-July, then the September-December average light-
vehicle sales would have to fall 13% from the average for the first seven months.
In mid-September, it appeared as if this calculation, which we felt at the time was
somewhat gloomy, was coming about, as the figures for the early part of the
month suggested a likely annualised rate of 8.8m units, compared with a total for
2008 of 13.2m. Dealer profits per vehicle are also sliding, so there may yet be
more attrition to come in this side of the industry.
Europe − the German scrappage incentive scheme has ended; France’s,
Italy’s and the UK’s schemes are also ending
European sales have held up better than those in the US (which therefore
favours platinum rather than palladium as a result of platinum’s much higher
diesel penetration in Europe), but this is partly because more money has been
pumped into the system. The German scheme involved US$7bn and has been
exhausted more than four months ahead of schedule, while the French
government is considering extending its own programme, which along with those
of Italy and the UK is nearing exhaustion (though the scheme has recently been
now extended to allow for an additional 100,000 vehicles).
The German programme raised August registrations by 28% yoy, although the
overall results from the scheme have by no means shown up in the registration
statistics yet. In early September, only 850,000 of the 2m applications had
filtered through into the figures. Of these, some 75% were for new vehicles.
Europe, too, expects a hangover after the party, with Volkswagen’s head of sales
looking for a potential decline of 27% in Germany next year, to 2.6m-2.8m
vehicles, down from a projected 3.7m vehicles in 2009.
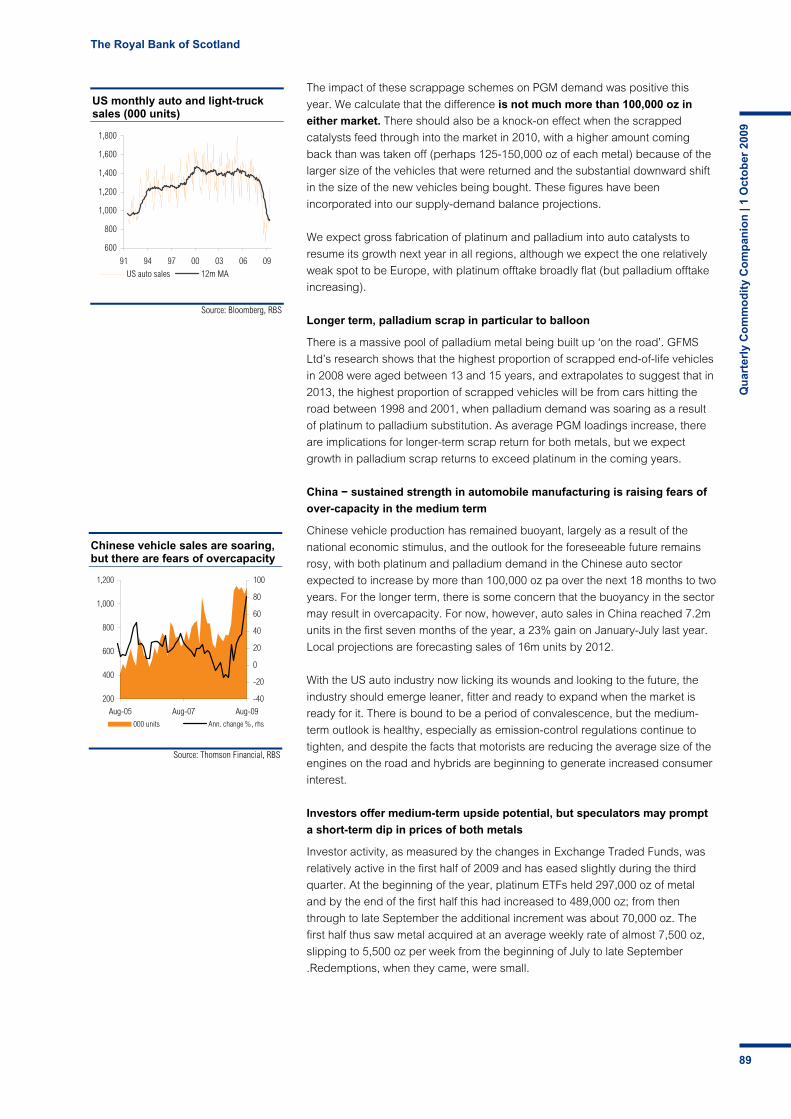
The Royal Bank of Scotland
Qu
arte
rly
Co
mm
od
ity
Co
mp
anio
n |
1 O
cto
ber
200
9
89
Source: Thomson Financial, RBS
Chinese vehicle sales are soaring, but there are fears of overcapacity
200
400
600
800
1,000
1,200
Aug-05 Aug-07 Aug-09
-40
-20
0
20
40
60
80
100
000 units Ann. change %, rhs
Source: Bloomberg, RBS
US monthly auto and light-truck sales (000 units)
600
800
1,000
1,200
1,400
1,600
1,800
91 94 97 00 03 06 09
US auto sales 12m MA
The impact of these scrappage schemes on PGM demand was positive this
year. We calculate that the difference is not much more than 100,000 oz in
either market. There should also be a knock-on effect when the scrapped
catalysts feed through into the market in 2010, with a higher amount coming
back than was taken off (perhaps 125-150,000 oz of each metal) because of the
larger size of the vehicles that were returned and the substantial downward shift
in the size of the new vehicles being bought. These figures have been
incorporated into our supply-demand balance projections.
We expect gross fabrication of platinum and palladium into auto catalysts to
resume its growth next year in all regions, although we expect the one relatively
weak spot to be Europe, with platinum offtake broadly flat (but palladium offtake
increasing).
Longer term, palladium scrap in particular to balloon
There is a massive pool of palladium metal being built up ‘on the road’. GFMS
Ltd’s research shows that the highest proportion of scrapped end-of-life vehicles
in 2008 were aged between 13 and 15 years, and extrapolates to suggest that in
2013, the highest proportion of scrapped vehicles will be from cars hitting the
road between 1998 and 2001, when palladium demand was soaring as a result
of platinum to palladium substitution. As average PGM loadings increase, there
are implications for longer-term scrap return for both metals, but we expect
growth in palladium scrap returns to exceed platinum in the coming years.
China − sustained strength in automobile manufacturing is raising fears of
over-capacity in the medium term
Chinese vehicle production has remained buoyant, largely as a result of the
national economic stimulus, and the outlook for the foreseeable future remains
rosy, with both platinum and palladium demand in the Chinese auto sector
expected to increase by more than 100,000 oz pa over the next 18 months to two
years. For the longer term, there is some concern that the buoyancy in the sector
may result in overcapacity. For now, however, auto sales in China reached 7.2m
units in the first seven months of the year, a 23% gain on January-July last year.
Local projections are forecasting sales of 16m units by 2012.
With the US auto industry now licking its wounds and looking to the future, the
industry should emerge leaner, fitter and ready to expand when the market is
ready for it. There is bound to be a period of convalescence, but the medium-
term outlook is healthy, especially as emission-control regulations continue to
tighten, and despite the facts that motorists are reducing the average size of the
engines on the road and hybrids are beginning to generate increased consumer
interest.
Investors offer medium-term upside potential, but speculators may prompt
a short-term dip in prices of both metals
Investor activity, as measured by the changes in Exchange Traded Funds, was
relatively active in the first half of 2009 and has eased slightly during the third
quarter. At the beginning of the year, platinum ETFs held 297,000 oz of metal
and by the end of the first half this had increased to 489,000 oz; from then
through to late September the additional increment was about 70,000 oz. The
first half thus saw metal acquired at an average weekly rate of almost 7,500 oz,
slipping to 5,500 oz per week from the beginning of July to late September
.Redemptions, when they came, were small.

The Royal Bank of Scotland
Qu
arte
rly
Co
mm
od
ity
Co
mp
anio
n |
1 O
cto
ber
200
9
90
Source: CFTC, RBS
Net NYMEX non-commercial and non-reportable palladium position
0
10
20
30
40
50
Sep-05 Sep-07 Sep-09
100
200
300
400
500
600
Tonnes Price US$/oz (rhs)
Source: CFTC, RBS
Net NYMEX non-commercial and non-reportable platinum position
0
5
10
15
20
25
30
35
Sep-05 Sep-07 Sep-09
750
1,000
1,250
1,500
1,750
2,000
2,250
2,500
Tonnes Price US$/oz (rhs)
Source: ETF Securities, ZKB RBS
Palladium ETF holdings and price – inflows accelerate in September
0
5
10
15
20
25
30
35
Sep-07 Mar-08 Sep-08 Mar-09 Sep-09
tonn
es
100
175
250
325
400
475
550
625
USD/oz
ZKB LSE Price (RHS)
Source: ETF Securities, ZKB, RBS
Platinum ETF holdings and price – holdings have been relatively stable in Q3 09, despite price volatility
0
3
6
9
12
15
18
Sep-07 Mar-08 Sep-08 Mar-09 Sep-09
tonn
es
750
1,000
1,250
1,500
1,750
2,000
2,250
USD/oz
ZKB LSE Price (RHS)
The story has been similar in the palladium market, but investors have been
rather more bullish towards palladium, with ETF inflows gaining momentum in the
third quarter. At the beginning of the year the palladium ETFs held just over
660,000 oz of metal. By the end of June, this had increased to 878,000 oz
(weekly average rise of nearly 8,500 oz) and in late September, after passing the
million ounce level, holdings were 1.09m oz so that the weekly average rate of
acquisition in July to late September was a more than respectable 17,000 oz.
If this latter rate of accumulation were extrapolated on a very simple linear basis,
then it would be equivalent to a full year of about 650,000 oz, or roughly half the
world’s estimated palladium demand in jewellery this year. This investment
activity, reflecting the market’s expectation for an improving supply-demand
balance, suspicions (accurate or otherwise) that the Russian state palladium
reserves might be nearing exhaustion, and aided also by the sharp declines
that palladium sustained in 2008, helped the price reach a 12-month high
exceeding US$300/oz in mid-September.
We have been deliberately conservative in our estimates for full-year demand in
both the palladium and platinum ETFs in our supply-demand balance forecasts.
We would expect that for the foreseeable future the hands that are holding this
metal are firm.
The same may not be the case with respect to the speculative positions on
NYMEX. The palladium position reached a record of over 1.5m oz in late
September, with the outright gross speculative long position at nearly 1.9m oz.
Some profit taking developed after palladium reached US$300/oz (although
there was also some short covering) and any slowing of momentum in the metals
sector is likely to generate more such selling. A similar position applies to
platinum, which reached a record on NYMEX at 1.1m oz in late September, and
it too may be vulnerable to some profit taking.
For the medium term, however, the fundamentals of both metals are among
the strongest in the sector and platinum and palladium remain our most
favoured metals in the precious metals complex.
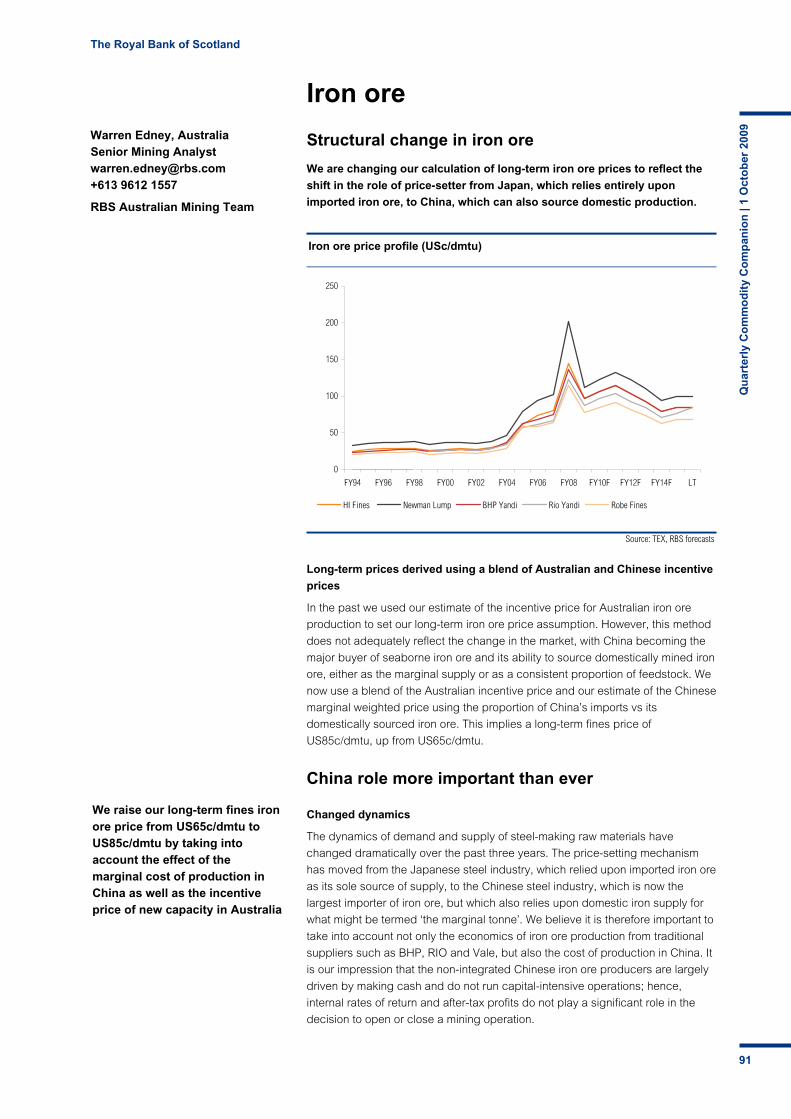
The Royal Bank of Scotland
Qu
arte
rly
Co
mm
od
ity
Co
mp
anio
n |
1 O
cto
ber
200
9
91
Source: TEX, RBS forecasts
Iron ore price profile (USc/dmtu)
0
50
100
150
200
250
FY94 FY96 FY98 FY00 FY02 FY04 FY06 FY08 FY10F FY12F FY14F LT
HI Fines Newman Lump BHP Yandi Rio Yandi Robe Fines
We raise our long-term fines iron ore price from US65c/dmtu to US85c/dmtu by taking into account the effect of the marginal cost of production in China as well as the incentive price of new capacity in Australia
Iron ore
Structural change in iron ore
We are changing our calculation of long-term iron ore prices to reflect the
shift in the role of price-setter from Japan, which relies entirely upon
imported iron ore, to China, which can also source domestic production.
Long-term prices derived using a blend of Australian and Chinese incentive
prices
In the past we used our estimate of the incentive price for Australian iron ore
production to set our long-term iron ore price assumption. However, this method
does not adequately reflect the change in the market, with China becoming the
major buyer of seaborne iron ore and its ability to source domestically mined iron
ore, either as the marginal supply or as a consistent proportion of feedstock. We
now use a blend of the Australian incentive price and our estimate of the Chinese
marginal weighted price using the proportion of China’s imports vs its
domestically sourced iron ore. This implies a long-term fines price of
US85c/dmtu, up from US65c/dmtu.
China role more important than ever
Changed dynamics
The dynamics of demand and supply of steel-making raw materials have
changed dramatically over the past three years. The price-setting mechanism
has moved from the Japanese steel industry, which relied upon imported iron ore
as its sole source of supply, to the Chinese steel industry, which is now the
largest importer of iron ore, but which also relies upon domestic iron supply for
what might be termed ‘the marginal tonne’. We believe it is therefore important to
take into account not only the economics of iron ore production from traditional
suppliers such as BHP, RIO and Vale, but also the cost of production in China. It
is our impression that the non-integrated Chinese iron ore producers are largely
driven by making cash and do not run capital-intensive operations; hence,
internal rates of return and after-tax profits do not play a significant role in the
decision to open or close a mining operation.
Warren Edney, Australia Senior Mining Analyst [email protected] +613 9612 1557
RBS Australian Mining Team
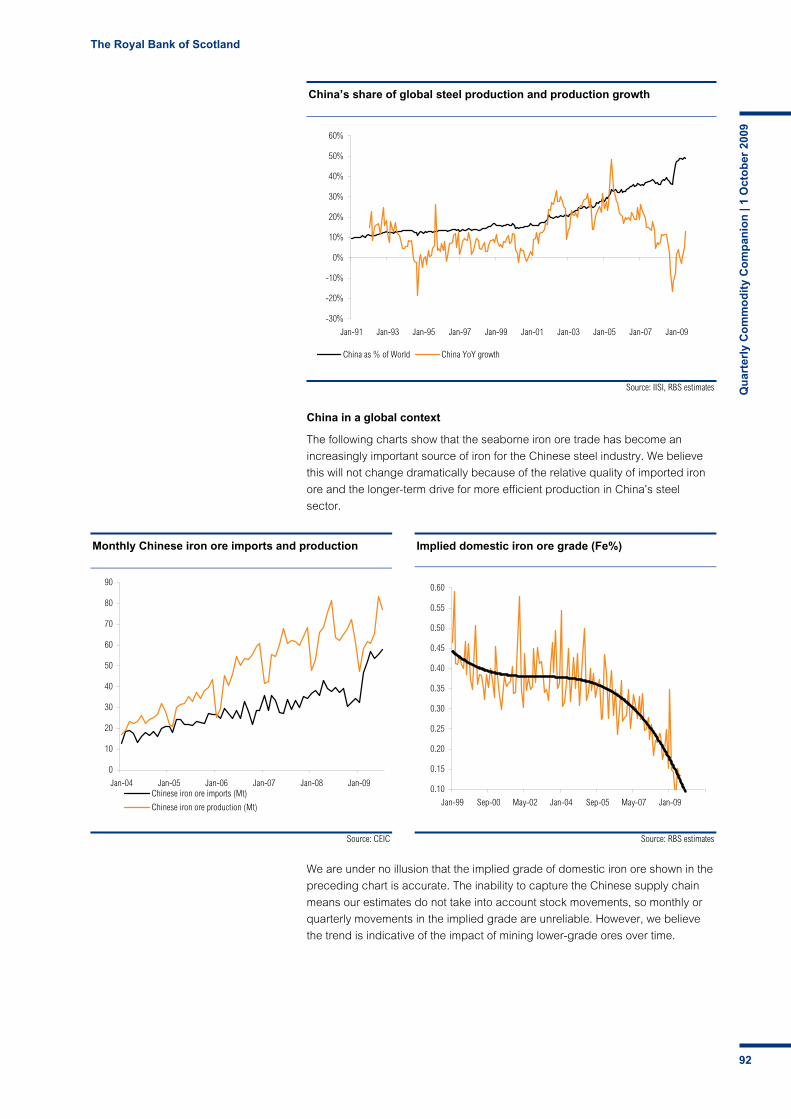
The Royal Bank of Scotland
Qu
arte
rly
Co
mm
od
ity
Co
mp
anio
n |
1 O
cto
ber
200
9
92
Source: IISI, RBS estimates
China’s share of global steel production and production growth
-30%
-20%
-10%
0%
10%
20%
30%
40%
50%
60%
Jan-91 Jan-93 Jan-95 Jan-97 Jan-99 Jan-01 Jan-03 Jan-05 Jan-07 Jan-09
China as % of World China YoY growth
Source: CEIC
Monthly Chinese iron ore imports and production
0
10
20
30
40
50
60
70
80
90
Jan-04 Jan-05 Jan-06 Jan-07 Jan-08 Jan-09Chinese iron ore imports (Mt)
Chinese iron ore production (Mt)
Source: RBS estimates
Implied domestic iron ore grade (Fe%)
0.10
0.15
0.20
0.25
0.30
0.35
0.40
0.45
0.50
0.55
0.60
Jan-99 Sep-00 May-02 Jan-04 Sep-05 May-07 Jan-09
China in a global context
The following charts show that the seaborne iron ore trade has become an
increasingly important source of iron for the Chinese steel industry. We believe
this will not change dramatically because of the relative quality of imported iron
ore and the longer-term drive for more efficient production in China’s steel
sector.
We are under no illusion that the implied grade of domestic iron ore shown in the
preceding chart is accurate. The inability to capture the Chinese supply chain
means our estimates do not take into account stock movements, so monthly or
quarterly movements in the implied grade are unreliable. However, we believe
the trend is indicative of the impact of mining lower-grade ores over time.
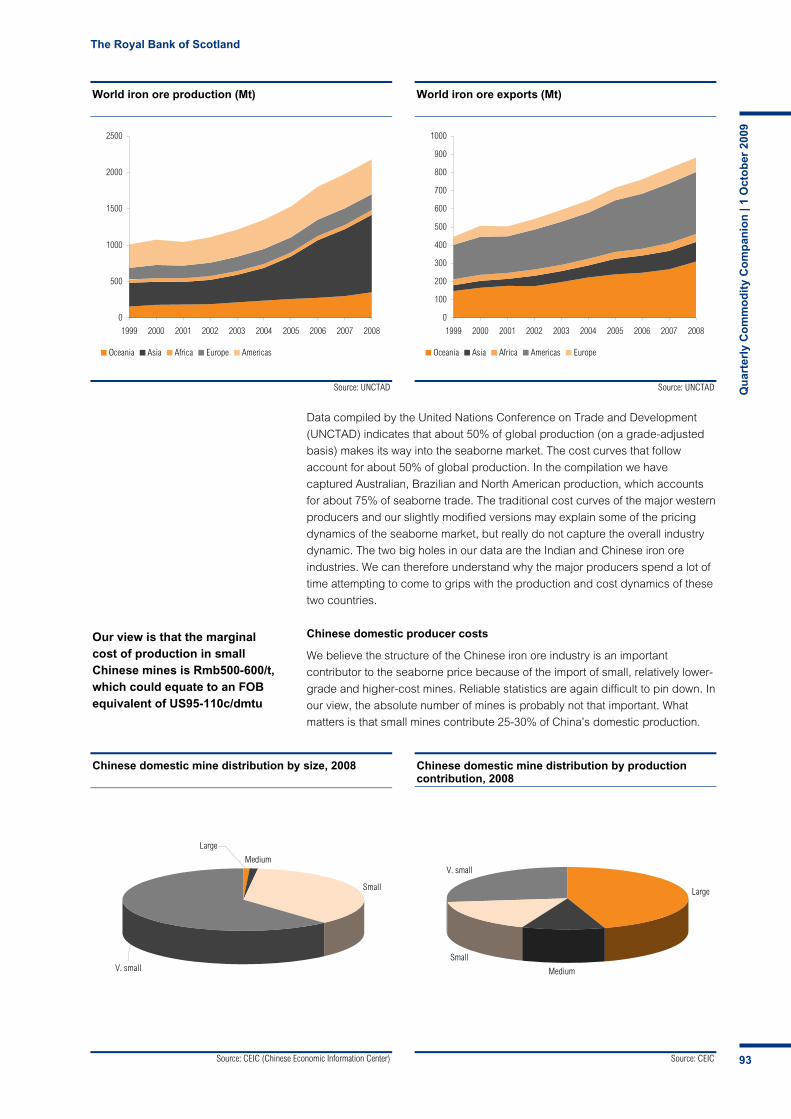
The Royal Bank of Scotland
Qu
arte
rly
Co
mm
od
ity
Co
mp
anio
n |
1 O
cto
ber
200
9
93
Source: UNCTAD
World iron ore production (Mt)
0
500
1000
1500
2000
2500
1999 2000 2001 2002 2003 2004 2005 2006 2007 2008
Oceania Asia Africa Europe Americas
Source: UNCTAD
World iron ore exports (Mt)
0
100
200
300
400
500
600
700
800
900
1000
1999 2000 2001 2002 2003 2004 2005 2006 2007 2008
Oceania Asia Africa Americas Europe
Our view is that the marginal cost of production in small Chinese mines is Rmb500-600/t, which could equate to an FOB equivalent of US95-110c/dmtu
Source: CEIC (Chinese Economic Information Center)
Chinese domestic mine distribution by size, 2008
Medium
Small
V. small
Large
Source: CEIC
Chinese domestic mine distribution by production contribution, 2008
Large
Medium
Small
V. small
Data compiled by the United Nations Conference on Trade and Development
(UNCTAD) indicates that about 50% of global production (on a grade-adjusted
basis) makes its way into the seaborne market. The cost curves that follow
account for about 50% of global production. In the compilation we have
captured Australian, Brazilian and North American production, which accounts
for about 75% of seaborne trade. The traditional cost curves of the major western
producers and our slightly modified versions may explain some of the pricing
dynamics of the seaborne market, but really do not capture the overall industry
dynamic. The two big holes in our data are the Indian and Chinese iron ore
industries. We can therefore understand why the major producers spend a lot of
time attempting to come to grips with the production and cost dynamics of these
two countries.
Chinese domestic producer costs
We believe the structure of the Chinese iron ore industry is an important
contributor to the seaborne price because of the import of small, relatively lower-
grade and higher-cost mines. Reliable statistics are again difficult to pin down. In
our view, the absolute number of mines is probably not that important. What
matters is that small mines contribute 25-30% of China’s domestic production.
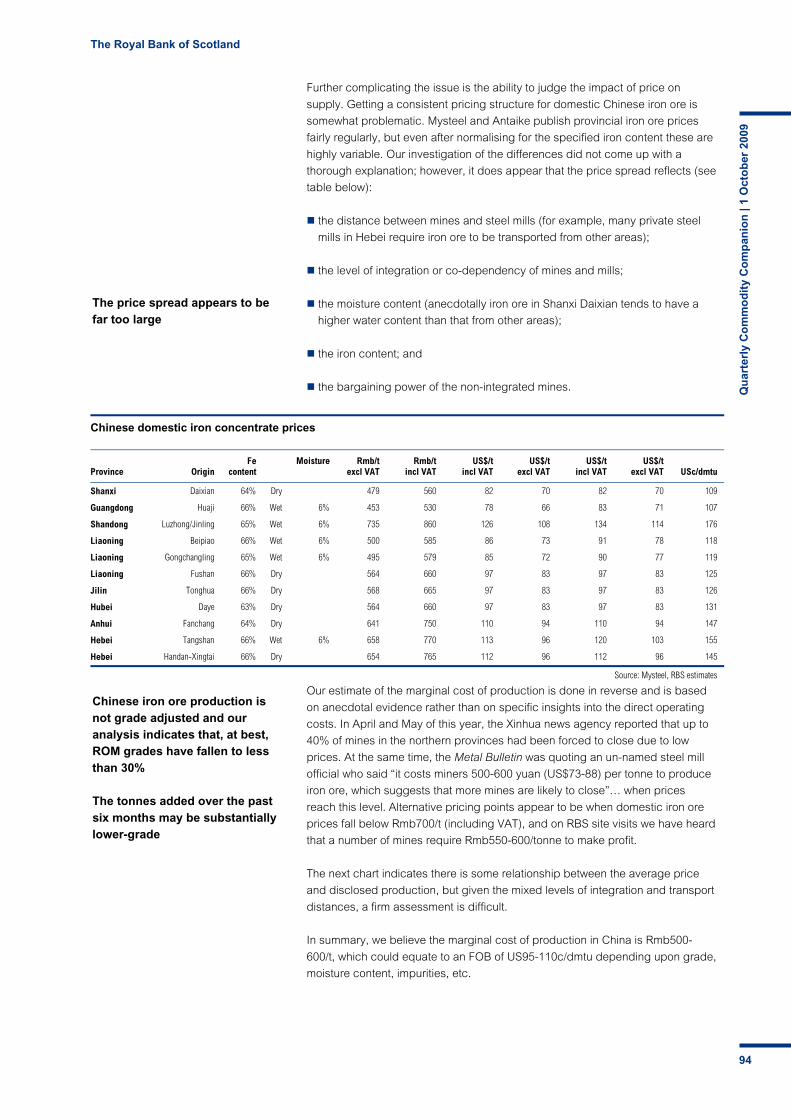
The Royal Bank of Scotland
Qu
arte
rly
Co
mm
od
ity
Co
mp
anio
n |
1 O
cto
ber
200
9
94
The price spread appears to be far too large
Chinese iron ore production is not grade adjusted and our analysis indicates that, at best, ROM grades have fallen to less than 30%
The tonnes added over the past six months may be substantially lower-grade
Further complicating the issue is the ability to judge the impact of price on
supply. Getting a consistent pricing structure for domestic Chinese iron ore is
somewhat problematic. Mysteel and Antaike publish provincial iron ore prices
fairly regularly, but even after normalising for the specified iron content these are
highly variable. Our investigation of the differences did not come up with a
thorough explanation; however, it does appear that the price spread reflects (see
table below):
the distance between mines and steel mills (for example, many private steel
mills in Hebei require iron ore to be transported from other areas);
the level of integration or co-dependency of mines and mills;
the moisture content (anecdotally iron ore in Shanxi Daixian tends to have a
higher water content than that from other areas);
the iron content; and
the bargaining power of the non-integrated mines.
Our estimate of the marginal cost of production is done in reverse and is based
on anecdotal evidence rather than on specific insights into the direct operating
costs. In April and May of this year, the Xinhua news agency reported that up to
40% of mines in the northern provinces had been forced to close due to low
prices. At the same time, the Metal Bulletin was quoting an un-named steel mill
official who said “it costs miners 500-600 yuan (US$73-88) per tonne to produce
iron ore, which suggests that more mines are likely to close”… when prices
reach this level. Alternative pricing points appear to be when domestic iron ore
prices fall below Rmb700/t (including VAT), and on RBS site visits we have heard
that a number of mines require Rmb550-600/tonne to make profit.
The next chart indicates there is some relationship between the average price
and disclosed production, but given the mixed levels of integration and transport
distances, a firm assessment is difficult.
In summary, we believe the marginal cost of production in China is Rmb500-
600/t, which could equate to an FOB of US95-110c/dmtu depending upon grade,
moisture content, impurities, etc.
Chinese domestic iron concentrate prices
Province
Origin
Fe content
Moisture Rmb/texcl VAT
Rmb/tincl VAT
US$/tincl VAT
US$/texcl VAT
US$/t incl VAT
US$/texcl VAT USc/dmtu
Shanxi Daixian 64% Dry 479 560 82 70 82 70 109
Guangdong Huaji 66% Wet 6% 453 530 78 66 83 71 107
Shandong Luzhong/Jinling 65% Wet 6% 735 860 126 108 134 114 176
Liaoning Beipiao 66% Wet 6% 500 585 86 73 91 78 118
Liaoning Gongchangling 65% Wet 6% 495 579 85 72 90 77 119
Liaoning Fushan 66% Dry 564 660 97 83 97 83 125
Jilin Tonghua 66% Dry 568 665 97 83 97 83 126
Hubei Daye 63% Dry 564 660 97 83 97 83 131
Anhui Fanchang 64% Dry 641 750 110 94 110 94 147
Hebei Tangshan 66% Wet 6% 658 770 113 96 120 103 155
Hebei Handan-Xingtai 66% Dry 654 765 112 96 112 96 145
Source: Mysteel, RBS estimates
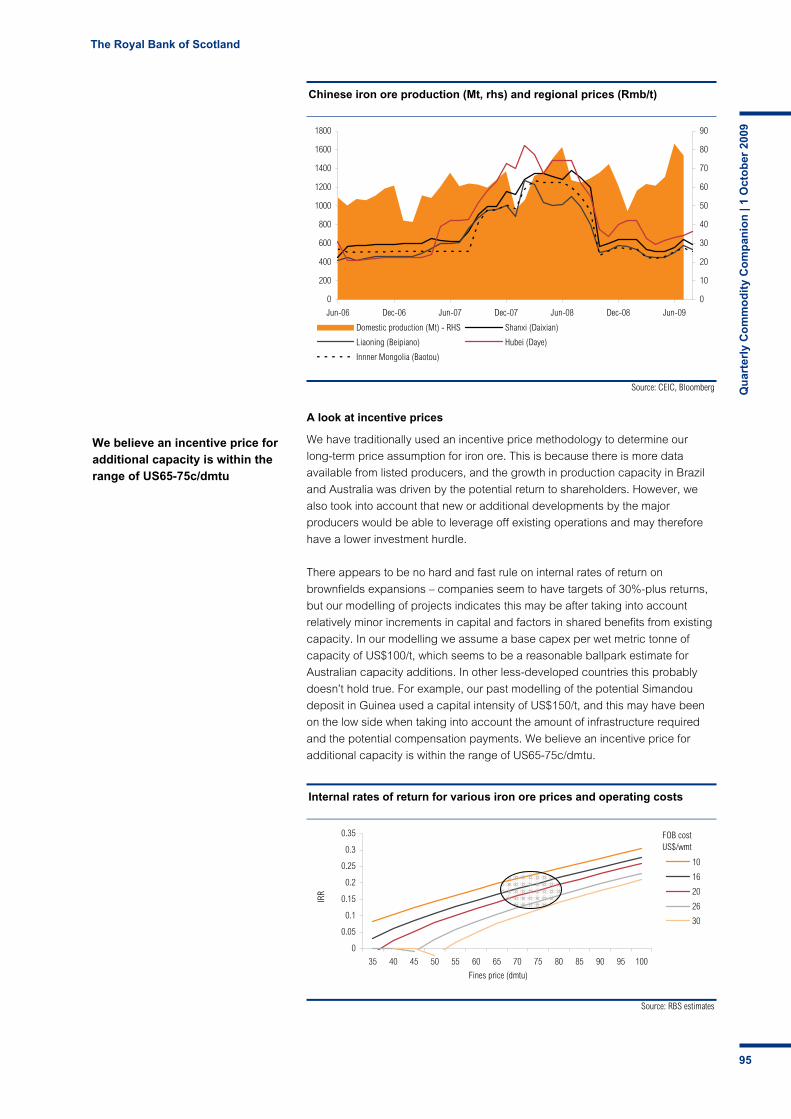
The Royal Bank of Scotland
Qu
arte
rly
Co
mm
od
ity
Co
mp
anio
n |
1 O
cto
ber
200
9
95
Source: CEIC, Bloomberg
Chinese iron ore production (Mt, rhs) and regional prices (Rmb/t)
0
200
400
600
800
1000
1200
1400
1600
1800
Jun-06 Dec-06 Jun-07 Dec-07 Jun-08 Dec-08 Jun-09
0
10
20
30
40
50
60
70
80
90
Domestic production (Mt) - RHS Shanxi (Daixian)
Liaoning (Beipiano) Hubei (Daye)
Innner Mongolia (Baotou)
We believe an incentive price for additional capacity is within the range of US65-75c/dmtu
Source: RBS estimates
Internal rates of return for various iron ore prices and operating costs
0
0.05
0.1
0.15
0.2
0.25
0.3
0.35
35 40 45 50 55 60 65 70 75 80 85 90 95 100
Fines price (dmtu)
IRR
10
16
20
26
30
FOB cost US$/wmt
A look at incentive prices
We have traditionally used an incentive price methodology to determine our
long-term price assumption for iron ore. This is because there is more data
available from listed producers, and the growth in production capacity in Brazil
and Australia was driven by the potential return to shareholders. However, we
also took into account that new or additional developments by the major
producers would be able to leverage off existing operations and may therefore
have a lower investment hurdle.
There appears to be no hard and fast rule on internal rates of return on
brownfields expansions – companies seem to have targets of 30%-plus returns,
but our modelling of projects indicates this may be after taking into account
relatively minor increments in capital and factors in shared benefits from existing
capacity. In our modelling we assume a base capex per wet metric tonne of
capacity of US$100/t, which seems to be a reasonable ballpark estimate for
Australian capacity additions. In other less-developed countries this probably
doesn’t hold true. For example, our past modelling of the potential Simandou
deposit in Guinea used a capital intensity of US$150/t, and this may have been
on the low side when taking into account the amount of infrastructure required
and the potential compensation payments. We believe an incentive price for
additional capacity is within the range of US65-75c/dmtu.
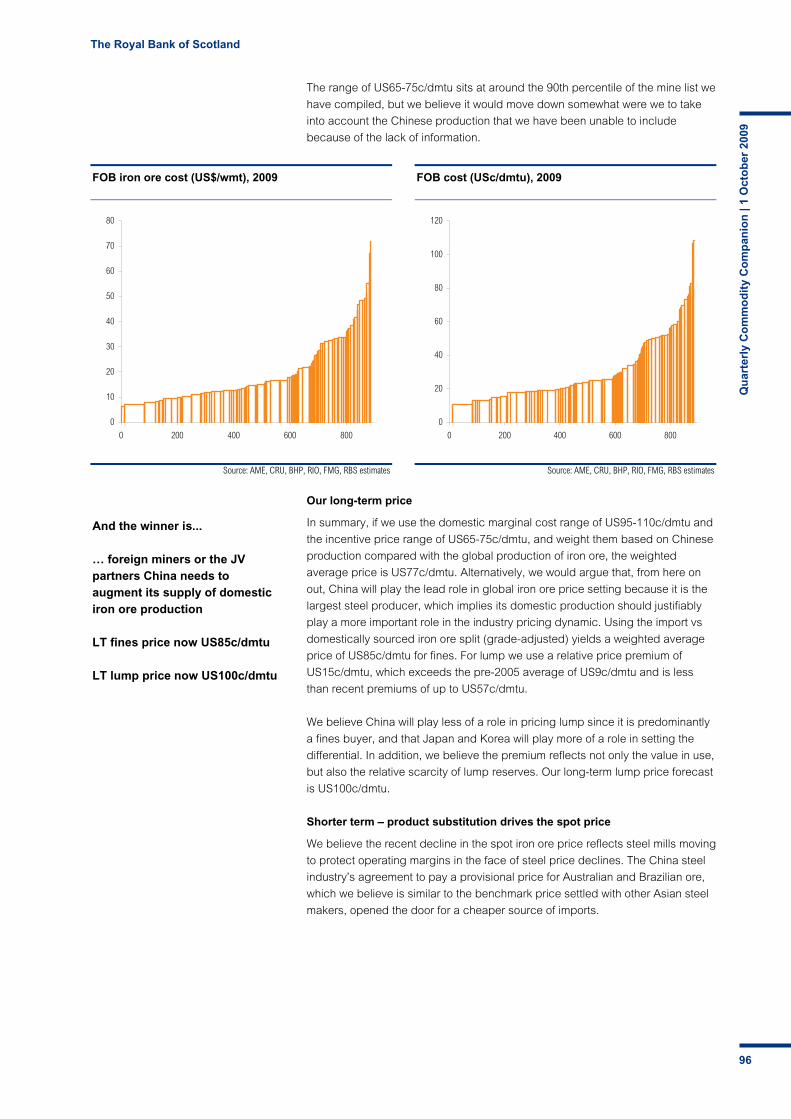
The Royal Bank of Scotland
Qu
arte
rly
Co
mm
od
ity
Co
mp
anio
n |
1 O
cto
ber
200
9
96
Source: AME, CRU, BHP, RIO, FMG, RBS estimates
FOB iron ore cost (US$/wmt), 2009
0
10
20
30
40
50
60
70
80
0 200 400 600 800
Source: AME, CRU, BHP, RIO, FMG, RBS estimates
FOB cost (USc/dmtu), 2009
0
20
40
60
80
100
120
0 200 400 600 800
And the winner is...
… foreign miners or the JV partners China needs to augment its supply of domestic iron ore production
LT fines price now US85c/dmtu
LT lump price now US100c/dmtu
The range of US65-75c/dmtu sits at around the 90th percentile of the mine list we
have compiled, but we believe it would move down somewhat were we to take
into account the Chinese production that we have been unable to include
because of the lack of information.
Our long-term price
In summary, if we use the domestic marginal cost range of US95-110c/dmtu and
the incentive price range of US65-75c/dmtu, and weight them based on Chinese
production compared with the global production of iron ore, the weighted
average price is US77c/dmtu. Alternatively, we would argue that, from here on
out, China will play the lead role in global iron ore price setting because it is the
largest steel producer, which implies its domestic production should justifiably
play a more important role in the industry pricing dynamic. Using the import vs
domestically sourced iron ore split (grade-adjusted) yields a weighted average
price of US85c/dmtu for fines. For lump we use a relative price premium of
US15c/dmtu, which exceeds the pre-2005 average of US9c/dmtu and is less
than recent premiums of up to US57c/dmtu.
We believe China will play less of a role in pricing lump since it is predominantly
a fines buyer, and that Japan and Korea will play more of a role in setting the
differential. In addition, we believe the premium reflects not only the value in use,
but also the relative scarcity of lump reserves. Our long-term lump price forecast
is US100c/dmtu.
Shorter term – product substitution drives the spot price
We believe the recent decline in the spot iron ore price reflects steel mills moving
to protect operating margins in the face of steel price declines. The China steel
industry’s agreement to pay a provisional price for Australian and Brazilian ore,
which we believe is similar to the benchmark price settled with other Asian steel
makers, opened the door for a cheaper source of imports.
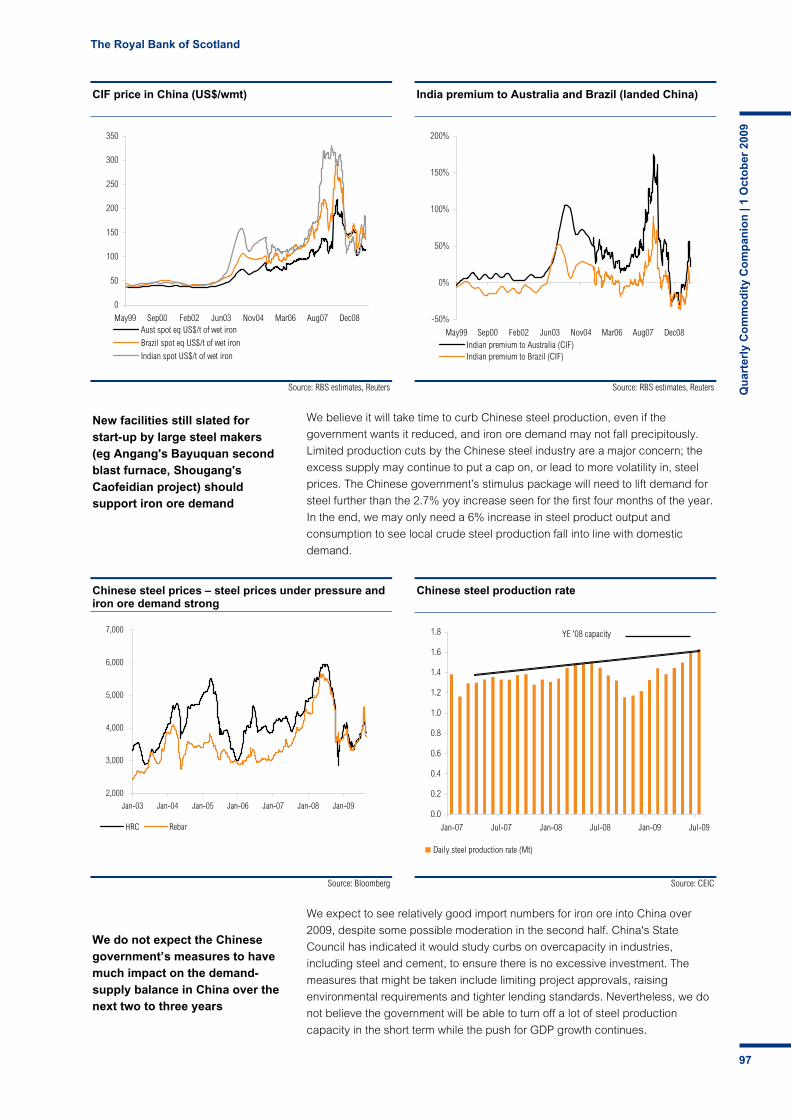
The Royal Bank of Scotland
Qu
arte
rly
Co
mm
od
ity
Co
mp
anio
n |
1 O
cto
ber
200
9
97
Source: RBS estimates, Reuters
CIF price in China (US$/wmt)
0
50
100
150
200
250
300
350
May99 Sep00 Feb02 Jun03 Nov04 Mar06 Aug07 Dec08Aust spot eq US$/t of wet iron
Brazil spot eq US$/t of wet iron
Indian spot US$/t of wet iron
Source: RBS estimates, Reuters
India premium to Australia and Brazil (landed China)
-50%
0%
50%
100%
150%
200%
May99 Sep00 Feb02 Jun03 Nov04 Mar06 Aug07 Dec08Indian premium to Australia (CIF)Indian premium to Brazil (CIF)
New facilities still slated for start-up by large steel makers (eg Angang's Bayuquan second blast furnace, Shougang's Caofeidian project) should support iron ore demand
Source: Bloomberg
Chinese steel prices – steel prices under pressure and iron ore demand strong
2,000
3,000
4,000
5,000
6,000
7,000
Jan-03 Jan-04 Jan-05 Jan-06 Jan-07 Jan-08 Jan-09
HRC Rebar
Source: CEIC
Chinese steel production rate
0.0
0.2
0.4
0.6
0.8
1.0
1.2
1.4
1.6
1.8
Jan-07 Jul-07 Jan-08 Jul-08 Jan-09 Jul-09
Daily steel production rate (Mt)
YE '08 capacity
We do not expect the Chinese government’s measures to have much impact on the demand-supply balance in China over the next two to three years
We believe it will take time to curb Chinese steel production, even if the
government wants it reduced, and iron ore demand may not fall precipitously.
Limited production cuts by the Chinese steel industry are a major concern; the
excess supply may continue to put a cap on, or lead to more volatility in, steel
prices. The Chinese government’s stimulus package will need to lift demand for
steel further than the 2.7% yoy increase seen for the first four months of the year.
In the end, we may only need a 6% increase in steel product output and
consumption to see local crude steel production fall into line with domestic
demand.
We expect to see relatively good import numbers for iron ore into China over
2009, despite some possible moderation in the second half. China's State
Council has indicated it would study curbs on overcapacity in industries,
including steel and cement, to ensure there is no excessive investment. The
measures that might be taken include limiting project approvals, raising
environmental requirements and tighter lending standards. Nevertheless, we do
not believe the government will be able to turn off a lot of steel production
capacity in the short term while the push for GDP growth continues.

The Royal Bank of Scotland
Qu
arte
rly
Co
mm
od
ity
Co
mp
anio
n |
1 O
cto
ber
200
9
98
Over that time, what is more important is the pace of demand recovery to absorb the current excesses
Source: CEIC
Percentage of iron ore domestically sourced in China
40%
50%
60%
70%
80%
90%
Jan-99 Jan-00 Jan-01 Jan-02 Jan-03 Jan-04 Jan-05 Jan-06 Jan-07 Jan-08 Jan-09
We also expect to see Chinese iron ore production reverse its recent upward
trend and reflect the volatility in steel prices. We do believe the Chinese steel
producers and traders will have to take their foot off the import pedal at some
stage. The positive for Australia and Brazil is that ore priced on a provisional
basis is more competitive than spot Indian ore on a landed basis, particularly
with the recent decline in freight rates.
Stocks not an issue while steel production continues
China’s iron ore imports should therefore remain relatively robust in the medium
term due to falling domestic production and a levelling out of steel production
growth. We believe it is fair to say that no one really knows where the Chinese
market is in terms of restocking. However, it does appear that the supply chain in
China is now coping with the outload requirements and that port stocks have
stabilised, allowing for a reduction in port congestion and effectively freeing up
the cape market, thus leading to lower freight rates.
Source: CEIC, RBS estimates
China’s port stocks not an issue based on steel production rate
0
20
40
60
80
Jun-06 Dec-06 Jun-07 Dec-07 Jun-08 Dec-08 Jun-09
10
20
30
40
50
Chinese port inventory (Mt) Days of inventory

The Royal Bank of Scotland
Qu
arte
rly
Co
mm
od
ity
Co
mp
anio
n |
1 O
cto
ber
200
9
99
We believe the supply-demand imbalance is small enough to be removed, with minor changes in Chinese domestic supply
It is in the buyer’s interest to ensure that capacity additions do occur in the future to avoid a recurrence of the 2008 spike
What is potentially more important for the iron ore outlook is the level of steel
stocks the Chinese end up with in 2010, which in turn will influence the relative
bargaining position of industry participants. It seems reasonable to us to infer
that the rapid increase in output by Chinese steel producers may have outpaced
the current demand recovery. In recent weeks, Chinese steel prices have fallen
about 25% from the peak, on stock builds and the potential for the government to
take some action against traders to curb excess, which we believe will lead to a
softening in 2H09 demand through the product chain.
We do believe the Chinese government will instigate stricter control of future
capacity additions, which would be a positive for the industry, in our view,
particularly if future new capacity additions can be controlled. However, it
remains to be seen how successful such curbs might be. Since 2005, when
China first became a net exporter of steel, it has been a stated objective of the
government that inefficient capacity should be reduced and that industry
structure should be improved. Since then, capacity increases have continued
(albeit not all are inefficient) and several provinces have undertaken restructuring
with the objective of increasing their capacity overall in the long term.
In summary, we forecast a marginal under-utilisation of iron ore production
capacity over the next four years. However, the implied supply-demand
imbalance should be small enough to be removed, with minor changes in
Chinese domestic supply. The wildcards we see for reduced export capacity
are: 1) India, where the government indicates that it intends to preserve iron ore
for its domestic steel industry; and 2) the lasting impact of the global financial
crisis, which has seen majors halt expansions and junior producers struggle to
fund capital expenditure. From an iron-ore-demand perspective, we see the
potential for Chinese steel producers to reduce their reliance upon domestic ore.
Iron ore price forecasts (FOB Australia)
Year-end: 31 March 2007A 2008A 2009A 2010A 2011F 2012F 2013F 2014F 2015F LT
Fines – USc/dltu 74.64 81.73 146.98 98.56 108.41 116.54 104.89 94.40 80.24 86.36
- USc/dmtu 73.46 80.44 144.67 97.00 106.70 114.71 103.24 92.91 78.98 85.00
- US$/t @ 62%Fe/7% moisture 42.4 46.4 83.4 55.9 61.5 66.1 59.5 53.6 45.5 49.0
% change yoy 19.0% 9.5% 79.9% -32.9% 10.0% 7.5% -10.0% -10.0% -15.0% 7.6%
% change from previous forecast - - - 0% 5% 5% 5% 11% 18% 33%
Lump – USc/dltu 95.25 104.29 204.94 113.80 125.18 134.57 124.47 112.03 95.22 101.60
- USc/dmtu 93.75 102.65 201.71 112.01 123.21 132.45 122.51 110.26 93.72 100.00
- US$/t @ 62%Fe/4% moisture 55.8 61.1 120.1 66.7 73.3 78.8 72.9 65.6 55.8 59.5
% change yoy 19.0% 9.5% 96.5% -44.5% 10.0% 7.5% -7.5% -10.0% -15.0% 6.7%
% change from previous forecast - - - 0% -2% -2% 3% 10% 22% 0%
Source: TEX, RBS forecasts
World iron ore supply-demand balance – 2005-15F
(Mt) 2005E 2006E 2007E 2008E 2009F 2010F 2011F 2012F 2013F 2014F 2015F
Total iron ore production 1,544 1,781 1,991 2,122 2,120 2,235 2,337 2,454 2,509 2,537 2,552
% change 15.8% 15.4% 11.8% 6.6% -0.1% 5.4% 4.6% 5.0% 2.3% 1.1% 0.6%
Total steel production 1,104 1,216 1,317 1,302 1,230 1,323 1,393 1,469 1,552 1,641 1,737
% change 6.5% 10.2% 8.3% -1.2% -5.5% 7.6% 5.3% 5.5% 5.6% 5.7% 5.9%
Chinese steel production 348 421 487 498 527 595 642 700 763 832 906
% change 26.9% 21.1% 15.6% 2.2% 5.9% 12.8% 8.0% 9.0% 9.0% 9.0% 9.0%
% of total 31.5% 34.6% 37.0% 38.3% 42.8% 44.9% 46.1% 47.6% 49.2% 50.7% 52.2%
Total steel production from iron ore (primary) 751 826 909 898 849 906 954 1,007 1,063 1,124 1,190
% change 9.7% 10.0% 10.0% -1.2% -5.5% 6.8% 5.3% 5.5% 5.6% 5.7% 5.9%
Total iron ore demand 1,549 1,789 2,024 2,091 2,055 2,202 2,305 2,402 2,477 2,589 2,709
% change 15.5% 15.5% 13.2% 3.3% -1.7% 7.2% 4.7% 4.2% 3.1% 4.5% 4.7%
Supply-demand balance -5 -7 -33 31 65 33 32 52 32 -52 -157
Avg iron ore price change 71.5% 19.0% 9.5% 96.5% -44.5% 10.0% 7.5% -7.5% -10.0% 0.0% 0.0%
Source: IISI, TEX, RBS forecasts

The Royal Bank of Scotland
Qu
arte
rly
Co
mm
od
ity
Co
mp
anio
n |
1 O
cto
ber
200
9
100
Source: TEX, RBS forecasts
Metallurgical coal prices (US$/t)
0
50
100
150
200
250
300
350
1986A 1988A 1990A 1993A 1995A 1998A 2001A 2003A 2006A 2008A 2011F 2013F
Hard coking coal benchmark Semi-soft coking coal LV PCI
Coal
No return to previous price lows
We have upgraded our long-term and short-term coal prices. Long-term
prices have increased 14-27% to reflect what we believe will be a longer-
term effect of production costs on prices. An improvement in demand has
seen our short-term prices increase 5-15%, with China consuming the spare
tonnage.
Broad pricing spectrum
The thermal coal market is suffering from arbitrage pricing. China is now in the
driver’s seat for coal, its move to increase imports having taken up the slack in
the market. After the recovery in demand for thermal coal the spot market has
eased back and is now being driven by the pricing of Chinese domestic coal
relative to low-grade Indonesian coal or Australian/South African product. We do
not see this changing in the short term.
Metallurgical coal prices are benefitting from a tight market
The 20mt turnaround in metallurgical imports into China was enough to rapidly
tighten the market for that product, which had already braced itself for a
dramatic decline in Asian and European demand by factoring in capacity
reductions.
Long-term coal up to offset costs
We have changed our view about potential cost reductions in the Australian coal
sector and believe cost pressures will also be felt by the Chinese coal industry,
which could lead to China’s ongoing participation in the seaborne coal market as
a buyer. We believe these factors are likely to be reflected in long-term
metallurgical coal prices, and we expect the thermal coal market to benefit from
the impact of lower than previously anticipated export tonnes and poorer-quality
coal out of Indonesia, offsetting cost pressures.
Warren Edney, Australia Senior Mining Analyst [email protected] +613 9612 1557
RBS Australian mining team
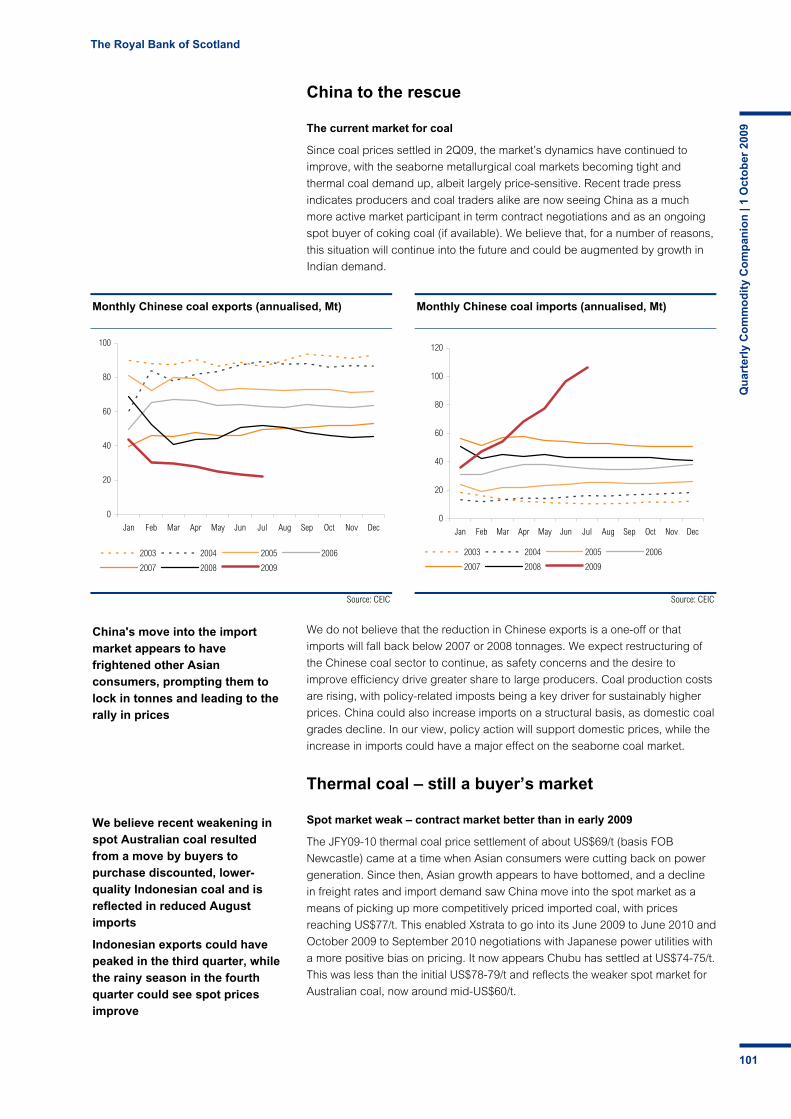
The Royal Bank of Scotland
Qu
arte
rly
Co
mm
od
ity
Co
mp
anio
n |
1 O
cto
ber
200
9
101
Source: CEIC
Monthly Chinese coal exports (annualised, Mt)
0
20
40
60
80
100
Jan Feb Mar Apr May Jun Jul Aug Sep Oct Nov Dec
2003 2004 2005 2006
2007 2008 2009
Source: CEIC
Monthly Chinese coal imports (annualised, Mt)
0
20
40
60
80
100
120
Jan Feb Mar Apr May Jun Jul Aug Sep Oct Nov Dec
2003 2004 2005 2006
2007 2008 2009
China's move into the import market appears to have frightened other Asian consumers, prompting them to lock in tonnes and leading to the rally in prices
We believe recent weakening in spot Australian coal resulted from a move by buyers to purchase discounted, lower-quality Indonesian coal and is reflected in reduced August imports
Indonesian exports could have peaked in the third quarter, while the rainy season in the fourth quarter could see spot prices improve
China to the rescue
The current market for coal
Since coal prices settled in 2Q09, the market’s dynamics have continued to
improve, with the seaborne metallurgical coal markets becoming tight and
thermal coal demand up, albeit largely price-sensitive. Recent trade press
indicates producers and coal traders alike are now seeing China as a much
more active market participant in term contract negotiations and as an ongoing
spot buyer of coking coal (if available). We believe that, for a number of reasons,
this situation will continue into the future and could be augmented by growth in
Indian demand.
We do not believe that the reduction in Chinese exports is a one-off or that
imports will fall back below 2007 or 2008 tonnages. We expect restructuring of
the Chinese coal sector to continue, as safety concerns and the desire to
improve efficiency drive greater share to large producers. Coal production costs
are rising, with policy-related imposts being a key driver for sustainably higher
prices. China could also increase imports on a structural basis, as domestic coal
grades decline. In our view, policy action will support domestic prices, while the
increase in imports could have a major effect on the seaborne coal market.
Thermal coal – still a buyer’s market
Spot market weak – contract market better than in early 2009
The JFY09-10 thermal coal price settlement of about US$69/t (basis FOB
Newcastle) came at a time when Asian consumers were cutting back on power
generation. Since then, Asian growth appears to have bottomed, and a decline
in freight rates and import demand saw China move into the spot market as a
means of picking up more competitively priced imported coal, with prices
reaching US$77/t. This enabled Xstrata to go into its June 2009 to June 2010 and
October 2009 to September 2010 negotiations with Japanese power utilities with
a more positive bias on pricing. It now appears Chubu has settled at US$74-75/t.
This was less than the initial US$78-79/t and reflects the weaker spot market for
Australian coal, now around mid-US$60/t.
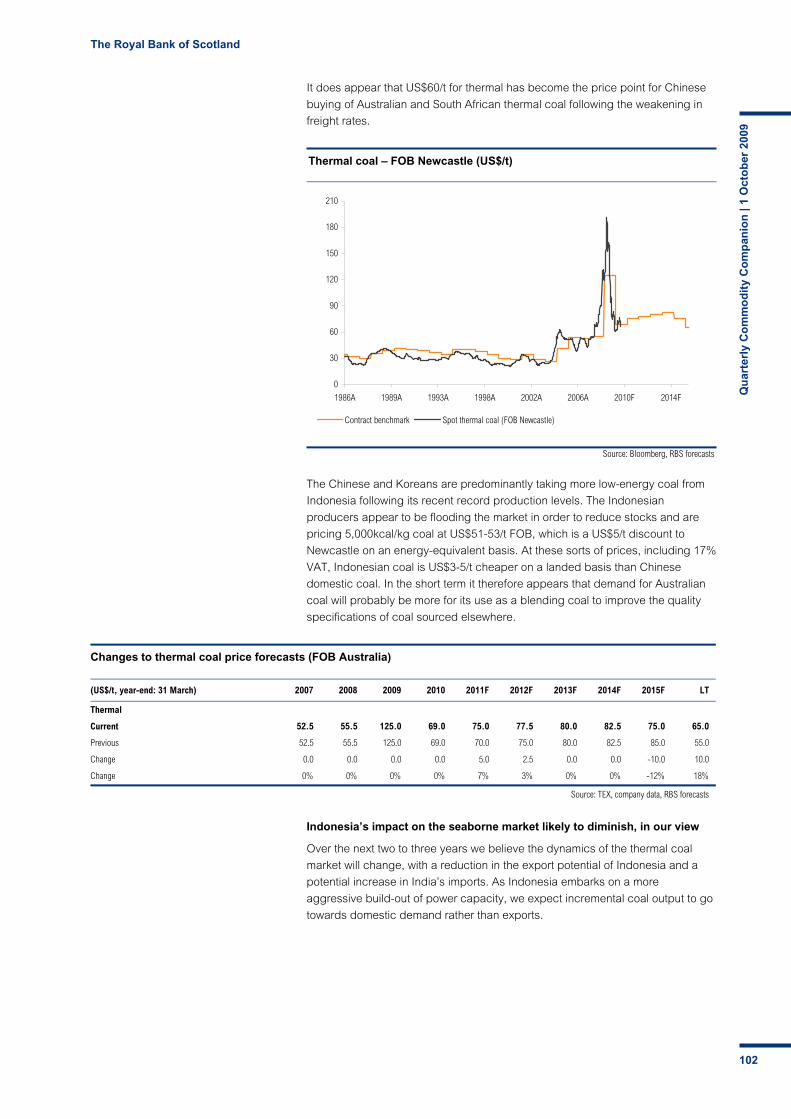
The Royal Bank of Scotland
Qu
arte
rly
Co
mm
od
ity
Co
mp
anio
n |
1 O
cto
ber
200
9
102
Source: Bloomberg, RBS forecasts
Thermal coal – FOB Newcastle (US$/t)
0
30
60
90
120
150
180
210
1986A 1989A 1993A 1998A 2002A 2006A 2010F 2014F
Contract benchmark Spot thermal coal (FOB Newcastle)
It does appear that US$60/t for thermal has become the price point for Chinese
buying of Australian and South African thermal coal following the weakening in
freight rates.
The Chinese and Koreans are predominantly taking more low-energy coal from
Indonesia following its recent record production levels. The Indonesian
producers appear to be flooding the market in order to reduce stocks and are
pricing 5,000kcal/kg coal at US$51-53/t FOB, which is a US$5/t discount to
Newcastle on an energy-equivalent basis. At these sorts of prices, including 17%
VAT, Indonesian coal is US$3-5/t cheaper on a landed basis than Chinese
domestic coal. In the short term it therefore appears that demand for Australian
coal will probably be more for its use as a blending coal to improve the quality
specifications of coal sourced elsewhere.
Indonesia’s impact on the seaborne market likely to diminish, in our view
Over the next two to three years we believe the dynamics of the thermal coal
market will change, with a reduction in the export potential of Indonesia and a
potential increase in India’s imports. As Indonesia embarks on a more
aggressive build-out of power capacity, we expect incremental coal output to go
towards domestic demand rather than exports.
Changes to thermal coal price forecasts (FOB Australia)
(US$/t, year-end: 31 March) 2007 2008 2009 2010 2011F 2012F 2013F 2014F 2015F LT
Thermal
Current 52.5 55.5 125.0 69.0 75.0 77.5 80.0 82.5 75.0 65.0
Previous 52.5 55.5 125.0 69.0 70.0 75.0 80.0 82.5 85.0 55.0
Change 0.0 0.0 0.0 0.0 5.0 2.5 0.0 0.0 -10.0 10.0
Change 0% 0% 0% 0% 7% 3% 0% 0% -12% 18%
Source: TEX, company data, RBS forecasts

The Royal Bank of Scotland
Qu
arte
rly
Co
mm
od
ity
Co
mp
anio
n |
1 O
cto
ber
200
9
103
Source: Ministry of Energy & Mineral Resources
Indonesia’s energy mix shifting towards coal (% total)
55
2016
9
48
29
19
4
20
3135
24
0
10
20
30
40
50
60
Oil Gas Coal Renewable
2005A 2008A 2025F
Source: Indonesia Coal Mining Association
Indonesia’s coal demand-supply forecasts (m tonnes)
238 250 260
326
364
421
170 175 170151
184 185
68 7590
175 180
236
0
50
100
150
200
250
300
350
400
450
2008A 2009F 2010F 2015F 2020F 2025F
Production Export Sales Domestic Sales
India's investment in infrastructure is also increasing and, in the government’s latest budget, spending on power plants was projected to increase 45% yoy
Supply appears set to remain constrained in the second half of 2009, which should support price outcomes in 2010
Indonesian coal output expansion plans may also fall short of expectations, with much of the country’s slated growth to come from lower calorific value coal, which is less attractive to importers
The Indonesian coal producers have aggressive plans to expand output, but the
Indonesian Coal Mining Association has less optimistic projections about the
pace of such additions. We also believe capacity expansion may be slower than
our previous expectations. As a result, we expect little change in the volume of
coal exports from the largest supplier of thermal coal to the export market. We
also note that much of the planned volume growth in Indonesia is in lower
calorific value coal, which is likely to be less attractive to importers.
India is also stepping up its investment in infrastructure, including power plants.
In the Indian government’s latest budget, spending on power plants was
projected to increase 45% yoy, a step up from the 14-22% annual growth we
have seen within the past few years. However, coal production in India has not
kept pace with this growth, resulting in a rising need for imports, which we
believe are likely to exceed previous government projections of 61Mt by FY12.
This probably leaves Australia as a marginal exporter of coal, which, in turn,
would necessitate new mine developments and infrastructure builds that, at
present, continue to be postponed (see our previous comments on Australian
infrastructure). We also see potential for even more problematic growth options,
such as the development of the Mongolian coal deposits, which, although they
are land-locked, could supply demand growth in China, thereby allowing China
to resume its place as a supplier of coal into the Asian market.
Metallurgical coal (coking coal)
Benchmark prices for metallurgical coal for JFY09-10 were settled at US$128/t
for premium hard coking coal, US$86/t for LV PCI coal and US$78.50/t for semi-
soft coking coal. As with thermal coal (albeit in a more opaque manner), it
appears the increase in Chinese steel production, and therefore in flat Asian
steel production, has led to a tightening in metallurgical coal markets. The
curtailment of production increases, coupled with rail constraints, have had a
positive effect on prices.
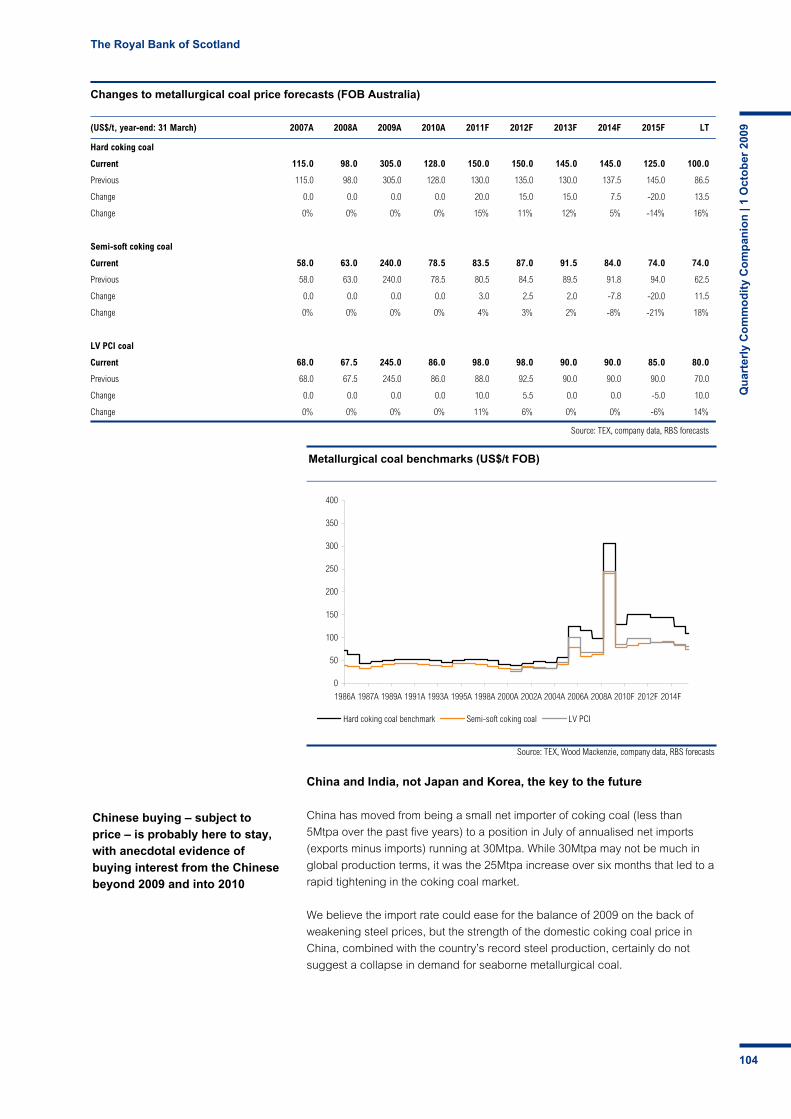
The Royal Bank of Scotland
Qu
arte
rly
Co
mm
od
ity
Co
mp
anio
n |
1 O
cto
ber
200
9
104
Source: TEX, Wood Mackenzie, company data, RBS forecasts
Metallurgical coal benchmarks (US$/t FOB)
0
50
100
150
200
250
300
350
400
1986A 1987A 1989A 1991A 1993A 1995A 1998A 2000A 2002A 2004A 2006A 2008A 2010F 2012F 2014F
Hard coking coal benchmark Semi-soft coking coal LV PCI
Chinese buying – subject to price – is probably here to stay, with anecdotal evidence of buying interest from the Chinese beyond 2009 and into 2010
China and India, not Japan and Korea, the key to the future
China has moved from being a small net importer of coking coal (less than
5Mtpa over the past five years) to a position in July of annualised net imports
(exports minus imports) running at 30Mtpa. While 30Mtpa may not be much in
global production terms, it was the 25Mtpa increase over six months that led to a
rapid tightening in the coking coal market.
We believe the import rate could ease for the balance of 2009 on the back of
weakening steel prices, but the strength of the domestic coking coal price in
China, combined with the country’s record steel production, certainly do not
suggest a collapse in demand for seaborne metallurgical coal.
Changes to metallurgical coal price forecasts (FOB Australia)
(US$/t, year-end: 31 March) 2007A 2008A 2009A 2010A 2011F 2012F 2013F 2014F 2015F LT
Hard coking coal
Current 115.0 98.0 305.0 128.0 150.0 150.0 145.0 145.0 125.0 100.0
Previous 115.0 98.0 305.0 128.0 130.0 135.0 130.0 137.5 145.0 86.5
Change 0.0 0.0 0.0 0.0 20.0 15.0 15.0 7.5 -20.0 13.5
Change 0% 0% 0% 0% 15% 11% 12% 5% -14% 16%
Semi-soft coking coal
Current 58.0 63.0 240.0 78.5 83.5 87.0 91.5 84.0 74.0 74.0
Previous 58.0 63.0 240.0 78.5 80.5 84.5 89.5 91.8 94.0 62.5
Change 0.0 0.0 0.0 0.0 3.0 2.5 2.0 -7.8 -20.0 11.5
Change 0% 0% 0% 0% 4% 3% 2% -8% -21% 18%
LV PCI coal
Current 68.0 67.5 245.0 86.0 98.0 98.0 90.0 90.0 85.0 80.0
Previous 68.0 67.5 245.0 86.0 88.0 92.5 90.0 90.0 90.0 70.0
Change 0.0 0.0 0.0 0.0 10.0 5.5 0.0 0.0 -5.0 10.0
Change 0% 0% 0% 0% 11% 6% 0% 0% -6% 14%
Source: TEX, company data, RBS forecasts

The Royal Bank of Scotland
Qu
arte
rly
Co
mm
od
ity
Co
mp
anio
n |
1 O
cto
ber
200
9
105
Source: CEIC
Chinese monthly coking coal trade (annualised, Mt)
-40
-30
-20
-10
0
10
20
Jan Feb Mar Apr May Jun Jul Aug Sep Oct Nov Dec2003 2004 2005 2006 2007
2008 2009
Net exports
Net imports
Spot prices for hard coking coal now appear to be US$165-175/t FOB Queensland, up from US$140-145/t in July
“In addition, India has been attracting a lot of investment into its steel industry,
with many domestic and global producers having announced plans to set up
large steel projects, drawn by the country’s abundance of iron ore. These plans
have been delayed by the long approval process, and this has been
exacerbated by the financial crisis. However, when these projects eventually get
off the ground, India’s need for imported coking coal will rise. Based on the
Ministry of Steel’s projections under the 11th Five-Year plan (FY08-12), India’s
imported coking coal needs will rise to 45Mt from 23Mt in FY07.” – excerpt from
‘Basic Elements – Coal roads lead to Asia’, published 9 September 2009 by RBS
Metals and Mining analyst in Hong Kong, Jeannette Sim.
Hard coking coal market tight
Comments by Australian producers and trade press indicate that 2H09 spot
sales outcomes may now be based on being able to source spot tonnages of
premium hard coking coal rather than the price paid. Metallurgical coal supply,
particularly out of Queensland, is being hampered by rail performance and some
constraints at mine sites. Sites scaled back with the weakening market in 2008
and now lack some flexibility in mining, and hence in their ability to blend coals
to meet typical product specifications for long-term customers. It appears that
many mines sacrificed maintaining flexibility in their mining schedules in favour
of selling everything they could (into spot demand) in the first half. This could see
the market tighten even further in the second half if demand remains at current
levels.
We believe freight markets and the treatment of carry-over will play a big part in
negotiations for delivery in 2009 and beyond. For example, there is a big spread
in the market pricing of hard coking coal, ranging from US$115 to US$175/t.
However, the lower figure does not reflect a weakening market.
India's projected coal imports set to rise by to 105.4mt by 2012F
(Mt) FY08 FY09 FY10 FY11 FY12
Thermal coal 39.0 34.6 42.0 52.6 60.7
Coking coal 20.7 23.4 32.0 41.4 44.7
Total 59.7 58.0 74.0 94.0 105.4
Source: Report of the Working Group for the 11th Five-Year plan
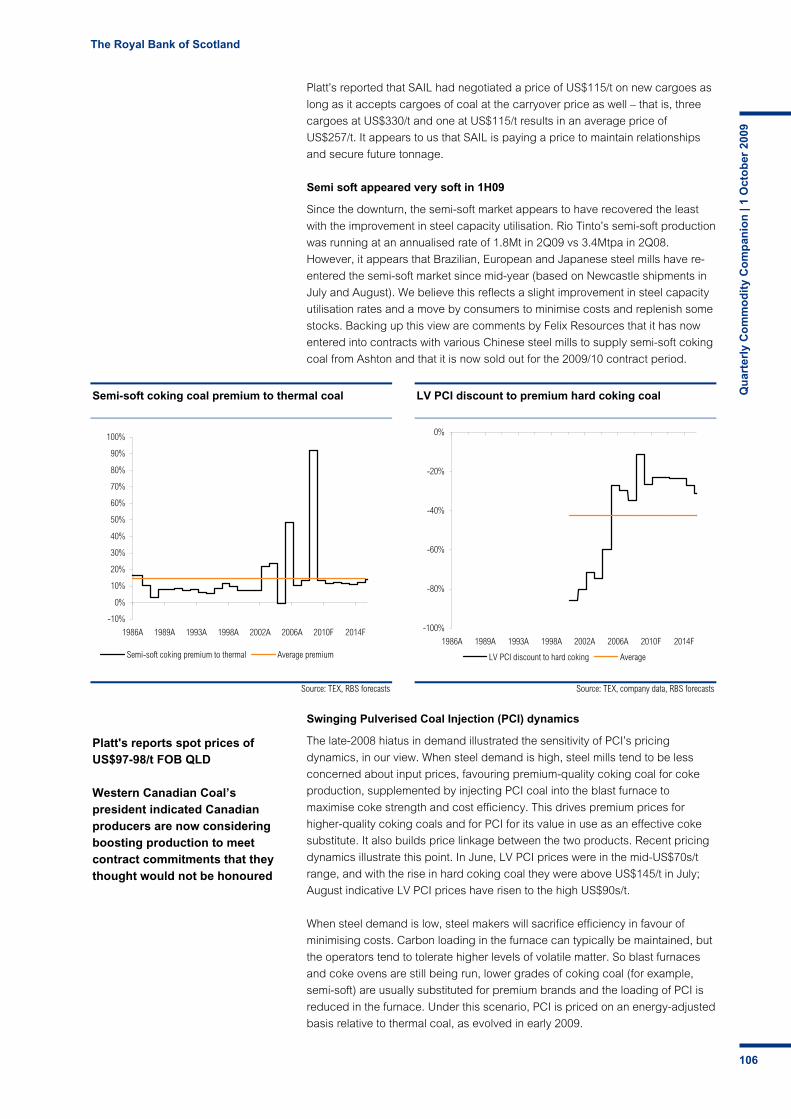
The Royal Bank of Scotland
Qu
arte
rly
Co
mm
od
ity
Co
mp
anio
n |
1 O
cto
ber
200
9
106
Source: TEX, RBS forecasts
Semi-soft coking coal premium to thermal coal
-10%
0%
10%
20%
30%
40%
50%
60%
70%
80%
90%
100%
1986A 1989A 1993A 1998A 2002A 2006A 2010F 2014F
Semi-soft coking premium to thermal Average premium
Source: TEX, company data, RBS forecasts
LV PCI discount to premium hard coking coal
-100%
-80%
-60%
-40%
-20%
0%
1986A 1989A 1993A 1998A 2002A 2006A 2010F 2014F
LV PCI discount to hard coking Average
Platt's reports spot prices of US$97-98/t FOB QLD
Western Canadian Coal’s president indicated Canadian producers are now considering boosting production to meet contract commitments that they thought would not be honoured
Platt’s reported that SAIL had negotiated a price of US$115/t on new cargoes as
long as it accepts cargoes of coal at the carryover price as well – that is, three
cargoes at US$330/t and one at US$115/t results in an average price of
US$257/t. It appears to us that SAIL is paying a price to maintain relationships
and secure future tonnage.
Semi soft appeared very soft in 1H09
Since the downturn, the semi-soft market appears to have recovered the least
with the improvement in steel capacity utilisation. Rio Tinto’s semi-soft production
was running at an annualised rate of 1.8Mt in 2Q09 vs 3.4Mtpa in 2Q08.
However, it appears that Brazilian, European and Japanese steel mills have re-
entered the semi-soft market since mid-year (based on Newcastle shipments in
July and August). We believe this reflects a slight improvement in steel capacity
utilisation rates and a move by consumers to minimise costs and replenish some
stocks. Backing up this view are comments by Felix Resources that it has now
entered into contracts with various Chinese steel mills to supply semi-soft coking
coal from Ashton and that it is now sold out for the 2009/10 contract period.
Swinging Pulverised Coal Injection (PCI) dynamics
The late-2008 hiatus in demand illustrated the sensitivity of PCI’s pricing
dynamics, in our view. When steel demand is high, steel mills tend to be less
concerned about input prices, favouring premium-quality coking coal for coke
production, supplemented by injecting PCI coal into the blast furnace to
maximise coke strength and cost efficiency. This drives premium prices for
higher-quality coking coals and for PCI for its value in use as an effective coke
substitute. It also builds price linkage between the two products. Recent pricing
dynamics illustrate this point. In June, LV PCI prices were in the mid-US$70s/t
range, and with the rise in hard coking coal they were above US$145/t in July;
August indicative LV PCI prices have risen to the high US$90s/t.
When steel demand is low, steel makers will sacrifice efficiency in favour of
minimising costs. Carbon loading in the furnace can typically be maintained, but
the operators tend to tolerate higher levels of volatile matter. So blast furnaces
and coke ovens are still being run, lower grades of coking coal (for example,
semi-soft) are usually substituted for premium brands and the loading of PCI is
reduced in the furnace. Under this scenario, PCI is priced on an energy-adjusted
basis relative to thermal coal, as evolved in early 2009.
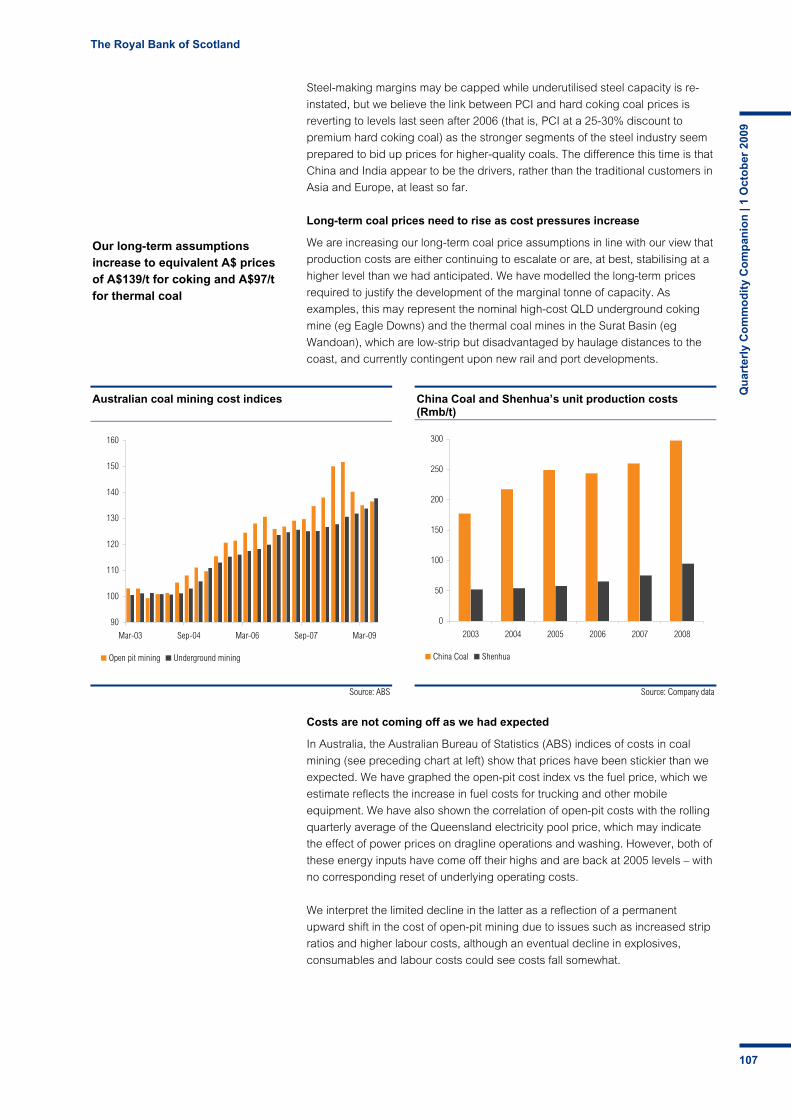
The Royal Bank of Scotland
Qu
arte
rly
Co
mm
od
ity
Co
mp
anio
n |
1 O
cto
ber
200
9
107
Our long-term assumptions increase to equivalent A$ prices of A$139/t for coking and A$97/t for thermal coal
Source: ABS
Australian coal mining cost indices
90
100
110
120
130
140
150
160
Mar-03 Sep-04 Mar-06 Sep-07 Mar-09
Open pit mining Underground mining
Source: Company data
China Coal and Shenhua’s unit production costs (Rmb/t)
0
50
100
150
200
250
300
2003 2004 2005 2006 2007 2008
China Coal Shenhua
Steel-making margins may be capped while underutilised steel capacity is re-
instated, but we believe the link between PCI and hard coking coal prices is
reverting to levels last seen after 2006 (that is, PCI at a 25-30% discount to
premium hard coking coal) as the stronger segments of the steel industry seem
prepared to bid up prices for higher-quality coals. The difference this time is that
China and India appear to be the drivers, rather than the traditional customers in
Asia and Europe, at least so far.
Long-term coal prices need to rise as cost pressures increase
We are increasing our long-term coal price assumptions in line with our view that
production costs are either continuing to escalate or are, at best, stabilising at a
higher level than we had anticipated. We have modelled the long-term prices
required to justify the development of the marginal tonne of capacity. As
examples, this may represent the nominal high-cost QLD underground coking
mine (eg Eagle Downs) and the thermal coal mines in the Surat Basin (eg
Wandoan), which are low-strip but disadvantaged by haulage distances to the
coast, and currently contingent upon new rail and port developments.
Costs are not coming off as we had expected
In Australia, the Australian Bureau of Statistics (ABS) indices of costs in coal
mining (see preceding chart at left) show that prices have been stickier than we
expected. We have graphed the open-pit cost index vs the fuel price, which we
estimate reflects the increase in fuel costs for trucking and other mobile
equipment. We have also shown the correlation of open-pit costs with the rolling
quarterly average of the Queensland electricity pool price, which may indicate
the effect of power prices on dragline operations and washing. However, both of
these energy inputs have come off their highs and are back at 2005 levels – with
no corresponding reset of underlying operating costs.
We interpret the limited decline in the latter as a reflection of a permanent
upward shift in the cost of open-pit mining due to issues such as increased strip
ratios and higher labour costs, although an eventual decline in explosives,
consumables and labour costs could see costs fall somewhat.

The Royal Bank of Scotland
Qu
arte
rly
Co
mm
od
ity
Co
mp
anio
n |
1 O
cto
ber
200
9
108
Source: ABS, Bloomberg
Australian open-pit coal mining cost index and fuel price (US$/bbl)
90
100
110
120
130
140
150
160
Dec-01 Dec-03 Dec-05 Dec-07
0
20
40
60
80
100
120
140
160
180
200
Open pit mining Fuel price (US$/bbl) - RHS
Source: ABS, NEMMCO
Australian open-pit mining cost index vs the electricity price (average Queensland pool) (A$/Mwh)
90
100
110
120
130
140
150
160
Dec-01 Dec-03 Dec-05 Dec-07
0
10
20
30
40
50
60
70
80
Open pit mining Rolling qtrly ave pool price - RHS
Policy costs have been a factor in raising the overall cost of Chinese coal production...
... while mining costs may rise over time, as we believe the more accessible reserves are likely to have been found and mined already
In China, we believe policy (compliance) costs will support long-term coal
pricing. To ensure better use of domestic coal, various local governments have
imposed taxes on coal producers. For example, Shanxi province introduced
three taxes in 2007 that added Rmb20-30/t to coal production costs. In addition,
a change in resource taxes has been widely expected by the industry, from the
current fixed Rmb3.3/t to an ad valorem tax. However, the exact quantum of this
has yet to be determined, and the timing of its implementation remains uncertain.
We believe Chinese mining costs will also rise over the longer term as the more
accessible reserves are likely to have already been found and mined. We have
charted how coal production costs have been gradually rising in China. Many of
the country’s recent coal discoveries have been in Inner Mongolia or Xinjiang;
transporting this coal to coastal areas will result in additional costs given the long
distances involved and the supporting infrastructure that must be built.
Much of China’s total 493Mt supply is sourced domestically from small-scale
producers, and we believe these largely underground operations are being
squeezed on costs by increasing mining depth and by the application of safety
and environmental standards. The Chinese swing factor can impart a significant
influence on market prices; however, if domestic supply is under pressure at the
small end, then the effect may become more prominent in the longer term,
helping to support a higher floor under long-term pricing.
On this basis, we have reviewed our incentive price for coal production after
factoring in alternative supply sources and higher production costs, and we have
increased our long-term price assumptions.
Our thermal coal price rises from US$55/t to US$65/t.
Our premium hard coking coal price rises from US$85/t to US$100/t (the
biggest percentage change because of greater capital intensity, increasing
strip ratios and the underground component).
Semi-soft increases from US$62.5/t to US$74.0/t (a similar percentage to
thermal).
LV PCI rises from US$70 to US$80/t (with potential for further upside).

The Royal Bank of Scotland
Qu
arte
rly
Co
mm
od
ity
Co
mp
anio
n |
1 O
cto
ber
200
9
109
Supply-demand assumptions for seaborne thermal coal (mt)
2005 2006 2007 2008 2009F 2010F 2011F 2012F 2013F 2014F 2015F
Imports
Japan 118 115 121 124 120 116 119 121 123 126 128
South Korea 57 60 66 74 78 84 91 98 106 114 123
Taiwan 53 54 56 53 53 54 55 57 60 61 61
China 19 33 45 54 59 65 71 75 79 82 87
Hong Kong 11 11 11 11 11 11 11 11 11 11 11
Israel 13 13 14 14 14 14 14 14 14 14 14
Malaysia 10 12 13 14 15 17 17 18 19 20 21
India 18 24 27 35 40 44 49 54 55 56 57
Other 21 23 25 27 28 29 31 32 34 36 37
Asia 320 344 378 405 418 434 457 480 501 520 540
Europe 195 204 198 200 200 202 207 213 218 224 230
Canada 17 16 17 17 17 17 17 17 17 17 16
US 26 31 32 33 33 34 35 35 36 37 38
Mexico 5 6 7 7 7 8 8 8 8 8 8
North America 47 54 55 57 58 59 60 60 61 62 62
South/Central America 9 9 10 10 10 10 11 11 11 12 12
Africa 5 5 5 5 5 5 5 5 5 5 6
Oceania 0 0 0 0 0 0 0 0 0 0 0
Thermal coal imports 576 616 646 677 692 711 740 770 797 823 850
% yoy change 6% 7% 5% 5% 2% 3% 4% 4% 4% 3% 3%
Exports 2005 2006 2007 2008 2009F 2010F 2011F 2012F 2013F 2014F 2015F
Australia 109 113 115 120 138 145 162 187 224 280 308
China 61 54 45 43 39 33 28 24 22 19 18
Vietnam 13 23 28 20 20 18 16 13 11 10 8
Indonesia 124 164 177 170 175 170 165 161 158 155 152
Asia/Pacific 306 354 366 353 372 366 371 386 415 464 486
US 19 20 24 26 18 18 16 15 13 12 11
Canada 1 3 4 4 4 5 5 5 5 5 6
Colombia 54 56 63 72 76 82 89 94 100 106 112
Venezuela 6 6 6 6 6 7 7 7 7 8 8
North/Central/South America 80 85 97 109 105 112 117 121 126 131 136
South Africa 73 66 66 65 67 69 71 73 75 78 80
Poland 18 13 10 9 9 9 9 9 9 9 9
Russia 64 77 84 88 90 92 94 95 97 99 101
Kazakhstan 28 27 28 28 29 29 30 30 31 32 32
Other 8 8 8 9 9 10 11 12 14 16 18
Thermal coal exports 576 629 659 661 680 686 702 726 767 828 862
% yoy change 6% 9% 5% 0% 3% 1% 2% 3% 6% 8% 4%
Trade surplus/(deficit) 0 13 13 -16 -12 -26 -38 -43 -30 5 13
% of imports 2% 2% -2% -2% -4% -5% -6% -4% 1% 1%
Annual increase 34 53 30 2 19 5 16 24 41 61 34
% increase pa 6% 9% 5% 0% 3% 1% 2% 3% 6% 8% 4%
Source: TEX, RBS forecasts

The Royal Bank of Scotland
Qu
arte
rly
Co
mm
od
ity
Co
mp
anio
n |
1 O
cto
ber
200
9
110
Supply-demand assumptions for seaborne metallurgical coal (mt)
2005 2006 2007 2008 2009F 2010F 2011F 2012F 2013F 2014F 2015F
Exports
Australia 122 122 135 132 129 137 148 160 173 186 209
Indonesia 5 6 7 7 7 7 7 7 8 9 9
China 6 5 4 4 4 3 2 1 1 0 0
Asia/Pacific 133 133 146 143 140 147 157 168 181 195 218
US 26 24 19 22 22 23 23 22 22 22 22
Canada 27 30 32 35 33 33 35 38 40 42 44
Colombia 2 2 3 3 3 3 3 3 3 3 3
Central/North/South America 54 56 53 59 58 59 60 63 65 67 69
Poland 3 3 3 3 3 3 3 3 3 3 3
Russia 15 13 13 13 14 14 14 14 15 15 15
South Africa 3 2 3 3 3 3 3 3 3 3 3
Other 8 8 9 10 11 12 13 15 19 20 21
Total exports 217 216 226 231 227 237 250 267 285 303 328
Annual increase 6 -1 10 5 -4 10 13 17 19 17 25
% yoy change 3.6% 3.8% 3.6% 2.1% -1.6% 4.3% 5.5% 6.7% 7.1% 6.1% 8.4%
Imports
Japan 63 62 63 64 59 60 61 63 64 64 64
South Korea 18 18 17 20 18 19 20 21 21 21 21
Taiwan 8 8 9 9 8 8 8 8 8 8 8
China 8 5 6 6 32 35 38 43 47 52 57
India 19 21 23 24 25 27 31 37 44 51 60
Other 4 3 3 3 3 3 3 3 3 3 3
Asia/Pacific 120 117 120 125 146 152 161 175 186 198 212
EU 49 50 50 51 51 52 52 53 53 54 54
Other Europe 28 24 23 22 22 21 20 20 19 19 18
Europe 77 74 73 73 73 73 73 73 72 72 72
North America 8 8 8 8 7 7 7 7 7 7 7
Brazil 14 18 20 21 15 16 18 19 21 23 26
Other 2 2 2 2 2 2 2 2 2 2 2
North/South/Central America 24 28 30 32 24 25 27 29 30 32 35
Africa 4 5 5 5 5 5 5 5 5 5 5
Total imports 224 224 229 235 249 255 265 280 294 308 324
Annual increase 3 0 5 6 14 6 11 15 14 14 16
% yoy change 1.2% -0.2% 2.1% 2.7% 5.8% 2.4% 4.2% 5.7% 4.8% 4.8% 5.2%
Trade surplus/(deficit) -7 -8 -3 -4 -21 -18 -16 -14 -9 -5 4
% of imports -3% -4% -1% -2% -9% -7% -6% -5% -3% -2% 1%
Source: TEX, RBS forecasts

The Royal Bank of Scotland
Qu
arte
rly
Co
mm
od
ity
Co
mp
anio
n |
1 O
cto
ber
200
9
111
Source: EIA, RBS
Impressive improvement in US total petroleum product demand, yoy unrevised
-16%
-12%
-8%
-4%
0%
4%
Jan Feb Mar Apr May May Jun Jul Aug
Source: NYMEX, RBS
WTI’s impressive rebound of 120% at its best US$/bbl
25
50
75
100
125
150
Aug-07 Feb-08 Aug-08 Feb-09 Aug-09
Crude oil
Looking for Q4 09 economic recovery
The crude oil market in the first half of 2009 managed to rally from a low of
US$33.98 per barrel on 12 February to a high of US$74.37 per barrel on
24 August. This rally was in the face of awful economic news, job losses and real
losses of petroleum demand. Crude inventories were rising to levels that resulted
in approximately 100m barrels of crude oil to be stored in floating crude oil
tankers. When crude stocks reached tank tops around the world, the market then
began to fill distillate tanks and floating diesel/gasoil as well. As the following
chart of total petroleum demand in the US shows, the demand shock was
extreme, yet crude prices managed to rally through it all.
It would be very easy to dismiss this rally as non-fundamental. As we discuss
next, the crude market continues to trade more in line with equity and currency
markets than it does with the intrinsic supply-and-demand balance of crude.
However, crude oil’s rally alongside equity markets is a secular feature of today’s
crude market. There is little sign that crude is about to lose its correlation to
global equities and other risk assets.
There is a longer-term dynamic at work as well. The crude market is increasingly
forward-looking as spot prices carry a premium for concerns about future
supply. Worries about ‘peak oil’ and insatiable BRIC demand growth for oil were
not assuaged by the great deleveraging in 2008 and 2009.
The first half of 2009 was also notable in that OPEC exercised considerable
restraint. While OPEC certainly has not held exactly to quotas, it has done
enough to keep the physical market from ever getting completely sloppy. OPEC
discipline in 2009 has been impressive, and rising demand in the fourth quarter
of 2009 and into 2010 will make OPEC’s job much easier.
The rally in crude has brought prices to a level that is likely discounting a clean-
up of the global overstock of crude and products. Over the next six months we
expect the global oil market to slowly erode floating stocks of crude oil and
distillates, and to begin to wear down onshore stocks of crude and products. The
most visible of these are global distillate stocks (gasoil, diesel, heating oil).
Brison Bickerton Head of RBS Sempra Commodities Energy Research [email protected] +1 203 897 5103
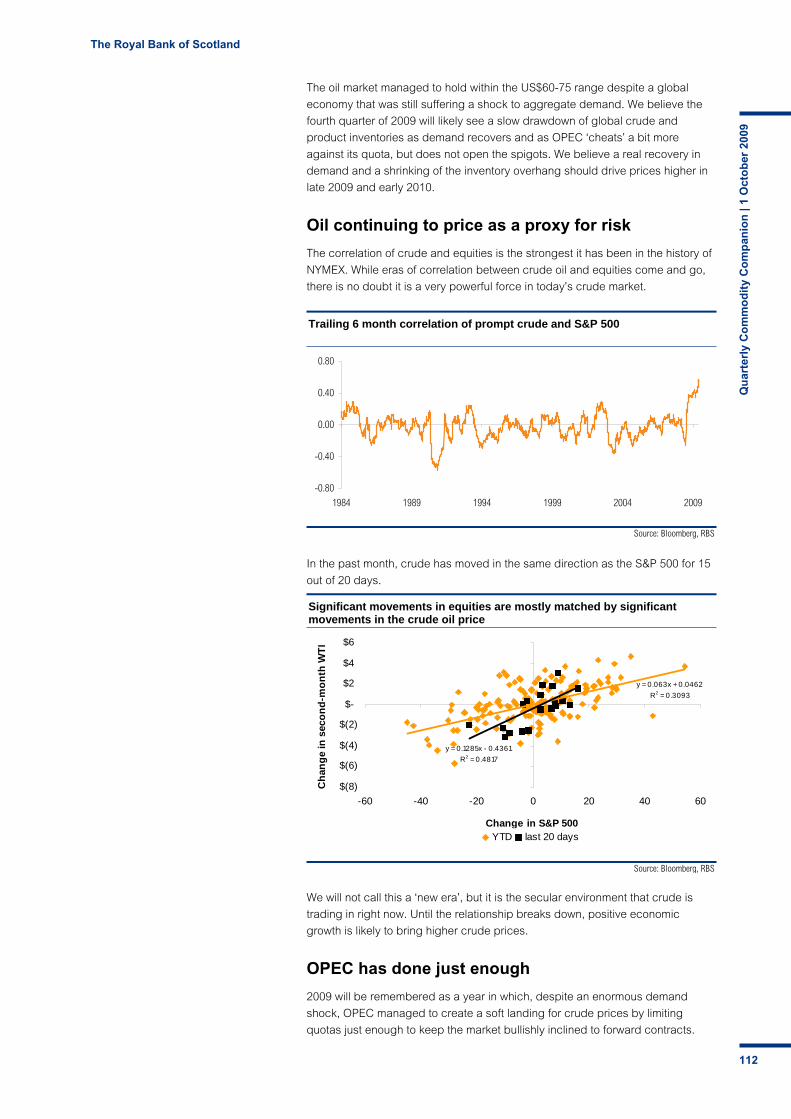
The Royal Bank of Scotland
Qu
arte
rly
Co
mm
od
ity
Co
mp
anio
n |
1 O
cto
ber
200
9
112
Source: Bloomberg, RBS
Significant movements in equities are mostly matched by significant movements in the crude oil price
y = 0.063x + 0.0462R2 = 0.3093
y = 0.1285x - 0.4361R2 = 0.4817
$(8)
$(6)
$(4)
$(2)
$-
$2
$4
$6
-60 -40 -20 0 20 40 60
Change in S&P 500
Cha
nge
in s
econ
d-m
onth
WTI
YTD last 20 days
Source: Bloomberg, RBS
Trailing 6 month correlation of prompt crude and S&P 500
-0.80
-0.40
0.00
0.40
0.80
1984 1989 1994 1999 2004 2009
The oil market managed to hold within the US$60-75 range despite a global
economy that was still suffering a shock to aggregate demand. We believe the
fourth quarter of 2009 will likely see a slow drawdown of global crude and
product inventories as demand recovers and as OPEC ‘cheats’ a bit more
against its quota, but does not open the spigots. We believe a real recovery in
demand and a shrinking of the inventory overhang should drive prices higher in
late 2009 and early 2010.
Oil continuing to price as a proxy for risk
The correlation of crude and equities is the strongest it has been in the history of
NYMEX. While eras of correlation between crude oil and equities come and go,
there is no doubt it is a very powerful force in today’s crude market.
In the past month, crude has moved in the same direction as the S&P 500 for 15
out of 20 days.
We will not call this a ‘new era’, but it is the secular environment that crude is
trading in right now. Until the relationship breaks down, positive economic
growth is likely to bring higher crude prices.
OPEC has done just enough
2009 will be remembered as a year in which, despite an enormous demand
shock, OPEC managed to create a soft landing for crude prices by limiting
quotas just enough to keep the market bullishly inclined to forward contracts.
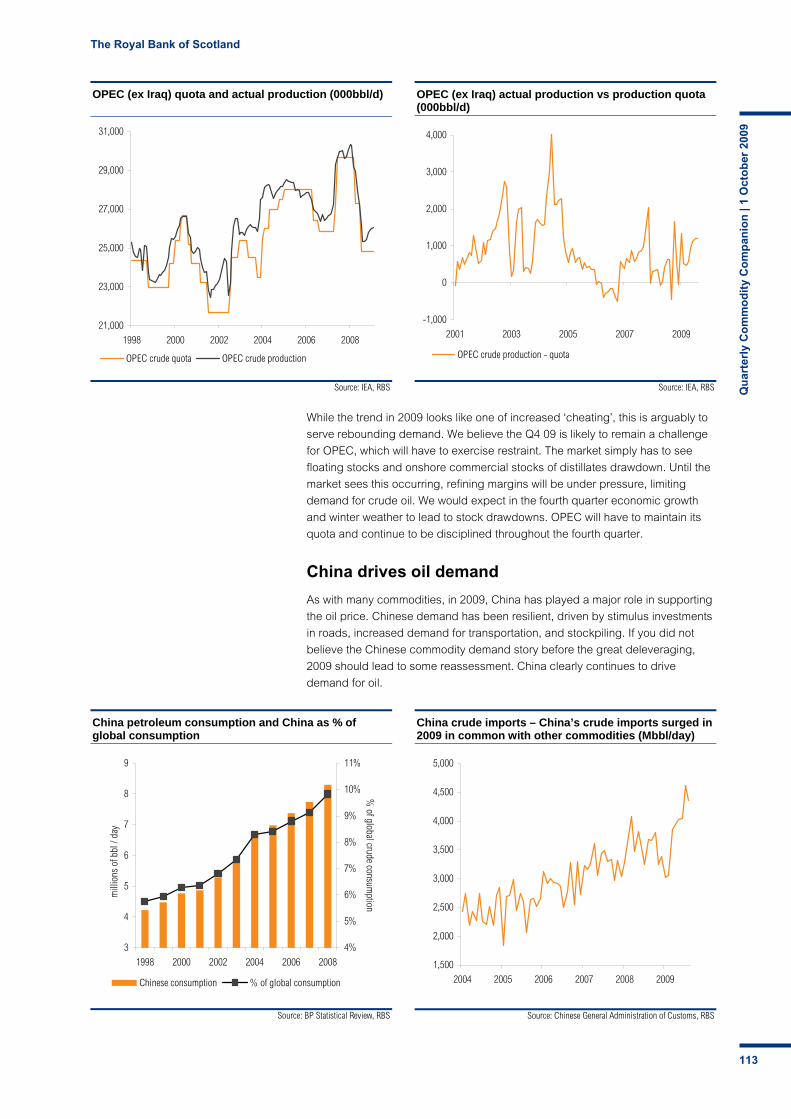
The Royal Bank of Scotland
Qu
arte
rly
Co
mm
od
ity
Co
mp
anio
n |
1 O
cto
ber
200
9
113
Source: IEA, RBS
OPEC (ex Iraq) quota and actual production (000bbl/d)
21,000
23,000
25,000
27,000
29,000
31,000
1998 2000 2002 2004 2006 2008
OPEC crude quota OPEC crude production
Source: IEA, RBS
OPEC (ex Iraq) actual production vs production quota (000bbl/d)
-1,000
0
1,000
2,000
3,000
4,000
2001 2003 2005 2007 2009
OPEC crude production - quota
Source: BP Statistical Review, RBS
China petroleum consumption and China as % of global consumption
3
4
5
6
7
8
9
1998 2000 2002 2004 2006 2008
mill
ions
of b
bl /
day
4%
5%
6%
7%
8%
9%
10%
11%
% of global crude consum
ption
Chinese consumption % of global consumption
Source: Chinese General Administration of Customs, RBS
China crude imports – China’s crude imports surged in 2009 in common with other commodities (Mbbl/day)
1,500
2,000
2,500
3,000
3,500
4,000
4,500
5,000
2004 2005 2006 2007 2008 2009
While the trend in 2009 looks like one of increased ‘cheating’, this is arguably to
serve rebounding demand. We believe the Q4 09 is likely to remain a challenge
for OPEC, which will have to exercise restraint. The market simply has to see
floating stocks and onshore commercial stocks of distillates drawdown. Until the
market sees this occurring, refining margins will be under pressure, limiting
demand for crude oil. We would expect in the fourth quarter economic growth
and winter weather to lead to stock drawdowns. OPEC will have to maintain its
quota and continue to be disciplined throughout the fourth quarter.
China drives oil demand
As with many commodities, in 2009, China has played a major role in supporting
the oil price. Chinese demand has been resilient, driven by stimulus investments
in roads, increased demand for transportation, and stockpiling. If you did not
believe the Chinese commodity demand story before the great deleveraging,
2009 should lead to some reassessment. China clearly continues to drive
demand for oil.
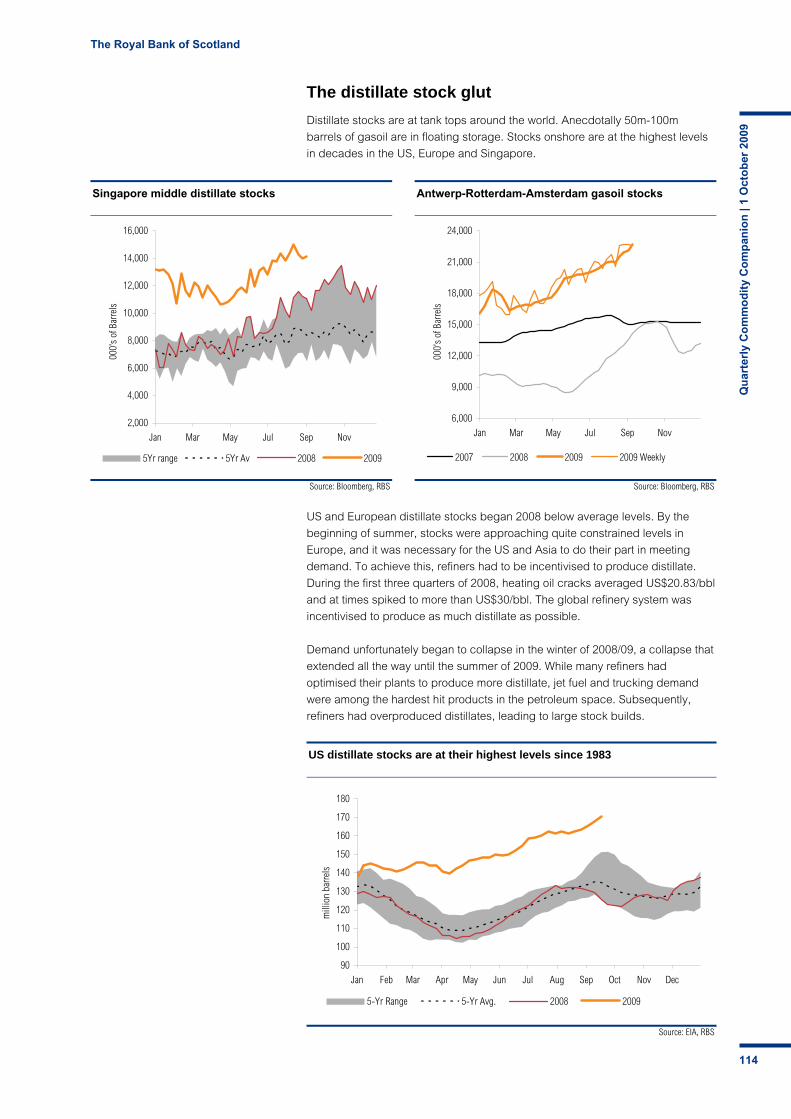
The Royal Bank of Scotland
Qu
arte
rly
Co
mm
od
ity
Co
mp
anio
n |
1 O
cto
ber
200
9
114
Source: EIA, RBS
US distillate stocks are at their highest levels since 1983
90
100
110
120
130
140
150
160
170
180
Jan Feb Mar Apr May Jun Jul Aug Sep Oct Nov Dec
mill
ion
barre
ls
5-Yr Range 5-Yr Avg. 2008 2009
Source: Bloomberg, RBS
Singapore middle distillate stocks
2,000
4,000
6,000
8,000
10,000
12,000
14,000
16,000
Jan Mar May Jul Sep Nov
000'
s of
Bar
rels
5Yr range 5Yr Av 2008 2009
Source: Bloomberg, RBS
Antwerp-Rotterdam-Amsterdam gasoil stocks
6,000
9,000
12,000
15,000
18,000
21,000
24,000
Jan Mar May Jul Sep Nov00
0's
of B
arre
ls
2007 2008 2009 2009 Weekly
The distillate stock glut Distillate stocks are at tank tops around the world. Anecdotally 50m-100m
barrels of gasoil are in floating storage. Stocks onshore are at the highest levels
in decades in the US, Europe and Singapore.
US and European distillate stocks began 2008 below average levels. By the
beginning of summer, stocks were approaching quite constrained levels in
Europe, and it was necessary for the US and Asia to do their part in meeting
demand. To achieve this, refiners had to be incentivised to produce distillate.
During the first three quarters of 2008, heating oil cracks averaged US$20.83/bbl
and at times spiked to more than US$30/bbl. The global refinery system was
incentivised to produce as much distillate as possible.
Demand unfortunately began to collapse in the winter of 2008/09, a collapse that
extended all the way until the summer of 2009. While many refiners had
optimised their plants to produce more distillate, jet fuel and trucking demand
were among the hardest hit products in the petroleum space. Subsequently,
refiners had overproduced distillates, leading to large stock builds.

The Royal Bank of Scotland
Qu
arte
rly
Co
mm
od
ity
Co
mp
anio
n |
1 O
cto
ber
200
9
115
Source: NYMEX, RBS
NYMEX prompt heating oil crack
5.96
$0
$10
$20
$30
$40
Jan Mar Jun Aug Nov
dolla
rs p
er b
arre
l
5-Yr Range 5-Yr Avg 2008 2009
IEA global crude oil supply/demand balance
Mbbl/d 2006 2007 2008 2009F 2010F Q109 Q209 Q309 Q409F Q110F Q210F Q310F Q410F
Demand
OECD 49.5 49.2 47.6 45.4 45.4 46.6 44.5 44.8 45.7 46.5 44.6 45.0 45.5
Non-OECD 35.7 37.3 38.7 39.1 40.3 37.9 39.7 39.6 39.0 39.6 40.5 40.8 40.3
Global Demand 85.2 86.5 86.3 84.4 85.7 84.5 84.1 84.4 84.7 86.0 85.1 85.8 85.9
Supply
OECD 20.1 19.9 19.3 19.1 18.8 19.7 19.1 18.7 19.0 19.4 18.8 18.5 19.1
Non-OECD 28.0 28.5 28.7 29.2 29.9 28.8 29.2 29.3 29.4 29.7 29.9 29.8 30.1
Processing Gains 2.1 2.2 2.2 2.3 2.2 2.3 2.3 2.3 2.3 2.2 2.2 2.2 2.2
Other Biofuels 0.2 0.3 0.3 0.4 0.4 0.3 0.4 0.4 0.4 0.4 0.4 0.4 0.5
TOTAL NON-OPEC 50.4 50.9 50.6 51.0 51.4 51.2 50.9 50.7 50.7 50.9 50.2 49.8 50.1
NGLs 4.4 4.5 4.7 5.2 6.1 4.9 5.1 5.4 5.6 5.7 6.0 6.2 6.4
Call on OPEC crude 30.4 31.1 31.0 28.2 28.2 28.4 28.1 28.3 28.0 28.6 27.9 28.7 27.6
Source: International Energy Agency, OPEC, RBS Sempra forecasts
We have spent much of our energy in 2009 discussing this distillate glut, and the
market has been ratcheting distillate margins lower and lower throughout 2009.
We do believe that rising demand in late 2009 and 2010 will slowly erode
distillate stock levels. However, we believe that during this long process distillate
margins (as represented by the heating oil crack in the next chart) will remain
near the bottom of their five-year range.
Oil price forecast to head towards US$80 in 2010
With any meaningful economic recovery we expect to see inventories drawn
down and the call on OPEC increase. In its most recent Oil Market Report, the
IEA has revised upwards the expected “call on OPEC” for 2010 by a full 0.5m
barrels per day, which is a very significant revision. We expect to see the
projected call on OPEC in 2010 to continue to creep upward, since in our view
IEA’s current projection is too low.
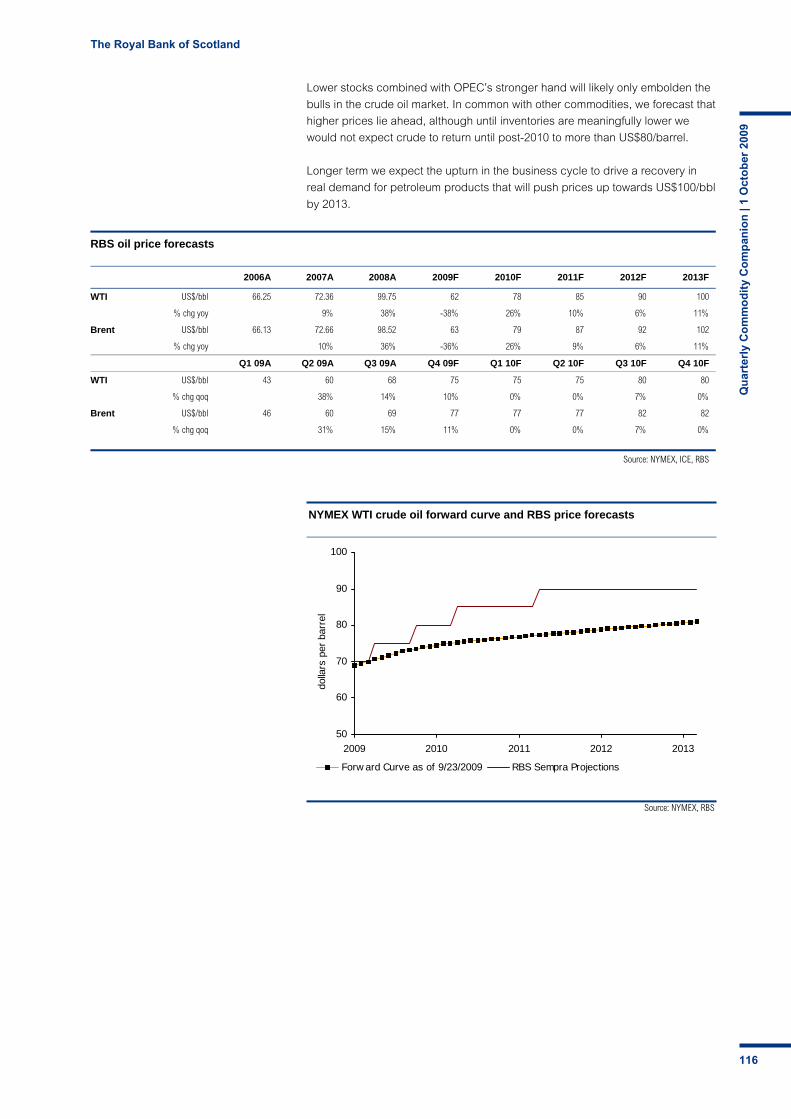
The Royal Bank of Scotland
Qu
arte
rly
Co
mm
od
ity
Co
mp
anio
n |
1 O
cto
ber
200
9
116
Source: NYMEX, RBS
NYMEX WTI crude oil forward curve and RBS price forecasts
50
60
70
80
90
100
2009 2010 2011 2012 2013
dolla
rs p
er b
arre
l
Forw ard Curve as of 9/23/2009 RBS Sempra Projections
Lower stocks combined with OPEC’s stronger hand will likely only embolden the
bulls in the crude oil market. In common with other commodities, we forecast that
higher prices lie ahead, although until inventories are meaningfully lower we
would not expect crude to return until post-2010 to more than US$80/barrel.
Longer term we expect the upturn in the business cycle to drive a recovery in
real demand for petroleum products that will push prices up towards US$100/bbl
by 2013.
RBS oil price forecasts
2006A 2007A 2008A 2009F 2010F 2011F 2012F 2013F
WTI US$/bbl 66.25 72.36 99.75 62 78 85 90 100
% chg yoy 9% 38% -38% 26% 10% 6% 11%
Brent US$/bbl 66.13 72.66 98.52 63 79 87 92 102
% chg yoy 10% 36% -36% 26% 9% 6% 11%
Q1 09A Q2 09A Q3 09A Q4 09F Q1 10F Q2 10F Q3 10F Q4 10F
WTI US$/bbl 43 60 68 75 75 75 80 80
% chg qoq 38% 14% 10% 0% 0% 7% 0%
Brent US$/bbl 46 60 69 77 77 77 82 82
% chg qoq 31% 15% 11% 0% 0% 7% 0%
Source: NYMEX, ICE, RBS

The Royal Bank of Scotland
Qu
arte
rly
Co
mm
od
ity
Co
mp
anio
n |
1 O
cto
ber
200
9
117
Source: NYMEX
Prompt US natural gas – prices have likely bottomed
2
4
6
8
10
12
14
Sep-07 Sep-08 Sep-09
US Natural Gas - US$/MMBtu
Source: NYMEX, RBS
Prompt natural gas as % of prompt WTI, energy-equivalent basis
20%
40%
60%
80%
100%
120%
140%
160%
Jan Feb Mar Apr May Jun Jul Aug Sep Oct Nov Dec
5-Yr Range 5-Yr Avg 2008 2009
US natural gas
Prompt prices have likely bottomed
Within the past few weeks, the US natural gas market has been volatile as it
copes with impending record storage levels. The apparent risk of overfilling
storage and forcing producer shut-ins drove the prompt contract down to a low
of US$2.51/MMBtu. Recently, market perception that the physical market will
avoid a glut has caused a short covering rally to nearly US$4.00/MMBtu. We
believe prompt prices for natural gas have likely bottomed.
In the short term, the biggest risk we see to gas prices is in the early winter. The
November contract is at the time of writing trading near US$4.75/MMBtu. With
coal parity pricing likely within the US$4.00-$4.50/MMBtu range, the difference
between US$3.75/MMBtu gas and US$4.75/MMBtu gas may be as much as
3 Bcf/d of demand from the power stack. That 3 Bcf/d may be the difference
between builds and draws in the first three weeks of November, and while the
physical market will likely be able to accommodate 3,825 Bcf in inventories at the
end of October (our current projection), it may not be able to accommodate
further stock builds into November.
The summer of 2009 was notable for the relentless decline in prompt gas pricing.
At the bottom, NYMEX prices were down more than 80% from the July 2008 high.
Surprisingly, there has not been a wave of bankruptcies in the US Exploration
and Production (E&P) industry. Certainly, US E&Ps focused on domestic gas
were hurt, but there was not a wave of properties sold at fire-sale prices. The
industry weathered these low prices fairly well, thanks in large part to good
hedging policies and aggressive moves to cut costs as commodity prices fell.
Having weathered the storm of the summer of 2009, we believe North American
natural gas producers can look forward to a winter in which excessive
inventories are slowly cleaned up. While it will take more than one season to put
the US natural gas market on anything resembling a bullish footing, at least
fundamental balances will not continue to threaten to drive prices down to shut-in
economics. This, in our assessment, is not an environment in which US NYMEX
gas contracts need to retain a risk premium for heavy weather. Neither should
Brison Bickerton Head of RBS Sempra Commodities Energy Research [email protected] +1 203 897 5103
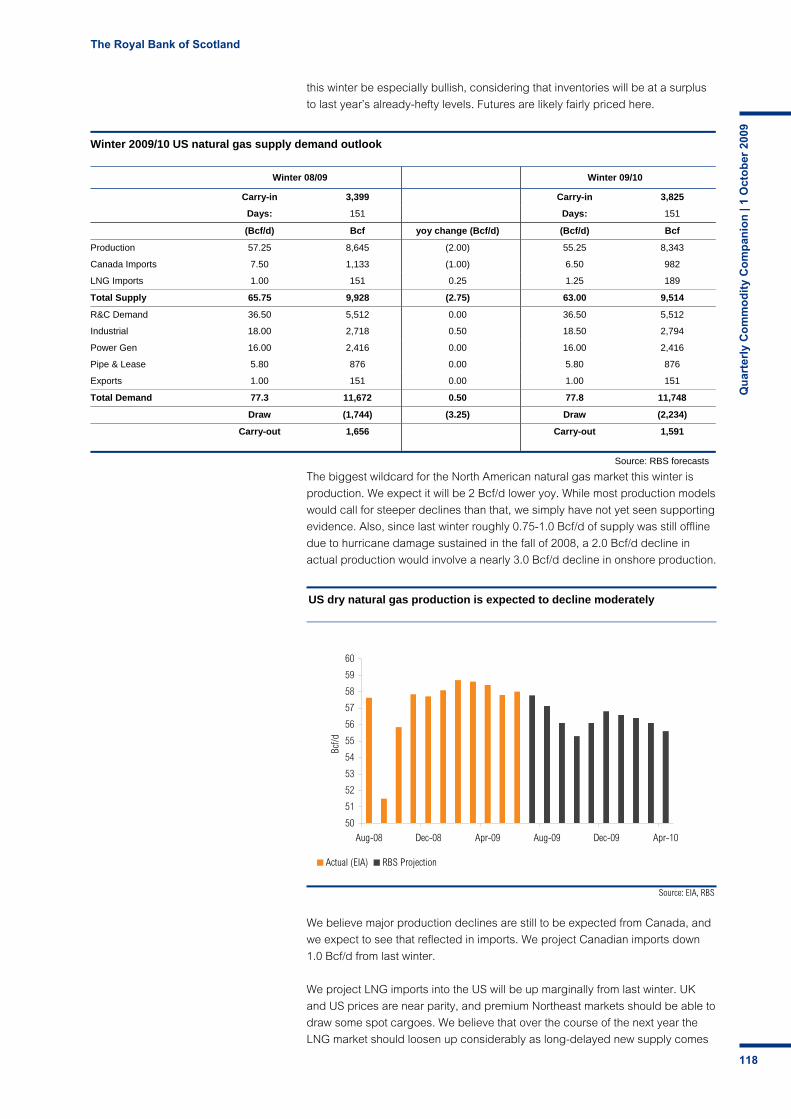
The Royal Bank of Scotland
Qu
arte
rly
Co
mm
od
ity
Co
mp
anio
n |
1 O
cto
ber
200
9
118
Source: EIA, RBS
US dry natural gas production is expected to decline moderately
50
51
52
53
54
55
56
57
58
59
60
Aug-08 Dec-08 Apr-09 Aug-09 Dec-09 Apr-10
Bcf/d
Actual (EIA) RBS Projection
this winter be especially bullish, considering that inventories will be at a surplus
to last year’s already-hefty levels. Futures are likely fairly priced here.
The biggest wildcard for the North American natural gas market this winter is
production. We expect it will be 2 Bcf/d lower yoy. While most production models
would call for steeper declines than that, we simply have not yet seen supporting
evidence. Also, since last winter roughly 0.75-1.0 Bcf/d of supply was still offline
due to hurricane damage sustained in the fall of 2008, a 2.0 Bcf/d decline in
actual production would involve a nearly 3.0 Bcf/d decline in onshore production.
We believe major production declines are still to be expected from Canada, and
we expect to see that reflected in imports. We project Canadian imports down
1.0 Bcf/d from last winter.
We project LNG imports into the US will be up marginally from last winter. UK
and US prices are near parity, and premium Northeast markets should be able to
draw some spot cargoes. We believe that over the course of the next year the
LNG market should loosen up considerably as long-delayed new supply comes
Winter 2009/10 US natural gas supply demand outlook
Winter 08/09 Winter 09/10
Carry-in 3,399 Carry-in 3,825
Days: 151 Days: 151
(Bcf/d) Bcf yoy change (Bcf/d) (Bcf/d) Bcf
Production 57.25 8,645 (2.00) 55.25 8,343
Canada Imports 7.50 1,133 (1.00) 6.50 982
LNG Imports 1.00 151 0.25 1.25 189
Total Supply 65.75 9,928 (2.75) 63.00 9,514
R&C Demand 36.50 5,512 0.00 36.50 5,512
Industrial 18.00 2,718 0.50 18.50 2,794
Power Gen 16.00 2,416 0.00 16.00 2,416
Pipe & Lease 5.80 876 0.00 5.80 876
Exports 1.00 151 0.00 1.00 151
Total Demand 77.3 11,672 0.50 77.8 11,748
Draw (1,744) (3.25) Draw (2,234)
Carry-out 1,656 Carry-out 1,591
Source: RBS forecasts
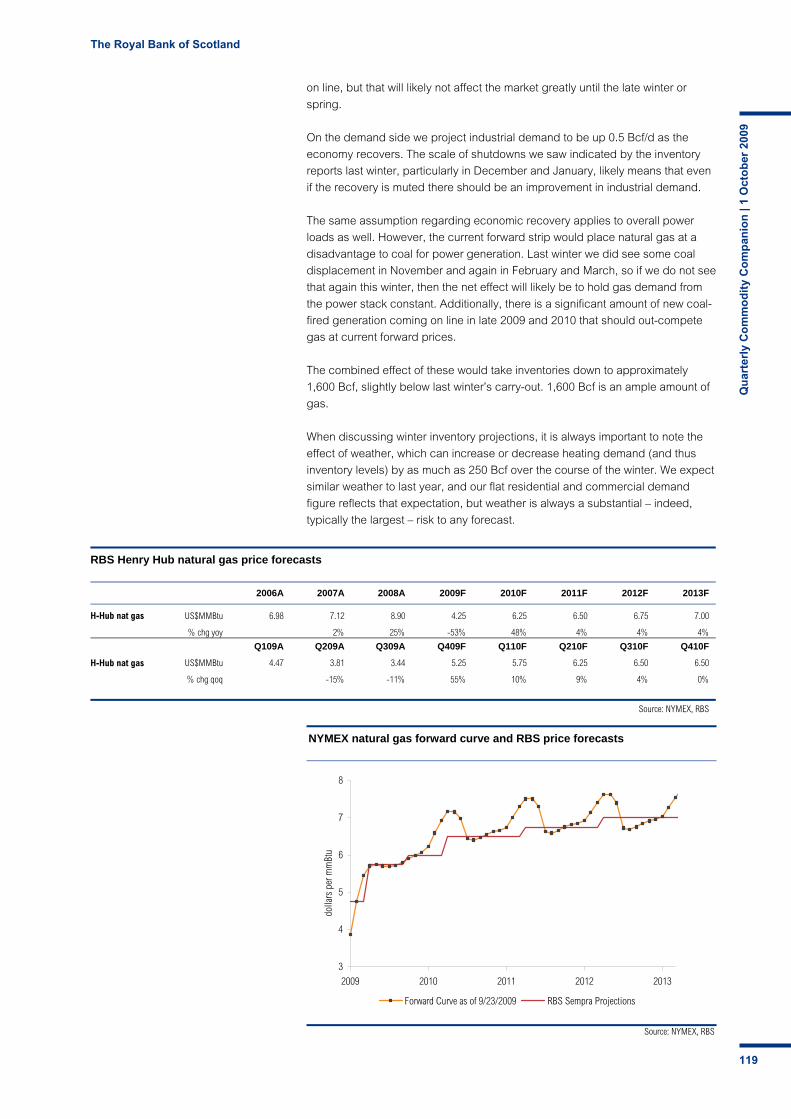
The Royal Bank of Scotland
Qu
arte
rly
Co
mm
od
ity
Co
mp
anio
n |
1 O
cto
ber
200
9
119
Source: NYMEX, RBS
NYMEX natural gas forward curve and RBS price forecasts
3
4
5
6
7
8
2009 2010 2011 2012 2013
dolla
rs p
er m
mBt
u
Forward Curve as of 9/23/2009 RBS Sempra Projections
on line, but that will likely not affect the market greatly until the late winter or
spring.
On the demand side we project industrial demand to be up 0.5 Bcf/d as the
economy recovers. The scale of shutdowns we saw indicated by the inventory
reports last winter, particularly in December and January, likely means that even
if the recovery is muted there should be an improvement in industrial demand.
The same assumption regarding economic recovery applies to overall power
loads as well. However, the current forward strip would place natural gas at a
disadvantage to coal for power generation. Last winter we did see some coal
displacement in November and again in February and March, so if we do not see
that again this winter, then the net effect will likely be to hold gas demand from
the power stack constant. Additionally, there is a significant amount of new coal-
fired generation coming on line in late 2009 and 2010 that should out-compete
gas at current forward prices.
The combined effect of these would take inventories down to approximately
1,600 Bcf, slightly below last winter’s carry-out. 1,600 Bcf is an ample amount of
gas.
When discussing winter inventory projections, it is always important to note the
effect of weather, which can increase or decrease heating demand (and thus
inventory levels) by as much as 250 Bcf over the course of the winter. We expect
similar weather to last year, and our flat residential and commercial demand
figure reflects that expectation, but weather is always a substantial – indeed,
typically the largest – risk to any forecast.
RBS Henry Hub natural gas price forecasts
2006A 2007A 2008A 2009F 2010F 2011F 2012F 2013F
H-Hub nat gas US$MMBtu 6.98 7.12 8.90 4.25 6.25 6.50 6.75 7.00
% chg yoy 2% 25% -53% 48% 4% 4% 4%
Q109A Q209A Q309A Q409F Q110F Q210F Q310F Q410F
H-Hub nat gas US$MMBtu 4.47 3.81 3.44 5.25 5.75 6.25 6.50 6.50
% chg qoq -15% -11% 55% 10% 9% 4% 0%
Source: NYMEX, RBS
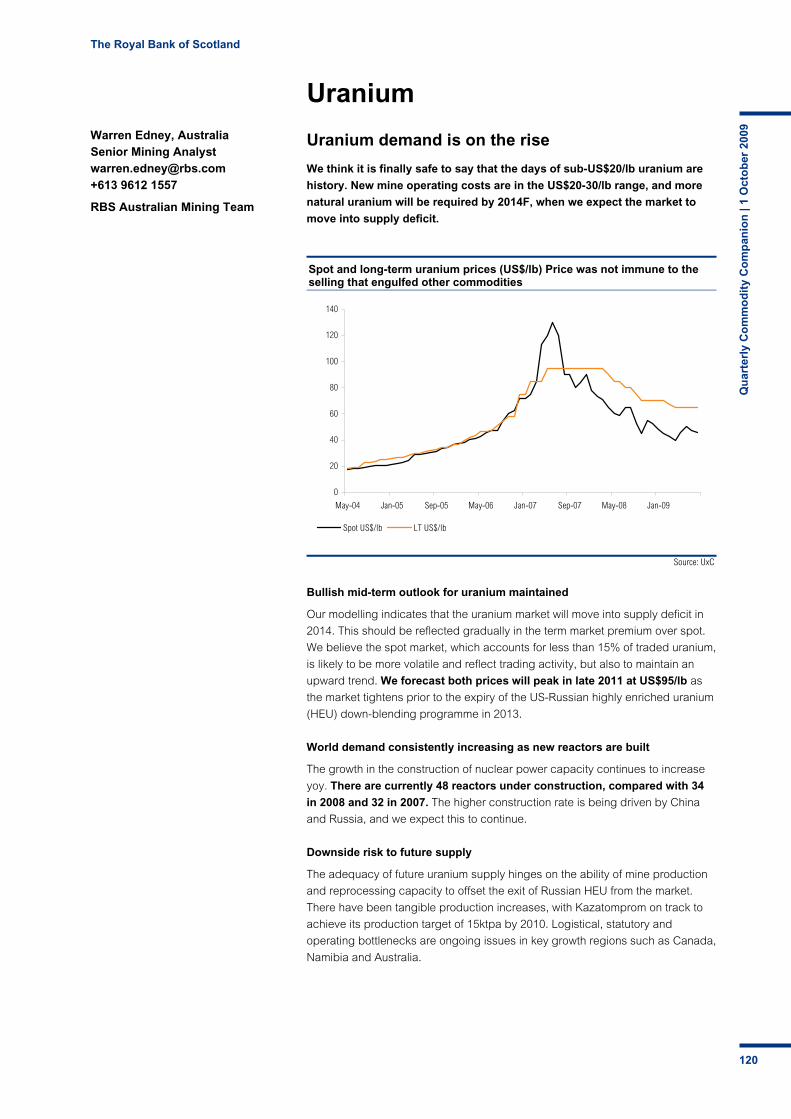
The Royal Bank of Scotland
Qu
arte
rly
Co
mm
od
ity
Co
mp
anio
n |
1 O
cto
ber
200
9
120
Source: UxC
Spot and long-term uranium prices (US$/lb) Price was not immune to the selling that engulfed other commodities
0
20
40
60
80
100
120
140
May-04 Jan-05 Sep-05 May-06 Jan-07 Sep-07 May-08 Jan-09
Spot US$/lb LT US$/lb
Uranium
Uranium demand is on the rise
We think it is finally safe to say that the days of sub-US$20/lb uranium are
history. New mine operating costs are in the US$20-30/lb range, and more
natural uranium will be required by 2014F, when we expect the market to
move into supply deficit.
Bullish mid-term outlook for uranium maintained
Our modelling indicates that the uranium market will move into supply deficit in
2014. This should be reflected gradually in the term market premium over spot.
We believe the spot market, which accounts for less than 15% of traded uranium,
is likely to be more volatile and reflect trading activity, but also to maintain an
upward trend. We forecast both prices will peak in late 2011 at US$95/lb as
the market tightens prior to the expiry of the US-Russian highly enriched uranium
(HEU) down-blending programme in 2013.
World demand consistently increasing as new reactors are built
The growth in the construction of nuclear power capacity continues to increase
yoy. There are currently 48 reactors under construction, compared with 34
in 2008 and 32 in 2007. The higher construction rate is being driven by China
and Russia, and we expect this to continue.
Downside risk to future supply
The adequacy of future uranium supply hinges on the ability of mine production
and reprocessing capacity to offset the exit of Russian HEU from the market.
There have been tangible production increases, with Kazatomprom on track to
achieve its production target of 15ktpa by 2010. Logistical, statutory and
operating bottlenecks are ongoing issues in key growth regions such as Canada,
Namibia and Australia.
Warren Edney, Australia Senior Mining Analyst [email protected] +613 9612 1557
RBS Australian Mining Team

The Royal Bank of Scotland
Qu
arte
rly
Co
mm
od
ity
Co
mp
anio
n |
1 O
cto
ber
200
9
121
Uranium – rising demand, inconsistent supply
The sharp increase in the number of planned and proposed reactors over the
past three years has begun to be realised through growing construction rates,
predominantly in China and Russia. The Russian nuclear statutory body,
Rosatom, recently reinforced market expectations of an end to the ‘megatonnes
to megawatts’ programme in 2013, marking the horizon of forecast supply
tightness. Tangible production success in Kazakhstan, where the state atomic
company, Kazatomprom, appears to be on track to achieve its production target
of 15ktpa by 2010, helps to offset our forecast supply deficit.
However, mine developments in other growth regions have stalled due to a
combination of logistical, statutory and financial realities. The balance of this is
that we see support for the uranium price increasing towards 2013 as new
reactor capacity comes on stream and HEU supply ends. We forecast new
primary supply will offset demand in the near term, but, in our view, inherent
delays in the mine commissioning and construction process are a risk to supply
in the medium term, supporting an increase in the uranium price over this period.
Our uranium price forecasts remain unchanged, with the only difference relating
to the mark to market of 3Q09 spot prices.
Demand for uranium growing
Rate of reactor construction increasing
Growth in the construction of nuclear power capacity continues to increase yoy
as flow-through from a sharp increase in planned and proposed capacity is
realised in construction starts. There are now 48 reactors under construction,
compared with 34 at this time in 2008 and 32 in 2007.
China increased its nuclear energy target from 40GWe to 60GWe, and now to
86GWe by 2020. We note that even at this increased target and the
corresponding nuclear build rate required, this would still be less aggressive
than the peak nuclear construction rate reached by the US in the early 1970s.
Therefore, we consider China’s 2020 target to be achievable. However, given the
timeframe, we have moderated the build rate beyond 2020 (see next chart). The
National Development and Reform Commission’s target for 2030 is 160GWe, and
although we believe this is certainly possible, it is too far out to factor into our
forecasts.
Supply/demand
Year-end: December (tU) 2009F 2010F 2011F 2012F 2013F 2014F 2015F
Mine production 48,472 53,187 56,353 57,850 59,706 63,159 63,937
Total secondary 23,326 22,918 22,534 21,766 18,886 10,997 8,862
Total U supply 71,798 76,105 78,887 79,616 78,592 74,156 72,799
Base-case demand 66,412 67,619 69,028 70,693 72,620 76,137 82,448
Surplus/deficit 5,386 8,486 9,859 8,923 5,972 -1,981 -9,649
Source: RBS forecasts
Uranium price forecasts
Year-end: December (US$/lb) 2009F 2010F 2011F 2012F 2013F 2014F LT
Spot 47.40 58.75 82.50 82.50 65.00 65.00 65.00
Source: RBS forecasts

The Royal Bank of Scotland
Qu
arte
rly
Co
mm
od
ity
Co
mp
anio
n |
1 O
cto
ber
200
9
122
Source: WNA
Reactor build profile (number of reactors)
0
100
200
300
400
500
600
700
800
900
1000
end-06 end-07 end-08 mid-09
Operating Under construction Planned Proposed
Source: WNA, National Development and Reform Commission, RBS forecasts
Modelled vs targeted Chinese nuclear power capacity (GWe)
0
20
40
60
80
100
120
140
160
1995 1999 2003 2007 2011F 2015F 2019F 2023F 2027F
2030 target 160 GWe
2020 target 86 GWe
Capital costs a hurdle in the western world
The cost of uranium in power generation currently comprises about 20% of the generating cost
Licence extensions to extend existing capacity
It would appear that the ongoing political machinations regarding the trade-off
between the environmental and financial costs of power supply are turning
further in favour of nuclear power as the issue plays out around the world.
Previously tabled plans to wind back nuclear capacity in Germany and the UK
have been delayed or reversed due to the absence of acceptable alternatives. A
similar scenario is observable in the US, where licence extensions are
prolonging reactor life. France continues to build on its nuclear programme,
which is supporting the power requirements of Italy, Belgium and Switzerland.
Costs of capacity and supply
Capital costs remain the key impediment to increasing nuclear capacity in the
western world. In the US, this cost is now more than US$4000/kW, vs
US$2000/kW in China and US$1200/kW in India. The Obama administration has
recognised the regulatory approval process as an area where the cost
impediment of nuclear capacity can be reduced, and it intends to address this
issue. However, we expect no material change in capital costs in the near term.
Source: IAEA, WNA, RBS
Number of reactors and their age, 2008
0
5
10
15
20
25
30
35
0 5 10 15 20 25 30 35 40 45 50
Reactor age (yrs)
Number of reactors

The Royal Bank of Scotland
Qu
arte
rly
Co
mm
od
ity
Co
mp
anio
n |
1 O
cto
ber
200
9
123
Source: RBS estimates
2008 cost breakdown of power production (US$/MWhr)
0
20
40
60
80
100
120
Nuclear Hydro Gas Coal (black) Coal(brown)
Wind
Capital O&M Fuel Carbon tax (US$30/t CO2)
US$/MWh
Source: World Nuclear Association
Fuel cost of power production (USc/kWhr)
0
2
4
6
8
10
12
14
16
18
20
1995 1997 1999 2001 2003 2005 2007
USc/
kWhr
Nuclear Coal Gas Oil
Source: RBS forecasts, WNA
Implied uranium surplus/deficit (tU)
-60000
-40000
-20000
0
20000
1990 2004 2009F 2014F 2019F 2024F 2029F
Reactors with only planned capacity 60 year licence extension - base case
The operational costs of nuclear power remain below those of oil, gas and coal,
at about US$0.02c/kWhr. In the lead up to the GFC there was some divergence
between the opex costs of nuclear and carbon-based power supply as the
tightness in carbon fuel markets flowed into utility operating costs. Nuclear-
based power costs were unaffected due to the small proportion of its operating
costs attributable to natural uranium procurement. The downside was the
proportionally higher increase in capital expenditure for new reactors.
Looking forward, the nebulous discussion regarding the pricing of carbon
dioxide emissions continues to intensify in the lead up to the Copenhagen
Climate Change Conference, which opens on 7 December 2009. We expect no
consensus to be reached on the global pricing of carbon, but the event will mark
another small step on the seemingly inevitable journey towards more expensive
carbon emissions in the western world.
Supply OK now, but what about later?
There are three major sources of uranium supply: primary or mine supply, HEU
down-blending and tails reprocessing. Currently, about 15% of uranium supply
comes from the down-blending of Russian stockpiles of HEU under the
‘megatonnes to megawatts’ programme. This programme will end in 2013, at
which time mine supply and the reprocessing of uranium tails material will be
required to meet demand going forward. We forecast the market will tighten from
2013 onward, despite expected increases from these two supply streams.

The Royal Bank of Scotland
Qu
arte
rly
Co
mm
od
ity
Co
mp
anio
n |
1 O
cto
ber
200
9
124
There is no shortage of uranium, but getting it out of the ground economically remains an issue
Source: IAEA
Status of world uranium deposits
Operating 9%
Dormant 49% Exploration
8%
Depleted 27%
Unknown 7%
Operating Dormant Exploration Depleted Unknown
Deposit status, number, % of 794 in compilation
Plenty of natural uranium to go around – but getting at it economically
Uranium is not an uncommon element and has a relatively broad geographical
distribution. Exploration for uranium is immature compared with that for say the
fossil fuels. There was no concerted exploration for uranium until the 1940s and
uranium’s exploration budget has undergone two booms since then: in the 1970-
80s (brought to an end due to low prices) and from 2005 onward (stimulated by
an increase in the uranium price from its long-term lows). A joint study by the UN
International Atomic Energy Agency (IAEA) and the OECD estimates the total
amount of conventional uranium stock that could be mined profitably at a price of
up to US$130/kg (US$59/lb) is about 4.7Mt of U3O8. Based on the 2004 rate of
demand, that is sufficient for 85 years. However, getting it out of the ground
economically has been, and remains, an issue.
We consider our modelling of new mine supply to be generous in taking target
dates and production volumes at face value from a variety of state and private
uranium mining entities. In reality, we expect the inherent delays in mine
construction and commissioning to result in actual production lagging the stated
targets. Recent examples of globally significant production delays are the
deferral of the Olympic Dam expansion from 2013 to around 2016 and the delay
of Cigar Lake production from 2007 to beyond 2011. Mines currently in
production at McArthur River and Langer Heinrich have also missed production
targets in the past 12 months due to maintenance and ramp-up complications.
Development delays or cancellations
Project Original start date Capacity (tU)
Dominion 2007 1,460
Hobson/La Palangana 2009 385
Midwest 2011 3,300
McClean Lake (Caribou) 2009 ?
Tony M 2007 ?
Vasquez 2007 300
Kingsville Dome/Rosita 2006 300
J-Bird 2008 ?
Rim, Topaz and Sunday mines 2006 ?
Cigar Lake 2005 18,000
ODO expansion 2013 +10,000
Source: Cameco, RBS estimates
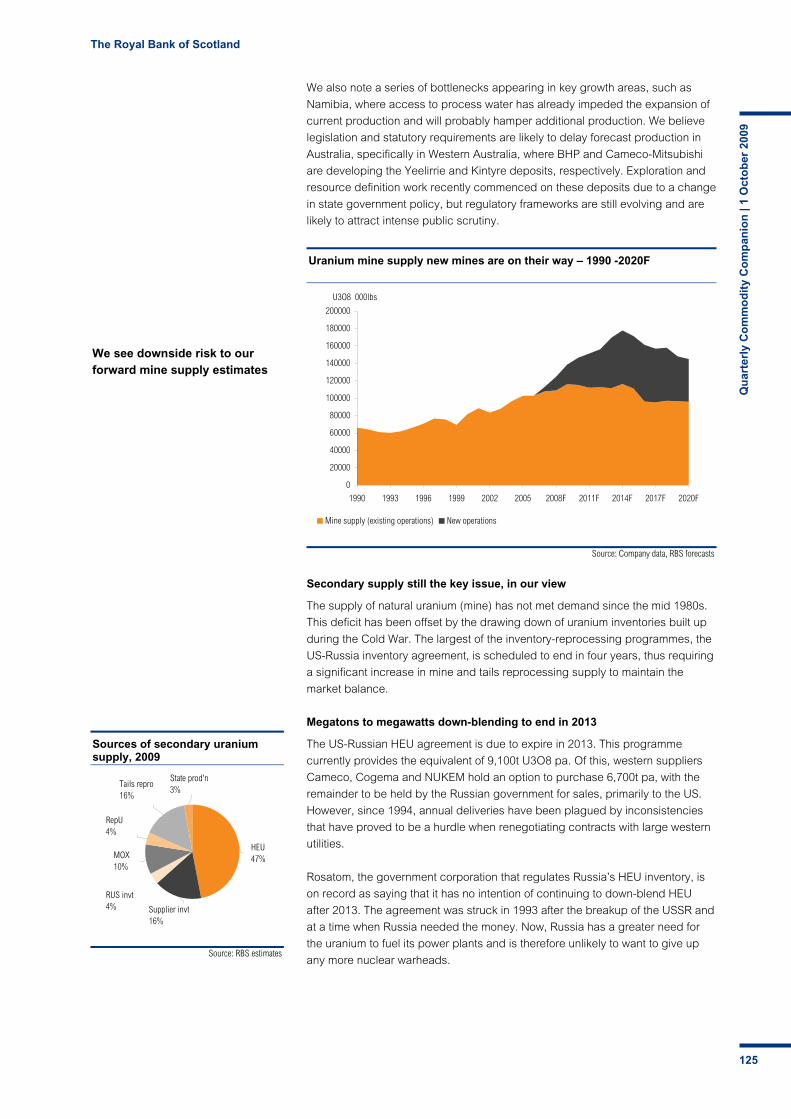
The Royal Bank of Scotland
Qu
arte
rly
Co
mm
od
ity
Co
mp
anio
n |
1 O
cto
ber
200
9
125
We see downside risk to our forward mine supply estimates
Source: Company data, RBS forecasts
Uranium mine supply new mines are on their way – 1990 -2020F
0
20000
40000
60000
80000
100000
120000
140000
160000
180000
200000
1990 1993 1996 1999 2002 2005 2008F 2011F 2014F 2017F 2020F
Mine supply (existing operations) New operations
U3O8 000lbs
Source: RBS estimates
Sources of secondary uranium supply, 2009
Supplier invt16%
State prod'n
3%
RUS invt4%
Tails repro16%
RepU4%
MOX10%
HEU47%
HEU47%
Supplier invt16%
RUS invt4%
MOX10%
RepU4%
Tails repro16%
State prod'n3%
We also note a series of bottlenecks appearing in key growth areas, such as
Namibia, where access to process water has already impeded the expansion of
current production and will probably hamper additional production. We believe
legislation and statutory requirements are likely to delay forecast production in
Australia, specifically in Western Australia, where BHP and Cameco-Mitsubishi
are developing the Yeelirrie and Kintyre deposits, respectively. Exploration and
resource definition work recently commenced on these deposits due to a change
in state government policy, but regulatory frameworks are still evolving and are
likely to attract intense public scrutiny.
Secondary supply still the key issue, in our view
The supply of natural uranium (mine) has not met demand since the mid 1980s.
This deficit has been offset by the drawing down of uranium inventories built up
during the Cold War. The largest of the inventory-reprocessing programmes, the
US-Russia inventory agreement, is scheduled to end in four years, thus requiring
a significant increase in mine and tails reprocessing supply to maintain the
market balance.
Megatons to megawatts down-blending to end in 2013
The US-Russian HEU agreement is due to expire in 2013. This programme
currently provides the equivalent of 9,100t U3O8 pa. Of this, western suppliers
Cameco, Cogema and NUKEM hold an option to purchase 6,700t pa, with the
remainder to be held by the Russian government for sales, primarily to the US.
However, since 1994, annual deliveries have been plagued by inconsistencies
that have proved to be a hurdle when renegotiating contracts with large western
utilities.
Rosatom, the government corporation that regulates Russia’s HEU inventory, is
on record as saying that it has no intention of continuing to down-blend HEU
after 2013. The agreement was struck in 1993 after the breakup of the USSR and
at a time when Russia needed the money. Now, Russia has a greater need for
the uranium to fuel its power plants and is therefore unlikely to want to give up
any more nuclear warheads.
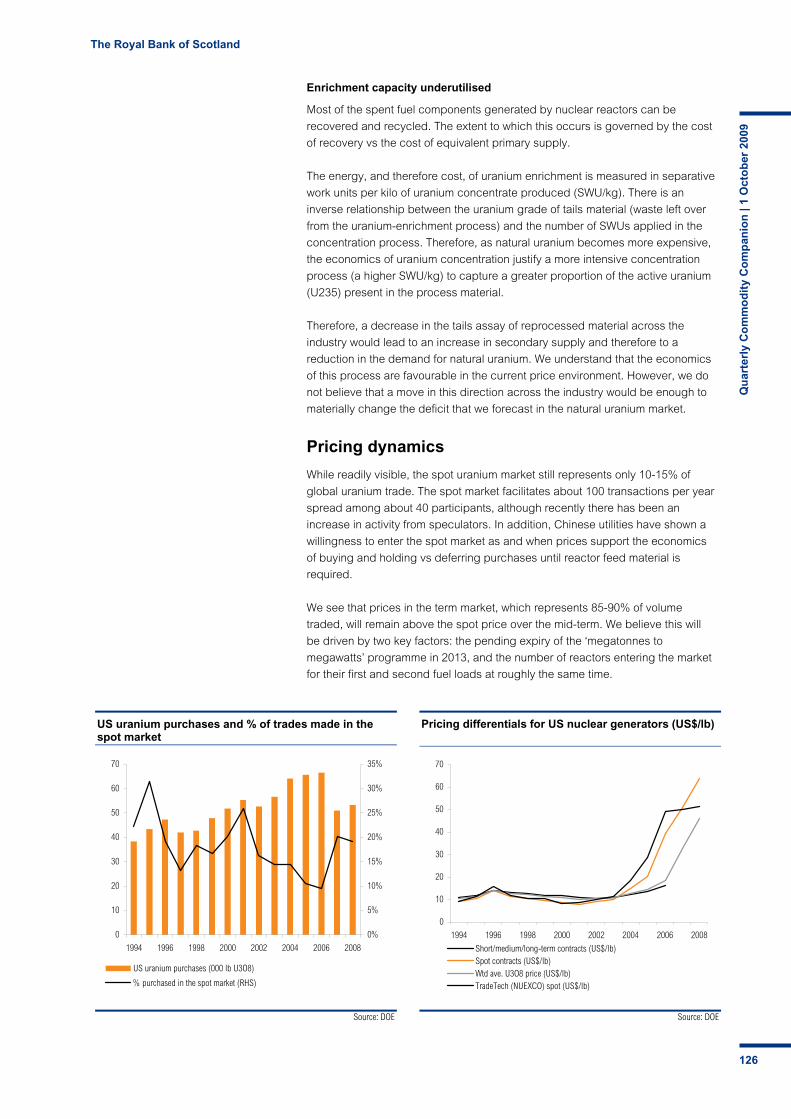
The Royal Bank of Scotland
Qu
arte
rly
Co
mm
od
ity
Co
mp
anio
n |
1 O
cto
ber
200
9
126
Source: DOE
US uranium purchases and % of trades made in the spot market
0
10
20
30
40
50
60
70
1994 1996 1998 2000 2002 2004 2006 2008
0%
5%
10%
15%
20%
25%
30%
35%
US uranium purchases (000 lb U3O8)
% purchased in the spot market (RHS)
Source: DOE
Pricing differentials for US nuclear generators (US$/lb)
0
10
20
30
40
50
60
70
1994 1996 1998 2000 2002 2004 2006 2008
Short/medium/long-term contracts (US$/lb)Spot contracts (US$/lb)Wtd ave. U3O8 price (US$/lb)TradeTech (NUEXCO) spot (US$/lb)
Enrichment capacity underutilised
Most of the spent fuel components generated by nuclear reactors can be
recovered and recycled. The extent to which this occurs is governed by the cost
of recovery vs the cost of equivalent primary supply.
The energy, and therefore cost, of uranium enrichment is measured in separative
work units per kilo of uranium concentrate produced (SWU/kg). There is an
inverse relationship between the uranium grade of tails material (waste left over
from the uranium-enrichment process) and the number of SWUs applied in the
concentration process. Therefore, as natural uranium becomes more expensive,
the economics of uranium concentration justify a more intensive concentration
process (a higher SWU/kg) to capture a greater proportion of the active uranium
(U235) present in the process material.
Therefore, a decrease in the tails assay of reprocessed material across the
industry would lead to an increase in secondary supply and therefore to a
reduction in the demand for natural uranium. We understand that the economics
of this process are favourable in the current price environment. However, we do
not believe that a move in this direction across the industry would be enough to
materially change the deficit that we forecast in the natural uranium market.
Pricing dynamics
While readily visible, the spot uranium market still represents only 10-15% of
global uranium trade. The spot market facilitates about 100 transactions per year
spread among about 40 participants, although recently there has been an
increase in activity from speculators. In addition, Chinese utilities have shown a
willingness to enter the spot market as and when prices support the economics
of buying and holding vs deferring purchases until reactor feed material is
required.
We see that prices in the term market, which represents 85-90% of volume
traded, will remain above the spot price over the mid-term. We believe this will
be driven by two key factors: the pending expiry of the ‘megatonnes to
megawatts’ programme in 2013, and the number of reactors entering the market
for their first and second fuel loads at roughly the same time.
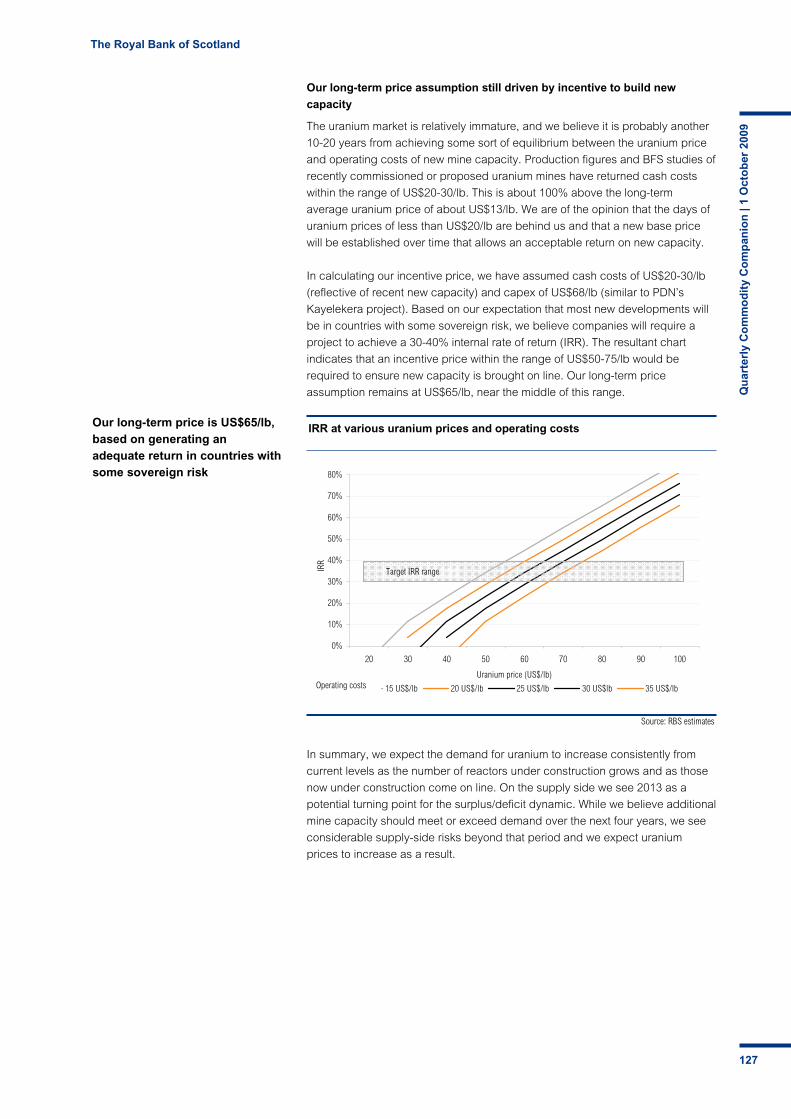
The Royal Bank of Scotland
Qu
arte
rly
Co
mm
od
ity
Co
mp
anio
n |
1 O
cto
ber
200
9
127
Our long-term price is US$65/lb, based on generating an adequate return in countries with some sovereign risk
Our long-term price assumption still driven by incentive to build new
capacity
The uranium market is relatively immature, and we believe it is probably another
10-20 years from achieving some sort of equilibrium between the uranium price
and operating costs of new mine capacity. Production figures and BFS studies of
recently commissioned or proposed uranium mines have returned cash costs
within the range of US$20-30/lb. This is about 100% above the long-term
average uranium price of about US$13/lb. We are of the opinion that the days of
uranium prices of less than US$20/lb are behind us and that a new base price
will be established over time that allows an acceptable return on new capacity.
In calculating our incentive price, we have assumed cash costs of US$20-30/lb
(reflective of recent new capacity) and capex of US$68/lb (similar to PDN’s
Kayelekera project). Based on our expectation that most new developments will
be in countries with some sovereign risk, we believe companies will require a
project to achieve a 30-40% internal rate of return (IRR). The resultant chart
indicates that an incentive price within the range of US$50-75/lb would be
required to ensure new capacity is brought on line. Our long-term price
assumption remains at US$65/lb, near the middle of this range.
In summary, we expect the demand for uranium to increase consistently from
current levels as the number of reactors under construction grows and as those
now under construction come on line. On the supply side we see 2013 as a
potential turning point for the surplus/deficit dynamic. While we believe additional
mine capacity should meet or exceed demand over the next four years, we see
considerable supply-side risks beyond that period and we expect uranium
prices to increase as a result.
Source: RBS estimates
IRR at various uranium prices and operating costs
0%
10%
20%
30%
40%
50%
60%
70%
80%
20 30 40 50 60 70 80 90 100
Uranium price (US$/lb)
IRR
15 US$/lb 20 US$/lb 25 US$/lb 30 US$lb 35 US$/lbOperating costs
Target IRR range
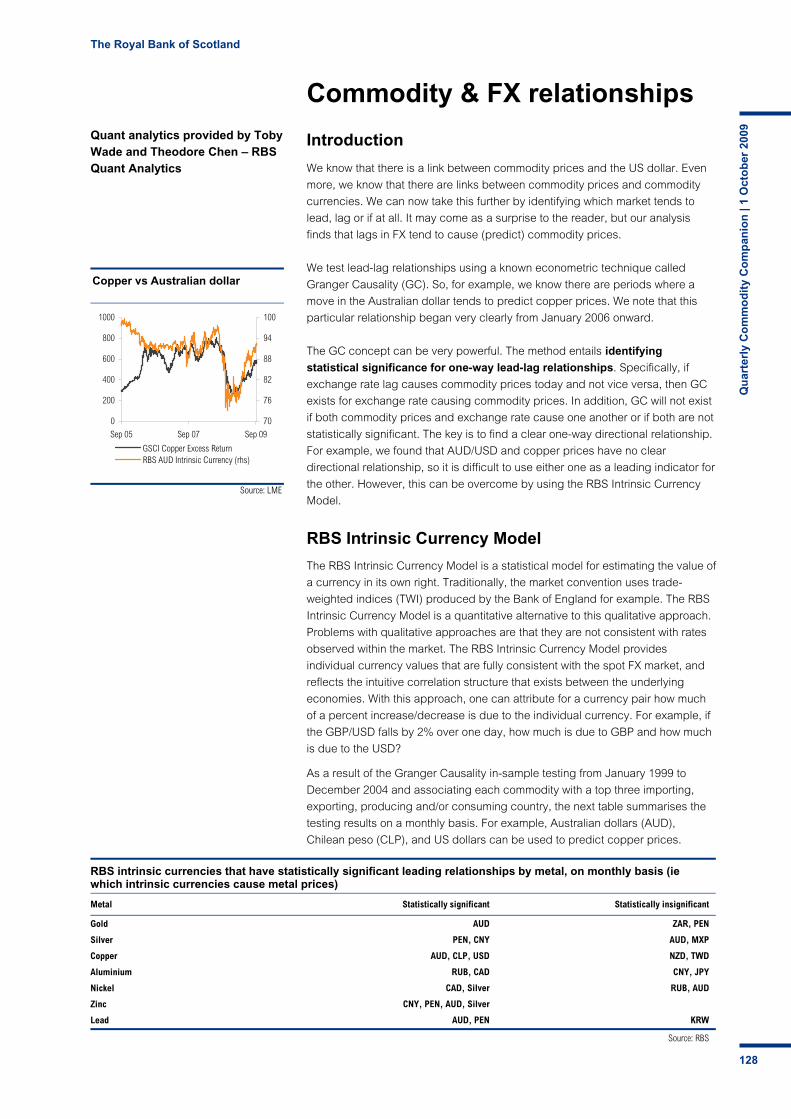
The Royal Bank of Scotland
Qu
arte
rly
Co
mm
od
ity
Co
mp
anio
n |
1 O
cto
ber
200
9
128
Source: LME
Copper vs Australian dollar
0
200
400
600
800
1000
Sep 05 Sep 07 Sep 09
70
76
82
88
94
100
GSCI Copper Excess ReturnRBS AUD Intrinsic Currency (rhs)
Commodity & FX relationships
Introduction
We know that there is a link between commodity prices and the US dollar. Even
more, we know that there are links between commodity prices and commodity
currencies. We can now take this further by identifying which market tends to
lead, lag or if at all. It may come as a surprise to the reader, but our analysis
finds that lags in FX tend to cause (predict) commodity prices.
We test lead-lag relationships using a known econometric technique called
Granger Causality (GC). So, for example, we know there are periods where a
move in the Australian dollar tends to predict copper prices. We note that this
particular relationship began very clearly from January 2006 onward.
The GC concept can be very powerful. The method entails identifying
statistical significance for one-way lead-lag relationships. Specifically, if
exchange rate lag causes commodity prices today and not vice versa, then GC
exists for exchange rate causing commodity prices. In addition, GC will not exist
if both commodity prices and exchange rate cause one another or if both are not
statistically significant. The key is to find a clear one-way directional relationship.
For example, we found that AUD/USD and copper prices have no clear
directional relationship, so it is difficult to use either one as a leading indicator for
the other. However, this can be overcome by using the RBS Intrinsic Currency
Model.
RBS Intrinsic Currency Model
The RBS Intrinsic Currency Model is a statistical model for estimating the value of
a currency in its own right. Traditionally, the market convention uses trade-
weighted indices (TWI) produced by the Bank of England for example. The RBS
Intrinsic Currency Model is a quantitative alternative to this qualitative approach.
Problems with qualitative approaches are that they are not consistent with rates
observed within the market. The RBS Intrinsic Currency Model provides
individual currency values that are fully consistent with the spot FX market, and
reflects the intuitive correlation structure that exists between the underlying
economies. With this approach, one can attribute for a currency pair how much
of a percent increase/decrease is due to the individual currency. For example, if
the GBP/USD falls by 2% over one day, how much is due to GBP and how much
is due to the USD?
As a result of the Granger Causality in-sample testing from January 1999 to
December 2004 and associating each commodity with a top three importing,
exporting, producing and/or consuming country, the next table summarises the
testing results on a monthly basis. For example, Australian dollars (AUD),
Chilean peso (CLP), and US dollars can be used to predict copper prices.
Quant analytics provided by Toby Wade and Theodore Chen – RBS Quant Analytics
RBS intrinsic currencies that have statistically significant leading relationships by metal, on monthly basis (ie which intrinsic currencies cause metal prices)
Metal Statistically significant Statistically insignificant
Gold AUD ZAR, PEN
Silver PEN, CNY AUD, MXP
Copper AUD, CLP, USD NZD, TWD
Aluminium RUB, CAD CNY, JPY
Nickel CAD, Silver RUB, AUD
Zinc CNY, PEN, AUD, Silver
Lead AUD, PEN KRW
Source: RBS

The Royal Bank of Scotland
Qu
arte
rly
Co
mm
od
ity
Co
mp
anio
n |
1 O
cto
ber
200
9
129
Source: Bloomberg, RBS
Medium-Term Base Metals Alpha Model – medium monthly lead-lag model
-20%
0%
20%
40%
60%
80%
100%
120%
140%
Jan 05 Jan 06 Jan 07 Jan 08 Jan 09
RBS Base Metal-FX Causality GSCI Base Metal Index
Source: Bloomberg, RBS
Short-Term Metals Alpha Model – short-term daily lead-lag model
-20%
0%
20%
40%
60%
80%
100%
120%
Dec 04 Dec 05 Dec 06 Dec 07 Dec 08
RBS Metals-FX Causality Long only GSCI Metals ER
Why is the relationship this way round?
The conventional market wisdom is that commodities on a fundamental level
clearly influence currency rates, relating to costs of production. However, the
currency markets are more liquid and are increasingly used by speculators to
take macro views as proxies of other asset classes. In addition, currencies
tend to be more forward-looking than commodities. Therefore, we are able to
utilise the FX information to predict commodity prices. Indeed, recent academic
research points to this very phenomenon. [1]
Alpha models for metals Using the preceding information, we are able to construct a forecasting alpha
model to predict both medium- and short-term metal prices using lag FX values.
The medium-term (monthly) model of an equal weighted portfolio of base metals
(Al, Cu, Ni, Pb, Zn) provides an average annual return of 27.3% over the out-of-
sample period of Jan 05-Jul 08, after transaction costs, with an information ratio
of 1.57. For the short-term model, a liquidity-based weighted portfolio of base
(Al, Cu, Ni, Pb, Zn) and precious (Au, Ag) metals provides average annual
returns of approx 23% over the out-of-sample period of Jan 05-Jul 08, after
transaction costs, with an information ratio of 1.65. The key highlights of the
model are lower transaction costs, low correlation risk, strong liquidity, high IR, a
stop-loss mechanism, including an inventory demand/supply overlay, and
incorporating forward-looking FX.
Conclusion
Analysing relationships between markets and asset classes is fertile hunting
ground for excess return. There are apparent linkages between currency and
commodity markets. Innovation is required to identify meaningful relationships.
Marrying together systematic analysis and fundamental market knowledge is
beneficial. Care is required to cope with changes in the market structure and
drivers.
(1) Can Exchange Rates Forecast Commodity Prices?, Chen, Rogoff, Rossi, Feb 2008
The Royal Bank of Scotland
Qu
arte
rly
Co
mm
od
ity
Co
mp
anio
n |
1 O
cto
ber
200
9
130
Commodity Companion appendix Vital statistics of the commodity markets
Guide to everyday uses for commodities 131
A simple guide to commodity indices 134
Commodity indices – negative roll reduces returns 138
Precious metal ETFs – stabilisation 140
World’s top commodity producers and consumers 142
Global refined base & precious metal production and consumption 154
World’s top 50 central bank gold holdings 159
30-year real and nominal base and precious metal prices 160
Glossary of useful mining and industry websites 163
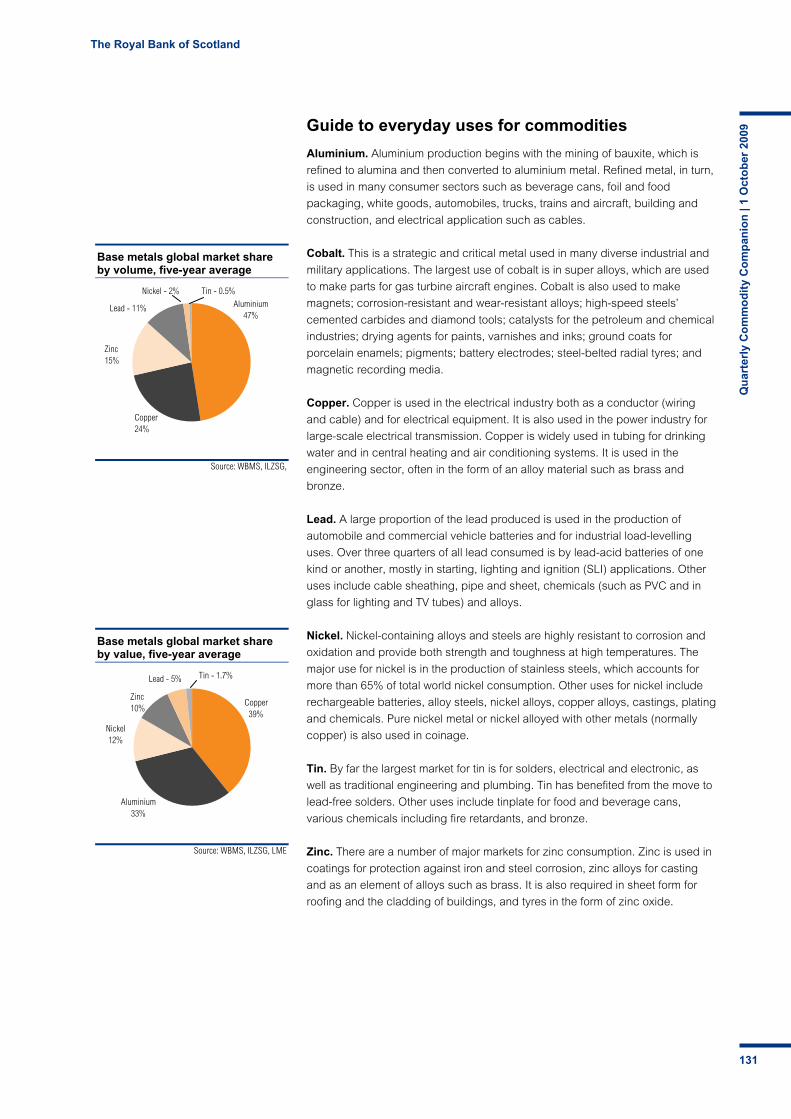
The Royal Bank of Scotland
Qu
arte
rly
Co
mm
od
ity
Co
mp
anio
n |
1 O
cto
ber
200
9
131
Source: WBMS, ILZSG, LME
Base metals global market share by value, five-year average
Copper39%
Aluminium33%
Nickel12%
Zinc10%
Lead - 5% Tin - 1.7%
Source: WBMS, ILZSG,
Base metals global market share by volume, five-year average
Aluminium47%
Copper24%
Zinc15%
Lead - 11%
Nickel - 2% Tin - 0.5%
Guide to everyday uses for commodities
Aluminium. Aluminium production begins with the mining of bauxite, which is
refined to alumina and then converted to aluminium metal. Refined metal, in turn,
is used in many consumer sectors such as beverage cans, foil and food
packaging, white goods, automobiles, trucks, trains and aircraft, building and
construction, and electrical application such as cables.
Cobalt. This is a strategic and critical metal used in many diverse industrial and
military applications. The largest use of cobalt is in super alloys, which are used
to make parts for gas turbine aircraft engines. Cobalt is also used to make
magnets; corrosion-resistant and wear-resistant alloys; high-speed steels’
cemented carbides and diamond tools; catalysts for the petroleum and chemical
industries; drying agents for paints, varnishes and inks; ground coats for
porcelain enamels; pigments; battery electrodes; steel-belted radial tyres; and
magnetic recording media.
Copper. Copper is used in the electrical industry both as a conductor (wiring
and cable) and for electrical equipment. It is also used in the power industry for
large-scale electrical transmission. Copper is widely used in tubing for drinking
water and in central heating and air conditioning systems. It is used in the
engineering sector, often in the form of an alloy material such as brass and
bronze.
Lead. A large proportion of the lead produced is used in the production of
automobile and commercial vehicle batteries and for industrial load-levelling
uses. Over three quarters of all lead consumed is by lead-acid batteries of one
kind or another, mostly in starting, lighting and ignition (SLI) applications. Other
uses include cable sheathing, pipe and sheet, chemicals (such as PVC and in
glass for lighting and TV tubes) and alloys.
Nickel. Nickel-containing alloys and steels are highly resistant to corrosion and
oxidation and provide both strength and toughness at high temperatures. The
major use for nickel is in the production of stainless steels, which accounts for
more than 65% of total world nickel consumption. Other uses for nickel include
rechargeable batteries, alloy steels, nickel alloys, copper alloys, castings, plating
and chemicals. Pure nickel metal or nickel alloyed with other metals (normally
copper) is also used in coinage.
Tin. By far the largest market for tin is for solders, electrical and electronic, as
well as traditional engineering and plumbing. Tin has benefited from the move to
lead-free solders. Other uses include tinplate for food and beverage cans,
various chemicals including fire retardants, and bronze.
Zinc. There are a number of major markets for zinc consumption. Zinc is used in
coatings for protection against iron and steel corrosion, zinc alloys for casting
and as an element of alloys such as brass. It is also required in sheet form for
roofing and the cladding of buildings, and tyres in the form of zinc oxide.
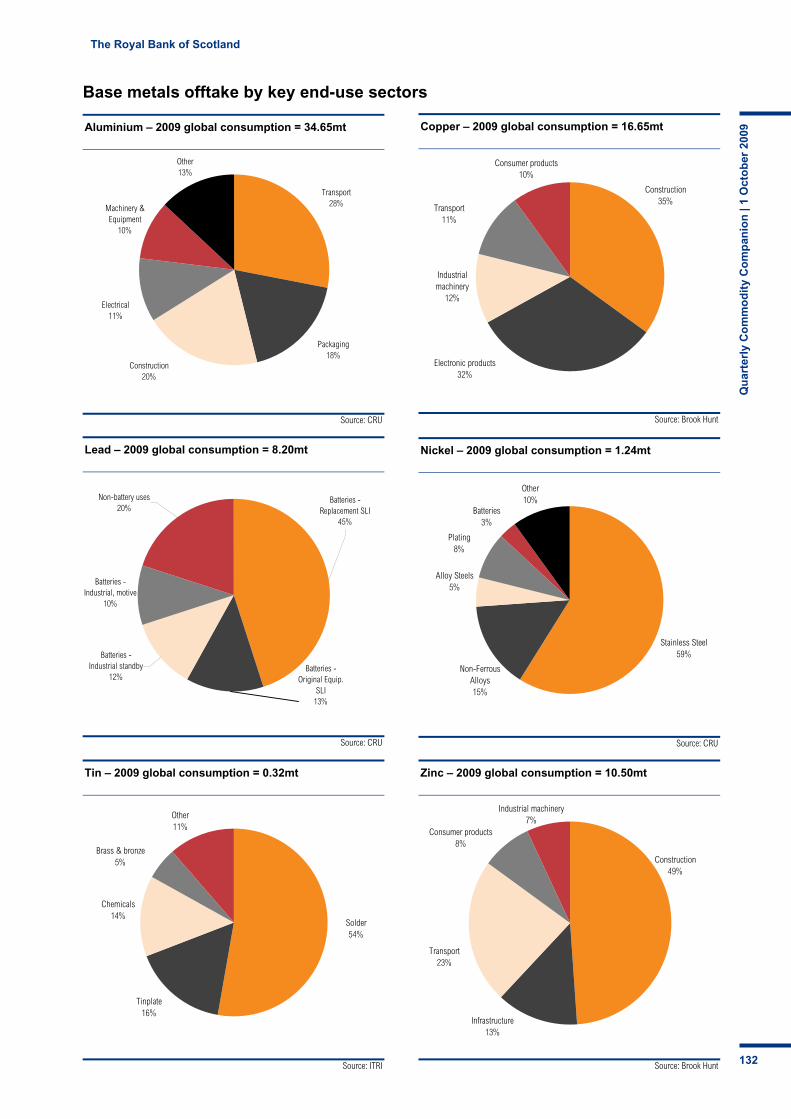
The Royal Bank of Scotland
Qu
arte
rly
Co
mm
od
ity
Co
mp
anio
n |
1 O
cto
ber
200
9
132
Source: CRU
Aluminium – 2009 global consumption = 34.65mt
Machinery & Equipment
10%
Other13%
Transport28%
Packaging18%
Construction20%
Electrical11%
Source: Brook Hunt
Copper – 2009 global consumption = 16.65mt
Consumer products
10%
Transport11%
Industrial machinery
12%
Electronic products
32%
Construction35%
Construction35%
Electronic products 32%
Industrial machinery
12%
Transport11%
Consumer products10%
Source: CRU
Nickel – 2009 global consumption = 1.24mt
Other 10%
Batteries3%
Plating8%
Alloy Steels5%
Non-Ferrous Alloys15%
Stainless Steel59%
Source: CRU
Lead – 2009 global consumption = 8.20mt
Non-battery uses20%
Batteries - Industrial, motive
10%
Batteries - Industrial standby
12%Batteries -
Original Equip. SLI
13%
Batteries - Replacement SLI
45%
Source: Brook Hunt
Zinc – 2009 global consumption = 10.50mt
Construction49%
Infrastructure13%
Industrial machinery7%
Consumer products8%
Transport23%
Source: ITRI
Tin – 2009 global consumption = 0.32mt
Solder54%
Tinplate16%
Chemicals14%
Brass & bronze5%
Other11%
Base metals offtake by key end-use sectors
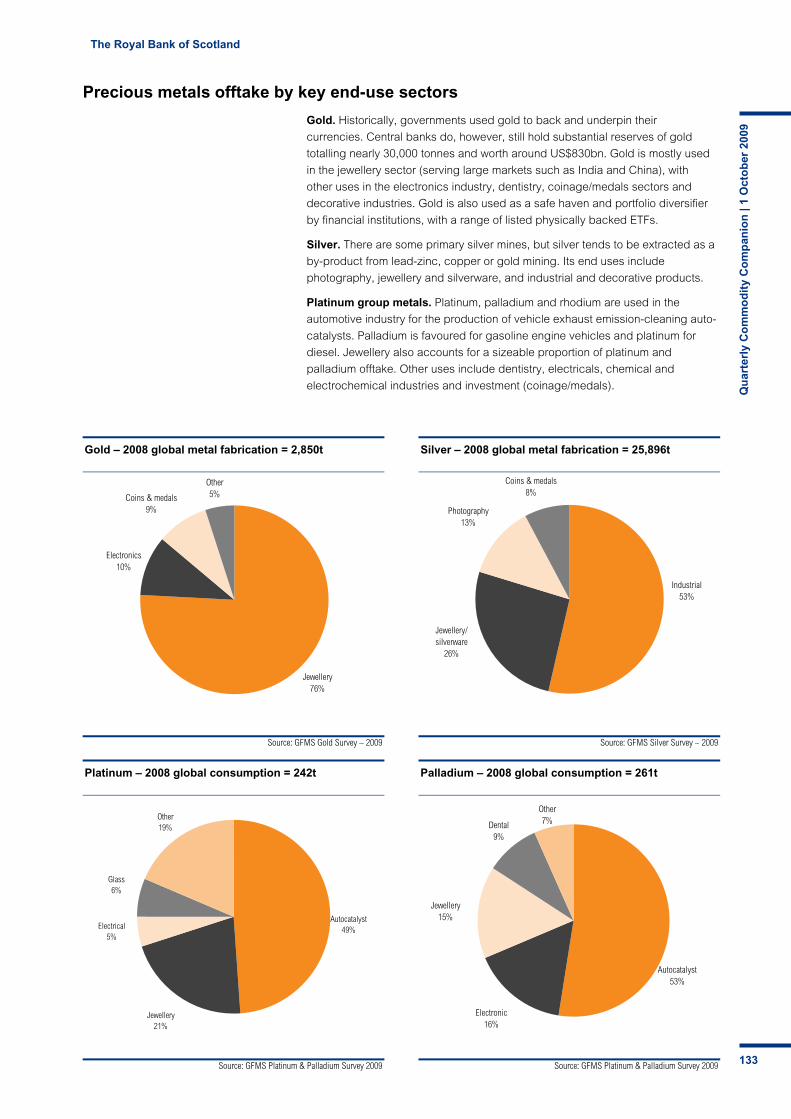
The Royal Bank of Scotland
Qu
arte
rly
Co
mm
od
ity
Co
mp
anio
n |
1 O
cto
ber
200
9
133Source: GFMS Platinum & Palladium Survey 2009
Platinum – 2008 global consumption = 242t
Other 19%
Glass6%
Electrical5%
Jewellery21%
Autocatalyst49%
Source: GFMS Platinum & Palladium Survey 2009
Palladium – 2008 global consumption = 261t
Autocatalyst53%
Electronic16%
Jewellery15%
Dental 9%
Other 7%
Source: GFMS Gold Survey – 2009
Gold – 2008 global metal fabrication = 2,850t
Other5%Coins & medals
9%
Electronics10%
Jewellery76%
Source: GFMS Silver Survey – 2009
Silver – 2008 global metal fabrication = 25,896t
Industrial53%
Jewellery/ silverware
26%
Photography13%
Coins & medals8%
Precious metals offtake by key end-use sectors
Gold. Historically, governments used gold to back and underpin their
currencies. Central banks do, however, still hold substantial reserves of gold
totalling nearly 30,000 tonnes and worth around US$830bn. Gold is mostly used
in the jewellery sector (serving large markets such as India and China), with
other uses in the electronics industry, dentistry, coinage/medals sectors and
decorative industries. Gold is also used as a safe haven and portfolio diversifier
by financial institutions, with a range of listed physically backed ETFs.
Silver. There are some primary silver mines, but silver tends to be extracted as a
by-product from lead-zinc, copper or gold mining. Its end uses include
photography, jewellery and silverware, and industrial and decorative products.
Platinum group metals. Platinum, palladium and rhodium are used in the
automotive industry for the production of vehicle exhaust emission-cleaning auto-
catalysts. Palladium is favoured for gasoline engine vehicles and platinum for
diesel. Jewellery also accounts for a sizeable proportion of platinum and
palladium offtake. Other uses include dentistry, electricals, chemical and
electrochemical industries and investment (coinage/medals).

The Royal Bank of Scotland
Qu
arte
rly
Co
mm
od
ity
Co
mp
anio
n |
1 O
cto
ber
200
9
134
Source: RBS
Example of how a backwardated forward curve generates a positive roll yield
Price USD/MT
Time to Maturity
B
A
7500
8000
C
A simple guide to commodity indices
Indices are designed to be a benchmark for the performance of the commodity
sector as a whole or for a particular sub-sector of the market. Returns are based
on a weighted basket of underlying commodity futures, with positions usually
taken in the front month contracts due to greater liquidity. However, differing
indices will have differing methodologies that may have an impact on
performance.
Key commodity index components
Returns to commodity investors comprise three components. The first is the
absolute price performance of the underlying futures contracts of the index
components. This is referred to as the spot index performance and is a useful
indicator of spot price trends and momentum in the commodity markets.
Analysing the spot index performance of sub-indices of the major commodity
indices (S&P GSCI, DJ-AIG and R/J CRB) is useful in identifying the leading and
lagging sectors within the commodity markets.
The excess return index is a combination of changes in the spot index and the
accumulated roll yield since inception of the index. As each front month future
approaches expiry, it needs to be ‘rolled’ into the next nearby contract on a pre-
determined day of the month to maintain exposure to changes in the underlying
commodity future. This would involve, for example, selling the maturing June
contract and purchasing an equivalent position in the July contract. The roll yield
is the difference between the price at which the front month future is sold and the
second future is bought.
Whether the roll yield is positive or negative will depend upon the shape of the
forward curve. A downward sloping or ‘backwardated’ forward curve will lead to
a positive roll yield, as shown in the next chart. Conversely, if the forward curve is
upward sloping or in ‘contango’, the return from rolling will be negative. The
angle of the front end of the forward curve will determine the size of the roll yield.
The total return assumes a fully collateralised investment is made up of the
excess return plus a return on collateral at a risk-free rate, generally the US
Treasury bill return. Should the price of the basket of commodities decline in
between roll periods, the collateral put up by an investor in a fully collateralised
1. Investor holds the first nearby
futures contract (point A)
2. As the contract approaches
maturity, it rolls up the curve,
appreciating in price
3. Immediately prior to expiry, the
front month contract is sold (point
B) and the next nearby contract
bought (point C)
4. Positive roll yield of US$500 is
generated by the margin between
the prices at which the two futures
contracts are bought and sold

The Royal Bank of Scotland
Qu
arte
rly
Co
mm
od
ity
Co
mp
anio
n |
1 O
cto
ber
200
9
135
Source: LME
LME aluminium forward curve in contango
2,600
2,800
3,000
3,200
3,400
Oct-08 Oct-10 Oct-12Jun-08 Aug-08
Source: LME
LME copper forward curve in backwardation
6,500
7,000
7,500
8,000
8,500
Oct-08 Oct-10 Oct-12Jun-08 Aug-08
index product will be consumed in margin payments for the basket of futures
contracts, reducing the accrued interest and resulting total return.
Generally, investment can be made in both the excess return and total return
indices. The spot index is usually more theoretical, as exposure to underlying
commodity cannot be achieved without taking out futures contracts and
therefore being exposed to positive or negative roll yields. However, spot indices
provide a good benchmark for tracking price trends in differing commodity sub-
sectors and comparing commodities with other asset classes as it removes bias
from positive and negative roll yields.
Commodity forward curves – contango and backwardation
Commodity forward curves are a representation of where the market is pricing an
underlying asset for delivery at a given date in the future. The curve is the
construct of a set of individual exchange-traded forward contracts, often at
monthly intervals.
As most trading occurs in nearby futures contracts, the front end of the curve is
increasingly influenced by speculative investor flows. The back end of the curve
is usually far more stable in commodity markets, driven by more predictable
producer hedging activity, acting as a pivot while flows at the front end
determine the slope and curvature.
A contango market is a situation where the nearby price is lower than the
forward price, reflecting the time value of money and the cost of carrying the
physical material.
Backwardation is a situation where the nearby price is higher than the forward
price; this may reflect a situation of short-term supply tightness inflating the
nearby price.
Reweighting, rebalancing and the rolling of contracts
The varying commodity indices have different methodologies used in the
calculation of index returns and resulting returns to investors. It is important to
identify some key terms that are used in distinguishing between these different
methodologies.
Index reweighting is the process in which the target weights of individual
components within the index are reviewed. This may include the number of
commodities, the individual futures contracts and the target weighting that each
futures contract will have. The criterion used to determine the weighting of
components within the index tends to be focused around the relative value of
components or the liquidity of futures contracts.
Index rebalancing is when the individual components of an index are reset to
their target weights. When an index is rebalanced, components that have
outperformed will have their weighting reduced, and those that have
underperformed will have their weighting increased.
Rolling contracts: the regularity of rolling and the position on the forward curve
that a contract is rolled will have an impact on the index roll yield. The more
regularly contracts are rolled, the more accentuated the positive or negative
yield will be. Therefore, indices dominated by components that are in
backwardation will benefit from more regular rolling of contracts.
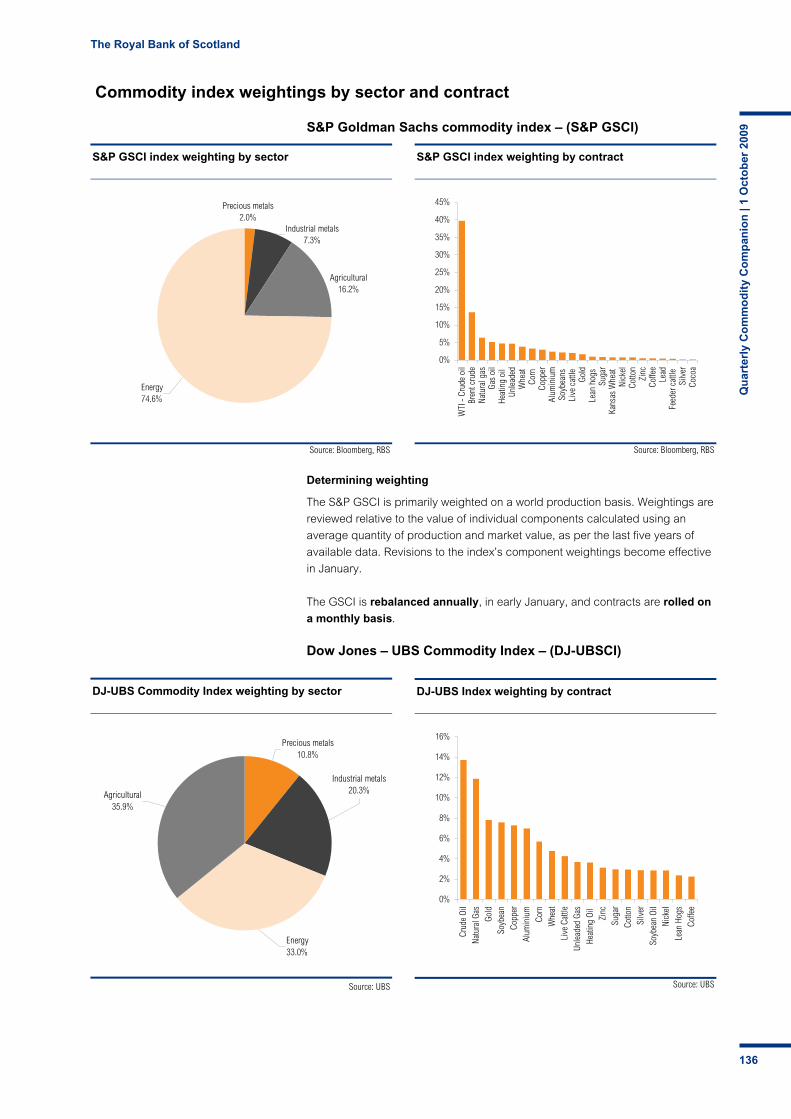
The Royal Bank of Scotland
Qu
arte
rly
Co
mm
od
ity
Co
mp
anio
n |
1 O
cto
ber
200
9
136
Source; UBS
DJ-UBS Commodity Index weighting by sector
Precious metals10.8%
Industrial metals 20.3%Agricultural
35.9%
Energy33.0%
Source: UBS
DJ-UBS Index weighting by contract
0%
2%
4%
6%
8%
10%
12%
14%
16%
Crud
e Oi
lNa
tura
l Gas
Gold
Soyb
ean
Copp
erAl
umin
ium
Corn
Whe
atLi
ve C
attle
Unle
aded
Gas
Heat
ing
Oil
Zinc
Suga
rCo
tton
Silv
erSo
ybea
n Oi
lNi
ckel
Lean
Hog
sCo
ffee
Source: RBS
S&P GSCI index weighting by sector
Industrial metals 7.3%
Agricultural16.2%
Precious metals2.0%
Energy74.6%
Source: RBS
S&P GSCI index weighting by contract
0%
5%
10%
15%
20%
25%
30%
35%
40%
45%
WTI
- Cr
ude
oil
Bren
t cru
deNa
tura
l gas
Gas
oil
Heat
ing
oil
Unle
aded
Whe
at
Corn
Co
pper
Alum
iniu
mSo
ybea
ns
Live
cat
tle
Gold
Lean
hog
s Su
gar
Kans
as W
heat
Ni
ckel
Cotto
nZi
ncCo
ffee
Lead
Feed
er c
attle
Si
lver
Coco
a
Source: Bloomberg, RBS Source: Bloomberg, RBS
Commodity index weightings by sector and contract
S&P Goldman Sachs commodity index – (S&P GSCI)
Determining weighting
The S&P GSCI is primarily weighted on a world production basis. Weightings are
reviewed relative to the value of individual components calculated using an
average quantity of production and market value, as per the last five years of
available data. Revisions to the index’s component weightings become effective
in January.
The GSCI is rebalanced annually, in early January, and contracts are rolled on
a monthly basis.
Dow Jones – UBS Commodity Index – (DJ-UBSCI)
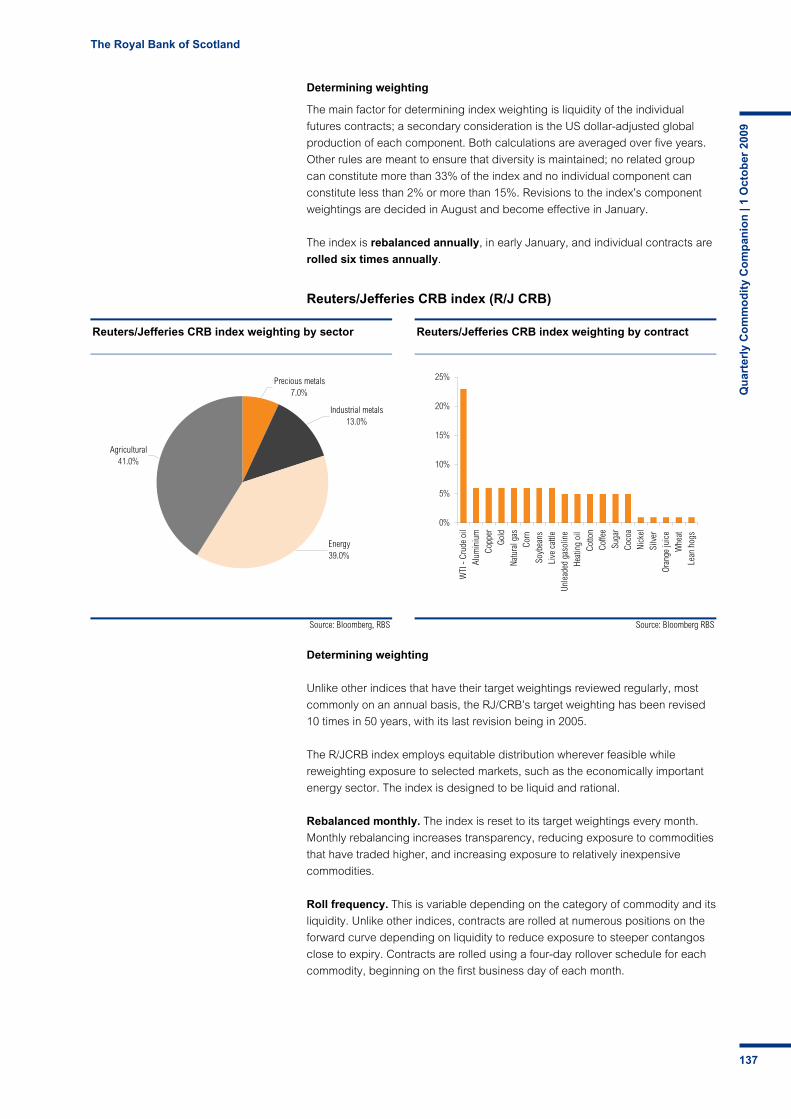
The Royal Bank of Scotland
Qu
arte
rly
Co
mm
od
ity
Co
mp
anio
n |
1 O
cto
ber
200
9
137
Source: Bloomberg, RBS
Reuters/Jefferies CRB index weighting by sector
Energy39.0%
Agricultural41.0%
Industrial metals 13.0%
Precious metals7.0%
Source: Bloomberg RBS
Reuters/Jefferies CRB index weighting by contract
0%
5%
10%
15%
20%
25%
WTI
- Cr
ude
oil
Alum
iniu
mCo
pper
Gold
Natu
ral g
asCo
rn
Soyb
eans
Li
ve c
attle
Un
lead
ed g
asol
ine
Heat
ing
oil
Cotto
nCo
ffee
Suga
rCo
coa
Nick
elSi
lver
Or
ange
juic
e W
heat
Le
an h
ogs
Determining weighting
The main factor for determining index weighting is liquidity of the individual
futures contracts; a secondary consideration is the US dollar-adjusted global
production of each component. Both calculations are averaged over five years.
Other rules are meant to ensure that diversity is maintained; no related group
can constitute more than 33% of the index and no individual component can
constitute less than 2% or more than 15%. Revisions to the index’s component
weightings are decided in August and become effective in January.
The index is rebalanced annually, in early January, and individual contracts are
rolled six times annually.
Reuters/Jefferies CRB index (R/J CRB)
Determining weighting
Unlike other indices that have their target weightings reviewed regularly, most
commonly on an annual basis, the RJ/CRB’s target weighting has been revised
10 times in 50 years, with its last revision being in 2005.
The R/JCRB index employs equitable distribution wherever feasible while
reweighting exposure to selected markets, such as the economically important
energy sector. The index is designed to be liquid and rational.
Rebalanced monthly. The index is reset to its target weightings every month.
Monthly rebalancing increases transparency, reducing exposure to commodities
that have traded higher, and increasing exposure to relatively inexpensive
commodities.
Roll frequency. This is variable depending on the category of commodity and its
liquidity. Unlike other indices, contracts are rolled at numerous positions on the
forward curve depending on liquidity to reduce exposure to steeper contangos
close to expiry. Contracts are rolled using a four-day rollover schedule for each
commodity, beginning on the first business day of each month.
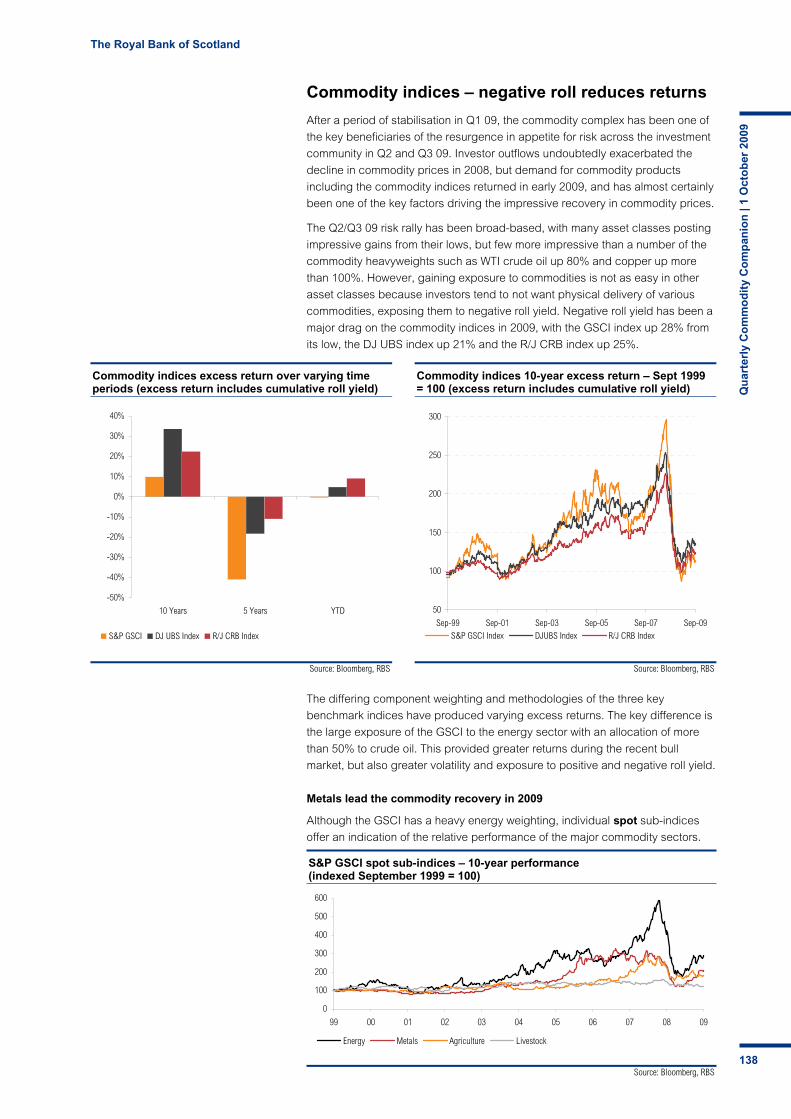
The Royal Bank of Scotland
Qu
arte
rly
Co
mm
od
ity
Co
mp
anio
n |
1 O
cto
ber
200
9
138
Source: Bloomberg, RBS
Commodity indices excess return over varying time periods (excess return includes cumulative roll yield)
-50%
-40%
-30%
-20%
-10%
0%
10%
20%
30%
40%
10 Years 5 Years YTD
S&P GSCI DJ UBS Index R/J CRB Index
Source: Bloomberg, RBS
Commodity indices 10-year excess return – Sept 1999 = 100 (excess return includes cumulative roll yield)
50
100
150
200
250
300
Sep-99 Sep-01 Sep-03 Sep-05 Sep-07 Sep-09S&P GSCI Index DJUBS Index R/J CRB Index
Source: Bloomberg, RBS
S&P GSCI spot sub-indices – 10-year performance (indexed September 1999 = 100)
0
100
200
300
400
500
600
99 00 01 02 03 04 05 06 07 08 09
Energy Metals Agriculture Livestock
Commodity indices – negative roll reduces returns
After a period of stabilisation in Q1 09, the commodity complex has been one of
the key beneficiaries of the resurgence in appetite for risk across the investment
community in Q2 and Q3 09. Investor outflows undoubtedly exacerbated the
decline in commodity prices in 2008, but demand for commodity products
including the commodity indices returned in early 2009, and has almost certainly
been one of the key factors driving the impressive recovery in commodity prices.
The Q2/Q3 09 risk rally has been broad-based, with many asset classes posting
impressive gains from their lows, but few more impressive than a number of the
commodity heavyweights such as WTI crude oil up 80% and copper up more
than 100%. However, gaining exposure to commodities is not as easy in other
asset classes because investors tend to not want physical delivery of various
commodities, exposing them to negative roll yield. Negative roll yield has been a
major drag on the commodity indices in 2009, with the GSCI index up 28% from
its low, the DJ UBS index up 21% and the R/J CRB index up 25%.
The differing component weighting and methodologies of the three key
benchmark indices have produced varying excess returns. The key difference is
the large exposure of the GSCI to the energy sector with an allocation of more
than 50% to crude oil. This provided greater returns during the recent bull
market, but also greater volatility and exposure to positive and negative roll yield.
Metals lead the commodity recovery in 2009
Although the GSCI has a heavy energy weighting, individual spot sub-indices
offer an indication of the relative performance of the major commodity sectors.
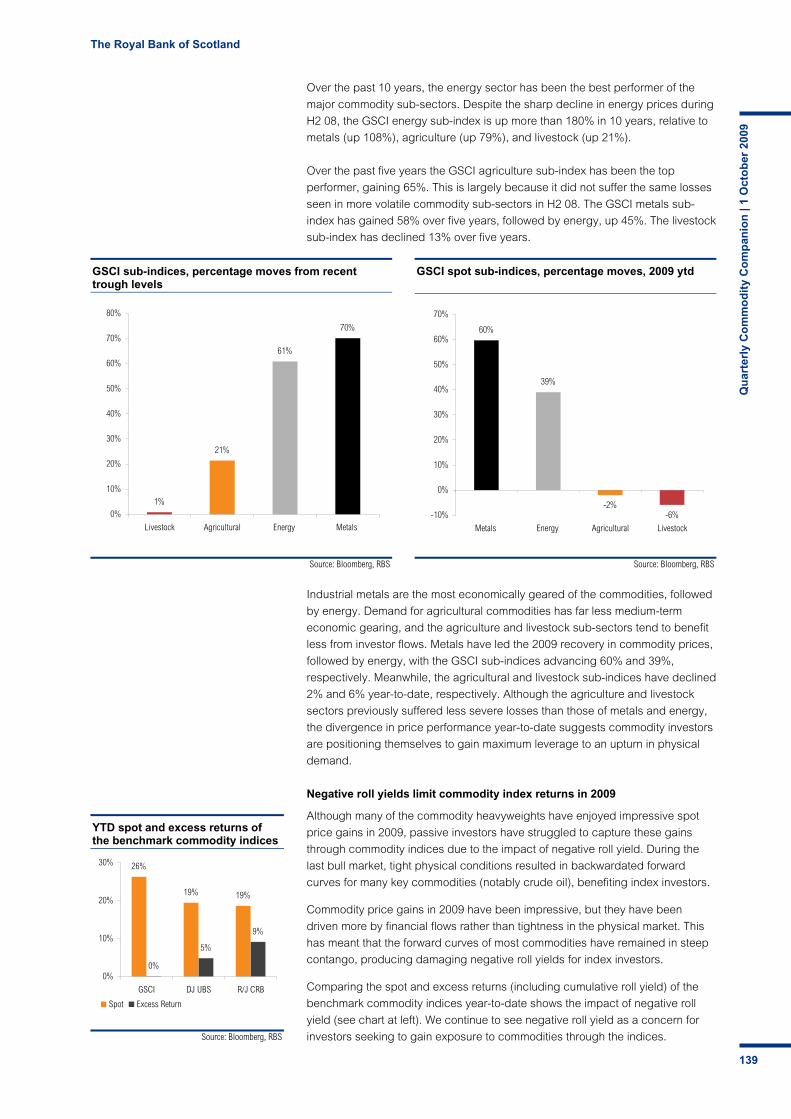
The Royal Bank of Scotland
Qu
arte
rly
Co
mm
od
ity
Co
mp
anio
n |
1 O
cto
ber
200
9
139
Source: Bloomberg, RBS
GSCI sub-indices, percentage moves from recent trough levels
1%
21%
61%
70%
0%
10%
20%
30%
40%
50%
60%
70%
80%
Livestock Agricultural Energy Metals
Source: Bloomberg, RBS
GSCI spot sub-indices, percentage moves, 2009 ytd
60%
39%
-2%-6%-10%
0%
10%
20%
30%
40%
50%
60%
70%
Metals Energy Agricultural Livestock
Source: Bloomberg, RBS
YTD spot and excess returns of the benchmark commodity indices
26%
19% 19%
0%
5%
9%
0%
10%
20%
30%
GSCI DJ UBS R/J CRB
Spot Excess Return
Over the past 10 years, the energy sector has been the best performer of the
major commodity sub-sectors. Despite the sharp decline in energy prices during
H2 08, the GSCI energy sub-index is up more than 180% in 10 years, relative to
metals (up 108%), agriculture (up 79%), and livestock (up 21%).
Over the past five years the GSCI agriculture sub-index has been the top
performer, gaining 65%. This is largely because it did not suffer the same losses
seen in more volatile commodity sub-sectors in H2 08. The GSCI metals sub-
index has gained 58% over five years, followed by energy, up 45%. The livestock
sub-index has declined 13% over five years.
Industrial metals are the most economically geared of the commodities, followed
by energy. Demand for agricultural commodities has far less medium-term
economic gearing, and the agriculture and livestock sub-sectors tend to benefit
less from investor flows. Metals have led the 2009 recovery in commodity prices,
followed by energy, with the GSCI sub-indices advancing 60% and 39%,
respectively. Meanwhile, the agricultural and livestock sub-indices have declined
2% and 6% year-to-date, respectively. Although the agriculture and livestock
sectors previously suffered less severe losses than those of metals and energy,
the divergence in price performance year-to-date suggests commodity investors
are positioning themselves to gain maximum leverage to an upturn in physical
demand.
Negative roll yields limit commodity index returns in 2009
Although many of the commodity heavyweights have enjoyed impressive spot
price gains in 2009, passive investors have struggled to capture these gains
through commodity indices due to the impact of negative roll yield. During the
last bull market, tight physical conditions resulted in backwardated forward
curves for many key commodities (notably crude oil), benefiting index investors.
Commodity price gains in 2009 have been impressive, but they have been
driven more by financial flows rather than tightness in the physical market. This
has meant that the forward curves of most commodities have remained in steep
contango, producing damaging negative roll yields for index investors.
Comparing the spot and excess returns (including cumulative roll yield) of the
benchmark commodity indices year-to-date shows the impact of negative roll
yield (see chart at left). We continue to see negative roll yield as a concern for
investors seeking to gain exposure to commodities through the indices.

The Royal Bank of Scotland
Qu
arte
rly
Co
mm
od
ity
Co
mp
anio
n |
1 O
cto
ber
200
9
140
Source: WGC, RBS
ETF gold holdings vs US dollar-denominated gold price
250
500
750
1,000
1,250
1,500
1,750
Sep-07 Sep-08 Sep-09
tonn
es
500
600
700
800
900
1,000
1,100
USD/oz
GLD-NYSE Swiss FundsOthers Price (rhs)
Source: iShares, ETF Securities, ZKB, RBS
12 month silver ETF holdings vs US$-denominated gold price
2,000
4,000
6,000
8,000
10,000
12,000
Sep-07 Sep-08 Sep-09
tonn
es
6
9
12
16
19
22
USD/oz
ishares ZKBLSE Price (RHS)
Precious metal ETFs – stabilisation In H2 08 and Q1 09, the precious metal ETFs, most notably gold, took centre
stage in the precious metals arena, enjoying record inflows as investors looked
for safety in real assets and to the ‘safe haven’ properties of the precious metals.
As the risk rally absorbed the financial community in Q2 and Q3 09, one might
have expected investors to move out of these instruments as risk appetite
improved, but this was not the case. Despite periods of modest net redemptions
from the precious metals ETFs during Q2 and Q3, holdings in all of the funds,
bar silver, stood at record levels in late September 2009.
It has become the consensus view that the worst is over and the world economy
will return to growth in 2010, yet investors are still holding a near-record $55bn in
ETFs of gold, the ‘asset of last resort’. In our view, this demonstrates that gold’s
‘safe haven’ properties are not its only attraction to investors. The resilience of
the gold ETFs during the risk rally of Q2 and Q3 09 suggests that if investors
have learned anything from the financial crisis, it is the value of portfolio diversity.
We believe that the desire for greater portfolio diversity as well as the desire for
exposure to real assets, partly as a hedge against potential inflation, will be key
factors that will underpin further growth in the precious metal ETFs in the future.
Gold ETF holdings have increased by 536t (45%) so far in 2009, and currently
stand at a record 1,725t. Inflows so far in 2009 are 68% higher than the 318t of
inflows seen in the whole of 2008, and account for 15% of 2008 global demand.
Total ETF value has risen by US$22bn (66%) in 2009 to US$55bn. 59% of total
growth in gold holdings so far in 2009 has been in the SPDR ETF, which
accounts for 63% of total holdings. However, the majority of these inflows came
in Q1 09, and after peaking in June there has been a net 38t of redemptions from
the SPDR ETF. These redemptions have been offset by growth in the smaller
funds, most notably the increasingly popular Swiss ETFs. Holdings in the ZKB
gold fund have risen 52% year-to-date and it is now, at over 150t, the second-
largest gold ETF, while the Julius Baer fund has surged from 9t to 65t YTD.
Silver ETF holdings have increased by 2,694t (33%) year-to-date, to 10,947t,
and their value has increased by US$2.8bn (99%), benefiting from a 50% YTD
increase in the silver price. Silver’s fundamental position remains a little shaky,
with the market likely to sustain a significant surplus this year, largely as a result
of weak industrial demand. However, so far in 2009, robust investment demand,
especially in ETFs, has been more than able to absorb this excess material.
Platinum ETF holdings have risen by 8.2t (89%) year-to-date, to a record 17.4t,
and their value has increased by US$450m (169%), supported by a 42%
increase in the platinum price. The platinum funds are the only family of precious
metal ETFs that suffered significant redemptions in H2 08, when prices fell. After
a volatile H1 09 in which holdings fluctuated broadly in line with changes in the
platinum price, holdings were stable in July-August, picking up in September.
Palladium ETF holdings have increased by 13.2t (64%) year-to-date, to a record
33.8t, and their value has increased by US$197m (162%) to a total of US$318m.
Precious metal ETF summary (end-period values)
Volume – tonnes Value – US$m
2006 2007 2008 2009 ytd % chg ytd % of total 2006 2007 2008 2009 ytd % chg ytd % of total
Gold 621 872 1,189 1,725 45% 14% 12,622 23,362 33,078 54,979 66% 89%
Silver 3,768 5,297 8,253 10,947 33% 86% 1,563 2,514 2,863 5,702 99% 9%
Platinum - 6.0 9.2 17.4 89% 0.1% - 297 267 717 169% 1.2%
Palladium - 8.7 20.6 33.8 64% 0.3% - 102 121 318 162% 0.5%
Total 4,389 6,183 9,472 12,723 34% 100% 14,185 26,275 36,329 61,716 70% 100%
Source: ETF Securities, Zurcher Kantonalbank, iShares, WGC, LBMA, LPPM
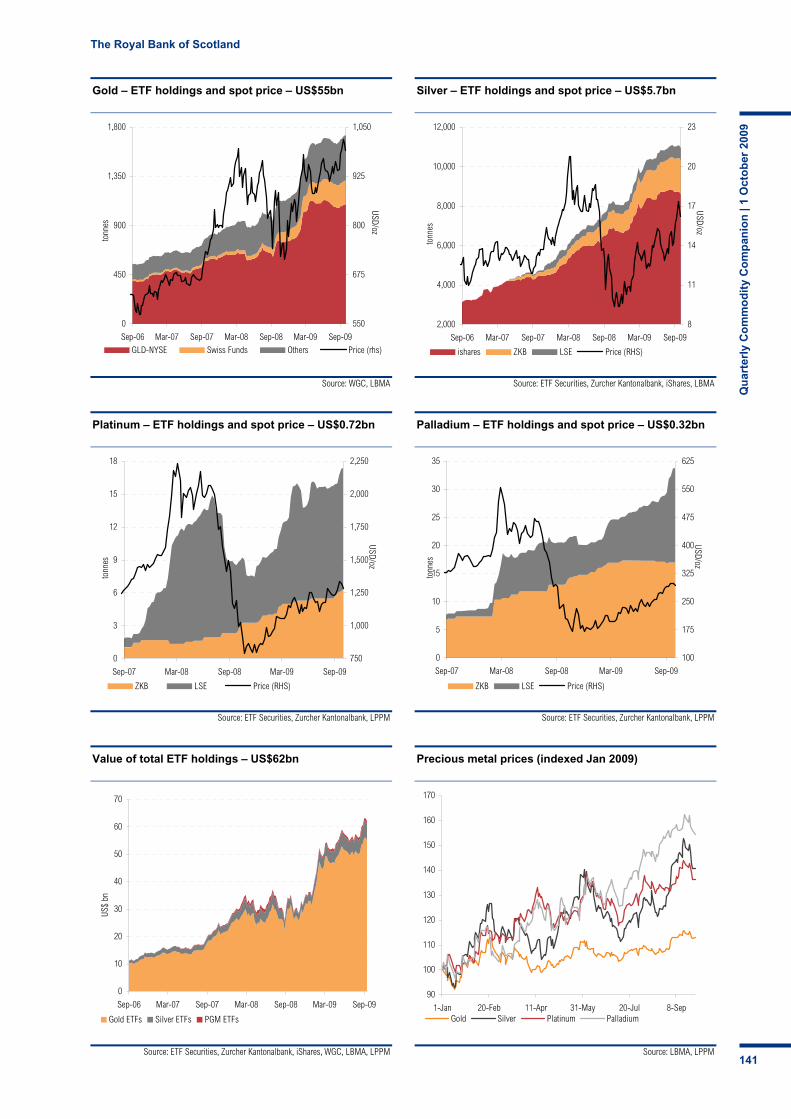
The Royal Bank of Scotland
Qu
arte
rly
Co
mm
od
ity
Co
mp
anio
n |
1 O
cto
ber
200
9
141
Source: WGC, LBMA
Gold – ETF holdings and spot price – US$55bn
0
450
900
1,350
1,800
Sep-06 Mar-07 Sep-07 Mar-08 Sep-08 Mar-09 Sep-09
tonn
es
550
675
800
925
1,050
USD/oz
GLD-NYSE Swiss Funds Others Price (rhs)
Source: ETF Securities, Zurcher Kantonalbank, iShares, LBMA
Silver – ETF holdings and spot price – US$5.7bn
2,000
4,000
6,000
8,000
10,000
12,000
Sep-06 Mar-07 Sep-07 Mar-08 Sep-08 Mar-09 Sep-09
tonn
es
8
11
14
17
20
23
USD/oz
ishares ZKB LSE Price (RHS)
Source: ETF Securities, Zurcher Kantonalbank, LPPM
Platinum – ETF holdings and spot price – US$0.72bn
0
3
6
9
12
15
18
Sep-07 Mar-08 Sep-08 Mar-09 Sep-09
tonn
es
750
1,000
1,250
1,500
1,750
2,000
2,250
USD/oz
ZKB LSE Price (RHS)
Source: ETF Securities, Zurcher Kantonalbank, LPPM
Palladium – ETF holdings and spot price – US$0.32bn
0
5
10
15
20
25
30
35
Sep-07 Mar-08 Sep-08 Mar-09 Sep-09
tonn
es
100
175
250
325
400
475
550
625
USD/oz
ZKB LSE Price (RHS)
Source: ETF Securities, Zurcher Kantonalbank, iShares, WGC, LBMA, LPPM
Value of total ETF holdings – US$62bn
0
10
20
30
40
50
60
70
Sep-06 Mar-07 Sep-07 Mar-08 Sep-08 Mar-09 Sep-09
US$
bn
Gold ETFs Silver ETFs PGM ETFs
Source: LBMA, LPPM
Precious metal prices (indexed Jan 2009)
90
100
110
120
130
140
150
160
170
1-Jan 20-Feb 11-Apr 31-May 20-Jul 8-SepGold Silver Platinum Palladium

The Royal Bank of Scotland
Qu
arte
rly
Co
mm
od
ity
Co
mp
anio
n |
1 O
cto
ber
200
9
142
Aluminium – five-year global historical view of top producers and consumers
Global alumina production ranked by 2008 output (000 tonnes)
Top 5 = 86% Jan-Jun
Country 2004 2005 2006 2007 2008 % Mkt. 5 yrs % pa 2008 2009 % change
China 6,994 8,510 13,696 19,456 22,784 27% 30.1% 11,129 10,610 -4.7%
Oceania 16,975 17,920 18,607 19,249 19,728 24% 3.3% 9,722 9,883 1.7%
Latin America 13,076 13,188 14,872 15,111 15,768 19% 4.8% 7,576 6,838 -9.7%
Western Europe 6,377 6,560 6,748 6,809 6,951 8% 2.6% 3,466 2,252 -35.0%
North America 6,887 6,928 6,799 6,076 6,160 7% 0.2% 3,175 1,735 -45.4%
Asia 5,397 5,395 5,364 5,564 5,993 7% 3.0% 3,041 2,994 -1.5%
East/Central Europe 5,381 5,430 5,475 5,528 5,301 6% 0.4% 2,681 2,266 -15.5%
Africa 779 736 530 526 595 1% -4.0% 273 272 -0.4%
Global total 61,866 64,667 72,091 78,319 83,280 100% 7.2% 41,063 36,850 -10.3%
Change % 5.4% 4.5% 11.5% 8.6% 6.3% Change -4,213
Source: Monthly Bulletin of the World Bureau of Metal Statistics and IAI – September 2009
Global refined aluminium metal production ranked by 2008 output (000 tonnes)
Top 5 = 63% Jan-Jul
Country 2004 2005 2006 2007 2008 % Mkt. 5 yrs % pa 2008 2009 % change
China 6,689 7,806 9,358 12,559 13,177 34% 18.9% 7,788 6,616 -15.0%
Russia 3,594 3,647 3,718 3,955 3,800 10% 1.8% 2,217 2,151 -3.0%
Canada 2,592 2,894 3,051 3,083 3,119 8% 2.2% 1,814 1,768 -2.5%
US 2,517 2,480 2,281 2,560 2,659 7% -0.3% 1,599 1,055 -34.0%
Australia 1,895 1,903 1,932 1,959 1,974 5% 1.2% 1,143 1,133 -0.9%
Brazil 1,457 1,498 1,604 1,655 1,661 4% 3.8% 965 900 -6.7%
Norway 1,322 1,377 1,427 1,357 1,359 3% 2.7% 792 654 -17.4%
India 861 942 1,105 1,222 1,308 3% 10.4% 742 854 15.2%
South Africa 864 851 887 898 811 2% 2.0% 477 632 32.6%
UAE 683 850 789 890 892 2% 10.7% 548 542 -1.1%
Others 7,462 7,769 7,823 7,970 8,507 22% 4.0% 4,974 4,261 -14.3%
Global total 29,936 32,017 33,975 38,108 39,265 100% 7.0% 23,058 20,566 -10.8%
Change % 6.9% 7.0% 6.1% 12.2% 3.0% Change -2,492
Source: Monthly Bulletin of the World Bureau of Metal Statistics – September 2009
Global refined aluminium metal consumption ranked by 2008 consumption (000 tonnes)
Top 5 = 62% Jan-Jul
Country 2004 2005 2006 2007 2008 % Mkt. 5 yrs % pa 2008 2009 % change
China 6,043 7,119 8,648 12,347 12,413 34% 19.1% 7,247 7,802 7.7%
USA 5,800 6,114 6,150 5,545 4,906 13% -2.8% 3,069 2,253 -26.6%
Japan 2,319 2,276 2,323 2,197 2,250 6% 0.1% 1,350 790 -41.5%
Germany 1,795 1,759 1,823 2,008 1,950 5% 0.3% 1,217 619 -49.1%
India 861 958 1,080 1,207 1,284 3% 10.0% 772 762 -1.4%
Russia 1,020 1,020 1,047 1,020 1,020 3% 4.9% 595 595 0.0%
South Korea 1,118 1,201 1,153 1,081 964 3% -0.4% 637 540 -15.2%
Italy 987 977 1,021 1,087 951 3% -0.1% 613 359 -41.4%
Brazil 651 759 773 854 932 3% 9.6% 546 403 -26.2%
Canada 755 801 846 718 714 2% -0.6% 407 347 -14.8%
Others 8,617 8,704 9,090 9,497 9,638 26% 4.5% 5,855 4,797 -18.1%
Global Total 29,965 31,689 33,954 37,561 37,020 100% 6.0% 22,308 19,268 -13.6%
Change % 8.5% 5.8% 7.1% 10.6% -1.4% Change -3,040
Source: Monthly Bulletin of the World Bureau of Metal Statistics – September 2009

The Royal Bank of Scotland
Qu
arte
rly
Co
mm
od
ity
Co
mp
anio
n |
1 O
cto
ber
200
9
143
Copper – five-year global historical view of top producers and consumers
Global copper mine production ranked by 2008 output (000 tonnes)
Top 5 = 64% Jan-May
Country 2004 2005 2006 2007 2008 % Mkt. 5 yrs % pa 2008 2009 % change
Chile 5,413 5,321 5,361 5,557 5,331 34% 1.7% 2,207 2,110 -4.4%
USA 1,174 1,157 1,222 1,194 1,336 9% 3.4% 519 504 -2.9%
Peru 1,036 1,010 1,049 1,190 1,268 8% 8.0% 502 520 3.5%
China 754 777 889 946 1,023 7% 10.7% 413 363 -12.2%
Australia 854 916 859 871 884 6% 1.0% 352 336 -4.4%
Russian Federation 630 640 675 690 705 5% 1.6% 291 298 2.2%
Indonesia 843 1,065 816 789 651 4% -8.3% 226 430 90.0%
Canada 563 596 603 596 607 4% 1.7% 241 243 1.0%
Zambia 402 433 474 509 546 4% 7.6% 215 229 6.6%
Poland 531 512 497 452 429 3% -3.2% 178 185 4.1%
Others 2,395 2,498 2,545 2,670 2,681 17% 3.0% 1,074 1,133 5.6%
Global total 14,594 14,924 14,990 15,465 15,458 100% 2.4% 6,218 6,352 2.2%
Change % 6.1% 2.3% 0.4% 3.2% -0.0% Change 134
Source: Monthly Bulletin of the International Copper Study Group ( ICSG) – August 2009
Global refined copper production ranked by 2008 output (000 tonnes)
Top 5 = 58% Jan-May
Country 2004 2005 2006 2007 2008 % Mkt. 5 yrs % pa 2008 2009 % change
China 2,199 2,600 3,003 3,499 3,791 21% 15.6% 1,550 1,611 3.9%
Chile 2,837 2,824 2,811 2,936 3,060 17% 1.1% 1,221 1,349 10.5%
Japan 1,380 1,395 1,532 1,577 1,540 8% 1.5% 638 580 -9.1%
United States 1,306 1,255 1,250 1,311 1,267 7% -0.6% 529 483 -8.6%
Russian Federation 919 935 951 949 862 5% 0.5% 356 337 -5.5%
Germany 653 638 662 666 694 4% 3.1% 288 275 -4.6%
India 405 493 625 715 675 4% 11.6% 281 299 6.5%
South Korea 496 519 576 582 537 3% 1.0% 219 203 -7.3%
Poland 550 560 557 533 527 3% -0.1% 217 200 -7.7%
Canada 527 515 501 454 444 2% -0.5% 209 154 -26.2%
Others 4,656 4,838 4,827 4,722 4,849 27% 1.6% 1,969 1,935 -1.7%
Global total 15,928 16,573 17,295 17,944 18,245 100% 3.6% 7,476 7,425 -0.7%
Change % 4.3% 4.0% 4.4% 3.8% Change -51
Source: Monthly Bulletin of the International Copper Study Group ( ICSG) – August 2009
Global refined copper consumption ranked by 2008 consumption (000 tonnes)
Top 5 = 58% Jan-May
Country 2004 2005 2006 2007 2008 % Mkt. 5 yrs % pa 2008 2009 % change
China 3,381 3,652 3,604 4,957 5,199 29% 10.9% 2,091 3,001 43.5%
US 2,415 2,274 2,130 2,137 1,952 11% -3.2% 879 693 -21.2%
Germany 1,121 1,180 1,398 1,392 1,365 8% 6.2% 581 435 -25.1%
Japan 1,279 1,223 1,282 1,252 1,184 7% -0.3% 515 308 -40.2%
South Korea 937 864 812 821 780 4% -3.0% 331 370 11.5%
Russian Federation 588 635 692 671 650 4% 7.8% 269 164 -38.8%
Italy 719 681 801 764 635 4% -0.9% 284 211 -25.8%
Taiwan 690 638 639 603 582 3% -1.2% 261 177 -32.4%
India 350 415 440 475 500 3% 10.0% 202 220 9.2%
France 550 505 540 440 410 2% -5.4% 191 105 -45.2%
Others 4,811 4,606 4,704 4,663 4,750 26% 0.6% 2,054 1,892 -7.9%
Global total 16,840 16,673 17,042 18,175 18,007 100% 2.8% 7,659 7,575 -1.1%
Change % 7.2% -1.0% 2.2% 6.6% Change -84
Source: Monthly Bulletin of the International Copper Study Group ( ICSG) – August 2009

The Royal Bank of Scotland
Qu
arte
rly
Co
mm
od
ity
Co
mp
anio
n |
1 O
cto
ber
200
9
144
Nickel – five-year global historical view of top producers and consumers
Global nickel mine production ranked by 2008 output (000 tonnes)
Top 5= 70% Jan-Jul
Country 2004 2005 2006 2007 2008 % Mkt. 5 yrs % pa 2008 2009 % change
Russia 289 289 290 294 287 19% -1.0% 167 160 -4.2%
Canada 187 200 233 255 260 17% 9.8% 150 108 -28.3%
Australia 187 186 185 185 200 13% 0.9% 116 97 -16.9%
Indonesia 153 156 157 229 193 13% 4.0% 124 99 -20.5%
New Caledonia 118 112 103 125 103 7% -1.7% 56 48 -14.0%
Philippines 17 29 65 91 84 6% 33.9% 43 105 145.9%
China 76 73 82 66 72 5% 3.2% 40 54 33.4%
Cuba 72 72 74 74 67 5% 0.1% 38 40 4.7%
Colombia 49 53 51 49 42 3% -2.8% 22 31 46.0%
South Africa 40 42 42 38 32 2% -5.0% 18 19 10.2%
Others 151 160 163 163 147 10% -1.8% 91 66 -27.4%
Global Total 1,339 1,371 1,445 1,570 1,484 100% 2.3% 865 827 -4.4%
Change % 1.3% 2.4% 5.4% 8.7% -5.5% Change -38
Source: Monthly Bulletin of the World Bureau of Metal Statistics – September 2009
Global refined nickel production ranked by 2008 output (000 tonnes)
Top 5= 64% Jan-Jul
Country 2004 2005 2006 2007 2008 % Mkt. 5 yrs % pa 2008 2009 % change
Russia 261 268 274 267 260 19% -0.2% 148 138 -7.1%
China 76 95 132 220 171 13% 21.3% 103 127 23.1%
Canada 152 140 147 154 168 12% 6.2% 97 85 -13.0%
Japan 169 164 152 161 157 12% -0.8% 94 79 -16.6%
Australia 122 122 116 114 108 8% -3.5% 69 76 11.1%
Norway 71 85 82 88 89 7% 2.9% 51 49 -4.9%
Finland 50 39 48 55 52 4% -0.5% 28 32 14.8%
Colombia 49 53 51 49 42 3% -2.8% 22 31 46.0%
New Caledonia 43 47 49 45 38 3% -6.0% 21 23 7.1%
Cuba 42 44 44 43 35 3% -2.1% 20 20 0.0%
Others 216 232 241 250 233 17% 3.3% 141 108 -23.2%
Global Total 1,251 1,288 1,336 1,445 1,351 100% 2.2% 794 767 -3.4%
Change % 3.3% 2.9% 3.7% 8.2% -6.5% Change -27
Source: Monthly Bulletin of the World Bureau of Metal Statistics – September 2009
Global refined nickel consumption ranked by 2008 consumption (000 tonnes)
Top 5= 59% Jan-Jul
Country 2004 2005 2006 2007 2008 % Mkt. 5 yrs % pa 2007 2008 % change
China 144 197 234 328 305 24% 18.1% 187 342 82.7%
Japan 195 180 181 196 185 14% -0.3% 114 79 -30.2%
US 128 135 145 119 121 9% 0.7% 77 54 -30.2%
Germany 94 116 106 110 90 7% -1.1% 50 27 -46.0%
Italy 62 60 68 64 68 5% -0.9% 43 21 -50.8%
South Korea 123 118 93 71 76 6% -7.7% 49 48 -2.5%
Taiwan 91 84 107 76 69 5% -7.7% 45 40 -12.1%
South Africa 45 47 54 44 44 3% 2.0% 30 23 -25.7%
Finland 59 49 51 40 41 3% -8.8% 28 10 -63.4%
Spain 48 48 53 42 41 3% -3.2% 26 12 -54.8%
Others 262 262 275 263 257 20% -1.4% 156 110 -29.1%
Global total 1,251 1,296 1,366 1,353 1,297 100% 0.8% 805 766 -4.9%
Change % 0.1% 3.6% 5.4% -0.9% Change -39
Source: Monthly Bulletin of the World Bureau of Metal Statistics – September 2009

The Royal Bank of Scotland
Qu
arte
rly
Co
mm
od
ity
Co
mp
anio
n |
1 O
cto
ber
200
9
145
Zinc – five-year global historical view of top producers and consumers
Global zinc mine production ranked by 2008 output (000 tonnes)
Top 5 = 66% Jan-Jul
Country 2004 2005 2006 2007 2009 % Mkt. 5 yrs % pa 2008 2009 % change
China 2,391 2,547 2,844 3,048 3,186 27% 9.4% 1,741 1,470 -15.6%
Peru 1,209 1,202 1,202 1,444 1,603 14% 3.2% 917 861 -6.1%
Australia 1,298 1,329 1,338 1,498 1,479 13% 0.4% 868 673 -22.5%
US 739 748 727 803 779 7% 0.3% 477 417 -12.6%
Canada 791 667 638 630 716 6% -1.9% 413 403 -2.4%
India 355 472 503 558 616 5% 15.1% 359 374 4.2%
Kazakhstan 361 364 410 446 482 4% 4.2% 281 287 2.1%
Mexico 426 476 469 452 464 4% 2.3% 268 302 12.7%
Ireland 438 445 426 401 398 3% -1.0% 244 236 -3.3%
Bolivia 147 160 173 194 362 3% 20.1% 193 242 25.4%
Others 1,554 1,736 1,714 1,669 1,667 14% 3.0% 971 984 1.3%
Global total 9,709 10,146 10,444 11,143 11,752 100% 4.3% 6,732 6,249 -7.2%
yoy change % 2.0% 4.5% 2.9% 6.7% 5.5% Change -483
Source: Monthly Bulletin of the International Lead Zinc Study Group – September 2009
Global refined zinc production ranked by 2008 output (000 tonnes)
Top 5 = 48% Jan-Jul
Country 2004 2005 2006 2007 2008 % Mkt. 5 yrs % pa 2008 2009 % change
China 2,720 2,776 3,163 3,743 2,913 25% 4.7% 2,253 2,281 1.2%
Canada 805 724 824 802 764 7% 0.1% 455 386 -15.2%
South Korea 669 647 667 691 739 6% 2.8% 436 432 -0.9%
India 272 302 415 459 606 5% 16.7% 345 392 13.6%
Japan 635 638 614 598 616 5% -1.1% 371 317 -14.6%
Australia 474 457 466 502 499 4% -2.0% 292 303 3.8%
Spain 523 500 507 509 466 4% -2.1% 272 284 4.4%
Kazakhstan 317 357 365 358 366 3% 5.6% 214 189 -11.7%
Mexico 337 336 285 320 321 3% 0.1% 180 183 1.7%
Germany 358 335 317 295 292 2% -5.5% 175 80 -54.3%
Others 3,282 3,150 3,032 3,089 4,120 35% 5.4% 1,867 1,464 -21.6%
Global total 10,392 10,222 10,655 11,366 11,702 100% 3.4% 6,860 6,311 -8.0%
yoy change % 5.2% -1.6% 4.2% 6.7% 3.0% Change -549
Source: Monthly Bulletin of the International Lead Zinc Study Group – September 2009
Global refined zinc consumption ranked by 2008 consumption (000 tonnes)
Top 5 = 58% Jan-Jul
Country 2004 2005 2006 2007 2008 % Mkt. 5 yrs % pa 2008 2009 % change
China 2,690 3,041 3,115 3,597 4,014 35% 13.2% 3,597 4,014 11.6%
US 1,247 1,078 1,153 1,016 990 9% -3.0% 1,016 990 -2.6%
Japan 623 602 594 588 570 5% -1.6% 588 570 -3.1%
Germany 514 511 564 535 526 5% -0.5% 535 526 -1.7%
South Korea 446 476 534 512 507 4% 1.0% 512 507 -1.0%
India 347 388 430 455 490 4% 7.6% 455 490 7.7%
Belgium 365 345 360 387 393 3% 2.3% 387 393 1.6%
Italy 389 395 313 398 281 2% -4.2% 398 281 -29.4%
France 298 275 285 275 247 2% -3.2% 275 247 -10.2%
Brazil 242 222 238 248 253 2% 2.6% 248 253 2.0%
Others 3,487 3,278 3,386 3,298 3,210 28% -0.8% 3,298 3,217 -2.5%
Global total 10,648 10,611 10,972 11,309 11,481 100% 3.1% 11,309 11,488 1.6%
yoy change % 8.2% -0.3% 3.4% 3.1% 1.5% Change 179
Source: Monthly Bulletin of the International Lead Zinc Study Group – September 2009

The Royal Bank of Scotland
Qu
arte
rly
Co
mm
od
ity
Co
mp
anio
n |
1 O
cto
ber
200
9
146
Lead – five-year global historical view of top producers and consumers
Global lead mine production ranked by 2008 output (000 tonnes)
Top 5 = 78% Jan-Jul
Country 2004 2005 2006 2007 2008 % Mkt 5 yrs % pa 2008 2009 % change
China 997 1,142 1,331 1,402 1,543 39% 10.1% 868 890 2.5%
Australia 642 715 621 589 594 15% -1.7% 343 273 -20.4%
US 445 436 429 434 420 11% -1.7% 258 237 -8.1%
Peru 306 319 313 329 345 9% 2.3% 195 168 -13.8%
Mexico 118 135 135 137 145 4% 0.8% 81 88 8.6%
India 51 60 69 78 84 2% 13.8% 49 51 4.1%
Canada 77 79 83 75 99 3% 4.1% 58 40 -31.0%
Sweden 54 60 56 63 77 2% 9.0% 45 41 -8.9%
Bolivia 10 11 12 20 80 2% 51.6% 42 53 26.2%
Russia 23 36 34 48 60 2% 20.1% 35 37 5.7%
Others 408 428 442 432 466 12% 2.9% 273 288 5.5%
Global total 3,131 3,421 3,525 3,607 3,913 100% 4.6% 2,247 2,166 -3.6%
yoy change % 0.4% 9.3% 3.0% 2.3% 8.5% Change -81
Source: Monthly Bulletin of the International Lead Zinc Study Group – September 2009
Global refined lead metal production ranked by 2008 output (000 tonnes)
Top 5= 63% Jan-Jul
Country 2004 2005 2006 2007 2008 % Mkt 5 yrs % pa 2008 2009 %change
China 1,934 2,391 2,715 2,788 3,206 37% 15.4% 1,744 2,139 22.6%
US 1,262 1,293 1,303 1,303 1,286 15% -1.6% 749 721 -3.7%
Germany 411 418 379 405 415 5% 3.1% 253 222 -12.3%
UK 243 304 298 275 303 3% -1.1% 180 185 2.8%
Japan 283 275 280 276 279 3% -1.1% 276 279 1.1%
South Korea 243 256 240 260 270 3% 3.3% 158 168 6.3%
Australia 273 268 241 238 261 3% -3.2% 151 122 -19.2%
Canada 241 230 250 237 259 3% 3.0% 149 149 0.0%
Mexico 242 256 253 255 255 3% 1.3% 149 147 -1.3%
Italy 202 211 191 212 200 2% -1.3% 121 93 -23.1%
Others 1,664 1,738 1,787 1,883 1,945 22% 3.7% 1,044 923 -11.6%
Global total 6,998 7,640 7,937 8,132 8,679 100% 5.1% 4,974 5,148 3.5%
yoy change % 3.5% 9.2% 3.9% 2.5% 6.7% Change 174
Source: Monthly Bulletin of the International Lead Zinc Study Group – September 2009
Global refined lead metal consumption ranked by 2008 consumption (000 tonnes)
Top 5 = 66% Jan-Jul
Country 2004 2005 2006 2007 2008 % Mkt 5 yrs % pa 2008 2009 %change
China 1,510 1,973 2,213 2,573 3,211 37% 22.1% 1,726 2,277 31.9%
US 1,502 1,587 1,622 1,510 1,521 18% 0.1% 923 820 -11.2%
Germany 395 407 387 409 369 4% -0.8% 239 176 -26.4%
South Korea 376 384 337 342 312 4% -2.2% 178 164 -7.9%
Italy 272 269 285 269 276 3% 1.4% 169 132 -21.9%
Japan 292 291 303 279 261 3% -3.4% 162 97 -40.1%
UK 295 271 270 239 236 3% -4.8% 143 135 -5.6%
Spain 246 270 272 260 228 3% 1.1% 143 108 -24.5%
Mexico 262 267 271 235 215 2% -3.7% 128 113 -11.7%
France 215 215 210 210 190 2% -2.9% 117 82 -29.9%
Others 1,931 1,869 1,905 1,863 1,830 21% 0.0% 1,068 992 -7.1%
Global total 7,296 7,803 8,075 8,189 8,649 100% 4.9% 4,996 5,096 2.0%
yoy change % 6.9% 6.9% 3.5% 1.4% 5.6% Change 100
Source: Monthly Bulletin of the International Lead Zinc Study Group – September 2009
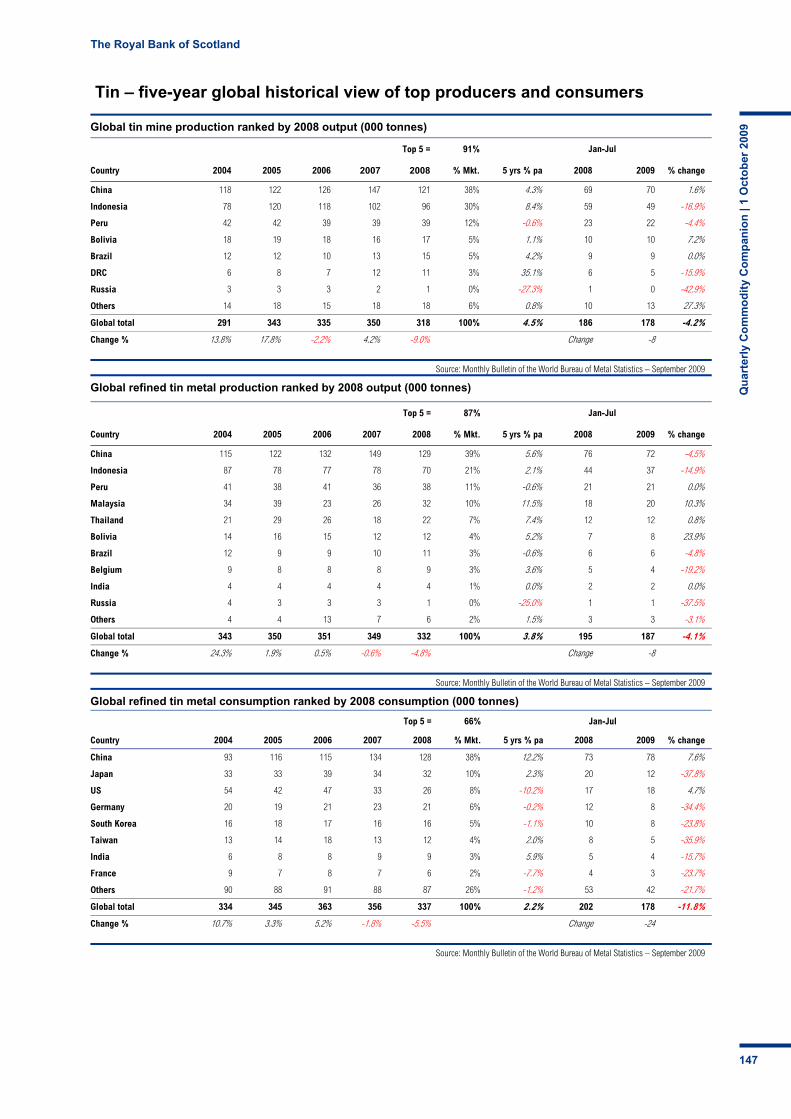
The Royal Bank of Scotland
Qu
arte
rly
Co
mm
od
ity
Co
mp
anio
n |
1 O
cto
ber
200
9
147
Tin – five-year global historical view of top producers and consumers
Global tin mine production ranked by 2008 output (000 tonnes)
Top 5 = 91% Jan-Jul
Country 2004 2005 2006 2007 2008 % Mkt. 5 yrs % pa 2008 2009 % change
China 118 122 126 147 121 38% 4.3% 69 70 1.6%
Indonesia 78 120 118 102 96 30% 8.4% 59 49 -16.9%
Peru 42 42 39 39 39 12% -0.6% 23 22 -4.4%
Bolivia 18 19 18 16 17 5% 1.1% 10 10 7.2%
Brazil 12 12 10 13 15 5% 4.2% 9 9 0.0%
DRC 6 8 7 12 11 3% 35.1% 6 5 -15.9%
Russia 3 3 3 2 1 0% -27.3% 1 0 -42.9%
Others 14 18 15 18 18 6% 0.8% 10 13 27.3%
Global total 291 343 335 350 318 100% 4.5% 186 178 -4.2%
Change % 13.8% 17.8% -2.2% 4.2% -9.0% Change -8
Source: Monthly Bulletin of the World Bureau of Metal Statistics – September 2009
Global refined tin metal production ranked by 2008 output (000 tonnes)
Top 5 = 87% Jan-Jul
Country 2004 2005 2006 2007 2008 % Mkt. 5 yrs % pa 2008 2009 % change
China 115 122 132 149 129 39% 5.6% 76 72 -4.5%
Indonesia 87 78 77 78 70 21% 2.1% 44 37 -14.9%
Peru 41 38 41 36 38 11% -0.6% 21 21 0.0%
Malaysia 34 39 23 26 32 10% 11.5% 18 20 10.3%
Thailand 21 29 26 18 22 7% 7.4% 12 12 0.8%
Bolivia 14 16 15 12 12 4% 5.2% 7 8 23.9%
Brazil 12 9 9 10 11 3% -0.6% 6 6 -4.8%
Belgium 9 8 8 8 9 3% 3.6% 5 4 -19.2%
India 4 4 4 4 4 1% 0.0% 2 2 0.0%
Russia 4 3 3 3 1 0% -25.0% 1 1 -37.5%
Others 4 4 13 7 6 2% 1.5% 3 3 -3.1%
Global total 343 350 351 349 332 100% 3.8% 195 187 -4.1%
Change % 24.3% 1.9% 0.5% -0.6% -4.8% Change -8
Source: Monthly Bulletin of the World Bureau of Metal Statistics – September 2009
Global refined tin metal consumption ranked by 2008 consumption (000 tonnes)
Top 5 = 66% Jan-Jul
Country 2004 2005 2006 2007 2008 % Mkt. 5 yrs % pa 2008 2009 % change
China 93 116 115 134 128 38% 12.2% 73 78 7.6%
Japan 33 33 39 34 32 10% 2.3% 20 12 -37.8%
US 54 42 47 33 26 8% -10.2% 17 18 4.7%
Germany 20 19 21 23 21 6% -0.2% 12 8 -34.4%
South Korea 16 18 17 16 16 5% -1.1% 10 8 -23.8%
Taiwan 13 14 18 13 12 4% 2.0% 8 5 -35.9%
India 6 8 8 9 9 3% 5.9% 5 4 -15.7%
France 9 7 8 7 6 2% -7.7% 4 3 -23.7%
Others 90 88 91 88 87 26% -1.2% 53 42 -21.7%
Global total 334 345 363 356 337 100% 2.2% 202 178 -11.8%
Change % 10.7% 3.3% 5.2% -1.8% -5.5% Change -24
Source: Monthly Bulletin of the World Bureau of Metal Statistics – September 2009

The Royal Bank of Scotland
Qu
arte
rly
Co
mm
od
ity
Co
mp
anio
n |
1 O
cto
ber
200
9
148
Bulks – five-year global historical view of top producers and consumers
Top 10 iron ore producers and consumers ranked by 2007 market share
Global iron ore production by region (million wet tonnes) Global iron ore apparent consumption by region (million wet tonnes)
Top 5 = 88% 5 yrs Top 5 = 77% 5 yrs
Country 2003 2004 2005 2006 2007 % Mkt. % pa Country 2003 2004 2005 2006 2007 % Mkt. % pa
China 261 310 426 588 707 35% 25.0% China 420 518 701 914 1,091 54% 25.2%
Brazil 246 271 292 319 355 18% 9.5% CIS 141 146 145 151 151 7% 2.9%
Australia 212 235 258 275 299 15% 9.8% Japan 132 135 132 134 139 7% 1.5%
India 99 121 143 181 207 10% 19.1% India 43 59 63 92 114 6% 29.0%
CIS 172 184 184 198 202 10% 5.0% Brazil 61 70 69 72 66 3% 3.6%
US 49 55 54 53 52 3% 0.2% US 54 58 56 56 52 3% -1.9%
S Africa 38 39 40 41 42 2% 2.7% Germany 39 47 42 45 47 2% 0.8%
Canada 33 29 30 34 32 2% 1.3% S Korea 43 45 44 44 47 2% 1.3%
Sweden 22 22 23 23 25 1% 4.0% Australia 17 16 20 29 34 2% 17.9%
Venezuela 19 20 21 22 23 1% 1.5% France 19 21 20 20 19 1% 0.4%
Others 64 78 79 85 75 4% 4.2% Others 244 249 258 262 259 13% 2.5%
Global total
1,214 1,363 1,550 1,820 2,019 100% 12.7% Global total
1,214 1,363 1,550 1,820 2,018 100% 12.7%
Chg % 9.4% 12.3% 13.8% 17.4% 10.9% Chg % 9.4% 12.3% 13.8% 17.4% 10.9%
Chg (mt) 104 149 188 269 199 Chg (mt) 104 149 188 269 199
Source: AME Mineral Economics – August 2008
Top 10 coal producers and consumers ranked by 2008 market share
Global coal* production by region (million tonnes oil equivalent**) Global coal* consumption by region (million tonnes oil equivalent**)
Top 5 = 78% 5 yrs Top 5 = 7% 5 yrs
Country 2004 2005 2006 2007 2008 % Mkt. % pa Country 2004 2005 2006 2007 2008 % Mkt. % pa
China 1,012 1,120 1,205 1,282 1,415 43% 10.3% China 983 1,101 1,215 1,314 1,406 43% 10.5%
US 572 580 595 587 597 18% 1.5% US 566 574 566 573 565 17% 0.1%
Australia 198 207 211 219 220 7% 3.0% India 172 184 195 213 231 7% 8.1%
India 156 162 170 181 194 6% 6.2% Japan 121 121 119 125 129 4% 2.8%
Russia 132 139 145 148 153 5% 3.8% RSA 95 92 94 98 103 3% 2.9%
RSA 137 138 138 140 141 4% 1.0% Russia 100 94 97 94 101 3% -0.5%
Indonesia 81 94 119 134 141 4% 17.3% Germany 85 82 84 86 81 2% -1.4%
Poland 70 69 67 62 61 2% 6.9% S. Korea 53 55 55 60 66 2% 5.3%
Kazakh-stan
44 44 49 50 59 2% -3.8% Poland 57 56 58 57 59 2% 0.5%
Germany 55 53 50 52 48 1% -2.5% Australia 53 55 57 56 51 2% 0.5%
Others 274 279 287 295 297 9% 1.8% Others 481 494 502 519 511 15% 1.5%
Global total
2,732 2,884 3,036 3,150 3,325 100% 5.7% Global total
2,766 2,907 3,042 3,195 3,304 100% 4.9%
Chg % 8.4% 5.6% 5.3% 3.7% 5.6% Chg % 6.5% 5.1% 4.6% 5.0% 3.4%
Chg (MTOE**)
212 152 152 113 175 Chg (MTOE**)
169 141 135 153 109
*Commercial solid fuels only – ie bituminous coal and anthracite (hard coal), and lignite and brown (sub-bituminous) coal. **1m tonnes of oil or equivalent produces approximately 4,400 gigawatt-hours of electricity in a modern power station.
Source: BP Statistical Review of World Energy – June 2008

The Royal Bank of Scotland
Qu
arte
rly
Co
mm
od
ity
Co
mp
anio
n |
1 O
cto
ber
200
9
149
Precious metals – five-year historical view of top producers and consumers
Top 10 gold producers and consumers ranked by 2008 market share
Global gold mine (tonnes) Global gold fabrication demand (tonnes)
Top 5 = 48% 5 yrs Top 5 = 53% 5 yrs
Country 2004 2005 2006 2007 2008 % Mkt. % pa Country 2004 2005 2006 2007 2008 % Mkt. % pa
China 217 230 247 281 292 12% 6.7% India 618 695 633 684 578 20% 1.4%
US 260 262 252 238 235 10% -3.6% China 236 258 270 327 342 12% 10.2%
S. Africa 363 315 296 270 233 10% -10.1% Turkey 285 303 242 277 237 8% -1.9%
Australia 258 263 247 246 215 9% -5.3% Italy 315 284 227 218 180 6% -11.6%
Russia 182 175 173 169 189 8% 0.7% US 224 219 211 180 176 6% -4.8%
Peru 173 208 202 170 180 7% 0.9% Japan 159 164 175 178 164 6% 1.6%
Canada 129 120 104 102 96 4% -7.3% Saudi Arabia 118 125 90 100 87 3% -4.6%
Indonesia 114 165 116 147 95 4% -10.4% South Korea 82 83 82 86 78 3% -1.7%
Ghana 58 63 70 77 80 3% 3.1% Russia 55 61 65 79 76 3% 8.7%
Uzbeki-stan 84 76 74 75 77 3% -0.8% Indonesia 91 87 65 63 61 2% -6.5%
Others 657 674 704 703 724 30% 2.5% Others 988 1,013 875 884 871 31% -1.6%
Global 2,494 2,550 2,485 2,478 2,416 100% -1.6% Global 3,172 3,291 2,936 3,076 2,850 100% -1.0%
Chg % -4.8% 2.2% -2.5% -0.3% -2.5% Chg % 5.8% 3.8% -10.8% 4.8% -7.3%
US$/oz 410 445 604 697 872 US$/oz 410 445 604 697 872
Source: GFMS, Gold Survey 2009
Top 10 silver producers and consumers ranked by 2008 market share
Global silver mine (tonnes) Global silver fabrication demand (tonnes)
Top 5 = 61% 5 yrs Top 5 = 63% 5 yrs
Country 2004 2005 2006 2007 2008 % Mkt. % pa Country 2004 2005 2006 2007 2008 % Mkt. % pa
Peru 3,060 3,191 3,456 3,502 3,680 17% 4.7% US 5,608 5,891 5,778 5,604 5,807 22% 1.3%
Mexico 2,569 2,896 2,970 3,135 3,241 15% 4.8% Japan 3,826 3,860 4,097 4,155 4,151 16% 2.8%
China 1,967 2,084 2,342 2,451 2,575 12% 7.1% India 2,163 2,850 2,575 2,770 2,868 11% -2.8%
Chile 1,360 1,378 1,602 1,928 1,397 7% 1.3% China 1,835 1,917 2,166 2,358 2,351 9% 7.5%
Australia 2,222 2,407 1,729 1,879 1,925 9% 0.6% Germany 1,257 1,260 1,275 1,249 1,264 5% 0.8%
Poland 1,362 1,260 1,260 1,232 1,210 6% -2.5% Italy 1,722 1,577 1,442 1,358 1,198 5% -7.1%
Russia 1,233 1,011 974 911 1,123 5% 1.0% CIS 879 926 963 1,048 1,082 4% 5.4%
US 1,250 1,219 1,141 1,260 1,120 5% -2.0% Thailand 1,151 1,150 1,150 1,140 1,041 4% -1.8%
Canada 1,295 1,064 970 830 669 3% -12.1% Belgium 858 814 894 850 792 3% -2.7%
Kazakh-stan
703 812 796 706 628 3% -4.8% UK/ Ireland
1,604 1,330 1,013 780 729 3% -11.6%
Others 2,298 2,494 2,706 2,824 3,611 17% 8.3% Others 4,927 4,773 4,592 4,824 4,613 18% -1.5%
Global total
19,319 19,816 19,947 20,659 21,178 100% 2.5% Global total
25,830 26,348 25,945 26,136 25,896 100% -0.2%
Chg % 3.4% 2.6% 0.7% 3.6% 2.5% Chg % -1.3% 2.0% -1.5% 0.7% -0.9%
US$/oz 6.66 7.31 11.55 13.38 14.99 US$/oz 6.66 7.31 11.55 13.38 14.99
Source: Silver Institute (GFMS) World Silver Survey 2009
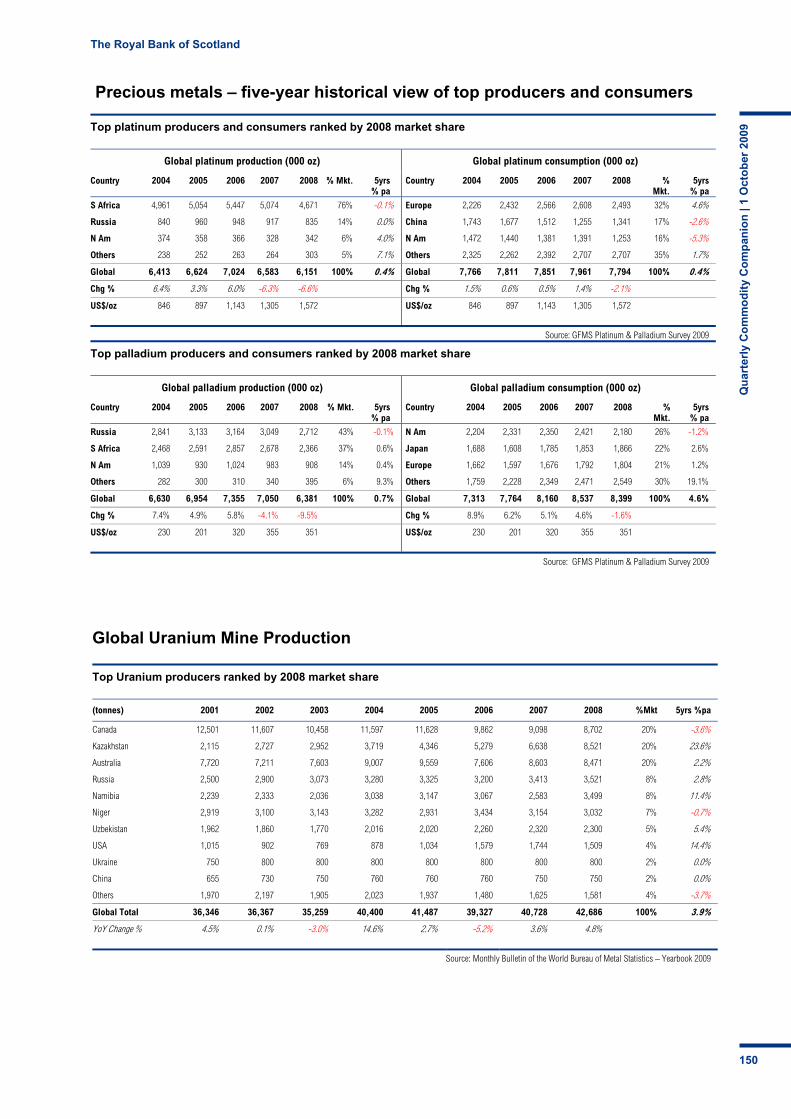
The Royal Bank of Scotland
Qu
arte
rly
Co
mm
od
ity
Co
mp
anio
n |
1 O
cto
ber
200
9
150
Global Uranium Mine Production
Top Uranium producers ranked by 2008 market share
(tonnes) 2001 2002 2003 2004 2005 2006 2007 2008 %Mkt 5yrs %pa
Canada 12,501 11,607 10,458 11,597 11,628 9,862 9,098 8,702 20% -3.6%
Kazakhstan 2,115 2,727 2,952 3,719 4,346 5,279 6,638 8,521 20% 23.6%
Australia 7,720 7,211 7,603 9,007 9,559 7,606 8,603 8,471 20% 2.2%
Russia 2,500 2,900 3,073 3,280 3,325 3,200 3,413 3,521 8% 2.8%
Namibia 2,239 2,333 2,036 3,038 3,147 3,067 2,583 3,499 8% 11.4%
Niger 2,919 3,100 3,143 3,282 2,931 3,434 3,154 3,032 7% -0.7%
Uzbekistan 1,962 1,860 1,770 2,016 2,020 2,260 2,320 2,300 5% 5.4%
USA 1,015 902 769 878 1,034 1,579 1,744 1,509 4% 14.4%
Ukraine 750 800 800 800 800 800 800 800 2% 0.0%
China 655 730 750 760 760 760 750 750 2% 0.0%
Others 1,970 2,197 1,905 2,023 1,937 1,480 1,625 1,581 4% -3.7%
Global Total 36,346 36,367 35,259 40,400 41,487 39,327 40,728 42,686 100% 3.9%
YoY Change % 4.5% 0.1% -3.0% 14.6% 2.7% -5.2% 3.6% 4.8%
Source: Monthly Bulletin of the World Bureau of Metal Statistics – Yearbook 2009
Precious metals – five-year historical view of top producers and consumers
Top platinum producers and consumers ranked by 2008 market share
Global platinum production (000 oz) Global platinum consumption (000 oz)
Country 2004 2005 2006 2007 2008 % Mkt. 5yrs % pa
Country 2004 2005 2006 2007 2008 % Mkt.
5yrs % pa
S Africa 4,961 5,054 5,447 5,074 4,671 76% -0.1% Europe 2,226 2,432 2,566 2,608 2,493 32% 4.6%
Russia 840 960 948 917 835 14% 0.0% China 1,743 1,677 1,512 1,255 1,341 17% -2.6%
N Am 374 358 366 328 342 6% 4.0% N Am 1,472 1,440 1,381 1,391 1,253 16% -5.3%
Others 238 252 263 264 303 5% 7.1% Others 2,325 2,262 2,392 2,707 2,707 35% 1.7%
Global 6,413 6,624 7,024 6,583 6,151 100% 0.4% Global 7,766 7,811 7,851 7,961 7,794 100% 0.4%
Chg % 6.4% 3.3% 6.0% -6.3% -6.6% Chg % 1.5% 0.6% 0.5% 1.4% -2.1%
US$/oz 846 897 1,143 1,305 1,572 US$/oz 846 897 1,143 1,305 1,572
Source: GFMS Platinum & Palladium Survey 2009
Top palladium producers and consumers ranked by 2008 market share
Global palladium production (000 oz) Global palladium consumption (000 oz)
Country 2004 2005 2006 2007 2008 % Mkt. 5yrs % pa
Country 2004 2005 2006 2007 2008 %Mkt.
5yrs % pa
Russia 2,841 3,133 3,164 3,049 2,712 43% -0.1% N Am 2,204 2,331 2,350 2,421 2,180 26% -1.2%
S Africa 2,468 2,591 2,857 2,678 2,366 37% 0.6% Japan 1,688 1,608 1,785 1,853 1,866 22% 2.6%
N Am 1,039 930 1,024 983 908 14% 0.4% Europe 1,662 1,597 1,676 1,792 1,804 21% 1.2%
Others 282 300 310 340 395 6% 9.3% Others 1,759 2,228 2,349 2,471 2,549 30% 19.1%
Global 6,630 6,954 7,355 7,050 6,381 100% 0.7% Global 7,313 7,764 8,160 8,537 8,399 100% 4.6%
Chg % 7.4% 4.9% 5.8% -4.1% -9.5% Chg % 8.9% 6.2% 5.1% 4.6% -1.6%
US$/oz 230 201 320 355 351 US$/oz 230 201 320 355 351
Source: GFMS Platinum & Palladium Survey 2009

The Royal Bank of Scotland
Qu
arte
rly
Co
mm
od
ity
Co
mp
anio
n |
1 O
cto
ber
200
9
151
Source: CRU
Top five aluminium-producing companies ranked by 2008 global market share
UC RusAl11%
Rio Tinto Alcan10%
Alcoa10%
Chalco7%
Hydro4%
Other 58%
Top 10 aluminium production companies ranked by 2008 global market share
Rank Company 000t Market Share Cumulative share
1 UC RusAl 4,478 11% 11%
2 Rio Tinto Alcan 4,056 10% 21%
3 Alcoa 3,994 10% 31%
4 Chalco 2,643 7% 38%
5 Hydro 1,684 4% 42%
6 BHP Billiton 1,242 3% 45%
7 Dubal 899 2% 47%
8 Aluminium Bahrain 866 2% 49%
9 Century 800 2% 51%
10 China Power 747 2% 53%
Other 18,741 47% 100%
World smelter production
40,150 100%
Source: CRU
Source: CRU
Top five copper mine production companies ranked by 2008 global market share
Codelco10%
Freeport10%
BHP Billiton9%
Xstrata6%
Rio Tinto4%
Other61%
Top 10 copper mine production companies ranked by 2008 global market share
Rank Company 000t Market Share Cumulative share
1 Codelco 1,570 10% 10%
2 Freeport 1,549 10% 20%
3 BHP Billiton 1,360 9% 29%
4 Xstrata 915 6% 35%
5 Rio Tinto 689 4% 39%
6 Anglo American 664 4% 43%
7 SCC 457 3% 46%
8 Norilsk 437 3% 49%
9 KGHM 429 3% 52%
10 Kazakhmys 364 2% 54%
Other 7,114 46% 100%
World mine production
15,548 100%
Source: CRU
Source: CRU
Top five nickel mine production companies ranked by 2008 global market share
Norilsk20%
Vale18%
Antam15%
BHP Billiton12%
Other30%
Xstrata5%
Top 10 nickel mine production companies ranked by 2008 global market share
Rank Company 000t Market Share Cumulative share
1 Norilsk 294 20% 20%
2 Vale 254 18% 38%
3 Antam 211 15% 52%
4 BHP Billiton 177 12% 64%
5 Xstrata 75 5% 70%
6 Cubaniquel 59 4% 74%
7 JNMC 59 4% 78%
8 Eramet 53 4% 81%
9 SMSP 34 2% 84%
10 Minara 32 2% 86%
Other 204 14% 100%
World mine production
1,452 100%
Source: CRU
Top 10 metal-producing companies
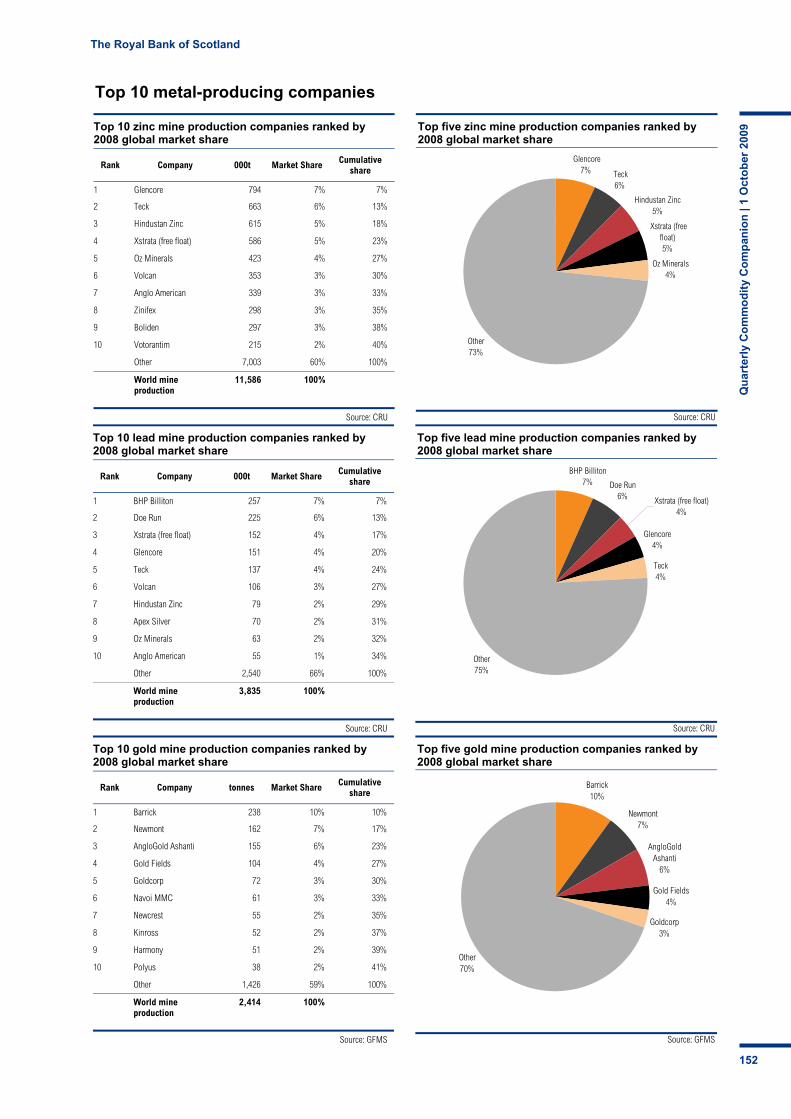
The Royal Bank of Scotland
Qu
arte
rly
Co
mm
od
ity
Co
mp
anio
n |
1 O
cto
ber
200
9
152
Source: CRU
Top five zinc mine production companies ranked by 2008 global market share
Glencore7% Teck
6%
Hindustan Zinc5%
Xstrata (free float)5%
Oz Minerals4%
Other73%
Top 10 zinc mine production companies ranked by 2008 global market share
Rank Company 000t Market Share Cumulative share
1 Glencore 794 7% 7%
2 Teck 663 6% 13%
3 Hindustan Zinc 615 5% 18%
4 Xstrata (free float) 586 5% 23%
5 Oz Minerals 423 4% 27%
6 Volcan 353 3% 30%
7 Anglo American 339 3% 33%
8 Zinifex 298 3% 35%
9 Boliden 297 3% 38%
10 Votorantim 215 2% 40%
Other 7,003 60% 100%
World mine production
11,586 100%
Source: CRU
Source: CRU
Top five lead mine production companies ranked by 2008 global market share
BHP Billiton7% Doe Run
6%
Glencore4%
Other75%
Teck4%
Xstrata (free float)4%
Top 10 lead mine production companies ranked by 2008 global market share
Rank Company 000t Market Share Cumulative share
1 BHP Billiton 257 7% 7%
2 Doe Run 225 6% 13%
3 Xstrata (free float) 152 4% 17%
4 Glencore 151 4% 20%
5 Teck 137 4% 24%
6 Volcan 106 3% 27%
7 Hindustan Zinc 79 2% 29%
8 Apex Silver 70 2% 31%
9 Oz Minerals 63 2% 32%
10 Anglo American 55 1% 34%
Other 2,540 66% 100%
World mine production
3,835 100%
Source: CRU
Source: GFMS
Top five gold mine production companies ranked by 2008 global market share
Barrick10%
Newmont7%
AngloGold Ashanti
6%
Gold Fields4%
Other70%
Goldcorp3%
Top 10 gold mine production companies ranked by 2008 global market share
Rank Company tonnes Market Share Cumulative share
1 Barrick 238 10% 10%
2 Newmont 162 7% 17%
3 AngloGold Ashanti 155 6% 23%
4 Gold Fields 104 4% 27%
5 Goldcorp 72 3% 30%
6 Navoi MMC 61 3% 33%
7 Newcrest 55 2% 35%
8 Kinross 52 2% 37%
9 Harmony 51 2% 39%
10 Polyus 38 2% 41%
Other 1,426 59% 100%
World mine production
2,414 100%
Source: GFMS
Top 10 metal-producing companies

The Royal Bank of Scotland
Qu
arte
rly
Co
mm
od
ity
Co
mp
anio
n |
1 O
cto
ber
200
9
153
Source: GFMS
Top five silver mine production companies ranked by 2008 global market share
BHP Billiton6% KGHM
6%
Fresnillo5%
Volcan3%
Other77%
Pan American Silver3%
Top 10 silver mine production companies ranked by 2008 global market share
Rank Company tonnes Market Share Cumulative share
1 BHP Billiton 1,360 6% 6%
2 KGHM 1,235 6% 12%
3 Fresnillo 1,119 5% 18%
4 Volcan 739 3% 21%
5 Pan American Silver 601 3% 24%
6 Buenaventura 563 3% 27%
7 Polymetal 553 3% 29%
8 Hochschild 543 3% 32%
9 Kazakhmys 502 2% 34%
10 Southern Copper 395 2% 36%
Other 13,569 64% 100%
World mine production
21,179 100%
Source: GFMS
Source: GFMS
Top five platinum mine production companies ranked by 2008 global market share
Implats20%
Lonmin12%
Norilsk11%
Other22%
Anglo Platinum32%
Aquarius5%
Top 10 platinum mine production companies ranked by 2008 global market share
Rank Company 000 oz Market Share Cumulative share
1 Anglo Platinum 1,947 32% 32%
2 Implats 1,214 20% 51%
3 Lonmin 708 12% 63%
4 Norilsk 659 11% 74%
5 Aquarius 283 5% 78%
6 Northam 175 3% 81%
7 Vale Inco 166 3% 84%
8 Xstrata 164 3% 86%
9 Artel Amur 122 2% 88%
10 Stillwater 115 2% 90%
Other 598 10% 100%
World mine production
6,151 100%
Source: GFMS
Source: GFMS
Top five palladium mine production companies ranked by 2008 global market share
Norilsk44%
Anglo Platinum17%
Implats9%
Stillwater6%
Other19%
Lonmin5%
Top 10 palladium mine production companies ranked by 2008 global market share
Rank Company 000 oz Market Share Cumulative share
1 Norilsk 2,821 44% 44%
2 Anglo Platinum 1,071 17% 61%
3 Implats 560 9% 70%
4 Stillwater 384 6% 76%
5 Lonmin 331 5% 81%
6 Vale Inco 231 4% 85%
7 N. American Palladium 212 3% 88%
8 Aquarius 148 2% 90%
9 Xstrata 123 2% 92%
10 ARM Platinum 101 2% 94%
Other 399 6% 100%
World mine production 6,381 100%
Source: GFMS
Top 10 metal-producing companies
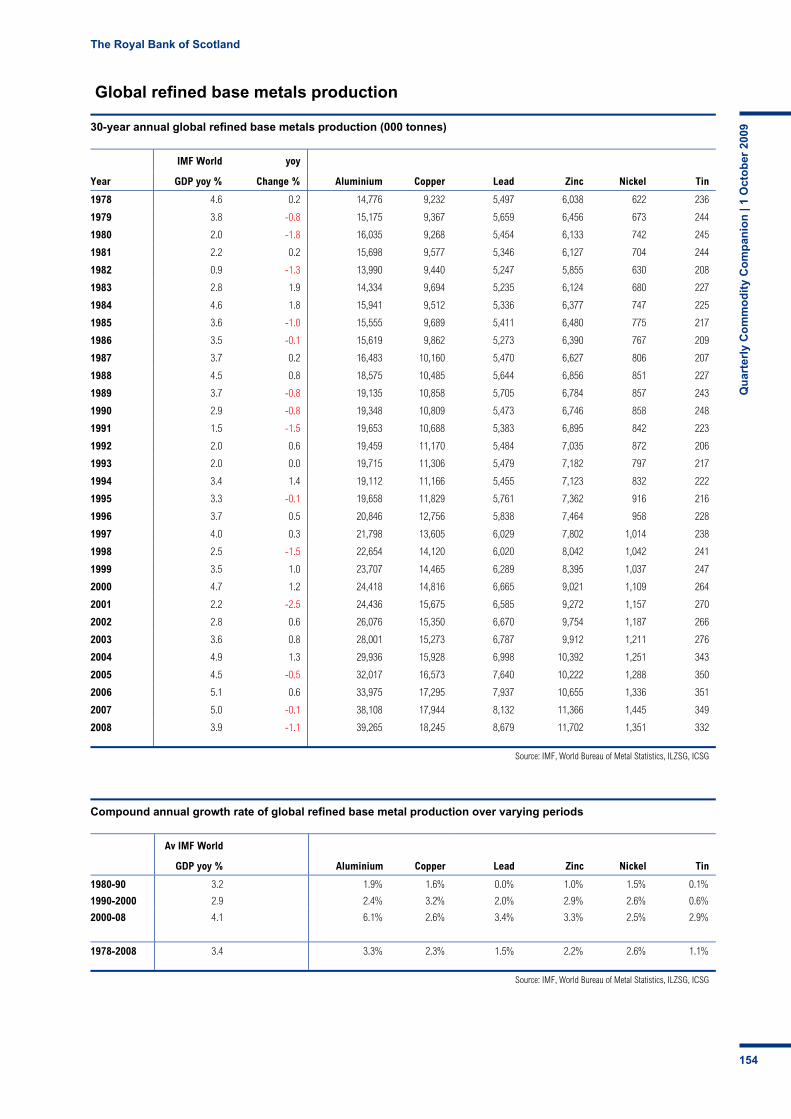
The Royal Bank of Scotland
Qu
arte
rly
Co
mm
od
ity
Co
mp
anio
n |
1 O
cto
ber
200
9
154
Global refined base metals production
30-year annual global refined base metals production (000 tonnes)
IMF World yoy
Year GDP yoy % Change % Aluminium Copper Lead Zinc Nickel Tin
1978 4.6 0.2 14,776 9,232 5,497 6,038 622 236
1979 3.8 -0.8 15,175 9,367 5,659 6,456 673 244
1980 2.0 -1.8 16,035 9,268 5,454 6,133 742 245
1981 2.2 0.2 15,698 9,577 5,346 6,127 704 244
1982 0.9 -1.3 13,990 9,440 5,247 5,855 630 208
1983 2.8 1.9 14,334 9,694 5,235 6,124 680 227
1984 4.6 1.8 15,941 9,512 5,336 6,377 747 225
1985 3.6 -1.0 15,555 9,689 5,411 6,480 775 217
1986 3.5 -0.1 15,619 9,862 5,273 6,390 767 209
1987 3.7 0.2 16,483 10,160 5,470 6,627 806 207
1988 4.5 0.8 18,575 10,485 5,644 6,856 851 227
1989 3.7 -0.8 19,135 10,858 5,705 6,784 857 243
1990 2.9 -0.8 19,348 10,809 5,473 6,746 858 248
1991 1.5 -1.5 19,653 10,688 5,383 6,895 842 223
1992 2.0 0.6 19,459 11,170 5,484 7,035 872 206
1993 2.0 0.0 19,715 11,306 5,479 7,182 797 217
1994 3.4 1.4 19,112 11,166 5,455 7,123 832 222
1995 3.3 -0.1 19,658 11,829 5,761 7,362 916 216
1996 3.7 0.5 20,846 12,756 5,838 7,464 958 228
1997 4.0 0.3 21,798 13,605 6,029 7,802 1,014 238
1998 2.5 -1.5 22,654 14,120 6,020 8,042 1,042 241
1999 3.5 1.0 23,707 14,465 6,289 8,395 1,037 247
2000 4.7 1.2 24,418 14,816 6,665 9,021 1,109 264
2001 2.2 -2.5 24,436 15,675 6,585 9,272 1,157 270
2002 2.8 0.6 26,076 15,350 6,670 9,754 1,187 266
2003 3.6 0.8 28,001 15,273 6,787 9,912 1,211 276
2004 4.9 1.3 29,936 15,928 6,998 10,392 1,251 343
2005 4.5 -0.5 32,017 16,573 7,640 10,222 1,288 350
2006 5.1 0.6 33,975 17,295 7,937 10,655 1,336 351
2007 5.0 -0.1 38,108 17,944 8,132 11,366 1,445 349
2008 3.9 -1.1 39,265 18,245 8,679 11,702 1,351 332
Source: IMF, World Bureau of Metal Statistics, ILZSG, ICSG
Compound annual growth rate of global refined base metal production over varying periods
Av IMF World
GDP yoy % Aluminium Copper Lead Zinc Nickel Tin
1980-90 3.2 1.9% 1.6% 0.0% 1.0% 1.5% 0.1%
1990-2000 2.9 2.4% 3.2% 2.0% 2.9% 2.6% 0.6%
2000-08 4.1 6.1% 2.6% 3.4% 3.3% 2.5% 2.9%
1978-2008 3.4 3.3% 2.3% 1.5% 2.2% 2.6% 1.1%
Source: IMF, World Bureau of Metal Statistics, ILZSG, ICSG

The Royal Bank of Scotland
Qu
arte
rly
Co
mm
od
ity
Co
mp
anio
n |
1 O
cto
ber
200
9
155
Annual changes in global refined base metals production
30-year annual percentage changes in global refined base metal production
IMF World yoy
Year GDP yoy % Change % Aluminium Copper Lead Zinc Nickel Tin
1979 3.8 -0.8 2.7% 1.5% 2.9% 6.9% 8.2% 3.5%
1980 2.0 -1.8 5.7% -1.1% -3.6% -5.0% 10.3% 0.3%
1981 2.2 0.2 -2.1% 3.3% -2.0% -0.1% -5.1% -0.4%
1982 0.9 -1.3 -10.9% -1.4% -1.9% -4.4% -10.5% -14.8%
1983 2.8 1.9 2.5% 2.7% -0.2% 4.6% 7.9% 8.9%
1984 4.6 1.8 11.2% -1.9% 1.9% 4.1% 9.9% -0.6%
1985 3.6 -1.0 -2.4% 1.9% 1.4% 1.6% 3.7% -3.5%
1986 3.5 -0.1 0.4% 1.8% -2.6% -1.4% -1.0% -3.8%
1987 3.7 0.2 5.5% 3.0% 3.7% 3.7% 5.0% -1.1%
1988 4.5 0.8 12.7% 3.2% 3.2% 3.5% 5.6% 9.9%
1989 3.7 -0.8 3.0% 3.6% 1.1% -2.1% 0.7% 6.7%
1990 2.9 -0.8 1.1% -0.5% -4.1% -1.4% 0.1% 2.1%
1991 1.5 -1.5 1.6% -1.1% -1.6% 0.3% -1.8% -10.1%
1992 2.0 0.6 -1.0% 4.5% 1.9% -0.7% 3.6% -7.3%
1993 2.0 0.0 1.3% 1.2% -0.1% 0.2% -8.6% 4.9%
1994 3.4 1.4 -3.1% -1.2% -0.4% 5.3% 4.4% 2.3%
1995 3.3 -0.1 2.9% 5.9% 5.6% 8.0% 10.2% -2.4%
1996 3.7 0.5 6.0% 7.8% 1.3% 0.4% 4.6% 5.3%
1997 4.0 0.3 4.6% 6.7% 3.3% 3.6% 5.8% 4.6%
1998 2.5 -1.5 3.9% 3.8% -0.1% 2.6% 2.7% 1.3%
1999 3.5 1.0 4.6% 2.4% 4.5% 6.8% -0.4% 2.2%
2000 4.7 1.2 3.0% 2.4% 6.0% 7.5% 6.9% 6.9%
2001 2.2 -2.5 0.1% 5.8% -1.2% 2.8% 4.3% 2.5%
2002 2.8 0.6 6.7% -2.1% 1.3% 5.0% 2.5% -1.4%
2003 3.6 0.8 7.4% -0.5% 1.8% 1.6% 2.1% 3.8%
2004 4.9 1.3 6.9% 4.3% 3.1% 4.8% 3.3% 24.1%
2005 4.5 -0.5 7.0% 4.0% 9.2% -1.6% 2.9% 2.0%
2006 5.1 0.6 6.1% 4.4% 3.9% 4.2% 3.7% 0.3%
2007 5.0 -0.1 12.2% 3.8% 2.5% 6.7% 8.2% -0.6%
2008 4.1 -0.9 3.0% 1.7% 6.7% 3.0% -6.5% -4.9%
Source: IMF, World Bureau of Metal Statistics, ILZSG, ICSG
Percentage changes in average annual global refined base metals production over varying periods
Av IMF World
GDP yoy % Aluminium Copper Lead Zinc Nickel Tin
1980-90 3.2 20.7% 16.6% 0.3% 10.0% 15.5% 1.2%
1990-2000 2.9 26.2% 37.1% 21.8% 33.7% 29.4% 6.4%
2000-08 4.1 60.8% 23.1% 30.2% 29.7% 21.8% 25.9%
1978-2007 3.4 165.7% 97.6% 57.9% 93.8% 117.3% 40.7%
Source: IMF, World Bureau of Metal Statistics ILZSG, ICSG

The Royal Bank of Scotland
Qu
arte
rly
Co
mm
od
ity
Co
mp
anio
n |
1 O
cto
ber
200
9
156
Global refined base metals consumption
30-year annual global refined base metals consumption (000 tonnes)
IMF World yoy
Year GDP yoy % Change % Aluminium Copper Lead Zinc Nickel Tin
1978 4.6 0.2 15,329 9,530 5,583 6,328 697 232
1979 3.8 -0.8 15,981 9,830 5,646 6,437 750 237
1980 2.0 -1.8 15,298 9,375 5,429 6,242 717 224
1981 2.2 0.2 14,516 9,525 5,345 6,116 662 213
1982 0.9 -1.3 14,161 9,019 5,179 5,902 650 199
1983 2.8 1.9 15,361 9,099 5,189 6,181 689 208
1984 4.6 1.8 15,574 9,914 5,312 6,350 780 221
1985 3.6 -1.0 15,862 9,665 5,315 6,347 788 215
1986 3.5 -0.1 16,071 10,070 5,380 6,547 776 223
1987 3.7 0.2 17,053 10,449 5,464 6,722 838 229
1988 4.5 0.8 18,867 10,531 5,527 6,848 857 233
1989 3.7 -0.8 19,244 10,969 5,562 6,715 848 232
1990 2.9 -0.8 19,226 10,780 5,403 6,620 842 239
1991 1.5 -1.5 18,743 10,695 5,328 6,642 799 209
1992 2.0 0.6 18,558 10,801 5,290 6,597 799 224
1993 2.0 0.0 18,166 10,972 5,203 6,609 824 239
1994 3.4 1.4 19,762 11,639 5,489 6,960 910 241
1995 3.3 -0.1 20,555 12,150 5,802 7,519 998 240
1996 3.7 0.5 20,684 12,399 5,975 7,551 904 239
1997 4.0 0.3 21,870 13,017 6,053 7,822 990 245
1998 2.5 -1.5 21,889 13,353 6,065 8,033 992 243
1999 3.5 1.0 23,356 14,057 6,242 8,575 1,057 250
2000 4.7 1.2 25,059 15,192 6,515 9,007 1,172 278
2001 2.2 -2.5 23,722 14,686 6,480 8,928 1,138 282
2002 2.8 0.6 25,372 15,051 6,635 9,385 1,186 276
2003 3.6 0.8 27,606 15,716 6,844 9,839 1,249 302
2004 4.9 1.3 29,965 16,840 7,296 10,647 1,251 334
2005 4.5 -0.5 31,689 16,673 7,803 10,611 1,296 345
2006 5.1 0.6 33,954 17,042 8,075 10,972 1,366 363
2007 5.0 -0.1 37,561 18,175 8,189 11,309 1,353 356
2008 3.9 -1.1 37,020 18,007 8,649 11,481 1,297 337
Source: IMF, World Bureau of Metal Statistics, ILZSG, ICSG
Compound annual growth rate of global refined base metal consumption over varying periods
Av IMF World
GDP yoy % Aluminium Copper Lead Zinc Nickel Tin
1980-90 3.2 2.3% 1.4% 0.0% 0.6% 1.6% 0.6%
1990-2000 3.1 2.7% 3.5% 1.9% 3.1% 3.4% 1.5%
2000-08 4.1 5.0% 2.1% 3.6% 3.1% 1.3% 2.4%
1978-2008 3.4 3.0% 2.1% 1.5% 2.0% 2.1% 1.3%
Source: IMF, World Bureau of Metal Statistics, ILZSG, ICSG
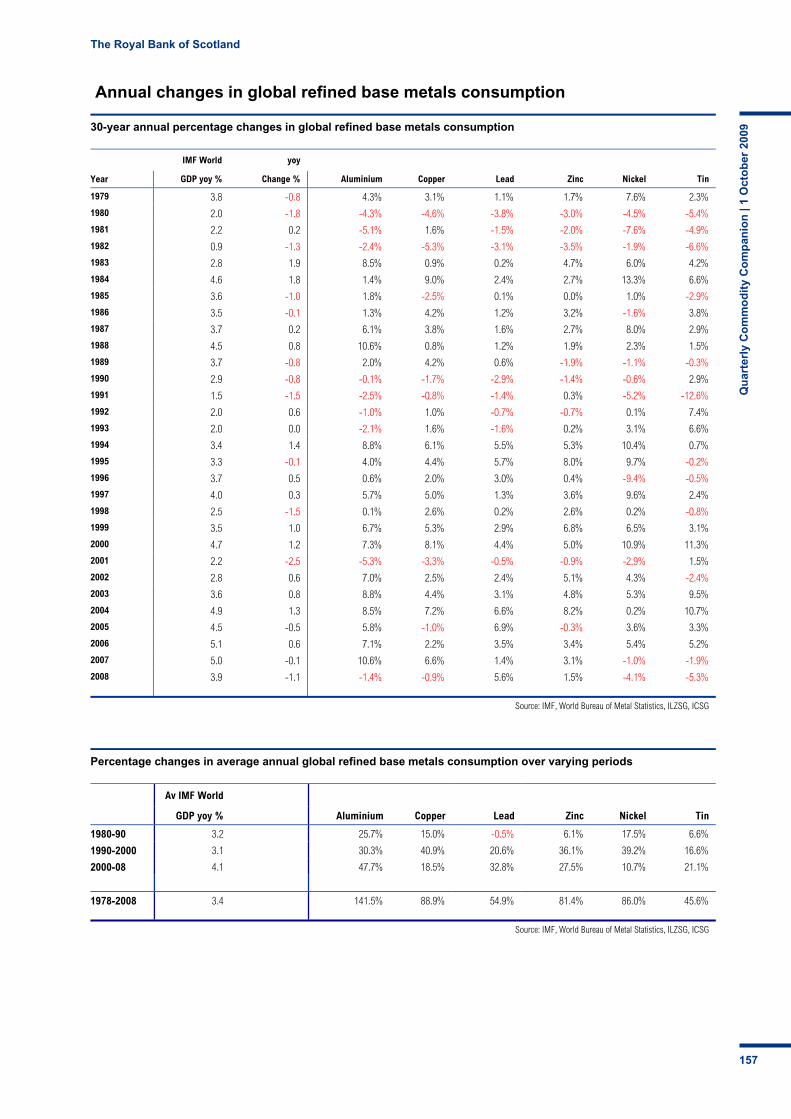
The Royal Bank of Scotland
Qu
arte
rly
Co
mm
od
ity
Co
mp
anio
n |
1 O
cto
ber
200
9
157
Annual changes in global refined base metals consumption
30-year annual percentage changes in global refined base metals consumption
IMF World yoy
Year GDP yoy % Change % Aluminium Copper Lead Zinc Nickel Tin
1979 3.8 -0.8 4.3% 3.1% 1.1% 1.7% 7.6% 2.3%
1980 2.0 -1.8 -4.3% -4.6% -3.8% -3.0% -4.5% -5.4%
1981 2.2 0.2 -5.1% 1.6% -1.5% -2.0% -7.6% -4.9%
1982 0.9 -1.3 -2.4% -5.3% -3.1% -3.5% -1.9% -6.6%
1983 2.8 1.9 8.5% 0.9% 0.2% 4.7% 6.0% 4.2%
1984 4.6 1.8 1.4% 9.0% 2.4% 2.7% 13.3% 6.6%
1985 3.6 -1.0 1.8% -2.5% 0.1% 0.0% 1.0% -2.9%
1986 3.5 -0.1 1.3% 4.2% 1.2% 3.2% -1.6% 3.8%
1987 3.7 0.2 6.1% 3.8% 1.6% 2.7% 8.0% 2.9%
1988 4.5 0.8 10.6% 0.8% 1.2% 1.9% 2.3% 1.5%
1989 3.7 -0.8 2.0% 4.2% 0.6% -1.9% -1.1% -0.3%
1990 2.9 -0.8 -0.1% -1.7% -2.9% -1.4% -0.6% 2.9%
1991 1.5 -1.5 -2.5% -0.8% -1.4% 0.3% -5.2% -12.6%
1992 2.0 0.6 -1.0% 1.0% -0.7% -0.7% 0.1% 7.4%
1993 2.0 0.0 -2.1% 1.6% -1.6% 0.2% 3.1% 6.6%
1994 3.4 1.4 8.8% 6.1% 5.5% 5.3% 10.4% 0.7%
1995 3.3 -0.1 4.0% 4.4% 5.7% 8.0% 9.7% -0.2%
1996 3.7 0.5 0.6% 2.0% 3.0% 0.4% -9.4% -0.5%
1997 4.0 0.3 5.7% 5.0% 1.3% 3.6% 9.6% 2.4%
1998 2.5 -1.5 0.1% 2.6% 0.2% 2.6% 0.2% -0.8%
1999 3.5 1.0 6.7% 5.3% 2.9% 6.8% 6.5% 3.1%
2000 4.7 1.2 7.3% 8.1% 4.4% 5.0% 10.9% 11.3%
2001 2.2 -2.5 -5.3% -3.3% -0.5% -0.9% -2.9% 1.5%
2002 2.8 0.6 7.0% 2.5% 2.4% 5.1% 4.3% -2.4%
2003 3.6 0.8 8.8% 4.4% 3.1% 4.8% 5.3% 9.5%
2004 4.9 1.3 8.5% 7.2% 6.6% 8.2% 0.2% 10.7%
2005 4.5 -0.5 5.8% -1.0% 6.9% -0.3% 3.6% 3.3%
2006 5.1 0.6 7.1% 2.2% 3.5% 3.4% 5.4% 5.2%
2007 5.0 -0.1 10.6% 6.6% 1.4% 3.1% -1.0% -1.9%
2008 3.9 -1.1 -1.4% -0.9% 5.6% 1.5% -4.1% -5.3%
Source: IMF, World Bureau of Metal Statistics, ILZSG, ICSG
Percentage changes in average annual global refined base metals consumption over varying periods
Av IMF World
GDP yoy % Aluminium Copper Lead Zinc Nickel Tin
1980-90 3.2 25.7% 15.0% -0.5% 6.1% 17.5% 6.6%
1990-2000 3.1 30.3% 40.9% 20.6% 36.1% 39.2% 16.6%
2000-08 4.1 47.7% 18.5% 32.8% 27.5% 10.7% 21.1%
1978-2008 3.4 141.5% 88.9% 54.9% 81.4% 86.0% 45.6%
Source: IMF, World Bureau of Metal Statistics, ILZSG, ICSG

The Royal Bank of Scotland
Qu
arte
rly
Co
mm
od
ity
Co
mp
anio
n |
1 O
cto
ber
200
9
158
Summary of global precious metals mine production and consumption
Global precious metals mine production (2000-08)
Precious metals mine production (tonnes) Percentage change in precious metals mine production
Year Gold Silver Platinum Palladium Gold Silver Platinum Palladium
2000 2,618 18,381 156 165 0.63% 6.12% -3.16% 1.79%
2001 2,645 18,856 168 173 1.01% 2.58% 7.18% 4.93%
2002 2,618 18,472 180 185 -1.02% -2.04% 7.40% 7.24%
2003 2,621 18,557 187 192 0.11% 0.46% 4.11% 3.70%
2004 2,494 19,068 199 206 -4.84% 2.75% 6.42% 7.42%
2005 2,550 19,817 206 216 2.25% 3.93% 3.29% 4.89%
2006 2,485 19,947 218 229 -2.55% 0.66% 6.04% 5.77%
2007 2,478 20,659 205 219 -0.28% 3.57% -6.28% -4.15%
2008 2,416 21,178 191 198 -2.50% 2.51% -6.56% -9.49%
Chg, 2000-08 -202 2,797 35 34 -8% 15% 22% 21%
Source: GFMS – Gold Survey 2009, Platinum & Palladium Survey 2009, Silver Institute (GFMS) World Silver Survey 2009
Global precious metals fabrication (2000-08)
Precious metals fabrication (tonnes) Percentage change in precious metals fabrication
Year Gold Silver Platinum Palladium Gold Silver Platinum Palladium
2000 3,761 27,734 197 287 0.79% 3.16% 0.59% -2.91%
2001 3,482 26,721 216 220 -7.43% -3.65% 9.64% -23.47%
2002 3,141 25,733 234 205 -9.79% -3.70% 8.36% -6.85%
2003 2,997 26,169 238 209 -4.59% 1.69% 1.77% 2.07%
2004 3,172 25,830 242 227 5.85% -1.30% 1.52% 8.86%
2005 3,291 26,348 243 241 3.75% 2.01% 0.58% 6.17%
2006 2,936 25,945 244 254 -10.79% -1.53% 0.51% 5.10%
2007 3,076 26,136 248 266 4.77% 0.74% 1.40% 4.62%
2008 2,850 25,896 242 261 -7.35% -0.92% -2.10% -1.62%
Chg, 2000-08 3,761 27,734 197 287 0.79% 3.16% 0.59% -2.91%
Source: Gold Survey 2009, Platinum & Palladium Survey 2009, Silver Institute (GFMS) World Silver Survey 2009
Weights-conversion table
Imperial Factor Metric Metric Factor Imperial
Troy ounces X 31.1034 Grams Grams X 0.0321508 Troy ounces
Pounds – lbs X 0.453592 Kilograms Kilograms X 2.2046 Pounds – lbs
Short tons X 0.90718 Tonnes Tonnes X 1.102317 Short tons
Troy ounces/short tons X 34.286 Grams per tonne Grams per tonne X 0.029167 Troy ounces/short tons
USc/lb X 22.046 US$/tonne US$/tonne / 22.046 USc/lb
Source: RBS
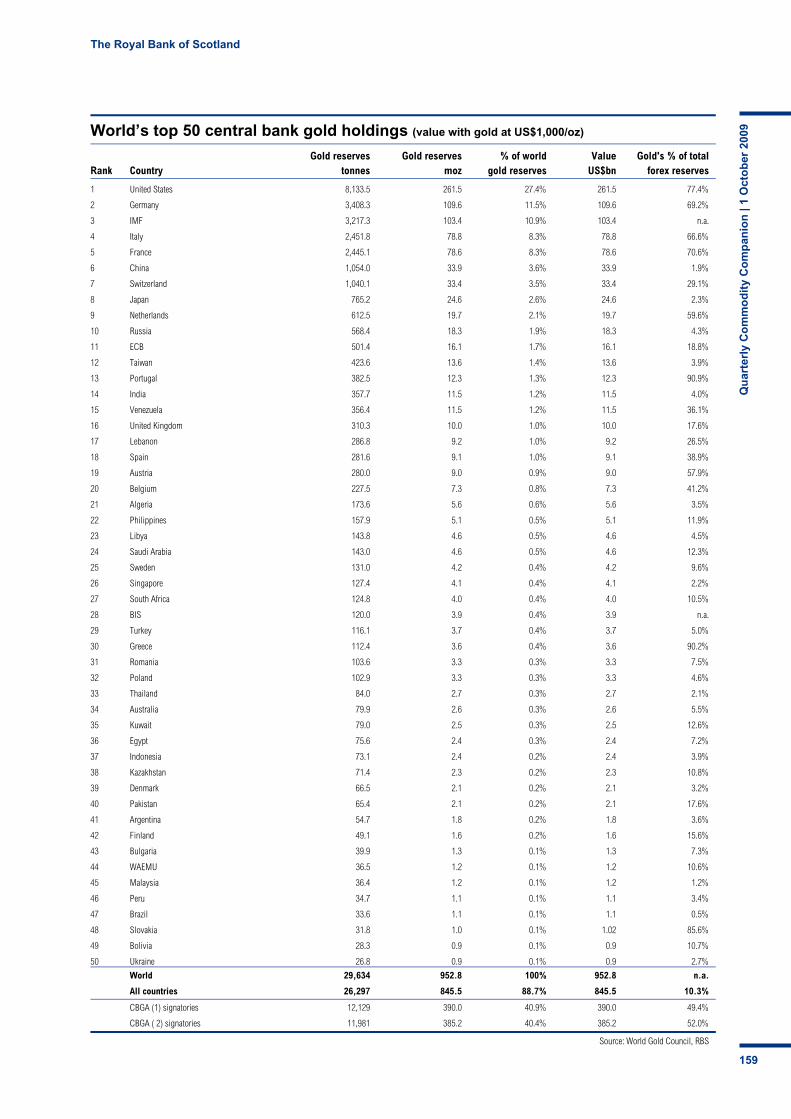
The Royal Bank of Scotland
Qu
arte
rly
Co
mm
od
ity
Co
mp
anio
n |
1 O
cto
ber
200
9
159
World’s top 50 central bank gold holdings (value with gold at US$1,000/oz)
Gold reserves Gold reserves % of world Value Gold's % of totalRank Country tonnes moz gold reserves US$bn forex reserves
1 United States 8,133.5 261.5 27.4% 261.5 77.4%
2 Germany 3,408.3 109.6 11.5% 109.6 69.2%
3 IMF 3,217.3 103.4 10.9% 103.4 n.a.
4 Italy 2,451.8 78.8 8.3% 78.8 66.6%
5 France 2,445.1 78.6 8.3% 78.6 70.6%
6 China 1,054.0 33.9 3.6% 33.9 1.9%
7 Switzerland 1,040.1 33.4 3.5% 33.4 29.1%
8 Japan 765.2 24.6 2.6% 24.6 2.3%
9 Netherlands 612.5 19.7 2.1% 19.7 59.6%
10 Russia 568.4 18.3 1.9% 18.3 4.3%
11 ECB 501.4 16.1 1.7% 16.1 18.8%
12 Taiwan 423.6 13.6 1.4% 13.6 3.9%
13 Portugal 382.5 12.3 1.3% 12.3 90.9%
14 India 357.7 11.5 1.2% 11.5 4.0%
15 Venezuela 356.4 11.5 1.2% 11.5 36.1%
16 United Kingdom 310.3 10.0 1.0% 10.0 17.6%
17 Lebanon 286.8 9.2 1.0% 9.2 26.5%
18 Spain 281.6 9.1 1.0% 9.1 38.9%
19 Austria 280.0 9.0 0.9% 9.0 57.9%
20 Belgium 227.5 7.3 0.8% 7.3 41.2%
21 Algeria 173.6 5.6 0.6% 5.6 3.5%
22 Philippines 157.9 5.1 0.5% 5.1 11.9%
23 Libya 143.8 4.6 0.5% 4.6 4.5%
24 Saudi Arabia 143.0 4.6 0.5% 4.6 12.3%
25 Sweden 131.0 4.2 0.4% 4.2 9.6%
26 Singapore 127.4 4.1 0.4% 4.1 2.2%
27 South Africa 124.8 4.0 0.4% 4.0 10.5%
28 BIS 120.0 3.9 0.4% 3.9 n.a.
29 Turkey 116.1 3.7 0.4% 3.7 5.0%
30 Greece 112.4 3.6 0.4% 3.6 90.2%
31 Romania 103.6 3.3 0.3% 3.3 7.5%
32 Poland 102.9 3.3 0.3% 3.3 4.6%
33 Thailand 84.0 2.7 0.3% 2.7 2.1%
34 Australia 79.9 2.6 0.3% 2.6 5.5%
35 Kuwait 79.0 2.5 0.3% 2.5 12.6%
36 Egypt 75.6 2.4 0.3% 2.4 7.2%
37 Indonesia 73.1 2.4 0.2% 2.4 3.9%
38 Kazakhstan 71.4 2.3 0.2% 2.3 10.8%
39 Denmark 66.5 2.1 0.2% 2.1 3.2%
40 Pakistan 65.4 2.1 0.2% 2.1 17.6%
41 Argentina 54.7 1.8 0.2% 1.8 3.6%
42 Finland 49.1 1.6 0.2% 1.6 15.6%
43 Bulgaria 39.9 1.3 0.1% 1.3 7.3%
44 WAEMU 36.5 1.2 0.1% 1.2 10.6%
45 Malaysia 36.4 1.2 0.1% 1.2 1.2%
46 Peru 34.7 1.1 0.1% 1.1 3.4%
47 Brazil 33.6 1.1 0.1% 1.1 0.5%
48 Slovakia 31.8 1.0 0.1% 1.02 85.6%
49 Bolivia 28.3 0.9 0.1% 0.9 10.7%
50 Ukraine 26.8 0.9 0.1% 0.9 2.7%
World 29,634 952.8 100% 952.8 n.a.
All countries 26,297 845.5 88.7% 845.5 10.3%
CBGA (1) signatories 12,129 390.0 40.9% 390.0 49.4%
CBGA ( 2) signatories 11,981 385.2 40.4% 385.2 52.0%
Source: World Gold Council, RBS
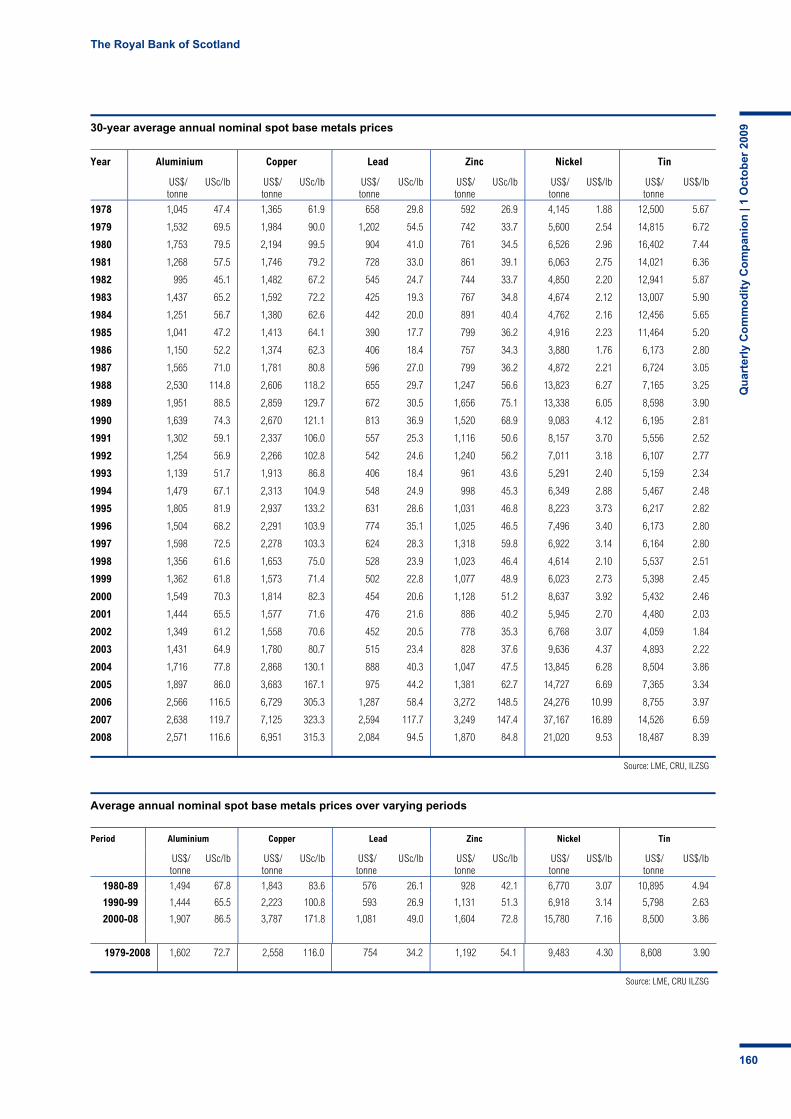
The Royal Bank of Scotland
Qu
arte
rly
Co
mm
od
ity
Co
mp
anio
n |
1 O
cto
ber
200
9
160
30-year average annual nominal spot base metals prices
Year Aluminium Copper Lead Zinc Nickel Tin
US$/ tonne
USc/lb US$/ tonne
USc/lb US$/tonne
USc/lb US$/tonne
USc/lb US$/ tonne
US$/lb US$/tonne
US$/lb
1978 1,045 47.4 1,365 61.9 658 29.8 592 26.9 4,145 1.88 12,500 5.67
1979 1,532 69.5 1,984 90.0 1,202 54.5 742 33.7 5,600 2.54 14,815 6.72
1980 1,753 79.5 2,194 99.5 904 41.0 761 34.5 6,526 2.96 16,402 7.44
1981 1,268 57.5 1,746 79.2 728 33.0 861 39.1 6,063 2.75 14,021 6.36
1982 995 45.1 1,482 67.2 545 24.7 744 33.7 4,850 2.20 12,941 5.87
1983 1,437 65.2 1,592 72.2 425 19.3 767 34.8 4,674 2.12 13,007 5.90
1984 1,251 56.7 1,380 62.6 442 20.0 891 40.4 4,762 2.16 12,456 5.65
1985 1,041 47.2 1,413 64.1 390 17.7 799 36.2 4,916 2.23 11,464 5.20
1986 1,150 52.2 1,374 62.3 406 18.4 757 34.3 3,880 1.76 6,173 2.80
1987 1,565 71.0 1,781 80.8 596 27.0 799 36.2 4,872 2.21 6,724 3.05
1988 2,530 114.8 2,606 118.2 655 29.7 1,247 56.6 13,823 6.27 7,165 3.25
1989 1,951 88.5 2,859 129.7 672 30.5 1,656 75.1 13,338 6.05 8,598 3.90
1990 1,639 74.3 2,670 121.1 813 36.9 1,520 68.9 9,083 4.12 6,195 2.81
1991 1,302 59.1 2,337 106.0 557 25.3 1,116 50.6 8,157 3.70 5,556 2.52
1992 1,254 56.9 2,266 102.8 542 24.6 1,240 56.2 7,011 3.18 6,107 2.77
1993 1,139 51.7 1,913 86.8 406 18.4 961 43.6 5,291 2.40 5,159 2.34
1994 1,479 67.1 2,313 104.9 548 24.9 998 45.3 6,349 2.88 5,467 2.48
1995 1,805 81.9 2,937 133.2 631 28.6 1,031 46.8 8,223 3.73 6,217 2.82
1996 1,504 68.2 2,291 103.9 774 35.1 1,025 46.5 7,496 3.40 6,173 2.80
1997 1,598 72.5 2,278 103.3 624 28.3 1,318 59.8 6,922 3.14 6,164 2.80
1998 1,356 61.6 1,653 75.0 528 23.9 1,023 46.4 4,614 2.10 5,537 2.51
1999 1,362 61.8 1,573 71.4 502 22.8 1,077 48.9 6,023 2.73 5,398 2.45
2000 1,549 70.3 1,814 82.3 454 20.6 1,128 51.2 8,637 3.92 5,432 2.46
2001 1,444 65.5 1,577 71.6 476 21.6 886 40.2 5,945 2.70 4,480 2.03
2002 1,349 61.2 1,558 70.6 452 20.5 778 35.3 6,768 3.07 4,059 1.84
2003 1,431 64.9 1,780 80.7 515 23.4 828 37.6 9,636 4.37 4,893 2.22
2004 1,716 77.8 2,868 130.1 888 40.3 1,047 47.5 13,845 6.28 8,504 3.86
2005 1,897 86.0 3,683 167.1 975 44.2 1,381 62.7 14,727 6.69 7,365 3.34
2006 2,566 116.5 6,729 305.3 1,287 58.4 3,272 148.5 24,276 10.99 8,755 3.97
2007 2,638 119.7 7,125 323.3 2,594 117.7 3,249 147.4 37,167 16.89 14,526 6.59
2008 2,571 116.6 6,951 315.3 2,084 94.5 1,870 84.8 21,020 9.53 18,487 8.39
Source: LME, CRU, ILZSG
Average annual nominal spot base metals prices over varying periods
Period Aluminium Copper Lead Zinc Nickel Tin
US$/ tonne
USc/lb US$/ tonne
USc/lb US$/tonne
USc/lb US$/tonne
USc/lb US$/ tonne
US$/lb US$/tonne
US$/lb
1980-89 1,494 67.8 1,843 83.6 576 26.1 928 42.1 6,770 3.07 10,895 4.94
1990-99 1,444 65.5 2,223 100.8 593 26.9 1,131 51.3 6,918 3.14 5,798 2.63
2000-08 1,907 86.5 3,787 171.8 1,081 49.0 1,604 72.8 15,780 7.16 8,500 3.86
1979-2008 1,602 72.7 2,558 116.0 754 34.2 1,192 54.1 9,483 4.30 8,608 3.90
Source: LME, CRU ILZSG
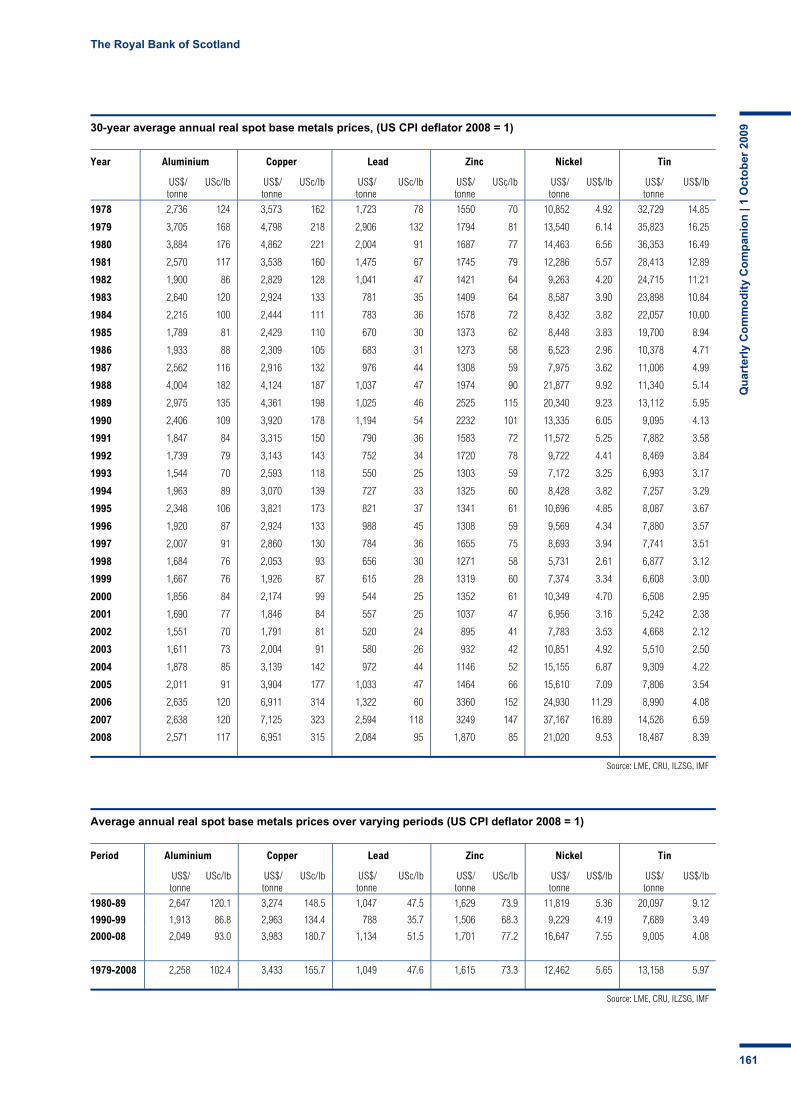
The Royal Bank of Scotland
Qu
arte
rly
Co
mm
od
ity
Co
mp
anio
n |
1 O
cto
ber
200
9
161
30-year average annual real spot base metals prices, (US CPI deflator 2008 = 1)
Year Aluminium Copper Lead Zinc Nickel Tin
US$/ tonne
USc/lb US$/ tonne
USc/lb US$/tonne
USc/lb US$/tonne
USc/lb US$/ tonne
US$/lb US$/tonne
US$/lb
1978 2,736 124 3,573 162 1,723 78 1550 70 10,852 4.92 32,729 14.85
1979 3,705 168 4,798 218 2,906 132 1794 81 13,540 6.14 35,823 16.25
1980 3,884 176 4,862 221 2,004 91 1687 77 14,463 6.56 36,353 16.49
1981 2,570 117 3,538 160 1,475 67 1745 79 12,286 5.57 28,413 12.89
1982 1,900 86 2,829 128 1,041 47 1421 64 9,263 4.20 24,715 11.21
1983 2,640 120 2,924 133 781 35 1409 64 8,587 3.90 23,898 10.84
1984 2,215 100 2,444 111 783 36 1578 72 8,432 3.82 22,057 10.00
1985 1,789 81 2,429 110 670 30 1373 62 8,448 3.83 19,700 8.94
1986 1,933 88 2,309 105 683 31 1273 58 6,523 2.96 10,378 4.71
1987 2,562 116 2,916 132 976 44 1308 59 7,975 3.62 11,006 4.99
1988 4,004 182 4,124 187 1,037 47 1974 90 21,877 9.92 11,340 5.14
1989 2,975 135 4,361 198 1,025 46 2525 115 20,340 9.23 13,112 5.95
1990 2,406 109 3,920 178 1,194 54 2232 101 13,335 6.05 9,095 4.13
1991 1,847 84 3,315 150 790 36 1583 72 11,572 5.25 7,882 3.58
1992 1,739 79 3,143 143 752 34 1720 78 9,722 4.41 8,469 3.84
1993 1,544 70 2,593 118 550 25 1303 59 7,172 3.25 6,993 3.17
1994 1,963 89 3,070 139 727 33 1325 60 8,428 3.82 7,257 3.29
1995 2,348 106 3,821 173 821 37 1341 61 10,696 4.85 8,087 3.67
1996 1,920 87 2,924 133 988 45 1308 59 9,569 4.34 7,880 3.57
1997 2,007 91 2,860 130 784 36 1655 75 8,693 3.94 7,741 3.51
1998 1,684 76 2,053 93 656 30 1271 58 5,731 2.61 6,877 3.12
1999 1,667 76 1,926 87 615 28 1319 60 7,374 3.34 6,608 3.00
2000 1,856 84 2,174 99 544 25 1352 61 10,349 4.70 6,508 2.95
2001 1,690 77 1,846 84 557 25 1037 47 6,956 3.16 5,242 2.38
2002 1,551 70 1,791 81 520 24 895 41 7,783 3.53 4,668 2.12
2003 1,611 73 2,004 91 580 26 932 42 10,851 4.92 5,510 2.50
2004 1,878 85 3,139 142 972 44 1146 52 15,155 6.87 9,309 4.22
2005 2,011 91 3,904 177 1,033 47 1464 66 15,610 7.09 7,806 3.54
2006 2,635 120 6,911 314 1,322 60 3360 152 24,930 11.29 8,990 4.08
2007 2,638 120 7,125 323 2,594 118 3249 147 37,167 16.89 14,526 6.59
2008 2,571 117 6,951 315 2,084 95 1,870 85 21,020 9.53 18,487 8.39
Source: LME, CRU, ILZSG, IMF
Average annual real spot base metals prices over varying periods (US CPI deflator 2008 = 1)
Period Aluminium Copper Lead Zinc Nickel Tin
US$/ tonne
USc/lb US$/ tonne
USc/lb US$/tonne
USc/lb US$/tonne
USc/lb US$/ tonne
US$/lb US$/tonne
US$/lb
1980-89 2,647 120.1 3,274 148.5 1,047 47.5 1,629 73.9 11,819 5.36 20,097 9.12
1990-99 1,913 86.8 2,963 134.4 788 35.7 1,506 68.3 9,229 4.19 7,689 3.49
2000-08 2,049 93.0 3,983 180.7 1,134 51.5 1,701 77.2 16,647 7.55 9,005 4.08
1979-2008 2,258 102.4 3,433 155.7 1,049 47.6 1,615 73.3 12,462 5.65 13,158 5.97
Source: LME, CRU, ILZSG, IMF
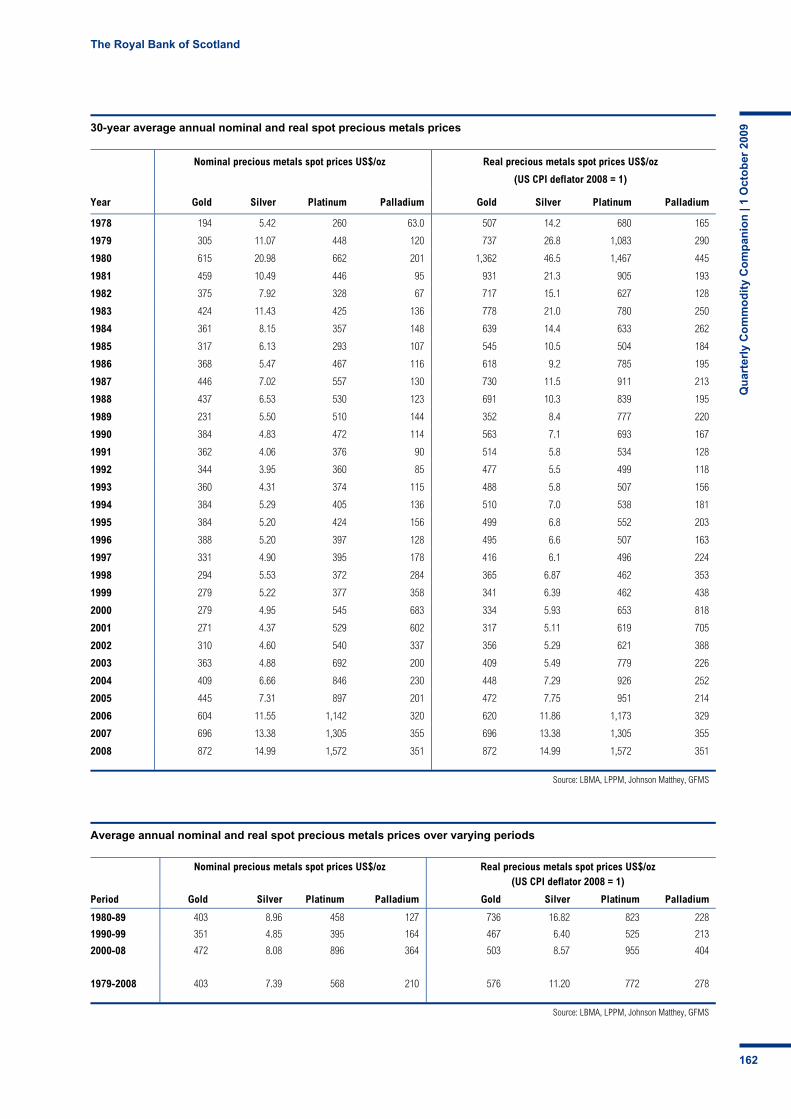
The Royal Bank of Scotland
Qu
arte
rly
Co
mm
od
ity
Co
mp
anio
n |
1 O
cto
ber
200
9
162
30-year average annual nominal and real spot precious metals prices
Nominal precious metals spot prices US$/oz Real precious metals spot prices US$/oz
(US CPI deflator 2008 = 1)
Year Gold Silver Platinum Palladium Gold Silver Platinum Palladium
1978 194 5.42 260 63.0 507 14.2 680 165
1979 305 11.07 448 120 737 26.8 1,083 290
1980 615 20.98 662 201 1,362 46.5 1,467 445
1981 459 10.49 446 95 931 21.3 905 193
1982 375 7.92 328 67 717 15.1 627 128
1983 424 11.43 425 136 778 21.0 780 250
1984 361 8.15 357 148 639 14.4 633 262
1985 317 6.13 293 107 545 10.5 504 184
1986 368 5.47 467 116 618 9.2 785 195
1987 446 7.02 557 130 730 11.5 911 213
1988 437 6.53 530 123 691 10.3 839 195
1989 231 5.50 510 144 352 8.4 777 220
1990 384 4.83 472 114 563 7.1 693 167
1991 362 4.06 376 90 514 5.8 534 128
1992 344 3.95 360 85 477 5.5 499 118
1993 360 4.31 374 115 488 5.8 507 156
1994 384 5.29 405 136 510 7.0 538 181
1995 384 5.20 424 156 499 6.8 552 203
1996 388 5.20 397 128 495 6.6 507 163
1997 331 4.90 395 178 416 6.1 496 224
1998 294 5.53 372 284 365 6.87 462 353
1999 279 5.22 377 358 341 6.39 462 438
2000 279 4.95 545 683 334 5.93 653 818
2001 271 4.37 529 602 317 5.11 619 705
2002 310 4.60 540 337 356 5.29 621 388
2003 363 4.88 692 200 409 5.49 779 226
2004 409 6.66 846 230 448 7.29 926 252
2005 445 7.31 897 201 472 7.75 951 214
2006 604 11.55 1,142 320 620 11.86 1,173 329
2007 696 13.38 1,305 355 696 13.38 1,305 355
2008 872 14.99 1,572 351 872 14.99 1,572 351
Source: LBMA, LPPM, Johnson Matthey, GFMS
Average annual nominal and real spot precious metals prices over varying periods
Nominal precious metals spot prices US$/oz Real precious metals spot prices US$/oz (US CPI deflator 2008 = 1)
Period Gold Silver Platinum Palladium Gold Silver Platinum Palladium
1980-89 403 8.96 458 127 736 16.82 823 228
1990-99 351 4.85 395 164 467 6.40 525 213
2000-08 472 8.08 896 364 503 8.57 955 404
1979-2008 403 7.39 568 210 576 11.20 772 278
Source: LBMA, LPPM, Johnson Matthey, GFMS
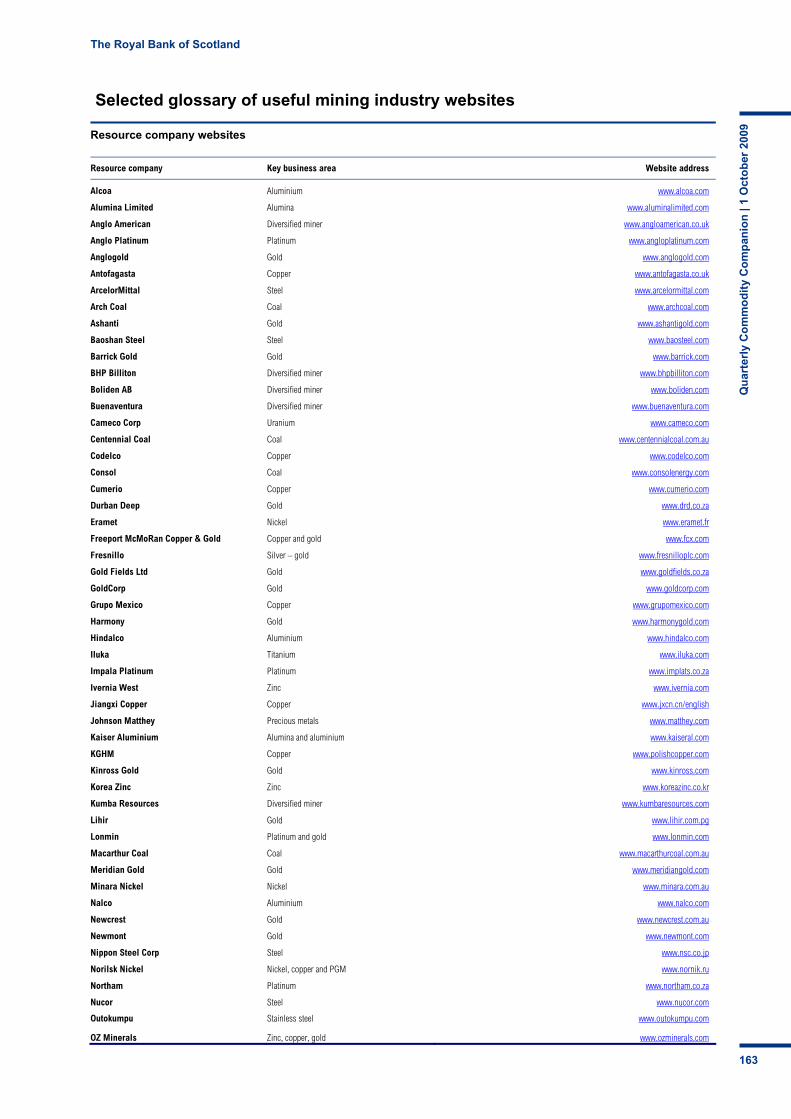
The Royal Bank of Scotland
Qu
arte
rly
Co
mm
od
ity
Co
mp
anio
n |
1 O
cto
ber
200
9
163
Selected glossary of useful mining industry websites
Resource company websites
Resource company Key business area Website address
Alcoa Aluminium www.alcoa.com
Alumina Limited Alumina www.aluminalimited.com
Anglo American Diversified miner www.angloamerican.co.uk
Anglo Platinum Platinum www.angloplatinum.com
Anglogold Gold www.anglogold.com
Antofagasta Copper www.antofagasta.co.uk
ArcelorMittal Steel www.arcelormittal.com
Arch Coal Coal www.archcoal.com
Ashanti Gold www.ashantigold.com
Baoshan Steel Steel www.baosteel.com
Barrick Gold Gold www.barrick.com
BHP Billiton Diversified miner www.bhpbilliton.com
Boliden AB Diversified miner www.boliden.com
Buenaventura Diversified miner www.buenaventura.com
Cameco Corp Uranium www.cameco.com
Centennial Coal Coal www.centennialcoal.com.au
Codelco Copper www.codelco.com
Consol Coal www.consolenergy.com
Cumerio Copper www.cumerio.com
Durban Deep Gold www.drd.co.za
Eramet Nickel www.eramet.fr
Freeport McMoRan Copper & Gold Copper and gold www.fcx.com
Fresnillo Silver – gold www.fresnilloplc.com
Gold Fields Ltd Gold www.goldfields.co.za
GoldCorp Gold www.goldcorp.com
Grupo Mexico Copper www.grupomexico.com
Harmony Gold www.harmonygold.com
Hindalco Aluminium www.hindalco.com
Iluka Titanium www.iluka.com
Impala Platinum Platinum www.implats.co.za
Ivernia West Zinc www.ivernia.com
Jiangxi Copper Copper www.jxcn.cn/english
Johnson Matthey Precious metals www.matthey.com
Kaiser Aluminium Alumina and aluminium www.kaiseral.com
KGHM Copper www.polishcopper.com
Kinross Gold Gold www.kinross.com
Korea Zinc Zinc www.koreazinc.co.kr
Kumba Resources Diversified miner www.kumbaresources.com
Lihir Gold www.lihir.com.pg
Lonmin Platinum and gold www.lonmin.com
Macarthur Coal Coal www.macarthurcoal.com.au
Meridian Gold Gold www.meridiangold.com
Minara Nickel Nickel www.minara.com.au
Nalco Aluminium www.nalco.com
Newcrest Gold www.newcrest.com.au
Newmont Gold www.newmont.com
Nippon Steel Corp Steel www.nsc.co.jp
Norilsk Nickel Nickel, copper and PGM www.nornik.ru
Northam Platinum www.northam.co.za
Nucor Steel www.nucor.com
Outokumpu Stainless steel www.outokumpu.com
OZ Minerals Zinc, copper, gold www.ozminerals.com
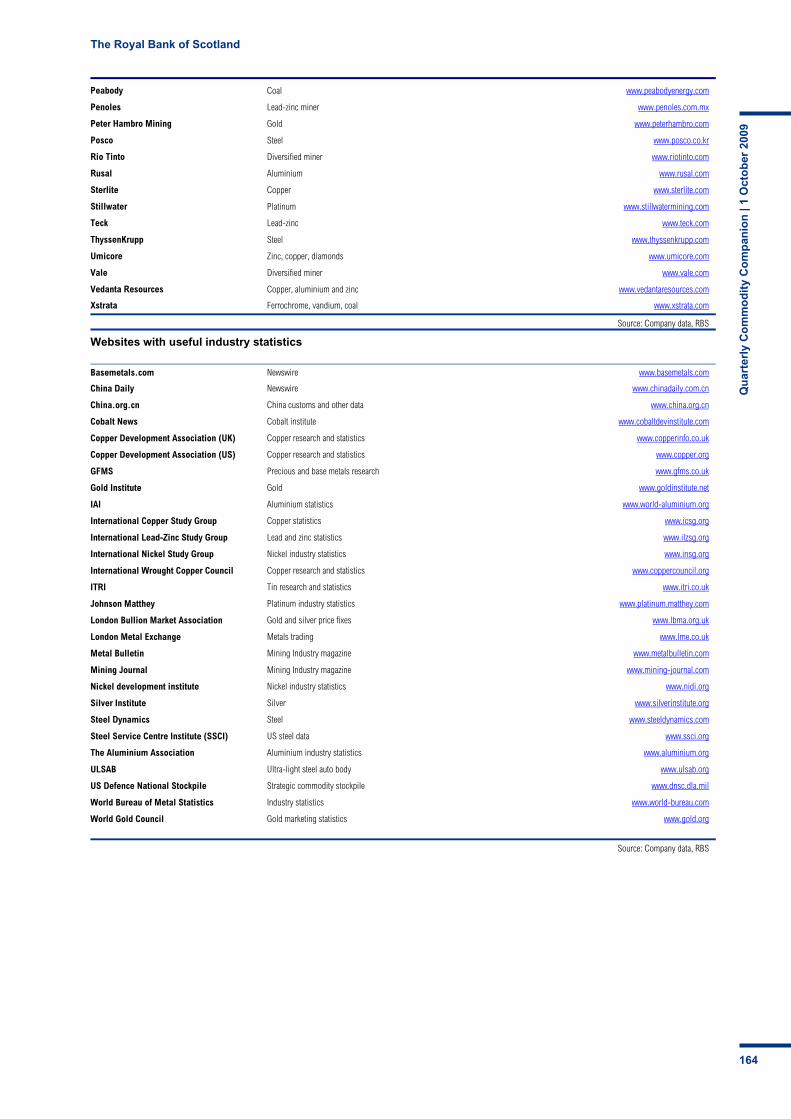
The Royal Bank of Scotland
Qu
arte
rly
Co
mm
od
ity
Co
mp
anio
n |
1 O
cto
ber
200
9
164
Peabody Coal www.peabodyenergy.com
Penoles Lead-zinc miner www.penoles.com.mx
Peter Hambro Mining Gold www.peterhambro.com
Posco Steel www.posco.co.kr
Rio Tinto Diversified miner www.riotinto.com
Rusal Aluminium www.rusal.com
Sterlite Copper www.sterlite.com
Stillwater Platinum www.stillwatermining.com
Teck Lead-zinc www.teck.com
ThyssenKrupp Steel www.thyssenkrupp.com
Umicore Zinc, copper, diamonds www.umicore.com
Vale Diversified miner www.vale.com
Vedanta Resources Copper, aluminium and zinc www.vedantaresources.com
Xstrata Ferrochrome, vandium, coal www.xstrata.com
Source: Company data, RBS
Websites with useful industry statistics
Basemetals.com Newswire www.basemetals.com
China Daily Newswire www.chinadaily.com.cn
China.org.cn China customs and other data www.china.org.cn
Cobalt News Cobalt institute www.cobaltdevinstitute.com
Copper Development Association (UK) Copper research and statistics www.copperinfo.co.uk
Copper Development Association (US) Copper research and statistics www.copper.org
GFMS Precious and base metals research www.gfms.co.uk
Gold Institute Gold www.goldinstitute.net
IAI Aluminium statistics www.world-aluminium.org
International Copper Study Group Copper statistics www.icsg.org
International Lead-Zinc Study Group Lead and zinc statistics www.ilzsg.org
International Nickel Study Group Nickel industry statistics www.insg.org
International Wrought Copper Council Copper research and statistics www.coppercouncil.org
ITRI Tin research and statistics www.itri.co.uk
Johnson Matthey Platinum industry statistics www.platinum.matthey.com
London Bullion Market Association Gold and silver price fixes www.lbma.org.uk
London Metal Exchange Metals trading www.lme.co.uk
Metal Bulletin Mining Industry magazine www.metalbulletin.com
Mining Journal Mining Industry magazine www.mining-journal.com
Nickel development institute Nickel industry statistics www.nidi.org
Silver Institute Silver www.silverinstitute.org
Steel Dynamics Steel www.steeldynamics.com
Steel Service Centre Institute (SSCI) US steel data www.ssci.org
The Aluminium Association Aluminium industry statistics www.aluminium.org
ULSAB Ultra-light steel auto body www.ulsab.org
US Defence National Stockpile Strategic commodity stockpile www.dnsc.dla.mil
World Bureau of Metal Statistics Industry statistics www.world-bureau.com
World Gold Council Gold marketing statistics www.gold.org
Source: Company data, RBS

The Royal Bank of Scotland
Qu
arte
rly
Co
mm
od
ity
Co
mp
anio
n |
1 O
cto
ber
200
9
165
Notes

The Royal Bank of Scotland
Qu
arte
rly
Co
mm
od
ity
Co
mp
anio
n |
1 O
cto
ber
200
9
166
http://strategy.rbsm.com/disclosures - View this page for additional Important Disclosure Information for Research Recommendations including Recommendation history.
This material has been prepared by The Royal Bank of Scotland plc (“RBS”) for information purposes only and is not an offer to buy or sell or a solicitation of an offer to buy or sell any security or instrument or to participate in any particular trading strategy. This material should be regarded as a marketing communication and may have been produced in conjunction with the RBS trading desks that trade as principal in the instruments mentioned herein. This commentary is therefore not independent from the proprietary interests of RBS, which may conflict with your interests. Opinions expressed may differ from the opinions expressed by other divisions of RBS including our investment research department. This material includes analyses of securities and related derivatives that the firm's trading desk may make a market in, and in which it is likely as principal to have a long or short position at any time, including possibly a position that was accumulated on the basis of this analysis prior to its dissemination. Trading desks may also have or take positions inconsistent with this material. This material may have been made available to other clients of RBS before being made available to you. Issuers mentioned in this material may be investment banking clients of RBS. Pursuant to this relationship, RBS may have provided in the past, and may provide in the future, financing, advice, and securitization and underwriting services to these clients in connection with which it has received or will receive compensation. The author does not undertake any obligation to update this material. This material is current as of the indicated date. This material is prepared from publicly available information believed to be reliable, but RBS makes no representations as to its accuracy or completeness. Additional information is available upon request. You should make your own independent evaluation of the relevance and adequacy of the information contained in this material and make such other investigations as you deem necessary, including obtaining independent financial advice, before participating in any transaction in respect of the securities referred to in this material. Past performance is not necessarily indicative of future results. Certain transactions, including those involving futures, options and products utilising futures and options give rise to substantial risk and are not suitable for all investors.
THIS MATERIAL IS NOT INVESTMENT RESEARCH AS DEFINED BY THE FINANCIAL SERVICES AUTHORITY.
United Kingdom. Unless otherwise stated herein, this material is distributed by The Royal Bank of Scotland plc (“RBS”) Registered Office: 36 St Andrew Square, Edinburgh EH2 2YB. Company No. 90312. RBS is authorised and regulated as a bank and for the conduct of investment business in the United Kingdom by the Financial Services Authority. Australia. This material is distributed in Australia to wholesale investors only by The Royal Bank of Scotland plc (Australia branch), (ABN 30 101 464 528), Level 22, 88 Phillip Street, Sydney NSW 2000, Australia which is authorised and regulated by the Australian Securities and Investments Commission, (AFS License No 241114), and the Australian Prudential Regulation Authority. France. This material is distributed in the Republic of France by The Royal Bank of Scotland plc (Paris branch), 94 boulevard Haussmann, 75008 Paris, France. Hong Kong. This material is being distributed in Hong Kong by The Royal Bank of Scotland plc (Hong Kong branch), 30/F AIG Tower, 1 Connaught Road, Central, Hong Kong, which is regulated by the Hong Kong Monetary Authority. Italy. Persons receiving this material in Italy requiring additional information or wishing to effect transactions in any relevant Investments should contact The Royal Bank of Scotland plc (Milan branch), Via Turati 18, 20121, Milan, Italy. Japan. This material is distributed in Japan by The Royal Bank of Scotland plc (Tokyo branch), Shin-Marunouchi Center Building 19F - 21F, 6-2 Marunouchi 1-chome, Chiyoda-ku, Tokyo 100-0005, Japan, which is regulated by the Financial Services Agency of Japan. Singapore. This material is distributed in Singapore by The Royal Bank of Scotland plc (Singapore branch), Level 26, One Raffles Quay, South Tower, Singapore 048583, which is regulated by the Monetary Authority of Singapore. RBS is exempt from licensing in respect of all financial advisory services under the (Singapore) Financial Advisers Act, Chapter 110 (“FAA”). In Singapore, this material is intended solely for distribution to institutional investors, accredited investors, and expert investors as defined under the FAA.
United States of America. RBS is regulated in the US by the New York State Banking Department and the Federal Reserve Board. The financial instruments described in the document comply with an applicable exemption from the registration requirements of the US Securities Act 1933. This material is only being made available to U.S. persons that are also Major U.S. institutional investors as defined in Rule 15a-6 of the Securities Exchange Act 1934 and the interpretative guidance promulgated there under. Major U.S. institutional investors should contact RBS Securities Inc. an affiliate of RBS and member of FINRA, if they wish to effect a transaction in any Securities mentioned herein.
The Royal Bank of Scotland plc. Registered in Scotland No. 90312. Registered Office: 36 St Andrew Square, Edinburgh EH2 2YB.
The daisy device logo, RBS, The Royal Bank of Scotland and Make it happen are trade marks of The Royal Bank of Scotland Group plc.