commodities corner asian trader mutual...
TRANSCRIPT
CY
AN
M
AG
ENTA
Y
ELLOW
B
LAC
K
CM
YK
Com
posite
Com
posi
teP
2BW
1330
30-0
-M01
400-
1---
----
-XA
EE
,EU
,MW
,NA
,SW
,WE
898009_898049
05/1
2/20
08
P2B
W133030-0-M
01400-1--------XA
P2BW133030-0-M01400-1-------
JUST AS THE AGRICULTURAL RAW MATERIALS THAT IT SUPPLIES ARE ESSEN-tial to the global diet, Olam International is proving to be an importantingredient in diversified equity portfolios. As Olam Chief Executive SunnyVerghese describes his Singapore-based company (OLAM.Singapore) to Bar-ron’s, it is “fairly recession-proof.”
“From previous commodity cycles, I don’t expect a recessionary situationto affect demand materially,” says Verghese, who set up the agricultural-sup-ply-chain management company 19 years ago. “Our products, such as edibleoils, rice, coffee, sesame and nuts, are essential items with predictable de-mand.” The recession-threatened U.S. market accounts for no more than 12%of Olam’s sales, he notes, and products exported to the U.S.—coffee, cocoa andedible nuts—aren’t likely to be much affected by an economic downturn.
Nomura analyst Eltricia Foong pegs Olam’s fair value at between 2.10 and3.70 Singapore dollars a share (about $1.53 and $2.70) over the next 12months, depending on the severity of any U.S. recession, which would stillgive shareholders who subscribed to Olam’s 1-for-10 preferential-share offer-ing at S$1.97 apiece in April a gain of at least 6.5%.
Olam’s shares were heavily penalized in the bearish climate of theoffering announcement in March, plunging to S$1.62 from a high of S$4.10just 10 months earlier, even though that was Olam’s first fund raising
since its initial public offering three years ago. Itdidn’t help that just before the announcement, Mer-rill Lynch issued a Sell recommendation, citingwhat it contended was an unsustainably high debtlevel. Olam was also plagued by rumors of a possi-ble default by its futures broker, MF Global, at the
height of the global credit crunch, an exposure that has since beensharply reduced, from US$750,000 to around US$70,000 as of early May,according to Verghese.
The stock broke through its S$3 resistance level to a seven-week high onMay 6, in part lifted by crude oil’s record rally and its spillover into thecommodity complex and commodity-linked equities. In contrast, shares ofagriculture and mining company Noble Group (NOBG.Singapore) suffered asimilar slump after its recent placement of new ordinary shares, but thecompany is recovering more slowly. Noble stock fell 6.6% within an hour toS$2.11 on the first trading day after the announcement, and has since recov-ered around 30%, compared with Olam’s near-85% rebound.
For Olam, says Verghese, the S$304 million in equity capital it raised willbring debt ratios “down quite a bit,” bolster working capital to support reve-nue growth—Verghese sees no problem booking gains of 16%-20% in the fiscalyear ending next month—and finance two to three acquisitions in the fiscalyear ending June 30, 2009. Olam has been creating shareholder value with itsacquisitions; the last six have produced an average return on equity of 35%,sharply higher that the ROE of 21% for the entire portfolio, Verghese says.
To maintain a strong ROE, Olam may have to increase its leverage, whichcould lead to another round of equity injection two to three years down theroad. But if Olam can minimize earnings dilution, as it has in its recent fundraising, shareholders are unlikely to complain. n
BRAZIL JOINED THE INVESTMENT-GRADE CLUB RECENTLY, FOLLOWINGStandard&Poor’sApril 30decision toraise theSouthAmericannation’s foreign-currencydebt rating to triple-B-minus.Word on theBrazilianStreet is that thiswill encourage money to flow into the country’s equity markets mid- to long-term, as cheaper credit becomes easier to come by and the local currencystrengthens against the dollar, bringing Brazil its El Dorado moment.
Many Brazilian equities are undervalued against their peers. Add in thecommodities story to the recent S&P notch-up, and things look good for manyBrazilian equity names: While shares of New York-traded Brazilian blue chipssuch as oil giant Petrobras (ticker: PBR) and mining-company Vale (RIO) havebeen rising, the food sector appears in an even better position to rally, as agricul-turalproducts continuebenefitting frompowered-uppricing andglobal demand.
Brazil is the world’s leading beef and chicken exporter, and we’ve all heardthat middle-class Asian and Middle Eastern populations are eating more.
FoodcompaniesSadia (SDA)andPerdigao (PDA)are listed inNewYork, too.But Marfrig (MRFG3.Brazil) and JBS (JBSS3.Brazil), both international beefcompanies, are not—and their growth opportunities are better than for overseascompetitors likeTysonFoods (TSN), saysCredit Suisse analystMarcelMoraes.
“Take Marfrig, for example. It’s trading at way lower multiples than its U.S.peers,” he says. Its ’08 price/earnings multiple is 17.8 times, and projected at12.1 times in ’09, while Tyson’s is 38.3 and 16.6 times, respectively and Smith-
field Foods (SFD) is 25.7 and 19.6 times. Marfrig is “adiscount stock with stronger growth opportunity andhigher growth rates, because they are not entirely de-pendent on the [domestic] economy,” Moraes contin-
ues, adding: “It’s a good entry time for buying these stocks.”As well, he points out that the Brazilian Development Bank, BNDESPar,
has expressed interest in financing consolidation deals for food companies.“We are going to start seeing a structural change in the valuation of thesecompanies,” Moraes said.
Meanwhile,FelipeCunha,headofresearchatBrascan inSãoPaulo, seesbene-fits for lesser-knownnameswithnew-foundaccess to credit in a hot commoditiesmarket. “If I was to choose a company that would benefit from investmentgrade, it wouldn’t be Petrobras. It’s already fairly valued,” Cunha says. Hisbiggest worry is the dollar. More dollars entering Brazil means a strongerreal (the local currency), and that’s negative for commodity exporters.
“Investment grade legitimizes all levels of Brazil’s market,” affirms NickChamie, head of emerging markets research at RBC Dominion Securities. “Ithelps mid- and small-cap companies find better credit and new investors.That’s the dramatic change. All of a sudden, these valuations and price-to-earnings ratios can push much higher,” Chamie says.
“Brazil will attract more money from pension funds and insurancecompanies, and that will keep the real strong,” adds Chamie. “It’s notgoing to be overnight. It’ll be almost imperceptible, but the flows [intoequity] will become steady.”
Nymex crude-oil prices hit a record $126.25 a barrel Friday, with the Junecontract settling at $125.96, an 8.3% rise on the week. n
Commodities Corner
by Tor Ching Li by Kenneth Rapoza
Asian TraderForeign Investment
KENNETH RAPOZA covers Brazil for Dow Jones Newswires in São Paulo.
A Recession-Dodging Stock Brazil Food Shares’ Sweet Spot
TOR CHING LI is a commodities reporter for Dow Jones Newswires in Singapore.
Commodity Indexes,www.barrons.com
Tables: AsianMarkets, page M49Emerging Markets,www.barrons.com
M14 B A R R O N ' S May 12, 2008
Util p 15.34 -0.17 -4.1 55.1Vsta p 11.20 0.19 -4.0 21.6Voy p 18.14 -0.17 -5.9 16.1
Putnam Funds Class B:GrIn t 14.22 -0.36 -7.7 5.5IntlEq t 25.24 -0.17 -4.2 48.5Voy t 15.59 -0.15 -6.1 13.5
Putnam Funds Class M:DvrIn p 9.37 -0.05 -1.8 10.9
Putnam Funds Class Y:AACn 9.52 -0.01 -0.7 15.5GrIn 14.53 -0.35 -7.3 8.7Incm 6.64 0.02 0.0 12.0IntlEq 26.67 -0.17 -3.9 53.1Inv 13.77 -0.24 -7.3 13.4Voy 18.83 -0.17 -5.8 17.0
Quaker Funds:StrGwthA p 27.94 0.80 4.3 65.8
Quantitative Group:EmgMkts r 29.25 -0.66 -6.5 129.8ForeignVal O t 20.37 -0.08 0.4 50.0
RRS Funds:
CoreEqA 42.56 -0.26 0.2 45.3CoreEqVIP 38.52 -0.26 0.2 46.6Em Gr p 35.51 -0.28 -12.6 22.4InvQBdVIP 12.16 0.04 1.8 14.5NatRes p 42.27 1.61 11.3 115.7Partners 30.59 -0.05 -0.7 24.0Value 26.25 0.17 -0.1 35.5
Rainier Inv Mgt:LgCpEq n 28.78 -0.28 -4.0 39.8LgCpEqI 28.94 -0.28 -3.9 41.0SmMCap n 36.74 0.18 -6.7 56.7SmMCap Inst 37.39 0.19 -6.6 57.8
RiverSource A:BalancedA 10.59 -0.15 -3.2 18.1DEI A 11.47 -0.12 -4.7 40.5DispEqA p 6.57 -0.12 -4.9 26.1DivOpptyA 8.54 -0.12 -6.2 28.2DivrBd 4.81 0.01 0.4 12.8EqValA 12.86 -0.12 -3.3 40.4GwthA 29.42 -0.37 -9.1 13.9HiYdTE A 4.24 0.02 0.6 8.3HiYldBd 2.74 0.00 0.5 20.5IBModIncA t 10.16 -0.02 -1.7 NSLgCpEqA p 4.97 -0.10 -6.8 18.0MdCpGrwA 9.45 -0.02 -5.8 24.5MdCpValA p 8.95 -0.04 -3.5 44.9PBAggsvA p 10.68 -0.07 -3.9 30.2PBModA p 10.53 -0.02 -1.6 24.9PBModAggA p 10.59 -0.05 -2.6 27.6PrtFndmntValA p 6.02 -0.08 -2.9 27.0PrtIntlSelValA p 9.46 -0.13 -4.8 54.4SDGovt 4.75 0.01 0.6 11.3SmCoIA 6.27 -0.07 -3.7 21.4StrtgcAlA 10.90 -0.10 -4.1 30.1TE BdA 3.75 0.02 0.6 8.7TNEmgMrkt 10.42 -0.06 -3.5 132.1TNGlbEqty 8.44 -0.08 -5.1 52.4TNIntOppty 10.71 -0.08 -3.3 56.5
RiverSource B:DEI B t 11.48 -0.12 -4.9 37.3LgCpEqB t 4.86 -0.10 -6.9 15.2
RiverSource I:DisplnEqI 6.61 -0.12 -4.9 27.6DivrBdI 4.82 0.02 0.5 14.2GwthI 30.12 -0.38 -8.9 15.5
Royce Funds:LowPrStkSev nr 14.79 0.17 0.1 45.0Micro-Cap I nr 14.90 0.10 -5.2 49.2Oppty I nr 10.45 -0.08 -5.2 27.8PAMut I nr 10.59 -0.06 -2.1 33.5PAMutC p 9.84 -0.06 -2.5 29.7PremierI nr 18.24 -0.04 5.1 58.9TotRet I nr 12.65 -0.07 -1.8 28.3ValuePlusSer n 13.10 0.12 -5.1 43.3ValueSev tn 11.41 0.20 7.2 55.8
Russell Funds S:DivEq n 46.06 -0.56 -5.5 30.2EmerMkts n 22.18 -0.20 -1.8 129.2IntlSec n 68.78 -0.26 -4.4 56.9MStratBd xn 10.24 -0.02 0.5 12.5QuantEq n 36.09 -0.39 -5.9 18.9RESec n 41.82 -1.50 6.8 38.1ShtDurBd n 18.97 0.08 1.6 13.3SpecGrow n 43.86 -0.08 -8.1 25.4TxMngLgC n 20.81 -0.28 -5.8 21.1
Russell Instl I:EqI n 31.29 -0.38 -5.4 30.7EqQ n 32.17 -0.37 -6.1 19.9FixIncI n 20.72 0.08 0.7 13.1FxIncIII n 10.46 0.05 1.0 14.0Intl n 41.88 -0.16 -4.3 58.2
Russell LifePoint R3:BalStrat p 11.60 -0.08 -2.3 26.2EqGwthStrat p 11.55 -0.12 -4.6 35.6GwthStrat p 11.81 -0.10 -3.4 30.6
Russell LifePoints C:BalStrat p 11.50 -0.08 -2.5 24.3EqGwthStr p 11.14 -0.12 -4.7 33.5GwthStrat 11.68 -0.10 -3.6 28.6
Russell LifePoints E:BalStrat n 11.60 -0.08 -2.3 27.1GwthStrat n 11.79 -0.10 -3.4 31.5
Russell LifePoints S:BalStrat n 11.66 -0.08 -2.2 28.0GwthStrat n 11.85 -0.11 -3.3 32.4
Rydex Investor Class:NasdaqInv n 12.95 -0.14 -6.2 32.2
SSA Funds:
GblFxdIncm 10.46 0.04 0.6 9.5Intl Val 16.20 -0.24 -4.8 64.2US Market 12.39 NA NA NA
SEI Portfolios:CoreFxIn 10.07 0.03 0.5 11.2EmgMkt 16.94 -0.19 -2.9 105.6EMktDbt 10.41 -0.03 0.5 33.5HiYld 7.61 -0.03 -0.8 16.4IntMuni 10.71 0.04 1.1 9.1IntlEq 12.80 -0.08 -4.7 49.4IntlFix 10.86 0.07 0.0 -3.0LgCGro 22.44 -0.11 -5.0 28.1LgCVal 18.90 -0.43 -5.5 20.9MgdVol 12.17 -0.05 -3.9 26.4S&P500A 38.55 -0.69 -4.9 23.5S&P500E 38.68 -0.68 -4.8 24.0SmCGro 16.84 -0.11 -10.6 16.7SmCVal 16.68 -0.17 -1.5 22.6TaxMgdLC 13.38 -0.17 -5.2 25.0UltraSht 9.50 0.02 -0.4 8.3
SSgA Funds:EmgMkt n 28.92 -0.30 -3.9 138.7EmgMktSel 28.94 -0.30 -3.8 NSIntlStoc n 13.74 -0.01 -2.7 59.6SP500 n 22.87 -0.41 -4.9 24.2
RRidgeWorth Funds:
HiYldI 10.00 -0.03 0.6 15.3IntEqIdxI 18.90 -0.09 -3.4 58.0IntlEqI 14.49 -0.04 -5.7 49.3IntmBdI 10.22 0.05 2.2 15.8InvGrTEBdI 11.67 0.05 2.2 12.5LgCpCorEqI 14.82 -0.32 -7.4 18.2LgCpGrStkI 10.62 -0.06 -7.3 22.6LgCpValEqI 12.86 -0.31 -5.2 26.2SmCpGrI 14.63 0.03 -8.3 21.5SmCpVal 11.61 -0.18 -4.6 33.2TotRetBd I 10.06 0.03 1.5 14.2USGovSecI 10.50 0.06 2.2 14.8
SSchroder Funds:
MuniBdI n 9.54 0.04 -2.0 7.3NAmerEqInv 10.60 -0.14 -4.3 26.8
Schwab Funds:1000 Inv nr 40.96 -0.61 -4.6 25.71000Sel n 40.96 -0.61 -4.6 26.2CoreEq n 18.27 -0.16 -5.8 26.0DivEqInv n 14.18 -0.24 -5.2 22.3DivEqSel n 14.12 -0.24 -5.2 22.8HdgEqSel nr 15.08 0.03 -3.0 13.9HlthCare n 14.66 -0.22 -11.2 14.5IntI Sel nr 23.24 -0.17 -2.8 57.0Intl Inv n 23.24 -0.16 -2.8 56.1LrgCpGrSel nr 11.40 -0.03 -6.7 NSMT AllEq n 13.92 -0.18 -3.9 33.0MT Bal n 16.29 -0.13 -3.0 22.0MT Gro n 18.69 -0.20 -3.4 26.9PremEqInv n 11.65 -0.09 -6.4 26.7PremEqSel n 11.66 -0.08 -6.3 27.3S&PInstSel 11.04 -0.19 -4.7 24.7S&P Inv n 21.50 -0.39 -5.0 23.7S&P Sel n 21.58 -0.39 -4.9 24.4SmCp Inv n 18.99 -0.22 -3.4 26.8SmCp Sel nr 19.01 -0.22 -3.4 27.4STBd n 9.44 0.01 -2.8 7.8TotBd n 9.39 0.01 -2.1 9.3TSM Inv nr 24.08 -0.35 -4.6 25.9TSM Sel nr 24.13 -0.35 -4.5 26.4YldPlsSel n 6.51 -0.07 -26.8 -21.6
Security Funds:MCapValA 29.85 -0.25 -4.1 34.0
Selected Funds:AmShD n 46.57 -0.66 -2.6 31.1AmShS pn 46.51 -0.66 -2.7 29.9
Seligman Group:ComunA p 35.95 0.07 -5.9 54.6ComunD t 30.42 0.06 -6.1 51.1
Sentinel Group:ComS A p 32.92 -0.38 -2.6 33.9SmCoA p 6.95 -0.05 -4.9 32.8
Sequoia n 131.76 -4.45 -3.0 27.3SoundSh n 34.67 -0.25 -2.8 27.7State Farm Associate:
Balan n 58.03 -0.09 0.2 31.3Gwth n 59.77 -0.42 -1.9 36.2Muni n 8.46 0.04 2.0 12.5
State Farm Retail:LP2020LegA 13.44 -0.07 -0.9 23.0
Stratton Funds:SmCap n 48.98 1.05 6.2 33.9
SunAmerica Funds:StrBd A 3.54 0.01 1.6 19.4
TTransamerica A:
AsAIGrow p 13.47 -0.13 -4.5 37.0AsAlMod p 12.42 -0.04 -1.4 29.0AsAlModGr p 13.01 -0.08 -2.6 33.4Equity p 10.74 -0.20 -7.3 40.1
Transamerica B:AsAlModGr t 12.94 -0.08 -2.9 30.7
Transamerica C:AsAlGrow t 13.15 -0.14 -4.7 34.5AsAlMod t 12.35 -0.04 -1.6 27.0AsAlModGr t 12.92 -0.08 -2.9 30.8
TCMSmCpGr 29.68 -0.16 -9.4 56.7TCW Funds:
DvsfValI n 14.79 -0.44 -4.1 17.9SelEqtyI n 18.34 -0.14 -6.6 15.5TotRetBondI n 9.65 NA NA NA
TCW Funds N:DivFocused pn 11.99 -0.36 -6.2 17.1SelEqtyN pn 17.78 -0.13 -6.7 14.6TotRetBdN pn 10.01 NA NA NA
TIAA/CREF Funds:BondInst 10.08 0.05 1.5 14.2
EqIdxInst 10.22 -0.15 -4.6 25.8GrEqInst 8.24 -0.06 -6.8 32.5InflLkdBdInst 10.85 0.14 4.2 18.0IntlEqIdxInst 21.50 -0.11 -3.5 55.5IntlEqInst 11.97 -0.03 -9.5 62.2IntlEqRet 12.29 -0.03 -9.6 59.7LrgCpVl Inst 13.84 -0.36 -6.9 21.3LrgCapVlRet 13.80 -0.35 -6.9 20.4MdCpVlRet 17.60 -0.18 -2.8 38.4S&P500IdxInst 15.73 -0.27 -4.7 24.5
TIAA-CREF/Retail Cl:Gro&Inc n 11.56 -0.13 -5.2 NSIntlEq n 8.58 -0.02 -9.6 NSLrgCpGro n 10.81 -0.09 -7.3 NSMgdAllcoII n 10.32 -0.07 -4.4 NS
TARGET:SmCapVal n 19.05 -0.14 0.5 31.9
Templeton Instit:EmMS 19.54 -0.18 -8.0 94.4ForEqS 26.99 -0.40 -5.6 64.4
Third Avenue:Intl nr 19.09 -0.09 1.9 38.7RealEstVal nr 27.47 -0.25 -1.3 29.4SmCap n 24.08 0.21 2.8 29.9Value n 56.76 -0.97 -6.6 24.6
Thornburg Fds:CoreGwthA t 17.02 -0.08 -14.5 40.5IncBuildA t 21.09 -0.17 -5.7 48.2IncBuildC p 21.10 -0.17 -5.9 45.6IntValA p 31.27 -0.26 -5.8 77.5IntVal I 31.96 -0.27 -5.7 79.6LtdTMuA 13.58 0.05 1.6 10.0Value 34.62 -0.36 -7.7 33.8ValueI 35.19 -0.37 -7.6 35.3
Thornburg Fds Cl C:IntlValC t 29.60 -0.26 -6.1 73.7Value t 33.32 -0.35 -8.0 30.9
Thrivent Funds A:HiYld 4.82 -0.03 1.3 20.0Income 8.32 0.02 0.2 10.3LgCpStk 25.05 -0.36 -4.9 22.5MidCapStk 13.63 -0.09 -6.3 30.7MuniBd 11.11 0.06 1.0 10.6
Tocqueville Funds:Gold tn 48.15 1.65 -1.4 116.6Tocqueville n 24.14 -0.59 -5.8 37.6
TorrayFd n 33.91 -0.63 -6.8 13.0Touchstone Family Fd:
LgCpGwthA 26.49 0.25 -3.2 36.2MdCpGwthA p 23.20 -0.10 0.1 46.1MdCpY 16.24 0.08 -6.5 32.8SandsCapGrI 12.24 0.03 -7.1 22.3
Transamerica Partner:AstAll IH p 9.97 -0.03 -1.6 20.5AstAll ILgH p 9.65 -0.06 -2.8 23.3AstAll ILH 12.11 -0.08 -3.0 21.8CoreBond 12.63 0.05 2.1 13.7IAstAll IH 11.19 -0.04 -1.7 19.7InstCoreBd p 10.67 0.05 2.2 14.8InstIntlEq p 9.38 -0.04 -6.1 52.8InstLgGwth p 6.92 -0.05 -5.6 22.8InstLgVal p 11.38 -0.34 -5.7 19.6InstStkIdx p 9.28 -0.16 -4.8 23.9IntlEq p 15.23 -0.07 -6.2 51.7LgGwth p 19.69 -0.16 -5.7 21.5LgVal 21.34 -0.65 -5.8 19.0MdVal p 12.88 -0.11 -2.7 28.9StkIdx p 10.80 -0.19 -4.9 22.5
Transamerica Premier:BalnceI n 25.72 -0.29 -5.2 28.6EquityI n 23.86 -0.43 -6.8 39.8
Turner Funds:MicroCap n 52.66 0.30 -6.8 43.8MidcapGwth n 34.15 0.25 -6.1 45.8
TweedyGlVal n ¡ 27.89 -0.35 -6.8 34.6TweedyVal n ¡ 21.64 -0.54 -1.4 17.0
UUBS Funds Class A:
DynAlpha t 10.47 -0.08 3.4 15.2GlobAll t 13.53 -0.06 -1.7 25.5
UBS Funds Class C:GlobAll p 13.22 -0.06 -2.1 22.6
UBS Funds Class Y:DynAlpha 10.54 -0.07 3.5 16.2GloAllY 13.75 -0.06 -1.6 26.4USLgCpEqY 18.31 -0.27 -4.3 21.8
UBS PACE Funds Cl P:GlobFxd P 12.22 0.23 7.4 20.1GovtFxd P 13.21 0.04 2.4 15.4IntFxd P 11.85 0.09 2.6 16.2IntlEqty P 18.11 -0.11 -5.1 57.2lcGEqty P 18.22 -0.04 -6.5 26.0lcVEqty P 18.65 -0.32 -6.3 28.9SmGEqty P 14.21 0.04 -9.7 25.3SmVEqty P 15.23 -0.30 -5.5 7.5StraFxd P 14.16 0.11 3.6 17.2StratInvP n 10.93 0.04 -1.0 NS
UMB Scout Funds:Intl n 37.12 -0.07 -0.7 69.1SmCap n 16.11 0.22 -8.7 24.3
US Global Investors:Estn Europ pn 47.00 2.12 -5.8 140.7GlbRs n 18.82 0.97 7.5 140.1WldPrecMinr n 25.03 1.09 -4.6 161.6
USAA Group:AgvGt n 34.86 -0.39 -7.9 24.1BalStra n 13.86 -0.04 -2.7 14.6CA Bd n 10.54 0.07 0.7 9.0CapGr n 8.59 -0.01 -4.2 52.5CrnstStr n 23.86 -0.02 -3.3 24.6EmgMkt n 24.13 -0.34 -1.5 114.1GNMA n 9.76 0.02 2.8 15.9Grwth n 16.60 -0.08 -8.4 25.6Gr&Inc n 16.20 -0.13 -5.4 23.9HYldOpp n 8.11 0.00 -1.1 16.6Inco n 12.16 0.06 2.2 14.1IncStk n 13.94 -0.33 -5.9 16.3
Intl n 27.04 -0.28 -1.5 55.1IntTerBd n 9.64 0.05 -0.5 10.4IntmTerm n 12.78 0.07 0.9 9.7LgTerm n 13.21 0.08 0.5 8.5PrecMM n 34.85 2.16 7.2 201.7S&PIdx n 20.83 -0.36 -4.8 24.1S&PReward n 20.83 -0.37 -4.8 24.4ShtT n 10.59 0.02 1.7 10.5ShtTBndA n 8.88 0.03 0.8 13.7SmCpStk n 12.33 -0.03 -6.3 19.6VA Bd n 11.08 0.08 0.7 8.4ValueFd n 13.66 -0.20 -5.7 18.5WldGr n 19.69 -0.30 -3.1 43.7
VVALIC:
FrgnVal 12.39 -0.25 -5.2 NSGlobStr 12.75 -0.04 -1.0 NSIntlEq 10.27 -0.05 -4.4 NAIntlGro 12.91 -0.03 -3.1 62.2IntlSmCpEq 16.69 0.18 -3.6 51.3LgCpGro 12.18 -0.08 -6.2 27.5MidCpIdx 23.10 0.09 0.0 35.0MidCpVal 16.13 -0.19 -6.9 26.7SciTech 13.92 -0.05 -5.3 31.1SmCpIdx 15.19 -0.11 -5.6 22.9SocAware 19.94 -0.19 -2.6 25.9SocResp 12.14 -0.17 -3.2 24.6StckIdx 34.26 -0.61 -4.9 23.5ValUltra 10.91 -0.06 -4.7 NS
Value Line Fd:¡EmerOpp pn 32.38 -0.12 -4.8 33.8¡PreGro n 28.52 -0.11 -2.9 45.1Van Eck Funds:
GlHardA 55.62 2.93 14.6 182.1IInvGldA 18.45 0.98 3.7 192.4
Van Kampen Funds A:AmValA p 26.77 -0.31 -4.4 39.3CmstA p 16.14 -0.50 -6.2 12.4CpBdA p 6.42 0.04 -0.3 11.6EmgMktA p 24.61 -0.26 -6.2 134.2EntA p 14.81 -0.09 -6.0 23.7EqIncA p 8.43 -0.11 -3.9 20.1GlobFranch p 25.35 0.12 -3.6 35.3GrIncA p 20.02 -0.45 -5.3 22.6GvScA p 9.80 0.04 -1.2 10.5HYMuA p 10.18 0.04 -0.8 10.6InTFA p 16.83 0.12 -1.6 2.7MidCpGwth p 27.85 -0.18 -3.2 58.0MunInA p 13.67 0.09 -0.6 6.3PaceA p 12.97 -0.13 -2.7 50.1ReEstA p 19.85 -0.74 7.5 41.3StrGrwth p 48.30 -0.50 -2.9 30.7StrMuniInc p 12.01 0.03 -1.5 6.7US MortgA p 12.88 0.00 -0.7 11.0
Van Kampen Funds B:CmstB t 16.15 -0.49 -6.2 10.3EqIncB t 8.28 -0.11 -3.8 18.0GlobFranch p 24.47 0.11 -3.6 33.0GrIncB t 19.87 -0.44 -5.3 22.0HYMuB t 10.18 0.04 -1.1 8.2StrGwth t 40.51 -0.41 -3.0 28.0
Van Kampen Funds C:CmstC t 16.14 -0.50 -6.5 9.9EqIncC t 8.31 -0.11 -4.1 17.4GrIncC t 19.85 -0.45 -5.5 20.0HYMuC t 10.17 0.04 -1.0 8.2
VANGUARD ADMIRAL:500Adml n 128.05 -2.26 -4.8 24.6AssetAdml n 64.15 -1.15 -4.7 26.4BalAdml n 21.51 -0.14 -1.7 23.1CAITAdml n 10.87 0.05 1.1 10.5CALTAdml n 11.27 0.06 0.3 10.1CapOpAdml nr 82.98 -0.22 -2.4 44.3EMAdmr n 42.20 -0.65 -3.2 NSEnergyAdml nr 167.68 7.11 11.0 133.0EqIncAdml n 48.15 -1.21 -5.1 26.8EuropeAdml n 89.81 -0.70 -3.9 60.6ExplrAdml n 62.09 -0.03 -6.3 24.7ExtndAdml n 38.62 -0.02 -3.2 33.0FLLTAdml n 11.36 0.06 0.9 11.5GNMAAdml n 10.43 0.02 2.4 17.0GroIncAdml n 50.37 -0.69 -3.7 21.9GrwthAdml n 32.00 -0.20 -3.5 29.7HlthCareAdml nr 52.66 -0.88 -9.0 15.9HYCorAdml nr 5.83 -0.03 1.6 17.9InfProAd 25.17 0.33 4.2 NSIntlGrAdml n 76.76 -0.66 -2.8 66.3ITBondAdml n 10.60 0.06 2.7 16.9ITIGradeAdml n 9.73 0.06 1.8 15.0ITsryAdml n 11.54 0.08 3.5 20.0LTGradeAdml n 8.83 0.07 -0.5 9.2LTsryAdml n 11.54 0.10 2.1 17.8MidCpAdml n 91.25 -0.05 -2.8 35.4MorgAdml n 57.95 -0.07 -4.4 34.2MuHYAdml n 10.43 0.05 0.5 11.2MuInLTAdml n 12.24 0.06 0.4 11.1MuIntAdml n 13.24 0.06 1.4 11.7MuLTAdml n 11.01 0.06 0.9 11.6MuLtdAdml n 10.84 0.02 1.7 11.3MuShtAdml n 15.75 0.01 1.6 11.1NJLTAdml n 11.58 0.06 0.6 11.4NYLTAdml n 10.98 0.05 0.7 10.5PacifAdml n 82.19 -0.92 -1.3 45.8PALTAdml n 10.98 0.05 0.3 10.4PrmcpAdml nr 74.29 -0.30 -0.6 41.5REITAdml nr 92.60 -3.20 6.9 35.2SmCapAdml n 31.58 -0.14 -3.1 28.5STBondAdml n 10.23 0.04 2.5 16.1STFedAdml n 10.66 0.03 2.5 16.8STIGradeAdml n 10.61 0.04 1.3 15.1STsryAdml n 10.75 0.04 2.6 17.1TotBdAdml n 10.21 0.04 2.2 16.3TotStAdml n 33.63 -0.47 -4.4 27.0TxMCapAdml nr 67.74 -0.90 -4.2 27.7TxMgIAdml nr 62.25 -1.10 -4.8 24.7USGroAdml n 48.44 -0.39 -6.0 24.3ValAdml n 24.29 -0.61 -5.7 23.9WdsrIIAdml n 52.33 -1.10 -5.7 21.1WellsIAdml n 52.00 -0.35 -0.6 20.2
Net YTD 3-YrNAV Chg % Ret % Ret
Net YTD 3-YrNAV Chg % Ret % Ret
Net YTD 3-YrNAV Chg % Ret % Ret
Net YTD 3-YrNAV Chg % Ret % Ret
Mutual Funds
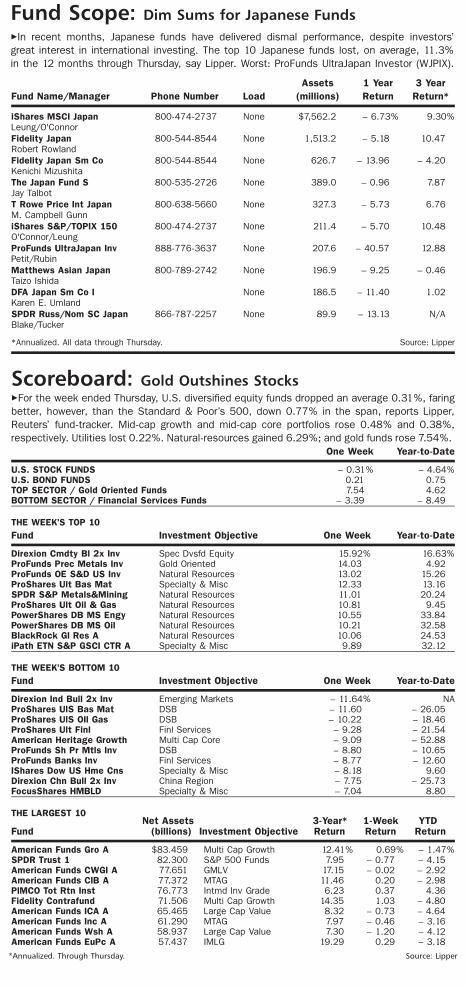
Scoreboard: Gold Outshines StockszFor the week ended Thursday, U.S. diversified equity funds dropped an average 0.31%, faringbetter, however, than the Standard & Poor’s 500, down 0.77% in the span, reports Lipper,Reuters’ fund-tracker. Mid-cap growth and mid-cap core portfolios rose 0.48% and 0.38%,respectively. Utilities lost 0.22%. Natural-resources gained 6.29%; and gold funds rose 7.54%.
One Week Year-to-Date
U.S. STOCK FUNDS – 0.31% – 4.64%U.S. BOND FUNDS 0.21 0.75TOP SECTOR / Gold Oriented Funds 7.54 4.62BOTTOM SECTOR / Financial Services Funds – 3.39 – 8.49
THE WEEK'S TOP 10Fund Investment Objective One Week Year-to-Date
Direxion Cmdty Bl 2x Inv Spec Dvsfd Equity 15.92% 16.63%ProFunds Prec Metals Inv Gold Oriented 14.03 4.92ProFunds OE S&D US Inv Natural Resources 13.02 15.26ProShares Ult Bas Mat Specialty & Misc 12.33 13.16SPDR S&P Metals&Mining Natural Resources 11.01 20.24ProShares Ult Oil & Gas Natural Resources 10.81 9.45PowerShares DB MS Engy Natural Resources 10.55 33.84PowerShares DB MS Oil Natural Resources 10.21 32.58BlackRock Gl Res A Natural Resources 10.06 24.53iPath ETN S&P GSCI CTR A Specialty & Misc 9.89 32.12
THE WEEK'S BOTTOM 10Fund Investment Objective One Week Year-to-Date
Direxion Ind Bull 2x Inv Emerging Markets – 11.64% NAProShares UlS Bas Mat DSB – 11.60 – 26.05ProShares UlS OIl Gas DSB – 10.22 – 18.46ProShares Ult Finl Finl Services – 9.28 – 21.54American Heritage Growth Multi Cap Core – 9.09 – 52.88ProFunds Sh Pr Mtls Inv DSB – 8.80 – 10.65ProFunds Banks Inv Finl Services – 8.77 – 12.60IShares Dow US Hme Cns Specialty & Misc – 8.18 9.60Direxion Chn Bull 2x Inv China Region – 7.75 – 25.73FocusShares HMBLD Specialty & Misc – 7.04 8.80
THE LARGEST 10Net Assets 3-Year* 1-Week YTD
Fund (billions) Investment Objective Return Return Return
American Funds Gro A $83.459 Multi Cap Growth 12.41% 0.69% – 1.47%SPDR Trust 1 82.300 S&P 500 Funds 7.95 – 0.77 – 4.15American Funds CWGI A 77.651 GMLV 17.15 – 0.02 – 2.92American Funds CIB A 77.372 MTAG 11.46 0.20 – 2.98PIMCO Tot Rtn Inst 76.773 Intmd Inv Grade 6.23 0.37 4.36Fidelity Contrafund 71.506 Multi Cap Growth 14.35 1.03 – 4.80American Funds ICA A 65.465 Large Cap Value 8.32 – 0.73 – 4.64American Funds Inc A 61.290 MTAG 7.97 – 0.46 – 3.16American Funds Wsh A 58.937 Large Cap Value 7.30 – 1.20 – 4.12American Funds EuPc A 57.437 IMLG 19.29 0.29 – 3.18
*Annualized. Through Thursday. Source: Lipper
Fund Scope: Dim Sums for Japanese FundszIn recent months, Japanese funds have delivered dismal performance, despite investors’great interest in international investing. The top 10 Japanese funds lost, on average, 11.3%in the 12 months through Thursday, say Lipper. Worst: ProFunds UltraJapan Investor (WJPIX).
Assets 1 Year 3 YearFund Name/Manager Phone Number Load (millions) Return Return*
iShares MSCI Japan 800-474-2737 None $7,562.2 – 6.73% 9.30%Leung/O'ConnorFidelity Japan 800-544-8544 None 1,513.2 – 5.18 10.47Robert RowlandFidelity Japan Sm Co 800-544-8544 None 626.7 – 13.96 – 4.20Kenichi MizushitaThe Japan Fund S 800-535-2726 None 389.0 – 0.96 7.87Jay TalbotT Rowe Price Int Japan 800-638-5660 None 327.3 – 5.73 6.76M. Campbell GunniShares S&P/TOPIX 150 800-474-2737 None 211.4 – 5.70 10.48O'Connor/LeungProFunds UltraJapan Inv 888-776-3637 None 207.6 – 40.57 12.88Petit/RubinMatthews Asian Japan 800-789-2742 None 196.9 – 9.25 – 0.46Taizo IshidaDFA Japan Sm Co I None 186.5 – 11.40 1.02Karen E. UmlandSPDR Russ/Nom SC Japan 866-787-2257 None 89.9 – 13.13 N/ABlake/Tucker
*Annualized. All data through Thursday. Source: Lipper
May 12, 2008 B A R R O N ' S M55