commitment to corrosion monitoring year 2006
TRANSCRIPT

Annual Report to Alaska Department of Environmental Conservation
Commitment to Corrosion Monitoring Year 2006
Prepared by
Corrosion, Inspection and Chemicals (CIC) Group BP Exploration (Alaska), Inc.
March 2007

This page is intentionally blank

Commitment to Corrosion Monitoring
Year 2006


- i -
Foreword This is the seventh annual report that meets the commitment made by BPXA to the State of Alaska to provide a regular review of BPXA's corrosion monitoring and management practices for non-common carrier pipelines on the North Slope. The contents of this report reflect the Work Plan1 agreed jointly between BPXA, Phillips and ADEC, the Guide for Performance Metric Reporting2, and feedback from previous ADEC reports. The report is divided into 2 main parts.
Part 1 contains information regarding the BPXA operated fields within the Greater Prudhoe Bay (GPB) Business Unit. This consists principally of fluids produced from Prudhoe Bay, Lisburne, Point McIntyre and Niakuk field areas but also includes smaller volumes of fluids from satellite accumulations.
Part 2 contains information regarding the BPXA operated fields within the Alaska Consolidated Team (ACT) Business Unit. This consists principally of fluids from Endicott, Badami, Milne Point and Northstar field areas. As with GPB, several smaller satellite accumulations are also produced through ACT facilities.
The report provides an overview of the corrosion management process, and provides data and discussion of the corrosion control, monitoring, inspection and fitness-for-service programs. These individual programs, in concert, form the core of the integrity/corrosion management system designed to deliver our corporate goal of no accidents, no harm to people and no damage to the environment3.
Two events occurred during 2006; the March leak in the WOA oil transit line and the August leak in the EOA oil transit line. As a result of these two events, there were numerous opportunities to explain the corrosion program to stakeholders over the past year. Similar to past reports, this annual report does not provide significant detail about leaks. However, it is important to note the enormous level of activity required to address these two leaks affected several metrics and the delivery of certain core programs discussed herein. While this report does not describe the oil transit line leaks or subsequent inspection activities, those data were provided to ADEC as they became available.
Despite the two oil transit line leaks, the corrosion management program reflects the core values of BP: innovation, performance driven, environmental leadership and progressive.
Innovation is evident in several areas, from the development of more effective corrosion inhibitors and corrosion inhibition programs, to the application of new inspection technologies. These innovations are only made possible by working closely with partners, major suppliers and the regulatory community, to bring the best available technology to Alaskan oilfields.
Performance management and the drive for improved performance are central to all aspects of the corrosion management program. This report demonstrates an on-going effort to improve corrosion management. Since 1992, corrosion rates have been reduced by almost a factor of 10 in the cross-country pipelines that transport a mixture of oil, 1 Appendix 2 (a) 2000 Work Plan 2 Appendix 2 (b) Guide for Performance Metric Reporting 3 BP HSE Policy Statement, EJP Browne, Group CEO, January, 1999, http://www.bp.com/

- ii -
water and gas (3-phase). Consistent with the pledge to report openly both good and bad performance, the report highlights areas for improvement and the plans in-place to deliver performance improvement.
Environmental protection and corrosion management are closely linked. The improvements in corrosion management have resulted in lower corrosion rates and a lower risk of loss of containment. Opportunities to improve environmental performance still exist and the investment in several pipeline replacement projects is but one example of the continued emphasis in this area. .
Progressive evolution of the corrosion management programs is an on-going activity driven by changing field conditions and the desire to improve performance. Progress involves the continued refinement of the existing programs, but also, the development and implementation of new programs and corrosion management technologies.
The current corrosion management process has delivered a significantly improved level of corrosion control. Notwithstanding the successes, the corrosion management program must remain focused on the future in order to maintain the current level of control and, where necessary, implement the actions necessary to improve performance.
The continuous improvement of the corrosion management programs has enabled BPXA to deliver the programs strategic objectives of:
• Minimizing the health, safety and environmental impacts of loss of containment due to corrosion
• Providing a fit-for-service infrastructure for the remainder of field life
• Producing satellite accumulations through existing equipment and pipe-work
• Providing an infrastructure capable of supporting gas sales in the future
In addition, with the information in this report, BPXA intends to build a healthy relationship with the North Slope stakeholders through consultation, open reporting and striving to raise the standards of the industry.
BP Exploration (Alaska) Inc. March 2007

- iii -
Table of Contents
Foreword...................................................................................... i
Table of Contents.........................................................................iii Table of GPB Figures............................................................................................. vi Table of ACT Figures ............................................................................................ vii Table of Appendix Figures .................................................................................... vii Table of GPB Tables .............................................................................................viii Table of ACT Tables .............................................................................................. ix Table of Appendix Tables ...................................................................................... ix Section A Charter Agreement – Corrosion Related Commitments ...........................3
Section A.1 Project Achievements............................................................................ 3 Section A.2 Annual Charter Timetable ...................................................................... 4
Part 1 – Greater Prudhoe Bay Performance Unit.............................. 5
Section B 2006 Corrosion Program Summary........................................................7 Section B.1 Introduction ......................................................................................... 7 Section B.2 Corrosion Related Leaks ........................................................................ 7 Section B.3 Corrosion Monitoring............................................................................. 7 Section B.4 Corrosion Mitigation/Corrosion Inhibition ................................................ 9 Section B.5 External Inspection Program.................................................................. 9 Section B.6 Cased Pipe Program............................................................................ 10 Section B.7 Internal Inspection Program ................................................................ 11
Section C Weight Loss Coupons and ER Probes ..................................................15 Section C.1 Three Phase Production Systems.......................................................... 16
Section C.1.1 Introduction.................................................................................... 16 Section C.1.2 Cross Country Flow Line Coupons ..................................................... 17 Section C.1.3 Well Line Coupons........................................................................... 19
Section C.2 Water Injection Systems ..................................................................... 19 Section C.2.1 Water Injection System Flow Lines.................................................... 20 Section C.2.2 Produced Water Injection Well Lines ................................................. 20 Section C.2.3 Seawater Injection Well Lines........................................................... 22
Section C.3 Electrical Resistance Probes................................................................. 24 Section C.4 1992 to Date Summary ....................................................................... 26
Section C.4.1 System by System Summary ............................................................ 26 Section D Chemical Optimization Activities..........................................................35
Section D.1 Chemical Optimization......................................................................... 35 Section D.2 Corrosion Inhibitor Testing .................................................................. 35 Section D.3 Field Wide Corrosion Inhibitor Deployment............................................ 36 Section D.4 Corrosion Inhibitor Usage and Concentration......................................... 36 Section D.5 Corrosion Inhibition and Corrosion Rate Correlation ............................... 38 Section D.6 Chemical Optimization Summary .......................................................... 40
Section E External/Internal Inspection ...............................................................43 Section E.1 External Inspection ............................................................................. 43

- iv -
Section E.1.1 External Inspection Program Results ................................................. 44 Section E.1.2 Cased Piping Survey Results ............................................................. 45 Section E.1.3 Excavation History ........................................................................... 46
Section E.2 Internal Inspection Program Results..................................................... 47 Section E.3 Correlation between Inspection and Corrosion Monitoring ...................... 48 Section E.4 In-line Inspection ............................................................................... 50 Section E.5 Internal/External Inspection Comparison .............................................. 51 Section E.6 Inspection Summary ........................................................................... 54
Section F Repair Activities .................................................................................65 Section G Corrosion and Structural Related Spills and Incidents ...........................73
Section G.1 Corrosion Related Leaks ...................................................................... 73 Section G.2 Structural Integrity Issues ................................................................... 76
Section G.2.1 Walking Speed Survey ..................................................................... 76 Section G.2.2 Routine Surveillance ........................................................................ 77
Section H Corrosion Monitoring and Inspection Goals ..........................................81 Section H.1 2005 Corrosion and Inspection Goals Reviewed..................................... 81
Section H.1.1 Corrosion Monitoring ....................................................................... 81 Section H.1.2 Inspection Programs........................................................................ 81 Section H.1.3 Chemical Optimization ..................................................................... 82 Section H.1.4 Program Reviews ............................................................................ 82 Section H.1.5 2006 Corrective Actions ................................................................... 82
Section H.2 2007 Corrosion Management Goals ...................................................... 83 Section H.2.1 Corrosion Monitoring ....................................................................... 83 Section H.2.2 Inspection Programs........................................................................ 84 Section H.2.3 Chemical Optimization ..................................................................... 84
Part 2 – Alaska Consolidated Team Performance Unit.................... 85
Section B Corrosion Monitoring Activities ............................................................87 Section B.1 Endicott ............................................................................................. 88 Section B.2 Milne Point ......................................................................................... 89 Section B.3 Northstar ........................................................................................... 90 Section B.4 Badami .............................................................................................. 90 Section B.5 Overall Inspection Activity Level........................................................... 91
Section C Weight Loss Coupons .........................................................................92 Section C.1 Endicott ............................................................................................. 92 Section C.2 Milne Point ......................................................................................... 93 Section C.3 Northstar ........................................................................................... 94 Section C.4 Badami .............................................................................................. 95
Section D Corrosion Mitigation Activities .............................................................96 Section D.1 Endicott ............................................................................................. 96 Section D.2 Milne Point ......................................................................................... 97 Section D.3 Northstar ........................................................................................... 99 Section D.4 Badami .............................................................................................. 99
Section E External/Internal Inspection ............................................................. 100 Section E.1 External Inspection ............................................................................100
Section E.1.1 Endicott.........................................................................................100 Section E.1.2 Milne Point.....................................................................................100 Section E.1.3 Badami..........................................................................................101 Section E.1.4 Northstar .......................................................................................101

- v -
Section E.2 Internal Corrosion Inspection..............................................................101 Section E.2.1 Endicott.........................................................................................101 Section E.2.2 Milne Point.....................................................................................103 Section E.2.3 Badami..........................................................................................105 Section E.2.4 Northstar .......................................................................................106
Section F Repair Activities ............................................................................... 108 Section G Corrosion and Structural Related Spills and Incidents ......................... 109 Section H 2007 Corrosion Monitoring and Inspection Goals................................ 111
Section H.1 Endicott ............................................................................................111 Section H.2 Milne Point ........................................................................................111 Section H.3 Northstar ..........................................................................................111 Section H.4 Badami .............................................................................................111
Appendix 1 ...............................................................................113
Glossary of Terms .............................................................................................. 115
Appendix 2 ...............................................................................117
2000 Work Plan ................................................................................................. 119 Guide for Performance Metric Reporting .............................................................. 123
Appendix 3 ...............................................................................129
Appendix 3 Corrosion Management System ..................................................... 131 Appendix 3.1 Corrosion Management System...........................................................131 Appendix 3.1.1 Description......................................................................................131 Appendix 3.1.2 Process...........................................................................................132 Appendix 3.1.3 Objectives and Targets.....................................................................133 Appendix 3.1.4 Implementation ...............................................................................133 Appendix 3.1.5 Evaluation.......................................................................................133 Appendix 3.1.6 Corrective Action .............................................................................134 Appendix 3.2 Corrosion and Inspection Data Management ........................................135 Appendix 3.2.1 MIMIR Database..............................................................................135 Appendix 3.2.2 Historical Data.................................................................................136 Appendix 3.3 Corrosion Management Context ..........................................................136 Appendix 3.3.1 ER Probe and Corrosion Inhibitor Response ......................................136 Appendix 3.3.2 Corrosion Inhibitor Development......................................................138 Appendix 3.3.3 Internal Inspection Program – Scope................................................141 Appendix 3.3.4 Corrosion Under Insulation ..............................................................142 Appendix 3.3.5 Fitness for Service Assessment ........................................................143 Appendix 3.3.6 In-line Inspection ...........................................................................147

- vi -
Table of GPB Figures
GPB FIGURE C.1 CORROSION MONITORING ACTIVITY STATISTICS BY EQUIPMENT................................... 16 GPB FIGURE C.2 FLOW LINE OIL SERVICE CORROSION RATE TREND................................................... 17 GPB FIGURE C.3 CORRELATION BETWEEN FLOW LINE CORROSION RATE AND PERCENTAGE CONFORMANCE.... 18 GPB FIGURE C.4 FLOW LINE OIL SERVICE WLC HISTOGRAM ............................................................ 18 GPB FIGURE C.5 WELL LINE OIL SERVICE CORROSION RATE TREND ................................................... 19 GPB FIGURE C.6 FLOW LINE PW/SW SERVICE CORROSION RATE TREND............................................. 20 GPB FIGURE C.7 CORROSION RATES FOR 100% PW SYSTEM........................................................... 21 GPB FIGURE C.8 CORROSION RATES FOR MAJORITY PW SYSTEM....................................................... 22 GPB FIGURE C.9 CORROSION RATE FOR 100% SEAWATER SYSTEM.................................................... 23 GPB FIGURE C.10 CORROSION RATES FOR MAJORITY SW SYSTEM..................................................... 23 GPB FIGURE C.11 FLOW LINE CORROSION COUPON SUMMARY BY EQUIPMENT AND SERVICE ..................... 26 GPB FIGURE C.12 WELL LINE AVERAGE CORROSION RATE SUMMARY BY EQUIPMENT AND SERVICE ............. 27 GPB FIGURE C.13 WELL LINE %<2 MPY SUMMARY BY EQUIPMENT AND SERVICE ................................... 27 GPB FIGURE C.14 WLC CORROSION RATE DIFFERENCE BY SERVICE AND TYPE ...................................... 28 GPB FIGURE D.1 NUMBER OF WELL LINE AND FLOW LINE TESTS........................................................ 35 GPB FIGURE D.2 FIELD WIDE CHEMICAL USAGE............................................................................ 38 GPB FIGURE D.3 AVERAGE CORROSION RATE VERSUS INHIBITOR CONCENTRATION................................. 39 GPB FIGURE D.4 CORROSION INHIBITOR CONCENTRATION VS. AVERAGE CORROSION RATE ...................... 39 GPB FIGURE E.1 EXTERNAL CORROSION ACTIVITY AND DETECTION SUMMARY ....................................... 44 GPB FIGURE E.2 FLOW LINE INTERNAL INSPECTION INCREASE BY SERVICE ........................................... 47 GPB FIGURE E.3 WELL LINE INTERNAL INSPECTION INCREASE BY SERVICE ........................................... 48 GPB FIGURE E.4 CORRELATION OF CORROSION RATE AND %INCREASES, 3-PHASE PRODUCTION ................ 50 GPB FIGURE E.5 INTERNAL AND EXTERNAL INSPECTION ACTIVITY FOR TRANSIT, FLOW AND WELL LINES ...... 52 GPB FIGURE E.6 INTERNAL AND EXTERNAL INSPECTION ACTIVITY SUMMARY BY FLOW/WELL LINE .............. 53 GPB FIGURE F.1 REPAIRS BY SERVICE ........................................................................................ 66 GPB FIGURE F.2 REPAIRS BY DAMAGE MECHANISM ........................................................................ 66 GPB FIGURE F.3 REPAIRS BY EQUIPMENT .................................................................................... 67 GPB FIGURE G.1 HISTORICAL CORROSION/MECHANICAL LEAKS AND SAVES BY LINE TYPE......................... 75 GPB FIGURE G.2 HISTORICAL CORROSION/MECHANICAL LEAKS AND SAVES .......................................... 75

- vii -
Table of ACT Figures
ACT FIGURE C.1 ENDICOTT CORROSION COUPON SUMMARY............................................................. 92 ACT FIGURE C.2 MPU CORROSION COUPON SUMMARY .................................................................. 93 ACT FIGURE D.1 ENDICOTT IIWL UT READINGS........................................................................... 96 ACT FIGURE D.2 MILNE POINT PRODUCED WATER CORROSION RATE TREND ........................................ 98 ACT FIGURE E.1 ENDICOTT WELL LINE INTERNAL INSPECTION INCREASES...........................................102 ACT FIGURE E.2 ENDICOTT FLOW LINE INTERNAL INSPECTION INCREASES ..........................................103 ACT FIGURE E.3 MPU FLOW LINE INTERNAL INSPECTION INCREASES.................................................104 ACT FIGURE E.4 MPU WELL LINE INTERNAL INSPECTION INCREASES.................................................105
Table of Appendix Figures FIGURE 1 OVERVIEW OF THE CORROSION MANAGEMENT PROCESS......................................................132 FIGURE 2 CORROSION INHIBITOR CONCENTRATION VS. CORROSION RATE............................................137 FIGURE 3 ER PROBE CHEMICAL OPTIMIZATION TEST......................................................................140 FIGURE 4 CORROSION COUPONS PULLED AFTER AN 'UNSUCCESSFUL' CHEMICAL TRIAL ...............................141 FIGURE 5 MAOP VERSUS REMAINING WALL THICKNESS ..................................................................145 FIGURE 6 FITNESS-FOR-SERVICE ENVELOPE BASED ON BP SPC-PP-00090..........................................147 FIGURE 7 FACILITY SCHEMATIC ................................................................................................161 FIGURE 8 MAP OF NORTH SLOPE ..............................................................................................163

- viii -
Table of GPB Tables GPB TABLE C.1 CORROSION MONITORING LOCATIONS BY EQUIPMENT AND SERVICE ............................... 15 GPB TABLE C.2 BIOCIDE TREATMENT CONCENTRATION AND INTERVAL ................................................ 24 GPB TABLE C.3 ACTIVE ER PROBE LOCATIONS ............................................................................. 25 GPB TABLE C.4 NUMBER OF ER PROBES >2 MPY AND ACTIONED ....................................................... 25 GPB TABLE C.5 WLC CORROSION RATE DIFFERENCE BY SERVICE AND TYPE ......................................... 28 GPB TABLE C.6 FLOW AND WELL LINE GENERAL CORROSION RATE DATA SUMMARY................................ 29 GPB TABLE C.7 FLOW AND WELL LINE PITTING RATE DATA SUMMARY ................................................ 31 GPB TABLE D.1 SUMMARY OF THE CHEMICAL DEPLOYMENT HISTORY .................................................. 36 GPB TABLE D.2 SUMMARY OF THE CHEMICAL USAGE HISTORY........................................................... 37 GPB TABLE E.1 CUI INSPECTIONS BY SERVICE TYPE, 1995-2006 ..................................................... 43 GPB TABLE E.2 EXTERNAL CORROSION ACTIVITY AND DETECTION SUMMARY ........................................ 44 GPB TABLE E.3 CASED PIPE SURVEY RESULTS .............................................................................. 46 GPB TABLE E.4 COMPLETED SMART PIG ASSESSMENTS.................................................................... 51 GPB TABLE E.5 INTERNAL AND EXTERNAL INSPECTION ACTIVITY BREAKDOWN ....................................... 52 GPB TABLE E.6 INTERNAL AND EXTERNAL INSPECTION ACTIVITY SUMMARY BY TRANSIT, FLOW & WELL LINE. 53 GPB TABLE E.7 TRANSIT, FLOW AND WELL LINE INSPECTION DATA.................................................... 55 GPB TABLE E.8 CASED PIPING EXCAVATION HISTORY ..................................................................... 57 GPB TABLE F.1 REPAIR ACTIVITY .............................................................................................. 65 GPB TABLE G.1 LEAKS DUE TO CORROSION/MECHANICAL ................................................................ 73 GPB TABLE G.2 HISTORICAL CORROSION/MECHANICAL LEAKS AND SAVES............................................ 74 GPB TABLE G.3 STRUCTURAL/WALKING SPEED SURVEY SCHEDULE ..................................................... 76 GPB TABLE H.1 COUPON PULL FREQUENCY .................................................................................. 81 GPB TABLE H.2 CORRECTIVE MITIGATION ACTIONS FROM INSPECTION DATA ........................................ 82 GPB TABLE H.3 CORRECTIVE MITIGATION ACTIONS FROM ER PROBE DATA .......................................... 83 GPB TABLE H.4 CORRECTIVE MITIGATION ACTIONS FROM COUPON DATA ............................................ 83

- ix -
Table of ACT Tables
ACT TABLE B.1 RELATIVE CORROSIVITY OF BPXA NORTH SLOPE PRODUCTION...................................... 88 ACT TABLE B.2 ILLUSTRATIVE COMPARISON OF SCALE BETWEEN ACT AND GPB..................................... 88 ACT TABLE B.3 ENDICOTT SUMMARY OF LINES AND NDE INSPECTIONS ............................................... 89 ACT TABLE B.4 MPU SUMMARY OF LINES AND NDE INSPECTIONS ..................................................... 90 ACT TABLE B.5 NORTHSTAR SUMMARY OF LINES AND NDE INSPECTIONS............................................. 90 ACT TABLE B.6 BADAMI SUMMARY OF LINES AND NDE INSPECTIONS .................................................. 91 ACT TABLE B.7 OVERALL INSPECTION ACTIVITY SUMMARY ............................................................... 91 ACT TABLE C.1 ENDICOTT CORROSION COUPON MONITORING .......................................................... 92 ACT TABLE C.2 MPU CORROSION COUPON MONITORING ................................................................ 93 ACT TABLE C.3 NORTHSTAR CORROSION COUPON MONITORING, 2006............................................... 94 ACT TABLE D.1 ENDICOTT VELOCITY MONITORING ........................................................................ 97 ACT TABLE E.1 CASED PIPING INSPECTIONS ...............................................................................100 ACT TABLE E.2 MPU EXTERNAL INSPECTION SUMMARY FOR ABOVE-GROUND PIPING .............................101 ACT TABLE E.3 INSPECTION SUMMARY OF BADAMI WELL LINES........................................................104 ACT TABLE E.4 INSPECTION SUMMARY OF BADAMI WELL LINES........................................................106 ACT TABLE E.5 INSPECTION SUMMARY OF NORTHSTAR ..................................................................107 ACT TABLE F.1 ACT REPAIR ACTIVITY ......................................................................................108 ACT TABLE G.1 ENDICOTT LEAK/SAVE AND MECHANICAL REPAIR DATA ..............................................109 ACT TABLE G.2 MILNE POINT LEAK/SAVE & MECHANICAL REPAIR DATA .............................................109 ACT TABLE G.3 NORTHSTAR LEAK/SAVE AND MECHANICAL REPAIR DATA ............................................110 ACT TABLE G.4 BADAMI LEAK/SAVE AND MECHANICAL REPAIR DATA .................................................110
Table of Appendix Tables TABLE 1 CORROSION MANAGEMENT PROCESS...............................................................................133 TABLE 2 CORROSION MANAGEMENT FEEDBACK CYCLES ...................................................................134 TABLE 3 DATABASE RECORD ACCUMULATION RATE ........................................................................136 TABLE 4 CORROSION INHIBITOR CONCENTRATION VS. CORROSION RATE .............................................137 TABLE 5 SUMMARY DESCRIPTION OF THE TYPICAL TEST PROGRAM COMPONENTS ...................................139 TABLE 6 FLOW LINE TEST PROGRAM RESULT SUMMARY...................................................................140 TABLE 7 CUI INCIDENT RATE BY JOINT TYPE ...............................................................................143 TABLE 8 THICKNESS, MAOP CORRELATION .................................................................................146 TABLE 9 CORROSION MANAGEMENT SYSTEM ................................................................................149 TABLE 10 CORROSION MANAGEMENT SYSTEM ELEMENT – MONITORING ..............................................150 TABLE 11 MONITORING PROGRAM TECHNIQUES............................................................................154 TABLE 12 CORROSION MONITORING TECHNIQUES – BENEFITS AND LIMITATIONS...................................157 TABLE 13 PROCESS MONITORING TECHNIQUES – BENEFITS AND LIMITATIONS.......................................157 TABLE 14 INSPECTION/NON-DESTRUCTIVE EXAMINATION TECHNIQUES – BENEFITS AND LIMITATIONS.........158 TABLE 15 CORROSION MANAGEMENT SYSTEM IMPLEMENTATION BY EQUIP TYPE AND SERVICE...................160 TABLE 16 BPXA NORTH SLOPE OPERATIONS ...............................................................................166


Section A
Charter Agreement – Corrosion Related Commitments


Section A Charter Agreement – Corrosion Related Commitments
- 3 -
Section A Charter Agreement – Corrosion Related Commitments The BPXA contact for all corrosion matters relating to the Charter Agreement is,
Bill Hedges, Corrosion Strategy and Planning Manager
E-mail:[email protected]
Phone: (907) 564-4466
Section A.1 Project Achievements
Oct-Nov 2000 Work Plan agreed between BPXA/PAI and ADEC (Appendix 2a)
March 2001 1st Annual Report submitted to ADEC
April 2001 1st 2001 Meet and Confer session held
Oct-Dec 2001 Consultations with ADEC and ADEC's consultant
November 2001 2nd 2001 Meet and Confer session held
Dec 01-Jan 02 Developed and agreed corrosion management metrics
February 2002 BPXA/PAI and ADEC agreed on performance metrics (Appendix 2b)
March 2002 2nd Annual Report submitted to ADEC
April 2002 1st 2002 Meet and Confer session held
November 2002 2nd 2002 Meet and Confer session held
March 2003 3rd Annual Report submitted to ADEC
May 2003 1st 2003 Meet and Confer session held
October 2003 2nd 2003 Meet and Confer session held
March 2004 4th Annual Report submitted to ADEC
April 2004 1st 2004 Meet and Confer session held
August 2004 North Slope Field Trip
March 2005 5th Annual Report submitted to ADEC
May 2005 1st 2005 Meet and Confer session held
August 2005 North Slope Field Trip
March 2006 6th Annual Report submitted to ADEC

- 4 -
May 2006 1st 2006 Meet and Confer session held
November 2006 2nd 2006 Meet and Confer session held
March 2007 7th Annual Report submitted to ADEC
Section A.2 Annual Charter Timetable
March 31st Annual Report submitted
April 30th 1st Semi-Annual Review/Meet and Confer
October 31st 2nd Semi-Annual Review/Meet and Confer

Part 1 – Greater Prudhoe Bay Business Unit
Section B
2006 Corrosion Program Summary


SECTION B 2006 Corrosion Program Summary
- 7 -
Section B 2006 Corrosion Program Summary
Section B.1 Introduction
This section provides a summary of key performance indicators (KPI) for 2006. Additional information regarding the Corrosion Management System and historical program data and development are shown in subsequent sections of the report.
Section B.2 Corrosion Related Leaks
A measure of corrosion management program efficacy is the number of corrosion related leaks with the ultimate goal of zero.
Target: Zero
KPI: Number of Leaks
Section Reference:
Section G Corrosion and Structural Related Spills and Incidents
1. There were 2 corrosion related leaks in the processed oil transit system.
2. There were 4 corrosion related leaks in the seawater system.
3. There was 1 corrosion related leak in the produced water system.
4. There were 0 corrosion related leaks in the 3-phase oil system.
5. There was 1 corrosion related leak in the gas lift system
Section B.3 Corrosion Monitoring
The plan and objective for corrosion monitoring is to measure the effectiveness of the mitigation programs. The primary monitoring techniques are intrusive weight loss coupons (WLC) and Electrical Resistance Probes (ER Probe) which provide the feedback for corrective action when control targets are exceeded.
Program: Weight Loss Coupon
Target: <2 mils per year (mpy)
KPI: % Conformance WLC <2 mpy
Section Reference: Section C Weight Loss Coupons and ER Probes
1. 7,192 coupons were utilized to monitor the effectiveness of the mitigation programs.

Part 1 – Greater Prudhoe Bay Business Unit
- 8 -
2. 3-phase flow line WLC data showed 99% less than 2 mpy with an average corrosion rate of 0.20 mpy.
3. Water injection flow line (produced and seawater) WLC data showed 87% less than 2 mpy with an average corrosion rate of 1.12 mpy.
4. Processed oil flow line WLC data showed 97% less than 2 mpy with an average corrosion rate of 0.20 mpy.
5. 3-phase well line WLC data showed 97% less than 2 mpy with an average corrosion rate of 0.38 mpy.
6. Majority service produced water well line WLC showed 100% less than 2 mpy and average corrosion rate of 0.10 mpy.
7. 100% produced water service well line WLC showed 100% less than 2 mpy and average corrosion rate of 0.10 mpy.
8. Majority service seawater well line WLC showed 99% less than 2 mpy and average corrosion rate of 0.45 mpy.
9. 100% seawater service well line WLC showed 99% less than 2 mpy and average corrosion rate of 0.45 mpy.
Program: Electrical Resistance Probe
Target: <2 mils per year (mpy)
KPI: Conformance <2 mpy
Section Reference: Section C.3 Electrical Resistance Probes
10. 3-phase flow line ER Probes showed 87% of the data was <2 mpy.
The monitoring data for the majority of the 3-phase production system demonstrate an effective level of corrosion control as direct result of the mitigation programs. In fact, the results for this year are best ever.
The monitoring data for the water injection system suggests an effective level of corrosion control although a long-term trend in correlation with inspection data continues to be evaluated.
Section B.4 Corrosion Mitigation/Corrosion Inhibition
The plan and objective for corrosion mitigation is to control corrosion rates to acceptable levels. For internal corrosion control, the principal means of mitigation is through the application of corrosion inhibitors.

SECTION B 2006 Corrosion Program Summary
- 9 -
Program: Corrosion Mitigation – Corrosion Inhibitor (CI)
Target: Control corrosion to acceptable levels
KPI: Monitoring <2 mpy and inspection percent of increases,
Target versus actual CI usage, injection volumes (ppm)
Section Reference: Section D Chemical Optimization Activities
1. The field wide average inhibitor concentration increased from 147 to 160 ppm. This is due in large part to the facility shutdowns that occurred in March and August.
2. The corrosion inhibitor usage was 2.05 million gallons (winter equivalent) which was delivered at 99.3% of target.
The effectiveness of corrosion mitigation, as a result of the application of corrosion inhibition, is determined from corrosion monitoring and inspection programs. Corrosion monitoring data are a leading indicator and inspection data are a lagging indicator of corrosion mitigation efforts. There is a strong correlation between monitoring and inspection data, which gives confidence mitigation with corrosion inhibition can be managed in a timely manner using monitoring data.
Section B.5 External Inspection Program
The plan and objectives for the external corrosion program are comprehensive inspection coverage of equipment susceptible to corrosion under insulation (CUI), minimize loss as a result of external corrosion failures and assure the equipment is fit-for-service (FFS) and safe to operate.
Program: Corrosion Under Insulation
Target: 40,000 inspections/year
KPI: % of locations inspected with external corrosion,
Leak/Save ratio
Section Reference: Section E.1 External Inspection
1. There were 30,470 external corrosion inspections completed, 8% were found with corrosion degradation.
2. There were 40 mechanical repairs identified as a result of external corrosion.
3. There was 1 leak due to external corrosion on a gas well line

Part 1 – Greater Prudhoe Bay Business Unit
- 10 -
4. The Leak/Save ratio for the External Corrosion (CUI) Program was 98%.
Unlike internal corrosion, where mitigation can be managed through chemical inhibition, mechanical cleaning and/or operational controls; CUI is managed through detection and repair. Once CUI has been found through inspection activities, locations are scheduled for insulation and by-product removal, fit-for-service assessment, mechanical repair if needed and rehabilitation of the insulation system. The 2006 external program completed 30,470 inspections with a corrosion find rate of 8%, effectively double the recent historical annual rate. However, the 40 mechanical repairs are lower than the average annual count over the previous three years.
Section B.6 Cased Pipe Program
The plan and objective for the cased pipe program is best available inspection assessment of cased pipe segments at road and/or animal crossings where historically the prominent mechanism has been external corrosion. The excavation of crossings, as required, is performed to mitigate active corrosion and assure the equipment is fit-for-service and safe to operate.
Program: Cased Pipe Inspection
Target: 125 inspection/yr
KPI: Increases or active corrosion determined from repeat examinations.
Section Reference: Section E.1.2 Cased Piping Survey Results
1. Fifty-nine cased piping segments were re-inspected using ILI and/or guided-wave inspection techniques.
2. Eight of the inspections indicate active corrosion.
3. Fifteen cased pipe segments were excavated and inspected. Corrosion damage was found in 13 segments of which 3 were cut out and removed.
A long-term cased piping management strategy has been implemented, consisting of repeat inspection and excavations. The strategy will continue to evolve as the program is refined and more information is available. In 2006, the number of inspected segments did not meet the target. This is the second consecutive year that activity levels have fallen short of plan. Cased pipe activity and assessment methodology is recognized as an area for improvement.
Section B.7 Internal Inspection Program
The plan and objective for the internal program is widespread inspection coverage of equipment susceptible to internal degradation including; the assessment of mechanisms

SECTION B 2006 Corrosion Program Summary
- 11 -
and rate of wastage in order to minimize loss as a result of failures and assure the equipment is fit-for-service and safe to operate.
Program: Internal Inspection Program
Target: 60,000 inspections/yr split between Field (~25,000) and Facility (~35,000) equipment
KPI: % of locations inspected with increased metal loss,
Leak/Save ratio
Section Reference: Section E.2 Internal Inspection Program Results
1. There were 9,922 inspections on 3-phase flow lines, with 4% showing an increase.
2. There were 5,978 inspections on 3-phase well lines, with 3% showing an increase.
3. There were 2,079 inspections on water injection flow lines, with 9% showing an increase.
4. There were 1,775 inspections on water injection well lines, with 10% showing an increase.
5. There were 25,296 inspections on processed oil transit lines, with 9% showing an increase.
6. There were 123 mechanical repairs identified as a result of internal corrosion.
7. There were 7 leaks due to internal corrosion; 2 processed oil, 4 in seawater and 1 in produced water service.
8. The Leak/Save ratio for the Internal Inspection Program was 95%.
For 3-phase production, flow line inspection increase data show an increasing trend in active corrosion, while the well line inspection increases are consistent at 3-5% for the past 6 years. The majority of increases, 75%, are attributed to two pipeline systems which were consequently shut-in.
For the water injection systems, both flow and well lines show an increase in corrosion activity in 2006.
For the processed oil transit lines, the large number of inspections was unplanned. Two corrosion failures in March and August led to the shut-in of 2 major pipeline segments. As a result, a tremendous amount of inspection activity was directed on similar service transit lines.

Section C
Weight Loss Coupons and Probes


Section C Weight Loss Coupons and ER Probes
- 15 -
Section C Weight Loss Coupons and ER Probes This section summarizes the results of the weight loss coupon corrosion monitoring and ER probe programs. Each of the major service categories are reviewed in turn with the results of the program.
The number of weight loss coupon (WLC) monitoring locations by equipment type and service, is summarized in GPB Table C.1. The number of WLC processed over time is presented in GPB Figure C.1.
Detailed data tables for each configuration of equipment type are provided in GPB Table C.6 and GPB Table C.7.
Service 1995 1996 1997 1998 1999 2000 2001 2002 2003 2004 2005 2006
3 Phase Oil 219 315 268 272 266 254 256 257 255 242 235 182Processed Oil 3 7 7 5 5 6 4 6 5 5 5 6Gas 3 3 1 1 1 0 0 0 1 0 0 0Other 5 6 5 7 6 5 6 6 3 5 4 3Water 36 37 45 43 46 45 44 44 48 38 31 38Total 266 368 326 328 324 310 310 313 312 290 275 229
3 Phase 1,047 1,168 1,216 1,202 1,166 1,162 1,081 1,096 1,105 1,062 1,048 1,056Processed Oil 0 3 3 3 3 3 3 0 2 0 0 0Gas 6 7 7 7 6 6 7 6 5 4 2 1Other 8 9 9 7 8 8 6 8 8 6 4 10Water 199 210 211 205 193 186 186 191 173 151 166 156Total 1,260 1,397 1,446 1,424 1,376 1,365 1,283 1,301 1,293 1,223 1,220 1,223
Grand Total 1,526 1,765 1,772 1,752 1,700 1,675 1,593 1,614 1,605 1,513 1,495 1,452
Flow Line
Well Line
GPB Table C.1 Corrosion Monitoring Locations by Equipment and Service
Two corrosion coupons are typically recovered for each WLC pull with the exception of those lines that are regularly maintenance pigged where single flush mounted coupons are installed. The number of coupons, coupons per pull, and pull frequency continue to be adjusted through time to gain greater value from the data obtained by the program.
As discussed in prior reports, there has been a gradual reduction in the number of weight loss coupons being evaluated, which reflects the on-going effort to optimize the program. Following the rationalization in 2000/01, the level of WLC activity has stabilized at ~7,500 coupons per year. The number of weight loss coupons reported for 2006 does not reflect the inventory of coupons that are installed in the system at year-end and still to be 'processed.' The reduction in 2006 coupon numbers therefore represents a timing effect and not a reduction in the program scope or activity level.

Part 1 – Greater Prudhoe Bay Business Unit
- 16 -
0
2,000
4,000
6,000
8,000
10,000
12,000
1995 1996 1997 1998 1999 2000 2001 2002 2003 2004 2005 2006
Wei
ght
Loss
Cou
pons
per
Yea
r
Flow Line WLC Activity Well Line WLC Activity Average WLC Activity
GPB Figure C.1 Corrosion Monitoring Activity Statistics by Equipment
Section C.1 Three Phase Production Systems
Section C.1.1 Introduction
The primary corrosion mechanism of concern in the 3-phase production system is CO2 corrosion, in which CO2 from the produced fluids dissolves and dissociates in the produced water to form an acidic environment that is, if untreated, corrosive to carbon steel4,5. The primary corrosion control method is the continuous addition of corrosion inhibitor in the flow lines and a mix of continuous and batch inhibitor additions in the well lines. For the 3-phase production system the target corrosion rate from weight loss coupons is a general corrosion rate of 2 mpy or less (WLC ≤2 mpy).
The 3-phase production system has seen a consistently strong improvement in corrosion control since the early 1990's with a near order of magnitude reduction in the cross-country flow line corrosion rates. This reduction in corrosion rate is a direct result of the implementation of an aggressive corrosion mitigation program consisting primarily of continuous addition of corrosion inhibitor into the production fluids. This mitigation program has been implemented at considerable capital and operating expense but has resulted in flow lines which are now expected to be fit-for-service (FFS) for approximately 10 times as long as that expected in the early 1990's due to the reduction in corrosion rate. The correlation between corrosion inhibitor concentration and corrosion rates in 3-phase flow lines is discussed in detail in Section D. A similar reduction is also seen in the inspection history discussed later in Section E.
4 Corrosion Control in Petroleum Production, Harry G Byers, NACE, 1999 5 Corrosion Control in Oil and Gas Production, Treseder and Tuttle, NACE, 1998

Section C Weight Loss Coupons and ER Probes
- 17 -
Section C.1.2 Cross Country Flow Line Coupons
GPB Figure C.2 shows the average corrosion rate and percentage of coupons meeting the performance standard target since 1992. The results show the percentage of conformant flow lines has improved consistently over the last decade. The average corrosion rate for 2006 across GPB is approximately a factor of 10 lower than the corrosion rates from the early 1990's and represent best ever performance.
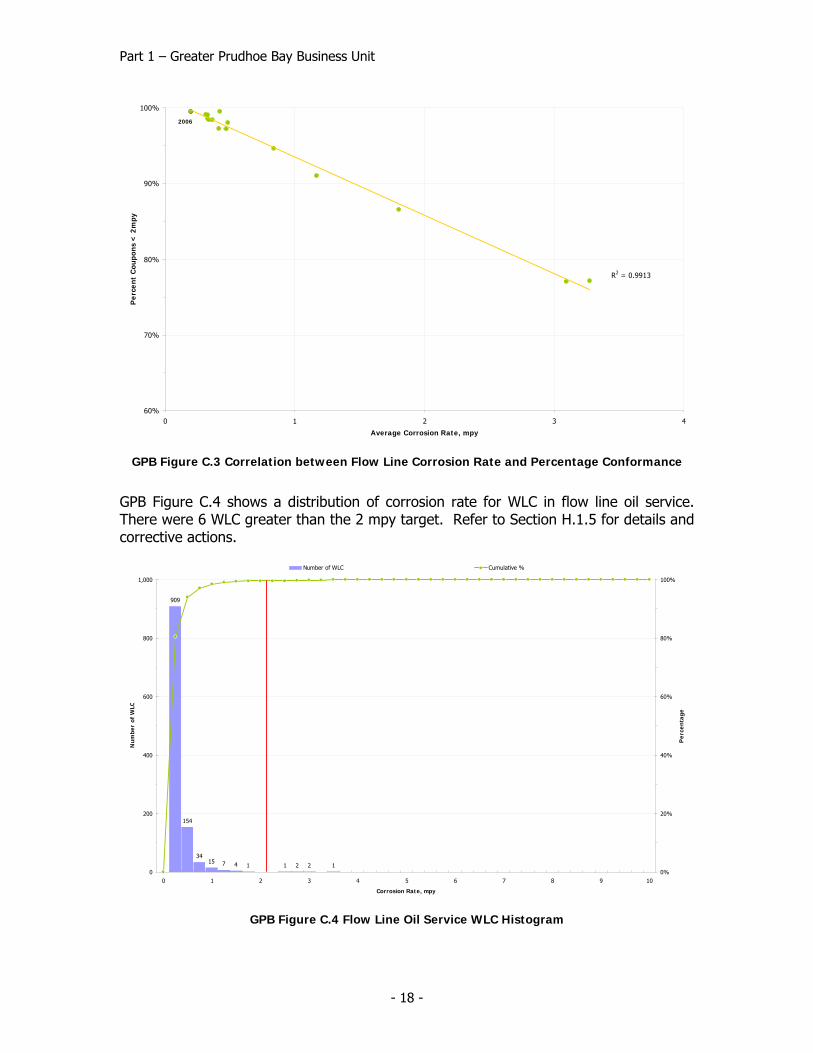
GPB Figure C.3 shows the correlation between average corrosion rate and the percentage of weight loss coupons meeting the 2 mpy target. As might be expected, there is a very strong correlation between these two metrics. However, they should be viewed as being complementary. The percentage less than 2 mpy target has the advantage of highlighting non-conformances that would otherwise be lost in the calculation of the average.
Conversely, the average corrosion rate has the advantage of showing the overall performance trend that would otherwise be lost when only looking at the exceptions >2 mpy. Hence, it is necessary to review both metrics in order to gain an overall understanding of the performance of the program.
0
1
2
3
4
1992 1993 1994 1995 1996 1997 1998 1999 2000 2001 2002 2003 2004 2005 2006
Ave
rage
Cor
rosi
on R
ate,
mpy
60%
70%
80%
90%
100%
%W
LC <
2mpy
Ave Rate, mpy % WLC < 2mpy 2mpy Target
GPB Figure C.2 Flow Line Oil Service Corrosion Rate Trend
Part 1 – Greater Prudhoe Bay Business Unit
- 18 -
2006
R2 = 0.9913
60%
70%
80%
90%
100%
0 1 2 3 4
Average Corrosion Rate, mpy
Per
cent
Cou
pons
< 2
mpy
GPB Figure C.3 Correlation between Flow Line Corrosion Rate and Percentage Conformance
GPB Figure C.4 shows a distribution of corrosion rate for WLC in flow line oil service. There were 6 WLC greater than the 2 mpy target. Refer to Section H.1.5 for details and corrective actions.
909
154
3415 7 4 1 1 2 2 1
0
200
400
600
800
1,000
0 1 2 3 4 5 6 7 8 9 10
Corrosion Rate, mpy
Num
ber
of W
LC
0%
20%
40%
60%
80%
100%
Per
cent
age
Number of WLC Cumulative %
GPB Figure C.4 Flow Line Oil Service WLC Histogram

Section C Weight Loss Coupons and ER Probes
- 19 -
Section C.1.3 Well Line Coupons
GPB Figure C.5 shows the average corrosion rate and percentage of WLC ≤2 mpy since 1992. The trends are very similar to those seen in the cross-country 3-phase oil flow lines, showing a long-term improvement in the level of control from early 1990's to the present day with a slight decrease in performance from 2003 to 2005. This decrease in performance was largely due to chemical deployment problems discussed in previous reports. 2006 results demonstrate best ever performance.
0
1
2
3
4
5
1992 1993 1994 1995 1996 1997 1998 1999 2000 2001 2002 2003 2004 2005 2006
Ave
rage
Cor
rosi
on R
ate,
mpy
50%
60%
70%
80%
90%
100%
% W
LC <
2mpy
Ave Rate, mpy % WLC < 2mpy 2mpy Target
GPB Figure C.5 Well Line Oil Service Corrosion Rate Trend
The long term corrosion control improvement in the well lines is of the same magnitude as that seen in the flow lines with corrosion rates being reduced from an average >4 mpy in 1993 down to an average of 0.5 to 0.8 mpy over the past six years.
Section C.2 Water Injection Systems
The Water Injection System at GPB is comprised of produced water from the primary processing/separation facilities and seawater extracted from the Beaufort Sea and processed through the Seawater Treatment Plant (STP). During 2006, the average seawater injection volumes was just over 746 Mbpd
As noted in the 2002 Report, the production database has now been linked to the corrosion and inspection database. This dynamic link provides a much more detailed view of service history/changes for the well line equipment, enabling an improved level of data analysis and quality.
The reporting format, which augments the performance metrics and was agreed with ADEC, can be summarized as follows:
Report Date Mid point of the WLC’s exposure period,

Part 1 – Greater Prudhoe Bay Business Unit
- 20 -
2
)InDateOutDate(InDateDateMid
−+=
Service Type (a) Average corrosion rate with 100% exposure to service
(b) Average corrosion rate with simple service majority
Section C.2.1 Water Injection System Flow Lines
GPB Figure C.6 is a summary of aggregate data for produced water and seawater flow lines. The data show the 2006 WLC corrosion rates show a decrease in performance over last year, but comparable to the last three years.
0
2
4
6
8
10
1992 1993 1994 1995 1996 1997 1998 1999 2000 2001 2002 2003 2004 2005 2006
Ave
rage
Cor
rosi
on R
ate,
mpy
0%
20%
40%
60%
80%
100%
% W
LC <
2mpy
Ave Rate, mpy % WLC < 2mpy 2mpy Target
GPB Figure C.6 Flow Line PW/SW Service Corrosion Rate Trend
Section C.2.2 Produced Water Injection Well Lines
There are a number of corrosion mechanisms of concern in the produced water (PW) injection system. These mechanisms include CO2 corrosion and differential concentration effects due to the high particulate content of the system. The particulates consist primarily of residual hydrocarbon remaining after the separation process, entrained production chemicals, and iron sulfides.
GPB Figure C.7 and GPB Figure C.8 summarizes the historical corrosion rate data for produced water well lines. The data show general corrosion rates in the produced water system have fallen as the level of inhibition in the 3-phase system was increased and supplemental produced water corrosion inhibitor injection was initiated.
Section C Weight Loss Coupons and ER Probes
- 21 -
0
2
4
6
8
10
1992 1993 1994 1995 1996 1997 1998 1999 2000 2001 2002 2003 2004 2005 2006
Ave
rage
Cor
rosi
on R
ate,
mpy
0%
20%
40%
60%
80%
100%
% W
LC <
2mpy
Ave Rate, mpy % WLC < 2mpy 2mpy Target
GPB Figure C.7 Corrosion Rates for 100% PW System
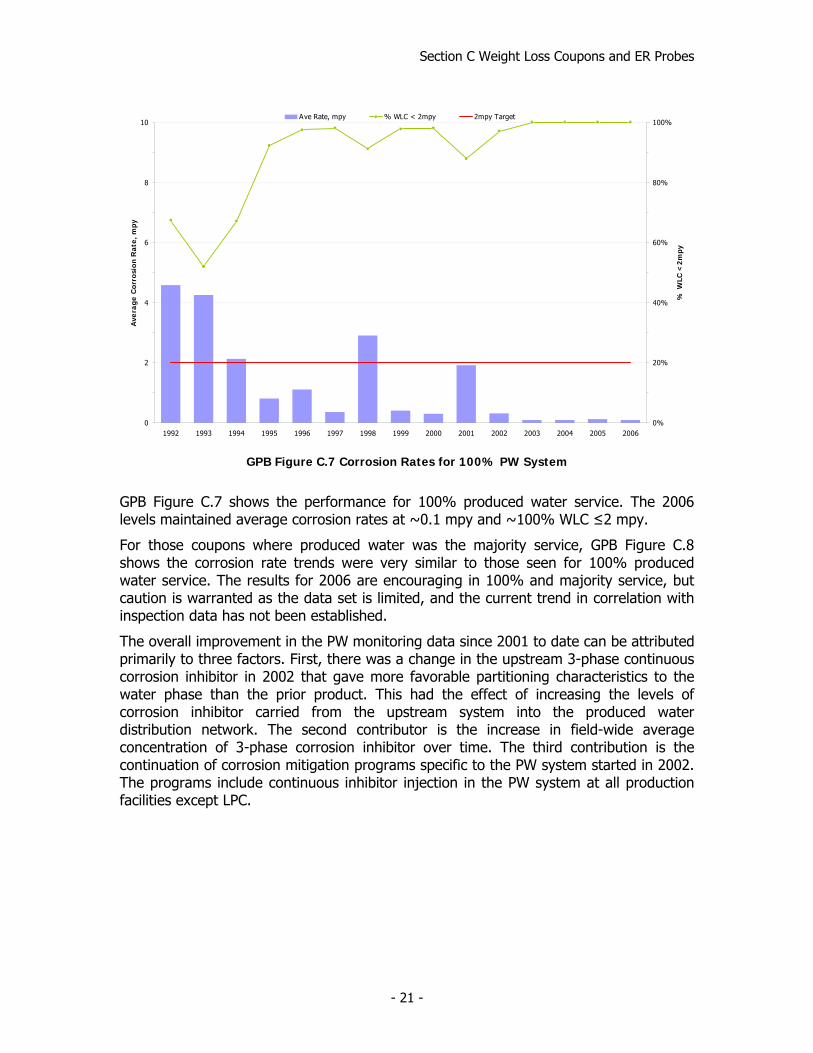
GPB Figure C.7 shows the performance for 100% produced water service. The 2006 levels maintained average corrosion rates at ~0.1 mpy and ~100% WLC ≤2 mpy.
For those coupons where produced water was the majority service, GPB Figure C.8 shows the corrosion rate trends were very similar to those seen for 100% produced water service. The results for 2006 are encouraging in 100% and majority service, but caution is warranted as the data set is limited, and the current trend in correlation with inspection data has not been established.
The overall improvement in the PW monitoring data since 2001 to date can be attributed primarily to three factors. First, there was a change in the upstream 3-phase continuous corrosion inhibitor in 2002 that gave more favorable partitioning characteristics to the water phase than the prior product. This had the effect of increasing the levels of corrosion inhibitor carried from the upstream system into the produced water distribution network. The second contributor is the increase in field-wide average concentration of 3-phase corrosion inhibitor over time. The third contribution is the continuation of corrosion mitigation programs specific to the PW system started in 2002. The programs include continuous inhibitor injection in the PW system at all production facilities except LPC.

Part 1 – Greater Prudhoe Bay Business Unit
- 22 -
0
2
4
6
8
10
1992 1993 1994 1995 1996 1997 1998 1999 2000 2001 2002 2003 2004 2005 2006
Ave
rage
Cor
rosi
on R
ate,
mpy
0%
20%
40%
60%
80%
100%
% W
LC <
2mpy
Ave Rate, mpy % WLC < 2mpy 2mpy Target
GPB Figure C.8 Corrosion Rates for Majority PW System
Section C.2.3 Seawater Injection Well Lines
The main corrosion mechanisms in the seawater (SW) injection systems are,
• Dissolved oxygen (DO) corrosion – This mechanism is mitigated by processing the seawater to remove the oxygen. Initial DO removal is achieved mechanically by vacuum stripping, which is then followed by chemical oxygen scavenging.
• Microbiological corrosion (MIC) – MIC is due to the action of anaerobic bacteria, and is mitigated by batch treatment with biocide, after processing to remove DO and prior to seawater transfer to the main cross country flow lines.
As with the PW system, the SW system data are presented as both 100% and majority service for the well line data, along with a comparison of general corrosion rates and pitting corrosion rates.
GPB Figure C.9 and GPB Figure C.10 show the corrosion rate trends in the SW system for both 100% SW service and majority SW service. For the 100% SW service, the improvement since 2002 is a result of implementation of the corrective actions outlined in previous reports.

Section C Weight Loss Coupons and ER Probes
- 23 -
0
5
10
15
20
1992 1993 1994 1995 1996 1997 1998 1999 2000 2001 2002 2003 2004 2005 2006
Ave
rage
Cor
rosi
on R
ate,
mpy
0%
25%
50%
75%
100%
% W
LC <
2mpy
Ave Rate, mpy % WLC < 2mpy 2mpy Target
GPB Figure C.9 Corrosion Rate for 100% Seawater System
0
5
10
15
20
1992 1993 1994 1995 1996 1997 1998 1999 2000 2001 2002 2003 2004 2005 2006
Ave
rage
Cor
rosi
on R
ate,
mpy
0%
25%
50%
75%
100%
% W
LC <
2mpy
Ave Rate, mpy % WLC < 2mpy 2mpy Target
GPB Figure C.10 Corrosion Rates for Majority SW System
GPB Table C.2 summarizes the changes in the biocide treatment program for the SW system. Biocide dosage was increased in Mar-03 by 50% at STP to increase the

Part 1 – Greater Prudhoe Bay Business Unit
- 24 -
effectiveness in downstream parts of the seawater system. This action decreased the downstream coupon corrosion rates faster than expected. In Dec-03, the glutaraldehyde/quaternary amine biocide was replaced temporarily with glutaraldehyde. In Oct-04, the biocide was switched back to glutaraldehyde/quaternary amine.
From To ppm Intervaldays Product
Jan-97 Jul-97 750 7 Glutaraldehyde
Jul-97 Feb-00 750 14 Glutaraldehyde
Feb-00 Aug-01 450 14 Glutaraldehyde/quaternary amine blend
Aug-01 Jul-02 500 14 Glutaraldehyde/quaternary amine blend
Jul-02 Dec-02 500 7 Glutaraldehyde/quaternary amine blend
Dec-02 Mar-03 500 7 Glutaraldehyde/quaternary amine blend
Mar-03 Dec-03 750 7 Glutaraldehyde/quaternary amine blend
Dec-03 Oct-04 750 7 Glutaraldehyde
Oct-04 Present 750 7 Glutaraldehyde/quaternary amine blend
GPB Table C.2 Biocide Treatment Concentration and Interval
In summary, the corrosion monitoring data suggest progress has been made in returning the seawater system to control. However as with the produced water system, the data are limited and caution is warranted.
Section C.3 Electrical Resistance Probes
ER probes are installed in various locations to monitor corrosion rates in flow lines throughout GPB. ER probes measure a change in resistance due to material loss from corrosion and the measurements are converted to provide corrosion rates in mils per year. ER probes are equipped with remote data collectors (RDC), which measure and record the metal loss data every 4 hours. This provides an adequate number of data points to assess corrosion rates while maximizing battery life in the units.
The typical ER probe used is a T-10 that has 5 mils (0.005") of usable metal thickness. All flow line ER probes are replaced based on a 1-year service life, or when one half the usable metal thickness has been consumed. This reduces false negative and false positive readings as a result of damaged or unresponsive probes.
ER probes are located on both the upstream (well pad) end and downstream (gathering center) end of flow lines located on the west side of GPB. On the east side, probes are only located on the downstream (flow station) end of flow lines.
For the electrical resistance (ER) probes, the number of active locations in the flow lines is given in GPB Table C.3.

Section C Weight Loss Coupons and ER Probes
- 25 -
Year Total Probe Locations
2001 83
2002 82
2003 85
2004 87
2005 87
2006 87
GPB Table C.3 Active ER Probe Locations
ER probe data are collected in the field and uploaded to the corrosion and inspection database once per week. The target for ER probe corrosion rate is ≤2 mpy. Each ER probe with a corrosion rate greater than 2 mpy is evaluated to determine data validity. After verifying an increase in corrosion rates based on the probe data and other supporting data, an action is determined. The action is typically a corrosion inhibitor increase, but other types of mitigation may be recommended.
GPB Table C.4 shows the number of probes with corrosion rates greater than target as compared to the number actioned dating back to 2001.
Year Average % <2 mpy
No. ER Probe > 2
No. ER Probes Actioned
2001 97% 193 6
2002 97% 137 6
2003 96%6 138 21
2004 92% 316 59
2005 88% 241 11
2006 87% 232 7
GPB Table C.4 Number of ER Probes >2 mpy and Actioned
The 7 occurrences greater than 2 mpy in 2006 were mitigated with corrosion inhibitor rate increases. The percentage of ER probes actioned is similar to last year. There are a number of probes that have been identified as “chronic offenders”, which is defined as probes with suspect metal loss data due to fluid flow and/or temperature fluctuations
6 Incorrectly reported as 93% in 2003 Report

Part 1 – Greater Prudhoe Bay Business Unit
- 26 -
which cause the calculated corrosion rate for the ER probe to exceed the 2 mpy target. Chronic offenders are evaluated in the same manner as other ER probe data.
Section H.1.5 shows the corrective mitigation actions taken as a result of ER probe readings exceeding target and Appendix 3.3.1 describes by example, the methodology by which corrosion inhibitor concentration is increased as a result of ER probes monitoring.
Section C.4 1992 to Date Summary
Section C.4.1 System by System Summary
This section provides system-by-system summary since 1992 for the major systems at GPB. GPB Figure C.11 shows the WLC corrosion rate and corrosion target conformance since 1992. The high performance in the 3-phase production system has remained essentially unchanged since 2000. The reasons for improvement in the water injection system performance were provided in Section C.2.
GPB Figure C.12 shows the corrosion rate and GPB Figure C.13 shows WLC corrosion conformance for well lines. The well line 3-phase system performance has remained essentially unchanged since 2000. The produced water and seawater well lines corrosion performance has remained essentially consistent since 2002.
0
2
4
6
8
10
1992 1993 1994 1995 1996 1997 1998 1999 2000 2001 2002 2003 2004 2005 2006
Ave
rage
Cor
rosi
on R
ate,
mpy
0%
20%
40%
60%
80%
100%
% W
LC <
2 m
py
Processed Oil Ave CR 3-Phase Oil Ave CR PW/SW Ave CRProcessed Oil %<2 3-Phase Oil %<2 PW/SW %<2
GPB Figure C.11 Flow Line Corrosion Coupon Summary by Equipment and Service

Section C Weight Loss Coupons and ER Probes
- 27 -
0
4
8
12
16
20
1992 1993 1994 1995 1996 1997 1998 1999 2000 2001 2002 2003 2004 2005 2006
Ave
rage
Cor
rosi
on R
ate,
mpy
3-Phase Oil Ave CR SW Ave CR PW Ave CR
GPB Figure C.12 Well Line Average Corrosion Rate Summary by Equipment and Service
0%
20%
40%
60%
80%
100%
1992 1993 1994 1995 1996 1997 1998 1999 2000 2001 2002 2003 2004 2005 2006
% W
LC <
2 m
py
3-Phase Oil %<2 SW %<2 PW %< 2
GPB Figure C.13 Well line %<2 mpy Summary by Equipment and Service
In order to assess the relative performance of the corrosion management program today versus that of the last 13 years, GPB Table C.5 and GPB Figure C.14 were generated as a summary. The data show the difference between the 2005 WLC corrosion rate for

Part 1 – Greater Prudhoe Bay Business Unit
- 28 -
each of the systems and the best, or lowest, WLC corrosion rate and the worst, or highest, WLC corrosion rate observed since 1992. This is an approximate measure of the successes and/or shortcomings of the program today versus the ~13-year history and highlights areas for attention.
-20.00 -15.00 -10.00 -5.00 0.00 5.00 10.00 15.00 20.00
FL 3-Phase Oil Ave CR
FL Water Ave CR
FL Processed Oil Ave CR
WL PW Ave CR
WL SW Ave CR
WL Oil Ave CR
Corrosion Rate Difference, mpy
Difference Between CR 2006 and Best in Last 15 Years Difference Between CR 2006 and Worst in the Last 15 Years
GPB Figure C.14 WLC Corrosion Rate Difference by Service and Type
2006 CR Best (Best – 2006) Worst (Worst – 2006)System mpy mpy mpy mpy Mpy
WL Oil 0.20 0.20 0.00 3.3 3.08
WL SW 0.20 0.08 -0.12 0.6 0.36
WL PW 1.12 0.78 -0.34 7.4 6.27
FL Processed Oil 0.10 0.10 0.00 4.6 4.48
FL Water 0.44 0.30 -0.14 18.2 17.80
FL 3-Phase Oil 0.38 0.38 0.00 4.3 3.93
GPB Table C.5 WLC Corrosion Rate Difference by Service and Type
The results indicate the current level of corrosion control, as determined by weight loss coupons, is at or near the best levels of control for each system.

Section C Weight Loss Coupons and ER Probes
- 29 -
BU Equip Service Metric 1992 1993 1994 1995 1996 1997 1998 1999 2000 2001 2002 2003 2004 2005 2006GPB FL 3-Phase Oil WLC 787 958 998 1,435 1,562 1,607 1,495 1,521 1,451 1,296 1,338 1,321 1,242 1,305 1,130GPB FL 3-Phase Oil Ave CR 3.28 3.10 1.81 1.17 0.84 0.47 0.48 0.31 0.42 0.34 0.33 0.42 0.36 0.33 0.20GPB FL 3-Phase Oil SD CR 8.77 10.53 5.07 5.34 3.93 1.82 3.76 0.57 0.84 0.90 0.67 2.39 0.98 0.51 0.26GPB FL 3-Phase Oil WLC < 2 607 738 864 1306 1478 1562 1466 1507 1411 1275 1325 1315 1222 1286 1124GPB FL 3-Phase Oil % WLC < 2mpy 77% 77% 87% 91% 95% 97% 98% 99% 97% 98% 99% 100% 98% 99% 99%GPB FL PW/SW WLC 81 106 154 198 184 195 171 181 160 131 137 144 119 115 122GPB FL PW/SW Ave CR 3.45 6.58 7.40 3.18 2.73 0.87 1.44 1.41 1.60 1.86 3.11 1.39 0.95 0.78 1.12GPB FL PW/SW SD CR 4.43 9.13 15.37 9.52 6.15 1.77 3.72 2.42 2.78 2.54 5.39 2.52 1.43 1.02 2.44GPB FL PW/SW WLC < 2 43 42 86 162 140 168 139 147 124 89 90 113 104 100 106GPB FL PW/SW %<2mpy 53% 40% 56% 82% 76% 86% 81% 81% 78% 68% 66% 78% 87% 87% 87%GPB FL Processed Oil WLC 16 23 24 34 44 32 34 36 22 28 44 38 42 34GPB FL Processed Oil Ave CR 0.43 0.56 0.13 0.23 0.13 0.16 0.14 0.17 0.08 0.09 0.11 0.09 0.15 0.20GPB FL Processed Oil SD CR 0.41 0.39 0.17 0.29 0.19 0.11 0.05 0.07 0.06 0.03 0.04 0.05 0.15 0.45GPB FL Processed Oil WLC < 2 16 23 24 34 44 32 34 36 22 28 44 38 42 33GPB FL Processed Oil %< 2 mpy 100% 100% 100% 100% 100% 100% 100% 100% 100% 100% 100% 100% 100% 97%GPB WL 3-Phase Oil WLC 6,718 5,584 4,941 5,206 6,549 6,747 6,390 6,183 6,239 4,852 5,273 5,568 5,225 5,413 5,201GPB WL 3-Phase Oil Ave CR 3.45 4.30 2.96 2.76 2.23 0.93 0.71 0.55 0.74 0.64 0.58 0.46 0.58 0.77 0.38GPB WL 3-Phase Oil SD CR 7.86 8.07 4.53 7.01 6.21 2.33 3.67 1.20 1.50 1.61 1.13 1.13 1.41 4.83 0.72GPB WL 3-Phase Oil WLC < 2 4459 3007 2820 3699 4994 5992 6011 5942 5753 4527 4935 5351 4910 5008 5051GPB WL 3-Phase Oil %< 2 mpy 66% 54% 57% 71% 76% 89% 94% 96% 92% 93% 94% 96% 94% 93% 97%GPB WL Majority PW WLC 531 514 662 829 976 1,073 964 740 699 659 422 386 428 432 302GPB WL Majority PW Ave CR 5.82 3.46 1.91 0.80 0.86 0.35 2.44 0.47 0.27 1.43 0.31 0.10 0.14 0.12 0.10GPB WL Majority PW SD CR 12.84 4.81 1.92 1.19 8.68 2.26 12.06 1.64 0.43 8.55 0.92 0.14 0.32 0.14 0.13GPB WL Majority PW WLC < 2 345 307 467 760 947 1047 884 716 690 598 407 386 423 432 302GPB WL Majority PW % WLC <2 mpy 65% 60% 71% 92% 97% 98% 92% 97% 99% 91% 96% 100% 99% 100% 100%GPB WL 100% PW WLC 282 304 286 485 604 717 719 524 459 473 300 318 344 376 272GPB WL 100% PW Ave CR 4.58 4.24 2.12 0.81 1.10 0.35 2.91 0.40 0.30 1.92 0.31 0.10 0.10 0.12 0.10GPB WL 100% PW SD CR 9.25 5.34 2.05 1.19 10.98 2.62 13.66 1.50 0.51 10.05 1.02 0.14 0.08 0.14 0.12GPB WL 100% PW WLC < 2 190 158 192 447 589 703 656 512 450 416 291 318 344 376 272GPB WL 100% PW % WLC < 2mpy 67% 52% 67% 92% 98% 98% 91% 98% 98% 88% 97% 100% 100% 100% 100%GPB WL Majority SW WLC 434 410 382 315 162 56 44 82 98 44 25 19 34 94 105GPB WL Majority SW Ave CR 1.97 13.02 6.55 2.64 3.25 0.65 0.96 1.82 1.78 6.01 6.58 0.74 1.49 0.56 0.45GPB WL Majority SW SD CR 5.48 16.14 7.56 3.87 5.26 1.20 1.14 2.36 2.77 6.88 5.27 0.68 2.72 0.54 0.45GPB WL Majority SW WLC < 2 382 103 133 201 110 53 38 61 78 16 7 18 27 89 104GPB WL Majority SW % WLC < 2mpy 88% 25% 35% 64% 68% 95% 86% 74% 80% 36% 28% 95% 79% 95% 99%GPB WL 100% SW WLC 184 194 174 187 78 52 44 70 86 16 21 19 12 88 101GPB WL 100% SW Ave CR 2.59 18.24 5.74 2.82 2.86 0.68 0.96 1.82 1.89 1.92 7.46 0.74 0.30 0.59 0.44GPB WL 100% SW SD CR 7.13 19.04 8.07 4.45 5.39 1.24 1.14 2.50 2.93 1.07 5.28 0.68 0.27 0.55 0.44GPB WL 100% SW WLC < 2 160 38 79 128 54 49 38 52 68 12 5 18 12 83 100GPB WL 100% SW % WLC < 2mpy 87% 20% 45% 68% 69% 94% 86% 74% 79% 75% 24% 95% 100% 94% 99%
Note: Majority Service data include 100% Service data GPB Table C.6 Flow and Well Line General Corrosion Rate Data Summary

This page is intentionally blank

Section C Weight Loss Coupons and ER Probes
- 31 -
BU Equip Service Metric 1992 1993 1994 1995 1996 1997 1998 1999 2000 2001 2002 2003 2004 2005 2006GPB FL 3-Phase Oil WLC 787 958 998 1,435 1,562 1,607 1,495 1,521 1,451 1,296 1,338 1,321 1,242 1,305 1,130GPB FL 3-Phase Oil Ave P CR 7.29 5.60 4.10 8.90 7.67 6.72 2.91 1.65 1.92 1.28 0.74 0.65 1.24 0.42 0.04GPB FL 3-Phase Oil SD P CR 22.83 15.42 13.30 22.74 14.85 13.85 6.66 6.16 7.71 10.58 3.93 8.32 5.90 2.59 0.73GPB FL 3-Phase Oil P WLC < 20 691 876 946 1,315 1,467 1,552 1,469 1,498 1,418 1,281 1,317 1,319 1,227 1,301 1,130GPB FL 3-Phase Oil % P WLC <20mpy 87.8% 91.4% 94.8% 91.6% 93.9% 96.6% 98.3% 98.5% 97.7% 98.8% 98.4% 99.8% 98.8% 99.7% 100.0%GPB FL PW/SW WLC 81 106 154 198 184 195 171 181 160 131 137 144 119 115 122GPB FL PW/SW Ave P CR 8.53 15.83 17.28 17.03 14.40 15.26 11.36 5.31 6.36 9.37 13.12 7.07 3.04 2.58 4.54GPB FL PW/SW SD P CR 8.49 5.40 8.61 6.60 5.40 4.10 3.01 2.53 2.33 0.91 0.01 0.01 0.00 0.00 0.00GPB FL PW/SW P WLC < 20 66 83 111 150 147 172 156 168 153 112 106 125 119 112 112GPB FL PW/SW % P WLC <20mpy 81.0% 78.0% 72.0% 76.0% 80.0% 88.0% 91.0% 93.0% 96.0% 85.0% 77.0% 87.0% 100.0% 97.0% 92.0%GPB FL Processed Oil WLC 16 23 24 34 44 32 34 36 22 28 44 38 42 34GPB FL Processed Oil Ave P CR 0.50 0.70 1.88 2.56 3.73 2.19 1.26 1.44 1.05 0.77 0.32 0.66 0.00 1.12GPB FL Processed Oil SD P CR 1.15 2.48 3.42 4.64 4.31 5.65 2.43 3.49 3.47 3.92 2.11 2.83 0.00 3.66GPB FL Processed Oil P WLC < 20 16 23 24 34 44 31 34 36 22 26 44 38 42 34GPB FL Processed Oil % P WLC <20mpy 100.0% 100.0% 100.0% 100.0% 100.0% 96.9% 100.0% 100.0% 100.0% 92.9% 100.0% 100.0% 100.0% 100.0%GPB WL 3-Phase Oil WLC 6,718 5,584 4,941 5,206 6,549 6,747 6,390 6,183 6,239 4,852 5,273 5,568 5,225 5,413 5,201GPB WL 3-Phase Oil Ave P CR 7.33 9.36 5.22 11.61 11.90 5.26 3.13 2.78 3.31 1.96 1.71 1.66 1.95 1.69 0.51GPB WL 3-Phase Oil SD P CR 22.56 24.27 14.33 32.50 29.35 14.71 9.05 7.83 10.18 6.43 5.63 5.33 5.78 5.74 2.60GPB WL 3-Phase Oil P WLC < 20 5,799 4,933 4,607 4,550 5,668 6,470 6,235 6,059 6,050 4,749 5,198 5,518 5,130 5,319 5,188GPB WL 3-Phase Oil % P WLC <20mpy 86.3% 88.3% 93.2% 87.4% 86.5% 95.9% 97.6% 98.0% 97.0% 97.9% 98.6% 99.1% 98.2% 98.3% 99.8%GPB WL Majority PW WLC 531 514 662 829 976 1,073 964 740 699 659 422 386 428 432 302GPB WL Majority PW Ave P CR 34.12 24.67 15.84 20.18 15.02 9.65 20.69 8.87 4.65 6.69 3.10 1.03 2.01 1.34 1.15GPB WL Majority PW SD P CR 41.07 31.95 27.13 29.05 29.64 28.96 58.60 26.07 9.75 17.52 9.32 2.98 8.03 3.97 4.41GPB WL Majority PW P WLC < 20 258 294 499 574 802 968 805 674 670 579 412 385 424 430 298GPB WL Majority PW % P WLC < 20mpy 48.6% 57.2% 75.4% 69.2% 82.2% 90.2% 83.5% 91.1% 95.9% 87.9% 97.6% 99.7% 99.1% 99.5% 98.7%GPB WL 100% PW WLC 282 304 286 485 604 717 719 524 459 473 300 318 344 376 272GPB WL 100% PW Ave P CR 4.58 4.24 2.12 0.81 1.10 0.35 2.91 0.40 0.30 1.92 0.31 0.10 0.10 0.12 0.10GPB WL 100% PW SD P CR 9.25 5.34 2.05 1.19 10.98 2.62 13.66 1.50 0.51 10.05 1.02 0.14 0.08 0.14 0.12GPB WL 100% PW WLC < 20 190 158 192 447 589 703 656 512 450 416 291 318 344 376 272GPB WL 100% PW % P WLC <20mpy 67.4% 52.0% 67.1% 92.2% 97.5% 98.0% 91.2% 97.7% 98.0% 87.9% 97.0% 100.0% 100.0% 100.0% 100.0%GPB WL Majority SW WLC 434 410 382 315 162 56 44 82 98 44 25 19 34 94 105GPB WL Majority SW Ave P CR 4.74 17.32 9.50 11.43 16.88 1.50 1.55 5.62 6.61 18.80 30.48 9.11 13.32 2.11 2.88GPB WL Majority SW SD P CR 15.65 44.26 14.23 15.45 23.11 4.52 2.31 8.16 10.40 18.59 28.09 20.21 31.01 4.03 8.98GPB WL Majority SW P WLC < 20 404 320 329 261 115 55 44 80 92 24 14 16 30 94 101GPB WL Majority SW % P WLC < 20mpy 93.1% 78.0% 86.1% 82.9% 71.0% 98.2% 100.0% 97.6% 93.9% 54.5% 56.0% 84.2% 88.2% 100.0% 96.2%GPB WL 100% SW WLC 184 194 174 187 78 52 44 70 86 16 21 19 12 88 101GPB WL 100% SW Ave P CR 5.19 13.31 7.88 9.19 10.10 0.54 1.55 5.24 5.57 9.13 31.62 9.11 9.17 2.01 2.13GPB WL 100% SW SD P CR 18.94 18.79 12.18 13.45 19.87 2.18 2.31 8.49 6.38 7.30 29.49 20.21 21.36 4.03 6.58GPB WL 100% SW P WLC < 20 172 157 154 160 62 52 44 68 82 14 12 16 10 88 99GPB WL 100% SW % P WLC <20mpy 93.5% 80.9% 88.5% 85.6% 79.5% 100.0% 100.0% 97.1% 95.3% 87.5% 57.1% 84.2% 83.3% 100.0% 98.0%
Note: Majority Service data include 100% Service data GPB Table C.7 Flow and Well Line Pitting Rate Data Summary

This page is intentionally blank

Section D
Chemical Optimization Activities


Section D Chemical Optimization Activities
- 35 -
Section D Chemical Optimization Activities
Section D.1 Chemical Optimization
Chemical optimization is an on-going process that encompasses a broad range of activities, from developing new corrosion inhibitors for improved performance, to the allocation of extra chemical for additional corrosion control. The following sections provide an update on chemical development, field wide chemical deployment, chemical usage and finally corrosion control.
Section D.2 Corrosion Inhibitor Testing
GPB Figure D.1 summarizes the number of well line and flow line tests which have been completed since 1996. The level of well line test activity increased beginning in 2003 due to a change in the screening protocol, which reduced the time required per test. The combined number of well line and flow line tests has increased from ~10-14 per year7 to more than 32 during 2006. This level of activity represents a substantial investment of resources towards the development of new and more effective corrosion inhibitors.
0
10
20
30
40
50
60
70
1996 1997 1998 1999 2000 2001 2002 2003 2004 2005 2006
Nu
mbe
r of
Tri
als
Well Line Flow Line
GPB Figure D.1 Number of Well Line and Flow line Tests
One test chemical was planned for a large scale flow line testing. However, the test was delayed. 7 The data prior to 2000 are incomplete and represents the test work completed on the heritage WOA only.

Part 1 – Greater Prudhoe Bay Business Unit
- 36 -
Section D.3 Field Wide Corrosion Inhibitor Deployment
The chemical development and testing program has been highly successful in recent years, with 16 new products being developed for use in the continuous wellhead inhibition program since 1995. All these changes represent a significant improvement in overall corrosion control performance.
GPB Table D.1 summarizes the changes in corrosion inhibitor products since 1995. The table does not include test products which did not make it to field wide usage. In addition, the summary table does not include summer versions of products that differ only in pour point from the winter version shown in the table.
Supplier Chemical 95 96 97 98 99 00 01 02 03 04 05 06
Nalco Exxon EC1110A
Nalco Exxon EC1259
Nalco Exxon 97VD129
Nalco Exxon 98VD118
ONDEO Nalco 99VD049
ONDEO Nalco 01VD017
ONDEO Nalco 01VD121
Nalco DVE4D002
Champion RU205
Champion RU210
Champion RU223
Champion RU258
Champion RU271
Champion RU126A
Champion RU2561
Champion 2004-151 1Used for the batch treatment of well lines while the remaining chemicals are all used for continuous application
GPB Table D.1 Summary of the Chemical Deployment History
Section D.4 Corrosion Inhibitor Usage and Concentration
Another measure of chemical optimization is the amount of corrosion inhibitor used relative to the volume of water produced from the reservoir. GPB Table D.2 summarizes the annual water production, corrosion inhibitor volumes, and concentrations since 1995. The inhibitor volumes are expressed as a 'winter product equivalent', i.e. the lower volumes of highly concentrated chemical used during the summer have been normalized to the winter equivalent.

Section D Chemical Optimization Activities
- 37 -
The concentration of inhibitor in the water phase provides a relative measure of the effectiveness of the chemical used to control corrosion. However, such data can be misleading as the types of corrosion inhibitors used can vary from year to year (GPB Table D.1). As more effective chemicals are developed, volumes and concentrations will change depending on the individual product's performance characteristics. There has also been a shift from batch treatments to continuous injection of chemical at the wellhead. The latter is more efficient in terms of protection achieved per gallon of chemical and therefore lower chemical usage would be expected. However, the ultimate measure of whether or not enough corrosion inhibitor is used can only be determined by consideration of other factors such as corrosion monitoring data and/or the amount of active corrosion detected by the inspection program.
Year H2O Production106 bbl/yr
Water Cut%
CI Usage106 gal/yr
CI Concentration ppm
1995 455 59 1.62 85
1996 460 62 2.05 106
1997 457 62 2.21 115
1998 426 66 2.53 141
1999 416 68 2.28 130
2000 438 70 2.73 148
2001 398 70 2.63 157
2002 407 71 2.45 143
2003 408 72 2.52 147
2004 422 74 2.67 151
2005 431 76 2.66 147
2006 306 74 2.06 160
GPB Table D.2 Summary of the Chemical Usage History
The advances in the development of more effective corrosion inhibitors is counteracted by the increasing water cuts associated with an aging oil field and increased flow velocities due to increased gas rates. These changes generally increase the amount of chemical required to control corrosion. As GPB Figure D.2 shows, the volume of corrosion inhibitor has increased since 1995 while the water volumes have remained relatively constant. The significant increase in concentration is due to the impacts of facility shutdowns in response to the March and August oil transit line leaks.
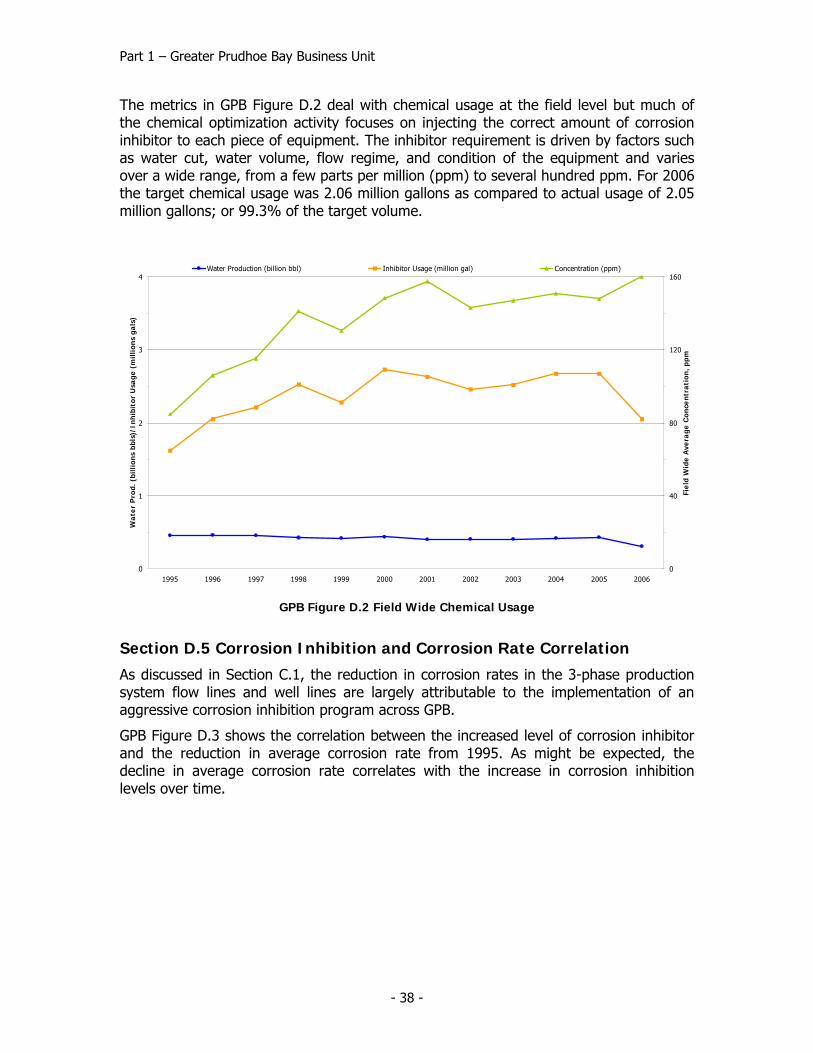
Part 1 – Greater Prudhoe Bay Business Unit
- 38 -
The metrics in GPB Figure D.2 deal with chemical usage at the field level but much of the chemical optimization activity focuses on injecting the correct amount of corrosion inhibitor to each piece of equipment. The inhibitor requirement is driven by factors such as water cut, water volume, flow regime, and condition of the equipment and varies over a wide range, from a few parts per million (ppm) to several hundred ppm. For 2006 the target chemical usage was 2.06 million gallons as compared to actual usage of 2.05 million gallons; or 99.3% of the target volume.
0
1
2
3
4
1995 1996 1997 1998 1999 2000 2001 2002 2003 2004 2005 2006
Wat
er P
rod.
(bi
llion
s bb
ls)/
Inhi
bito
r U
sage
(m
illio
ns g
als)
0
40
80
120
160
Fiel
d W
ide
Ave
rage
Con
cent
rati
on, p
pm
Water Production (billion bbl) Inhibitor Usage (million gal) Concentration (ppm)
GPB Figure D.2 Field Wide Chemical Usage
Section D.5 Corrosion Inhibition and Corrosion Rate Correlation
As discussed in Section C.1, the reduction in corrosion rates in the 3-phase production system flow lines and well lines are largely attributable to the implementation of an aggressive corrosion inhibition program across GPB.
GPB Figure D.3 shows the correlation between the increased level of corrosion inhibitor and the reduction in average corrosion rate from 1995. As might be expected, the decline in average corrosion rate correlates with the increase in corrosion inhibition levels over time.

Section D Chemical Optimization Activities
- 39 -
0.0
0.5
1.0
1.5
2.0
1995 1996 1997 1998 1999 2000 2001 2002 2003 2004 2005 2006
Ave
rage
Cor
rosi
on R
ate,
mpy
0
50
100
150
200
Fiel
dwid
e A
vera
ge C
once
ntra
tion
, ppm
FL Oil Ave CR, mpy Inhibition, ppm
GPB Figure D.3 Average Corrosion Rate versus Inhibitor Concentration
2006
R2 = 0.7764
0.0
0.5
1.0
1.5
2.0
0 50 100 150 200
Inhibitor Concentration, ppm
Ave
rage
Cor
rosi
on R
ate,
mpy
GPB Figure D.4 Corrosion Inhibitor Concentration vs. Average Corrosion Rate
GPB Figure D.4 shows the annual field-wide average corrosion inhibitor concentrations versus annual average corrosion rates for 3-phase production flow lines. The figure shows how additional corrosion inhibitor has reduced the average corrosion rate through

Part 1 – Greater Prudhoe Bay Business Unit
- 40 -
time, but also shows an inherent limitation of corrosion inhibition as the minimum corrosion rate (or maximum corrosion inhibitor efficiency) is approaching an asymptote of ~0.25 mpy.
Section D.6 Chemical Optimization Summary
In summary, chemical optimization covers a number of different areas from chemical testing and development to field-wide deployment of new products delivering improved levels of corrosion control more cost effectively. However, all this activity is ultimately directed toward one end — the reduction in corrosion rate. The effectiveness of the chemical optimization program in delivering improved corrosion rates is clearly demonstrated.

Section E
External/Internal Inspection


Section E External/Internal Inspection
- 43 -
Section E External/Internal Inspection The inspection program encompasses piping, piping components, pressure vessels and tanks across GPB. Radiographic imaging or ultrasonic flaw evaluation makes up the majority of inspection techniques. However, there are specialized techniques in use for specific applications. The details for these techniques are shown in Appendix 3, Table 11.
A number of factors contribute to the selection and allocation of inspection resources including, but not limited to, current equipment condition, current known rate (from inspection or corrosion monitoring) of wastage, operational risks associated with transported fluids, active or passive corrosion mitigation, operation, design and age of the equipment.
Section E.1 External Inspection
This section summarizes the inspections performed to detect external corrosion and the results of those inspections. GPB Table E.1 summarizes the CUI inspection program for the period 1995 to 2006 separated by service and equipment type and the aggregate data. These aggregate data include both baseline and repeat inspections
These data suggest there is some dependence of external corrosion occurrence based on service type. This dependence is driven in part by the difference in operating temperature between services. However, there is as much variability in damage occurrence of insulated pipe susceptible to CUI based on the location and orientation. For additional information about CUI, refer to Appendix 3.3.4.
The CUI program covers all cross-country flow lines and well lines. There are approximately 300,000 weld packs at GPB, of which approximately 200,000 are off-pad and 100,000 are on-pad.
In order to manage CUI, a recurring inspection program has been implemented as the best method to identify equipment and locations susceptible to CUI. Prioritization of inspection surveys is determined by configuration, average temperature of the equipment, age of equipment, health, safety, environment (HSE), and/or the last time a complete inspection was completed. As a result of findings from inspections, the extent or recurring frequency of any additional examinations is determined.
Service # Insp. # Corr % Corr # Insp. # Corr % Corr # Insp. # Corr % Corr
3-Phase Oil 54,178 4,122 8% 62,715 2,453 4% 116,893 6,575 6%Processed Oil 6,469 315 5% - - - 6,469 315 5%
Gas 63,019 4,109 7% 33,042 334 1% 96,061 4,443 5%Other 72 3 4% 1,552 42 3% 1,624 45 3%Water 27,039 1,996 7% 11,898 384 3% 38,937 2,380 6%Total 150,777 10,545 7% 109,207 3,213 3% 259,984 13,758 5%
Transit & Flow Line Well Line Aggregate
GPB Table E.1 CUI Inspections by Service Type, 1995-2006

Part 1 – Greater Prudhoe Bay Business Unit
- 44 -
Section E.1.1 External Inspection Program Results
GPB Table E.2 and GPB Figure E.1 show the number and results of the external corrosion inspections performed since 1995. The data includes all the Tangential Radiographic (TRT) techniques applied to detect external corrosion, including Automated-TRT (ATRT), and C-Arm Fluoroscopy (CTRT).
1995 1996 1997 1998 1999 2000 2001 2002 2003 2004 2005 2006
Well Line
Activity Level - 36 1,677 935 2,376 5,239 12,862 23,969 10,854 13,955 21,344 15,960
Corrosion Detected - 6 234 65 80 244 721 356 140 363 436 568
% Corroded - 17% 14% 7% 3% 5% 6% 1% 1% 3% 2% 4%
Transit & Flow Line
Activity Level 1,498 11,455 17,934 10,289 8,132 5,169 3,966 18,726 24,293 21,155 13,650 14,510
Corrosion Detected 276 824 1,616 751 778 492 155 999 1,449 675 773 1,757
% Corroded 18% 7% 9% 7% 10% 10% 4% 5% 6% 3% 6% 12%
GPB Overall
Activity Level 1,498 11,491 19,611 11,224 10,508 10,408 16,828 42,695 35,147 35,110 34,994 30,470
Corrosion Detected 276 830 1,850 816 858 736 876 1,355 1,589 1,038 1,209 2,325
% Corroded 18% 7% 9% 7% 8% 7% 5% 3% 5% 3% 3% 8% GPB Table E.2 External Corrosion Activity and Detection Summary
0
10,000
20,000
30,000
40,000
50,000
1995 1996 1997 1998 1999 2000 2001 2002 2003 2004 2005 2006
Insp
ecti
on A
ctiv
ity/
Dam
aged
0%
4%
8%
12%
16%
20%
% C
UI
Dam
age
Det
ecti
on R
ate
Total TRT Inspections No. of Inspections with CUI % of Inspections with CUI
96-01 Ave Level 02-05 Target 06 Target
GPB Figure E.1 External Corrosion Activity and Detection Summary

Section E External/Internal Inspection
- 45 -
In general, the inspection levels over the period 1996 to 2001 remained relatively constant at an average of ~13,000 per year. In 2002 the activity level was increased substantially, targeting 35,000 inspections per year. For 2006, the planned activity level was 40,000 inspections however, actual inspections carried out were below the plan level with just over 30,000 achieved.
Although total inspections completed were less than plan, compared to previous years, there was a considerable increase in CUI damage detected. Overall, the percentage of locations found with damage has fallen from an initial high of >15% to a field-wide average between 2001 and 2005 of 3-5%. The current survey showed an increase in percent of locations inspected with damage, nearly doubling total damage locations found in the previous year. The reason for the increased damage rate can be associated to a small number of pipelines with higher than normal occurrences of CUI. While a higher than average detection rate on a few pipelines can be expected, if the trend continues, program resources required to manage CUI will need to change to keep pace. The intended program scope for 2007 is discussed in Section H.
Section E.1.2 Cased Piping Survey Results
A long-term management strategy consisting of; repeat examinations, analysis of results and corrective action as warranted has been implemented for cased piping segments. Currently, the preferred test methodologies are either guided wave and/or in-line inspection (ILI) in order to determine the presence of an active corrosion mechanism. Potential metal loss areas are reported and severity is semi-quantified as non-relevant (i.e. no metal loss), minor, moderate, or significant. Distinction from previous examinations is reported as no change (NC) or an increase (I). An increase may be associated with active corrosion, therefore additional verification would be required to determine the appropriate response.
The 2006 program consisted of repeat examinations/monitoring and excavation. GPB Table E.3 shows the inspection results for cased pipe segments. There were 59 cased segments evaluated using guided wave and/or in-line smart pig technology. Of the 59 inspected segments, 2 reported moderate anomalies and 24 reported slight anomalies.
Anomaly Type
Service Inspection Method
NC or I
Non Relv
Minor Mod Sig Anomaly Action
Gas G-Wave I 3 G-Wave Monitor/Evaluate for Excavation
G-Wave NC 4 G-Wave Monitor/Evaluate for Excavation
G-Wave NC 1 Excavated – No Damage
G-Wave NC 5 G-Wave Monitor
Oil G-Wave I 1 Flow line shut-in (16C/17C)
G-Wave I 1 G-Wave Monitor/Evaluate for Excavation
G-Wave NC 1 Excavated – 55% Ext Wall Loss
G-Wave NC 2 G-Wave Monitor/Evaluate for ILI and/or Excavation

Part 1 – Greater Prudhoe Bay Business Unit
- 46 -
Anomaly Type
Service Inspection Method
NC or I
Non Relv
Minor Mod Sig Anomaly Action
G-Wave NC 8 G-Wave Monitor
PO G-WAVE/ILI I 1 Smart Pig 2007
G-WAVE/ILI I 1 Transit Line shut-in
G-WAVE/ILI I 1 G-Wave Monitor
G-WAVE/ILI NC 1 G-Wave Monitor/Evaluate for Excavation
G-WAVE/ILI NC 7 Smart Pig 2007
G-WAVE/ILI NC 10 G-Wave/ILI Monitor
ILI NC 1 Transit Line shut-in
ILI NC 1 Transit Line shut-in
G-WAVE NC 5 G-Wave Monitor
PW/SW G-Wave NC 4 G-Wave Monitor
G-Wave NC 1 G-Wave Monitor/Evaluate for ILI and/or Excavation
Inspection Totals 59 33 24 2 -
GPB Table E.3 Cased Pipe Survey Results
As a result of 2006 cased pipe survey, twelve segments are being evaluated for excavation and/or additional testing.
Section E.1.3 Excavation History
Excavations of cased pipeline segments are typically performed when inspection data indicates the likelihood of an active corrosion mechanism or significant degradation that cannot be mitigated by any other means (e.g. CUI).
In 2006, fifteen cased segments were excavated and the subsequent inspections were used to verify monitoring results. There were 3 pipe segments cut out and removed because of severe internal corrosion, 6 segments with external corrosion that was mitigated, 4 segments with minor to moderate internal corrosion and 2 segments with no corrosion damage.
Since 1992, there have been 71 cased pipeline segments at road and/or animal crossings excavated in GPB. Three of these excavations were as a result of loss of containment; 2 attributed to external corrosion and 1 attributed to internal corrosion. The remaining 68 excavations were verification of inspection results. GPB Table E.8, at the end of this section, shows 50 were found with external corrosion damage, 6 were found with internal corrosion damage, 1 location found with coincidental internal and external corrosion and 11 with no corrosion damage.
In summary, the strategy and execution of the cased pipe assessment (survey and excavation) will continue to develop as the program is refined and more information and/or experience with emerging long-range inspection technologies are gained. Effort to increase cased pipe program activity and/or improve technology is acknowledged as an area for improvement.

Section E External/Internal Inspection
- 47 -
Section E.2 Internal Inspection Program Results
The results presented in this section are aggregate data obtained from flow line, oil transit line, and well line inspections. The program results are presented in terms of the number of locations that show an increase in corrosion damage since the last inspection as a percentage of the total number of repeat inspections,
% Increases = Locations with active corrosionTotal # of reinspected locations x 100
The percentage increases is therefore a high level measure of the amount of active corrosion in any given system.
GPB Figure E.2 shows the percentage of inspection increases (%I's) and the number of inspections per year for the flow lines segregated by 3-phase production and water injection (seawater and produced water) service. The total number of inspections in 2006 is slightly below the 5 year average between 2001 and 2005.
0%
5%
10%
15%
1995 1996 1997 1998 1999 2000 2001 2002 2003 2004 2005 2006
% o
f In
spec
tion
In
crea
ses/
Yea
r
0
10,000
20,000
30,000
No.
of
Insp
ecti
ons/
Yea
r
3 Phase Production Water Injection/Supply Total Inspections Avg Inspections 01-05
GPB Figure E.2 Flow Line Internal Inspection Increase by Service
The percentage of inspection increases in the 3-phase system declined considerably from 1997 to a historical low in 2000-2001. Since that time, there has been a increasing trend in locations showing active corrosion. In 2006 the majority of increases, 75% of the total, are attributed to two pipeline systems which were consequently shut-in. These pipeline systems are flow lines 16C/17C and PTMCLS01/02.
The water injection system continues to be an area where improvement is required to realize a similar level of corrosion control as the 3-phase system. Section C.2.2 details several improvements that were made to the PW system in recent years. Since

Part 1 – Greater Prudhoe Bay Business Unit
- 48 -
inspection is a lagging indicator, it will likely be 2007 or 2008 before notable changes in %I’s are evident.
GPB Figure E.3 shows the %I’s trend and the number of inspections per year for the well lines. The total number of inspections achieved on the well lines is appreciably below the 2001 to 2005 average. It is expected that program activity will return to historic levels in 2007.
For 3-phase well lines there is a small reduction in corrosion activity as measured by percent of increases although on the whole, %I’s has remained steady over the past 6-years at 3-5%.
For the water system, the trends for well lines are similar to flow lines. As with the flow lines, improvements in the chemical mitigation program are expected to add to the level of corrosion control and show a reduction in the percent of increases in coming years.
0%
10%
20%
30%
1995 1996 1997 1998 1999 2000 2001 2002 2003 2004 2005 2006
% o
f In
spec
tion
In
crea
ses/
Yea
r
0
5,000
10,000
15,000
No.
of
Insp
ecti
ons/
Yea
r
3 Phase Production Water Injection Total Inspections Avg Inspections 01-05
GPB Figure E.3 Well Line Internal Inspection Increase by Service
Section E.3 Correlation between Inspection and Corrosion Monitoring8
The following section describes the correlation between inspection and monitoring programs for the 3-phase production system. Inspection and corrosion monitoring have different characteristics; in particular, inspection techniques are comparatively insensitive but are the most accurate as they measure actual wall loss. In contrast,
8 In addition to Charter Work Plan, this information supplied to provide additional context and
help in understanding BPXA’s corrosion management activities

Section E External/Internal Inspection
- 49 -
corrosion monitoring is more sensitive but less accurate as a measure of corrosion rate as the weight loss coupon is not an integral part of the pipe wall. Refer to Table 12 for additional information regarding these techniques. Therefore, in order to have good confidence in the results from the corrosion monitoring program, it is necessary to show a correlation between the monitoring program and the results of the inspection program.
GPB Figure E.4 shows a similar decreasing trend in average corrosion rate from WLC and the percentage of increases found in the inspection program for the 3-phase well line and flow line. It should be noted that the inspection results included in the analysis are not the full data set but has been refined to include only that data which has an inspection interval (time since last inspection) of less than 730 days (two years). Also, the indicated reporting year has been changed to reflect the mid-point of the inspection interval rather than the time of inspection as in the other figures in this report. This change in the reporting time compensates for the fact that corrosion is occurring over the entire time interval between inspections. Similarly, the weight loss coupon corrosion rates are reported as the mid-point of the exposure period not the removal date.
From the correlation between inspection and corrosion monitoring, a number of important conclusions can be drawn:
• Corrosion monitoring is considered a leading indicator and inspection is considered a lagging indicator. This is supported by the data which shows ~2 year lag between corrosion monitoring and inspection changes.
• As the corrosion rates decrease due to the effectiveness of the inhibition program, then further program optimization will be driven by the information gained from the corrosion monitoring program rather than the inspection program.
• Timely optimization of the chemical program can not be reliant on feedback from the inspection data but must be managed through the corrosion monitoring program.
• Because of the lower sensitivity of the techniques used in the inspection program, the corrosion rates in the 3-phase flow lines are below the detection limits for inspection; therefore corrosion rate monitoring becomes a function of the coupon program leaving inspection as a confirmation and integrity assessment tool.

Part 1 – Greater Prudhoe Bay Business Unit
- 50 -
0
1
2
3
1995 1996 1997 1998 1999 2000 2001 2002 2003 2004 2005 2006
Ave
Cor
rosi
on R
ate,
mpy
0%
2%
4%
6%
Per
cen
tage
In
crea
ses,
% I
ncr
Inspection Increases Ave Corrosion Rate, mpy
GPB Figure E.4 Correlation of Corrosion Rate and %Increases, 3-phase Production
In summary, the data in this section shows the correlation between the inspection data and the corrosion monitoring data. This in turn, allows the corrosion monitoring data to be used with confidence to manage the chemical treatment program in a timelier manner.
Section E.4 In-line Inspection
In-line inspection (ILI) tools, or smart pigs are important tools to have available for the management of the long-term integrity of the flow lines. However, ILI is not always the most appropriate or applicable for GPB because of the operating conditions, design and accessibility of the pipelines to manual methods of NDE.
Magnetic flux leakage (MFL) type tools are frequently used at GPB where pigging facilities and process environment allow. Refer to Appendix 3.3.6 for additional information related to ILI at GPB.
ILI was performed on one 3-phase production flow line and five processed oil transit lines. GPB Table E.4 summarizes equipment service, diameter, and length.

Section E External/Internal Inspection
- 51 -
Equipment Service Diameter Previous ILI From To Length
(miles)
LPC OIL SALES PO 16 - LPC PS1 6.1
XF-21 PO 24 2000 GC2 GC1 3.6
WZ-LDF 3 Phase 30 - WZ Junct. GC2 6.5
FS2/FS1OIL PO 30 - FS2 FS1 3.0
FS1/ALPS-34 PO 34 - FS1 SK50 4.9
OT-13/31 PO 34 1998 GC2 SK50 4.8
GPB Table E.4 Completed Smart Pig Assessments
The reported metal loss features have been prioritized for verification by radiographic and/or ultrasonic inspection. The verification results through 2006 are included in the aggregate inspection data. Additional follow-up of the reported features is an ongoing part of the normal radiographic and ultrasonic NDE activity at GPB.
In summary, ILI will continue to be used to assist and complement the overall inspection program.
Section E.5 Internal/External Inspection Comparison
GPB Figure E.5 and GPB Table E.5 summarize the level of internal and external inspection activity across GPB since 1995. Due to the events involving processed oil transit lines, the level of internal corrosion inspection during 2006 increased significantly when compared to previous years. The large increase of activity included 23,000 ultrasonic inspections on two 34-inch processed oil transit lines.

Part 1 – Greater Prudhoe Bay Business Unit
- 52 -
0
20,000
40,000
60,000
80,000
1995 1996 1997 1998 1999 2000 2001 2002 2003 2004 2005 2006
No.
of
Insp
ecti
ons
0%
20%
40%
60%
80%
% E
xter
nal
(Ex
t/To
tal I
nsp
ecti
ons)
Internal Inspection External Detection Ext/(Int + Ext)%
GPB Figure E.5 Internal and External Inspection Activity for Transit, Flow and Well Lines
Year 1995 1996 1997 1998 1999 2000 2001 2002 2003 2004 2005 2006
External 1,498 11,491 19,611 11,224 10,508 10,408 16,828 42,695 35,147 35,110 34,994 30,470
Internal 27,727 28,911 29,771 25,928 21,254 16,851 21,947 26,411 25,490 27,279 24,053 45,924
Total 29,225 40,402 49,382 37,152 31,762 27,259 38,775 69,106 60,637 62,389 59,047 76,394
Ext
(Ext + Int)% 5% 28% 40% 30% 33% 38% 43% 62% 58% 56% 40%59%
GPB Table E.5 Internal and External Inspection Activity Breakdown
GPB Table E.6 and GPB Figure E.6 show the split between transit line, flow line and well line inspections for both the internal and external programs. The overall inspection activity increased from ~60,000 inspections per year to ~75,000 inspections in 2006. Although the total inspection numbers are higher than historic levels, the activity level on flow lines and well lines, was marginally reduced.

Section E External/Internal Inspection
- 53 -
Year 1995 1996 1997 1998 1999 2000 2001 2002 2003 2004 2005 2006
External 0 173 541 871 282 0 133 567 4 2,996 498 404
Internal 54 226 52 30 62 302 500 392 201 151 159 25,296
Total 54 399 593 901 344 302 633 959 205 3,147 657 25,700
Ext
(Ext + Int)
External 1,498 11,282 17,393 9,418 7,850 5,169 3,833 18,159 24,289 18,159 13,152 14,106
Internal 21,615 20,277 21,210 18,152 14,844 9,305 11,132 12,909 14,008 14,144 13,938 12,623
Total 23,113 31,559 38,603 27,570 22,694 14,474 14,965 31,068 38,297 32,303 27,090 26,729
Ext
(Ext + Int)
External 0 36 1,677 935 2,376 5,239 12,862 23,969 10,854 13,955 21,344 15,960
Internal 6,058 8,408 8,509 7,746 6,348 7,244 10,315 13,110 11,281 12,984 9,956 8,005
Total 6,058 8,444 10,186 8,681 8,724 12,483 23,177 37,079 22,135 26,939 31,300 23,965
Ext
(Ext + Int)
Grand Total 29,225 40,402 49,382 37,152 31,762 27,259 38,775 69,106 60,637 62,389 59,047 76,394
TR
( TR + FL + WL)
FL
( TR + FL + WL)
WL
( TR + FL + WL)
Transit Line
Flow Line
Well Line 37% 43% 53% 31%
35%
% 21% 21% 21% 23% 27% 46% 60% 54%
45% 63% 52% 46%74% 71% 53% 39%% 79% 78% 78%
% 6% 36% 45% 34% 35% 36% 26% 58% 63% 56% 49%
% 0% 0% 16% 11% 27% 42% 55% 65% 49% 52% 68%
% 0.2% 1% 1% 0.3% 5% 1%2% 1% 1% 2%
67%
34%
% 0% 43% 91% 97% 82% 0%
1%
Well Line
76% 2%
Transit Line
Flow Line
21% 59% 2% 95%
53%
GPB Table E.6 Internal and External Inspection Activity Summary by Transit, Flow & Well Line
0
20,000
40,000
60,000
80,000
1995 1996 1997 1998 1999 2000 2001 2002 2003 2004 2005 2006
No.
of
Insp
ecti
ons
0%
5%
10%
15%
20%
25%
30%
35%
40%
% T
rans
it (
TR/T
otal
Ins
pect
ion
s)
Well Line Int Well Line Ext Flow Line Int Flow Line Ext
Tranist Line Int Transit Line Ext TR/(TR + FL + WL)%
GPB Figure E.6 Internal and External Inspection Activity Summary by Flow/Well Line

Part 1 – Greater Prudhoe Bay Business Unit
- 54 -
Section E.6 Inspection Summary
In summary, the main conclusions from the inspection section are,
• The external corrosion inspection program completed 30,470 items in 2006. Approximately 8% of these inspections showed damage, which is approximately double the average for the previous five years. If the level of damage detected in 2006 becomes standard, resources required to manage CUI will need to change to keep pace.
• The cased piping survey is continuing to evolve although the level of activity achieved in the past few years has fallen short of activity planned. It is widely recognized that not all pipelines can be smart pigged and guided wave is not an inclusive technique for interrogating pipe segments but, each of the techniques has a place in the long-term management. Obligation to increase cased pipe program activity and improve upon assessment methodologies is acknowledged as an area of sought after improvement.
• A unified internal inspection philosophy and program structure has been implemented across GPB with a total program size of greater than 60,000 items, split between field and facility piping. The 2006 survey was greatly affected by the events surrounding the processed oil transit lines.
• The inspection results for well line 3-phase systems show steady performance with 3-5% increases over the past six years. 2006 flow line data shows an increasing trend in active corrosion. A significant portion of increases on flow lines are directly related to 2 pipelines systems which were consequently shut-in for planned replacement.
• The water injection systems show a long term improving trend from 1995 through 2001 although there has been an increase in the corrosion activity since 2002. Several corrective actions have been implemented to address the increased activity. During 2005, significant changes to the chemical inhibition program for PW system were implemented. Because inspection is a lagging indicator, results may not be shown in the data until 2007 or 2008.
• The results of the inspection program and the weight loss coupon program from the 3-phase oil service were shown to be strongly correlated. The reduction in corrosion activity from both measures being attributable to the implementation of an aggressive and increasing corrosion inhibition program in the 3-phase service since 1995.

Section E External/Internal Inspection
- 55 -
BU Type Service Result 1995 1996 1997 1998 1999 2000 2001 2002 2003 2004 2005 2006I 367 921 1,154 394 240 68 60 103 151 101 179 251
NC 15,210 15,806 16,576 14,954 12,074 8,209 7,109 8,706 9,113 10,640 9,062 6,302NL 3,615 2,116 1,968 456 369 145 1,782 2,031 1,938 810 1,700 3,369
Total 19,192 18,843 19,698 15,804 12,683 8,422 8,951 10,840 11,202 11,551 10,941 9,922I 171 124 154 192 72 17 43 138 176 107 141 147
NC 1,151 1,076 1,125 1,559 1,564 722 1,103 1,173 1,538 1,580 1,784 1,563NL 423 114 134 88 75 61 350 377 218 218 279 369
Total 1,745 1,314 1,413 1,839 1,711 800 1,496 1,688 1,932 1,905 2,204 2,079Total Total 20,937 20,157 21,111 17,643 14,394 9,222 10,447 12,528 13,134 13,456 13,145 12,001
I 11 12 4 0 10 161 81 7 3 12 10 114NC 33 81 46 18 26 59 191 338 92 110 90 1,171NL 10 133 2 12 26 82 228 47 106 29 59 24,011
Total 54 226 52 30 62 302 500 392 201 151 159 25,296Total Total 54 226 52 30 62 302 500 392 201 151 159 25,296
I 630 904 875 600 312 264 213 274 323 290 232 157NC 2,459 3,488 3,416 4,085 3,640 4,142 5,529 7,162 6,575 7,114 6,337 4,393NL 961 1,742 1,959 699 570 505 2,449 3,390 2,247 2,388 1,237 1,428
Total 4,050 6,134 6,250 5,384 4,522 4,911 8,191 10,826 9,145 9,792 7,806 5,978I 225 263 201 216 74 127 79 125 147 152 108 130
NC 1,028 1,540 1,083 1,633 1,424 1,754 1,293 1,149 1,352 2,142 1,225 1,125NL 616 359 621 218 175 254 495 536 361 520 540 520
Total 1,869 2,162 1,905 2,067 1,673 2,135 1,867 1,810 1,860 2,814 1,873 1,775Total Total 5,919 8,296 8,155 7,451 6,195 7,046 10,058 12,636 11,005 12,606 9,679 7,753
GPB Total Total Total 26,910 28,679 29,318 25,124 20,651 16,570 21,005 25,556 24,340 26,213 22,983 45,050
Note: I = Increased Degradation from Previous InspectionNC = No Change from Previous InspectionNL = New Location 1st Inspection
GPB FL
OIL
WTR
TRGPBPO
GPB WL
OIL
WTR
GPB Table E.7 Transit, Flow and Well Line Inspection Data

Part 1 – Greater Prudhoe Bay Business Unit
- 56 -
This page is intentionally blank

Section E External/Internal Inspection
- 57 -
Year Cased Pipe Location Equipment Excavated Observation Corrective Action
1992 COTU Access Road FS1 to FS2 12" MI Distribution 10% external wall loss Insulation/coating/tape repair
1995 S Pad West Entrance Crossing S Pad 24" 3 Phase Production 61% external wall loss Sleeve/insulation/coat repair S Pad 14" Produced Water 36% internal/ext wall loss Sleeve/insulation/coat repair S Pad 10" Gas Lift 34% external Wall Loss Insulation/coating repair S Pad 8" Miscible Injection 41% external wall loss Replaced segment/FBE
GC1 Main Entrance Distribution 24" Gas Lift 29% external wall loss Insulation/coating repair Y Pad 24" 3 Phase Production 24% external wall loss Insulation/coating repair
GC2 to GC1 Caribou Crossing Distribution 24" Gas Lift 42% external wall loss Sleeve/insulation/coat repair Y Pad 24" 3 Phase Production 26% external wall loss Insulation/coating repair
1996 GC-1 Spine Road Distribution 24" Gas Lift 53% external wall loss Sleeve/insulation/coat repair
D Pad 24" 3 Phase Production 33% external wall loss Insulation/coating repair Y Pad 24" 3 Phase Production 18% external wall loss Insulation/coating repair Distribution 20" Produced Wtr. 8% external wall loss Insulation/coating repair
E Pad Entrance E Pad 24" 3 Phase Production 21% external wall loss Insulation/coating repair
GC3 to FS3 Caribou Crossing Distribution 24" Gas Lift No corrosion damage None
FS1 to FS2 Caribou Crossing Distribution Natural Gas 30" 11% external wall loss Insulation/coating/tape repair Sales Oil 30" 14% external wall loss Insulation/coating/tape repair Distribution 24" Gas Lift No corrosion damage None Distribution 32" Sea Water No corrosion damage None
1998 S Pad East Entrance Crossing S Pad 10" Gas Lift ~80% wall loss - ext rupture Replaced segment
GC2 to GC1 Caribou Crossing Distribution 24" Gas Lift 9% external wall loss Insulation/coating repair
GC2 to GC1 Q Pad Rd Crossing Distribution 34" Natural Gas No corrosion damage Insulation/FBE coated
GPB Table E.8 Cased Piping Excavation History

Part 1 – Greater Prudhoe Bay Business Unit
- 58 -
Year Cased Pipe Location Equipment Excavated Observation Corrective Action
2000 S Pad East Entrance Crossing S Pad 24" 3 Phase Production 60% external wall loss Replaced segment/coat repair S Pad 14" Produced Water 50% external wall loss Replaced segment/coat repair S Pad 8" Miscible Injection 25% external wall loss Sleeve/insulation/coat repair
2003 GC2 to GC1 Caribou Crossing Y Pad 24" 3 Phase Production Leak -external corrosion Partial excavation/sleeve repair
X Pad Pipeline Access Rd Crossing X Pad 24" 3 Phase Production ~75% external wall loss Partial excavation/sleeve repair
F Pad Pipeline Access Rd Crossing F Pad 24" 3 Phase Production 24% external wall loss Partial excavation/none
NGI Pad Road Crossing NGI Pad 14" Gas Cap Injection 58% external wall loss Replaced segment
2004 WGI to West Dock Road Crossing AGI Pad 16" Gas Cap Injection no corrosion damage none
CCP Pad Road Crossing CCP/NGI-NGL 4" NGL 10% external wall loss partial excavation/insulation tape repair
GC1 Entrance Road Crossing D Pad 24" 3 Phase Production 16% external wall loss partial excavation/insulation tape repair
GC1 to F Pad Caribou Crossing F Pad 24" 3 Phase Production 21% external wall loss partial excavation/insulation tape repair
GC1 to GC2 Road Crossing U Pad 6" Gas Lift Supply 5% external wall loss partial excavation/insulation tape repair
F Pad/Frontier Camp Rd Crossing F Pad 24" 3 Phase Production 16% external wall loss partial excavation/insulation tape repair
F Pad Pipeline Access Rd Crossing F Pad 24" 3 Phase Production 18% external wall loss partial excavation/insulation tape repair
GC1 to G Pad Caribou Crossing G Pad 6" 3 Phase Production no corrosion damage none
GPB Table E.8 (Continued) Cased Piping Excavation History

Section E External/Internal Inspection
- 59 -
Year Cased Pipe Location Equipment Excavated Observation Corrective Action
2004 Q Pad Access Road Crossing GC3/GC2 12" MI Supply 9% external wall loss partial excavation/insulation tape repair
H Pad 24" 3 Phase Production 24% external wall loss partial excavation/insulation tape repair
Y Pad 12" PW Supply 39% external wall loss partial excavation/insulation tape repair
Q Pad Spur Road Crossing Y Pad 12" PW Supply 12% external wall loss partial excavation/insulation tape repair
West Dock to GC1 Road Crossing K Pad 24" 3 Phase Production 8% external wall loss partial excavation/insulation tape repair
GC2 to N Pad Caribou Crossing N Pad 24" 3 Phase Production 37% external wall loss partial excavation/insulation tape repair
CCP Pad Road Crossing NGI Pad 14" Gas Cap Injection 14% external wall loss partial excavation/insulation tape repair
S Pad Entrance Road Crossing S Pad 24" 3 Phase Production 10% external wall loss partial excavation/insulation tape repair
S Pad 14" Produced Water 11% external wall loss partial excavation/insulation tape repair
U Pad Road Crossing U Pad 6" Production Well Line 18% external wall loss partial excavation/insulation tape repair
U Pad 3" Gas Lift Well Line 16% external wall loss partial excavation/insulation tape repair
X Pad to B Pad Caribou Crossing X Pad 24" 3 Phase Production 5% external wall loss partial excavation/insulation tape repair
X Pad 8" MI Supply 17% external wall loss partial excavation/insulation tape repair
2005 X Pad Pipeline Access Road X Pad 24" 3 Phase Production 24% external wall loss insulation tape repair
GC-1 Spine Road Distribution 24" Gas Lift 30% external wall loss sleeve/insulation/tape repair
GPB Table E.8 (Continued) Cased Piping Excavation History

Part 1 – Greater Prudhoe Bay Business Unit
- 60 -
Year Cased Pipe Location Equipment Excavated Observation Corrective Action
2005 GC-1 Spine Road D Pad 24" 3 Phase Production 34% external wall loss insulation tape repair
Y Pad 24" 3 Phase Production no corrosion damage insulation tape repair
Distribution 28" Produced Water no corrosion damage insulation tape repair
GC1-GC2 24" 3 Phase Tie-line no corrosion damage insulation tape repair
2006 F-Pad to GC1 Caribou Crossing F Pad 24” 3 Phase Production 43% external wall loss insulation tape repair
F-Pad to GC-1 Frontier Road Crossing F Pad 24” 3 Phase Production 55% external wall loss insulation tape repair
X-Pad to GC-3 Caribou Crossing X Pad 24” 3 Phase Production 19% external wall loss insulation tape repair
X Pad 6” Miscible Injection 24% external wall loss insulation tape repair
S-Pad West Road Crossing S Pad 14" Produced Water 37% internal wall loss insulation tape repair
GC3 Pad Road Crossing X Pad 24” 3 Phase Production 49% external wall loss insulation tape repair
B Pad Main Entrance Road Crossing B Pad 6" Miscible Injection no corrosion damage none
GC2 to GC-1 Caribou Crossing 1 Oil Transit 34” Processed Oil leak - internal wall loss demolished – removed piping
GC2 to GC-1 Caribou Crossing 3 Oil Transit 34” Processed Oil 79% internal wall loss demolished – removed piping
GC2 to GC-1 Caribou Crossing 4 Oil Transit 34” Processed Oil 87% internal wall loss demolished – removed piping
C-Pad to GC-3 Access Road Crossing Oil Transit 34” Processed Oil 31% internal wall loss temporary insulation – planned
replacement
GC3 to Sk-50 Caribou Crossing 1 Oil Transit 34” Processed Oil 17% internal wall loss temporary insulation – planned replacement

Section E External/Internal Inspection
- 61 -
Year Cased Pipe Location Equipment Excavated Observation Corrective Action
GC3 to Sk-50 Caribou Crossing 2 Oil Transit 34” Processed Oil 18% internal wall loss temporary insulation – planned replacement
GC3 to Sk-50 Caribou Crossing 3 Oil Transit 34” Processed Oil 13% external wall loss temporary insulation – planned replacement
GC3 to Sk-50 Caribou Crossing 4 Oil Transit 34” Processed Oil no damage temporary insulation – planned replacement
GPB Table E.8 (Continued) Cased Piping Excavation History


Section F
Repair Activities


Section F Repair Activities
- 65 -
Section F Repair Activities The repair activities for 2006 are summarized in GPB Table F.1. The total of 206 represents the largest number of piping repairs identified in a single year since the Charter Agreement.
Service Type Internal External Mechanical Total
3-Phase Oil FL 64 20 8 92
WL 2 5 2 9
Water FL 2 - 1 3
WL 10 1 - 11
Gas FL - 2 1 3
WL - 11 5 16
Processed Oil TR 45 1 26 72
Total 123 40 43 206
GPB Table F.1 Repair Activity
There were 40 repairs attributed to external corrosion which is lower than the annual average from the 3 previous years.
There were 43 repairs attributed to mechanical defects which is a large increase from historic averages. Twenty-six were found on the processed oil transit lines after thousands of feet of insulation were removed to allow UT inspection. The mechanical defects are largely a result of manufacturing flaws in the steel or gouges and scratches that occurred during pipeline construction.
There were 123 repairs attributed to internal corrosion of which 104 were on four pipeline segments that were shut-in. These segments are 30-inch FS2/FS1OIL and 34-inch OT-21 processed oil transit lines and the 24-inch PTMCLS01 and PTMCLS0102 3-phase oil flow line.
GPB Figure F.1, GPB Figure F.2, GPB Figure F.3, and GPB Table F.1 show the 7-year trend in repairs grouped by service, damage mechanism, and equipment, respectively.

Part 1 – Greater Prudhoe Bay Business Unit
- 66 -
0
50
100
150
200
250
2000 2001 2002 2003 2004 2005 2006
Nu
mbe
r of
Rep
airs
3-Phase Oil Water Gas Processed Oil
GPB Figure F.1 Repairs by Service
0
50
100
150
200
250
2000 2001 2002 2003 2004 2005 2006
Nu
mbe
r of
Rep
airs
Internal External Mechanical
GPB Figure F.2 Repairs by Damage Mechanism

Section F Repair Activities
- 67 -
0
50
100
150
200
250
2000 2001 2002 2003 2004 2005 2006
Nu
mbe
r of
Rep
airs
Flow Line Well Line Transit Line
GPB Figure F.3 Repairs by Equipment


Section F Repair Activities
- 69 -
Processed Oil
Flow Line Well Line Flow Line Well Line Flow Line Well Line Transit Line
Internal 2 5 - - - - - 7External 1 7 2 7 8 3 - 28Mechanical - - - - - - - -Total 3 12 2 7 8 3 - 35
Internal 2 4 1 1 - - 3 11External 7 5 3 - 2 - - 17Mechanical - 2 - - - 1 - 3Total 9 11 4 1 2 1 3 31
Internal 8 7 1 4 - - - 20External 35 11 6 1 4 - - 57Mechanical - - - - 1 - - 1Total 43 18 7 5 5 0 - 78
Internal - 3 - - - - - 3External 28 20 - 1 23 8 - 80Mechanical 1 - - - 1 1 - 3Total 29 23 - 1 24 9 - 86
2004Internal 5 5 23 13 - 46External 13 13 9 1 12 37 - 85Mechanical - - 1 - 1Total 18 18 33 14 12 37 - 132
2005Internal 1 1 5 5 - - - 12External 27 7 - 7 4 4 - 49Mechanical 1 - 1 1 4 3 - 10Total 29 8 6 13 8 7 - 71
2006Internal 64 2 2 10 - - 45 123External 20 5 - 1 2 11 1 40Mechanical 8 2 1 - 1 5 26 43Total 92 9 3 11 3 16 72 206
223 99 55 52 62 73 75 639Grand Total
2000
2001
2002
2003
3-Phase Oil Water GasTotal
GPB Table F.1 Historical Repairs by Service


Section G
Corrosion and Structural Related Spills and Incidents


Section G Corrosion and Structural Related Spills and Incidents
- 73 –
Section G Corrosion and Structural Related Spills and Incidents
Section G.1 Corrosion Related Leaks
This section summarizes the corrosion and structural related incidents that occurred in 2006 and provides a historical perspective on the leaks (loss of containment) and saves (repairs before leak of non-FFS equipment).
GPB Table G.1 summarizes the equipment, failure mechanism and volume of leaks that occurred in 2006. Of the 9 leaks that occurred, 1 was due to external corrosion, 7 due to internal corrosion, and 1 from a frozen well line that ruptured.
Service Location Type Date Mechanism Volume
Seawater Drill Site 11 WL 21-Jan-06 Internal ~25 gallons
Produced Water Drill Site 13 WL 27-Feb-06 Mechanical/Froze ~2,500 gallons
Processed Oil GC2 to GC1 TR 02-Mar-06 Internal ~200,000 gallons
Gas R Pad WL 08-Apr-06 External ~650,000 Std. Cubic Feet
Seawater Drill Site 04 WL 01-May-06 Internal ~400 gallons
Seawater Drill Site 11 WL 25-May-06 Internal ~1,000 gallons
Seawater Drill Site Niakuk WL 03-Aug-06 Internal ~80 gallons
Processed Oil FS2 to FS1 TR 06-Aug-06 Internal ~950 gallons
Produced Water Drill Site 13 WL 26-Sep-06 Internal ~80 gallons
Surface Service Mechanism
Int Ext OIL SW PW Gas CO2 Int CUI Mech
WL 6 1 - 4 2 1 - 5 1 1
FL - - - - - - - - - -
TR 2 2 - - - - 2 - -
GPB Table G.1 Leaks Due to Corrosion/Mechanical

Part 1 – Greater Prudhoe Bay Business Unit
- 74 -
GPB Table G.2, GPB Figure G.1 and GPB Figure G.2 show the number of corrosion related leaks and saves since 1996. The ratio of leaks to saves provides a high level measure of the performance of the inspection program at detecting severe damage before it results in a failure. A 'save' is defined as a location found via the inspection program that warrants a repair, system de-rate, replacement or removal from service as the equipment no longer meets the FFS criteria defined in Appendix 3.3.5. It should be noted that items are typically scheduled for repair at 105% of MAOP, to allow time to schedule and complete the repair before the item requires removal from service.
Transit & Flow Lines Well Lines Total
Saves Leaks ( )%SLS+
Saves Leaks ( )%SLS+
( )%SLS+
1996 14 4 78% 57 6 90% 88%
1997 33 2 94% 73 1 99% 97%
1998 51 3 94% 34 4 89% 92%
1999 22 0 100% 25 3 89% 94%
2000 9 1 90% 54 0 98% 97%
2001 7 2 78% 21 4 84% 82%
2002 58 1 98% 23 3 89% 95%
2003 53 2 96% 33 0 100% 98%
2004 68 1 99% 60 3 95% 97%
2005 41 2 95% 24 4 86% 92%
2006 170 2 99% 36 7 84% 96%
GPB Table G.2 Historical Corrosion/Mechanical Leaks and Saves

Section G Corrosion and Structural Related Spills and Incidents
- 75 –
0
50
100
150
200
250
1996 1997 1998 1999 2000 2001 2002 2003 2004 2005 2006
Nu
mbe
r of
Lea
ks a
nd
Save
s
Transit & Flow Line Leaks Well Line Leaks Transit & Flow Line Saves Well Line Saves
GPB Figure G.1 Historical Corrosion/Mechanical Leaks and Saves by Line Type
0
50
100
150
200
250
1996 1997 1998 1999 2000 2001 2002 2003 2004 2005 2006
Nu
mbe
r of
Lea
ks a
nd
Save
s
0%
20%
40%
60%
80%
100%
S/(L
+ S
) R
atio
, %
Transit & Flow Lines + Well Line Leaks Transit & Flow Line + Well Line Saves Save/(Leak+Save)
GPB Figure G.2 Historical Corrosion/Mechanical Leaks and Saves

Part 1 – Greater Prudhoe Bay Business Unit
- 76 -
Section G.2 Structural Integrity Issues
There are several activities designed to observe and report structural integrity issues. Structural integrity issues are related to damage caused by structural movement: subsidence, jacking, cyclic fatigue, impact, slugging, snow loading, etc.
There were numerous structural repairs to pipeline support members during 2006. The repairs were for the most part pipeline re-leveling due to support member subsidence or jacking.
Other mitigating activities include installation of pipeline vibration dampeners to minimize cyclic fatigue resulting from wind induced vibration. In 2006 more than 500 tuned vibration dampeners were positioned on Eileen West End flow lines.
Section G.2.1 Walking Speed Survey
Where there is perambulatory access, a Walking Speed Survey (WSS) is performed. The WSS consists of a visual examination of process equipment and system components to identify mechanical integrity deficiencies. Anomalies are noted and evaluated by the Field Mechanical Piping Engineer for action as appropriate.
As the name implies the observations are made at 'walking speed' and are focused on, but not limited to,
• Piping and insulation
• Structural components
• Electrical equipment
• Instrumentation equipment
• Communication equipment
• Chemical injection tubing
• Pipe line road and animal crossings
WSS is a 5-year recurring program with the following schedule,
Year Scheduled Completed Equipment Description
1 2002 GPB East Cross Country Pipelines
2 2003 GPB West Cross Country Pipelines
3 2004 GPB East Well Pads
4 2005 GPB West Well Pads
5 2006 Lisburne Cross Country Pipelines/Drill Sites
GPB Table G.3 Structural/Walking Speed Survey Schedule

Section G Corrosion and Structural Related Spills and Incidents
- 77 –
A WSS of the Lisburne Pipelines was completed in 2006. In addition WSS of the processed oil transit lines, both east and west side of GPB, was performed.
Section G.2.2 Routine Surveillance
Field Operations and Security personnel are tasked as the primary identifiers of flow lines and well lines with potential structural integrity anomalies. Observations of wind-induced vibration, excessive pipe movement, out-of-place pipe guides, bent piping, etc. are reported.
An analysis of potential integrity anomaly is completed by a competent engineer to determine any required action. Additional analysis may be required by the Field Mechanical Piping Engineer or third party engineering experts.
For example, if excessive sagging between pipeline supports is observed, the engineer requests an NDE inspection of the affected area. The purpose of the NDE inspection is to determine if any detrimental damage (i.e. wall thinning, cracks, ovality, buckling, strain) exists. The NDE methods typically used include visual, caliper, ultrasonic, magnetic particle, radiography, and dye penetrant as appropriate. The data are analyzed to assure the pipeline is structurally sound and fit-for-service. If the pipeline is not structurally sound, an engineering design package is prepared to initiate, complete and document the work action. Management of Change and other procedures are applied as required.


Section H
Corrosion Monitoring and Inspection Goals


Section H Corrosion Monitoring and Inspection Goals
- 81 –
Section H Corrosion Monitoring and Inspection Goals
Section H.1 2005 Corrosion and Inspection Goals Reviewed
The corrosion inspection, monitoring and mitigation programs were expected to be substantially unchanged during 2006. However, because of events that transpired throughout the year, programs were affected, some to a lesser degree than others. In particular, the corrosion control target of less than 2 mpy remained in place with monitoring activity levels the same as recent years. The inspection program focused a great deal of resources on the processed oil transit lines increasing the inspection level for these pipelines by more than 20,000 over historic levels.
Section H.1.1 Corrosion Monitoring
The weight loss coupon program frequency remained unchanged in 2005 compared to recent years and is summarized in GPB Table H.1.
Service Flow Lines(months)
Well Lines(months)
3-phase production 3 4
Produced water 6 8
Seawater 3 3
Processed Oil 3 N/A
GPB Table H.1 Coupon Pull Frequency
As a consequence, the activity level from the weight loss coupon program was anticipated to be similar in 2006 to that seen in 2005 and indeed this was the case. There were some changes in the number of coupons reported compared to prior years. This is as a result of the following factors:
• Continued efforts to clean historical data records.
• The removal and addition of equipment associated with abandonment and installation of satellite production equipment.
• The historical data was updated to reflect the current equipment inventory.
The ER probe program was planned to be substantially the same as 2005 with probes being located on the 3-phase production lines. The 2006 result was largely as anticipated.
Section H.1.2 Inspection Programs
The fundamental elements of the Inspection Programs outlined in Appendix 3.3.3 (CRM, ERM, FIP, CIP and CUI) form the foundation for the inspection program. The major

Part 1 – Greater Prudhoe Bay Business Unit
- 82 -
change for this program in 2006 was the unplanned level of activity on processed oil transit lines. While the overall activity level increased from ~60,000 to ~75,000 inspections, there were reductions in planned scope that included both field and facility programs.
There were 6 ILI runs completed; one 3-phase oil flow line and five processed oil transit lines.
Corrosion under insulation or external corrosion inspection activity was substantially increased in 2002 from ~13,000 to 35,000 per year. An increased level from 35,000 to 40,000 inspections was planned in 2006, however only 30,000 inspections were completed.
A long-term management strategy was continued for cased piping segments consisting of repeat inspections and excavation. Fifty-nine of the 125 planned inspections were completed.
Section H.1.3 Chemical Optimization
There were forecast to be no large-scale changes in the corrosion mitigation program and this proved to be the case. Improvements in the small scale testing of corrosion inhibitors allow an increased number of well line tests to be completed.
Section H.1.4 Program Reviews
As a result of oil transit line events, there were numerous opportunities to explain and review the corrosion program with stakeholders (e.g. State, Federal, Working Interest Owners) over the past year.
Section H.1.5 2006 Corrective Actions
This section summarizes the corrective actions taken on cross-country flow lines as a result of corrosion monitoring and inspection results exceeding the specified targets. These targets are detailed in Appendix 3.1.3.
GPB Table H.2 notes the corrective mitigation actions taken as a result of inspection information.
Equipment ID No. of Action Cause Action
16C/17C 1 Increased Corrosivity Pipeline Shut-in
PTMCLS01/02 2 Increased Corrosivity Increased CI by 20%
Pipeline Shut-in
H-43 1 Increased Corrosivity Increased CI by 15%
GPB Table H.2 Corrective Mitigation Actions from Inspection Data
GPB Table H.3 notes the corrective mitigation actions taken as a result of ER probe readings exceeding target.

Section H Corrosion Monitoring and Inspection Goals
- 83 -
Equipment ID No. of Action Cause Action
01D 2 Increased Corrosivity Increased CI by 25% at one well
03D 2 Increased Corrosivity Increased CI by 10% at two wells
06C/13B 1 Increased Corrosivity Increased CI by 5%
E-36 1 Increased Corrosivity Switched to Incumbent chemistry
X-74 1 Increased Corrosivity Increased CI by 10% at two wells
GPB Table H.3 Corrective Mitigation Actions from ER Probe Data
GPB Table H.4 notes the corrective mitigation actions taken as a result of weight loss coupons exceeding target.
Equipment ID
WLC CR mpy Cause Action
14D 3.31
14D 2.98 Inhibitor Under-injection Increase CI to existing target
14D 2.55
14D 2.47 Increased Corrosivity Increased CI by 10% at wells
14D 2.76
14D 2.73 Inhibitor Under-injection Increase CI to existing target
GPB Table H.4 Corrective Mitigation Actions from Coupon Data
Section H.2 2007 Corrosion Management Goals
Overall the 2007 corrosion and inspection goals will be focused on the continued delivery and optimization of the current programs.
Section H.2.1 Corrosion Monitoring
There are no plans to significantly change the corrosion weight loss coupon-monitoring program. Additional monitoring methods will be investigated for the PW system in an effort to develop a more sensitive short-term monitoring tool.

Part 1 – Greater Prudhoe Bay Business Unit
- 84 -
Section H.2.2 Inspection Programs
The complete internal inspection program consisting of forward planning and execution will be approximately 70,000 inspections items in total, distributed between the field and facilities. With exception to the current year 2006, the planned scope will be an increase in activity levels from previous years. Of the overall 70,000 inspection items approximately 45% will be associated with cross country flow line and well lines and hence be reported under the Charter Agreement Work Plan.
The external program target is 50,000 inspections for the full year.
The long-term management strategy for cased piping segments will continue in 2007; consisting of repeat examinations and excavations as warranted. The 2007 work scope for cased piping is scheduled to be approximately 200 inspections.
The ILI program target is 10 pipelines but is dependant upon tool and pipeline availability.
Section H.2.3 Chemical Optimization
Corrosion inhibition will continue to be the primary means of internal corrosion control at GPB. Supplemental corrosion inhibition of the PW system will continue. For the 3-phase system, the emphasis will be on the optimization corrosion inhibitor and provide improved control. A similar number of rapid screen testing will be performed during the year.

Part 2 – Alaska Consolidated Team Business Unit
Section B-H


Section B Corrosion Monitoring Activities
- 87 -
Section B Corrosion Monitoring Activities Alaska Consolidated Team (ACT) Performance Unit presently consists of four producing areas: Endicott, Milne Point Unit (MPU), Northstar and Badami. Each of the producing fields within ACT has its own unique set of circumstances and challenges.
Milne Point - Located approximately 25 miles west of Prudhoe Bay, the field began production in 1985. On January 1st, 1994, BPXA acquired a majority working interest and assumed operatorship. Since 1994 production and proven reserves have been increased and Milne Point production averaged approximately 36,400 bpd in 2006.
Endicott - Located northeast of Prudhoe Bay, Endicott consists of two islands, the main Production Island (MPI), and the satellite-drilling island (SDI) at the end of a causeway. Endicott 3-phase production piping is made largely of duplex stainless steel, which significantly reduces the environmental risks. In 2006, Endicott production averaged approximately 14,120 bpd.
Badami - Remotely located east of Prudhoe Bay, Badami has a relatively low production volume due to challenging reservoir conditions. The Badami production facilities are constructed using a much smaller surface footprint than GPB and do not have permanent road access, therefore having a much reduced impact on the environment. Production from Badami was re-started in October 2005 after being shut-in since the third quarter of 2003. Badami production averaged approximately 1,322 bpd in 2006.
Northstar - Located offshore, Northstar is the first offshore oil field in the Beaufort Sea not connected to land by a causeway. As with Badami and other recent developments, Northstar drilling and production operations are built on a smaller footprint than the original North Slope facilities Northstar production during 2006 averaged approximately 51,700 bpd.
ACT Table B.1 illustrates, on a relative basis, the unique corrosivity of each producing field within ACT along with the materials of construction and corrosion mitigation. GPB is included in the table for comparative purposes. Listed in the table are, for each field, the typical water cut in percent, average wellhead temperature, and the percent CO2 in the produced gas.

Part 2 – Alaska Consolidated Team Business Unit
- 88 -
Material of Construction (a) Prod Fluid Characteristics Production Injection Field H2O (%) T (°F) PCO2
(%) CR (b) WL FL WL FL
GPB 67 150 12 H CS+CI CS+CI(c) CS+CI CS+CI
END 93 150 18 H DSS DSS CS+CI CS+CI
MPU 62 125 1.5 L/M CS CS (d) CS+CI CS+CI
Northstar 21 160 8 M CS+CI N/A N/A N/A
Badami ~0 65 ~0 L CS N/A N/A N/A
Notes (a) CS is carbon steel, CI is corrosion inhibitor, DSS is duplex stainless steel (b) Unmitigated relative corrosion rate, H – high, M – medium, and L - low (c) There are a limited number of Duplex Stainless Steel flow lines in GPB (d) Two production flow lines are inhibited at MPU (e) Northstar CO2 has increased from 5-6% at startup to 8% due to gas injection from GPB containing 12% CO2.
ACT Table B.1 Relative Corrosivity of BPXA North Slope Production
Badami, MPU, and Northstar production fluids have a lower corrosivity compared to GPB. Endicott’s production fluid characteristics are more corrosive than GPB and this corrosion risk is mitigated largely through the use of duplex stainless steel (DSS).
ACT Table B.2 shows the ACT fields combined are of a much smaller scale than GPB. For example, neither Northstar nor Badami have any significant non-common carrier cross-country flow lines. Also, it should be noted, that when comparing GPB and ACT facilities, these facilities vary in age from over 29 years for GPB to approximately five years for Northstar.
Metric ACT GPB ( )%GPBACTACT+
Number of Production Trains 4 21 16%
Number of Prod and Inj Wells 408 1498 21%
Non-common carrier FL miles 105 1,350 7%
Total Acreage 75,000 203,000 27%
ACT Table B.2 Illustrative Comparison of Scale between ACT and GPB
Section B.1 Endicott
Endicott is a mature waterflood field. The fluid properties (high water cut, high temperatures, and high CO2 content) indicate the corrosivity of the produced fluids to be high. Due to this anticipated high corrosivity, the majority of the oil production system was fabricated from duplex stainless steel, a corrosion resistant alloy and therefore,

Section B Corrosion Monitoring Activities
- 89 -
corrosion risk is lower for this system. The duplex stainless steel well lines are subject to erosion and are monitored through a velocity monitoring and inspection program. In the oil production system, the only carbon steel is the C-Spool, connecting the wellhead to the duplex stainless steel well line. These C-Spools are inspected regularly and replaced when no longer fit-for-service as per the criteria discussed in Appendix 3.3.5. A recommendation was made in late 2006 to begin replacing the carbon steel spools with duplex stainless steel on an as-needed basis. ACT Table B.3 reflects the historical inspection activity level for Endicott since 2002.
2002 2003 2004 2005 2006 2002 2003 2004 2005 2006
Oil X-country lines 3.54
(in vault)14
(4 in vault)4
(in vault)14
(4 in vault)92
(4 in vault)4
(in vault)4
(in vault)4
(in vault)4
(in vault)19
(in vault)
Oil - Well Pads 2.5 1,327 1,531 1,990 2,637 2,925 - - - - -
Water X-country lines 3.5 104 229 163 119 1364
(in vault)4
(in vault)723 30 22
Water - Well Pads 1.7 200 224 135 309 3199
(in vault)5 - 8 -
Gas X-country (GLT/MI) 7 15 454
(in vault)12
(4 in vault)53
(4 in vault)4
(in vault)774
4(in vault)
34(4 in vault)
21(4 in vault)
Gas - Well Pads 1.2 26 29 10 61 419
(in Vault)69 - 28 -
Fuel Line - Gasoline N/A5 foot
excavation- - - -
5 foot excavation
- - - -
Fuel line - Diesel N/A5 foot
excavation- - - -
5 foot excavation
- - - -
Totals 1,686 2,072 2,216 3,152 3,566 40 856 731 104 62
External InspectionServiceLength,miles
Internal Inspection
ACT Table B.3 Endicott Summary of Lines and NDE Inspections
The primary internal corrosion concerns are in the water injection system, mainly the Inter-Island Water Line (IIWL) carrying injection water to SDI from the MPI. Corrosion control of the water injection system relies on corrosion inhibition of the injection water, supplemented by a periodic biocide treatment and maintenance pigging program. Originally, this line primarily carried seawater. In the early 1990’s, in an effort to increase waterflood efficiency, the line was converted to commingled PW+SW service. As produced water volumes have risen, SW usage has diminished and is no longer used for injection purposes. As a result, changes were made to the mitigation program for the IIWL in 2004. These changes include increasing the corrosion inhibitor concentration by 50% (from 20 to 30 ppm) and reducing the biocide treatment. The effectiveness of corrosion control on the IIWL is monitored by ultrasonic inspection at 25 locations.
Section B.2 Milne Point
The primary corrosion concerns are in the water injection system and corrosion of buried piping. Corrosion inhibition, supplemented by periodic biocide treatments and maintenance pigging program began in mid-2000 in the water injection system. As a result, corrosion rates, as exhibited by weight loss coupons, have dropped significantly.
Although the low temperatures and low CO2 content of the production fluids result in lower corrosivity for MPU, solids contribute to the corrosion mechanism of the production system. Corrosion inhibition of the K-pad production flow line was initiated in 2001 and the trunk system carrying the F-L-C Pads flow line in 2003. The K-Pad flow line was shut-in during 2006 and is scheduled for a replacement due to significant

Part 2 – Alaska Consolidated Team Business Unit
- 90 -
corrosion due to low flow conditions. Corrosion inhibition of the newer S-Pad began late 2002, close to startup of the pad. The Tract 14 production flow line trunk system is currently being upgraded to allow for continuous chemical inhibition.
ACT Table B.4 reflects the historical inspection activity for MPU since 2002.
2002 2003 2004 2005 2006 2002 2003 2004 2005 2006
Oil x-country lines 24 80 465 480 186 817 - 964 70 - 101
Oil – Well Pads N/A1 754 2,754 2,049 1,990 1,900 47 N/A2 - 14 6
Water x-country 15 35 185 249 53 119 - 97 1,065 154 83
Water – Well Pads N/A1 449 635 863 988 1,088 23 N/A2 - 9 10
Gas x-country 14 - 20 26 - 4 - 522 603 - 4
Gas – Well Pads N/A1 283 99 83 56 82 - N/A2 - -
Water/Alternating Gas Well Pads N/A1 - 230 298 214 173 - - - -
Totals 1,601 4,388 4,048 3,487 4,183 70 1,583 1,738 177 204
1 Totals not available2 Included with internal numbers as part of the excavations.
ServiceLength,miles
Internal Inspection External Inspection
ACT Table B.4 MPU Summary of Lines and NDE Inspections
Section B.3 Northstar
Northstar began production in November 2001. Production fluid corrosivity is moderate, but will tend to increase over time with the injection of GPB gas into the reservoir for pressure maintenance purposes. ACT Table B.5 summarizes the inspection program for Northstar since 2002.
2002 2003 2004 2005 2006 2002 2003 2004 2005 2006
Oil Pipe rack 1,200 - - - - - - - - - -
Oil – Well Pad 280 106 114 204 230 215 - - - - -
Water Pipe rack1 2,400 - - - - - - - - - -
Water – Well Pad1 70 17 25 46 53 34 - - - - -
Gas Pipe rack 600 - - - - - - - - - -
Gas – Well Pad 140 26 65 77 112 67 - - - - -
Totals 149 204 327 395 316 - - - - -
1Disposal system; Northstar does not have an active water injection system.Note: Line lengths are in feet as the production facility is contained in a comparatively small footprint.
ServiceLength,
feetInternal Inspection External Inspection
ACT Table B.5 Northstar Summary of Lines and NDE Inspections
Section B.4 Badami
Production from the Badami field began in 1998, however low production necessitated the shut-in of the Badami Field in the third quarter of 2003 and throughout all of 2004. Shut-in consisted of de-inventory and warm storage of major equipment. Prior to shut-in, Badami’s production fluids were considered a low risk from a corrosivity standpoint, as there is little water production and low CO2 content. Production from Badami was

Section B Corrosion Monitoring Activities
- 91 -
restarted in the fourth quarter of 2005. Startup and periodic inspections were performed on existing equipment. ACT Table B.6 summarizes this inspection program for Badami during 2006.
Service Feet Int. Insp. Ext. Insp.
Oil –Well Pad 840’WL , 320’ HDR 66 -
Gas 240’WL, 320’HDR 14 -
Disposal Well 400’ 18 -
Note Badami does not have an active water injection system.
ACT Table B.6 Badami Summary of Lines and NDE Inspections
Section B.5 Overall Inspection Activity Level
ACT Table B.7 summarizes the overall inspection activity since 2000. As can be seen, the overall activity level has remained approximately constant at ~3,400 items per year through 2002. A significant increase in inspections occurred in 2003 and forward. This is the result of additional inspections performed at Endicott and MPU.
Surface 2000 2001 2002 2003 2004 2005 2006
Endicott Int 1,346 1,480 1,686 2,072 2,216 3,152 3,566
Ext 16 16 40 856 731 104 62
Total 1,362 1,496 1,726 2,928 2,947 3,256 3,628
Milne Point Int 1,419 629 1,601 4,388 4,048 3,487 4,109
Ext 378 1,577 70 1,583 1,738 177 204
Total 1,797 2,206 1,671 5,971 5,786 3,664 4,313
Northstar Int - 16 149 204 327 395 316
Ext - - - - - - -
Total - 16 149 204 327 395 316
Badami Int 27 - 5 29 26 40 98
Ext - - - - - - -
Total 27 - 5 29 26 40 98
Grand Total 3,186 3,718 3,551 9,132 9,086 7,355 8,355
ACT Table B.7 Overall Inspection Activity Summary

Part 2 – Alaska Consolidated Team Business Unit
- 92 -
Section C Weight Loss Coupons
Section C.1 Endicott
ACT Table C.1 summarizes the Endicott corrosion monitoring performance for 2006 and historical data are shown in ACT Figure C.1.
The average WLC corrosion rate for the production system remains near 2 mpy; however as noted previously, the major portion of the system is fabricated from duplex stainless steel and these data are used primarily for monitoring produced fluid corrosivity and erosion tendency.
The lower, relatively constant corrosion rates in the water injection system reflect the effectiveness of the corrosion mitigation program. No water injection WLC locations experienced corrosion rates above the 2 mpy target for 2006.
System Access Fittings %WLC <2 mpy
Water Injection - Pads 17 100%
Water Injection – x-country 1 100%
Oil Production – Pads 71 54%
ACT Table C.1 Endicott Corrosion Coupon Monitoring
0
2
4
6
8
10
1995 1996 1997 1998 1999 2000 2001 2002 2003 2004 2005 2006
Ave
rage
Cor
rosi
on R
ate,
mpy
Production System Water Injection System 2 mpyTarget
ACT Figure C.1 Endicott Corrosion Coupon Summary

Section C Weight Loss Coupons
- 93 -
Section C.2 Milne Point
ACT Table C.2 summarizes the Milne Point Unit corrosion monitoring performance for 2006 and historical data are shown in ACT Figure C.2.
ACT Figure C.2 illustrates the low corrosion rates for the MPU production and water systems. Of concern historically were the relatively higher corrosion rates in the water injection system. These higher corrosion rates led to the initiation of corrosion inhibition in the water injection system in mid-2000. The monitoring results indicate the inhibition has had a positive effect, reducing corrosion rate as the WLC corrosion rates have consistently averaged less than 2 mpy. No WLCs exceeded the 2 mpy target in 2006.
A corrosion monitoring gap analysis was conducted in 2005 and as a result a proposal was made to increase the number of corrosion monitoring locations for more consistent coverage. Several new locations were added to the monitoring program to include additional weight loss coupons and electrical resistance probes. This work was completed in 2006.
System Access Fittings %WLC <2 mpy
Production System 26 94%
Water Injection System 5 100%
Source Water Coupons 6 100%
ACT Table C.2 MPU Corrosion Coupon Monitoring
0
5
10
15
20
1995 1996 1997 1998 1999 2000 2001 2002 2003 2004 2005 2006
Ave
rage
Cor
rosi
on R
ate,
mpy
PW Oil Source 2mpy Target
ACT Figure C.2 MPU Corrosion Coupon Summary

Part 2 – Alaska Consolidated Team Business Unit
- 94 -
Section C.3 Northstar
ACT Table C.3 shows the results of the corrosion monitoring program at Northstar for 2006. There are no historical data prior to 2003.
System Location Access Fittings
%WLC <2 mpy
Oil Production
Upstream of CI Injection 12 44%
Downstream of CI Injection 7 86%
Water Disposal
Upstream of Mud Addition 9 100%
Downstream of Mud Addition 2 50%
ACT Table C.3 Northstar Corrosion Coupon Monitoring, 2006
The 3-phase production is currently inhibited; however monitoring data continues to indicate the uninhibited well line corrosion rates are above the 2 mpy target. This is due to the corrosion monitoring locations being located upstream of the corrosion inhibitor injection location. Monitoring data collected from downstream locations show the inhibition program is effective in reducing corrosion rates to acceptable levels. The higher corrosion rates seen on weight loss coupons from the upstream locations indicate the need for inhibition of the upstream section. Operations has proceeded with the recommendation to move the corrosion inhibitor injection point further upstream, to the wellhead for the producing wells. Additionally, all new wells will be equipped to inject corrosion inhibitor at the well head. As of the end of 2006, all but one well have been equipped with wellhead inhibition. However, a significant portion of the coupon data still reflect uninhibited conditions as these changes were made throughout the year and many of the coupons did not see inhibitor for the full exposure period. The remaining well is expected to be converted to wellhead injection in 2007.
In addition to the weight loss coupon data, an electrical resistance probe was installed on the main production line to provide additional corrosion rate feedback. This probe data has been useful in correlating the corrosion rate excursions to periods when the corrosion inhibitor was being under-injected.
High corrosion rates in one of the water disposal wells are attributed to oxygenated mud from the grind-and-inject plant (mud) and the addition of oxygenated fluids from the sewage treatment facility. Although an oxygen scavenger has been tested in the grind-and-inject fluids, it was ineffective due to the low fluid temperatures. This system is being inspected on a quarterly basis to monitor for active metal loss.
A second disposal well was added to Northstar in 2004 and the monitoring data indicate the corrosion rate to be <2 mpy, similar to the inhibited portion of the produced water

Section C Weight Loss Coupons
- 95 -
piping. Operationally, this new disposal well has not seen any of the oxygenated mud from the plant.
Section C.4 Badami
Badami currently has no WLC-monitoring program, and relies on the inspection program presented in Section E to provide corrosion control feedback.

Part 2 – Alaska Consolidated Team Business Unit
- 96 -
Section D Corrosion Mitigation Activities
Section D.1 Endicott
Corrosion mitigation for the IIWL had historically relied on maintenance pigging for line cleanliness, biocide treatments to control bacterial activity and continuous injection of a corrosion inhibitor for corrosion control. The primary monitoring tool to determine effectiveness of these programs is the frequent UT inspection of 25 locations along the pipeline. These UT inspections are repeated quarterly, at a minimum.
ACT Figure D.1 shows the percent inspection increases and the number of inspections since 1995 for the IIWL. No inspection increases were identified in 2006, the second year in a row. This is the result of the optimization program begun in October, 2004 whereby the corrosion inhibitor concentration was increased from 20 to 30 ppm and biocide program was rebalanced. Additionally, the 2006 maintenance pigging program was fairly successful with seven runs completed out of a total nine runs scheduled (78%).
0%
5%
10%
15%
20%
25%
1995 1996 1997 1998 1999 2000 2001 2002 2003 2004 2005 2006
Per
cen
t In
spec
tion
In
crea
se
0
50
100
150
200
250
No.
of
Insp
ecti
ons
Percent Increase No. of Inspections
ACT Figure D.1 Endicott IIWL UT Readings
In the production system, the primary damage mechanism is erosion in the duplex stainless steel sections and corrosion in the carbon steel C-Spool sections. The erosion rate is monitored through inspection and mitigated through velocity management. Wells are risk ranked by mixture velocity once per month and the information is used to adjust the inspection frequency and fluid velocity. ACT Table D.1 is an overview of the average

Section D Corrosion Mitigation Activities
- 97 -
velocity data since 2001. Shown are the number of wells within V/Ve ratio ranges, where V is the actual mixture velocity and V/Ve is the allowable erosion velocity as defined by API-RP-14E9.
No. Wells Percent No. Wells Percent No. Wells Percent No. Wells Percent No. Wells Percent No. Wells PercentV/Ve<1 23 38% 12 21% 19 31% 12 21% 21 33% 28 44%
1<V/Ve<2 25 42% 31 54% 29 47% 31 54% 28 44% 25 39%2<V/Ve<3 11 18% 12 21% 13 21% 12 21% 14 22% 11 17%
V/Ve>3 1 2% 2 4% 1 2% 2 4% 0 0% 0 0%Total 60 100% 57 100% 62 100% 57 100% 63 100% 64 100%
20062004 2005V/Ve Range
2001 2002 2003
ACT Table D.1 Endicott Velocity Monitoring
API-RP-14E defines an allowable velocity for the avoidance of erosion, based on the fluid properties including density and material of construction. API-RP-14E is based on experience with steam service and is known to be conservative when applied to oil production systems, particularly where corrosion and erosion resistant materials are used. The aim is to limit actual velocities to less than 3 times the allowable velocity (V/Ve <3). which reflects BPXA’s experience with production fluids that contain minimal amounts of entrained solids flowing through stainless steel pipelines. Equipment exhibiting high velocities is inspected at intervals ranging from weekly to bi-annually dependant upon the V/Ve ratio, input from Well Operations, and inspection results. During 2006, no wells exceeded an average V/Ve >3.
Section D.2 Milne Point Corrosion inhibition of the water injection system began in mid-2000, in addition to implementing a more rigorous maintenance pigging program. Corrosion inhibitor concentration remains at 40 ppm. Weight loss coupon data indicate the system is under control as the WLC corrosion rates have averaged less than 2 mpy since mid-2000. This represents a significant reduction from previous years as can be seen in ACT Figure D.2. For the period 1996-2000, the average corrosion rate was approximately 7 mpy. Since the enhancement of the corrosion management program in 2000, the average WLC corrosion rate for the PW system has been reduced to less than 1 mpy. Although the corrosion rate monitoring data indicates good performance, the inspection data are indicating better control is needed in the PW service lines. As a result, an improved inhibitor has been recommended for trial.
Corrosion inhibition of the K-Pad 3-phase production flow line was initiated in 2001 after inspections indicated significant under-deposit corrosion damage. The damage was associated with low fluid velocities, allowing solids to accumulate in the line. In conjunction with the inhibition program, the K-Pad flow line is cleaned with a maintenance pig on routine schedule. Inhibition levels were increased in October 2003 to 56 ppm and again in April 2004 to 100 ppm as a result of active corrosion detected through routine inspection monitoring. In 2005, approximately 5,000 feet of the K-Pad line was replaced. Although the corrosion mechanism appeared to be under control, a
9 API-RP-14E - Recommended Practice for Design and Installation of Offshore Production Platform Piping System 5th Edition.

Part 2 – Alaska Consolidated Team Business Unit
- 98 -
decision was made in 2006 to replace the K Pad flow line. The line was mothballed and shut-in during May, 2006 and is scheduled for replacement.
0
5
10
15
20
1995 1996 1997 1998 1999 2000 2001 2002 2003 2004 2005 2006
Ave
rage
Cor
rosi
on R
ate,
mpy
Produced Water Avg CR Before Mitigation Ave CR After Mitigation 2mpy Target
ACT Figure D.2 Milne Point Produced Water Corrosion Rate Trend
The development at S-Pad was designed for continuous inhibition injection into the power fluid supply for the downhole hydraulic pumps. Since this water is separated and re-circulated as power fluid at the pad, a low amount (~10%) of the produced water is sent through the 3-phase flow line to the main separation facility. Additional makeup water for use in the power fluid system is treated at a rate of 20 ppm corrosion inhibitor. Since the production from S-Pad feeds into the K Pad flow line it was also mothballed and shut-in during 2006 as it awaits the K Pad flow line replacement.
The continuous inhibition of the production flow line carrying production from F, L, and C Pads was increased to 100 ppm from 56 ppm due to corrosion activity determined via the inspection program.
The B-Pad production line had continuous corrosion inhibition facilities installed in 2006 and is currently treated at a concentration of 100 ppm.
The Tract 14 production flow lines are in the process of being fitted with continuous corrosion inhibition facilities as a result of the recommendations made in 2005.
In addition, Milne Point has brought all the Tract 14 (Pads G, H, I and J) buried well pad piping above ground in 2006..
As production rates are typically low for the pipeline capacity, the fluid velocities are low and erosion is not a significant concern, therefore there is no formal velocity management program.

Section D Corrosion Mitigation Activities
- 99 -
Section D.3 Northstar
Northstar is inhibited with continuous injection of corrosion inhibitor into the well production lines. Inhibitor concentration was originally set at 100 ppm based on water rates, with a minimum of 2 gallons/day regardless of the production characteristics. Based on corrosion monitoring data, the corrosion inhibitor concentration has been raised to 125 ppm.
As noted in Section C.3, all wells with the exception of one have had the chemical injection point relocated to the wellhead by the end of 2006.
Section D.4 Badami
Corrosion inhibition is currently not required at the Badami field based on modeling of fluid corrosivity, the low water-cut, and the results from the facility and pipeline inspection program.

Part 2 – Alaska Consolidated Team Business Unit
- 100 -
Section E External/Internal Inspection
Section E.1 External Inspection
Section E.1.1 Endicott
Cased flow lines at Endicott are inspected by electromagnetic pulse test (EMT) at the intervals noted in ACT Table E.1.
Line Crossings Year Surveyed Method Max Inspection Interval
Water - Inter-Island 1 2001 EMT 10 Years
Gas Lift - Inter-Island 1 2001 EMT 10 Years
Oil 1 N/A N/A Duplex Stainless Steel
MI Line 11 N/A
Water – WL 2 1 line in 2000 EMT 10 Years for Carbon Steel
Other line is Duplex Stainless Steel
Gas - WL 1 2000 EMT 10 Years 1 New in 1998, inspection ports for sniffing, permanently sealed, can be inspected by excavation only
ACT Table E.1 Cased Piping Inspections
In addition, the vaults where the production, Inter-Island Water Line, and gas-lift pipelines pass are visually inspected annually. There was one external corrosion increase on the gas line which is slated for repair in 2007.
Section E.1.2 Milne Point
ACT Table E.2 summarizes the above-ground external inspection program at MPU since 1997 Three increases in corrosion were noted.
With regard to buried piping, since the Tract 14 (G, H I, and J Pads) below ground pad piping has been abandoned and new piping installed above ground, there are no inspection results to report. With respect to still existing below grade piping, excavations were conducted on Tract 14 flow lines and L-Pad piping. A total 460 inspections were conducted in 36 excavation sites throughout the MPU field.
Of the 460 inspections: • 237 inspections were repeat locations, of which 43 locations (18%) had
increases in damage. Of these 43 locations showing increases in corrosion activity, 33 were slight increases in damage, nine moderate and one large. All increases greater than slight were in produced water service.

Section E External/Internal Inspection
- 101 -
• The repeat inspection intervals ranges from approximately one to eight years, with an average of 3.1 years
• 223 locations were baseline inspections
Year Total Insp Repeat Insp Increases % I's
1997 26 0 0 n/a
1998 441 10 0 0
1999 101 65 0 0
2000 205 104 28 27
2001 179 20 5 25
2002 70 5 1 20
2003 1,583 55 1 2
2004 1,738 251 0 0
2005 131 1 0 0
2006 190 30 3 10
ACT Table E.2 MPU External Inspection Summary for Above-Ground Piping
Section E.1.3 Badami
External inspections that have been done to date at Badami are associated with the internal inspection program where insulation was removed for ultrasonic inspection of well line elbows. No evidence of external corrosion has been noted.
Section E.1.4 Northstar
Since the facility is less than six years old, an external inspection program has not yet been established. Plans for CUI inspection program are mention in Section H.
Section E.2 Internal Corrosion Inspection
Section E.2.1 Endicott
ACT Figure E.1 and ACT Figure E.2 indicate the percentage of inspection increases since 1995 for the well lines and flow lines at Endicott. There were no increases in the 3-phase, DSS production cross-country line. The inspection data for the 3-phase production system are used to alert Operations of potential replacements of the carbon steel C-Spools at the wellheads. The corrosion increases in carbon steel C-Spools are managed through planned replacement using the FFS criteria discussed in Appendix 3.3.5. In late 2006, a recommendation was made to begin replacing the carbon steel C-Spools with duplex stainless steel spools on as-needed basis.

Part 2 – Alaska Consolidated Team Business Unit
- 102 -
Corrosion activity in the water injection well lines had been increasing since 2000 and was addressed by increasing the corrosion inhibitor concentration by ~18% in 2003 and then by another 50%, to 30 ppm, in late 2004. The additional corrosion inhibitor reversed the increasing trend in 2004; however there was an increase in 2005 and a reduction in 2006. The majority of these increases are slight, whereas the increases during 2001-2003 were more significant. This trend is being monitored to determine what additional changes might be required to the PW inhibition program.
0%
10%
20%
30%
40%
1995 1996 1997 1998 1999 2000 2001 2002 2003 2004 2005 2006
% I
nspe
ctio
n In
crea
se
0
1,000
2,000
3,000
4,000
No.
of
Insp
ecti
ons
3 Phase Production Produced Water Total Inspections
ACT Figure E.1 Endicott Well Line Internal Inspection Increases
ACT Figure E.2 shows a significant decline of inspection increases from 1995 through 1998 for the IIWL at Endicott. There has been an increasing trend in inspection increases from 1998 through 2004, and again in 2006; however these data include the addition of inspection locations that have not been inspected in several years. These additional locations confirm that corrosion was occurring in the line; however the time period between inspections makes it difficult to determine when the corrosion actually occurred. A more accurate representation of corrosion activity through time was shown previously in ACT Figure D.1 which includes only data from inspections performed on a frequent basis. The frequently monitored locations show a decrease in corrosion activity during 2004, and no increases in 2005 or 2006.
The IIWL is maintenance pigged approximately every five weeks and smart pigged in 2006. The follow up inspections are continuing but initial results show no areas requiring repair. Adding additional inspection locations are being evaluated for the IIWL frequent monitoring program as a result of the smart pig run.

Section E External/Internal Inspection
- 103 -
0%
5%
10%
15%
20%
25%
1995 1996 1997 1998 1999 2000 2001 2002 2003 2004 2005 2006
% I
nspe
ctio
n In
crea
ses
0
100
200
300
400
500
No.
of
Insp
ecti
ons
PW/SW Total Inspection Count
ACT Figure E.2 Endicott Flow Line Internal Inspection Increases
Section E.2.2 Milne Point
BPXA became operator at Milne Point in 1994, and from this date to 2000 the inspection program was aimed at establishing the baseline condition in the MPU systems. It is only with the 2000 data and beyond that trending of inspection increases has been possible. The results of this comparative data can be seen in ACT Figure E.3. The figure shows the total number of inspection items has been, in general, increasing since 2001.

Part 2 – Alaska Consolidated Team Business Unit
- 104 -
0%
20%
40%
60%
80%
100%
1995 1996 1997 1998 1999 2000 2001 2002 2003 2004 2005 2006
% I
nspe
ctio
n In
crea
ses
0
200
400
600
800
1000
No.
of
Insp
ecti
ons
3 Phase Production Produced Water Total Inspection Count
ACT Figure E.3 MPU Flow Line Internal Inspection Increases
Overall the 3-phase flow lines were continuing to show a decreasing trend of locations with corrosion activity, however this activity has picked up in 2005 and 2006. A total of 21 increases were noted in the three phase flow lines in 2006. A summary of this activity and corrective actions are presented in ACT Table E.3
Location No. Increases Action
K Pad flow line 13 Line shut-in, to be replaced
F Pad flow line 3 Increased inhibition to 100 ppm
Tract 14 flow lines 5 Installing inhibition facilities
ACT Table E.3 Inspection Summary of Badami Well Lines
Maintenance pigging frequencies for the 3-phase system were increased from bi-annual to quarterly. Maintenance pigging of the water injection flow lines is done on a monthly basis.
The FLC production flow line was smart pigged in 2006 and inspection follow-up of smart pig results is being conducted. There were no areas requiring repairs.
The K Pad production flow line was smart pigged in 2006. Based on the inspection results, this line was shut-in and is scheduled for replacement.
A total of 36 inspection increases in the produced water flow lines is noted for 2005 and 2006. Whereas the corrosion monitoring indicates this system is under better control as

Section E External/Internal Inspection
- 105 -
compared to pre-inhibition, the inspection data suggests further intervention is required. Maintenance pigging activities will be conducted as in the past at a monthly frequency on PW lines.
ACT Figure E.4 shows the %I’s and number of inspections on well lines. Inspection activity has remained constant at approximately 2,700 items per year since 2004. The PW well line corrosion activity continues to show a decreasing trend over the past several years.
The three phase well lines damage rate has remained essentially level over the past two years at about 2% of repeat locations showing an increase in corrosion activity. There is currently no corrosion inhibition program for the production well lines.
0%
10%
20%
30%
40%
1995 1996 1997 1998 1999 2000 2001 2002 2003 2004 2005 2006
% I
nspe
ctio
n In
crea
ses
0
1,000
2,000
3,000
4,000
No.
of
Insp
ecti
ons
3 Phase Production Produced Water Total Inspections
ACT Figure E.4 MPU Well Line Internal Inspection Increases
Section E.2.3 Badami
The Badami Field was shut-in August of 2003 due to declining production. A post shutdown inspection was performed to serve as a baseline for a follow-up inspection in the third quarter of 2004 as a check to assure equipment was properly laid up in 2003. A follow up inspection performed in 2004 indicated no increase in corrosion activity from the 2003 shut-in baseline survey. The Badami Field was re-started in October 2005 was placed back on the integrity inspection cycle.
Although the data set is limited, inspections support the overall assertion that Badami fluids have low corrosivity. ACT Table E.4 is a summary of well line inspections for Badami. The four inspection increases noted occurred on two well lines. All increases were categorized as slight damage and are being inspected quarterly to verify the damage rate.

Part 2 – Alaska Consolidated Team Business Unit
- 106 -
Year Oil Gas Disposal Total Repeat Insp
Locations with Increasing Damage
1998 28 3 - 31 0 -
1999 - - - - - -
2000 15 6 6 27 18 -
2001 - - - - - -
2002 5 - - 5 4 -
2003 21 5 3 29 19 1
2004 18 5 3 26 26 -
2005 29 7 4 40 34 1
2006 66 14 18 98 96 4
Note: 2004 data associated with shutdown operation; 2005 associated with restart operation
ACT Table E.4 Inspection Summary of Badami Well Lines
Section E.2.4 Northstar
During 2006, a total of 316 well line inspections were completed. Eighteen locations in the three phase system, four location in the disposal system and three locations in the gas system had inspection increases as compared to 16, one and four, respectively, the prior year. It has been stated in previous reports that the 3-phase locations and the gas system locations showing increasing corrosion are all in heavy wall target tees and elbows. This heavy wall piping presents a significant challenge to determining if the wall loss is due to corrosion or to the rough geometry effects of the thick walled sections. The rough geometry can skew readings by 2-3 percent or ~50 mils in a piece 1-1/2 inches thick. For this reason, these locations are monitored on a quarterly basis.
Inspection increases in the disposal well are believed to be associated with oxygenated fluids from the drilling mud plant and also oxygenated fluids introduced from the effluent system. Options for reducing the dissolved oxygen content of the fluids introduced into the disposal system from the effluent are under review. The disposal system is inspected on a quarterly basis. Inspection increases in the gas injection well lines is believed to be related to temporary plant upset conditions which “push” some water to the injection system. The damage will be limited to the excursion period as subsequent dry gas will sweep any water remaining in the system. Control options are limited as the system runs at too high a temperature to be treated with current inhibitor technology. The lines are inspected on a quarterly basis. These data are summarized in ACT Table E.5.

Section E External/Internal Inspection
- 107 -
3-Phase Disposal Gas Total
Number of Inspections 215 34 67 316
Number of Repeat Inspections 196 33 67 296
Locations with Increasing Damage 18 4 3 25
% Inspection Increase 9% 12% 4% 8%
ACT Table E.5 Inspection Summary of Northstar

Part 2 – Alaska Consolidated Team Business Unit
- 108 -
Section F Repair Activities ACT Table F.1 summarizes the repair activity for ACT. There were 15 repair locations identified for ACT. Fourteen were internal repairs at Milne Point all associated with the K-Pad flow line which has subsequently been shut-in for replacement. There was one repair for internal corrosion at Endicott on an elbow in well line 4-02.
Service Type Internal External Mechanical
Oil FL 14 - -
WL 1 - -
Gas FL - - -
WL - - -
PW FL - - -
WL - - -
Total 15 0 0
ACT Table F.1 ACT Repair Activity

Section G Corrosion and Structural Related Spills and Incidents
- 109 -
Section G Corrosion and Structural Related Spills and Incidents There were no structural related leaks or corrosion related spills in ACT in 2006. ACT Table G.1, ACT Table G.2, ACT Table G.3, and ACT Table G.4 summarize leak/save and mechanical repair data for Endicott, MPU, Northstar and Badami, respectively.
Service Leaks Saves
Oil x-country lines - -
Oil Well Pads - 1
Water x-country lines - -
Water Well Pads - -
Gas x-country GLT/MI - -
Gas Well Pads - -
ACT Table G.1 Endicott Leak/Save and Mechanical Repair Data
No leaks occurred at Endicott in 2006. One save was recorded on well 4-02 well line as noted above.
Service Leaks Saves
Oil x-country - 14
Oil Well Pads - -
Water x-country - -
Water Well Pads - -
Gas x-country - -
Gas Well Pads - -
ACT Table G.2 Milne Point Leak/Save & Mechanical Repair Data
There were no leaks and 14 saves for MPU in 2006. All saves were associated with the K-Pad three phase flow line.

Part 2 – Alaska Consolidated Team Business Unit
- 110 -
Service Leaks Saves
Oil – Well Pad - -
Gas – Well Pad - -
Disposal Well - -
ACT Table G.3 Northstar Leak/Save and Mechanical Repair Data
There were no leaks or saves for Northstar in 2006.
Service Leaks Saves
Oil – Well Pad - -
Gas – Well Pad - -
Disposal Well - -
ACT Table G.4 Badami Leak/Save and Mechanical Repair Data
There were no leaks or saves for Badami in 2006.

Section H 2007 Corrosion Monitoring and Inspection Goals
- 111 -
Section H 2007 Corrosion Monitoring and Inspection Goals
Section H.1 Endicott
The IIWL corrosion inhibition and monitoring program will continue to maintain the current decreased trends in corrosion activity.
A new inhibitor will be considered in the Endicott water injection system pending the trail at Milne Point Unit.
The well line erosion rate monitoring program will continue.
Carbon steel C-Spools will be replaced on an as-needed basis to duplex stainless steel.
No significant changes to the corrosion-monitoring program are anticipated.
Section H.2 Milne Point
The 2007 plan will continue the inspection program to provide feedback for corrosion control and mechanical integrity.
A study was made in 2004/2005 to determine the best way forward for corrosion mitigation of remaining uninhibited areas of the field. These options will be progressed further in 2006/2007.
Monitor and report results of new inhibitor trial in the Milne Point Unit water injection system.
With the recent upgrade to the corrosion monitoring program, the new data will be incorporated into the control program.
Section H.3 Northstar
Corrosion monitoring and inspection data will continue to be reviewed as the information becomes available. Changes to the inspection and mitigation activity will be dictated by these data in conjunction with process data. This is an ongoing activity that will continue for a number of years as the corrosion management evolves.
The recommendation to relocate the chemical injection points to the wellhead was provided, and Operations is proceeding with these modifications as materials become available. The project is expected to be completed by year end 2007 (one well remaining). Additionally, all new wells will be equipped with capability to inject corrosion inhibitor at the wellhead.
The water disposal system will be evaluated for the effect of the effluent system carryover to assure adverse effects of dissolved oxygen are minimized. Further analysis will be performed to determine the level of corrosion activity and recommendations will be based on that evaluation.
The gas injection system corrosion will continue to be monitored through inspection.
The CUI program will be initiated in 2007.
Section H.4 Badami
Badami will continue to be evaluated through the integrity plan for operation of the field.


Appendix 1
Glossary of Terms


Appendix 1
- 115 -
Glossary of Terms Term Definition/Explanation
3 phase production Unprocessed well head fluids, oil, water, gas – same as OIL ACT Alaska Consolidated Team
ATRT Automated tangential radiographic testing BAD Badami bpd Barrels per day
BPXA BP Exploration (Alaska) Inc. CCL Cross country line
CI Corrosion inhibitor CIC Corrosion, Inspection and Chemicals CIP Comprehensive Inspection Program CL Common line – same as LDF
CMS Corrosion management system CPF Central processing facility CR Corrosion rate, mpy
CRA Corrosion resistant alloy CRM Corrosion rate monitoring inspection program
Cross Country lines Pipelines from the manifold building to major facility CUI Corrosion under insulation CW Commingled Water
DRT Digital radiography END Endicott
ER Electrical resistance probe – see corrosion monitoring ERM Erosion rate monitoring inspection program
FL Flow line – same as cross-country FIP Frequent inspection program
Frequency C Continuous Frequency D Daily Frequency H Hourly Frequency M Monthly Frequency Q Quarterly Frequency Y Yearly/annual
FS Flow station G Gas
GC Gathering center GLT Gas lift transit GPB Greater Prudhoe Bay
IIWL Inter Island Water Line - Endicott ILI In-line Inspection or Smart Pig
LDF Large diameter flow line – same as CL LIS Lisburne
MAOP Maximum Allowable Operating Pressure MFL Magnetic flux leakage
MI Miscible injectant mil 0.001 in.
MIMIR Mechanical Integrity Management Information Repository BPXA corrosion and inspection database
MPI Main Production Island - Endicott Mbpd Thousands of barrels per day mpy Corrosion rate/degradation rate – mils per year

Appendix 1
- 116 -
Glossary of Terms Term Definition/Explanation MPU Milne Point Unit MW Mixed water
NDE/NDT Non-destructive examination/testing NIA Niakuk NGL Natural gas liquids NST Northstar OIL OIL service is 3-phase production service
OWG Oil, water and gas – 3-phase production PBU Prudhoe Bay Unit PO Processed oil
ppb Parts per billion ppm Parts per million
PR Pitting rate, mpy PTMAC Point McIntyre
PW Produced water RT Radiographic testing
SDI Satellite drilling island Sleeve Mechanical repair
Slug catcher First stage pressure vessel of OWG separation facility STP Seawater Treatment Plant SW Seawater TR Transit line
TRT Tangential radiographic testing UT Ultrasonic testing
VSM Vertical support member WAG Water alternating gas
WL/Well lines Pipelines from the well head to manifold building WLC Weight loss coupon WPM Well pad manifold building WSS Walking speed survey WTR Combined seawater and produced water injection
X-country Cross country

Appendix 2
Work Plan Guide for Performance Metric Reporting


Appendix 2 (a) Work Plan
- 119 -
2000 Work Plan
Commitment to Corrosion Monitoring
Phillips Alaska, Inc.
BP Exploration (Alaska) Inc.
“BP and Phillips will, in consultation with ADEC, develop a performance management program for the regular review of BP's and Phillips’ corrosion monitoring and related practices for non-common carrier North Slope pipelines operated by BP or Phillips. This program will include meet and confer working sessions between BP, Phillips and ADEC, scheduled on average twice per year, reports by BP and Phillips of their current and projected monitoring, maintenance and inspection practices to assess and to remedy potential or actual corrosion and other structural concerns related to these lines, and ongoing consultation with ADEC regarding environmental control technologies and management practices.” Work Plan Purpose:
The purpose of this work plan is to clearly define the purpose, scope, content, reporting requirements, roles and responsibilities, and milestones/timing for the development and implementation of the Corrosion Monitoring Performance Management Program required by Paragraph II.A.6 of the North Slope Charter Agreement.
Corrosion Monitoring Performance Management Program Purpose: To provide for 'the regular review of BP and PAI’s corrosion
monitoring and related practices for non-common carrier North Slope pipelines' operated by BP or PAI. 'Corrosion Monitoring' specifically refers to the activity of monitoring pipeline corrosion rates via corrosion probes, corrosion coupons, internal pipeline inspections, and external pipeline inspections. 'Related practices' refers to the assessment of corrosion monitoring data and the associated response to the assessment, specifically chemicals, inspection, and repairs.
Scope: Non-common carrier North Slope pipelines operated by BP or
Phillips Alaska, Inc.

Appendix 2 (b) Guide for Performance Metric Reporting
- 120 -
“Non-common carrier pipelines” refer to Non-DOT-regulated pipelines. Included in this designation are cross-country and on-pad pipelines in crude, gas, and other hydrocarbon services, as well as, produced water and seawater service pipelines. In module and inter-module on pad piping are not considered part of the scope of this review program.
Content: This Corrosion Monitoring Performance Management Program consists of the following:
1. BP and PAI will “meet and confer” with ADEC twice per year, on average. These sessions will be “working sessions” where BP and PAI will inform ADEC of the following:
A. Summary description of the inspection and maintenance practices used to assess and to remedy potential or actual corrosion, or other significant structural concerns relating to these lines, which have arisen from actual operating experience. This description will address overall areas of focus, the rationale for this focus, and the nature of monitoring and related practices used during the time since the last meeting. This description may be brief if strategies/focus areas have not changed since the last meeting.
B. Summary overview of ongoing coupon and probe monitoring results.
C. Summary overview of chemical optimization activities.
D. Summary overview of ongoing internal inspection activities.
E. Summary overview of ongoing external inspection activities.
F. Summary overview of ongoing structural concerns.
G. Summary of conclusions drawn and responses taken to remedy potential or actual corrosion concerns relating to these lines.
H. Review/discussion of corrosion or structural related spills and incidents
I. Review the actions developed by the operator to address any corrosion performance trends that significantly exceed expected parameters.
J. Summary of program improvements and enhancements, if applicable.
K. Review of annual monitoring report (see below) at the next scheduled semi-annual meeting.
The agenda for these meetings will also include an opportunity for open discussion and an opportunity for ADEC to ask questions, provide feedback, etc.

Appendix 2 (a) Work Plan
- 121 -
These meetings will be targeted for April and October of each year, although this timing can be adjusted upon the mutual agreement of BP, PAI, and ADEC. The location of the meetings will alternate between the parties.
2. BP and PAI will submit annual reports to ADEC, which will provide the status of current and projected monitoring activities. These reports will be issued on or before March 31st of each year, and reflect the prior calendar year. The following information will be provided:
A. Annual bullet item reporting the progress of the Charter Agreement corrosion related commitment.
B. A general overview of the previous year’s monitoring activities.
C. Metrics that depict coupon and probe corrosion rates.
D. Metrics that characterize chemical optimization activities.
E. Metrics that depict the number and type of internal/external inspections done, and, as applicable, the corrosion increases/rates and corresponding inspection intervals.
F. Metrics that characterize the quantity and type of repairs made in response to the internal/external inspections done per the above paragraph.
G. Metrics that depict the numbers and types of corrosion and structural related spills and incidents.
H. A forecast of the next year’s monitoring activities in terms of focus areas and inspection goals. These forecasts cannot be viewed as binding, as corrosion strategies are dynamic and priorities will change over the course of the year. However, changes in focus will be communicated to ADEC during the semi-annual meetings described above.
Note: These reports will be presented in, and be part of, a comprehensive North Slope Charter Agreement status report.
3. In addition to the semi-annual “meet and confer” working sessions referenced above, BP and PAI will remain accessible to provide “ongoing consultation” to ADEC regarding environmental control technologies and management practices.
'Environmental Control Technologies' refer to those technologies specifically related to corrosion monitoring and mitigation of the subject pipelines.
'Management practices' refer to corrosion monitoring and related practices as defined above.
4. During the semi-annual 'Meet and Confer' working meetings with BP and/or PAI, ADEC may use the services of a corrosion expert(s) (contracted from

Appendix 2 (b) Guide for Performance Metric Reporting
- 122 -
funds under Charter Commitment paragraph II.A.7) to assist in the review of performance trends and corrosion program features.
5. BP has assigned CIC Manager, R. Woollam/564-4437, and Phillips has assigned Kuparuk Engineering and Corrosion Supervisor M. Cherry and J. Huber/659-7384, to be the contacts responsible for ensuring these commitments are met, including ADEC notification of scheduled times for the semiannual presentations. The ADEC contact for this effort is (Pipeline Integrity Section Manager/S. Colberg/269-3078) who will notify interested personnel of the presentation times, maintain the reports for distribution to the public when requested and coordinate other issues relating to this commitment.
Annual Timetable
March 31st Annual Report
April 30th 1H Semi-Annual Review (Meet and Confer)
October 31st 2H Semi-Annual Review (Meet and Confer)

Appendix 2 (b) Guide for Performance Metric Reporting
- 123 -
Guide for Performance Metric Reporting
General
• Different metrics show and reveal different aspects of the business and as a consequence there are rarely any 'right' or 'wrong' measures only 'right' or 'wrong' application and usage.
• Summary statistics described below may be provided as a data appendix to the annual reports with the more pertinent tables and graphics being contained in the text as appropriate. The intent is not to clutter and interrupt the flow of the text with extraneous data.
• Format of data, the order in which it is presented, etc. of each company’s annual report may differ from the order presented below, depending on key messages and data context. For example, one company may choose to imbed Leak/Save data into an inspection graph as opposed to presenting the Leak/Save data in standalone tabular format.
• This is an initial document for implementation in the 2001 annual report to ADEC, it should be noted, that the guidelines provided below can and will be adjusted to improve the efficacy of the annual report and reporting mechanism.
Timescale
• Data to be presented on an aggregate annualized basis.
• Base year 1995 providing 5 year history before the start of the Charter Agreement and each year's annual report will add to time series starting in 1995.
•
Equipment Classification
• Well Line Pipe work from the well head to the Well Pad Manifold Building, generally, the flow from a single well prior to commingling before transportation to the separation plant.
• Flow Line Pipe work from the Well Pad Manifold Building to the Separation plant, generally, cross country and off pad pipe work which carries commingled flow to/from a well pad. Also, straight run flow from the wellhead to separation plant, without commingling, is classified at Flow Line pipe work.
• Exceptions Pipe work not conforming to these basic definitions will be reported by exception.

Appendix 2 (b) Guide for Performance Metric Reporting
- 124 -
Service Definitions
• Three Phase Production (3ø or OWG) Basic reservoir fluids (O/W/G – oil, water and gas) produced from down hole through to the main separation plants that typically see only see changes in temperature and pressure from reservoir conditions and are therefore essentially un-separated.
• Seawater (SW) Water sourced typically from the Beaufort Sea that has undergone primary treatment at the Seawater Treatment Plant. Note, that the seawater treatment plants differ across the slope in the primary treatment methods, most importantly oxygen removal, with both production gas and vacuum stripping being employed.
• Produced Water (PW) The water produced with the primary reservoir 3 phase production after passing through the separation and treatment
• Commingled Water (CW) or Mixed Water (MW) Water which has been commingled and is therefore multi-sourced, this is typically a mix of SW and PW although other combinations exist in the operations on the North Slope.
• Gas (G) Generic term for a number of different gas systems which transport essentially dry gas between facilities including fuel gas, lift gas and miscible injectant.
• Processed Oil (PO) The oil/hydrocarbon produced with the primary reservoir 3 phase production after separation and treatment, this is primarily black oil but could include black oil plus NGL's.
Basic Summary Statistics
• Distribution The data is fundamentally of log-normal distribution, with a lower limit of zero or no-change and potentially unlimited upper extent.
• Count A count of the number of activities completed i.e. coupons pulled in a given year.
• Average The average or mean for the criteria being summarized i.e. average corrosion rate.
• Target Value The target value against which non-conformance, see below, is reported.
• Number Non-conformant The number of items not conforming to the control criteria i.e. the number of coupons exceeding the control value.
• Percentage Non-conformance The percentage not conforming to the control value as a percentage of the total.

Appendix 2 (b) Guide for Performance Metric Reporting
- 125 -
Weight Loss Coupon Data
Table below summarizes the reporting of weight loss coupon data for the major fields on the North Slope
Well Lines CCL/FL
3 ø Production All All
Seawater GPB All
Prod. Water GPB GPB
Commingled Water All All
The data sets to be provided for both general corrosion rates and pitting rates are,
• Count of coupons,
• Average corrosion rate,
• Number non-conformant,
• % Conformant i.e. 1 minus the % non-conformant.
A corrective action list for non-conformant flow lines (FL/LDF/CCL/CLs) will also be provided.
Internal Inspection Data
Table below summarizes the reporting of internal corrosion inspection data for the major fields on the North Slope:
Well Lines CCL/FL
3 ø Production All All
Commingled Water All All
Note that no distinction will be made between water services across the North Slope since in many cases the service is variable making meaningful analysis and aggregation difficult.
The data sets to be provided for internal inspection are,
• Count of inspections,
• Number of increases on repeat inspection locations,
• Percentage of increases on repeat inspections.
A corrective action list for flow lines (FL/LDF/CCL/CLs) with inspection increases will also be provided.

Appendix 2 (b) Guide for Performance Metric Reporting
- 126 -
Corrosion Inhibition
The corrosion inhibition program is to be reported as the target and actual total annual gallons and gallons per day, and as concentration, ppm, based on a field wide average.
External Corrosion Inspection
External corrosion inspection program is to be reported as an aggregate of all piping systems without distinction or differentiation of service and equipment type with a summary of the overall program status.
The data sets to be provided for external inspection are,
• Count of inspected location,
• Number of corroded locations,
• Percentage of inspection locations corroded.
Repair and Leak Statistics
The repair and leak/spill statistics to be reported for each year plus the historical trend back to 1995 consistent with other performance metrics. The basic definitions,
Leak/Spill An agency reportable leak/spill for the pipelines covered under the Charter Agreement which was caused by corrosion and/or erosion
Save A location which required repair action as a result of corrosion and/or erosion damage but which was found through inspection prior to causing a leak/spill
The data sets to be provided for Repair/Leak statistics,
• Count of Leaks/Saves by flow line and well lines,
• Summary of leak/spill causes.
Below Grade Piping
The data sets to be provided for Below Grade Piping (BGP) program,
• Number of segments/crossings inspected broken out by inspection method,
• Number with anomalies and severity of anomaly.
Results of casing digs, visual casing inspections and casing clean-out to be reported as appropriate.

Appendix 2 (b) Guide for Performance Metric Reporting
- 127 -
Other Programs
Reporting of ER probe, smart pigging, maintenance pigging, structural issues, and details of individual spill incidents to be reported as dictated by the current year's program activity.


Appendix 3
Corrosion Management System


Appendix 3 Corrosion Management System
- 131 -
Appendix 3 Corrosion Management System This section summarizes the Corrosion Management System (CMS) in use at Greater Prudhoe Bay (GPB) Performance Unit. Figure 7 contains a schematic of a typical production facility configuration. A map and brief description of each field and the associated production facilities can be found in Figure 8 and Table 16 BPXA North Slope Operations.
Appendix 3.1 Corrosion Management System
Appendix 3.1.1 Description
The Corrosion Management System consists of a number of major program elements: Corrosion Monitoring, Erosion Monitoring, Corrosion Mitigation, Inspection and Fitness-For-Service assessment, which follow a simple management process, represented in Figure 1. The CMS elements are summarized in Table 9, Table 10 and Table 11,at the end of this section. The Corrosion, Inspection and Chemical (CIC) Group utilizes data presented in this report as part of the overall Corrosion Management System.
The overall objective of the CMS is to meet the corporate objectives of 'no accidents, no harm to people and no damage to the environment' which translates for corrosion management within BPXA to delivering a mechanical integrity program which:
• Minimizes health, safety, and environmental impacts of corrosion resulting from a loss of containment.
• Provides an infrastructure fit-for-service for the remainder of the life of the oilfield.
• Provides infrastructure of sufficient mechanical integrity capable of producing satellite fields/accumulations through existing main production facilities and infrastructure.
• Provides an infrastructure to support future major gas production and sales through current North Slope facilities.
These overall goals and objectives are achieved through a comprehensive Corrosion Management System that consists of an integrated system of strategy, processes and programs.

Appendix 3 – Corrosion Management System
- 132 -
OverallCorrosion Monitoring
ER ProbesWeight Loss CouponsProcess Monitoring
Erosion MonitoringMixture Velocity
Corrosion MitigationCorrosion Inhibition
Erosion MitigationWell POP/Vel<V/Ve
InspectionCRM/ERM/FIP/CIP/CUI
Fitness-for-ServiceASME B31G
Cont. Improvement
Evaluation
Implementation
Objectives
CorrectiveAction Mitigation.Rate
ThicknessFFS
Monitoring
InspectionLongTerm =
Corrosion Management System
Process
Programs
Step: Program Elements
Plan: ObjectiveTarget
Do: Implmentation
Check: Evaluation
Act: Corrective Action
WeeklyWeekly review meeting
MonthlyMajor element review
QuarterlyPerformance Review
AnnualStrategic Review/ADEC
Inspection TechniquesRadiographyTangential radiographyUltrasonicGuided waveElectro-magnetic pulseMagnetic flux smart-pig
Monitoring TechniquesWeight loss coupons
General rate, mpyPitting rate, mpy
ER probesGalvanic probeLinear polarization
Feedback/ReviewProcess Monitoring
Mixture velocityWater cutTemperaturePressureDissolved oxygenFe countMicrobiological
Figure 1 Overview of the Corrosion Management Process
Appendix 3.1.2 Process
Within the overall Corrosion Management System, each specific program element, i.e. Corrosion Monitoring, Mitigation, Inspection and Fitness-For-Service, follows the classic TQM (Total Quality Management) process of 'plan-do-check-act' and consists of,

Appendix 3 – Corrosion Management System
- 133 -
Step Activity Description
Objective The program objective and purpose Plan
Target The metric against which performance is assessed
Do Implementation Implementation plan to achieve objective
Check Evaluation Method to evaluate performance of plan against target
Act Corrective Action The action required to correct deviation from target
Table 1 Corrosion Management Process
Appendix 3.1.3 Objectives and Targets
The objectives10 for the CMS are set in order to support the delivery of the corporate objective and BPXA objectives described in the Foreword. For the purposes of the CMS these can be translated into the corrosion management objectives of;
• Eliminate corrosion and erosion related failures,
• Provide Fit-For-Service infrastructure to the end of field life.
Based on these objectives, individual targets are set for the corrosion, erosion, mitigation and inspection programs, which in combination are designed to deliver the objectives. The overall business objectives and individual program objectives and targets are described in detail in Table 9, Table 10 and Table 11.
For example, the weight loss coupons (WLC) in the 3-phase production system have a corrosion rate target of 2 mils per year (mpy). The monitoring program objective is to meet or beat this target, which means an actual WLC corrosion rate of 2 mpy or less (WLC ≤2 mpy).
Appendix 3.1.4 Implementation
There are a number of different corrosion monitoring and inspection techniques, each of which has both advantages and disadvantages. The advantages and disadvantages, or strengths and weaknesses, make the results from an individual technique more or less applicable depending on the application circumstances.
Table 12, Table 13, and Table 14 summarize the main categories of corrosion monitoring, process monitoring, inspection techniques and briefly summarize relative strengths and weaknesses for different applications.
Appendix 3.1.5 Evaluation
The elements of the CMS have to be applied to each system at GPB to reflect their applicability and efficacy. The corrosion and erosion monitoring, inspection and mitigation practices for the major services and equipment type are summarized in Table 15.
10 In addition to Charter Work Plan, some information is supplied to provide additional context and help in understanding BPXA corrosion management activities

Appendix 3 – Corrosion Management System
- 134 -
The results from each of the corrosion management programs are reviewed on a regular basis to provide feedback and to take any necessary corrective action based on deviation from target performance. In general, the major review cycles within the CMS are presented in Table 2.
Review Description
Weekly A weekly internal review meeting at which the latest corrosion monitoring, mitigation, inspection and process data are analyzed and reviewed, and any tactical changes implemented
Monthly Monthly summary of the major elements of the program are reviewed for the need for longer term corrective action
Quarterly Quarterly strategic performance review held in order to ensure that the implementation plan is delivering the strategic objectives
Annual Annual program and strategy review designed to review the strategic direction of the program and review effectiveness of the current programs in delivering the strategic direction, e.g. Annual Report to ADEC
Table 2 Corrosion Management Feedback Cycles
Based on the results of the evaluation process, corrective action plans are developed and the overall management program and strategic direction are reviewed.
Appendix 3.1.6 Corrective Action
Corrective actions provide feedback to the adjustment and setting of Objectives and Targets. Corrective actions can be broken down into five basic categories;
• Chemical Mitigation,
• Operational Intervention,
• Reduce Maximum Operating Pressure (Derate),
• Repair/Replacement,
• Abandon or Remove from Service.
Chemical mitigation is discussed in detail in Section D. Operational intervention centers on the GPB Velocity Management Program that is designed to control internal mixture velocity below target values dependent on equipment type, water cut and line size. Repair/replacement programs are driven by the inspection findings and include mechanical sleeves, pipe work refurbishment, and pipeline replacement.

Appendix 3 – Corrosion Management System
- 135 -
Appendix 3.2 Corrosion and Inspection Data Management
In order to deliver a comprehensive corrosion management program and manage the extensive corrosion monitoring and inspection activity, it is necessary to have an active and structured electronic database.
With the introduction of single-operatorship at Greater Prudhoe Bay one of the major problems faced by the CIC Group was the integration of two historical data sets for inspection, corrosion monitoring and corrosion mitigation information.
There has been a significant investment in resources in order to bring together these two different histories from incompatible databases based on early 1990's technology.
Appendix 3.2.1 MIMIR Database
The database development effort has involved a dedicated team of software developers and also significant resources from within the CIC Group. The program is currently a “work in progress” and in 2005 BP/CIC will continue work on the development of chemical management, electronic data recording, tank and vessel, and standard reporting modules.
Users of the system are provided two primary methods for accessing data stored in the database. The first is a custom user interface written in Microsoft Visual Basic©, and the second is through ad-hoc data query tools such as BrioQuery© and BusinessObjects© which allow free-form SQL© access to the data.
Checks for data integrity are provided at a number of different levels including error checking at the point of data capture and data entry, regular reviews of data quality, and data entry rules within the database.
The data is continuously monitored for integrity, quality and consistency; as a consequence any errors detected are corrected as they are found. In addition, as better analysis tools become available through further integration then records are amended to reflect the improved level of analysis.
As a result of the ongoing quality effort and the tracking of production/service changes, this is a 'live' database and therefore as the system changes then the records returned will change. The following are some of reasons why returned values change through time,
Quality Control and Audit A fundamental design philosophy for the database was that errors should be corrected through time as they are discovered. Therefore as the database is used and the quality control rules and procedures applied, data-entry, translation and record-keeping errors are eliminated.
Equipment Service Changes The database tracks active, in or out-of-use equipment, and equipment service changes. As a piece of equipment moves through different services and different status, then the data in the database tracks the equipment status.
Transition Issues As noted above, the two historical databases, heritage East and heritage West, were incompatible with very different structures and data fields. Therefore these have had to be translated to the new system. As the quality control and audit tools are applied to the translated data, error and mistranslations are removed.
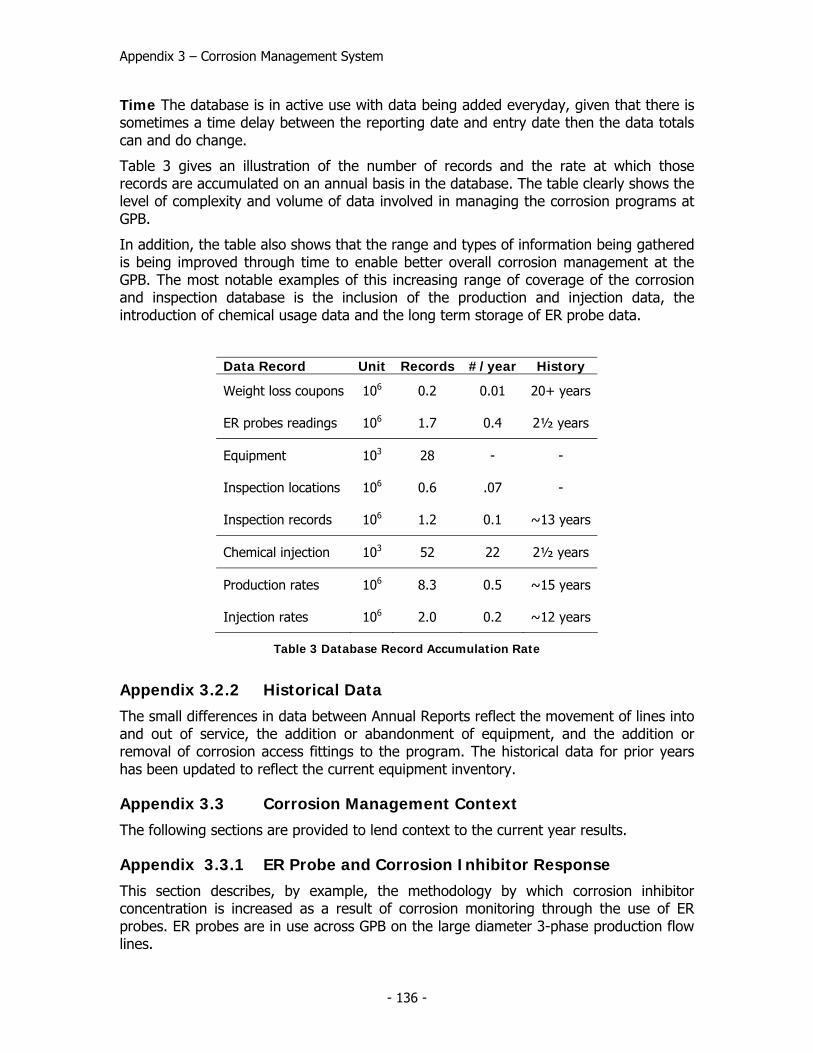
Appendix 3 – Corrosion Management System
- 136 -
Time The database is in active use with data being added everyday, given that there is sometimes a time delay between the reporting date and entry date then the data totals can and do change.
Table 3 gives an illustration of the number of records and the rate at which those records are accumulated on an annual basis in the database. The table clearly shows the level of complexity and volume of data involved in managing the corrosion programs at GPB.
In addition, the table also shows that the range and types of information being gathered is being improved through time to enable better overall corrosion management at the GPB. The most notable examples of this increasing range of coverage of the corrosion and inspection database is the inclusion of the production and injection data, the introduction of chemical usage data and the long term storage of ER probe data.
Data Record Unit Records #/year History
Weight loss coupons 106 0.2 0.01 20+ years
ER probes readings 106 1.7 0.4 2½ years
Equipment 103 28 - -
Inspection locations 106 0.6 .07 -
Inspection records 106 1.2 0.1 ~13 years
Chemical injection 103 52 22 2½ years
Production rates 106 8.3 0.5 ~15 years
Injection rates 106 2.0 0.2 ~12 years
Table 3 Database Record Accumulation Rate
Appendix 3.2.2 Historical Data
The small differences in data between Annual Reports reflect the movement of lines into and out of service, the addition or abandonment of equipment, and the addition or removal of corrosion access fittings to the program. The historical data for prior years has been updated to reflect the current equipment inventory.
Appendix 3.3 Corrosion Management Context
The following sections are provided to lend context to the current year results.
Appendix 3.3.1 ER Probe and Corrosion Inhibitor Response
This section describes, by example, the methodology by which corrosion inhibitor concentration is increased as a result of corrosion monitoring through the use of ER probes. ER probes are in use across GPB on the large diameter 3-phase production flow lines.

Appendix 3 – Corrosion Management System
- 137 -
Figure 2 and Table 4 illustrate the use of ER probes in managing changing corrosion conditions in a large diameter flow lines. Figure 2 shows the ER probe readings and derived corrosion rates, over a period of approximately 10 months in 2003. For the first 10 weeks the measured corrosion rate is bordering on 2 mpy and a 5% increase in CI is implemented. In early February the existing ER probe was replaced due to data quality issues. In mid March another increase of CI was implemented based on ER probe corrosion rate. During April and part of May, the CR still exceeded the target and two additional CI increases were implemented. Finally in mid-May, the CR falls below the 2 mpy target and the CI remains at the increased concentration.
Time Period Comments
14-Jan Probe placed on watch list
14-Jan to Feb 11 Probe at or near 2 mpy, 5% increase in pad CI target
14-Feb Poor data quality, ER probe replaced.
18-Feb to 21-Mar Probe continues to show rate >2mpy, 10% increase in pad CI target
21-Mar to 30 Apr Probe continues to show rate >2mpy, 10% increase in pad CI target
01-May to 01-Oct Probe shows rate <2mpy, No adjustments to CI target
Table 4 Corrosion Inhibitor Concentration vs. Corrosion Rate
0.0
0.5
1.0
1.5
2.0
Dec Feb Apr Jun Aug Oct
ER P
robe
Rea
din
gs a
nd
CI
Con
cent
rati
on (
ppm
/10
0)
0
5
10
15
20
Cor
rosi
on R
ate,
mpy
ER Probe Data, metal loss CI Conc, ppm/100 Corrosion Rate, mpy Target, 2 mpy
5-CI Rate increases; 5 to 10% each
Probe continues to show rate of 2 mpy. 10% pad increase implemented
Put on watch list
Probe bordering on 2mpy. Pad increase of 5% implemented.
High CR due to data quality. Probe changed
Figure 2 Corrosion Inhibitor Concentration vs. Corrosion Rate

Appendix 3 – Corrosion Management System
- 138 -
Appendix 3.3.2 Corrosion Inhibitor Development
The development of new corrosion inhibitors starts in the research and development laboratories of the chemical suppliers where potential products are tested for effectiveness under a range of conditions designed to simulate production fluids. Once these preliminary test chemistries have passed the laboratory screening process, the promising products are tested under field conditions using dedicated test facilities at GPB. The test process is summarized in Table 5.
In 2003, a new standardized protocol for well line testing was developed. Approximately ten new products are tested each quarter on a small scale test using an individual well line with each test lasting ~2 days and using approximately 5 gallons of the corrosion inhibitor under evaluation. Products that successfully pass the well line test program are then considered for a large-scale field trial.
The large-scale field trial involves converting between one and three well pads to the test product for 90 days and using 20-40,000 gallons of test chemical. This enables corrosion probe, coupon, and inspection data to be generated to verify the test product's effectiveness as a corrosion inhibitor. The large-scale field trial also allows assessment of the impact of the product on oil separation and stabilization process. Progress is being made in developing a new, standardized protocol for more rapid verification of a product’s effectiveness as a corrosion inhibitor.
Location Test Description
Laboratory Wheel-box Test
Performance of new potential corrosion inhibitor actives is compared to high performing actives. The test conditions simulate GPB and the test is run for 24 hours. Performance is determined by coupon weight loss.
Kettle Test
This investigates the ability of an inhibitor formulation to partition from an oil phase into a brine phase under stagnant conditions. Test duration is 16 hours and corrosion rate is determined by linear polarization resistance (LPR) probes.
HP Autoclave
This method determines the performance of inhibitors under high pressure and high temperature conditions. Monitoring method is by either coupon weight loss measurements or LPR. Test duration varies from 1 to 7 days.
Jet Impingement
A once-through jet impingement configuration evaluates the performance of an inhibitor formulation under extremely high shear conditions. The persistency of the inhibitor film can also be determined. Test duration is one hour and corrosion rate is determined by LPR measurements.

Appendix 3 – Corrosion Management System
- 139 -
Location Test Description
Flow Loop Test
The ultimate laboratory scale test that simulates temperature, pressure and flow conditions including velocity and water cut. Typical test duration is 24 hours and corrosion rate is determined by LPR measurements.
Field Well Line Test Dedicated test well lines are used at GPB as the first step in the field-testing process. Typically 5 gals of chemical used with a test duration of 2 days.
Large Scale Test
1 to 3 well pads using 20-40,000 gallons of corrosion inhibitor with a test duration of 90+ days. Allows the evaluation of corrosion inhibitor performance by ER, WLC, and inspection, as well as impact of product on separation plant performance.
Evaluation Products are evaluated against both technical performance and cost effectiveness criteria in order to assess if there is an overall improvement in performance.
GPB Implementation
Once a decision has been made to convert the field to a new product, additional precautions are taken with additional corrosion monitoring and plant performance evaluations in order to assure product efficacy.
Table 5 Summary Description of the Typical Test Program Components
As an example, the ER probe results from a typical cross-country flow line test are shown in Table 6 and are summarized in Figure 3. Based on these data, the test chemical in this example was not cost effective and therefore was not utilized across the field.
Status Chemical Conc. ppm CR, mpy Notes/Comments
Baseline Incumbent 130 0.2
Stage 1 Test 150 8.1 Even at a higher dose rate the test chemical was unable to inhibit corrosion to the same level as the incumbent.
Stage 2 Test 170 2.0 Reduces corrosion rate.
Stage 3 Test 190 0.8
Dose rate was increased in order to achieve the same level of corrosion control as the incumbent. At this increased level of corrosion inhibition the test product was uneconomic and the test was terminated.
Return Incumbent 130 0.1 Re-inject the incumbent product and corrosion rates return to the same level as those prior to the test.

Appendix 3 – Corrosion Management System
- 140 -
Table 6 Flow line Test Program Result Summary
Baseline
Stage 1 Stage 2 Stage 3
Return
Incumbent Test Incumbent
1.5
1.8
2.0
2.3
2.5
2.8
3.0
30-Jan 1-Mar 1-Apr 2-May 2-Jun 3-Jul
Met
al L
oss
- m
ils
0
50
100
150
200
250
300
Inh
ibit
or C
once
ntr
atio
n -
ppm
Metal Loss Inhibitor Concentration
Figure 3 ER Probe Chemical Optimization Test
A second example, utilizes the output from the weight loss coupon program. This example from a test performed in 2001, demonstrates the need/value of multiple monitoring techniques when evaluating corrosion inhibitor performance. The trial product was tested for a 90-day period with no negative response observed by the ER probes. However, after the 90-day test period the corrosion coupons were pulled and showed relatively high general corrosion and pitting rates - see Figure 4. The product evaluated was a failure and the incumbent product was re-instated based on the coupon results. Corrosion inhibitor tests use all the monitoring tools available such as corrosion probes, coupons, and inspection data to determine corrosion control performance. In addition, the corrosion inhibitor is evaluated for plant production performance to show compatibility with the separation process.

Appendix 3 – Corrosion Management System
- 141 -
Figure 4 Corrosion coupons pulled after an 'unsuccessful' chemical trial
Appendix 3.3.3 Internal Inspection Program – Scope
This section summarizes the scope and criteria used to determine the frequency of inspection for the internal corrosion inspection program. The over-riding factor in determining inspection intervals is the purpose of inspection based on a combination of equipment condition, corrosion rate, and operating environment. The internal inspection program is sub-divided into four elements, each with a separate purpose and therefore frequency of inspection:
CRM – Corrosion Rate Monitoring: The goal of this program is to detect active corrosion in support of corrosion control activities, primarily the chemical inhibition program. The data are complimentary to other monitoring data, such as corrosion probes and corrosion coupons. As the primary aim is to determine when corrosion occurs, this program is of fixed scope at fixed inspection intervals. For a typical cross-country pipeline, the CRM program includes up to 40 inspection locations which include examples of all locations susceptible to corrosion, such as elbows, girth welds, long seam welds, bottom of lines sections, etc. These locations are each inspected twice per year. The inspections are staggered, with half the set being completed in the 1st calendar quarter and half in the 2nd. These are repeated in the 3rd and 4th quarters, respectively. Therefore, information regarding the level of active corrosion (or lack of) in a pipeline is generated every 3 months. The CRM program covers all cross-country pipelines in corrosive service.

Appendix 3 – Corrosion Management System
- 142 -
ERM – Erosion Rate Monitoring: The purpose of this program is similar to the CRM but is aimed at monitoring erosion activity. As this damage mechanism is driven by production variables, i.e. production rates and solids loading, it is driven by ‘triggers’, such as velocity limits, well work, etc. If such triggers are exceeded, inspections are performed on a monthly to quarterly basis until confidence is gained that erosion is not occurring.
FIP – Frequent Inspection Program: The aim of this program is to manage mechanical integrity at locations where significant corrosion damage is detected. Locations are added to the FIP if they are approaching repair or derate criteria or if unusually high corrosion or erosion rates are detected. As the name implies, inspections are performed frequently until the item is repaired, replaced, derated, taken out of service, or corrosion/erosion rates reduced. The inspection interval varies, depending on how close the location is to repair/derate and the rate of corrosion but does not exceed 1 year. All equipment is covered by the FIP.
CIP – Comprehensive Integrity Program: This is an annual program and is aimed at detecting new corrosion mechanisms and new locations of corrosion as well as monitoring damage at known locations. The CIP therefore provides an assessment of the extent of degradation and the fitness-for-service. All equipment is covered by the CIP, although not all equipment is inspected annually.
The scope of the internal inspection program is relatively constant at approximately 60,000 inspection items per year. This includes both field and facility inspections.
Appendix 3.3.4 Corrosion Under Insulation
Corrosion under insulation is primarily associated with water ingress into the pipeline thermal insulation, in particular, at the field-applied insulation joints (weld packs).
The pipelines are generally uncoated carbon steel and are therefore vulnerable to external corrosion under the insulation (CUI) if water comes into contact with the pipe surface. The pipelines are constructed from either single or double joints (40 - 80 ft. long) with a shop-applied polyurethane insulation protected with a galvanized wrapping. The area around the girth welds are insulated with 'weld packs.' The detailed design of weld packs varies but all are prone to water ingress.
Table 7 shows the distribution of insulation joint types based on a sample of ~50,000 locations. For each specified joint type, there is an associated CUI incident rate. These data show there is as much variability in the CUI incident rate between the insulation joint configurations as there is associated with the service type. This suggests that the joint configuration and insulation joint location, along with age, have as much influence on the occurrence of external corrosion at weld-packs compared to the service type and operating temperature.
\

Appendix 3 – Corrosion Management System
- 143 -
GPB Joint Design Joint Type Freq CUI Incident Rate
Anchor Joint 4.4% 2.8%
Damaged Insul 8.4% 2.0%
Damaged Weld Pack Insul 0.1% 2.4%
Ell Anchor Joint 0.1% 6.8%
Ell Bottom Elev 3.6% 6.3%
Ell Bottom Elev Saddle 0.5% 9.9%
Ell Horiz Saddle 1.0% 8.4%
Ell Horizontal 10.1% 3.8%
Ell Top Elev 2.6% 1.3%
Ell Top Elev Saddle 0.3% 4.5%
Mid-Span Weld Pack 56.4% 1.8%
Saddle Joint 11.1% 3.6%
Vertical Joint 0.1% 5.3%
Wall Penetration 1.2% 1.4%
Average CUI Incident Rate 2.5%
Table 7 CUI Incident Rate by Joint Type
The main challenge in managing CUI is the detection of the external corrosion damage. Water ingress into the weld packs is a random process and therefore it is difficult to apply highly specific rules to target the inspection program.
Appendix 3.3.5 Fitness for Service Assessment
The basic fitness-for-service criterion used by BPXA is ANSI/ASME B31G. The base document is the modified B31G, PRC 3-805, which is augmented with additional requirements defined in BP specification SPC-PP-00090, “Evaluation and Repair of Corroded Piping Systems".
Application of fitness-for-service is best illustrated by the following example and discussion using a typical 24" diameter, 375-mil wall thickness cross-country low-pressure (LP) flow line. The average depth of damage for this example is approximately 24% or 90 mils and average corrosion network length of 8.9". In calculating the corrosion rate to achieve this depth of damage, it was assumed that the corrosion rate is linear since the beginning of field life in 1977.

Appendix 3 – Corrosion Management System
- 144 -
Figure 5 summarizes the dependence of Maximum Allowable Operating Pressure (MAOP) with the remaining wall thickness of a section of flow line based on ANSI/ASME B31G and is intended to show the multiple-layers of protection to the environment provided by the current fitness-for-service criteria. At the original wall thickness of 375 mils, the example flow line has a B31G calculated MAOP of ~1400 psi. As the wall thickness is reduced by corrosion, this pressure containment capacity is also reduced.
Table 8 shows the MAOP for various wall thicknesses starting from the original wall thickness of 375 mils. It can be seen that the repair criterion used provide a significant level of conservatism over the minimum wall thickness required to retain the maximum operating pressure. In addition, high-level over-pressure protection provides additional protection over the normal operating pressure.
In addition to the depth of damage discussed, there are a number of other considerations that have to be accounted for when assessing fitness-for-service. Some of the concerns are,
Localized/Pitting Corrosion Localized/pitting corrosion consisting of clearly defined relatively isolated regions of metal loss. The axial and circumferential extent of such regions needs to be determined and any potential areas of interaction where there is axial overlap between pitting regions.
General/Uniform Corrosion General corrosion consisting of widespread corrosion between islands of original material, again, as with pitting corrosion, the axial and circumferential extent of such regions need to be determined. The extent of damage is determined by the boundaries of good or non-corroded material surrounding the damaged area.
Interaction If more than one areas of metal loss exist in close proximity, the possible interaction between these corroded areas needs to be considered. The worst case for interaction of several corroded areas is that a composite of all the profiles within a given metal-loss area needs to be considered.
Critical Dimensions The critical dimensions of metal loss, whether internal or external corrosion damage, need to be determined depending on the corrosion damage morphology described above. The most important dimensions being, the axial or longitudinal length, and the maximum depth of damage.
Evaluation of Corroded Pipe The evaluation of corroded pipe involves determining the remaining strength and safe operating pressure on the basis of the overall axial length, circumferential extent, and maximum depth of the corroded area.

Appendix 3 – Corrosion Management System
- 145 -
ANSI B31G MAOP Curve24 OD x .375 WT X52 8.9 in. Corrosion Network
0
500
1000
1500
0.000 0.100 0.200 0.300 0.400
Minimum t Remaining (inches)
Pre
ssu
re, p
sig
(A) B31G Min PSIG (B) Operating PSIG (C) Nominal Pipe t
(D) Ave Metal Loss of Equipment (E) Allowable Min Wall BP Spec (F) BP Design PSIG
(G) Allowable Min Wall B31.4 (H) High Level Overpressure
Legend Description/Comments (A) B31G Min PSIG The relationship between maximum allowable operating
pressure, MAOP, as given by B31G and the remaining wall thickness
(B) Operating PSIG The normal operating pressure for a typical low pressure common line or flow line (CL/LDF)
(C) Nominal Pipe t The original nominal pipe wall thickness which for this example is 0.375" (375 mils) as is the case for many of the flow lines at GPB
(D) Ave metal loss From the inspection data an average pit depth or depth of damage across the field for the 24" LP OIL flow lines
(E) Min Wall BP Spec The minimum wall thickness, 0.100", which is permitted under BP specification SPC-PP-00090 for the management of corroded pipe-work. Any location at or below this level is actioned regardless of the calculated MAOP
(F) BPXA Design PSIG The original design pressure that the pipe wall thickness was designed to retain
(G) Allowable Min Wall Allowable minimum wall thickness under B31 below which a repair is mandated by code
(H) High level P protection High level over-pressure protection for the LP systems as either a pressure switch or the PSV's on the separator/slug-catcher
Figure 5 MAOP versus Remaining Wall Thickness

Appendix 3 – Corrosion Management System
- 146 -
Step t, mils MAOP Curve Description 1 375 1395 (C) As constructed pipe condition with no
corrosion or degradation of wall thickness 2 285 1209 (D) After 25+ years of service the average wall
loss for the flow line system is 24% or 90 mils and has a MAOP of 1209 psi. This is an equivalent corrosion rate of ~4 mpy. At the average corrosion rate seen to date, in approximately 50 years the wall loss will be such that it reaches the repair criteria in Step 3. Note that the target corrosion rate is 2 mpy to provide additional protection and scope for extended field life.
3 100 700 (E) The BP repair criterion from BP Specification SPC-PP-00090 is 100 mils with an MAOP of 700 psi. This repair criterion is 25 psi above the design pressure and 25 mils or 33% above minimum wall thickness defined by code B31G giving significant level of additional protection
4 95 675 (F) The original system design pressure 5 75 614 (G) The minimum wall thickness allowed under
B31G for this application which is 80% wall loss regardless of pressure
6 71 600 (H) High level over-pressure protection for the low pressure production system at Greater Prudhoe Bay
7 250 (B) The normal operating pressure for the system
Table 8 Thickness, MAOP Correlation
Figure 6 illustrates the FFS envelop for a combination of depth and length of defect as defined in BP Specification SPC-PP-00090. As can be seen from the curve, the criteria for allowable operating service condition is more conservative than the industry standard at the low end of the remaining wall thickness. This conservatism reflects two issues, (a) the need to provide a margin for error in the determination of wall thickness and corrosion rate, and hence remaining life, and (b) the decreased accuracy of the NDE techniques in use at a wall thickness of less 100 mils.
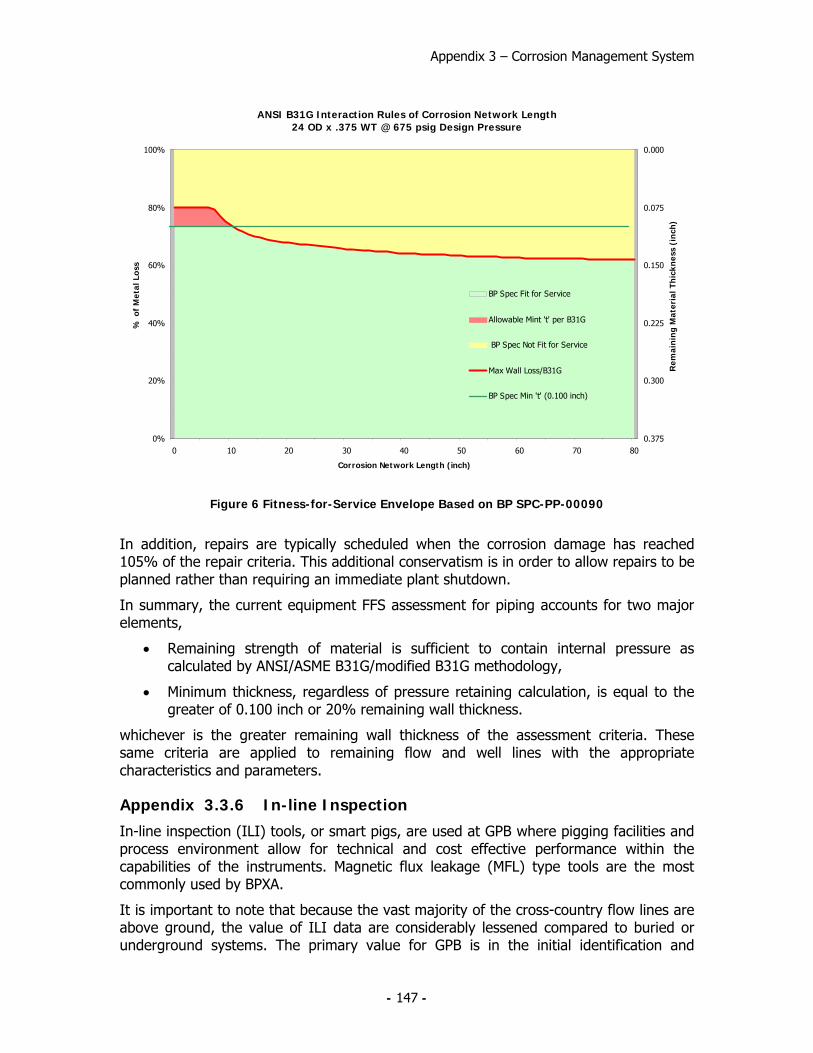
Appendix 3 – Corrosion Management System
- 147 -
ANSI B31G Interaction Rules of Corrosion Network Length24 OD x .375 WT @ 675 psig Design Pressure
0%
20%
40%
60%
80%
100%
0 10 20 30 40 50 60 70 80
Corrosion Network Length (inch)
% o
f M
etal
Los
s
0.000
0.075
0.150
0.225
0.300
0.375
Rem
ain
ing
Mat
eria
l Th
ickn
ess
(in
ch)
BP Spec Fit for Service
Allowable Mint 't' per B31G
BP Spec Not Fit for Service
Max Wall Loss/B31G
BP Spec Min 't' (0.100 inch)
Figure 6 Fitness-for-Service Envelope Based on BP SPC-PP-00090
In addition, repairs are typically scheduled when the corrosion damage has reached 105% of the repair criteria. This additional conservatism is in order to allow repairs to be planned rather than requiring an immediate plant shutdown.
In summary, the current equipment FFS assessment for piping accounts for two major elements,
• Remaining strength of material is sufficient to contain internal pressure as calculated by ANSI/ASME B31G/modified B31G methodology,
• Minimum thickness, regardless of pressure retaining calculation, is equal to the greater of 0.100 inch or 20% remaining wall thickness.
whichever is the greater remaining wall thickness of the assessment criteria. These same criteria are applied to remaining flow and well lines with the appropriate characteristics and parameters.
Appendix 3.3.6 In-line Inspection
In-line inspection (ILI) tools, or smart pigs, are used at GPB where pigging facilities and process environment allow for technical and cost effective performance within the capabilities of the instruments. Magnetic flux leakage (MFL) type tools are the most commonly used by BPXA.
It is important to note that because the vast majority of the cross-country flow lines are above ground, the value of ILI data are considerably lessened compared to buried or underground systems. The primary value for GPB is in the initial identification and

Appendix 3 – Corrosion Management System
- 148 -
location of damaged locations within a pipeline system. Having initially identified the location of damaged areas, the long-term integrity, pipeline condition and current corrosion rate, of the flow line can be more effectively managed through the use of targeted manual NDE techniques.
Having established the condition and location of damaged sections of line the locations are then added to the routine NDE program where the condition and fitness-for-service is determined and where the on-going corrosion rate and level of corrosion mitigation can be monitored.
There are limitations with the ILI technology currently used at GPB. A typical high resolution11 MFL smart pig gives wall thickness measurements that are ±10% of the nominal wall thickness and sizing resolution of 3 times wall thickness for length and width assessment. In addition, there are temperature and pressure limitations that prevent or make difficult the use of MFL tools in many lines at GPB. The typical upper operating temperature for the MFL tools is 122°F/50°C compared with a typical separator fluids temperature of 150-160°F/65-71°C.
While the ILI program is an important element in the overall corrosion and integrity management program, it should be considered like any other inspection or monitoring technique as simply another tool to be applied where it delivers the most value.
When used, smart pig inspections are performed to gain a relative understanding of pipeline condition and rate of deterioration and/or to provide confidence that the internal and external conventional inspection programs have identified locations where mechanical integrity is at risk. Because MFL tools do not directly measure pipeline condition, results from in-line inspections are not reported in as received from the smart pig service company but are reported as part of the overall NDE summary.
Areas identified by ILI and interpreted as being a risk to future operation of equipment, are verified through visual, radiographic and/or ultrasonic inspection techniques and the results are reported as part of routine inspection programs.
11 MFL manufacturer technical data sheet

Appendix 3 – Corrosion Management System
- 149 -
Program Plan/Objectives Target Implementation Evaluation Corrective Action
Eliminate corrosion/erosion related failures
No harm to people No accidents No damage to environment Regulatory compliance Compliance with industry standards
Integrated program with monitoring, inspection, operational controls, and corrosion inhibitor
Key performance indicators Leading and lagging indicators
Adjust mitigation, monitoring, and operational targets to meet objective Defect elimination -repair/replace/abandon
Provide equipment availability to end of Field life
2050 Integrated Program with Monitoring, Inspection, Operational Controls, and Corrosion Inhibition
Key Performance Indicators Leading and Lagging Indicators
Adjust Mitigation, Monitoring, and Operational Targets to Meet Objective
1.0 Overall program goals
Cost effective Corrosion Management
Budget Alliance Partnerships Technical Incentive Contracts Continuous Improvement
Key Performance Indicators Leading and Lagging Indicators
Develop more Cost Effective Methods For Delivering the Program Best in Class Technology Investment for the Future
Table 9 Corrosion Management System

Appendix 3 – Corrosion Management System
- 150 -
Program Plan/Objectives Target Implementation Evaluation Corrective Action
Monitor for changes in corrosion rates
System dependant targets Corrosion rate to meet overall objectives Regulatory compliance Compliance with industry standards
Short term corrosion rate determination Medium term corrosion rate determination
ER probes Weight loss coupon rate Pitting Rates
Adjust Mitigating action to achieve corrosion rate target
Monitor effectiveness of the chemical mitigation programs
Optimize Corrosion Inhibitor Rates and Distribution Optimize chemical mitigation programs e.g. Oxygen scavenger Biocide Drag reducing agent Scale
See above See above Provide feedback to Chemical treatment Operations Inspection activities Adjust Mitigation Effort Production Chemistry
Monitor changes in the process conditions
Field-wide Velocity Management targets
Weekly Review of Operational Controls by CIC Group Operations review of fluid velocities Velocity alarms in Distributive Control System (DCS)
Mixture Velocities, Water Cuts, and Water Rates
Adjust production rates to meet velocity management targets
1.1 Corrosion Monitoring
Corrosion mechanism changes with time
Mitigation action in place prior to threat to mechanical integrity
Data availability and access Ease of ‘data mining’ and evaluation Single data storage Comprehensive data management and reporting process
Long-Term Process Change
Develop mitigation program Mechanism management as part of routine business
1.2 Erosion Monitoring
Monitor the effectiveness of the erosion mitigation programs
V/Ve <2.5 Max mixture Velocity and water cut matrix Well Put-On-Production (POP) process Regulatory compliance Compliance with industry standards
Unified velocity management standard across the North Slope Monthly compilation Of High Risk Wells Inspection of High Risk Wells Mixture velocity calculation in DCS
Mixture Velocities Inspection results
Additional inspection and monitoring at high risk sites Adjust Process Conditions Well shut-in Production reduction Design/debottleneck facilities
Table 10 Corrosion Management System Element – Monitoring

Appendix 3 – Corrosion Management System
- 151 -
Program Plan/Objectives Target Implementation Evaluation Corrective Action
Mitigate Corrosion Through Application of Corrosion Inhibitors
Control Corrosion Rates to Acceptable Levels (See Overall Program Goals) Regulatory compliance Compliance with industry standards
Continuous Injection into individual wells as far upstream as possible - currently at Wellhead Protect all equipment between injection point and separation plant
ER Probes WLC’s Inspection
Corrosion Inhibitor Development Adjust Mitigation Effort
Control Corrosion Rates to Acceptable Levels (See Overall Program Goals)
Batch Treatments on a routine schedule with injection at the Wellhead
WLC’s Inspection
Corrosion Inhibitor Development Adjust Mitigation Effort Through Reviews
Mitigate Corrosion through Operational Controls
Operational Guidelines Weekly Reviews by CIC Group Mixture Velocities Adjust Process Conditions
1.3 Corrosion Mitigation
Mitigate Corrosion through Maintenance Pigging
Achieve Scheduled Frequency
Maintenance Pigging Inspection Pigging Returns
Adjust Maintenance Pigging Schedule
1.4 Erosion Mitigation
Mitigate Erosion Through Operational Controls and Design
Control Erosion Rates to Acceptable Levels (See Overall Program Goals) V/Ve < 2.5 Regulatory compliance Compliance with industry standards
Well POP process V/Ve Guidelines
V/Ve Inspection (ERM)
Adjust Process Conditions
Table 10 (continued) Corrosion Management System Element – Mitigation

Appendix 3 – Corrosion Management System
- 152 -
Program Plan/Objectives Target Implementation Evaluation Corrective Action
Integrated inspection program to provide a overall assessment of plant condition and corrosion rates
Inspection activity level Leak/save target Inspection increases Plant condition Regulatory compliance
Corrosion rate monitoring program (CRM) Erosion rate monitoring program (ERM) Comprehensive inspection program (CIP) Frequent inspection program (FIP) Corrosion under insulation program (CUI)
NDE technique sheets and procedures Standardized assessment of piping condition, degradation rate and mechanism
Provide feedback to chemical mitigation program Erosion management program Fitness for service assessment Equipment life assessment Proactive repair scheduling
Assessment of Current Damage Mechanisms
Zero Increases Internal and external programs See above Repair/replace/monitor
1.5 Inspection
Search for New Damage Mechanisms
Mitigation action in place prior to threat to FFS
Baseline new equipment Apply lessons learnt from industry practice else where in the world Apply lessons learned for other BP operations Apply learnings across the field for similar equipment/process conditions Communications with Operations and Reservoir Engineers
See above Develop mitigation program Mechanism management as part of routine business
Fitness for service assurance
Regulatory compliance Compliance with industry standard
See above inspection programs Battelle Modified B31G fitness-for-service criteria (note piping only) BP internal specification for the assessment of damaged pipe
Repair equipment Replace equipment Derate equipment Abandon equipment
1.6 Fitness for Service
Structural integrity Regulatory compliance Compliance with industry standard
Walking speed survey every 5 years
Piping design code BP Spec, B31.4 and B31.8 Piping stress analysis Nondestructive testing as required
Repair/replace Correct support defect Monitor for further degradation
Table 10 (continued) Corrosion Management System Element – Inspection

Appendix 3 – Corrosion Management System
- 153 -
Program Plan/Objectives Target Implementation Evaluation Corrective Action 1.7 Continuous Improvement
Provide Feedback to Monitoring, Mitigation, and Inspection Programs
Continuous Improvement
Integrated Program with Monitoring, Inspection, Operational Controls, and Corrosion Inhibitor Provides Feedback Control Loop for Program Improvements Consolidated data store, MIMIR
Weekly program review Quarterly program review Annual program reviews and strategy assessment Annual equipment life/availability review Key Performance Indicators
Strategic adjustment Budget/funding level changes Mitigation process change and review Technical/R&D requirements and programs
Table 10 (continued) Corrosion Management System Element – Inspection

Appendix 3 – Corrosion Management System
- 154 -
Program Plan/Objectives Target Implementation Evaluation Corrective Action 1.1.1 Monitoring – Electrical Resistance Probes (ER)
Monitor the Effectiveness of the Mitigation Programs
< 2mpy Regulatory compliance Compliance with industry standard
ER Probes - Upstream and/or Downstream Ends of Flow lines
Investigate Cause for Corrosion Rate Increase
Mitigation Adjustments ER Probe Maintenance
1.1.2 Monitoring – Weight Loss Coupons (WLC)
Monitor the Effectiveness of the Mitigation Programs
Gen CR: < 2mpy Pit CR: < 20mpy Regulatory compliance Compliance with industry standard
WLC – Installed Flow lines, Well lines, Headers, and Piping
Investigate Cause for Corrosion Rate Increase
Mitigation Adjustments Inspection Program Adjustments
1.1.3 Monitoring – Process Conditions
Monitor changes in the Process Conditions
(See Mixture Velocity and Erosion Sections Below) Regulatory compliance Compliance with industry standard
Investigate Cause for Process Upset Long-Term Process Change Monitor Impact
Mitigation Adjustments
1.1.4 Monitoring – Mixture Velocity Management Program
Monitor the Effectiveness of the Mitigation Programs
Operational Guidelines Mix Vel Limits Regulatory compliance Compliance with industry standard
Operations Acceptance of Mixture Velocity Guidelines SETCIM
Review Alarm List to Determine True Offenders
Adjust Process Conditions
1.1.5 Monitoring – Erosion Management Program
Monitor the Effectiveness of the Erosion Mitigation Programs
Operational Guidelines Well Put on Production (POP) V/Ve < 2.5 Regulatory compliance Compliance with industry standard
Operations Acceptance of Erosion Guidelines High Risk Well Inspection Program (ERM)
Monthly Reviews to Determine High Risk Equipment and Repeat Offenders
Adjust Process Conditions
Table 11 Monitoring Program Techniques

Appendix 3 – Corrosion Management System
- 155 -
Program Plan/Objectives Target Implementation Evaluation Corrective Action
Mitigate Corrosion Through Application of Corrosion Inhibitors
Control Corrosion Rates to Acceptable Levels (See Overall Program Goals) Regulatory compliance Compliance with industry standard
Continuous Injection Into Individual Wells as Far Upstream As Possible – Currently at Wellhead Protect All Equipment Between Injection Point and Separation Plant
ER Probes WLC’s Inspection
Corrosion Inhibitor Development Adjust Mitigation Effort
1.2.1 Mitigation – Corrosion Inhibitor
Control Corrosion Rates to Acceptable Levels (See Overall Program Goals)
Batch Treatments on a Routine Schedule with Injection at the Wellhead
WLC’s Inspection
Corrosion Inhibitor Development Adjust Mitigation Effort through Reviews
Mitigate Corrosion Through Operational Controls
Operational Guidelines Mixture Velocity Limits Regulatory compliance Compliance with industry standard
Operations Acceptance of Mixture Velocity Guidelines
Mixture Velocities Review Alarm List to determine true offenders
Adjust Process Conditions
Mitigate Erosion through Operational Controls
Operational Guidelines Well POP V/Ve < 2.5
Operations Acceptance of Erosion Guidelines High Risk Well Inspection Program (ERM)
Monthly Reviews to Determine High Risk Equipment and Repeat Offenders
Adjust Process Conditions
Mitigate Corrosion through Maintenance Pigging
Achieve Scheduled Frequency
Maintenance Pigging Inspection Pigging Returns
Adjust Maintenance Pigging Schedule
1.2.2 Mitigation – Operational Control, Maintenance, and Material Selection
Corrosion Resistant Alloys Zero Increases (I’s) Selected Facilities & Equipment Inspection Applicability For Service Requirements
Replace as Necessary
1.2.3 Mitigation – Structural Integrity
Mitigate structural damage caused by subsidence, jacking, vibration, impact, snow loading, etc. through inspections
No failures due to structural damage Regulatory compliance Compliance with industry standard
Operational procedures for visual surveillance of pipelines Piping stress analysis as required NDE inspections as required
Review Pipeline Design Code/BP Specification
Repair, replace and correct deficiencies as required Add Pipeline Vibration Dampeners (PVDs) as required
Table 11 (continued) Mitigation Program Techniques

Appendix 3 – Corrosion Management System
- 156 -
Program Plan/Objectives Target Implementation Evaluation Corrective Action 1.3.1 Corrosion Rate Monitoring (CRM)
Assessment of current corrosion mechanisms Monitor for new corrosion mechanisms
No measurable active corrosion -Zero increases (I’s) Regulatory compliance Compliance with industry standard
CRM Program – Fixed locations on approximately bi-annual frequency
Inspections Condition of Equipment Rate of degradation
Mitigation Adjustments Repair/Replace Preventative Maintenance
1.3.2 Erosion Rate Monitoring (ERM)
Monitor high risk wells Assessment of current erosion locations
Manageable rate of degradation Regulatory compliance Compliance with industry standard
ERM Program – monthly to quarterly
Inspections Condition of Equipment Rate of degradation
Mitigation Adjustments Repair/Replace Preventative Maintenance
1.3.3 Frequent Inspection Program (FIP)
Assessment of High Corrosion Rates Monitor locations near repair
Fitness-for-Service Regulatory compliance Compliance with industry standard
FIP Program – monthly to bi-annual
Inspections Condition of Equipment Rate of degradation
Mitigation Adjustments Repair/Replace Preventative Maintenance
1.3.4 Comprehensive Integrity Program (CIP)
Comprehensive Coverage of equipment Fitness-for-Service review
Fitness-for-Service Regulatory compliance Compliance with industry standard
CIP – Condition and rate based half-life recurring frequency Extend coverage through new locations
Inspections Condition of Equipment Rate of degradation
Mitigation Adjustments Repair/Replace Preventative Maintenance
1.3.5 Corrosion Under Insulation (CUI)
Comprehensive Coverage of equipment
Inspection of Locations susceptible to CUI Fitness For Service Regulatory compliance Compliance with industry standard
CUI – Risk based annual program Management of location inventory through recurring examinations
Detect Damage Areas Analysis of occurrence
Repair/Replace Preventative Maintenance
Table 11 (continued) Mitigation Program Techniques

Appendix 3 – Corrosion Management System
- 157 -
Method Technique Description Sensitivity Accuracy Freq Notes/Comments
Corrosion Monitoring
Electrical Resistance (ER) Probes
Measurement of corrosion rate by monitoring changes in electrical resistance of a metal probe due to volume loss
High Low H/D Correlate poorly to actual pipewall corrosion rates
Weight Loss Coupons Corrosion Rate
Exposure of metal samples to corrosive fluid and calculation of volume loss rates based on weight
Medium Medium M Limited benefit in determining short-term effects, such as flow regime changes on corrosion rates
Weight Loss Coupons Pitting Rate
Exposure of metal samples and assessment of pitting rate via measurement of pit depths
Medium Medium M Not a very sensitive measure for GPB 3phase but more effective in the PW system
Galvanic Probe Detects changes in corrosivity as a function of current flow between two dissimilar metals.
High Low C Not a reliable measurement of mild steel corrosion rate. Very suitable to monitor oxygen and chlorine changes in seawater
Linear Polarization Resistance (LPR)
Electrochemical technique for assessing corrosion rate by application of controlled voltage and measuring current response
High Low H/D Not used at GPB due to the interference of hydrocarbon films on measurement
Table 12 Corrosion Monitoring Techniques – Benefits and Limitations
Method Technique Description Sensitivity Accuracy Freq Notes/Comments
Process Monitoring
Mixture velocity Mixture velocity of fluids in pipe-work Medium Medium D Accuracy dependent upon production information (T, P, Oil, Water, Gas)
Water cut Percent water in liquid fluids Medium Medium D Accuracy dependent upon production information (Oil, Water)
Temperature and pressure
Measured temperature and pressure in process equipment
Medium Medium D
Dissolved Oxygen Amount of oxygen dissolved in Sea Water High Medium D In-line accuracy problematic. Chemet method more accurate
Iron (Fe) counts Amount of Iron (Fe) dissolved in process water High Low M Microbiological activity Amount of microbiological life forms in process fluids Medium Low M
Table 13 Process Monitoring techniques – Benefits and Limitations

Appendix 3 – Corrosion Management System
- 158 -
Method Technique Description Sensitivity Accuracy Freq Notes/Comments Inspection/NDE Radiographic Testing
(RT) Assessment of pipe wall degradation by passing gamma or x-ray radiation through a specimen and projecting an image on conventional lead screen/film. Irregular density variations of the image can indicate metal loss.
Medium Medium M/Q/H/Y
Utilized for detection, monitoring, and fit for service assessment of pipe metal loss in the form of mechanical, corrosion, and erosion degradation. Currently being phased out in lieu of ‘greener’ process of DRT – see below
Digital Radiographic Testing (DRT)
Assessment of pipe wall degradation by passing gamma or x-ray radiation through a specimen and projecting an image on phosphor screen/imaging plate. Irregular density variations of the image can indicate metal loss.
Medium Medium M/Q/H/Y
Utilized for detection, monitoring, and fit for service assessment of pipe metal loss in the form of mechanical, corrosion, and erosion degradation. DRT provides additional benefits in waste reduction associated with conventional film and processing chemicals
Tangential Radiography Testing (TRT)
Assessment of pipe wall degradation by passing gamma or x-ray radiation through insulation at the tangent of the specimen and projecting an image on screen/film, phosphor screen/imaging plate, or detector array.
High Low Y Utilized for detection of corrosion under insulation (CUI). Deployed where potential moisture ingress is suspected on thermally insulated piping
Ultrasonic Testing (UT)
Assessment of pipe wall thickness by sending/receiving ultrasound through a specimen. Echoes returning indicate remaining thickness of the specimen.
Medium High M/Q/H/Y
Utilized for detection, monitoring, and fit for service assessment of pipe metal loss in the form of mechanical, corrosion, and erosion degradation
Guided Wave Ultrasonic Testing (GUT)
Volumetric assessment of pipe wall by sending/receiving ultrasound through a specimen in the form of cylinder Lamb Waves. Monitoring changes in these waves indicate potential changes in pipe thickness. Alternatively, echoes returning to the source transducer may also indicate interruptions or pitting in the pipe segment.
Low Low Y Utilized for cased piping assessment where access does not support use of traditional inspection methods. The method is capable of semi-quantifying metal loss but cannot discriminate between internal and external corrosion
Electromagnetic Pulse Testing (EMT)
Assessment of pipe wall by propagating broadband electromagnetic waves on the exterior surface of the specimen. When waves traveling down steel pipe encounter corrosion on the pipe surface, the waves are distorted. Distortions in waveform may indicate rust by-product on the surface of the steel and subsequent metal loss.
High Low Y Utilized for cased piping assessment where access does not support use of traditional inspection methods. The method cannot quantify metal loss and has a tendency to report false positive results but seldom overlooks surface atmospheric corrosion
Table 14 Inspection/Non-Destructive Examination Techniques – Benefits and Limitations

Appendix 3 – Corrosion Management System
- 159 -
Method Technique Description Sensitivity Accuracy Freq Notes/Comments Inspection/NDE (Cont)
In-line Inspection – Smart Pig Magnetic Flux (MFL) Technique
Assessment of pipelines for the detection and measurement of metal loss. These pigs carry high strength magnets, which apply a strong magnetic field into the pipe wall. The magnetic field saturates the pipe steel with magnetic flux. As a result, areas of metal loss cause the flux to leak out of the pipe wall. The flux leakage data are recorded and used to infer the size and depth of any metal loss defects in the pipe.
High Medium N/A
Utilized where design and process operation permit in-line pigging. Metal loss MFL In-line Inspection provides complete evaluation of pipeline integrity within the limitations of the MFL technique.
Table 14 (continued) Inspection/Non-Destructive Examination Techniques – Benefits and Limitations

Appendix 3 – Corrosion Management System
- 160 -
Service Equipment Type Monitoring Technique Inspection Program Mitigation Program*Flow line ER Probes
WLC Process Monitoring
CRM FIP CIP CUI
CI Injection Mixture Velocities Periodic Maintenance Pigging Operational Controls
Oil
Well line WLC Process Monitoring
CRM ERM FIP CIP CUI
CI Injection Mixture Velocities Mixture Velocities Operational Controls
Flow line WLC CRM FIP CIP CUI
CI Injection** CI Carry Over Periodic Maintenance Pigging Mixture Velocities Operational Controls
Produced Water
Well line WLC CRM FIP CIP CUI
CI Injection** CI Carry Over Mixture Velocities Operational Controls
Flow line WLC Galvanic Probes Dissolved 02 Microbiological Activity
CRM FIP CIP CUI
Biocide Treatment 02 Scavenger Periodic Maintenance Pigging Operational Controls
Seawater
Well line WLC Microbiological Activity
CRM FIP CIP CUI
Biocide Treatment Periodic Maintenance Pigging Operational Controls
Export oil Flow line WLC ER Probes
CRM FIP CIP CUI
CI Carry Over Mixture Velocities Operational Controls Periodic Maintenance Pigging
*Applicable to all inspection programs noted **No CI injection for FS-2 PW
Table 15 Corrosion Management System Implementation by Equip Type and Service

Appendix 3 – Corrosion Management System
- 161 -
Well lines from well head to WPM headers
Headers
WPM piping
Pig launcher
Large diameter flow line (LDF) and
common lines (CL)
GC/FS Headers
Well line
'S' riser
Wellhead
Slug catcherPW system
Pig receiver
Coupon/probe location
Continuous CI injection
Figure 7 Facility Schematic

Appendix 3 – Corrosion Management System
- 162 -
This page is intentionally blank

Appendix 3 – Corrosion Management System
- 163 -
Figure 8 Map of North Slope

Appendix 3 – Corrosion Management System
- 164 -
This page is intentionally blank
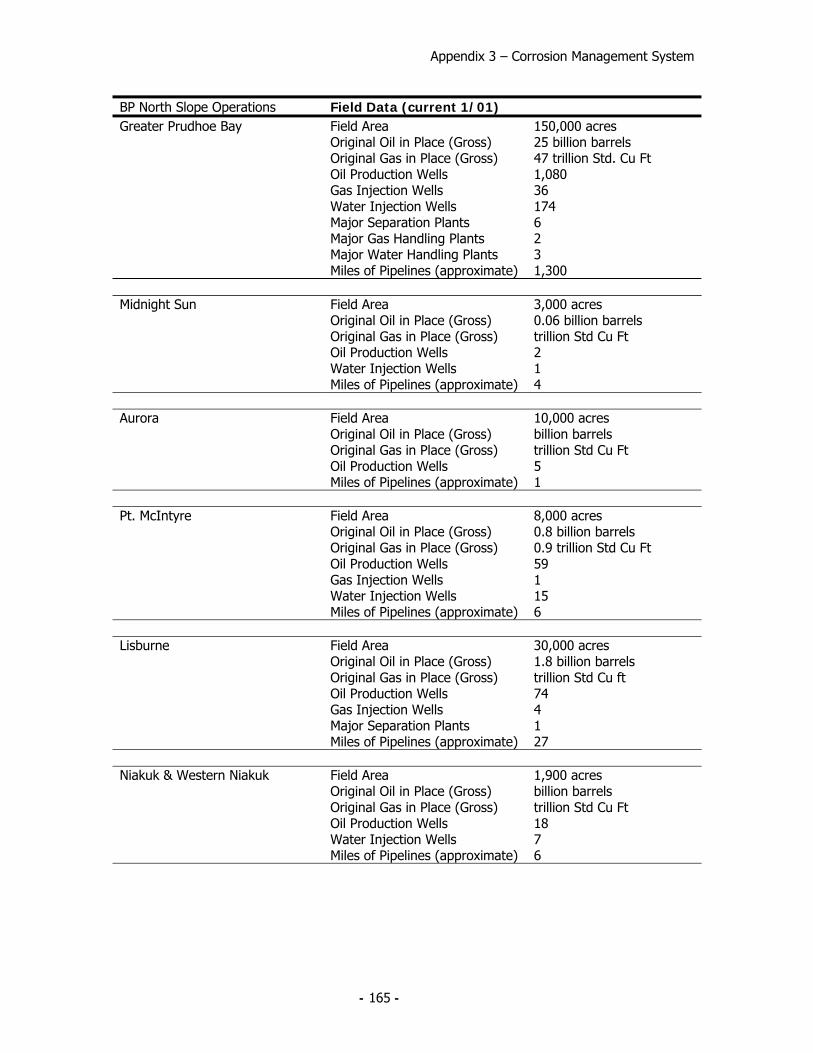
Appendix 3 – Corrosion Management System
- 165 -
BP North Slope Operations Field Data (current 1/01) Greater Prudhoe Bay Field Area
Original Oil in Place (Gross) Original Gas in Place (Gross) Oil Production Wells Gas Injection Wells Water Injection Wells Major Separation Plants Major Gas Handling Plants Major Water Handling Plants Miles of Pipelines (approximate)
150,000 acres 25 billion barrels 47 trillion Std. Cu Ft 1,080 36 174 6 2 3 1,300
Midnight Sun Field Area
Original Oil in Place (Gross) Original Gas in Place (Gross) Oil Production Wells Water Injection Wells Miles of Pipelines (approximate)
3,000 acres 0.06 billion barrels trillion Std Cu Ft 2 1 4
Aurora Field Area
Original Oil in Place (Gross) Original Gas in Place (Gross) Oil Production Wells Miles of Pipelines (approximate)
10,000 acres billion barrels trillion Std Cu Ft 5 1
Pt. McIntyre Field Area
Original Oil in Place (Gross) Original Gas in Place (Gross) Oil Production Wells Gas Injection Wells Water Injection Wells Miles of Pipelines (approximate)
8,000 acres 0.8 billion barrels 0.9 trillion Std Cu Ft 59 1 15 6
Lisburne Field Area
Original Oil in Place (Gross) Original Gas in Place (Gross) Oil Production Wells Gas Injection Wells Major Separation Plants Miles of Pipelines (approximate)
30,000 acres 1.8 billion barrels trillion Std Cu ft 74 4 1 27
Niakuk & Western Niakuk Field Area
Original Oil in Place (Gross) Original Gas in Place (Gross) Oil Production Wells Water Injection Wells Miles of Pipelines (approximate)
1,900 acres billion barrels trillion Std Cu Ft 18 7 6

Appendix 3 – Corrosion Management System
- 166 -
BP North Slope Operations Field Data (current 1/01) Milne Point Field Area
Original Oil in Place (Gross) Oil Production Wells Gas/Water Injection Wells Source Water Wells Major Separation Plants Miles of Pipelines (approximate)
36,454 acres 0.92 billion barrels 107 59 8 1 55
Schrader Bluff Field Area
Original Oil in Place (Gross) Oil Production Wells Gas\Water Injection Wells Source Water Wells Miles of Pipelines (approximate)
28,000 acres 1.97 billion barrels 49 14 3 15
Eider Field Area
Original Oil in Place (Gross) Original Gas in Place (Gross) Oil Production Wells Gas Injection Wells Miles of Pipelines (approximate)
300 acres 0.013 billion barrels 0.052 trillion Std Cu Ft 1 1 .5
Endicott Field Area
Original Oil in Place (Gross) Original Gas in Place (Gross) Oil Production Wells Gas Injection Wells Water Injection Wells Major Separation Plants Miles of Pipelines (approximate)
8,800 acres billion barrels 1.4 trillion Std Cu Ft 47 5 21 1 52
Sag Delta North Field Area
Original Oil in Place (Gross) Oil Production Wells Gas Injection Wells Miles of Pipelines (approximate)
380 acres 0.014 billion barrels 2 2 .5
Badami Original Oil in Place (Gross)
Oil Production Wells Gas Injection Wells Major Separation Plants Miles of Pipelines (approximate)
0.160 billion barrels 6 2 1 50
Northstar (current 3/02)
Field Area Original Oil in Place (Gross) Oil Production Wells Disposal Injection Wells Gas Injection Wells Major Separation Plants Miles of Pipelines (approximate)
38,000 acres .176 billion barrels 4 1 2 1 30
Table 16 BPXA North Slope Operations


BP Exploration (Alaska) Inc. Corrosion, Inspection and Chemical (CIC) Group
900 E Benson Boulevard Anchorage, Alaska 99519
© 2007 BP Exploration (Alaska) Inc.