commission on teacher credentialing biennial report › sites › default › files › groups ›...
TRANSCRIPT
Fall 2011 Biennial Report – Single Subject
1
Commission on Teacher Credentialing
Biennial Report
(For Institutions in the Red, Green, and Indigo Cohort Due Summer/Fall 2011)
Academic Years 2009-10 and 2010-11
Institution California State University, Long Beach
Date report is submitted Fall 2011
Program documented in this report Single Subject Credential Program
Name of Program Single Subject Credential Program
Credential awarded Preliminary Single Subject Credential
Is this program offered at more than one site?
If yes, list all sites at which the program is offered
Program Contact Dr. Jared Stallones
Phone # 562-985-5642
E-Mail [email protected]
If the preparer of this report is different than the Program Contact, please note contact information for that person below:
Name: Dr. Deborah H. Mitchell
Phone # 562-985-4781
E-mail [email protected]
Fall 2011 Biennial Report – Single Subject 2
SECTION A – CREDENTIAL PROGRAM SPECIFIC INFORMATION
PART I – Contextual Information
The Single Subject Credential Program (SSCP) rests on the bedrock principle clarified by the National Commission on Teaching and America’s Future (NCTAF, 1996, p.5): What teachers know and can do makes the crucial difference in what children learn. Building on this core principle, the program has as its overarching purpose the preparation of high quality beginning teachers who possess the knowledge, aptitudes and dispositions that will enable them to provide the conditions for meaningful, substantive and sequential learning for all students so that they can become active citizens in a democratic, increasingly global, technology-driven society.
The SSCP has three components: subject matter preparation, professional pedagogical preparation, and student teaching. The program has eleven Commission-approved subject matter programs: Art, English, Family and Consumer Sciences (FCS), Health Science (HCS), Industrial and Technology Education (ITE) Languages Other Than English (LOTE), Mathematics, Music, Physical Education, Science and Social Science. Subject matter programs vary in length from 35 to 75 units, and are essentially undergraduate majors. Professional preparation is accomplished through a 45-unit set of courses, with 27 units dedicated to foundational and pedagogical preparation and 18 units associated with the culminating student teaching experience. The program offers an Internship track within the same structure and unit load.
The SSCP is a university-wide program. As such it has a shared governance structure among the eleven constituent subject matter programs (housed in five colleges: Arts, Engineering, Health and Human Services, Liberal Arts and Natural Sciences and Mathematics) and the University Coordinator (based in the College of Education). The University Coordinator reports to the Dean of the College of Education. A Credential Coordinator and/or a Credential Advisor, housed in the appropriate academic department, is responsible for each of the subject matter programs. Each has a committee of faculty that, among other responsibilities, determines subject matter program policy and reviews applications to the program.
For university budget purposes the Single Subject Credential Program has a single faculty, the University Coordinator. Subject matter program advisors, teaching faculty, and the student teaching supervisors are members of the colleges and departments housing the subject matter programs and the Department of Teacher Education. They are “loaned” to the Single Subject Program. Table 3 displays the 2009-2011 profile of faculty.
All courses in the professional education sequence integrate course activities and structured fieldwork.
Fieldwork is designed to give candidates a variety of experiences in contemporary classrooms ranging from back-of-the-class observation through case studies and mini ethnographies to whole class teaching. Course activities and field experiences are closely tied to the Teaching Performance Expectations (TPEs). The Teaching Performance Expectations serve as the SSCP student learning outcomes. Table 1 presents the program’s learning outcomes, key signature assignments, and how those outcomes map to local, state and national standards.
Fall 2011 Biennial Report – Single Subject
3
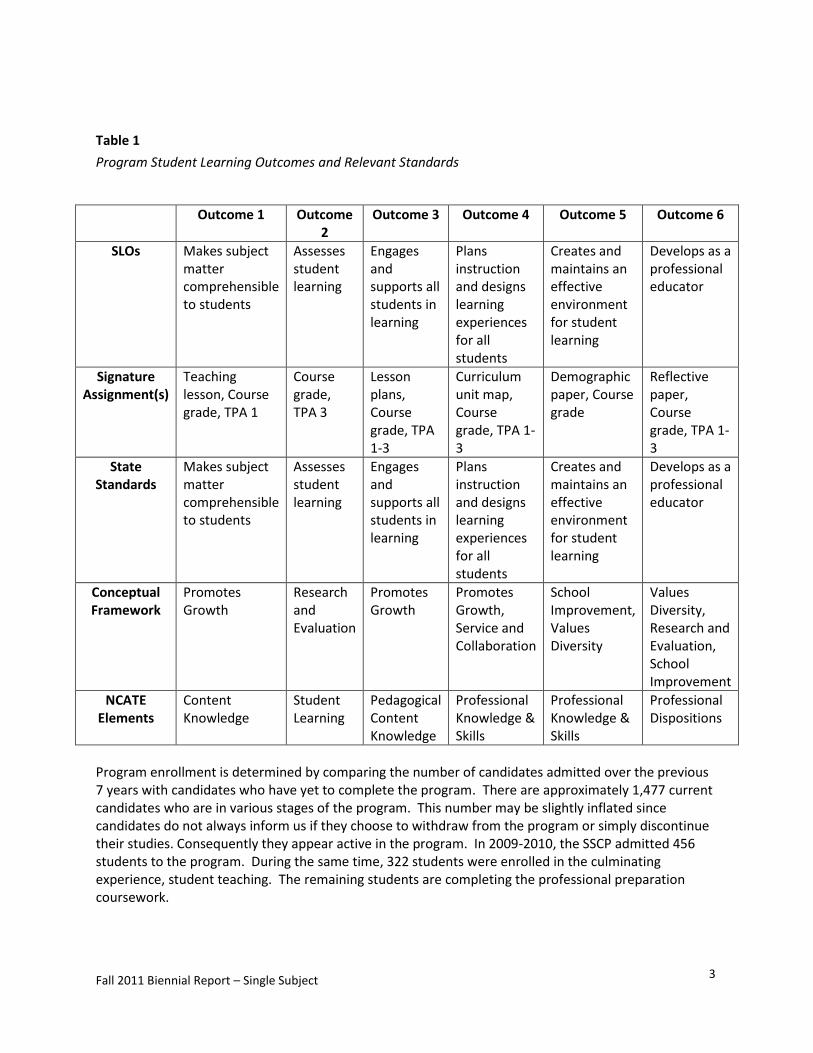
Table 1
Program Student Learning Outcomes and Relevant Standards
Outcome 1 Outcome 2
Outcome 3 Outcome 4 Outcome 5 Outcome 6
SLOs Makes subject matter comprehensible to students
Assesses student learning
Engages and supports all students in learning
Plans instruction and designs learning experiences for all students
Creates and maintains an effective environment for student learning
Develops as a professional educator
Signature Assignment(s)
Teaching lesson, Course grade, TPA 1
Course grade, TPA 3
Lesson plans, Course grade, TPA 1-3
Curriculum unit map, Course grade, TPA 1-3
Demographic paper, Course grade
Reflective paper, Course grade, TPA 1-3
State Standards
Makes subject matter comprehensible to students
Assesses student learning
Engages and supports all students in learning
Plans instruction and designs learning experiences for all students
Creates and maintains an effective environment for student learning
Develops as a professional educator
Conceptual Framework
Promotes Growth
Research and Evaluation
Promotes Growth
Promotes Growth, Service and Collaboration
School Improvement, Values Diversity
Values Diversity, Research and Evaluation, School Improvement
NCATE Elements
Content Knowledge
Student Learning
Pedagogical Content Knowledge
Professional Knowledge & Skills
Professional Knowledge & Skills
Professional Dispositions
Program enrollment is determined by comparing the number of candidates admitted over the previous 7 years with candidates who have yet to complete the program. There are approximately 1,477 current candidates who are in various stages of the program. This number may be slightly inflated since candidates do not always inform us if they choose to withdraw from the program or simply discontinue their studies. Consequently they appear active in the program. In 2009-2010, the SSCP admitted 456 students to the program. During the same time, 322 students were enrolled in the culminating experience, student teaching. The remaining students are completing the professional preparation coursework.
Fall 2011 Biennial Report – Single Subject
4
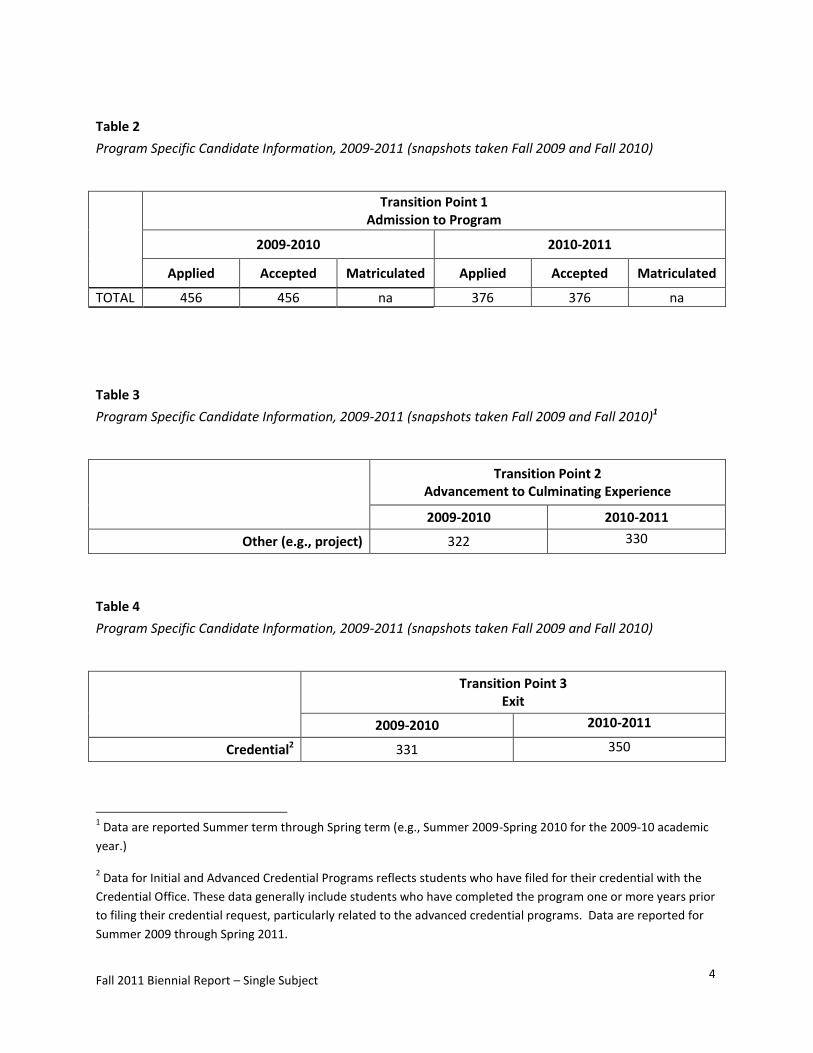
Table 2
Program Specific Candidate Information, 2009-2011 (snapshots taken Fall 2009 and Fall 2010)
Transition Point 1 Admission to Program
2009-2010 2010-2011
Applied Accepted Matriculated Applied Accepted Matriculated
TOTAL 456 456 na 376 376 na
Table 3
Program Specific Candidate Information, 2009-2011 (snapshots taken Fall 2009 and Fall 2010)1
Transition Point 2 Advancement to Culminating Experience
2009-2010 2010-2011
Other (e.g., project) 322 330
Table 4
Program Specific Candidate Information, 2009-2011 (snapshots taken Fall 2009 and Fall 2010)
Transition Point 3 Exit
2009-2010 2010-2011
Credential2 331 350
1 Data are reported Summer term through Spring term (e.g., Summer 2009-Spring 2010 for the 2009-10 academic
year.)
2 Data for Initial and Advanced Credential Programs reflects students who have filed for their credential with the
Credential Office. These data generally include students who have completed the program one or more years prior
to filing their credential request, particularly related to the advanced credential programs. Data are reported for
Summer 2009 through Spring 2011.
Fall 2011 Biennial Report – Single Subject
5
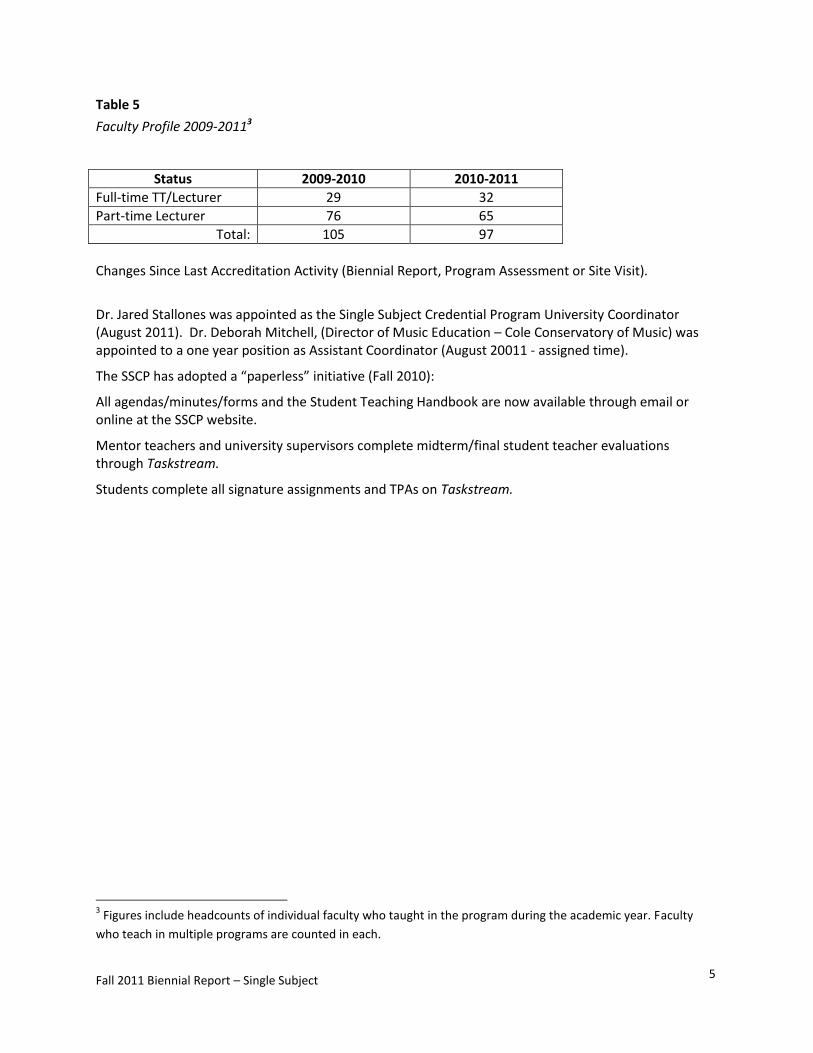
Table 5
Faculty Profile 2009-20113
Status 2009-2010 2010-2011
Full-time TT/Lecturer 29 32
Part-time Lecturer 76 65
Total: 105 97
Changes Since Last Accreditation Activity (Biennial Report, Program Assessment or Site Visit).
Dr. Jared Stallones was appointed as the Single Subject Credential Program University Coordinator (August 2011). Dr. Deborah Mitchell, (Director of Music Education – Cole Conservatory of Music) was appointed to a one year position as Assistant Coordinator (August 20011 - assigned time).
The SSCP has adopted a “paperless” initiative (Fall 2010):
All agendas/minutes/forms and the Student Teaching Handbook are now available through email or online at the SSCP website.
Mentor teachers and university supervisors complete midterm/final student teacher evaluations through Taskstream.
Students complete all signature assignments and TPAs on Taskstream.
3 Figures include headcounts of individual faculty who taught in the program during the academic year. Faculty
who teach in multiple programs are counted in each.
Fall 2011 Biennial Report – Single Subject
6
PART II – Candidate Assessment/Performance and Program Effectiveness Information
a) What are the primary candidate assessment(s) the program uses up to and through recommending the candidate for a credential?
b) What additional information about candidate and program completer performance or program effectiveness is collected and analyzed that informs programmatic decision making?
Prior to fall 2009, the SSCP used the signature assignment completed by SSCP candidates enrolled in EDSS 473, Student Teaching Seminar (pre/post assessment, assessing SLO 2, Assessing Student Learning), the CalTPAs and the TPEs (through the student teaching evaluations) to analyze candidate performance data. Signature assignments for the remaining five SLOs were developed by the SSCP faculty and are now embedded in all professional preparation courses. The table below summarizes the six student learning outcomes (SLOs), the six signature assignments, and CalTPAs currently used to assess candidates.
Fall 2011 Biennial Report – Single Subject 7
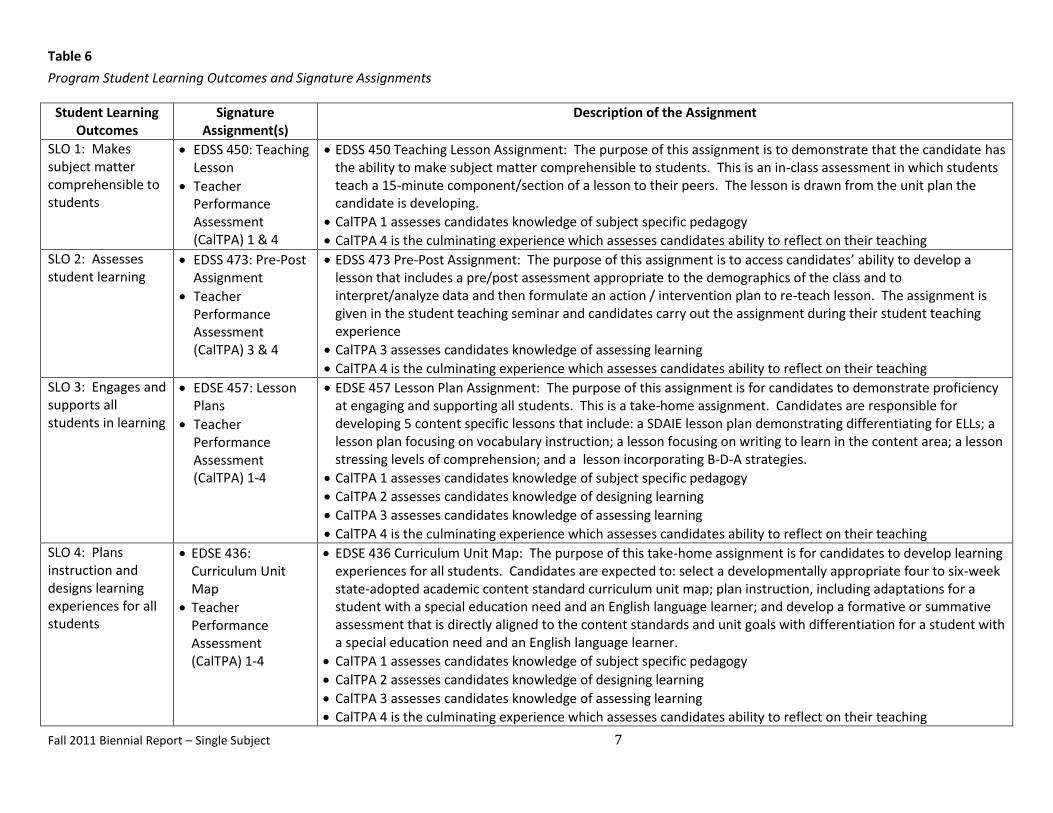
Table 6
Program Student Learning Outcomes and Signature Assignments
Student Learning Outcomes
Signature Assignment(s)
Description of the Assignment
SLO 1: Makes subject matter comprehensible to students
EDSS 450: Teaching Lesson
Teacher Performance Assessment (CalTPA) 1 & 4
EDSS 450 Teaching Lesson Assignment: The purpose of this assignment is to demonstrate that the candidate has the ability to make subject matter comprehensible to students. This is an in-class assessment in which students teach a 15-minute component/section of a lesson to their peers. The lesson is drawn from the unit plan the candidate is developing.
CalTPA 1 assesses candidates knowledge of subject specific pedagogy
CalTPA 4 is the culminating experience which assesses candidates ability to reflect on their teaching
SLO 2: Assesses student learning
EDSS 473: Pre-Post Assignment
Teacher Performance Assessment (CalTPA) 3 & 4
EDSS 473 Pre-Post Assignment: The purpose of this assignment is to access candidates’ ability to develop a lesson that includes a pre/post assessment appropriate to the demographics of the class and to interpret/analyze data and then formulate an action / intervention plan to re-teach lesson. The assignment is given in the student teaching seminar and candidates carry out the assignment during their student teaching experience
CalTPA 3 assesses candidates knowledge of assessing learning
CalTPA 4 is the culminating experience which assesses candidates ability to reflect on their teaching
SLO 3: Engages and supports all students in learning
EDSE 457: Lesson Plans
Teacher Performance Assessment (CalTPA) 1-4
EDSE 457 Lesson Plan Assignment: The purpose of this assignment is for candidates to demonstrate proficiency at engaging and supporting all students. This is a take-home assignment. Candidates are responsible for developing 5 content specific lessons that include: a SDAIE lesson plan demonstrating differentiating for ELLs; a lesson plan focusing on vocabulary instruction; a lesson focusing on writing to learn in the content area; a lesson stressing levels of comprehension; and a lesson incorporating B-D-A strategies.
CalTPA 1 assesses candidates knowledge of subject specific pedagogy
CalTPA 2 assesses candidates knowledge of designing learning
CalTPA 3 assesses candidates knowledge of assessing learning
CalTPA 4 is the culminating experience which assesses candidates ability to reflect on their teaching
SLO 4: Plans instruction and designs learning experiences for all students
EDSE 436: Curriculum Unit Map
Teacher Performance Assessment (CalTPA) 1-4
EDSE 436 Curriculum Unit Map: The purpose of this take-home assignment is for candidates to develop learning experiences for all students. Candidates are expected to: select a developmentally appropriate four to six-week state-adopted academic content standard curriculum unit map; plan instruction, including adaptations for a student with a special education need and an English language learner; and develop a formative or summative assessment that is directly aligned to the content standards and unit goals with differentiation for a student with a special education need and an English language learner.
CalTPA 1 assesses candidates knowledge of subject specific pedagogy
CalTPA 2 assesses candidates knowledge of designing learning
CalTPA 3 assesses candidates knowledge of assessing learning
CalTPA 4 is the culminating experience which assesses candidates ability to reflect on their teaching
Fall 2011 Biennial Report – Single Subject
8
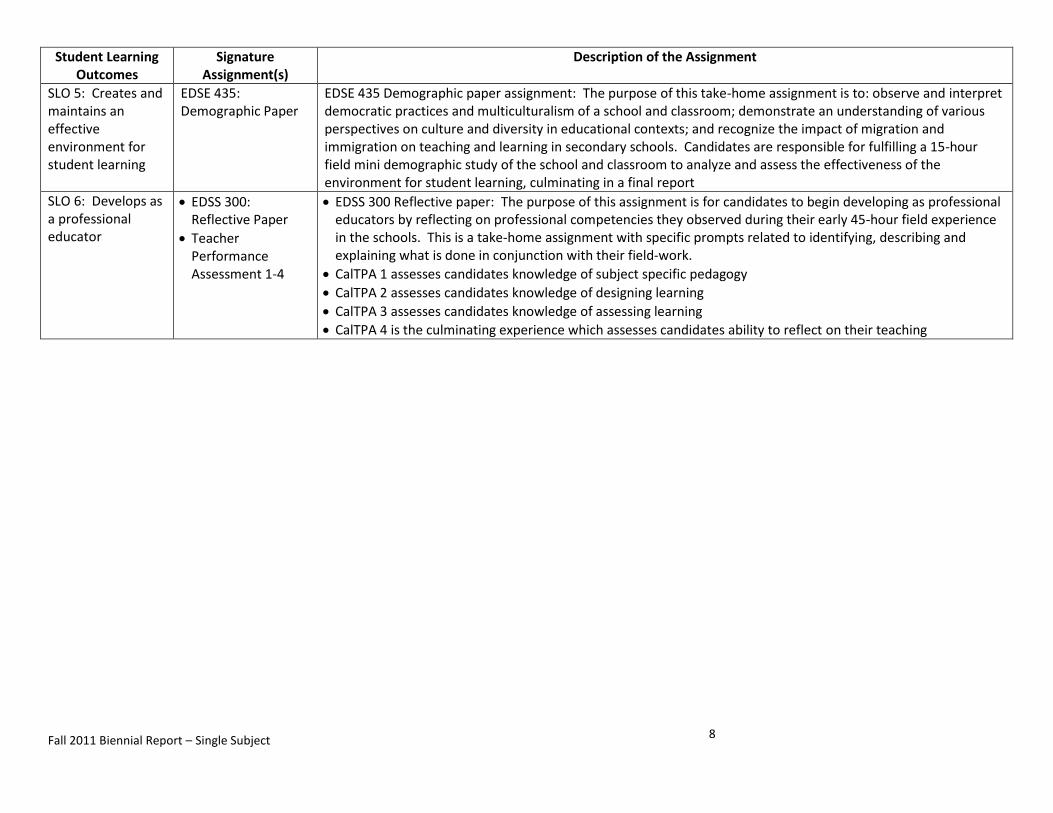
Student Learning Outcomes
Signature Assignment(s)
Description of the Assignment
SLO 5: Creates and maintains an effective environment for student learning
EDSE 435: Demographic Paper
EDSE 435 Demographic paper assignment: The purpose of this take-home assignment is to: observe and interpret democratic practices and multiculturalism of a school and classroom; demonstrate an understanding of various perspectives on culture and diversity in educational contexts; and recognize the impact of migration and immigration on teaching and learning in secondary schools. Candidates are responsible for fulfilling a 15-hour field mini demographic study of the school and classroom to analyze and assess the effectiveness of the environment for student learning, culminating in a final report
SLO 6: Develops as a professional educator
EDSS 300: Reflective Paper
Teacher Performance Assessment 1-4
EDSS 300 Reflective paper: The purpose of this assignment is for candidates to begin developing as professional educators by reflecting on professional competencies they observed during their early 45-hour field experience in the schools. This is a take-home assignment with specific prompts related to identifying, describing and explaining what is done in conjunction with their field-work.
CalTPA 1 assesses candidates knowledge of subject specific pedagogy
CalTPA 2 assesses candidates knowledge of designing learning
CalTPA 3 assesses candidates knowledge of assessing learning
CalTPA 4 is the culminating experience which assesses candidates ability to reflect on their teaching
Fall 2011 Biennial Report – Single Subject 9
The Single Subject SLOs are directly aligned with the CSTPs & the TPE’s, with each SLO being directly aligned to each of the six categories of TPE’s.
The signature assignments were chosen by the SSCP faculty spring 2008 and fully implemented fall 2008.
Each semester one SLO signature assignment and its data are analyzed by the SSCP coordinators (governing body for SSCP), the SSCP advisory committee and the faculty teaching the Signature Assignment course. Based on data and feedback received, any necessary adjustments to the assignment and/or rubric are made. Additionally, when the assignment course instructors meet, they are calibrated on the use of the scoring rubric.
The EDSE 457 assignment and rubric was revised and instructors calibrated on the rubric fall 2009.
o SLO 3: Engages and supports all students in learning.
o Candidates are responsible for developing 5 content specific lessons that include:
a SDAIE lesson plan demonstrating differentiating for ELLs;
a lesson plan focusing on vocabulary instruction; a lesson focusing on writing to learn in the content area;
a lesson stressing levels of comprehension; and
a lesson incorporating B-D-A strategies.
The EDSE 435 assignment and rubric was revised and instructors calibrated on the rubric spring 2010. This three-year cycle of data discussion, review & revision and calibration/re-calibration will continue once all courses are addressed for the first time.
o SLO # 5 “Creates and maintains an effective environment for student learning” on School Observation Report: Democratic Schooling Practices signature assignment.
o The purpose of this assignment is to assess EDSE 435 students’ ability to
Identify and describe the demographic profile of a middle or high school by analyzing its Academic Performance Index (API) scores
Identify and describe the Standardized Testing and Reporting Results required of public schools to meet SB2042 “No Child Left Behind” federal requirements.
From the above reports, identify various populations and relevant data ( i.e., English Language Learners, students on reduced lunch program, and test results reported).
Observe and identify the social environment of the school, classroom climate, implementation of the content area/subject discipline, and multicultural education practices.

Fall 2011 Biennial Report – Single Subject
10
Related to more general program effectiveness, SSCP uses a wealth of information to inform program decision making. Data is analyzed by SSCP faculty, program coordinators, and the university coordinator. Information is also shared with the SSCP program Advisory Committee. Table 9 below summarizes data collected from:
course evaluations,
the CSU Exit Survey (completed by student teachers),
the CSU survey of graduates (one-year out),
evaluations of university supervisors and master teachers (completed by student teachers),
evaluation of the program by cooperating teachers,
course instructor surveys.
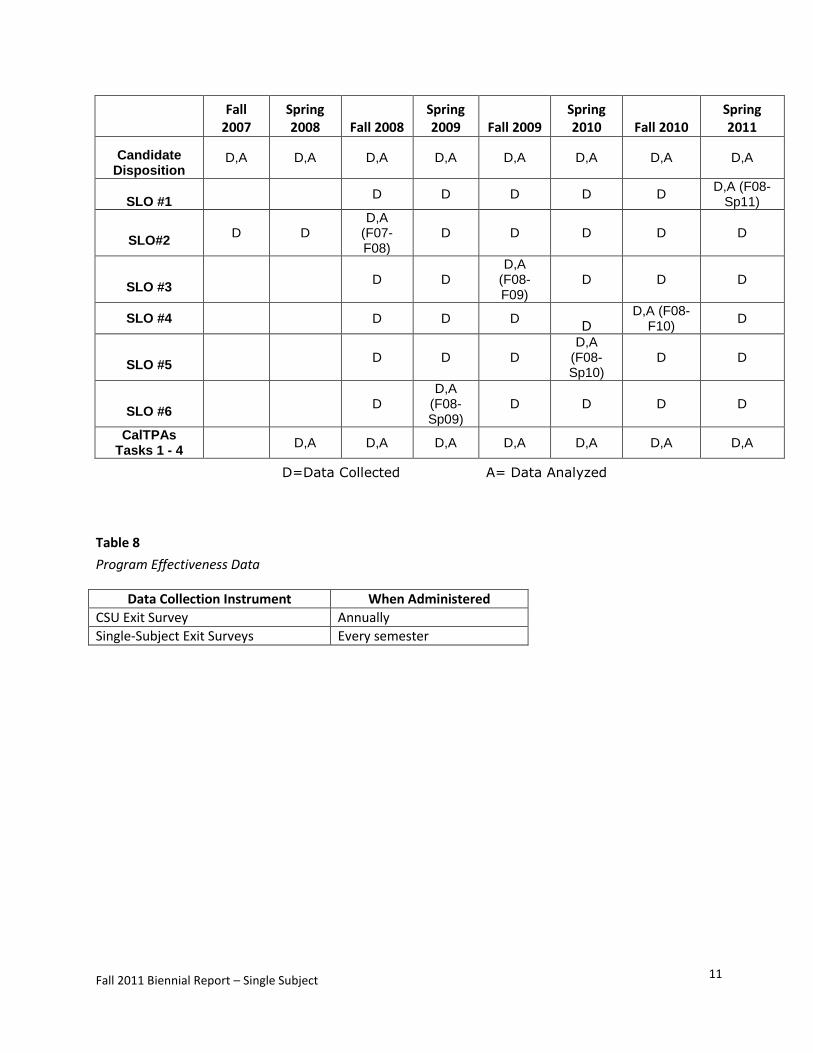
[D = data collected; A = Data Analyzed] Table 7
Summary of Single Subject Evaluation & Data Collection & Analysis
Fall 2007
Spring 2008 Fall 2008
Spring 2009 Fall 2009
Spring 2010 Fall 2010
Spring 2011
Course Evaluations
D,A D,A D,A D,A D,A D,A D,A D,A
CSU Exit
Survey
D, A (Analyze 05-06 Data)
D
D, A (Analyze
06-07 Data)
D
D, A (Analyze
07-08 Data)
D
D, A (Analyze
08-09 Data)
D
CSU Survey of
Graduates
D, A (Analyze 05-06 Data)
D
D, A (Analyze
06-07 Data)
D
D, A (Analyze
07-08 Data)
D
D, A (Analyze
08-09 Data)
D
CSU Survey of
Supervisors
D, A (Analyze 05-06 Data)
D
D, A (Analyze
06-07 Data)
D
D, A (Analyze
07-08 Data)
D
D, A (Analyze
08-09 Data)
D
Evaluation of Cooperating
Teachers
D,A D,A D,A D,A D,A D,A D,A D,A
Evaluation of University
Supervisors
D,A D,A D,A D,A D,A D,A D,A D,A
Cooperating Teacher Program
Evaluation Survey
D,A D,A D,A D,A D,A D,A D,A D,A
Instructor Survey
D A
Fall 2011 Biennial Report – Single Subject
11
Fall 2007
Spring 2008 Fall 2008
Spring 2009 Fall 2009
Spring 2010 Fall 2010
Spring 2011
Candidate Disposition
D,A D,A D,A D,A D,A D,A D,A D,A
SLO #1 D D D D D
D,A (F08-Sp11)
SLO#2 D D
D,A (F07-F08)
D D D D D
SLO #3 D D
D,A (F08-F09)
D D D
SLO #4 D D D D
D,A (F08-F10)
D
SLO #5 D D D
D,A (F08-Sp10)
D D
SLO #6 D
D,A (F08-Sp09)
D D D D
CalTPAs Tasks 1 - 4
D,A D,A D,A D,A D,A D,A D,A
D=Data Collected A= Data Analyzed
Table 8
Program Effectiveness Data
Data Collection Instrument When Administered
CSU Exit Survey Annually
Single-Subject Exit Surveys Every semester
Fall 2011 Biennial Report – Single Subject
12
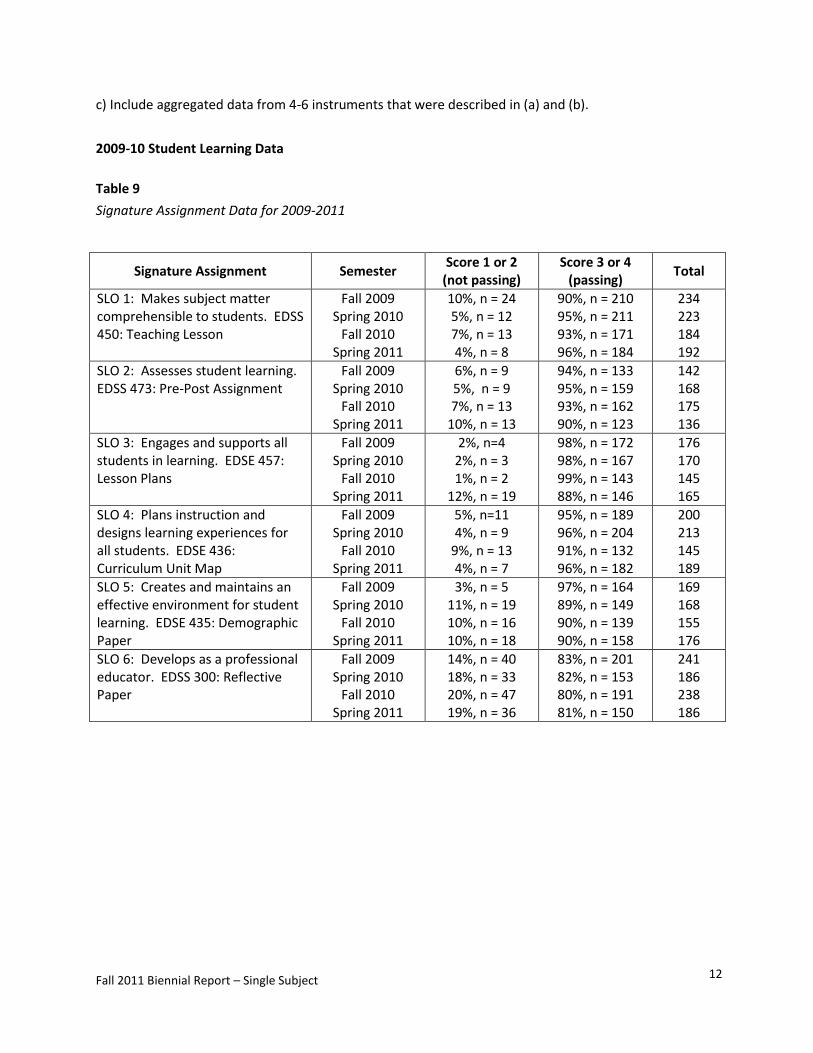
c) Include aggregated data from 4-6 instruments that were described in (a) and (b).
2009-10 Student Learning Data
Table 9
Signature Assignment Data for 2009-2011
Signature Assignment Semester Score 1 or 2
(not passing) Score 3 or 4
(passing) Total
SLO 1: Makes subject matter comprehensible to students. EDSS 450: Teaching Lesson
Fall 2009 Spring 2010
Fall 2010 Spring 2011
10%, n = 24 5%, n = 12 7%, n = 13 4%, n = 8
90%, n = 210 95%, n = 211 93%, n = 171 96%, n = 184
234 223 184 192
SLO 2: Assesses student learning. EDSS 473: Pre-Post Assignment
Fall 2009 Spring 2010
Fall 2010 Spring 2011
6%, n = 9 5%, n = 9 7%, n = 13
10%, n = 13
94%, n = 133 95%, n = 159 93%, n = 162 90%, n = 123
142 168 175 136
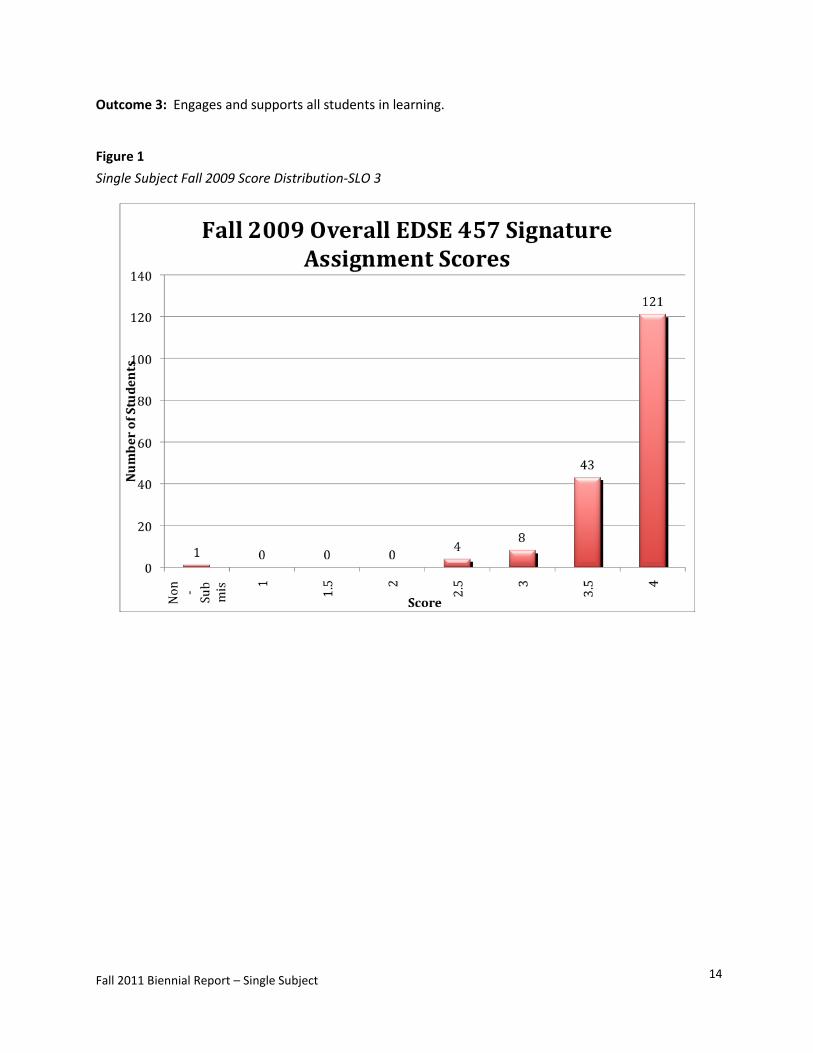
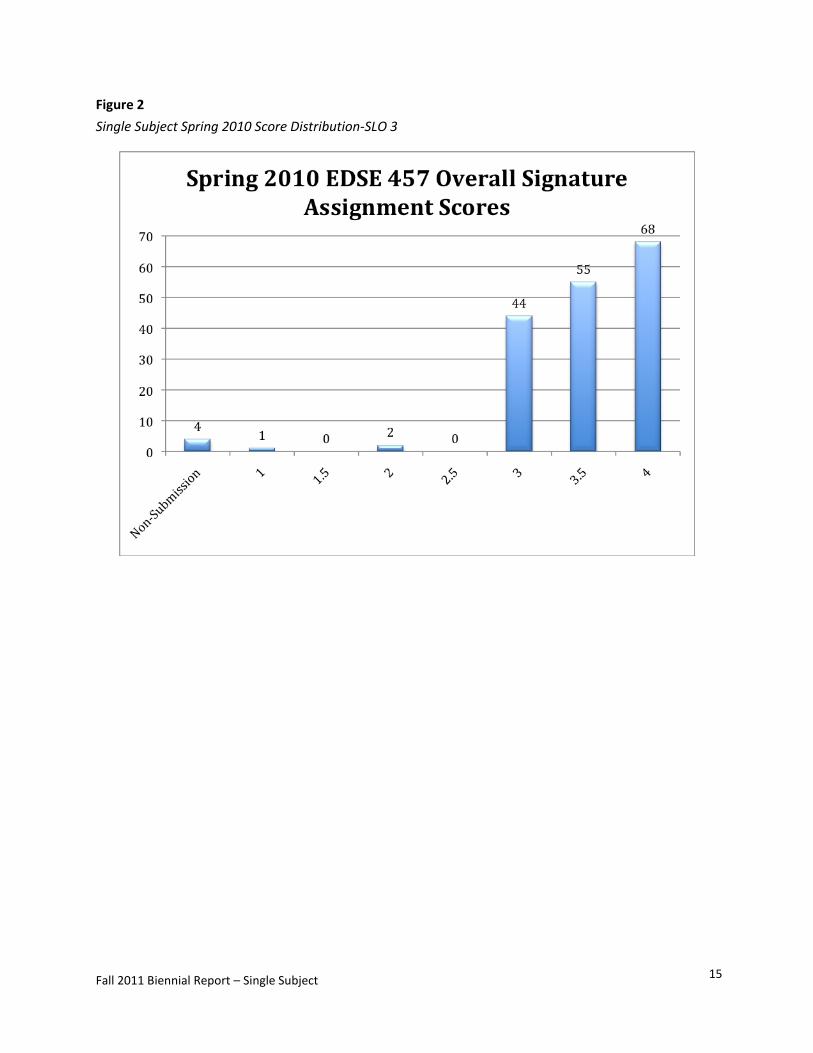
SLO 3: Engages and supports all students in learning. EDSE 457: Lesson Plans
Fall 2009 Spring 2010
Fall 2010 Spring 2011
2%, n=4 2%, n = 3 1%, n = 2
12%, n = 19
98%, n = 172 98%, n = 167 99%, n = 143 88%, n = 146
176 170 145 165
SLO 4: Plans instruction and designs learning experiences for all students. EDSE 436: Curriculum Unit Map
Fall 2009 Spring 2010
Fall 2010 Spring 2011
5%, n=11 4%, n = 9
9%, n = 13 4%, n = 7
95%, n = 189 96%, n = 204 91%, n = 132 96%, n = 182
200 213 145 189
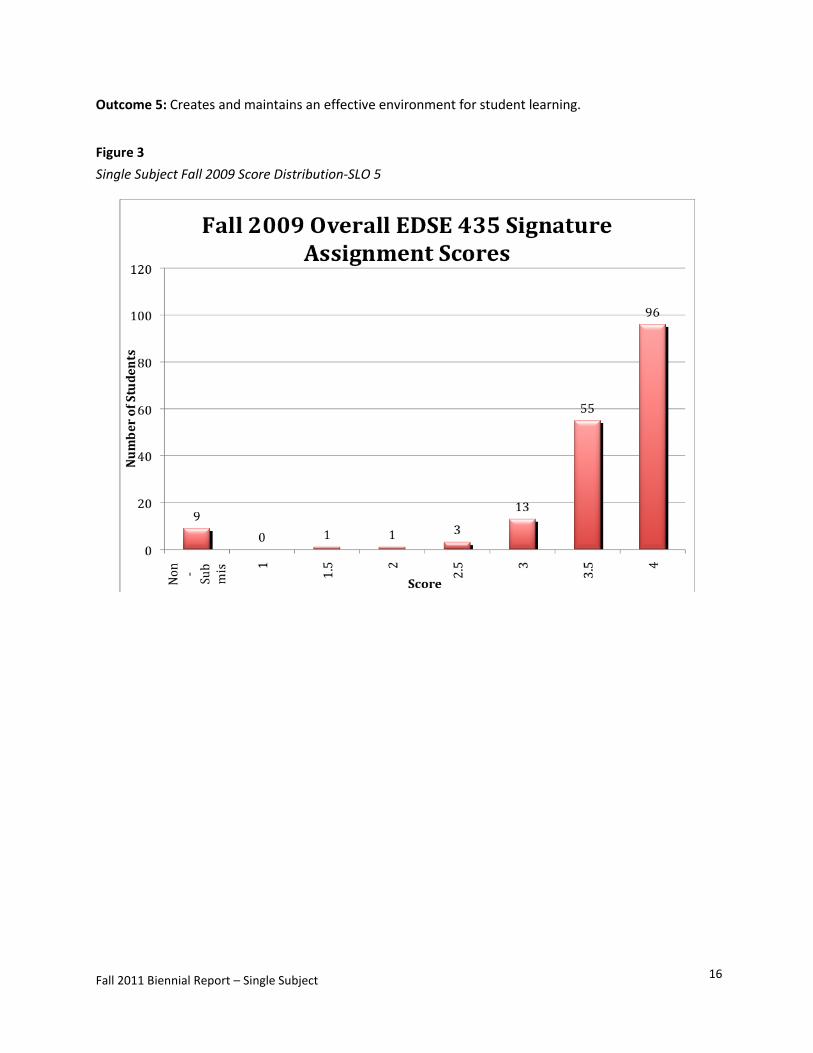
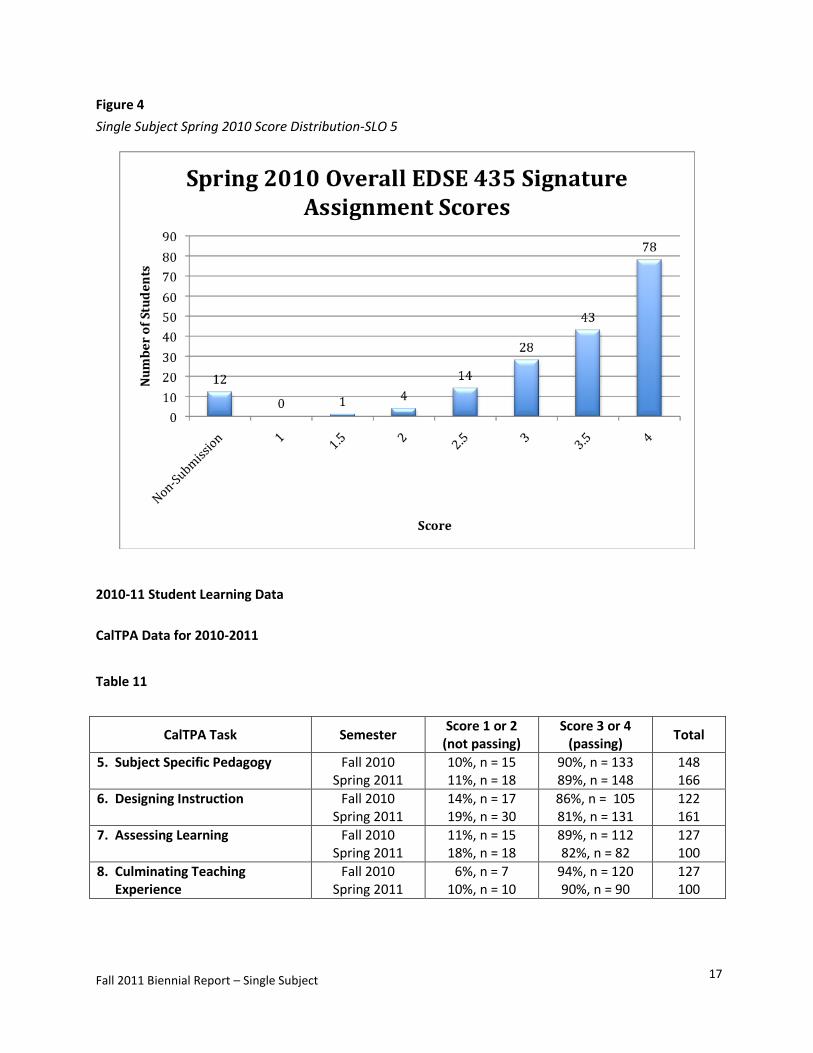
SLO 5: Creates and maintains an effective environment for student learning. EDSE 435: Demographic Paper
Fall 2009 Spring 2010
Fall 2010 Spring 2011
3%, n = 5 11%, n = 19 10%, n = 16 10%, n = 18
97%, n = 164 89%, n = 149 90%, n = 139 90%, n = 158
169 168 155 176
SLO 6: Develops as a professional educator. EDSS 300: Reflective Paper
Fall 2009 Spring 2010
Fall 2010 Spring 2011
14%, n = 40 18%, n = 33 20%, n = 47 19%, n = 36
83%, n = 201 82%, n = 153 80%, n = 191 81%, n = 150
241 186 238 186
Fall 2011 Biennial Report – Single Subject
13
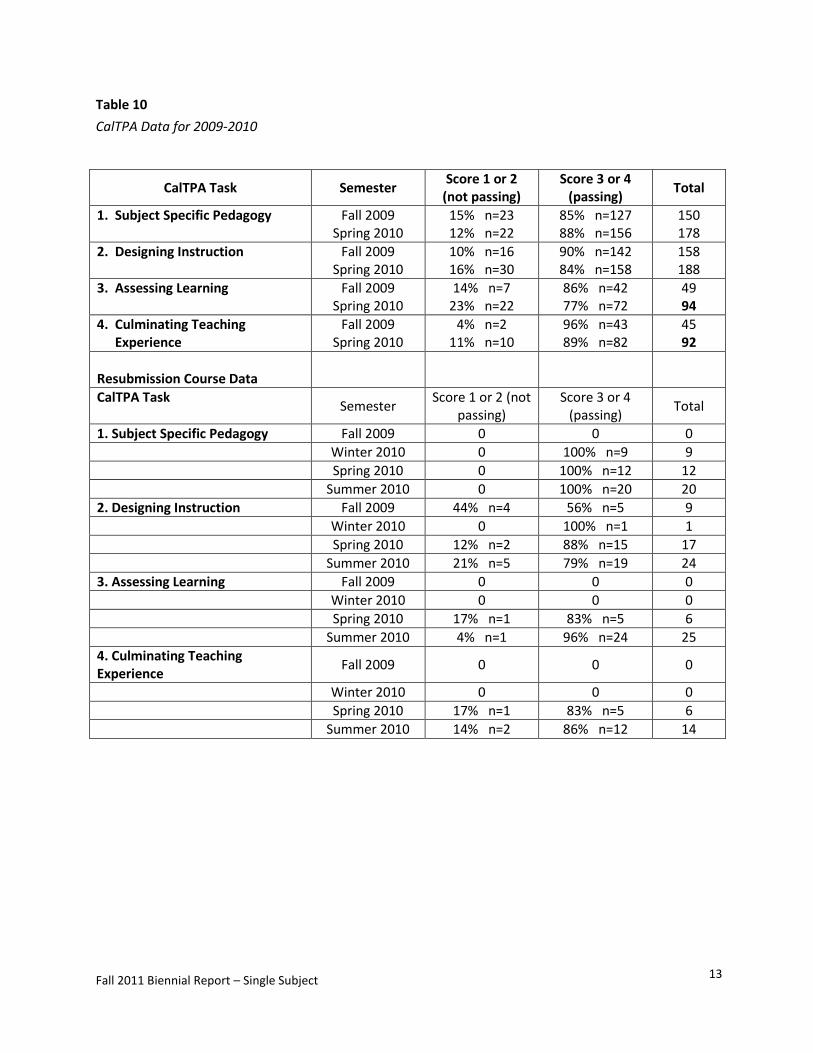
Table 10
CalTPA Data for 2009-2010
CalTPA Task Semester Score 1 or 2
(not passing) Score 3 or 4
(passing) Total
1. Subject Specific Pedagogy Fall 2009 Spring 2010
15% n=23 12% n=22
85% n=127 88% n=156
150 178
2. Designing Instruction Fall 2009 Spring 2010
10% n=16 16% n=30
90% n=142 84% n=158
158 188
3. Assessing Learning Fall 2009 Spring 2010
14% n=7 23% n=22
86% n=42 77% n=72
49 94
4. Culminating Teaching Experience
Fall 2009 Spring 2010
4% n=2 11% n=10
96% n=43 89% n=82
45 92
Resubmission Course Data
CalTPA Task Semester
Score 1 or 2 (not passing)
Score 3 or 4 (passing)
Total
1. Subject Specific Pedagogy Fall 2009 0 0 0
Winter 2010 0 100% n=9 9
Spring 2010 0 100% n=12 12
Summer 2010 0 100% n=20 20
2. Designing Instruction Fall 2009 44% n=4 56% n=5 9
Winter 2010 0 100% n=1 1
Spring 2010 12% n=2 88% n=15 17
Summer 2010 21% n=5 79% n=19 24
3. Assessing Learning Fall 2009 0 0 0
Winter 2010 0 0 0
Spring 2010 17% n=1 83% n=5 6
Summer 2010 4% n=1 96% n=24 25
4. Culminating Teaching Experience
Fall 2009 0 0 0
Winter 2010 0 0 0
Spring 2010 17% n=1 83% n=5 6
Summer 2010 14% n=2 86% n=12 14
Fall 2011 Biennial Report – Single Subject
14
Outcome 3: Engages and supports all students in learning.
Figure 1
Single Subject Fall 2009 Score Distribution-SLO 3
Fall 2011 Biennial Report – Single Subject
15
Figure 2
Single Subject Spring 2010 Score Distribution-SLO 3
Fall 2011 Biennial Report – Single Subject
16
Outcome 5: Creates and maintains an effective environment for student learning.
Figure 3
Single Subject Fall 2009 Score Distribution-SLO 5
Fall 2011 Biennial Report – Single Subject
17
Figure 4
Single Subject Spring 2010 Score Distribution-SLO 5
2010-11 Student Learning Data
CalTPA Data for 2010-2011
Table 11
CalTPA Task Semester Score 1 or 2
(not passing) Score 3 or 4
(passing) Total
5. Subject Specific Pedagogy Fall 2010 Spring 2011
10%, n = 15 11%, n = 18
90%, n = 133 89%, n = 148
148 166
6. Designing Instruction Fall 2010 Spring 2011
14%, n = 17 19%, n = 30
86%, n = 105 81%, n = 131
122 161
7. Assessing Learning Fall 2010 Spring 2011
11%, n = 15 18%, n = 18
89%, n = 112 82%, n = 82
127 100
8. Culminating Teaching Experience
Fall 2010 Spring 2011
6%, n = 7 10%, n = 10
94%, n = 120 90%, n = 90
127 100
Fall 2011 Biennial Report – Single Subject
18
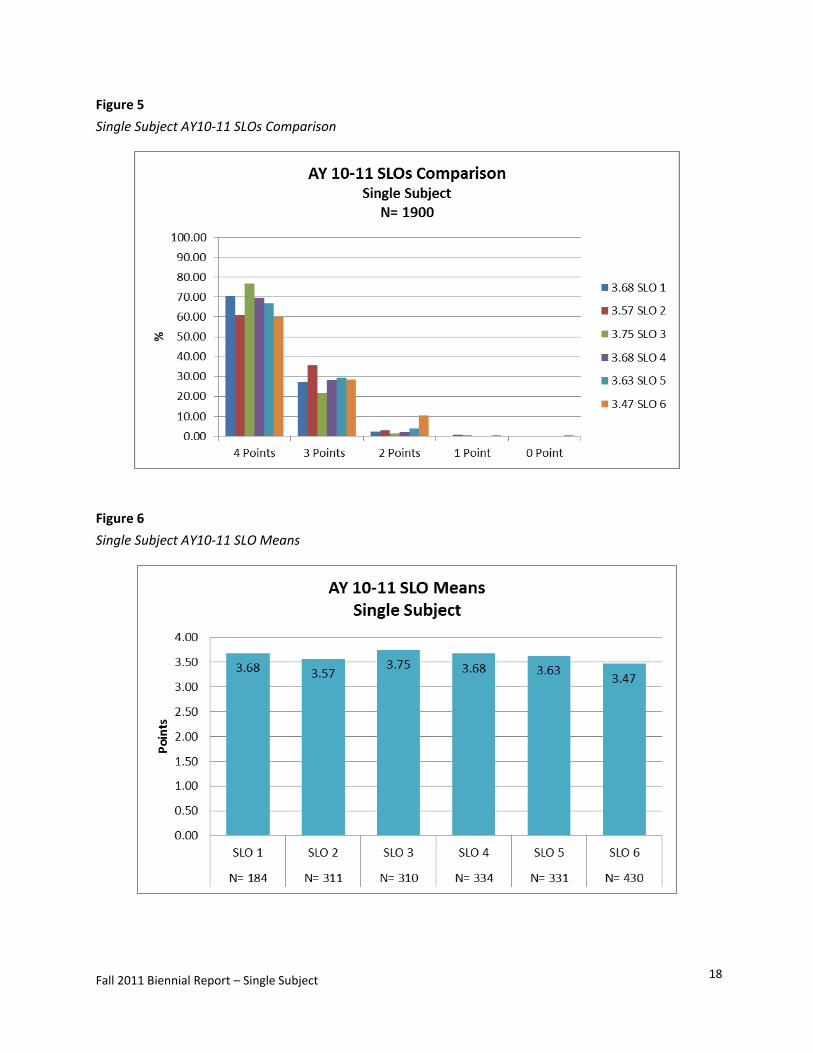
Figure 5
Single Subject AY10-11 SLOs Comparison
Figure 6
Single Subject AY10-11 SLO Means
Fall 2011 Biennial Report – Single Subject
19
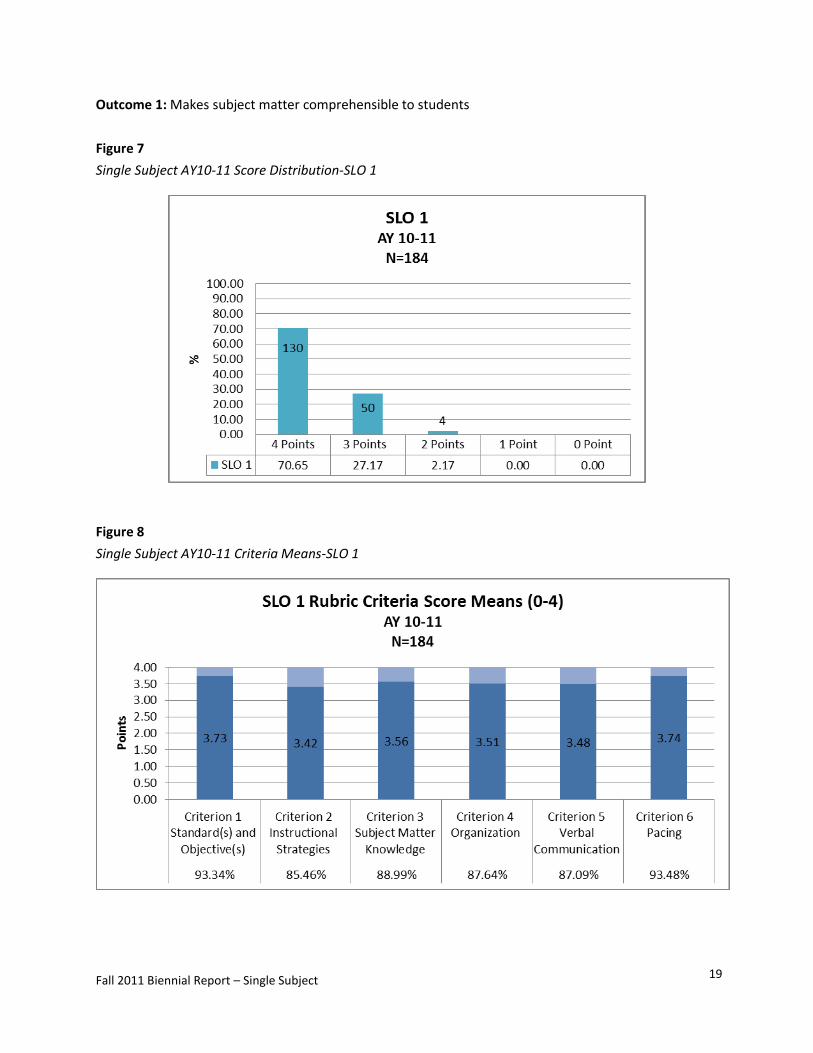
Outcome 1: Makes subject matter comprehensible to students
Figure 7
Single Subject AY10-11 Score Distribution-SLO 1
Figure 8
Single Subject AY10-11 Criteria Means-SLO 1
Fall 2011 Biennial Report – Single Subject
20
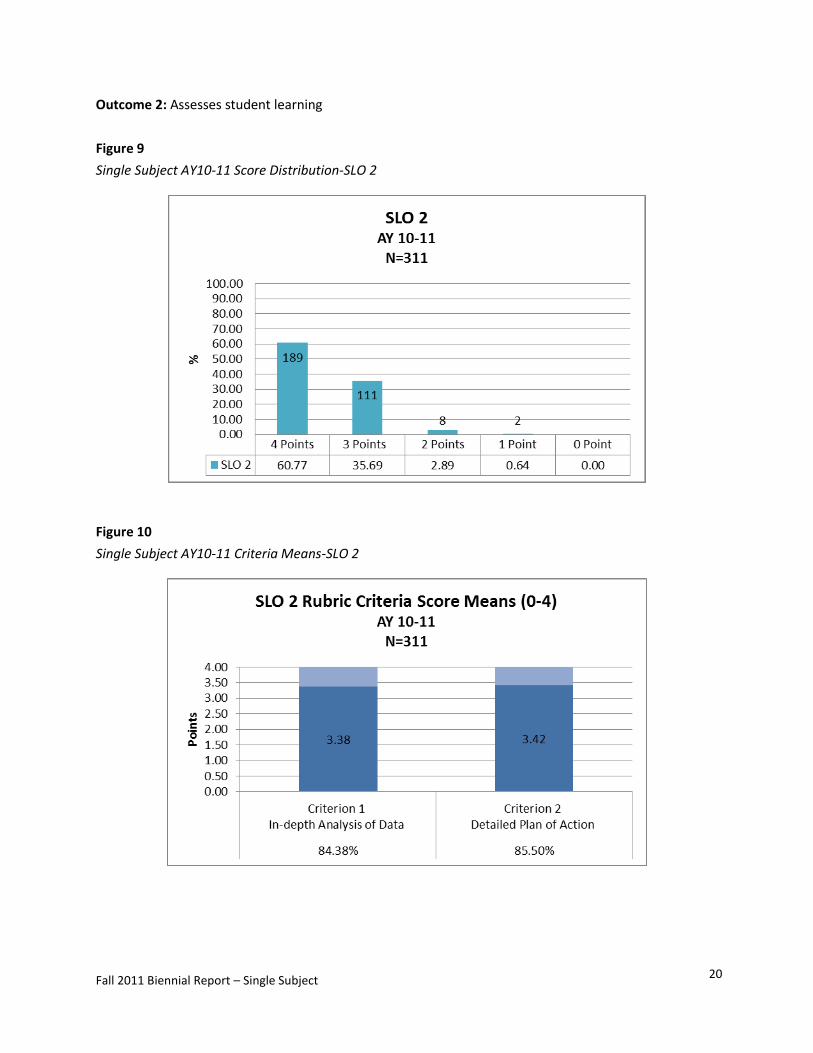
Outcome 2: Assesses student learning
Figure 9
Single Subject AY10-11 Score Distribution-SLO 2
Figure 10
Single Subject AY10-11 Criteria Means-SLO 2
Fall 2011 Biennial Report – Single Subject
21
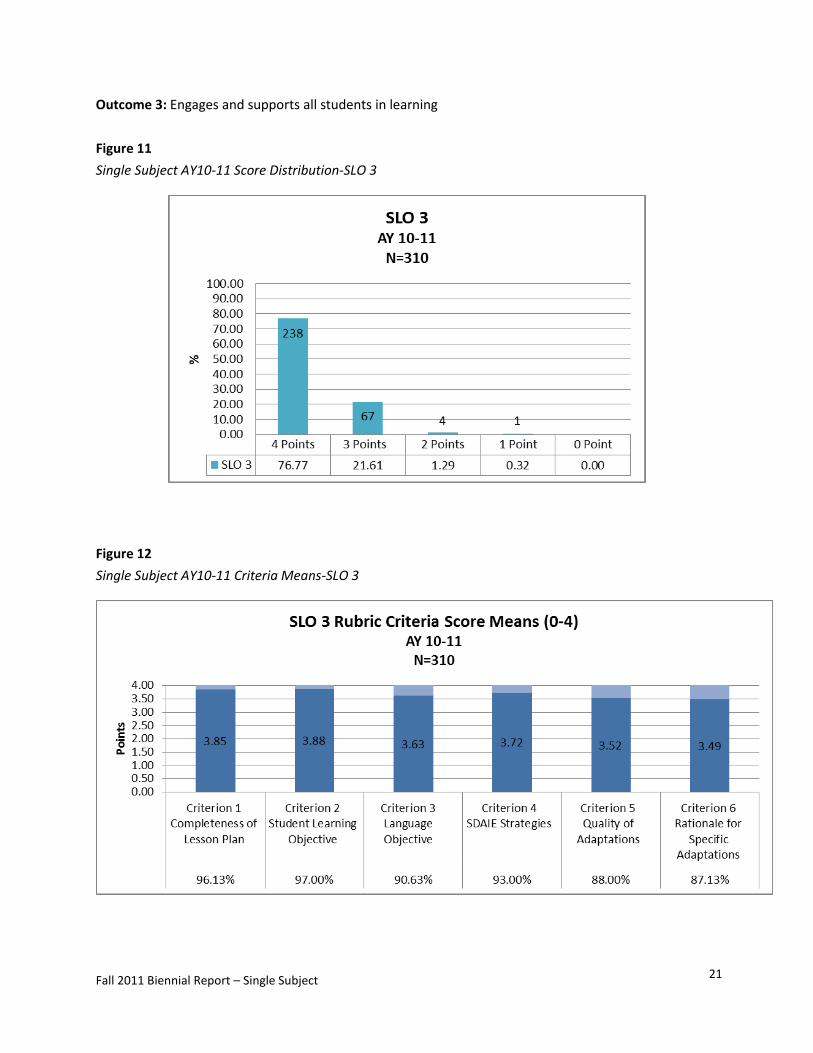
Outcome 3: Engages and supports all students in learning
Figure 11
Single Subject AY10-11 Score Distribution-SLO 3
Figure 12
Single Subject AY10-11 Criteria Means-SLO 3

Fall 2011 Biennial Report – Single Subject
22
Outcome 4: Plans instruction and designs learning experiences for all students
Figure 13
Single Subject AY10-11 Score Distribution-SLO 4
Figure 14
Single Subject AY10-11 Criteria Means-SLO 4
Fall 2011 Biennial Report – Single Subject
23
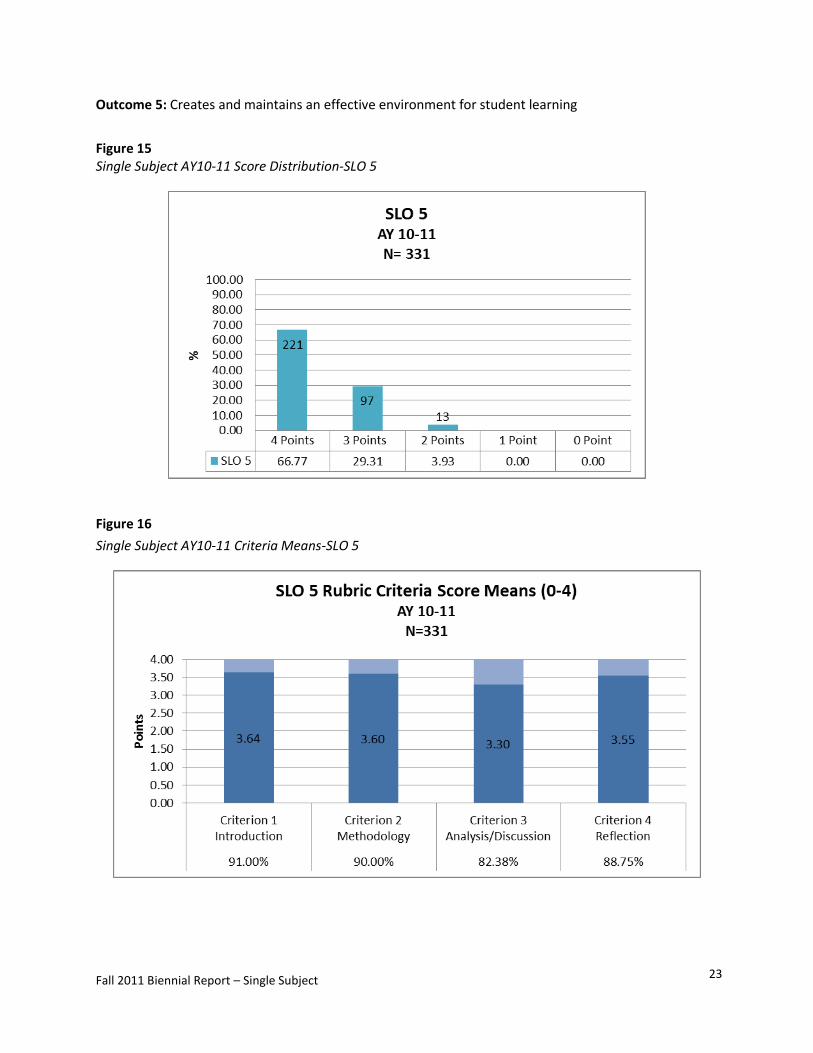
Outcome 5: Creates and maintains an effective environment for student learning
Figure 15 Single Subject AY10-11 Score Distribution-SLO 5
Figure 16
Single Subject AY10-11 Criteria Means-SLO 5
Fall 2011 Biennial Report – Single Subject
24
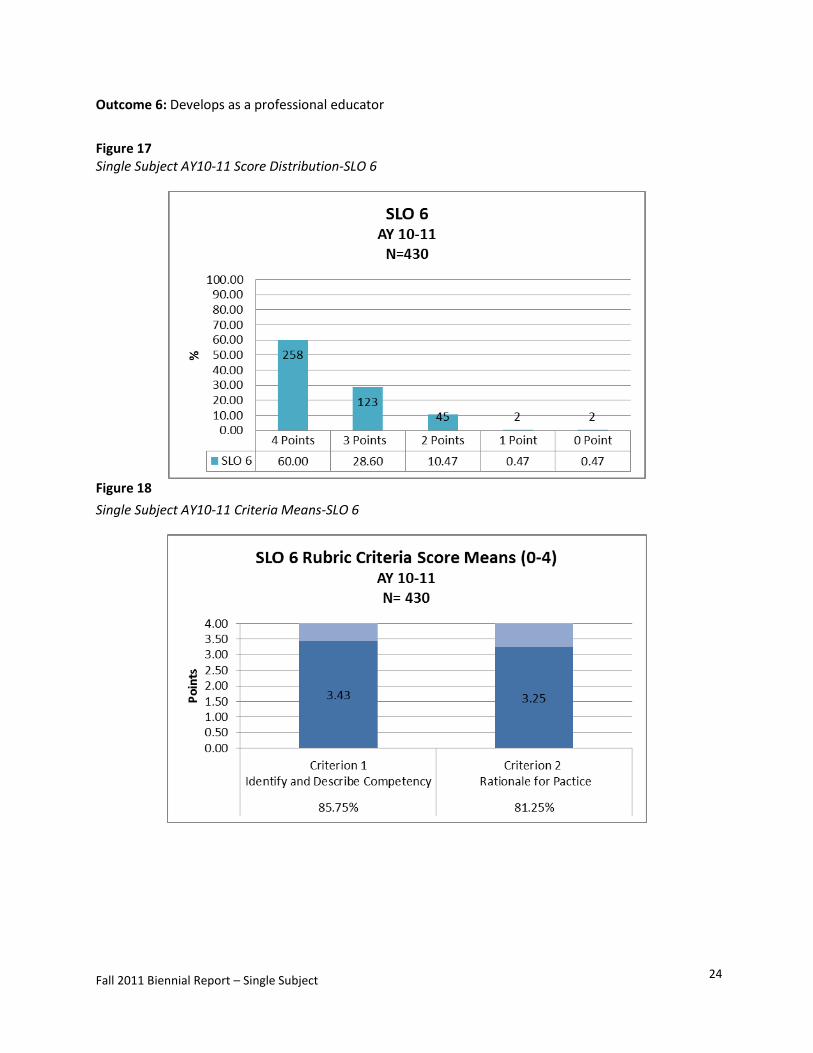
Outcome 6: Develops as a professional educator
Figure 17 Single Subject AY10-11 Score Distribution-SLO 6
Figure 18
Single Subject AY10-11 Criteria Means-SLO 6
Fall 2011 Biennial Report – Single Subject
25
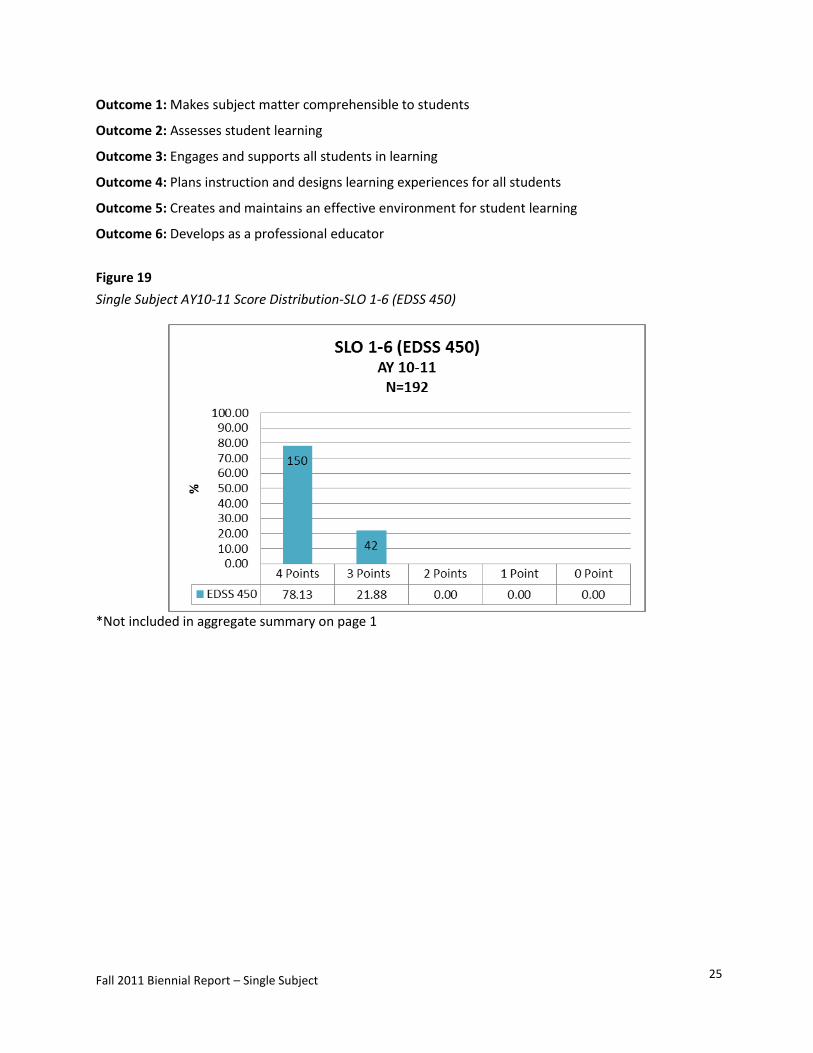
Outcome 1: Makes subject matter comprehensible to students
Outcome 2: Assesses student learning
Outcome 3: Engages and supports all students in learning
Outcome 4: Plans instruction and designs learning experiences for all students
Outcome 5: Creates and maintains an effective environment for student learning
Outcome 6: Develops as a professional educator
Figure 19
Single Subject AY10-11 Score Distribution-SLO 1-6 (EDSS 450)
*Not included in aggregate summary on page 1
Fall 2011 Biennial Report – Single Subject
26
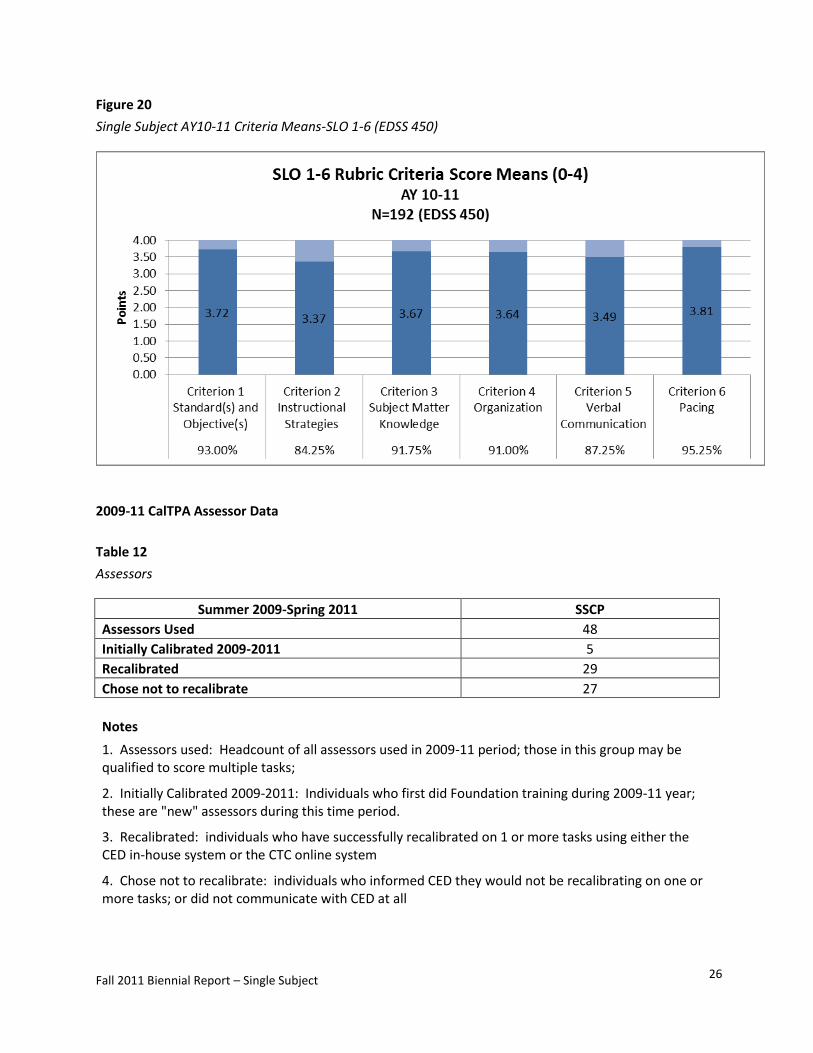
Figure 20
Single Subject AY10-11 Criteria Means-SLO 1-6 (EDSS 450)
2009-11 CalTPA Assessor Data
Table 12
Assessors
Summer 2009-Spring 2011 SSCP
Assessors Used 48
Initially Calibrated 2009-2011 5
Recalibrated 29
Chose not to recalibrate 27
Notes
1. Assessors used: Headcount of all assessors used in 2009-11 period; those in this group may be qualified to score multiple tasks;
2. Initially Calibrated 2009-2011: Individuals who first did Foundation training during 2009-11 year; these are "new" assessors during this time period.
3. Recalibrated: individuals who have successfully recalibrated on 1 or more tasks using either the CED in-house system or the CTC online system
4. Chose not to recalibrate: individuals who informed CED they would not be recalibrating on one or more tasks; or did not communicate with CED at all
Fall 2011 Biennial Report – Single Subject
27
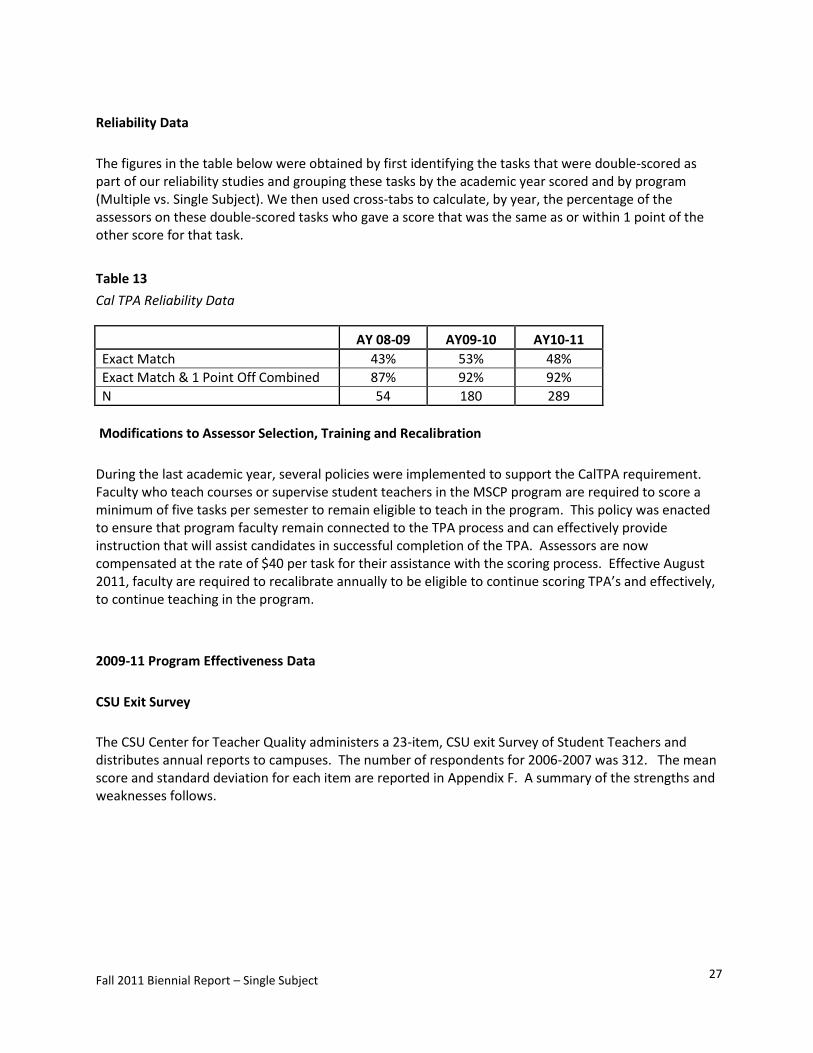
Reliability Data
The figures in the table below were obtained by first identifying the tasks that were double-scored as part of our reliability studies and grouping these tasks by the academic year scored and by program (Multiple vs. Single Subject). We then used cross-tabs to calculate, by year, the percentage of the assessors on these double-scored tasks who gave a score that was the same as or within 1 point of the other score for that task.
Table 13
Cal TPA Reliability Data
AY 08-09 AY09-10 AY10-11
Exact Match 43% 53% 48%
Exact Match & 1 Point Off Combined 87% 92% 92%
N 54 180 289
Modifications to Assessor Selection, Training and Recalibration
During the last academic year, several policies were implemented to support the CalTPA requirement. Faculty who teach courses or supervise student teachers in the MSCP program are required to score a minimum of five tasks per semester to remain eligible to teach in the program. This policy was enacted to ensure that program faculty remain connected to the TPA process and can effectively provide instruction that will assist candidates in successful completion of the TPA. Assessors are now compensated at the rate of $40 per task for their assistance with the scoring process. Effective August 2011, faculty are required to recalibrate annually to be eligible to continue scoring TPA’s and effectively, to continue teaching in the program.
2009-11 Program Effectiveness Data
CSU Exit Survey
The CSU Center for Teacher Quality administers a 23-item, CSU exit Survey of Student Teachers and distributes annual reports to campuses. The number of respondents for 2006-2007 was 312. The mean score and standard deviation for each item are reported in Appendix F. A summary of the strengths and weaknesses follows.

Fall 2011 Biennial Report – Single Subject
28
Table 14
Identified Strengths as revealed in the CSU Exit Survey of Student Teachers
As a new teacher, I am well or adequately prepared to begin…
Graduated 07-08
Graduated 08-09
To prepare lesson plans and make prior
arrangements for students’ class activities
95.8%
n = 236
95%
n = 194
To adhere to principles of education equity in
the teaching of all students
93.1%
n = 232
94%
n = 94%
To evaluate and reflect on my own teaching
and to seek out assistance that leads to
professional growth
97.4%
n = 235
93%
n = 194
Table 15
Identified Weaknesses as revealed in the CSU Exit Survey of Student Teachers
As a new teacher, I am well or adequately prepared to begin…
Graduated 07-08
Graduated 08-09
To know about resources in the school &
community for at risk students and families
74.7%
n = 233
69%
n = 194
To meet the instructional needs of students with
special learning needs
71.5%
n = 235
72%
n = 186
To meet the instructional needs of students who
are English Language Learners
76.4%
n = 232
72%
n = 194

Fall 2011 Biennial Report – Single Subject
29
CSU Survey of Program Graduates
The CSU Center for Teacher Quality annually surveys 1st year teachers who graduated from CSU programs. The data is presented alongside the data from the survey of Supervisors. What follows is a summary of strengths and weaknesses.
Table 16
Identified Strengths as Revealed in the CSU Survey of Graduates in their First Year of Teaching
The First Year Teaching Graduate was well or adequately prepared to… Graduated
07-08 Graduated
08-09
Know and understand the subjects of the curriculum at his/her grade
level 94%
n = 86
94%
n=84
Prepare lesson plans and make prior arrangements for class activities 89%
n = 87
88%
n=84
Monitor students’ progress by using informal assessments methods 88%
n = 84
87%
n= 85
Adhere to principles of educational equity in the teaching of all
students 88%
n = 83
93%
n=85
Table 17
Identified Weaknesses as Revealed in the CSU Survey of Graduates in their First Year of Teaching
The First Year Teaching Graduate was well or adequately prepared to… Graduated
07-08 Graduated
08-09
Know about resources in the school & community for at-risk
students/families 55%
n = 83
56%
n=85
Meet the instructional needs of students with special learning
needs 57%
n = 84
67%
n=83
Organize and manage student behavior and discipline
satisfactorily 61%
n = 87
73%
n=86

Fall 2011 Biennial Report – Single Subject
30
CSU Survey of Supervisors of Program Graduates
The CSU Center for Teacher Quality annually surveys supervisors of 1st year teaching graduates of CSU programs. The data is presented alongside the data from the 1-year out graduates. What follows is a summary of the strengths and weaknesses.
Table 18
Identified Strengths as revealed in the CSU Survey of Employers
The First Year Teaching Graduate was well or adequately prepared to… Graduated
07-08 Graduated
08-09
Know and understand the subjects of the curriculum at her/his
grade level 95%
n = 82
91%
n=57
Use computer-based technology in class activities and to keep
class records 94%
n = 82
93%
n=55
Adhere to principles of educational equity in the teaching of all
students 90%
n = 82
82%
n=57
Maintain positive rapport and foster students’ motivation and
excitement 90%
n = 83
77%
n=57
Table 19
Identified Weaknesses as revealed in the CSU Survey of Employers
The First Year Teaching Graduate was well or adequately prepared to…
Graduated 07-08
Graduated 08-09
Know about resources in the school & community for at-risk
students/families 66%
n = 80
58%
n=52
Meet the instructional needs of students with special
learning needs 71%
n = 82
62%
n=55
Meet the instructional needs of students who are English
Language Learners 78%
n = 81
72%
n=54
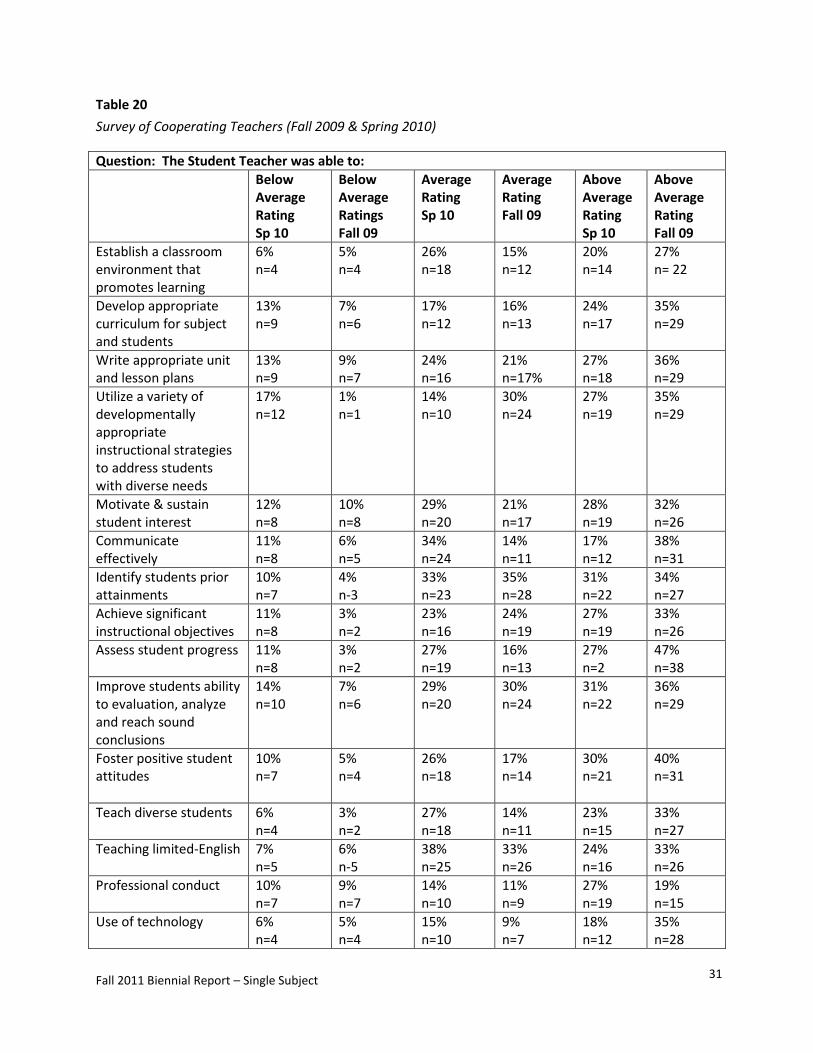
Survey of Cooperating Teachers
Each year the SSCP surveys our cooperating teachers about how well our programs helped prepare their student teachers. Overall, the cooperating teachers who returned the surveys were satisfied with the education our student teachers received. What is shown below is a summary of data collected.
Fall 2011 Biennial Report – Single Subject
31
Table 20
Survey of Cooperating Teachers (Fall 2009 & Spring 2010)
Question: The Student Teacher was able to:
Below Average Rating Sp 10
Below Average Ratings Fall 09
Average Rating Sp 10
Average Rating Fall 09
Above Average Rating Sp 10
Above Average Rating Fall 09
Establish a classroom environment that promotes learning
6% n=4
5% n=4
26% n=18
15% n=12
20% n=14
27% n= 22
Develop appropriate curriculum for subject and students
13% n=9
7% n=6
17% n=12
16% n=13
24% n=17
35% n=29
Write appropriate unit and lesson plans
13% n=9
9% n=7
24% n=16
21% n=17%
27% n=18
36% n=29
Utilize a variety of developmentally appropriate instructional strategies to address students with diverse needs
17% n=12
1% n=1
14% n=10
30% n=24
27% n=19
35% n=29
Motivate & sustain student interest
12% n=8
10% n=8
29% n=20
21% n=17
28% n=19
32% n=26
Communicate effectively
11% n=8
6% n=5
34% n=24
14% n=11
17% n=12
38% n=31
Identify students prior attainments
10% n=7
4% n-3
33% n=23
35% n=28
31% n=22
34% n=27
Achieve significant instructional objectives
11% n=8
3% n=2
23% n=16
24% n=19
27% n=19
33% n=26
Assess student progress 11% n=8
3% n=2
27% n=19
16% n=13
27% n=2
47% n=38
Improve students ability to evaluation, analyze and reach sound conclusions
14% n=10
7% n=6
29% n=20
30% n=24
31% n=22
36% n=29
Foster positive student attitudes
10% n=7
5% n=4
26% n=18
17% n=14
30% n=21
40% n=31
Teach diverse students 6% n=4
3% n=2
27% n=18
14% n=11
23% n=15
33% n=27
Teaching limited-English 7% n=5
6% n-5
38% n=25
33% n=26
24% n=16
33% n=26
Professional conduct 10% n=7
9% n=7
14% n=10
11% n=9
27% n=19
19% n=15
Use of technology 6% n=4
5% n=4
15% n=10
9% n=7
18% n=12
35% n=28
Fall 2011 Biennial Report – Single Subject
32
Question: The Student Teacher was able to:
Below Average Rating Sp 10
Below Average Ratings Fall 09
Average Rating Sp 10
Average Rating Fall 09
Above Average Rating Sp 10
Above Average Rating Fall 09
The student was adequately prepared to begin student teaching
10% n=7
10% n=8
20% n=14
14% n=11
17% n=12
25% n=20
The student possessed a sound knowledge base in content area
6% n=4
5% n=4
15% n=10
11% n=9
17% n=12
30% n=24
Question: Highly ineffective/ ineffective Sp 10
Highly ineffective/ Ineffective Fall 09
Acceptable Sp 10
Acceptable Fall 09
Effective/ highly effective Sp 10
Effective/ highly effective Fall 09
Please rate the Single Subject Credential Program in terms of how it prepares candidates to be a beginning teacher
6% n=4
9% n=7
23% n=16
12% n=10
71% n=50
79% n=64
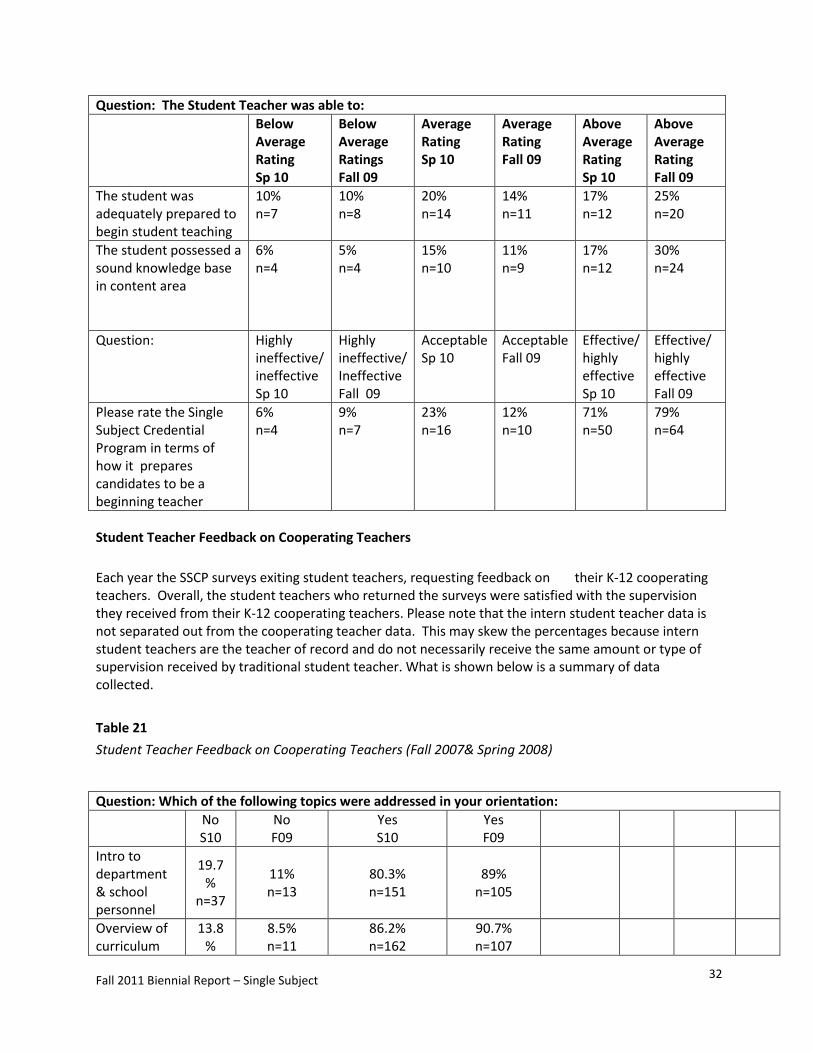
Student Teacher Feedback on Cooperating Teachers
Each year the SSCP surveys exiting student teachers, requesting feedback on their K-12 cooperating teachers. Overall, the student teachers who returned the surveys were satisfied with the supervision they received from their K-12 cooperating teachers. Please note that the intern student teacher data is not separated out from the cooperating teacher data. This may skew the percentages because intern student teachers are the teacher of record and do not necessarily receive the same amount or type of supervision received by traditional student teacher. What is shown below is a summary of data collected.
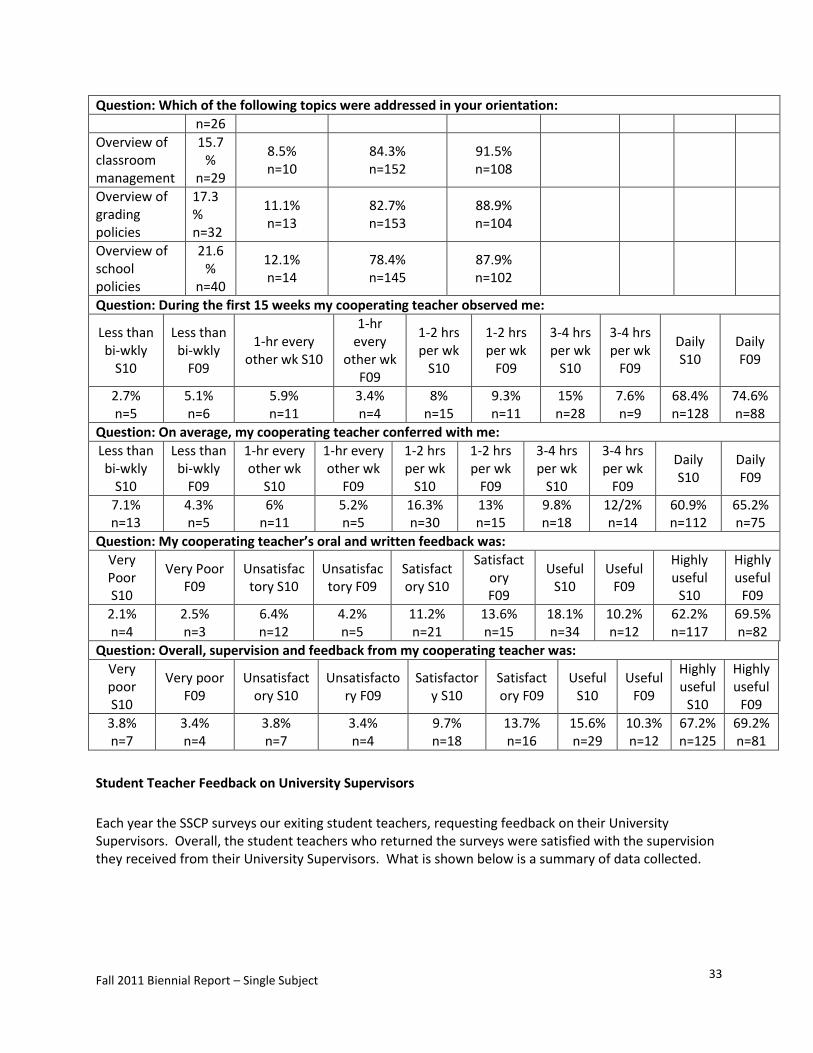
Table 21
Student Teacher Feedback on Cooperating Teachers (Fall 2007& Spring 2008)
Question: Which of the following topics were addressed in your orientation:
No S10
No F09
Yes S10
Yes F09
Intro to department & school personnel
19.7%
n=37
11% n=13
80.3% n=151
89% n=105
Overview of curriculum
13.8%
8.5% n=11
86.2% n=162
90.7% n=107
Fall 2011 Biennial Report – Single Subject
33
Question: Which of the following topics were addressed in your orientation:
n=26
Overview of classroom management
15.7%
n=29
8.5% n=10
84.3% n=152
91.5% n=108
Overview of grading policies
17.3% n=32
11.1% n=13
82.7% n=153
88.9% n=104
Overview of school policies
21.6%
n=40
12.1% n=14
78.4% n=145
87.9% n=102
Question: During the first 15 weeks my cooperating teacher observed me:
Less than bi-wkly
S10
Less than bi-wkly
F09
1-hr every other wk S10
1-hr every
other wk F09
1-2 hrs per wk
S10
1-2 hrs per wk
F09
3-4 hrs per wk
S10
3-4 hrs per wk
F09
Daily S10
Daily F09
2.7% n=5
5.1% n=6
5.9% n=11
3.4% n=4
8% n=15
9.3% n=11
15% n=28
7.6% n=9
68.4% n=128
74.6% n=88
Question: On average, my cooperating teacher conferred with me:
Less than bi-wkly
S10
Less than bi-wkly
F09
1-hr every other wk
S10
1-hr every other wk
F09
1-2 hrs per wk
S10
1-2 hrs per wk
F09
3-4 hrs per wk
S10
3-4 hrs per wk
F09
Daily S10
Daily F09
7.1% n=13
4.3% n=5
6% n=11
5.2% n=5
16.3% n=30
13% n=15
9.8% n=18
12/2% n=14
60.9% n=112
65.2% n=75
Question: My cooperating teacher’s oral and written feedback was:
Very Poor S10
Very Poor F09
Unsatisfactory S10
Unsatisfactory F09
Satisfactory S10
Satisfactory F09
Useful S10
Useful F09
Highly useful
S10
Highly useful
F09
2.1% n=4
2.5% n=3
6.4% n=12
4.2% n=5
11.2% n=21
13.6% n=15
18.1% n=34
10.2% n=12
62.2% n=117
69.5% n=82
Question: Overall, supervision and feedback from my cooperating teacher was:
Very poor S10
Very poor F09
Unsatisfactory S10
Unsatisfactory F09
Satisfactory S10
Satisfactory F09
Useful S10
Useful F09
Highly useful
S10
Highly useful
F09
3.8% n=7
3.4% n=4
3.8% n=7
3.4% n=4
9.7% n=18
13.7% n=16
15.6% n=29
10.3% n=12
67.2% n=125
69.2% n=81
Student Teacher Feedback on University Supervisors
Each year the SSCP surveys our exiting student teachers, requesting feedback on their University Supervisors. Overall, the student teachers who returned the surveys were satisfied with the supervision they received from their University Supervisors. What is shown below is a summary of data collected.

Fall 2011 Biennial Report – Single Subject
34
Table 22
Student Teacher Feedback on University Supervisors (Fall 2009 & Spring 20010)
Question: Supervisor explained program expectations:
Never S10
Never F09
Within 4 wks S10
Within 4 wks F09
Within 3 wks S10
Within 3 wks F09
Within 2 wks S10
Within 2 wks F09
Within 1 wk S10
Within 1 wk F09
4.9% n=7
5.4% n=5
2.1% n=3
4.2% n=6
2.2% n=2
15.3% n=22
13% n=12
73.6% n=106
79.3% n=73
Question: Supervisor observed me teaching:
3 or fewer times S10
3 or fewer times F09
4 times S10
4 times F09
5 times S10 5 times
F09 6 times
S10
6 times F09
More than 6 times S10
More than 6 times F09
6.2% n=9
4.3% n=4
14.4% n=21
5.4% n=5
20.5% n=30
26.1% n=24
44.5% n=65
50% n=46
14.4% n=21
14.1% n=13
Question: Supervisor conferred with me:
Never S10
Never F09
1-2 times S10
1–2 times F09
Less than half the
time S10
Less than half the
time F09
After half or more
observations
S10
After half or more
observations
F09
After every observatio
n S10
After every observation
F09
2.1% n=3
3.3% n=3
0.7% n=14
4% n=4
10.3% n=14
5.6% n=5
87% n=127
86.7% n=78
Question: Supervisor’s oral and written feedback:
Did not
occur S10
Did not occur F09
Unsatisfactory
S10
Unsatisfactory
F09
Satisfactory S10
Satisfactory F09
Useful S10
Useful F09
Highly useful
S10
Highly useful
F09
0.7% n=1
3.4% n=5
5.4% n=5
12.3% n=18
7.6% n=7
32.2% n=47
29.3% n=27
51.4% n=75
57.6% n=53
Question: 3-way conference with my supervisor and cooperating teacher:
Never S10
Never F09
Once S10
Once F09
2-3 times S10
2–3 times F09
4 times S10
4 times F09
More than 4 times S10
More than 4 times F09
14.7%
n=21
5.5% n=5
15.4% n=22
22% n=20
44.1% n=63
39.6% n=36
9.1% n=13
11% n=10
16.8% n=24
22% n=20
Question: Overall supervision of my student teaching semester was:
Very poor Sp 10
Very poor F09
Unsatisfactory
S10
Unsatisfactory
F09
Satisfactory S10
Satisfactory Fall
09
Useful S10
Useful F09
Highly useful
S10
Highly useful
F09
1.4% n=2
1.1% n=1
3.4% n=5
5.4% n=5
13% n=19
10.9% n=10
36.3% n=53
29.3% n=27
45.9% n=67
53.3% n=49
Fall 2011 Biennial Report – Single Subject
35
2010-11 Program Effectiveness Data
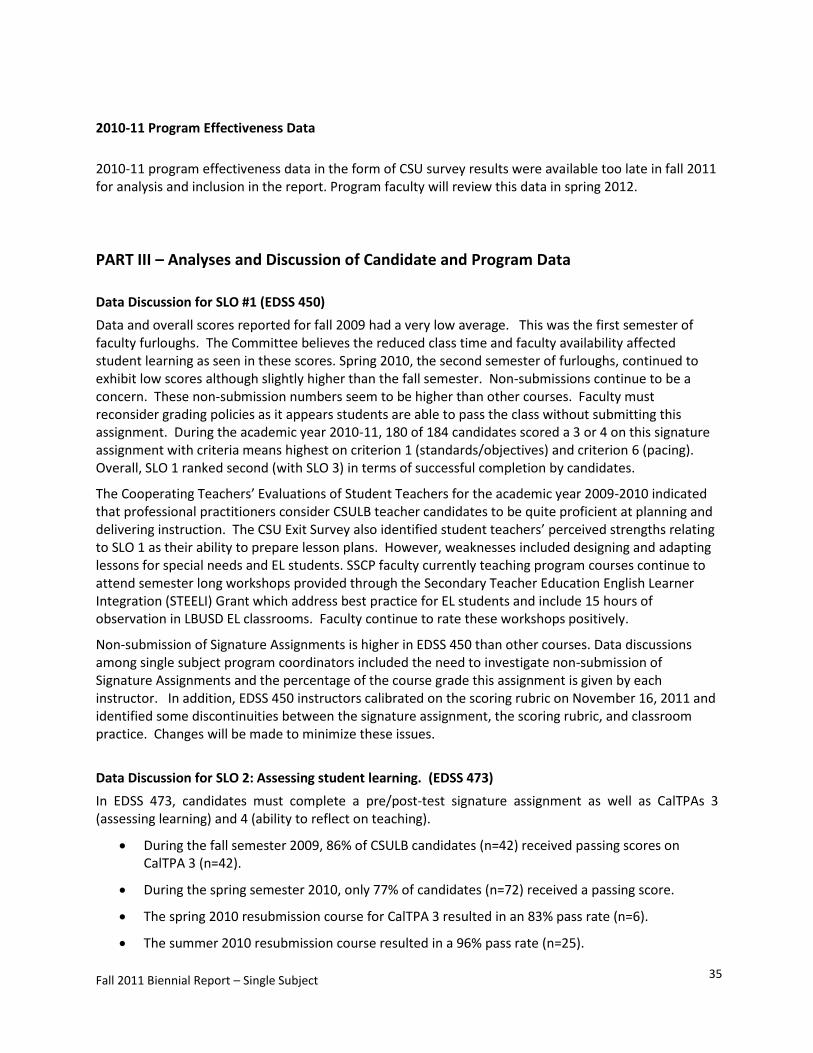
2010-11 program effectiveness data in the form of CSU survey results were available too late in fall 2011 for analysis and inclusion in the report. Program faculty will review this data in spring 2012.
PART III – Analyses and Discussion of Candidate and Program Data
Data Discussion for SLO #1 (EDSS 450)
Data and overall scores reported for fall 2009 had a very low average. This was the first semester of faculty furloughs. The Committee believes the reduced class time and faculty availability affected student learning as seen in these scores. Spring 2010, the second semester of furloughs, continued to exhibit low scores although slightly higher than the fall semester. Non-submissions continue to be a concern. These non-submission numbers seem to be higher than other courses. Faculty must reconsider grading policies as it appears students are able to pass the class without submitting this assignment. During the academic year 2010-11, 180 of 184 candidates scored a 3 or 4 on this signature assignment with criteria means highest on criterion 1 (standards/objectives) and criterion 6 (pacing). Overall, SLO 1 ranked second (with SLO 3) in terms of successful completion by candidates.
The Cooperating Teachers’ Evaluations of Student Teachers for the academic year 2009-2010 indicated that professional practitioners consider CSULB teacher candidates to be quite proficient at planning and delivering instruction. The CSU Exit Survey also identified student teachers’ perceived strengths relating to SLO 1 as their ability to prepare lesson plans. However, weaknesses included designing and adapting lessons for special needs and EL students. SSCP faculty currently teaching program courses continue to attend semester long workshops provided through the Secondary Teacher Education English Learner Integration (STEELI) Grant which address best practice for EL students and include 15 hours of observation in LBUSD EL classrooms. Faculty continue to rate these workshops positively.
Non-submission of Signature Assignments is higher in EDSS 450 than other courses. Data discussions among single subject program coordinators included the need to investigate non-submission of Signature Assignments and the percentage of the course grade this assignment is given by each instructor. In addition, EDSS 450 instructors calibrated on the scoring rubric on November 16, 2011 and identified some discontinuities between the signature assignment, the scoring rubric, and classroom practice. Changes will be made to minimize these issues.
Data Discussion for SLO 2: Assessing student learning. (EDSS 473)
In EDSS 473, candidates must complete a pre/post-test signature assignment as well as CalTPAs 3 (assessing learning) and 4 (ability to reflect on teaching).
During the fall semester 2009, 86% of CSULB candidates (n=42) received passing scores on CalTPA 3 (n=42).
During the spring semester 2010, only 77% of candidates (n=72) received a passing score.
The spring 2010 resubmission course for CalTPA 3 resulted in an 83% pass rate (n=6).
The summer 2010 resubmission course resulted in a 96% pass rate (n=25).
Fall 2011 Biennial Report – Single Subject
36
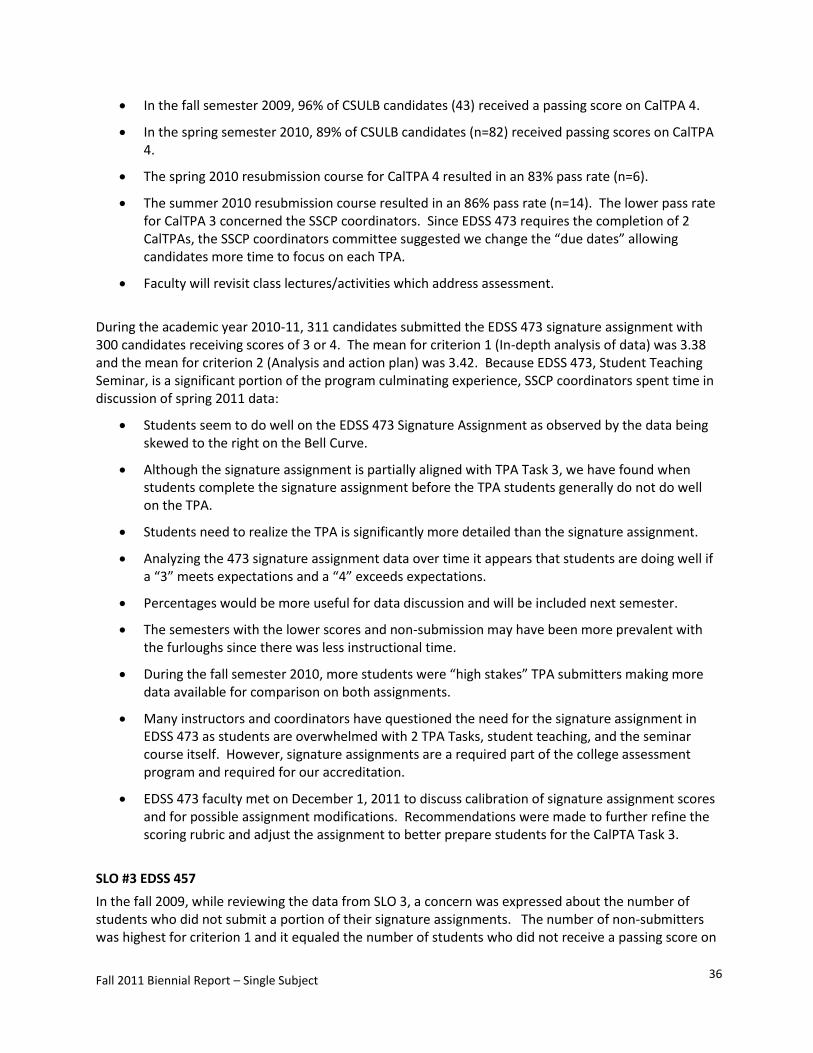
In the fall semester 2009, 96% of CSULB candidates (43) received a passing score on CalTPA 4.
In the spring semester 2010, 89% of CSULB candidates (n=82) received passing scores on CalTPA 4.
The spring 2010 resubmission course for CalTPA 4 resulted in an 83% pass rate (n=6).
The summer 2010 resubmission course resulted in an 86% pass rate (n=14). The lower pass rate for CalTPA 3 concerned the SSCP coordinators. Since EDSS 473 requires the completion of 2 CalTPAs, the SSCP coordinators committee suggested we change the “due dates” allowing candidates more time to focus on each TPA.
Faculty will revisit class lectures/activities which address assessment.
During the academic year 2010-11, 311 candidates submitted the EDSS 473 signature assignment with 300 candidates receiving scores of 3 or 4. The mean for criterion 1 (In-depth analysis of data) was 3.38 and the mean for criterion 2 (Analysis and action plan) was 3.42. Because EDSS 473, Student Teaching Seminar, is a significant portion of the program culminating experience, SSCP coordinators spent time in discussion of spring 2011 data:
Students seem to do well on the EDSS 473 Signature Assignment as observed by the data being skewed to the right on the Bell Curve.
Although the signature assignment is partially aligned with TPA Task 3, we have found when students complete the signature assignment before the TPA students generally do not do well on the TPA.
Students need to realize the TPA is significantly more detailed than the signature assignment.
Analyzing the 473 signature assignment data over time it appears that students are doing well if a “3” meets expectations and a “4” exceeds expectations.
Percentages would be more useful for data discussion and will be included next semester.
The semesters with the lower scores and non-submission may have been more prevalent with the furloughs since there was less instructional time.
During the fall semester 2010, more students were “high stakes” TPA submitters making more data available for comparison on both assignments.
Many instructors and coordinators have questioned the need for the signature assignment in EDSS 473 as students are overwhelmed with 2 TPA Tasks, student teaching, and the seminar course itself. However, signature assignments are a required part of the college assessment program and required for our accreditation.
EDSS 473 faculty met on December 1, 2011 to discuss calibration of signature assignment scores and for possible assignment modifications. Recommendations were made to further refine the scoring rubric and adjust the assignment to better prepare students for the CalPTA Task 3.
SLO #3 EDSS 457
In the fall 2009, while reviewing the data from SLO 3, a concern was expressed about the number of students who did not submit a portion of their signature assignments. The number of non-submitters was highest for criterion 1 and it equaled the number of students who did not receive a passing score on
Fall 2011 Biennial Report – Single Subject
37
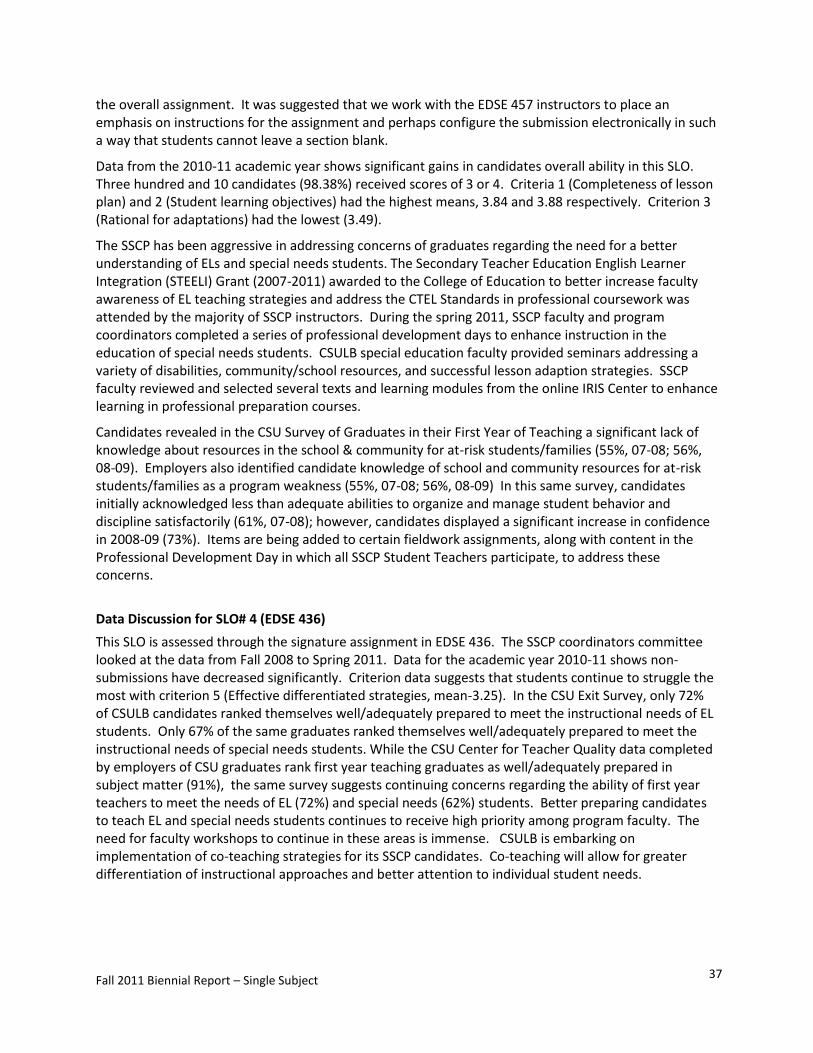
the overall assignment. It was suggested that we work with the EDSE 457 instructors to place an emphasis on instructions for the assignment and perhaps configure the submission electronically in such a way that students cannot leave a section blank.
Data from the 2010-11 academic year shows significant gains in candidates overall ability in this SLO. Three hundred and 10 candidates (98.38%) received scores of 3 or 4. Criteria 1 (Completeness of lesson plan) and 2 (Student learning objectives) had the highest means, 3.84 and 3.88 respectively. Criterion 3 (Rational for adaptations) had the lowest (3.49).
The SSCP has been aggressive in addressing concerns of graduates regarding the need for a better understanding of ELs and special needs students. The Secondary Teacher Education English Learner Integration (STEELI) Grant (2007-2011) awarded to the College of Education to better increase faculty awareness of EL teaching strategies and address the CTEL Standards in professional coursework was attended by the majority of SSCP instructors. During the spring 2011, SSCP faculty and program coordinators completed a series of professional development days to enhance instruction in the education of special needs students. CSULB special education faculty provided seminars addressing a variety of disabilities, community/school resources, and successful lesson adaption strategies. SSCP faculty reviewed and selected several texts and learning modules from the online IRIS Center to enhance learning in professional preparation courses.
Candidates revealed in the CSU Survey of Graduates in their First Year of Teaching a significant lack of knowledge about resources in the school & community for at-risk students/families (55%, 07-08; 56%, 08-09). Employers also identified candidate knowledge of school and community resources for at-risk students/families as a program weakness (55%, 07-08; 56%, 08-09) In this same survey, candidates initially acknowledged less than adequate abilities to organize and manage student behavior and discipline satisfactorily (61%, 07-08); however, candidates displayed a significant increase in confidence in 2008-09 (73%). Items are being added to certain fieldwork assignments, along with content in the Professional Development Day in which all SSCP Student Teachers participate, to address these concerns.
Data Discussion for SLO# 4 (EDSE 436)
This SLO is assessed through the signature assignment in EDSE 436. The SSCP coordinators committee looked at the data from Fall 2008 to Spring 2011. Data for the academic year 2010-11 shows non-submissions have decreased significantly. Criterion data suggests that students continue to struggle the most with criterion 5 (Effective differentiated strategies, mean-3.25). In the CSU Exit Survey, only 72% of CSULB candidates ranked themselves well/adequately prepared to meet the instructional needs of EL students. Only 67% of the same graduates ranked themselves well/adequately prepared to meet the instructional needs of special needs students. While the CSU Center for Teacher Quality data completed by employers of CSU graduates rank first year teaching graduates as well/adequately prepared in subject matter (91%), the same survey suggests continuing concerns regarding the ability of first year teachers to meet the needs of EL (72%) and special needs (62%) students. Better preparing candidates to teach EL and special needs students continues to receive high priority among program faculty. The need for faculty workshops to continue in these areas is immense. CSULB is embarking on implementation of co-teaching strategies for its SSCP candidates. Co-teaching will allow for greater differentiation of instructional approaches and better attention to individual student needs.
Fall 2011 Biennial Report – Single Subject
38
Data Discussion for SLO# 5 (EDSE 435)
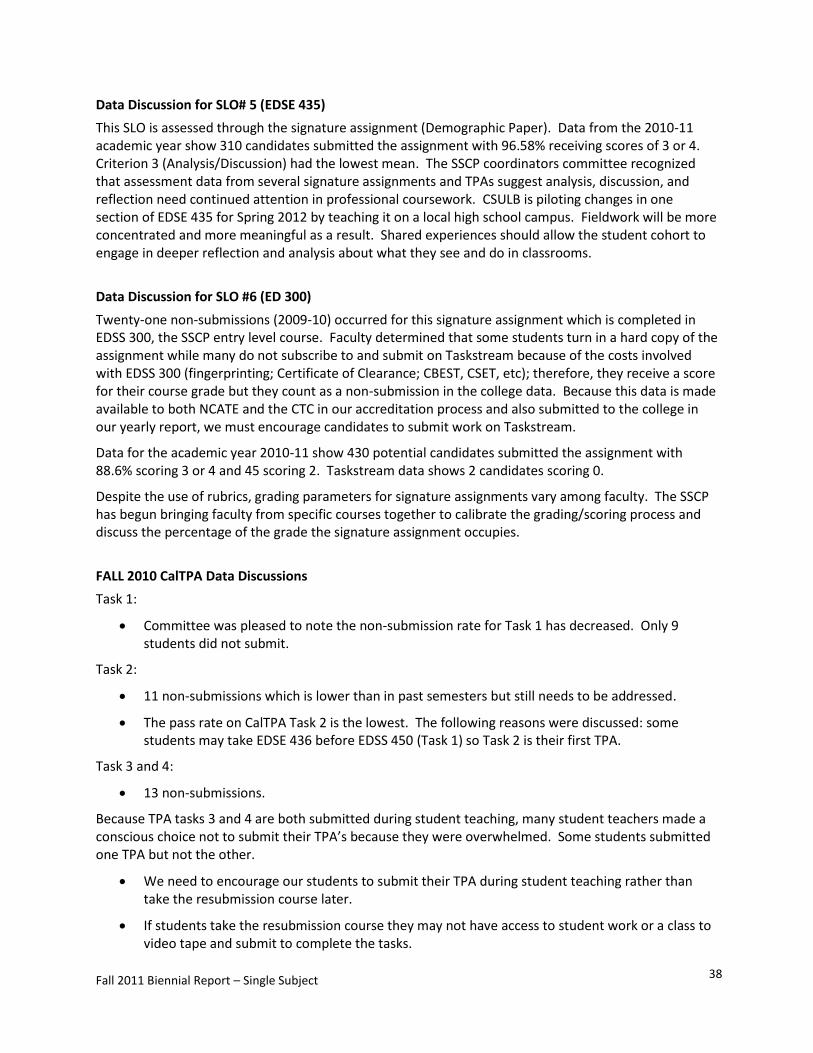
This SLO is assessed through the signature assignment (Demographic Paper). Data from the 2010-11 academic year show 310 candidates submitted the assignment with 96.58% receiving scores of 3 or 4. Criterion 3 (Analysis/Discussion) had the lowest mean. The SSCP coordinators committee recognized that assessment data from several signature assignments and TPAs suggest analysis, discussion, and reflection need continued attention in professional coursework. CSULB is piloting changes in one section of EDSE 435 for Spring 2012 by teaching it on a local high school campus. Fieldwork will be more concentrated and more meaningful as a result. Shared experiences should allow the student cohort to engage in deeper reflection and analysis about what they see and do in classrooms.
Data Discussion for SLO #6 (ED 300)
Twenty-one non-submissions (2009-10) occurred for this signature assignment which is completed in EDSS 300, the SSCP entry level course. Faculty determined that some students turn in a hard copy of the assignment while many do not subscribe to and submit on Taskstream because of the costs involved with EDSS 300 (fingerprinting; Certificate of Clearance; CBEST, CSET, etc); therefore, they receive a score for their course grade but they count as a non-submission in the college data. Because this data is made available to both NCATE and the CTC in our accreditation process and also submitted to the college in our yearly report, we must encourage candidates to submit work on Taskstream.
Data for the academic year 2010-11 show 430 potential candidates submitted the assignment with 88.6% scoring 3 or 4 and 45 scoring 2. Taskstream data shows 2 candidates scoring 0.
Despite the use of rubrics, grading parameters for signature assignments vary among faculty. The SSCP has begun bringing faculty from specific courses together to calibrate the grading/scoring process and discuss the percentage of the grade the signature assignment occupies.
FALL 2010 CalTPA Data Discussions
Task 1:
Committee was pleased to note the non-submission rate for Task 1 has decreased. Only 9 students did not submit.
Task 2:
11 non-submissions which is lower than in past semesters but still needs to be addressed.
The pass rate on CalTPA Task 2 is the lowest. The following reasons were discussed: some students may take EDSE 436 before EDSS 450 (Task 1) so Task 2 is their first TPA.
Task 3 and 4:
13 non-submissions.
Because TPA tasks 3 and 4 are both submitted during student teaching, many student teachers made a conscious choice not to submit their TPA’s because they were overwhelmed. Some students submitted one TPA but not the other.
We need to encourage our students to submit their TPA during student teaching rather than take the resubmission course later.
If students take the resubmission course they may not have access to student work or a class to video tape and submit to complete the tasks.
Fall 2011 Biennial Report – Single Subject
39
Resubmission Course:
Candidates completing the resubmission course in spring 2010 (2/17 non-passing scores) had better success
Candidates completing in summer 2010 had somewhat less success (5/19, non-passing scores).
We will continue to monitor these areas carefully during the fall semester 2010 and work with EDSS 473 faculty to calibrate scoring of the signature assignment and the grade percentage the assignment receives in the class..
FALL 2011 CalTPA Data Discussion
Data shows student scores are improving and more students seem to be submitting on time.
Students continue to do well on tasks 1 and 4 and not as well on tasks 2 and 3.
Task 2 continues to have a high number of non-submissions. Discussion has begun about moving task 2 from EDSE 436 to EDSE 457. The EDSE 457 course may be a better course to support the completion of task 2 since it has a larger English Language Learner component.
Faculty report it is difficult to evaluate a task that is outside your subject area since you are not familiar with the content and the teaching practices.
The pass rate on Task 4 shows that students are improving in their teaching reflections, a component with which students have struggled. All students across the program struggle with assessment and differentiation.
Students seem to struggle with Tasks 3 and 4 perhaps because they are due simultaneously while the student must meet the responsibilities and obligations of student teaching.
Task 3 (Assessing Learning) had the highest failure rate (23%, spring 2010) perhaps due to furloughs. It appears data analysis is problematic for candidates. SSCP coordinators questioned how/when candidates are prepared for this task. No specific course introduces data analysis. Discussing this procedure in EDSS 473 when candidates must analyze the effects of pre/post tests and complete CalTPA 3 is too late. Students are overwhelmed with the demands of student teaching, the signature assignment, and 2 CalTPAs in EDSS 473. It was suggested that we look carefully at all signature assignments to review how they are tied to course grade, calibrate scoring among instructors, and to ensure the assignments continue to be a meaningful.
Non-submissions: Student non-submitters for each of the 4 tasks were not necessarily the same students.
Resubmission course:
We continue to encourage candidates to complete the TPA workshops provided each semester by SSCP faculty.
Part IV – Use of Assessment Results to Improve Candidate and Program Performance
The SSCP Coordinators Committee relies on a significant amount of valuable data to inform candidate performance both throughout the program and after the granting of credentials. Overall, faculty are
Fall 2011 Biennial Report – Single Subject
40
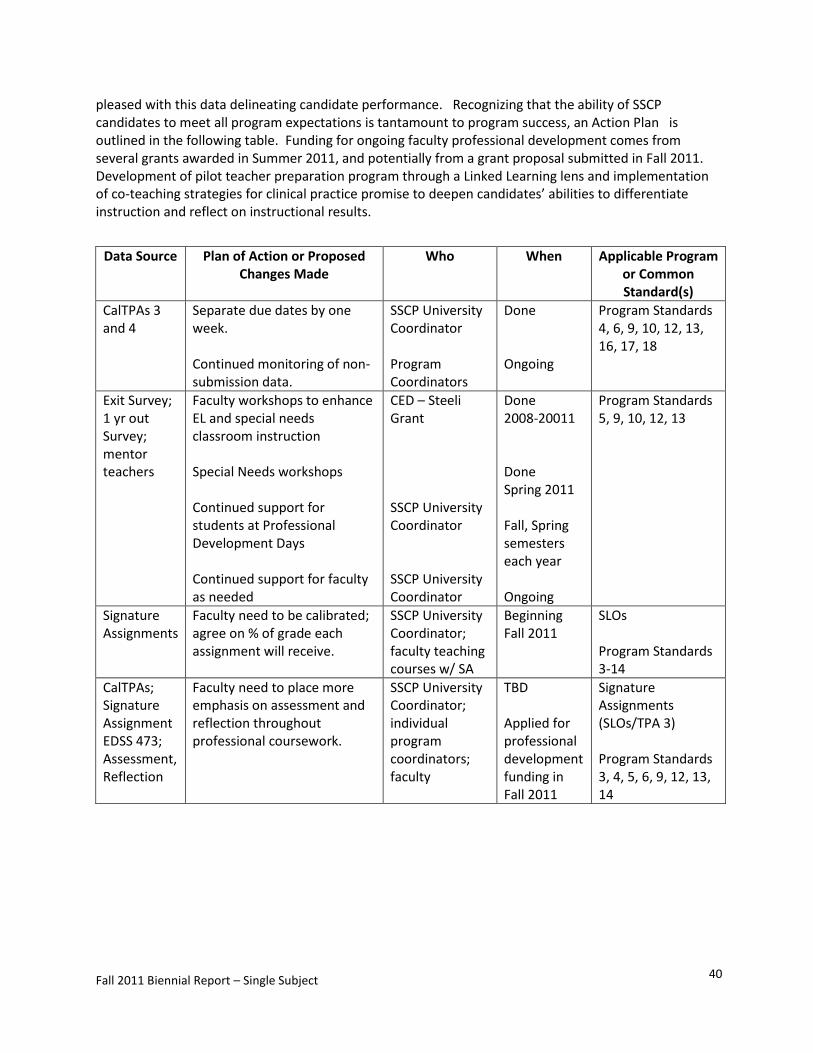
pleased with this data delineating candidate performance. Recognizing that the ability of SSCP candidates to meet all program expectations is tantamount to program success, an Action Plan is outlined in the following table. Funding for ongoing faculty professional development comes from several grants awarded in Summer 2011, and potentially from a grant proposal submitted in Fall 2011. Development of pilot teacher preparation program through a Linked Learning lens and implementation of co-teaching strategies for clinical practice promise to deepen candidates’ abilities to differentiate instruction and reflect on instructional results.
Data Source Plan of Action or Proposed Changes Made
Who When Applicable Program or Common Standard(s)
CalTPAs 3 and 4
Separate due dates by one week. Continued monitoring of non-submission data.
SSCP University Coordinator Program Coordinators
Done Ongoing
Program Standards 4, 6, 9, 10, 12, 13, 16, 17, 18
Exit Survey; 1 yr out Survey; mentor teachers
Faculty workshops to enhance EL and special needs classroom instruction Special Needs workshops Continued support for students at Professional Development Days Continued support for faculty as needed
CED – Steeli Grant SSCP University Coordinator SSCP University Coordinator
Done 2008-20011 Done Spring 2011 Fall, Spring semesters each year Ongoing
Program Standards 5, 9, 10, 12, 13
Signature Assignments
Faculty need to be calibrated; agree on % of grade each assignment will receive.
SSCP University Coordinator; faculty teaching courses w/ SA
Beginning Fall 2011
SLOs Program Standards 3-14
CalTPAs; Signature Assignment EDSS 473; Assessment, Reflection
Faculty need to place more emphasis on assessment and reflection throughout professional coursework.
SSCP University Coordinator; individual program coordinators; faculty
TBD Applied for professional development funding in Fall 2011
Signature Assignments (SLOs/TPA 3) Program Standards 3, 4, 5, 6, 9, 12, 13, 14