commission of the european commun-ities ...aei.pitt.edu/6245/1/6245.pdfpreferences ·granted by our...
TRANSCRIPT
COMMISSION OF THE EUROPEAN COMMUN-ITIES
Brussels, 0 1.10.1997 COM(97)4 77 final
REPORT FROM THE COMMISSION TO THE COUNCIL
Mediterranean concessions impact study

Mediterranean concessions impact study
1. INTRODUCTION
1.1. In the context of discussions on trade agreements with third countries of the Mediteminean region, the Commission gave an undertaking at the Agriculture Council of 17 February to produce a study of the market impact in the Community of current and possible future concessions to third countries on sensitive products. Recent develop01ents in negotiations with these countries · allow now for greater clarity in assessing the situation.
1.2. This is clearly a complex task, which involves taking into account not only trade relations with the countries concerned now and in the foreseeable future, but also production, processing and consumption trends in the Community, and the possible future shap~_:ofthe CAP.
1.3. This study will focus on those import products generally seen as sensitive on a Community level in relations with 11 third countries of the Mediterranean region (Tunisia, Morocco, Israel, Jordan, Algeria, Egypt, Syria, Lebanon, Malta, Cyprus, Turkey) and Palestine. The statistical data provided does not include Palestine, as reliable figures are not available(trade quantities are also very low in relation to the other 11 main countries covered).
1.4. The 14 product groups are as follows: tomatoes (including tomato concentrate), oriions, oli''::e oil, hazelnuts, oranges, "easy , peelers" (mandarines, etc.), lemons, grapes, melons, strawberries, flowers, potatoes, rice and wine. -
2. GENERAL COMMENTS
2.1. It has not been possible in the context of this study to take into account all factors obtaining in what is an extremely complex situation. In particular, for example, for a number of the products upon which this study has focused are characterised by their perishability and the seasonal nature of their production. The question of whether their seasonality complements or conflicts wit}J. Community production is of significance in assessing the impact of imports on the Community market.
i
2.2. This study is concerned with the effects of the Mediterraneall agreements._ It should be remembered, however, that these are only part of a more general process towards a more open trading environment, as a result, in particular, of the conclusion of the Uruguay Round. The need to help and encourage Community producers of fruit and vegetables to respond to this challenge by becoming more · competitive was stressed in the communication from the Commission to the Council and the European Parliament on the development and future of Community policy in the fruit an~ vegetables sector (COM(94) 360) which served as the basis for the Commission proposals on the reform of the fruit and vegetables regime on which the Council reached a decision in July 1996. The need for adaptation to the results,of the Uruguay Round also -underlay the decisionon the reform of the rice regime which was taken· by the Council in December 1995 and is one of the considerations in the recent Options Paper on the future of the olh.:e oil regime. The Commission will, of course, be monitoring the success of these reforms in the light of the changing trading environment.
3. CURRENTIMPORTREGIME
3'.1. .It is important to remember that the agreements that have been negotiated .. by the Community generally consolidate trading arrangements that have · ·aJ>plied -historically. Import quota amounts are therefore likely to a great . extent to reflect traditional trade flows and thus in turn the needs of : Community consumption.
3.2: Under the agreements signed in the- seventies betWeen the Community and ~~~· Medit~p-~e~ p~ers import p~eJ~rences. '~e~e·. granted fqr v.a[ious
· · "'agrfculturar' produ~ts; thes.e 'piefere_nces varY- :.from very ,S:i~ilificant - , · , concessions to Turkey to more limited concessions to Syria. The
.. prefer~nces have applied since the late seventies.
· ._. J:3:. UI).der the current euro-mediterranean partnership policy (agreed with our partners in Barcelona in November 1995), the EU is negotiating new ag~eements ~ith most of the Mediterranean countries. These new agreements · will also solve the problems related to Uruguay Round iniplefuen~tion and to the enlargement of the Community. The new agreements contain an important innovation: they will provide for preferences ·granted by our partners for EC exports of agricultural products.
3.4. To date, negotiations for new agreements have been concluded with Cyprus, Israel, Jordan, Morocco, the PLO, Tunisia and Turkey, only some of which have been signed by the Council. Only the agreement with the PLO has formally entered into forc_e; however some of the trade provisions apply already as far as Morocco, Israel and Tunisia are concerned. Table 2 shows the preferences granted by the Community to our partners on the agricultural products selected for this study. This table incorpo~ates the recent agreements reached with Cyprus, Turkey and Jordan.
2
3.5. The concessions referred to in the t~ble only affect the ad v!iloreJl! dtJty. With regard to the specific duties linked to entry prices, it should be noted that for oranges a reduction of the entry prices has been granted to Morocco, Israel, Cyprus and Egypt, within the limits of tariff quotas. With Morocco a partial reduction of entry prices for cucumbers, artichokes, clementines and tomatoes has been agreed, also within tariff quotas.
3 .6. New agreements are under negotiation with Egypt, Lebanon and Algeria and exploratory talks are being held with Syria. Table 1 contains the state of play of the negotiatio~s with the Mediterranean partners up to 1 May
• 1997.
3.7. The following rough classification can be made to show the relative importance of the individual Mediterranean countries as exporters to the EC of the product groups covered by this study:
• Turkey, Morocco and Israel are the only_ really important exporters of agri~ultural produce to the Community. Their exports cover a wide range of products; in particular, they are very important exporters of some of the following products: flowers, citrus fruit, tomatoe-s, grapes, melons, hazelnuts, strawberries and wine;
• Cyprus ~nly exports potatoes, citrus and grapes in significant volumes;
• Tunisia is by far the ma~n exporter of olive oil and exports also oranges;
• Egypt is. the main exporter of potatoes and onions,
., ~ ·- ~ 1 "i :::- "\'~ ~
• countries with no particular t.rade signif!.cancy in_ this·· context: Malta, Palestine, Jordan, Syria, Lebano_n .. , '- .:
.".
4: CURRENT MARKET SITUATION
4.1. The market situation in key sectors is highlighted below with a view to assessing the possible impact on Community markets of trade and trade agreements with the Mediterranean countries.
4.2. . Main fruits and vegetables
4.2.1. In the fruit and vegetables sector it is possible to make a three-way classification on the basis of the relation between Community production and consumption levels: surplus products (tomato paste and, to a lesser extent, lemons); deficit products (hazelnuts and, to some extent, "easy pee_lers"); other products for which production satisfies internal demand.
4.2.2. Total import quantities expressed as a proportion of Community production is fairly limited for three products (tomatoes, strawberries · and melons - around 5% of production), while· for othe~s it is around
- ro% (tomato paste, onions, lemons and grapes), 15% (oranges) and 40% ("easy peelers").
3
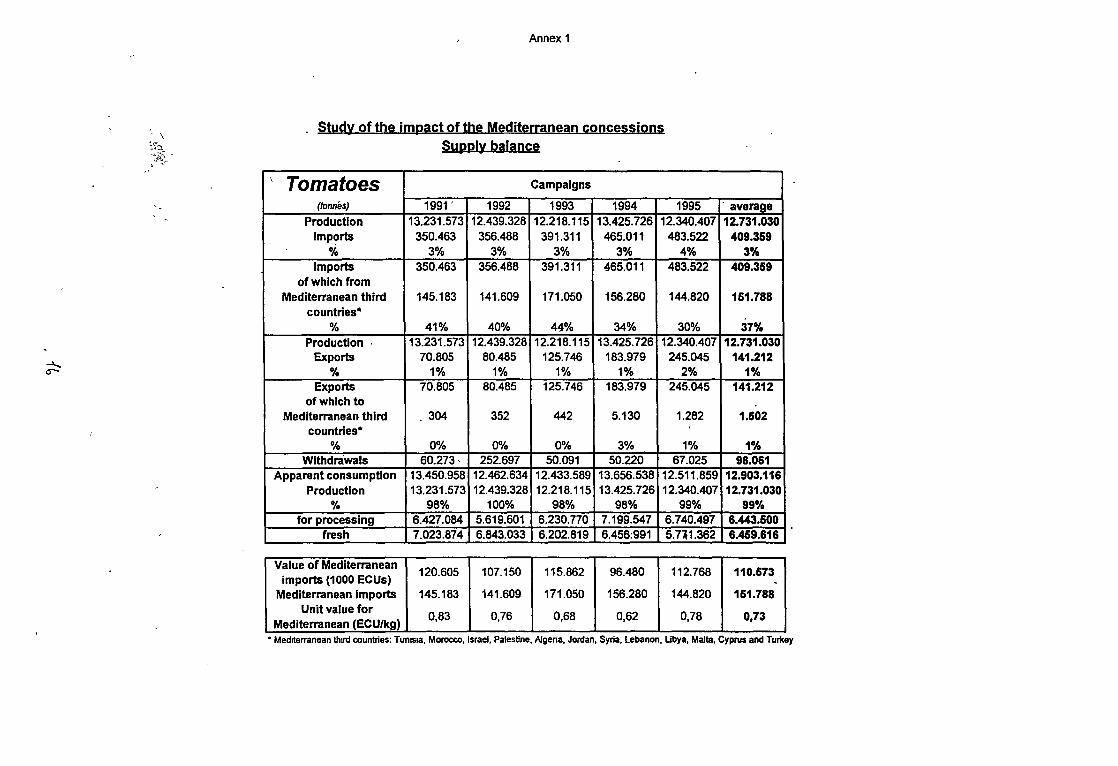
4.2.3. With regard to tomatoes, it is noticeable that the imports from the Mediterranean countries are decreasing, whilst imports from other origins are increasing. In addition, it should be noted that there exists with the main Mediterranean exporter of tomatoes a self- · restraint arrangement (with a strong double-check notification system), whereby Morocco's exports to the EC will not exceed 150,000 tonnes. The Community market is protected against cheap imports by entry prices. Overall, Community production, consumption and exports are stable. (The main Mediterranean exporters to the EC of tomatoes are Morocco and Turkey).
4.2.4. EC imports of tomato concentrate from the Mediterranean countries (especially from Turkey) have shown a strong increase in the past few years, leading to reductions in prices. On the other hand, it should be remembered that our exports to these countries are quite significant (of the order of 27% of total exports) and are in generaf greater than these imports. Community production -exceeds consumption (production 116% of consumption in 1991, 133% in 1993) ..
4.2.5. For onions, import quantities from the Mediterranean countries are not significant, but are tending to increase (9% of total imports in 1995). Production. of onions in the Community tends to be variable; imports and prices are affected largely by internal supply. (The main Mediterranean exporter to the EC of onions is Egypt).
4.2.6. Hazelnuts are a deficit product (EC production represents about 35% of consumption). 96% of imports, which cover internal demand, come from the Mediterranean countries (Turkey). Although caution would need to be exercised in granting freer market access, concessions in themselves are not likely to destabilise the market as normal import duties are relatively low. (The main Mediterranean exporter to the EC of hazelnuts is Turkey).
4.2.7. Mediterranean countries' exports of oranges are showing a downward trend. This trend is reflected also in EC production, consumption and general imports into the Community. "Easy peelers". are a deficit product, but internal production is accounting for an increasing share in consumption. Markets are stable in general. Community production of lemons is decreasing, along with imports from the Mediterranean countries, whilst imports from other sources are on the increase. (The main Mediterranean exporters to the EC of oranges are Morocco, Israel, Cyprus and Tun!sia; "easy peelers" - Morocco, Turkey and Israel; lemons - Turkey and Cyprus).
4.2.8. Grape imports, particularly those from the Mediterranean countries, are increasing. (The main Mediterranean exporters to the EC of grapes are Turkey, Israel and Cypms).
4
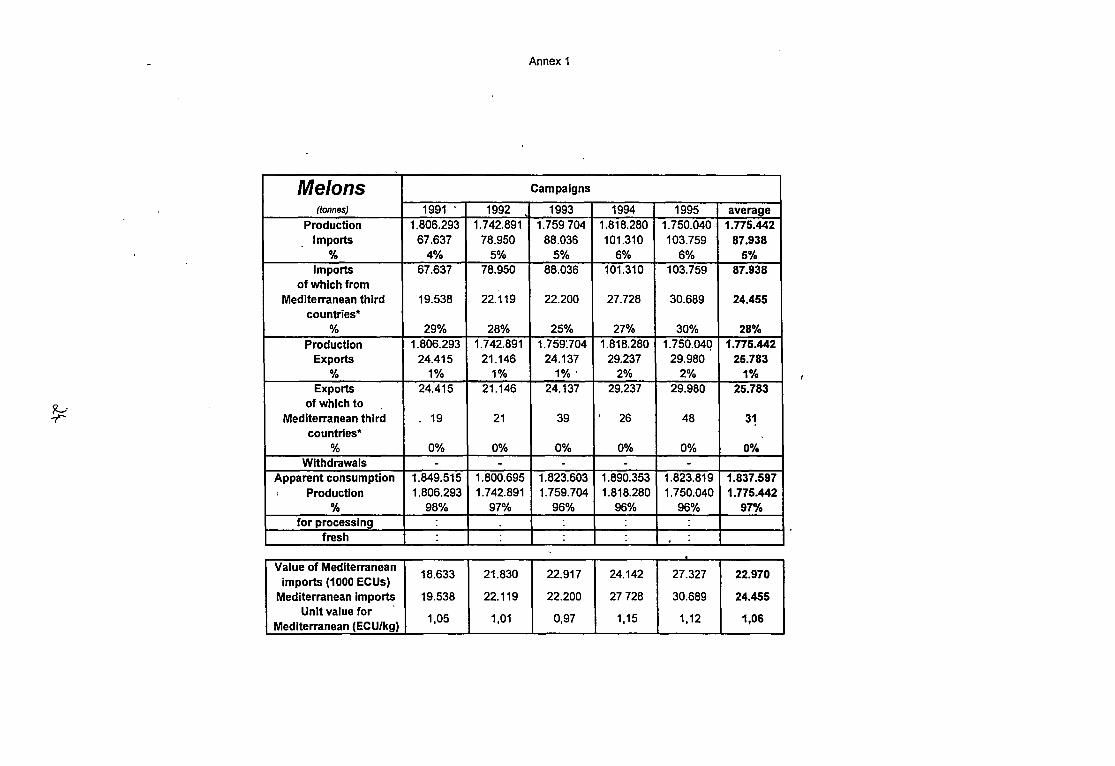
· 4.2.9. Imports of Mediterranean melons are, likewise, increasjng. Overall the market is very stable. (The main Mediterranean exporters to the EC of melons are Israel, Turkey and Morocco). ·
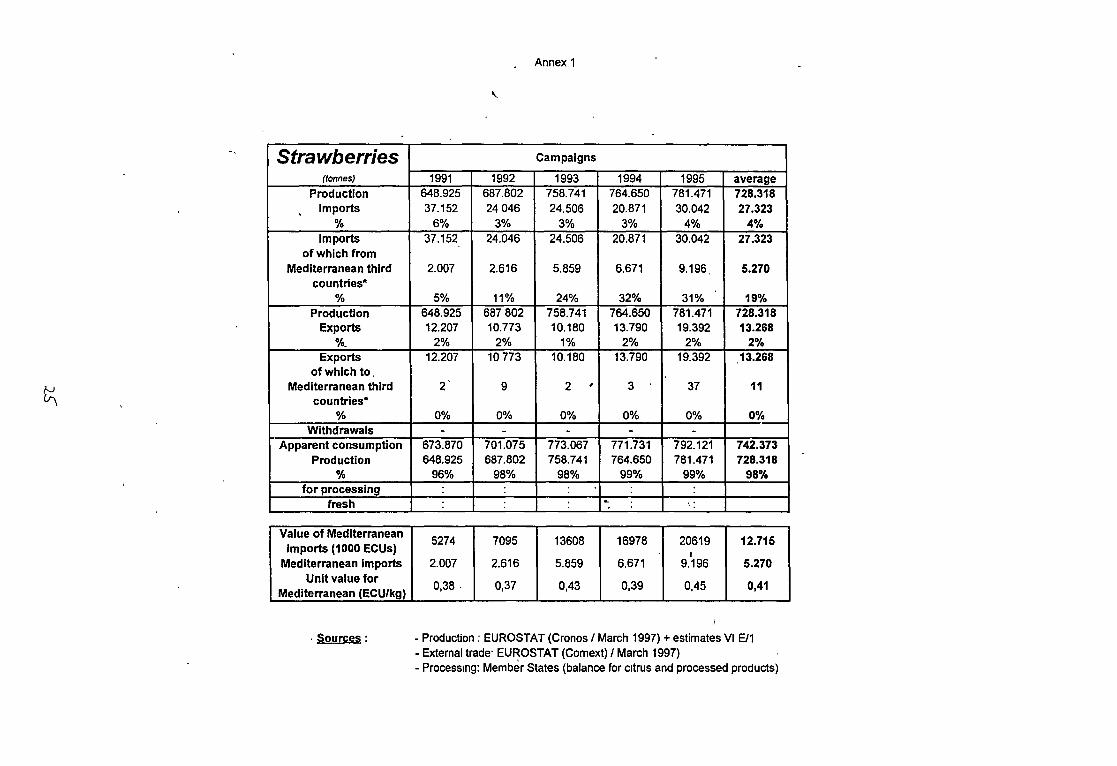
4.2.10. For strawberries, imports from the Mediterranean countries are rising, as also however are EC production and our exports to these . countries. (The' main Mediterranean exporters lo the EC of . /
strawberries are Turkey and Morocco).
4.2.1 t. For the last three products, it is worth mentioning that most imports from the Mediterranean region arrive early in the season, thus complementing, rather than conflicting with, EC production.
4.3. Flowers
4.3.1. For the flowers sector, the issues covered by this paper were discussed in detail in the Commission's recent communication to the
4.3.2.
· Council - European Strategy for Trade in Live Plants and Fioricultural Products (17.02.97; COM (97) 36 final).
The strategy paper contains a detailed discussion of the evolution and impact of trading arrangements with the Mediterranean and other third countries, pointing out the general significance of tr~de in this sector and .the fact that the Community has an overall trade surplus in value terms (though a deficit in terms of quantity). Also underlined is ·the importance of seasonality, four fifths of imports arriving between November and May, when Community production is insufficient to meet demand. (The main Mediterranean exporter to the EC of flowers is Israel). ·
4.3.3. The paper also sets out a coherent and balanced approach to future negotiations, particularly with the more developed countries, where Community export potential should be fully taken into account.
4.4. Rice
4.4.1. The ·rice market is composed of two products: indica rice (long grain) and japonica rice (round and medium grain). As far as indica rice is concerned, the Coiplilunity shows a deficit of around 0.3.
, million tonnes in the marketing year 1996/97. Given that imports of indica rice are projected at around 0.6 million tonnes, a part of the Community indie3: rice production is currently being offered to intervention (about 0.1 million tonnes at 2 May 1997), while another part is to be exported through refunds. This situation is likely to persist in 1997/98.
4.4.2. As regards japonica rice, the Community has a surplus of about 0.25 million tonnes, all of which is to be exported with refunds .. Given the GATT Uruguay Round restrictions on export volumes (0.15 million tonnes), a part of the japonica rice production will also ~e offered to intervention. Egypt produces mainly japonica rice.
5

4.5. Olive oil
4.5.1. Production of olive oil, both inside and outside the Community, is naturally cyclical. For this reason, in some years the Community has suffered from a lack of supply in olive oil, which explains the significant price variations in this sector. This situation could change if there is a significant increase in Community production. For some quality levels the EC is always a net exporter. (The main Mediterranean exporter to the EC of olive oil is Tunisia).
4.6. Potatoes
4.6.1. Early potatoes are ·a cyclical product. Ther~ is a demand for imports in the winter months, despite the fact that some EC produce is available at this time. (The main Mediterranean exporters to the EC of early potatoes are Egypt, Cyprus and Morocco). " -
4.6.2. Prices for potatoes for direct consumption in general are relatively low as a result of decreasing demand (though demand for processed potato products is increasing).
4.6.3. Although potato production in the Community may vary significantly from one year to the next, the market is in general in a state of equilibrium.
4.7. ~
4. 7 .1. Meqiterranean exports of wine do not play a significant role on the EC market. (The only Mediterranean exporter to the EC of wine worth mentioning is Morocco).
4.8. Figures relating to the EC's imports of "sensitive" products from the Mediterranean countries are set out in Tables 3 and 4.
5. EC EXPORTS
5.1. In the context of bilateral trade relations, 'the benefits accruing to the Community's exporters must also be borne in mind, p~icularly in view of the primary importance of the countries concerned as importers of Community agricultural produce (particularly, but b~ no means exclusively, of cattle, beef, dairy products, grains, sugar as well as processed agricultural products).
5.2. Statistical data show that the EC is a net exporter in agricultural goods to the Mediterranean countries (with an agricultural trade surplus of 413 million ECU in 1995). A country-by-country appr0ach shows that the Community is a net importer of agricultural goods only from Turkey and Morocco. It has a stable trade balance with Israel and Tunisia, and a surplus with all other countries in the region. The main importers of EC agricultural produce are Algeria and Egypt.
6

5.3. In assessing the benefits to the Community of preferential _tra_de agreements, it shou~d be noted that the Community has so far concluded agreements "Yith the main exporting countries. The EC is a net agricultural exporter vis-a-vis the other countries wjth which negotiatio11s are currently under way. In addition, as mentioned above, new agreements will place increased emphasis on concessions to be granted by ,the Mediterranean countries on EC exports. In gen~ral terms, therefore, the EC stands to benefit in pure trade terms from the conclusion of these further free trade agreements.
5.4. Details of the value of the Community's main agricultural exports in 1995, are set out in Table 5.
6. CONCLUSIONS
6.1. In the seventies the Community concluded agreements with itsMediterranean partners. Within the trade provisions of these agreements~ the trade arrangements that had applied historically were conSolidated. Preferential import quota amounts are therefore likely to a great extent to reflect traditional trade flows and thus in turn the needs of Community consumption.
6.2. At that time, the EC-6 was a net importer of most of the Mediterranean products (citrus, olive oil, hazelnuts, melons, grapes, etc.) and it was only logical to permit the access of agricultural products originating in that region (which at that time included Spain, Greece and Portugal) to the EC market.
6.3. In the eighties the Community integrated Greece, Portugal and Spain. The EC production capacity of Mediterranean products increased and surpluses appeared. For our Mediterranean partners the situation thus became more difficult; their access to the EC market had to face increased competition from the new member states, which absorbed parts of the markets which were occupied previously by other third countries. Additional protocols were negotiated with these third countries to mitigate the negative impact of the enlargement of the Community.
6.4. An analysis of the available trade data does not lead to the identification of any clear link between increases in imports or in concessions and the production, consumption and export situation in,the Community. There seems, for example, to be no direct substitution of internal production by
I
imports.
6.5. Neither is there an obvious connection between the granting of concessions by the Community and the level _of imports of the products concerned. This is in part due to the fact that the Community's border protection for most imports from the Mediterranean countries is relatively low, thus reducing the significance of preferential margins on tariffs vis-avis basic factors such as market supply and demand. For many products, imports under concession account for a much smaller proportion ()f the product total than those under non-preferential arrangements.
7

6.6. For a number of the key product groups highlighted in thirs stu~y, theJe l;!,re significant factors limiting the impact of import concessions granted by the Community. As mentioned above, for tomatoes a strong self-restraint arrangement is in force with by far the most important exporter, Morocco. For potatoes, onions, strawberries, grapes and melons, concessions are subject to tight calendars and the tariff quota for olive oil is opened each year in such a way as to facilitate the absorption of this quantity into the Union's market; preferential imports do not take place within the periods most sensitive for the internal markets. For hazelnuts, given 'the low erga omnes duty, the concessions have no effect at all on imports. For oranges, the concessions to the important producers (Morocco and Israel) are subject to tariff quotas. For potatoes, imports take place when short internal production leads prices high. The importance of the concessions is therefore only relative. Imports of wine are marginal and have no impact on the internal market.
6. 7. On a general level, the relatively small proportion of Community consumption accounted for by imports from the Mediterranean countries (whether or not preferential) should also be borne in ll!ind. Overall figures do not, of course, give a total view of the problem. Relatively small volumes of imports arriving at a critical time can have a disproportionate effect, in particular on sensitive regions heavily dependent on a particular product.
6.8. It is possible, however, to observe that at least in the cases of the markets for the particular fruit and veget~l:>le products examined here, there is a relative stability with regard to Community production, imports and prices. Markets would thus appear to have adapted to the concessions that have been granted and ha\'e reached a degree of equilibrium.
6.9. This is not of course to say that the absorption capacny of the Community markets is unlimited, or that the granting of concessions has no impact, but simply to state that in current circumstances there are no causes for undue concern. Community producers and preferential trading partners have a mutual interest in the stability of the Comihunity market and this could be upset if the process of multilateral or pre:(erential moves to more open trading were to proceed too rapidly.
6.10. In a broader context, it is of course important not simply to base one's conclusions on a sector-by-sector analysis, but also to consider the more general benefits of trading arrangements to the Community's consumers and exporters. On the export side, Community producers and exporters stand to benefit from the conclusion of new agreements with the Mediterranean countries.
8

MEDITERRANEAN POLICY: THE BILATERAL AGREEMENTS state of play on 28 April 1997 'TAIH_a I
Country Current agreement Agriculture coverage in Negotiations under way Agricultural current agreement for: coverage
EU Imports EU exports
I>Jgeria Cooperation Agreement Limited preference No concessions Euro-Mediterranean Association reciprocal 1976 Association; Council mandate adopted concessions
1n June 1996; negotiations started in 1997.
Cyprus Association Agreemel't Wide preference L1m1ted preference impact of Uruguay Round; reciprocal J 1973 agreement initialled in February 1997 concessions
Egypt Cooperation Agreement Limited preference No concessions Euro-Mediterranean Association reciprocal 1977 agreement; negotiations started in 1995 concessions
I
Israel Free trade Agreement Wide preference L1m1ted preference Euro-Mediterranean AssoCJalJon Agree- reciprocal 1976 men! signed 20 Nov 1995; since 1.1.96 concessions . the agricultural concessions are operative
Jordan Cooperation Ag~eement Limited preference No concessions Euro-Mediterranean Association reciprocal 1977 agreement initialled on 16.4.97. concessions
~ Lebanon Cooperallon Agreement Lin:tited preference No concessions Euro-Mediterranean Association reciprocal 1977 agreement; negotiaticns started in 1996 concessions
Malta Assoc1at1on Agreement W1de preference Limited preference 1970
Morocco Cooperation Agreement Wide prefP.re.-:ce No concessions Euro-Mediterranean Association reciprocal 1976 agreement signed 26 February 1996; only concessions
operative for some agricultural products
Palestinian Autonomous EC conce- Wide preference No concessions Euro-Mediterranean Association reciprocal Authority ssions. agreement signed 24 February 1997 concessions
Syna Cooperation Agreement Limited preference No concessions Euro-Mediterranean Association reciprocal 1977 agreement. No Council mandate yet, concessions
exploratol}' talks under way.
Tums1a Cooperation Agreement Wide preference No concessions Euro-Mediterranean Association reciprocal 1976 agreement signed 17 July 1995; only concessions
operative for Tunisian olive oil I
Turkey AsSOCiation Agreement W1de preference Limited preference Additional reCiprocal concessions + imp- reciprocal for a Customs Umon, 1963 act of Uruguay Round + enlargement; concessions
-- -agreement initialled on 25 April1997.
relalio2 26109/97

Ttl&...BZ \.
EU concessions to mediterranean partners on sensitive products
Product Malta· Cyprus Turkey Morocco
penod (all penod (all penod (all period (all year except 1f duty volume year except 1f duty volume year except 1f duty volume year except 1f duty volume
stated) stated) stated) stated)
flowers exempt1on unlimited exemption 75 exemption unlim1ted exemption 5,000
new potatoes 1/1-3115 3,000 1/1-1~5 exemption unlim1ted 111-31/3 exempt1on unl1m1ted 1/12-30/4 exemption 120,000
16/5-30/6 exempt1on 110,000
tomatoes 1112-30/4 60% duty
unlimited 15/11-15/4 exemption unlim1ted exemption unlimited 1/11-31/3 exemption 150,676 reduction
tomato cone. exemption 30,000
on1ons 1/7-31/7 exemption unlimited 15/2-15/5 exemption unlimited 15/2-15/5 exemption unlim1ted 15/2-15/5 exemption 7,000
16/5-14/2 exemption 2,000
0 5% to 10%
•.HO \U IU70
olive 011 duty reduct
unlimited duty unlimited
.:.:,.
hazelnuts duty: 3% unlim1ted -
oranges exemption unlimited exemptiOn unlimited exemption unlimited exemption 340,000
easy peelers exemption unlimited exemption unlimited exemption 150,000
lemons exemption .unlimited exemption unlimited exemption unlimited
grapes 8/6-9/8 exempt1on unlimited 15/11-30/4 exemption unhm1ted 1/11-31/7 exemption unlimited
18/6-31/7 exempt1on unlimited '
melons 1/11-31/5 exemption unlim1ted 1/11-31/5 exempt1on unlim1ted 1/11-31/5 exemption unlimited
strawberries 1111-31/3 60% duty.
unlimited 1/11-31/3 exempt1on unlim1ted all year exemption unlimited 1/11-3113 exemption unlimited reduct1on
rice
wine exemption 306,620 hi exemption unlimited exemption 151,200 hi

Product Algeria Tunisia Egypt Lebanon
penod (all penod (all period (all penod (all year except 1f year except 1f year except 1f year except 1f
stated) duty volume stated) duty volume stated) duty volume stated) duty volume
flowers exemptlor. 750
new potatoes 1/1-31/3 exemptiOn unlimited 1/1-31/3 exemption 15,000 111-31/3 exemption 109,7~0
I
tomatoes 15111-30/4 exempt1on unlimited 15/11-30/4 exemption unlimited 1/12-31/3 exemption unlimited
tomato cone. 30% duty
unlimited reduction
onions 15/2-15/5 exemption unlimited 15/2-15/5 exemption unlimited 1/2-15/5 exemption 12,120 1/2-30/4 50% duty
unlimited reduct1on
olive oil 5% duty
unlimited duty. 7,81
A6,000 5% duty unlimited
reduction ECU/100 kg reduction
hazelnuts
oranges exemption unlimited exempt1on 31,360 exemption 7,840 60% duty
unlimited reduct1on
easy peelers exempt1on unlimited exempt1on unlimited exempt1on ynlim1ted 60% duty
unlimited reduct1on
lemons 80% duty
unlimited· exe~ptlon unlimited exempt1on unlimited 40% duty
unlimited reduct1on reduction
grapes 15/11-30/4 exemption unlimited 15/11-30/4 exemption unlimltt.d 1/2-30/6 exemption unlimited 1/12-30/4 60% duty
unlim1ted reduct1on
' for small
melons 1/11-31/5 exempt1on unlimited 1/1-31/5 exemption unlimited 1/1-31/3 melons. 120 exemption
strawberries 60% duty
unlim1ted 1/11-31/3 exemption unlim1ted .eduction
rice 25% duty
32,000 reduction
wme exemption 4~8,000 hi e~emptlon 235,000 hi ' --- --L__ ______ L_______ - L_ ___ --- --

Product Syfia Israel Jordan Palestine
penod (all period(all penod (all period (all year except if year except if year except if year except If
stated) duty volume stated) duty volume stated) duty .rolume stated) duty volume
' flowers exemption 24,500 exemption 100 exemption 1,500
new potatoes 1/1-31/3 exemption 20,000 1/1-31/3 exemption 1,000
tomatoes exemption 1,000 1112-31/3 exempt1on unlimited 1/12-3113 exemption 1,000
tomato cone. exemption 3,000
omons 1/2-30/4 exemption 700 15/2-15/5 exemption 13,400 112-30/4 exempt1on unlimited 15/2-15/5 exempbon unlimited
rv olive 011
hazelnuts
oranges exemption 200,000 exemption unhm1ted exemption 25,000
easy peelers exemption 35,000 exempli on 1,000 exemption 500
lemons exempt1on 7,700 exemption 1,000 exemption 800
grapes 15/5-11n exemption unlimited 1/2-11/7 exemption unlimited
melons 1/11-3115 exemption 11,400 1/11-31/5 exemption unlimited 1/11-31/5 exempt1on 10,000
strawberries 1111-31/3 exempt1on 2,600 1/1-31/3 exemption 100 1111-3113 exemption 1,200
rice
wme exemplton 1,610 hi -

Table3
EU IMPORTS OF SENSITIVE PRODUCTS IN VALUE (1000 ~CU): 1990-1995
I Description 1990 1991 1992 1993 1994 1995
! 000 ECU %age of OOOECU , 'Yoage of 000 ECU %age of 000 ECU %age of 000 ECU %age of OOOECU %age of
agrlc total agrlc total agrlc total agrlc total agrlc total agrlc total
FLOWERS 127713,00 4,70 140241,85 4,65 141302,45 5,18 138292,52 '5,24 156961,13 5,08 169171,76 4,86 i '
POTATOES 142257,80 6,24 164498,49 5,45 143283,75 5,25 125781,68 4,76 132123,60 4,27 261578,01 7,99
TOMATOES 149600,66 5,51 159365,00 5,28 134768,95 4,94 146070,66 5,53 129229,80 4,18 165889,44 4,76
ONIONS 10963,42 0,40 12745,99 0,42 14301,08 0,52 12645,86 0,48 . 14192,74 0,46 24141,21 0,74
!
SHALLOTS, GARLIC 2486,07 0,09 5626,14 0,19 3215,25 0,12 4553,45 0,17 4239,61 0,14 3987,79 0,12
OLIVES AND OLIVE OIL 1m66,78 6,65 276571,04 9,16 185984,30 '6,81 180965,12 6,85 299711,96 9,69 410825,69 12,54
HAZELNUTS 206049,96 7,59 224611,79 7,44 223555,41 8,19 242382,48 9,18 403896,71 13,06 366616,16 11,19
' \.IV ORANGES 434016,99 15,98 366454,38 11,81 289610,28 \/ 10,61 202227,12 7,66 208201,82 ' 6,73 205188,48 6,26
EASY PEELERS 76558,50 2,82 100340,94 3,32 79803,19 2,92 82628,86 3,13 77114,74 2,49 110782,98 3,38
LEMONS 14695,70 0,54 24554,94 0,81 25559,43 0,94 23613,24 0,89 22818,67 0,74 28043,98 0,86
GRAPES 121405,06 4,47 135216,96 4,48 117515,40 4,31 137894,59 5,22 159793,25 6,17 178630,42 5,45
MELONS 15815,37 0,58 24571,21 0,81 26940,45 0,99 25846,51 0/}8 31084,76 ' 1,01 34514,51 1,05
STRAWBERRIES 8438,15 0,31 793,1,79 0,26 10638,42 0,39 15643,70 0,59 23418,80 '0,76 17079,38 0,52
RICE 18,70 0,00 2019,73 0,07 38,27 0,00 2190,87 0,08 872,26 0,03 89,19 0,00
WINE 21698,87 0,80 23313,21 0,77 22401,01 0,82 21364,62 0,81 22473,12 0,73 22731,60 0,69
SENSITIVE TOTAL 1609382,83 55,58 11157983,48 54,92 1418917,84 61,98 1382091,28 61,68 1686132,97 54,54 1979168,49 60,42
AGRICULTURAL TOTAL 27168311,811 100,00 3018860,68 100,00 2726979,21 100,00 2640703,12 100,00 3091466,84 • 100,00 3276445,28 100,00
'
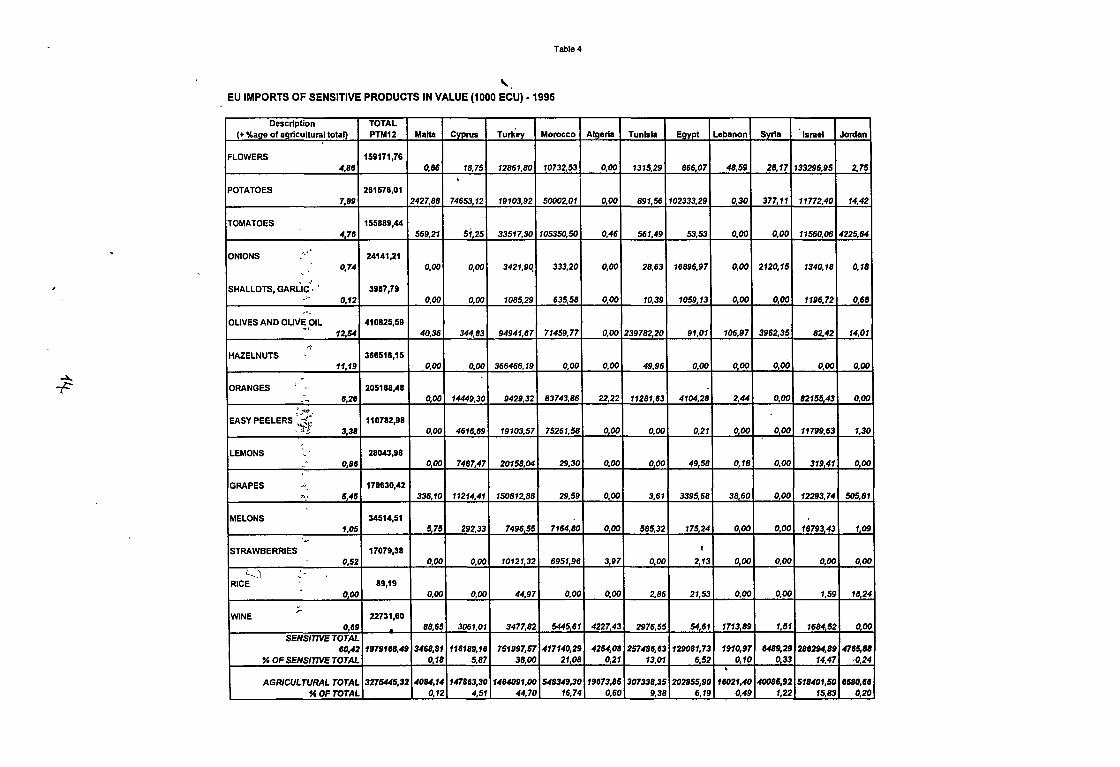
Table4
\,
EU IMPORTS OF SENSITIVE PRODUCTS IN VALUE (1000 ECU) -1995
Description TOTAL (+%age of agricultural total) PTM12 Malta Cyprus Turkey Morocco Algeria Tunisia Egypt Lebanon Syria Israel Jordan
I
I FLOWERS 159171,76 4,86 0,86 18,75 12861,80 10732,53 0,00 1315,29 86607 48,59 28,17 133296,95 2,75
POTATOES 281578,01 7,99 2427,88 74653,12 19103,92 50002,01 0,00 891,56 102333,29 0,30 377,11 11772,40 14,42
TOMATOES 155889,44 4,76 569,21 51,25 33517,30 105350,50 0,46 561,49 53,53 0,00 0,00 11560,06 4225,64
ONIONS _._ ..
24141,21 0,74 0,00 0,00 3421,9q 333,20 0,00 28,63 16896,97 0,00 2120,15 1340,18 0,18
' ' ,•
SHALLOTS, GARLIC • ' 3987,79 -~ 0,12 0,00 0,00 1085,29 635,58 0,00 10,39 1059,13 000 0,00 1196,72 0,68
-·. ~ OLIVES AND OLIVE OIL 410825,59
~,.
12,54 40,36 344,83 94941,67 71459,77 0,00 239782,20 91,01 106,97 3962,35 82,42 14,01
" HAZELNUTS 366516,15 11,19 0,00 0,00 366466,19 0,00 0,00 49,96 0,00 0,00 0,00 0,00 0,00 1
~ --f:" ORANGES ' - 205188,48 - 8,28 0,00 14449,30 9429,32 83743,86 22,22 11281,63 4104,28 2,44 0,00 82155,43 0,00 --
:.~~. - .-~· 110782,98 EASY PEELERS ,'';t_f
338 0,00 4616,69 19103,57 75261,58 0,00 0,00 0,21 0,00 000 11799,63 1,30
' LEMONS -- 28043,98
' 0,88 0,00 7487,47 20158,04 29,30 0,00 0,00 49,58 0,18 0,00 319,41 0,00
GRAPES -"- 178630,42
~· 5,45 336,10 11214,41 150812,88 29,59 0,00 3,61 3395,68 38,60 0,00 12293,74 505,81
MELONS 34514,51 105 5,75 292,33 7496,55 7164,80 000 585,32 175,24 0,00 0,00 18793,43 1,09
v
STRAWBERRIES 17079,38 ' 0,52 0,00 0,00 10121,32 6951,96 3,97 0,00 2,13 0,00 0,00 0,00 0,00
'---._) -RICE 89,19
0,00 0,00 0,00 44,97 0,00 0,00 2,86 21,53 0,00 0,00 1,59 1/J,24
;. WINE 22731,60
0,69 . 88,65 3061,01 3477,82 5445,61 4227,43 2976 55 54,61 1713,89 1,51 1684,52 0,00 SENSITIVE TOTAL
60,42 1979188,49 3468,81 11&189,1& 751997,57 417140,29 4254,08 257488,83 129081,73 1910,97 8489,29 288294,89 4785,81 % OF SENSITIVE TOTAL 0,18 5,87 38,00 2108 0,21 13,01 6,52 010 033 14,47 -0,24
• AGRICULTURAL TOTAL 3275445,32 4084,14 1478&3,30 1464091,00 548349,30 19673,85 307338,35 202855,90 16021,40 40085,92 518401,50 8680,61J
%OF TOTAL 0,12 4,51 44,70 1&,74 0,60 9,38 6,19 0,49 1,22 15,83 0,20

Table 5
MAIN EU EXPORTS TO PTM12 -1995 less Fish products and non-Annex II products
' (e_xports over 10m ECU ranked by product group and value) .. CNcode Desc;rlptlon
1701 CANE OR BEET SUGAR 1001 WHEAT AND MESLIN 102 LIVE BOVINE ANIMALS 402 MILK AND CREAM 202 MEAT OF BOVINE ANIMALS, FROZEN
1507 SOYA-BEAN OIL 1101 WHEAT OR MESLIN FLOUR 406 CHEESE AND CURD 1103 CEREAL GROATS, MEAL AND PELLETS 2309 PREPARATION OF A KIND USED IN ANIMAL FEEDING
' 701 POTATOES 1514 RAPE, COLZA OR MUSTARD OIL 1512 SUNFLOWER SEED 405 BUTTER AND OTHER FATS AND OILS DERIVED FROM MILK 1003 BARLEY 2401 UNMANUFACTURED TOBACCO 1209 SEEDS,FRUITS AND SPORES, USED FOR SOWING 201 MEAT OF BOVINE ANIMALS
2002 TOMATOES PREPARED 1206 SUNFLOWER SEEDS 1,g5 LIVE POULTRY
1602 PREPARED OR PRESERVED MEAT 1516 ANIMAL OR VEGETABLE FATS AND OILS 2301 FLOURS,MEALS AND PELLETS, ... , UNFIT FOR HUMAN CONSUMPTION 1517 MARGARINE
' 1006 RICE 713 DRIED LEGUMINOUS VEGETABLES 602 LIVE PLANTS 1202 GROUND-NUTS 2204 WINE 1519 ACID OILS, FATTY ACIDS AND ALCOHOLS 901 COFFEE 808 APPLES,PEARS AND QUINCES
2009 FRUIT JUICES 1515 FIXED VEGETABLE FATS AND OILS 1214 SWEDES, MANGOLDS
~
2005 , PREJ;AR,ED VEG~TAfi!LE~ .. , .~. ;.,-. ~'. .;;_ ·; .._.. ·'!;,. &";~~~~· .• : 1.~, .; ) ~ , ·, ., 1107 . MALT'!:. ... "" '!I"' ·f1 ... ,rt :; ~"t<•• ~ ... ~:. "· ~~"'"" "t~-:~,<,1 :of·...-;,.,~::'11~,-.· '~< "~FJ'
·~ 'r",t~' ,ft':r,-..,.'. '1;-..r'_~:-'': ,• ~ '' ,~ 1 ·-.,:.:.r-~·;~~1.,~f·*~' .. ~\"1-·,~.._f 1 ~( '"•.-• ~ ~ ro
' .
total agricultural exports
{')
value %age of quantity (000 ECU) total export (tonnes)
value
592528,59 16,06 1935472,00 454625,73 12,32 3819429,_!)0 280425,79 7,60 291714,00 266032,88 7,21 152790,00 247083,63 6,70 196189,00 206817,02 5,61 423652,00 191749,76 - 5,20 975826,00 117330,67 3,18 56182,00 114277,20 3,10 572332,00 101397,37 2,75 229542,00 95434,66 2,59 219777,00 84036,61 2,28 178926,00 67438,08 1,83 112993,00 62554,00 1,70 36689,00 53569,84 1,45 587700,00 46655,87 1,26 39713,00 44193,66 1,20 6717,00 42059,67 1,14 29242,00 35910,03 0,97 42078,00 27557,99 0,75 110263,00 27196,06 0,74 2168,00 27058,21 0,73 13412,00 25838,'~6 0,70 29826,00 23557,62 O,q4 100804,00 20910,88 0,57 25949,00 19471,42 . 0,53 1553834,00 19349,59 0,52 40609,00 192:15,59 0,52 12503,00 1696~,78 0,46 20880,00 16525,04 0,45 3124,00 15732,52 0,43 22523,00 14896,16 0,40 4056,00 14523,10 0,39 26273,00 12711,78 0,34 15518,00 11661,02 0,32 19228,00 11519,03 0,31 99829,00
·,..'Pt99: ~ ,: ·'fOS!i:~.62
·)·t .. ',.·: 0,31 · '·: :""o:29
.. "10402,00 !' 'o' 4o24s,oo
3688900,00 100
""""' a-
. \
;fl· ' '
\
Annex 1
Study of the impact of the Mediterranean concessions Supply balance
Tomatoes Campaigns
(tonnes) 1991' 1992 1993 1994 1995 Production 13.231.573 12.439.328 12.218.115 13.425.726 12.340.407
Imports 350.463 356.488 391.311 465.011 483.522 % 3% 3% 3% 3% 4%
Imports 350.463 356.488 391.311 465.011 483.522 of which from
Mediterranean third 145.183 141.609 171.050 156.280 144.820 countries*
o/o 41% 40% 44% 34% 30% Production · 13.231.573 12.439.328 12.218.115 13.425.726 12.340.407
Exports 70.805 80.485 125.746 183.979 245.045 % 1% 1% 1% 1% 2%
Exports 70.805 80.485 125.746 183.979 245.045 of which to
Mediterranean third . 304 352 442 5.130 1.282 countries*
% 0% 0% 0% 3% 1% Withdrawals 60.273' 252.697 50.091 50.220 67.025
Apparent consumption 13.450.958 12.462.634 12.433.589 13.656.538 12.511.859 Production 13.231.573 12.439.328 12.218.115 13.425.726 12.340.407
% 98% 100% 98% 98% 99% for processing 6.427.084 5.619.601 6.230.770 7.199.547 6.740.497
fresh 7.023.874 6.843.033 6.202.819 _6.456:991 5.n1.36~ -------------
Value of Mediterranean 120.605 107.150 115.862 96.480 112.768
imports (1000 ECUs) Mediterranean imports 145.183 141.609 171.050 156.280 144.820
Unit value for 0,83 0,76 0,68 0,62 0,78
Mediterranean (E~U/kg)
average 12.731.030
409.359 3%
409.359
15~.7881 37%
12.731.030 141.212
1% 141.212
1.502
1% 96.061
12.903.116 12.731.030
99% 6.443.500 6.459.616
110.573 . 151.788
0,73
• Mediterranean th1rd countries: Tums1a, Morocco, Israel, Palestine, Algena, Jordan, Syria, Lebanon, Ubya, Malta, Cyprus and Turkey

Annex 1
Tomato Campaigns
concentrate (tonnes) 1991 1992 1993 . 1994 1995 average
Production 793.551 678.850 756.818 902.174 824.457 791.170 Imports 69.573 49.580 35.399 42.586 90.382 57.504
%. 9% 7% 5% 5% 11% 7% Imports 69.573 49.580 35.399 42.586 90.382 57.504
of which from Mediterranean third 36.651 24.183 27.844 32.445 42.011 32.627
countries• % 53% 49% 79% 76% 46% 57%
Production 793.551 678.850 756.818 902.174 824.457 791.170 Exports 178.136 186.201 222.510 182.727 224.889 198.893
% 22% 27% 29% 20% 27% 26% ---t-' Exports 178.136 186.201 222.510 182.727 224.889 198.893
of which to I
Mediterranean third 65 961 59.126 27.517 33.035 82.988 53.725 . countries•
% 37% 32% 12% 18% 37% 27% Withdrawals - - - - -
Apparent consumption 684.988 542.230 569.708 762.032 689.950 649.782 Production 793.551 678.850 756.818 902.174 824.457 791.170
% 116% 125% 133%. 118% 119% 122% for processing - - - - -
fresh - - - - • - . Value of Mediterranean
28.505 17.785 18.394 21.858 31.132 23.535 . ' imports (1000 ECUs)
Mediterranean Imports 36.651 24.183 27.844 . 32.445 42.011 32.627 Unit value for
0,78 0,74 0,66 0,67 0,74 0,72 Mediterranean (ECU/kg)

-~
., . • ~ .. ~·;
:Onions (tonnes)
Production Imports
% -Imports
of which from Mediterranean third
countries* %
Production Exports
% Exports
of which to Mediterranean third ·
countries* %
Withdrawals Apparent consumption
Production %
for processing fresh
Value of Mediterranean imports (1000 ECUs)
Mediterranean imports Unit value for
Mediterranean (ECU/kg)
1991 . . 1992 3.057.046 3.326.061 256.614 217.252
8% 7% 256.614 217.252
9.167 11.909
4% 5% 3.057.046 3.326.061 126.383 155.445
4% 5% 126.383 155.445
-1.224 5.227
1% 3% - -
3.187.277 3.387.868 3.057.046 3.326.061
96% 98%
1910 2783
9.167 11.909
0,21 0,23 - -
Annex 1
Campaigns
1993 1994 1995 average 3.151.952 3.223.463 3.223.675 3.196.439 166.114 246.513 320.614 241.421
5% \ 8% .. 10% 8% 166.114 246.513 320.614 241.4~1
6.053 9.032 27.706 12.773
4% 4% 9% 5% 3.151.952 3.223.463 3.223.675 3.196.439 178.259 229.335 184.041 174.693
6% 7% 6% 5% 178 259 229.335 184.041 174.693
2.027 2.759 1.058 2.459
1% 1% 1% 1% - - -
3.139.807 3.240.640 3.360.248 3.263.168 3.151.952 3.223.463 3.223.675 3.196.439
100% 99% 96% 98% ..
1162 2240 8329 3.285
6053 9.032 27.706 12.773
0,19 0,25 0,30 0,26 ------- - - - -- ~ -

...... u
IVII:.U/-\1'-ILI:.N . .II.L::i Annex 1
Hazelnuts Campaigns
(lonnes) 1991 1992 1993 1994 Production 148.475 126.600 100.433 143.784 Imports (1) 227.343 236.961 245.631 289.570
% 153% 187% 245% 201% Imports (1) 227.343 236 961 245.631 289.570
of which from· Mediterranean third 219.933 228.649 234 037 272.349
countries* % 97% 96% 95% 94%
Production 148.475 126 600 100.433 143 784 Exports (1) 29.900 24.802 21 081 19.213
% 20% 20% 21% 13% Exports (1) 29.900 24.802 21 081 19 213 of which to '
Mediterranean third 1.317 1.192 1.499 901 countries* ~ ·% 4% 5% 7% 5%
Withdrawals - - - -Apparent consumption 345.918 338.759 324.983 414.141
Production 148.475 126 600 100.433 143 784 % 43% 37% 31% 35%
for processing fresh
-- L___._· - - ~- - ---
Value of Mediterranean 224.510 223.554 242.382 403.896
imports (2) (1000 ECUs) Mediterranean imp<'rts 219.933 228.649 234 037 272.349
Unit value for 1,02 0,98 1,04 1.48 Mediterranean {ECU/kg)
(1)' unshelled equivalent (coefficient: 1kg in shell;:: 0,45 kg Without shell) (2): average of "shelled" and "unshelled"
Page4
25/09/97
1995 average 124.088 128.676 322.086 264.318 260% 205%
322.086 264.318
I
313.818 253.757
97% 96% 124.088 128.676 18.939 22.787 15% 18%
18.939 22.787 \ '
1.169 1.216
6% 5% -
427.235 370.207 124.088 128.676
29% 35%
- L_ -· ---
366.515 292.171 I
313.818 253.757 i
1,17 1,15

t--.J 0
Oranges (tonnes)
Production Imports
% - Imports
of which from Me,dlterranean third
countries* %
Production Exports
% Exports
of which to Mediterranean third
countries* %
Withdrawals Apparent consumption
Production %
for processing fresh
Value of Mediterranean imports (1000 ECUs)
MediterriJnean imports Unit value for
Mediterranean (ECU/kg)
....
1991/1992 1992/1993 5.276.371 6.221.959 922.837 885.250
17% 14% 922.837 885.250
540.406 497.209
59% 56% 5.276.371 6.221.959 447.713 504.999
8% 8% 447.713 504.999
1.894 3.853
0% 1% 164.588 607.458
5.586.906 5.994.751 5.276.371 6.221.959
94% 104% 1.471.659 1.175.075 4.115.247 4.819.677
214.671 192 765
540.406 497.209
0,40 0,39
Annex 1
Campaigns
1993/1994 1994/1995 1995/1996 average 5.154.539 5.633.589 5.237.734 5.504.838 797.891 845.347 869.609 864.186
15% 15% 17% 16% 797.891 845.347 869.609 864.18.6
410.868 380.065 364.061 438.522
51% 45% 42% 51% 5.154.539 5.633.589 5.237.734 5.504.838 710.952 912.284 631.265 641.443
14% 16% 12% 12% 710.952 912.284 631.265 641.443
6024 5.063 4.227 4.212
1% 1% 1% 1% 312.800 220.275 184.718 297.968
4.928.678 5.346.376 5.291.361 5.429.615 5.154.539 . 5.633.589 5.237.734 5.504.838
105% 105% 99% 101% 1.044.489 1.329.941 1.255.291 3.884.189 4.016.436 4.208.887
126.596 134.405 154.259 167.109
410 868 380.065 364.061 438.522
0,31 0,35 0,42 0,38

Annex 1
Easy peelers Campaigns
(tonnes) 1991 1992 1993 1994 1995 average Production 1.891.425 2 160.478 2.103.342 2.403.261 2.145.754 2.140.852
Imports 922.837 885.250 797 891 845.347 86~.609 864.186 % 49% 41% 38% 35% 41% 40%
lmpo~ 922.837 885.250 797.891 845.347 869.609 864.186 of which from
I Mediterranean third 127.077 115.663 130.709 122.825 159.232 1J1.1o1 I
countries* % 14% 13% 16% 15% 18% 15% I
Production 1.891.425 2.160.478 2.103.342 2.403.261 2.145.754 2.140.852 I Exports 82.058 110.440 180 326 . 215.105 219.878 . 161.561 i
% 4% 5% 9% 9% 10% 8% I
Exports \ 82.058 110.440 180.326 215.105 219.878 161.561
S! of which to Mediterranean third 549 A39 894 876 980 748
countries* % 1% 0% 0% 0% 0% 0%
Withdrawals 4.436 69.460 340.546 265.652 242.359 184.491 Apparent consumption 2.727.768 2.865.828 2.380.361 2.767.851 2.553.126 2.658.987
Production 1.891.425 2.160.478 2.103.342 2.403.261 2.145.754 2.140.852 % 69% 75% 88% 87% 84% 81%
for processing 319.210 167.100 241.319 259.716 246.836 fresh 2.408.558 L_2.698.7~ 2.139.042 2.508.135 2.438.616 --· --
Value of Mediterranean 100.270 79.498 82.458 77.042 110.710 84.817
i111ports (1000 ECUs) Mediterranean imports 127.077 115 663 410.868 380.065 364.061 279.547
Unit value for 0,79- 0,69 0,20 0,20 0,30 0,30 Mediterranean (ECU/kg)

~ ~
Lemons (tonnes)
Production Imports
% Imports
of which from Mediterranean third
countries* %
Production Exports
% Exports
of which to Mediterranean third
countries* %
Withdrawals Apparent consumption
Production %
for processing fresh
Value of Mediterranean imports (1000 ECUs)
Mediterranean Imports Unit value for
Medlterranj!!" (ECU/kg)
\.
1991 1992 1.452.355 1.618.978 119.788 128.550
8% 8% 119.788 128.550
48.420 56.077
40% 44% 1.452.355 1 618.978 166.347 114.818
11% 7% 166.347 114.818
342 431
0% 0% 13.736 84.578
1.392.060 1.548.132 1.452.355 1,.618.978
104% 105% 357.349 501.272
1.034.711 1.046.860
24.622 25.595
48.420 56.077
0,51 0,46
Annex 1
Campaigns
1993 1994 1995 average 1.523.803 1.273.567 1.283.390 1.430.419
95.810 165.568 190.962 140.136 6% 13% 15% 10%
95.810 165.568 190.962 140.136
44.973 46.288 46.130 48.378
47% 28% 24% 35% ' 1.523.803 1.273.567 1.283.390 1.430.419 222:941 196.049 178.827 175.796
15% 15% 14% 12% 222.941 196.049 178.827 175,796 I
3.073 50 190 81!
1% 0% 0% 0% 61.482 6.476 4.588 34.172
1.335.190 1.236.611 1.290.937 1.360.586 1.523.803 1.273.567 1.283.390 1.430.419
114% 103% 99% 105% 510.571 413.881 445.768 824.619 822.729 932.230
23.742 22.958 28.263 24.229
44.973 46.288 46.130 48.378
0,53 0,50 0,61 0,50

/'-' iJJ
Table grapes (tonnes) 1991
Production 2.394.533 Imports 170.519
% 7% Imports 170.519
of which from Mediterranean third 20.139
countries* % 12%
Production 2.394.533 Exports 58.078
% 2% Exports 58.078
of which to Mediterranean third 1.520
countries* % 3%
Withdrawals 291 Apparent consumption 2.506.683
Production 2.394.533 % 96%
for processing (1) 265.940 fresh 2.240.743
--··-
Value of Mediterranean 30.180
imports (1000 ECUs) Mediterranean Imports 20.139
Unit value for Mediterranean (ECU~ . -~~~
(1 ): for wine production in Italy only
1992 2.598.075 194.381
7% 194.381
21.515
11% 2.598.075
74.726 3%
74.726
2.039
3% 3.791
2.713.938 2.598.075
,96%
409.860 2.304.078
18.048
21.515
1,19 -·
Al')nex 1 25/09/97
Campaigns
1993 1994 1995 average 2.453.899 2.282.927 2.393.544 2.424.596 187.229 205.835 204.080 192.409
8% 9% 9% 8% 187.229 205.835 204.080 192.409
22.516 22.481 31.659 23.662
12% 11% 16% 12% 2.453.899 2.282.927 2.393.544 2.424.596 104.434 141.197 134.022 102.492
4% 6% 6% 4% 104.434 141.197 134.022 102.492
1.752 4.149 3.001 2.492
2% 3% 2% 2% 18.859 20.212 2.058 9.042
2.51-7.835 2.327.353 2.461.544 2.505.471 2.453.899 2.282.927 2.393.544 2.424.596
97% 98% 97% 97% 378.310 247.589 454.690 351.278
2.139.525 2.079.764 2.006.854 2.154.193
24.019 20.864 35.251 25.672
22.516 22.481 3-1.659 23.662
0,94 1,08 0,90 0,92
~ -r
Melons (tonnes)
Production _ Imports
% Imports
of which from Mediterranean third
countries• %
Production Exports
% Exports
of which to Mediterranean third
countries• %
Withdrawals Apparent consumption I Production
% for processing
fresh - ----------- ---
Value of Mediterranean imports (1000 ECUs)
Mediterranean imports Unit value for
Mediterranean (ECU/kg)
1991 .
1.806.293 67.637
4% 67.637
19.538
29% 1.806.293
24.415 1%
24.415
. 19
0%
-1.849.515 1.806.293
98%
----~
18.633
19.538
1,05
Annex 1
Campaigns
1992 1993 1.742.891 1.759 704
78.950 88.036 5% 5%
78.950 88.036
22.119 22.200
28% 25% 1.742.891 1.759:704
21.146 24.137 1% 1%.
21.146 24.137
21 39
0% 0%
- -1.800.695 1.823.603 1.742.891 1.759.704
97% 96%
___ . __
21.830 22.917
22.119 22.200
1,01 0,97
I
1994 1995 average 1.818.280 1.750.040 1.775.442 101.310 103.759 87.938
6% 6% 5% 101.310 103.759 87.938
27.728 30.689 24.455
27% 30% 28% 1.818.280 1.750.04Q 1.775.442
29.237 29.980 25.783 2% 2% 1%
29.237 29.980 25.783
' 26 48 31
0% 0% 0%
- -1.890.353 1.823.819 1.837.597 1.818.280 1.750.040 1.775.442
96% 96% 97%
._ L_ __ • _. - -·
24.142 27.327 22.970
27 728 30.689 24.455
1,15 1,12 1,06
Annex 1
'
Strawberries Campaigns
(tonnes) 1991 1992 1993 1994 1995 average Production 648.925 687.802 758.741 764.650 781.471 728.318
Imports 37.152 24 046 24.506 20.871 30.042 27.323 % 6% 3% 3% 3% 4% 4%
Imports 37.152 24.046 24.506 20.871 30.042 27.323 of which from !
Mediterranean third 2.007 2.616 5.859 6.671 9.196 5.270 countries*
% 5% 11% 24% 32% 31% 19% Production 648.925 687 802 758.741 764.650 781.471 728.318
Exports 12.207 10.773 10.180 13.790 19.392 13.268 %_ 2% 2% 1% 2% 2% 2%
Exports 12.207 10 773 10.180 13.790 19.392 13.268 of which to,
~ Mediterranean third 2' 9 2 I 3 37 11
countries* % 0% 0% 0% 0% 0% 0%
Withdrawals - - - - -Apparent consumption 673.870 701.075 773.067 771.731 792.121 742.373
Production 648.925 687.802 758.741 764.650 781.471 728.318 % 96% 98% 98% 99% 99% 98%
for processing fresh L \:
------ ---- --- -- -- -- - ---- -- -
Value of Mediterranean 5274 7095 13608 16978 20619 12.715
imports (1000 ECUs) I
Mediterranean Imports 2.007 2.616 5.859 6.671 9.196 5.270 Unit value for 0,38. 0,37 0,43 0,39 0,45 0,41
Mediterranean (ECU_/I(gl_ -- --
. Sources: -Production: EUROSTAT (Cronos I March 1997) +estimates VI E/1 -External trade· EUROSTAT (Comext) I March 1997) - Processmg: Member States (balance for c1trus and processed products)

~z
Chapter 06 - Live plants and floricultural products - Extra-EU -
looo ecu 1988 1989 1990 1991 1992 1993 1994 19951
Imports
06 409.896 443.994 495.231 585.184 629.037 675.312 726.910 784:515
-'-.
0601 10.147 10.277 10.791 11.771 14.785 12.583 15.981 18.632 0602 103.901 111.468 117.007 125.931 121.529 128.489 135.043 143.577 0603 220.178 228.879 260.709 320.915 357.015 366.571 403.245 441.777 0604 75.671 93.370 106.723 126.567 135.709 167.669 172.642 180.529
Exports
06 786.056 866.122 930.327 990.915 1.044.060 1.038.393 1.179.688 891.302
0601 156.385 167.522 190.639 222.190 246.396 248.652 319.256 285.711 0602 316.704 343.114 379.646 408.455 420.800 415.424 447.311 280.652 0603 286.806 327.980 333.195 330.889 347.295 344.690 378.351 299.083 0604 26.160 27.506 26.847 29.382 29.568 29.626 34.770 25.856
Export surplus
06 376.159 422.127 435.096 405.731 '415.023 363.081 452.778 106.787
0601 146.238 157.245 179.848 210.419 231.611 236.069 303.276 267.079 0602 212.803 231.646 262.639 282.524 299.272 286.935 312.268 137.074 0603 66.629 99.101 72.486 9.973 (9.719) (21.881) (24.893) (142.694) 0604 (49.510) (65.864) (79.877) (97.184) (106.140) (138.04~) (137.872) (154.673)
ltonnes 1988 1989 1990 1991 1992 1993 1994 19951
lmpctrls
06 137.483 145.772 171.494 196.748 209.194 215.269 229.676 250.626
0601 4.024 4.018 3.686 3.448 4.861 4.764 4.565 5.004 0602 50.856 53.167 61.662 64.425 60.766 57.513 61.660 70.084 0603 54.436 57.091 66.599 83.358 92.040 95.697 102.504 108.289 0604 28.192 31.480 39.571 45.531 51.489 57.272 60.992 67.266
Exports
06 213.950 239.574 272.696 291.825 296.344 361.987 344.958 242.343
0601 52.033 55.964 63.144 68.767 74.194 70.567 89.030 69.371 0602 111.982 1~0.274 154.749 167.677 163.110 222.620 178.721 118.973 0603 35.189 38.361 40.026 39.467 43.987 53.363 61.435 42.494 0604 14.734 14.995 14.790 15.938 15.064 15.418 15.824 11.486
Export surplus
06 76.467 93.802 101.202 95.077 87.150 146 718 115.282 (8.283)
0601 48.009 51.946 59.458 65.319 69.333 65 803 84.465 64.367 0602 6-1.126 77.107 93.087 103.252 102.344 165 107 117.061 48 889 0603 (19.247) (18.730) (26.573) (43891) (48.053) (42.334) (41.069) (65.795) 0604 (13 458) (16.485) (24.781) (29 593) (36 425) (41 854) (45.168) (55.780)
lb

A~NEX.3 _
RICE
Provisional balance 1996/97
Indica Japonica Total %Indica
Area (000 ha) 94 331 425 22,1
(OOOt wholly-milled equivalent)
Harvest 369 1.183 1.552 ,, .23,7 -- -' ,l, Initial stocks 87 82 169 51,5 of which - - - -intervention
Consumption -725 -950 -1675 43 (2) r
.. Final stocks -100 -92 -192 52,0
Internal surplus -.~~.!! ~
-369 223 -146 .. a: ...... -;.._-t" ~-·~ : ~~~;;J, .. ~~ ~ .. ~j ... 4,' ~)q-,.~:..f tv~ ..
...;' ;:_ '~,.. .. ' !t ~ ~.:..,~; ~ ~~ \:-'w}~J.~ ... "';..., :. •P': ' --Imports 5b0 40 540 93
Available for 131 263 394 33 export
J
Exports (3) -231
Food aid -65
_Non exportable 98 surplus
(2) mcludmg 20.000 t oflndtca nee sent to Reumon Island (3) GATT ceiling (157.100 t) plus 74.000 t carried over from the 1995/96 campaign

I
ISSN 0254-1475
COM(97) 477 final
DOCUMENTS
EN 03 11
Catalogue number CB-C0-97-489-EN-C
Office for Official Publications of the European Communities
L-2985 Luxembourg
ISBN 92-78-25040-6