comments of hoosier environmental council · pdf filecomments and concerns of interested...
TRANSCRIPT

COMMENTS OF
HOOSIER ENVIRONMENTAL COUNCIL
ON 2014 INTEGRATED RESOURCES PLANS January 30, 2015
Hoosier Environmental Council (HEC) submits these comments as part of the Integrated Resource
Planning process informally followed by Indiana generating utilities. That process is outlined in a rule
that is currently proposed by the Indiana Utility Regulatory Commission (IURC or Commission); however,
the IURC is forbidden from formally adopting it pursuant to an Executive Order of the current Governor.1
Prior to the November 2014 IRP filings, utilities in Indiana worked through a new stakeholder-invited
process designed to engage stakeholders early in the IRP process. The intent of this process was to
include stakeholder comments and thoughts into the IRP process to better meet the needs and
demands of electric utility customers. The process was also intended to direct disagreements concerning
specific methodologies employed in the IRP process to the front end of the development of the IRP in
hopes utilities would be responsive to the needs and wishes of concerned customers.
Vectren, Indianapolis Power and Light (“IPL”), and Northern Indiana Public Service Company (“NIPSCO”)
all held several stakeholder meetings as part of this process. In each meeting, the companies listened to
comments and concerns of interested stakeholders. However, the IRPs filed by Vectren, NIPSCO, and IPL
do not reflect a response to the concerns raised by stakeholders in the sessions. Specifically, the IRPs
were deficient in assumptions regarding the contribution of energy efficiency, demand response,
combined heat and power (“CHP”), and distributed generation.
Inclusion of Energy Efficiency and Demand Side Management in an IRP The IRP rule in Indiana requires demand side resources to be evaluated on a consistent and comparable
basis to supply side resources. Energy efficiency has been found to be the lowest cost resource among
traditional alternatives analyzed in utility integrated resource planning. A recent report released by the
American Council for an Energy Efficient Economy (ACEEE) estimated the average cost of energy
efficiency to program administrators to be approximately three cents per kilowatt-hour (kWh)2. The
Lawrence Berkeley National Laboratory also released a comprehensive analysis in 2014 of energy
efficiency program costs and estimated a similar national average3. In another recent study, energy
efficiency was also found to be the lowest risk strategy for an electric utility in evaluating resource
1 As HEC has voiced previously, this rulemaking moratorium is a short-sighted and contrived political gesture that
prevents the Commission (and other agencies) from fully and effectively performing their responsibilities on behalf
of Indiana consumers.
2 Molina, Maggie, 2014. The Best Value for America’s Energy Dollar: A National Review of the Cost of Utility
Energy Efficiency Programs. ACEEE Research Report No. U1402. Washington, D.C.: American Council for an
Energy-Efficient Economy.
3 LBNL (Lawrence Berkeley National Laboratory). 2014. The Program Administrator Cost of Saved Energy for
Utility Customer-Funded Energy Efficiency Programs in the United States. Berkeley: LBNL.
Received: January 30, 2015 Indiana Utility Regulatory Commission

options for meeting future needs4. Efficiency can also play a significant role in Indiana as the state
prepares to meet the requirements of EPA’s Clean Power Plan later this year. Clearly, demand side
energy efficiency resources hold significant potential as a least-cost, least-risk strategy for Indiana
electricity customers. It is therefore in the interest of all stakeholders to improve transparency in
assumptions and to carefully review the reasonableness of assumptions about energy efficiency in each
of the IRPs.
In the Vectren IRP, the company included a chapter on the evaluation of demand side resources with a
strong emphasis on energy efficiency programs. Vectren discussed the details of a recent market
potential study used to determine the programs to be offered moving forward into 2015. Finally,
Vectren used 0.5% DSM “blocks” in the resource alternative section of the IRP to model DSM resources
in various scenarios. From reading the IRP, it is unclear how a DSM “block” is defined. To better
understand how DSM is modeled in the Vectren IRP, it would be useful to know the assumptions
regarding cost of each “block” and how energy efficiency compares with other resource options in a net
present value of revenue requirements analysis. Also, we strongly encourage Vectren to model higher
penetrations of DSM in the base scenario to offset the operation of higher cost, inefficient units. Most of
Vectren’s existing units are inefficient with high heat rates (page 189, Vectren IRP).
Unlike Vectren, IPL has redacted avoided cost information used to screen energy efficiency programs
using traditional cost effectiveness tests. This is a departure from previous versions of the IPL IRP, which
contain all avoided cost information unredacted. The omission of avoided cost data presents challenges
in attempting to determine if the cost effectiveness screening of IPL’s programs is accurate. If the
historical avoided costs presented on page 110 of the IRP were used to determine cost effectiveness of
future programs, the IRP should be rerun with updated avoided costs reflective of today’s conditions
and IPL’s current generation fleet.
IPL’s IRP also demonstrates the company’s failure to capture cost effective energy savings. As Figure
4B.6 illustrates, IPL has substantially more economic potential for efficiency. Instead of modeling the
economic potential into the IRP as a resource at different cost points, IPL nets the achievable efficiency
from the demand forecast leaving nearly 1000 MW of economic efficiency out of the optimization
analysis. Netting potential energy efficiency from a demand forecast does not allow energy efficiency to
compete with other supply side resources in an optimization process and produces a supply resource
mix which is likely not the least cost possible outcome. We strongly encourage IPL to model energy
efficiency as a resource, and to consider a higher penetration of cost-effective energy efficiency.
While NIPSCO did model efficiency programs competitively with supply side options in the IRP, the
company unfortunately reduced the energy efficiency contribution to energy needs by half from 2014 to
2015. Given NIPSCO was operating cost effective programs in 2014, it is likely NIPSCO discontinued cost
effective programs which could have reduced the need for market purchases in future years. The
capacity shortfalls outlined in Table 11-1 from 2020 to 2023 could be met with cost effective energy
efficiency. We strongly encourage NIPSCO to consider a higher penetration of cost-effective energy
efficiency in its modeling.
4 Binz, Ron, Dan Mullen, Richard Sedano and Denise Furey. 2014. Practicing Risk-Aware Electricity Regulation:
2014 Update. Ceres Report. November. Boston, MA: Ceres.
Received: January 30, 2015 Indiana Utility Regulatory Commission

Like IPL, Vectren and NIPSCO relied on recent market potential studies to determine the appropriate
level of efficiency in future years. In all three studies, a distinction was made between achievable
potential and economic potential. Economic potential is defined as the cost effective efficiency based on
commercially available measures and the company avoided cost. Achievable potential is considered to
be the potential available given utility budgetary limits and other regulatory constraints. All three
companies based future assumptions of energy efficiency on the achievable potential leaving substantial
cost effective energy and summer peak demand savings on the table. For example, NIPSCO’s market
potential study stated the achievable potential summer peak savings for 2020 were 125 MW while the
economic potential is 635 MW (NIPSCO IRP Appendix G page 6). The difference of 510 MW is substantial
and equates to the size of a medium sized generation plant. All three IRPs should model all economic
potential to determine how the resource compares with other supply side resources. Failure to capture
the economic savings potential can cost utility ratepayers more dollars over the life of the measures.
Combined Heat and Power5 As Indiana utilities plan for the next twenty years, they should give greater consideration to the inclusion
of customer-sited distributed generation in their integrated resource plans (IRPs). In their respective IRP
filings, NIPSCO, Vectren, and IPL did not give full consideration to the use of customer sited distributed
generation. While there was awareness of investments by customers of photo voltaic (PV) systems and
the potential for those systems to reduce peak load, the utilities’ respective plans did not explore the
potential for other types of customer-site distributed generation, specifically combined heat and power
(CHP), to meet future base load and peak load needs. This is surprising given that Indiana is already
home to three dozen facilities with over 2200 MW of installed capacity and that the benefits of these
systems to the grid are well established.
Not only do the plans not recognize the value of CHP already realized in Indiana, they do not consider or
even discuss the future contributions CHP systems can make. With 21st Century technologies and market
structures, it is now possible for distributed generation facilities to provide almost all of the services that
historically could only be provided by utility owned assets. The shared costs and benefits of these
distributed resources translate to lower system costs and lower operating costs, and by extension, lower
bills for utility customers.
Potential in Indiana Several of the submissions argued that the economics for CHP are not favorable in Indiana. These
findings are contrary to a 2012 ACEEE analysis6 that found that Indiana could replace up to 21 percent of
the 1957-2966 MW of projected coal retirement capacity with CHP if utilities and large customers are
provided the proper incentives. In its analysis, ACEEE determined that there exists approximately 56
MW of CHP that is currently economically viable and up to 611 MW with a market structured to
encourage such investments.
The lower number is possible with proper signals from utilities such as inclusion in resource planning, favorable interconnection standards and standby rates, and natural gas price stability. The larger
5 In further support of its discussion here, HEC attaches its policy paper, “Combined Heat and Power: Creating
Energy Solutions for Indiana (2014).
6 Anna Chittum and Terry Sullivan. 2013 Coal Retirements and CHP Investment Opportunity, ACEEE Research
Report IE 123, http://www.aceee.org/sites/default/files/publications/researchreports/ie123.pdf
Received: January 30, 2015 Indiana Utility Regulatory Commission

number requires policies that put CHP on par with other generation assets a utility or power generation company might pursue7.
Opportunities in Indiana for Investments in Energy Efficiency and CHP Large industrial and commercial facilities represent some of the greatest opportunities to mitigate future investments in new generation and transmission. Because many of the facilities are energy-intensive, economies of scale can be realized. As energy costs are often part of a manufacturing facility’s variable cost of production, there are existing motivations to leverage. 31% of the nation’s energy use is in manufacturing8 much of it concentrated in energy-intensive industries such as the primary metals, chemical, forest products, and automotive sectors that have significant representation in Indiana. While the cost of energy efficiency overall ranges from about 2 to 6 cents per kWh9, the cost of investments in energy efficiency in the industrial sector tended to be at the lower end of that range10. This cost effectiveness presents an opportunity to avoid more costly investments in utility infrastructure in the future. As the Indiana economy recovers and old commercial and industrial facilities are updated and new ones built, now is the time to encourage investments in energy efficiency. Investments today lock in savings for many years to come. Many facilities in Indiana also have an opportunity to improve their energy efficiency and reliability through investments in high-efficiency distributed generation. Customer-sited distributed generation, especially CHP, can provide to Indiana reduced energy consumption and associated emissions, reduced peak demand and grid congestion, deferred or avoided investments in generation and distribution infrastructure, improved system reliability11 and enhanced energy security12. CHP facilities can also help Indiana utilities with Indiana’s NOx SIP and compliance strategy for the Clean Power Plan.
Utility ownership of CHP There is an assumption in the IRP filings that the CHP systems will be owned by customers. This is
certainly not a requirement. There are multiple models for the ownership and operation of CHP systems
and one that has great promise for a state with integrated and combination electricity and gas utilities is
ownership, operation and dispatch by a utility. For example, Southern Company owns and dispatches
7 Ibid.
8 U.S. DOE Energy Information Agency (EIA). 2014. Annual Energy Outlook 2014. Washington, D.C.: U.S. Energy
Information Administration. http://www.eia.gov/forecasts/aeo/.
9 Molina, Maggie, 2014. The Best Value for America’s Energy Dollar: A National Review of the Cost of Utility
Energy Efficiency Programs. ACEEE Research Report No. U1402. Washington, D.C.: American Council for an
Energy-Efficient Economy.
10 Anna Chittum and Seth Nowak. 2012. Money Well Spent: 2010 Industrial Energy Efficiency Program Spending.
ACEEE Report No. IE121.
11 Anna Chittum, 2012, “How CHP Stepped Up When the Power Went Out During Hurricane Sandy,” ACEEE
Blog, http://aceee.org/blog/2012/12/how-chp-stepped-when-power-went-out-d
12 DOE SEE Action. 2013. Guide to Successful Implementation of State Combined Heat and Power Policies.
http://www1.eere.energy.gov/seeaction/chp_policies_guide.html
Received: January 30, 2015 Indiana Utility Regulatory Commission

about 700MW of CHP capacity across its various service territories in the Southeast13,14 . In the Alabama
Power service territory, the costs of its systems have been integrated into the utility’s rate base, thus
allowing the utility to earn a return on investment equivalent to that which it receives from other types
of capital investments15. These systems are treated as normal part of the generation fleet and are
dispatched in the same manner as other generation assets to meet system load.
In Austin, Texas, a CHP system serving the Dell Children’s Medical Center is owned by Austin Energy, the
local municipal utility. The CHP system is sized to meet all the electric and thermal needs of the hospital.
The utility signed a 30-year contract with the hospital, thus offering the hospital increased reliability
while offering the utility the assurance that it won’t be stuck with stranded assets in the future. The 4.3
MW system generates more electricity than the hospital requires, allowing the utility to sell the
remaining power to customers within its distribution system. Due to the presence of a district cooling
system, the utility can take advantage of any excess thermal energy by storing it as chilled water16,17,18.
As peak hedging practice, Austin Energy stores energy as chilled water so that it can cool the hospital
during the day. This frees up generation capacity that would normally be needed to run the hospital’s air
conditioning to meet local peak electrical demands. Austin Energy has avoided having to purchase
hundreds of thousands of dollars of electricity on the wholesale market as a result of this practice.
Grid Reliability and Ancillary Services In Massachusetts and New Jersey, customer sited CHP systems are not only operating as Independent
Power Producers (IPPs) providing power and peak reduction, they are also participating in the provision
of ancillary services such as frequency control and spinning reserve. New, more flexible technologies
allow system owners to tailor the design and use of their CHP systems to respond to real time market
conditions. For example, Princeton University’s 15MW CHP system is specifically designed to respond to
real-time price signals from the PJM wholesale energy market. Massachusetts Institute of Technology
(MIT) has a very similar system that operates in the same manner bidding power and ancillary services
into the New England ISO. When the price of power rises, the Universities ramps up their CHP systems
and consequently buys less of the more expensive grid power. In the summer, when the nighttime price
of power is low, the universities generate power to chill water which they then store to be used during
the day to keep students and faculty cool. The CHP systems offers the universities flexibility and allows
13
Cofield, C.A. Skip, “Federal Utility Partnership Working Group, Combined Heat and Power.” Southern
Company. October 16. http://www1.eere.energy.gov/femp/pdfs/fupwg_fall12_cofield.pdf.
14 [SEEAction] State & Local Energy Efficiency Action Network. 2013. Guide to the Successful Implementation of
State Combined Heat and Power Policies. March.
http://www1.eere.energy.gov/seeaction/pdfs/see_action_chp_policies_guide.pdf.
15 Ibid
16 Corum, Lyn. 2007. “Backing Up the Grid.” Distributed Energy. September-October 2007.
http://forester.xodev01.com/DE/Articles/Backing_Up_the_Grid_1727.aspx.
17 Takahashi, Kenji. 2010. “Review of Utility Owned DG Business Models.” Synapse Energy Economics. April 13.
http://www.synapse-energy.com/Downloads/SynapsePresentation.2010-04.0.DG-NY-Models.S0060.pdf.
18 TAS. 2013. “Dell Children’s Medical Center Combined Heat & Power Solution.” case study. Accessed April.
http://files.harc.edu/Sites/GulfCoastCHP/CaseStudies/DellChildrenHospital.pdf.
Received: January 30, 2015 Indiana Utility Regulatory Commission

them to take maximum advantage of the benefits of efficiently generating its own power. Princeton
saves $2.5 million to $3.5 million in energy costs annually by using its CHP system to power its campus19.
The New England ISO and PJM markets enable customers to reduce their energy costs while also
increasing the reliability of the electric system. And while such markets make such advantages easier to
implement, they are not required. Utilities in fully integrated markets can establish bilateral contracts
with their customers to the same effect.
For example, in Fernandia Beach on Amelia Island, Florida, Chesapeake Utilities Corporation and its
subsidiary Eight Flags Energy, LLC are building a 20MW CHP facility on the site of a Rayonier
Performance Fibers, LLC paper pulp plant. The plant’s power will be sold to Chesapeake’s wholly-owned
subsidiary, Florida Public Utilities Company (FPU) for distribution to its retail electric customers and the
thermal output will be used by the pulp mill. Because the mill is near the end of a transmission line, its
location will stabilize the grid on the island and provide all of the residents and businesses on the island
a more reliable electric system. Ownership by a utility simplifies the risks and benefits that would
normally suffer from split agency challenges20.
CHP to supply Peak Capacity As described in the Austin Energy example, CHP can also alleviate the need to use peaker plants or
purchase power in wholesale markets by reducing peak demand. Peaker plants tend to be some of the
most expensive resources connected to the grid, performing at low load factors and running only when
the prices for power justify their operation. For instance, in 2011, Texas’ ERCOT market was settling
contracts for about $2,000/MWh during the early morning of its peak summer demand day in August.
By 4:00pm, at the peak demand period, it was settling agreements at $3,000/MWh, almost entirely with
natural gas peaker plants21. Avoiding the use of peaker plants can provide an economic benefit to all
ratepayers. As described in previous paragraphs, with proper signals and technology, CHP systems can
contribute to system peak and reduce costs for the owners of the cogeneration systems and for all
utility customers.
Reduce line losses On a national level, lost power over transmission and distribution lines cost power users about $24
billion in 201022. Line losses are often discussed as averages, but as the grid nears its peak capacity, its
19
Nyquist, Tom, Randy Preston, and Mike Webster. 2013. “New Market Opportunities for CHP.” presentation to
the IDEA 26th
Annual Campus Energy Conference & Distribution Workshop. February 18-22.
http://www.districtenergy.org/assets/pdfs/2013CampConference/Wednesday/Track-
C/1C.1NYQUISTWEBSTERPRESTONIDEA-Presentation-2013-Princeton-MIT-Icetec-session-1C.pdf.
20 Chesapeake Utilities Corporation. 2014. “Chesapeake Utilities Corporation to Build Combined Heat and Power
Plant in Florida”. Press Release. September 19.
21 Doggett, Trip. 2012. “ERCOT’s Challenges & Opportunities.” Presentation to Texas Public Power Association.
August 1.
22 Casten, Thomas. 2012. “Not all megawatts are created equal.” Cogeneration and On-site Power Production.
January 7. http://www.cospp.com/articles/print/volume-13/issue-4/features/not-all-megawatts-are-created-
equal.html.
Received: January 30, 2015 Indiana Utility Regulatory Commission
line losses rise exponentially and the marginal line losses can equal 3 times the average losses23. For
example, in 2006 the Ontario Power Authority analyzed the marginal cost of providing power from a gas
turbine during the system’s summer peak. They found the cost of fuel was about $57 per MWh, while
line losses added a cost of $115/MWh. Thus line losses represented over 65% of the total cost during
that time24.
On average, about 7% of the electricity generated at centralized plants is lost in the transmission and
distribution to its final destination25. When CHP-using facilities rely on their CHP system for power and
rely less on the grid, it reduces the amount of power needing to be generated, but it also reduces the
amount of electricity sent over and then lost in transmission and distribution wires. This frees up
capacity for other customers. To Wit, a 2012 analysis found that, due in large part to avoided line losses,
“80 GW of strategically-placed [distributed generation]” could reduce the actual “peak US generation
and transmission requirements by 100-120 GW”26. Such investments would provide economic benefit to
all system users and customers.
CHP as a compliance mechanism for NOx SiP and Clean Power Plan compliance strategy As CHP is a cleaner technology than conventional generation, it is also a potential mechanism to meet the requirements of the State Implementation Plan (SIP) for reducing NOx levels. Indiana’s SIP includes energy efficiency set-asides that provide credits to projects that reduce electricity consumption. Since CHP is at least 40 percent more efficient than central generation, it could be an eligible technology for the energy efficiency set-asides. Credits for CHP system could be developed using an output-based measurement system and provided to CHP installations on a net NOx reduction basis. CHP has the potential to be a compliance mechanism for Indiana to meet the requirements of the Clean
Power Plan. In setting the targets for each state, EPA identified four mechanisms by which states could
reduce their carbon emissions. Each of these can be met in part with CHP.
Heat-rate improvements – CHP is a more efficient method of combusting fuel and making electricity
and therefore the effective heat-rate of CHP systems is lower than conventional generation. An existing
power plant can improve its heat-rate, regardless of fuel, through conversion to cogeneration.
Shifting dispatch – A greater percentage of kWh delivered can be sourced from CHP facilities.
Renewables – Some CHP facilities use fuels (wood waste, landfill methane) that qualify as renewable
energy. Utilities can source more of their power from such facilities.
23
Lazar, Jim. 2011. “Line Losses and Reserves: Often Undervalued Benefits of Energy Efficiency Investments.”
presentation to ACEEE Energy Efficiency as a Resource Conference. Denver, CO. September 27.
24 [OPA] Ontario Power Authority. 2007. EB-2006-0233 Supplemental Settlement Proposal, Exhibit S-1-2, Issue 1,
Item 1.6. March 16.
http://www.fit.powerauthority.on.ca/Storage/43/3908_OPA_Settlement_Issue_1,_Item_1.6_2007-03-16.pdf.
25 [EIA] 2012. Energy Information Administration. “How much electricity is lost in transmission and distribution in
the United States?” July 9. http://www.eia.gov/tools/faqs/faq.cfm?id=105&t=3.
26 Casten, Thomas. 2012. “Not all megawatts are created equal.” Cogeneration and On-site Power Production.
Received: January 30, 2015 Indiana Utility Regulatory Commission

Demand-side energy efficiency – Utilities can create or alter existing programs to treat CHP systems as
investments in energy efficiency. The energy savings these systems provide customers can be can be
included in the net electricity savings for the programs.
Conclusion The discussion above outlines the many benefits of combined heat and power and energy efficiency as
reliable, economically beneficial resources to meet future energy demand in Indiana. In conclusion, any
resource that has the potential to provide base load, peak, and ancillary services should be included in
an IRP and given equal consideration with utility scale fossil fuel generation. Energy efficiency and
distributed generation have that potential. As studies have shown, energy efficiency is the least cost
resource for an electric utility and has been proved to reduce peak load and drive down system costs.
The benefits of customer-sited distributed generation, especially CHP, to utilities and the electrical
system include: reduced system energy consumption and overall emissions, reduced demand and grid
congestion, deferred or avoided investments in generation and distribution infrastructure, improved
system reliability27 and diversity, and enhanced energy security28. CHP can also help Indiana utilities with
Indiana’s NOx SIP and compliance strategy for the Clean Power Plan.
As electric utilities in Indiana consider the future resource mix in the IRP process, greater consideration
should be given to cost effective energy efficiency, combined heat and power, distributed generation,
and other renewable technologies. Current and future environmental regulations will continue to
increase the cost of the utility scale fossil generation. The increasing reliance on utility scale natural gas
generation due to a recent drop in prices is also a risky strategy for Indiana utilities and Hoosiers.
Instead, companies should take full advantage of 21st Century technologies and markets in order to
create the most robust and reliable electric system possible. These same resources will also result in
lower utility bills for Indiana’s customers and a stronger economy for the state. These resources should
be included and fully explored in each utility’s integrated resource plan.
Respectfully submitted,
/s/ Robert K. Johnson Robert K. Johnson 2454 Waldon Dr. Greenwood, IN 46143 TX: 317-606-7348 E: [email protected] Energy Counsel to Hoosier Environmental Council
27
Anna Chittum, 2012, “How CHP Stepped Up When the Power Went Out During Hurricane Sandy,” ACEEE
Blog, http://aceee.org/blog/2012/12/how-chp-stepped-when-power-went-out-d
28 DOE SEE Action. 2013. Guide to Successful Implementation of State Combined Heat and Power Policies.
http://www1.eere.energy.gov/seeaction/chp_policies_guide.html
Received: January 30, 2015 Indiana Utility Regulatory Commission

COMBINED HEAT AND POWER
CREATING ENERGY SOLUTIONS FOR INDIANA
Hoosier Environmental Council
December 2014
Received: January 30, 2015 Indiana Utility Regulatory Commission

2 HOOSIER ENVIRONMENTAL COUNCIL
Received: January 30, 2015 Indiana Utility Regulatory Commission

Received: January 30, 2015 Indiana Utility Regulatory Commission

4 HOOSIER ENVIRONMENTAL COUNCIL
TABLE OF CONTENTS
Introduction ....................................................................................................... 5
Combined Heat & Power: An Overview ............................................................ 7
Benefits of Combined Heat & Power ........................................................................ 7
End users of CHP ........................................................................................................................ 7
Utilities and Transmission Infrastructure ................................................................................. 8
All RESIDENTS AND BUSINESSES OF INDIANA ....................................................... 8
Environmental Benefits ............................................................................................................... 8
Target Markets for Combined Heat & Power ........................................................... 9
Combined heat & Power Technology ..................................................................... 10
Topping Cycle CHP ................................................................................................................... 10
Waste Heat to Power ................................................................................................................. 11
District Energy Systems ............................................................................................................ 11
Microturbines .............................................................................................................................. 12
Reciprocating Combustion Engines ........................................................................................ 12
Biomass Opportunity Fuels ...................................................................................................... 13
The Economics of Combined Heat & Power .................................................. 14
Cost-effective for New Generation .......................................................................... 14
Cost-Effective for Emissions Reduction ................................................................. 15
An Economic Development Opportunity ................................................................ 16
Combined Heat & Power in Indiana ................................................................ 17
Current Capacity ...................................................................................................... 17
Potential Capacity .................................................................................................... 18
EPA Boiler MACT Compliance Opportunities .................................................................... 19
Economically Feasible Potential .............................................................................................. 19
Potential for export .................................................................................................................... 21
Barriers to growth .................................................................................................... 21
Franchise laws ............................................................................................................................. 22
Standby Rates .............................................................................................................................. 23
Avoided cost rates ...................................................................................................................... 23
Lack of end-user awareness & expertise ................................................................................. 24
Economic decision-making and risk thresholds .................................................................... 24
ABsence of mandatory portfolio standards ........................................................................... 24
Conclusions & Recommendations .................................................................. 25
Appendix A: Current CHP Installations in Indiana ........................................ 29
Appendix B: Indiana CHP Technical Potential ............................................... 31
Acknowledgements .......................................................................................... 33
About Hoosier Environmental Council ........................................................... 34
Received: January 30, 2015 Indiana Utility Regulatory Commission

HOOSIER ENVIRONMENTAL COUNCIL 5
INTRODUCTION
Hoosiers are entering a time of critical decisions with respect to our energy future. Historically,
affordable energy has been the centerpiece of Indiana’s economic development assets, but a number
of factors are converging to erode that competitive advantage if we continue with a business-as-usual
attitude toward energy policy.
Shifting fuel costs. Stricter regulation and other economic factors are driving the cost of
coal upward. From 2008-2013, coal prices in Indiana climbed nearly 38%.1 Compounding
coal’s price problem is the stabilization of natural gas prices with the boom in shale gas
mining. From 2008-2013, natural gas prices have dropped by over 50% and stabilized at this
level.2 Growth in shale gas, though entailing an array of its own environmental risks that
need to be addressed, is considered to be on a strong growth path for the foreseeable future.
Disproportionately rising electricity prices. Largely because of the state’s greater
historical reliance on fossil fuels, as noted above, the rate of increase in electricity prices hits
especially hard. Since 2001, electricity prices have risen by 60% in Indiana compared to 35%
on average in the United States.3 This presents a particular challenge to Indiana as energy-
intensive industries make up a large part of Indiana’s economy and job base. It also slowly
eats away at the disposable incomes of every Hoosier.
Aging infrastructure. Nearly 70% of coal-fired generation units in Indiana are over 40
years old. In 2013, the Indiana Utility Regulatory Commission estimated that by 2015, given
current regulatory trends and the age of many plants, “Indiana will need to retrofit or retire
an unprecedented wave of coal-fired generation units.”4 The changing economics of coal
compound this problem as some retrofits to older units become economically untenable.
Climate change and pollution. In 2010, according to the EPA Toxic Release Inventory,
Indiana ranked 4th in the nation for the most toxic pollution emitted. Of that, 65% came
from the electric sector. With respect to carbon dioxide, Indiana ranks 7th in carbon intensity
of the economy.5 Emissions levels are due in large part to heavy coal use, inefficiency in fuel
conversion, and the strong presence of energy-intensive industry in Indiana. Charting an
aggressive long-term strategy for reducing emissions from the electricity sector is the only
way to meaningfully address climate change and pollution in Indiana and comply with new
federal regulation.
Increased security and resilience concerns. Much attention has been drawn recently to
the strength of the electricity grid to withstand both natural and manmade disasters.
Concerns about the grid’s vulnerability to cyberterrorism are also on the rise. Some critics
attribute some of the vulnerabilities to our highly centralized electricity generation
infrastructure. A recent grid security report prepared by the Federal Energy Regulatory
Commission (FERC) indicated that nationwide grid integrity could theoretically be
1 Energy Information Administration. “Coal Data Browser.” Based on percent change in price of coal delivered
to electric power sector. Accessed 8/4/14. 2 Energy Information Administration Annual Energy Outlook 2014. Accessed 8/4/14.
3 Energy Information Administration. “Electricity Data Browser: Retail Electricity Price.” Accessed 7/1/14.
4 2013 IURC Annual Report to the Regulatory Flexibility Committee. Accessed 7/2/14. IURC estimates units
projected to retire represent 2,070 MW of generation capacity, or nearly 15% of summer-rated coal generation. 5 Metric tons of energy-related carbon dioxide emissions per million dollars of GDP. Source: Energy Information
Administration. “Table 8. Carbon Intensity of the economy by state (2000-2010).”
Received: January 30, 2015 Indiana Utility Regulatory Commission

6 HOOSIER ENVIRONMENTAL COUNCIL
compromised by simultaneous attacks on as little as nine critical substations and one
transformer manufacturing facility.6
Persistent waste. Inefficiency is not a new problem, but it represents the single biggest
opportunity to address many of the above energy challenges. Much attention is deservedly
paid to helping consumers consume less electricity through demand-side management,7 but
supply-side efficiency at the point where electricity is generated is often overlooked and
under-supported by policymakers.
State regulatory policy. Accelerated and guaranteed cost recovery mechanisms, through
more than a dozen trackers, provide generating utilities with a strong incentive to construct
new generation and associated transmission, largely free of market risks. At the same time,
artificial cost constraints keep renewable and conservation resources from the market, or at
least do not provide the same incentives. These factors, coupled with an Integrated
Resource Planning process that does not include all resources equally,8 create a persistent
discrimination against distributed, renewable and/or efficiency resources.
Combined heat and power (CHP) is an important, well-established, and highly efficient generation
technology to address each of these challenges. Indiana is perfectly suited to deepen its CHP
investment given its high concentration of energy intense industry.
Since the 1960s, efficiency in utility generation has been generally stagnant at around 33% for coal
plants.9 For every one unit of energy delivered as electricity to the consumer, two more units are
wasted through exhausted heat and energy lost in transmission and distribution.10 CHP is a family of
technologies that leverages combined generation of electricity and thermal energy to increase
efficiencies to up to 85%. Through the aggressive adoption of policies and regulations to support
CHP development in Indiana, we can lower energy costs, lower emissions, and create jobs – well
beyond a business-as-usual scenario.
6 Savenjie, Davide. “Could terrorists really black out the power grid?” Utility Dive, 3/24/14.
http://www.utilitydive.com/news/could-terrorists-really-black-out-the-power-grid/241192/. 7 According to the American Council for an Energy-Efficient Economy, demand-side efficiency is 2 to 3 times
cheaper than building new generating capacity. Source: “The Best Value for America’s Energy Dollar: A National Review of the Cost of Utility Energy Efficiency Programs.” March 2014. 8 “REPORT OF THE INDIANA UTILITY REGULATORY COMMISSION ELECTRICITY DIVISION DIRECTOR
DR. BRADLEY K. BORUM REGARDING 2013 INTEGRATED RESOURCE PLANS,” 4/30/14, at 4-6, e.g. “I&M did not allow EE to compete with supply-side resources in an optimization process over the full planning horizon.” 9 “Energy Research at DOE: Was It Worth It?” By Commission on Engineering and Technical Systems,
Committee on Benefits of DOE R&D on Energy Efficiency and Fossil Energy, Board on Energy and Environmental Systems, National Research Council, Division on Engineering and Physical Sciences, (National Academies Press 2001) at p. 123. 10
“Power Plant Efficiency,” released by the National Petroleum Council, 7/18/07. “The US fuel diversity, relative abundance of various fuels, competitive landscape, the age of industry, and focus on reliability has lead [sic] to less efficiency in our coal fleet relative to other countries...” Id. at 1.
Received: January 30, 2015 Indiana Utility Regulatory Commission

HOOSIER ENVIRONMENTAL COUNCIL 7
COMBINED HEAT & POWER: AN OVERVIEW
Typically, consumers who need electricity and thermal energy (in the form of steam or process heat)
will acquire electricity from a local utility and fire a conventional boiler with its own fuel supply to
create thermal energy. This process is used in a variety of industrial, commercial, and institutional
settings.
Combined heat and power (CHP) – also known as cogeneration – is a suite of energy technologies that utilize
one fuel source to efficiently and cleanly generate electricity and thermal energy at the same time.
Most CHP installations are onsite at facilities that require a relatively constant and predictable flow of
both electricity and thermal energy. Energy generated is most commonly consumed entirely onsite,
though in the right regulatory environment CHP can provide clean energy to the electricity grid.
Generating electricity and thermal energy separately incorporates a number of inefficiencies that cost
money and unnecessarily add more greenhouse gases to our atmosphere:
Two sources of fuel must be utilized, one at the utility
level and one to fire the boiler at the consumer’s own
facility. Both will generate heat that is exhausted and
never put to productive use. While boilers can reach 80%
efficiency, even the most efficient power plant can only
convert 45% of the energy contained in the fuel to
electricity.
An average of almost 6% of electricity generated in
Indiana is lost to the electricity grid during transmission
and distribution (T&D). In 2012, 5.79 million megawatt
hours (MWh) were lost.11 This is equivalent to the
amount of power needed for over 480,000 homes in
Indiana.12
These inefficiencies add up to a lot of waste. When electricity and thermal energy are generated
separately, the system achieves 45% efficiency at best. In other words, over half of the energy
contained in the fuels employed in the separate processes is wasted. However, when utilizing a CHP
system, waste heat is utilized to achieve as high as 80% or higher efficiency .
BENEFITS OF COMBINED HEAT & POWER
The efficiency of CHP translates to benefits for all stakeholders in the electricity market:
END USERS OF CHP
Reduced purchases of electricity from a local utility, which can lower net energy costs
Cost-effective alternative to back-up generators, which are rarely used but must be always
ready to come online and therefore cost money to maintain.13
11
U.S. Energy Information Administration. “Indiana Electricity Profile 2012 – Table 10: Supply and Disposition of Electricity, 1990- 2012”. Accessed 6/24/14. 12
U.S. Energy Information Administration. “Average monthly residential electricity consumption, prices, and bills by state.” Accessed 6/24/14.
Figure 1: CHP Process Flow Diagram
Source: Oak Ridge National Laboratory
Received: January 30, 2015 Indiana Utility Regulatory Commission

8 HOOSIER ENVIRONMENTAL COUNCIL
Additional revenue stream: if the amount of electricity generated exceeds what the facility
requires to operate, additional electricity can be sold back to the grid through power
purchasing agreements (PPA) feed-in tariffs, or by tapping into net metering.14
Increased resiliency and reliability: during Hurricane Sandy, many of the functioning
buildings with power were insulated from outages because they used CHP.
UTILITIES AND TRANSMISSION INFRASTRUCTURE
Reduce peak load and reduce need for new generating capacity.
As demand grows and transmission lines age, infrastructure upgrades are inevitable in order
to maintain infrastructure and relieve congestion. CHP can help defray some of the cost by
reducing and distributing demand on that grid. For example, Connecticut has successfully
used CHP to relieve congestion in key parts of the grid where new large-scale generation was
not feasible.15
CHP installations can be self-sufficient, providing power to critical facilities in the event of
system-wide outages. Important examples include hospital systems and university campuses.
ALL RESIDENTS AND BUSINESSES OF INDIANA
Lower cost energy solutions mean lower energy prices for everyone, including residential
customers.
Because most CHP solutions utilize natural gas and do it more efficiently than any other
generation technology, expanding CHP will help reduce coal-related pollution of Indiana’s
air and waterways. This means long-term health benefits for everyone, especially Indiana’s
children.
Commitment to the growth of CHP in Indiana will create jobs to support the manufacture,
installation, and maintenance of CHP systems. Indiana is already home to firms that
manufacture CHP equipment, including Cummins, Rolls Royce, and Caterpillar. Driving
demand here will be a tool for attracting more of their business and jobs to our state.
ENVIRONMENTAL BENEFITS
In addition to economic and resilience benefits, higher efficiency through CHP results in avoided
emissions of CO2 and other toxic air pollutants (TAPs) such as mercury, sulfur dioxide, and NOx.
Because of Indiana’s dependence on coal, which makes up over 85% of Indiana’s electricity supply16,
Indiana has some of the highest emissions levels in the United States. In 2010, according to the EPA
Toxic Release Inventory, Indiana had the 4th highest emissions levels in the nation. Of that, 65% came
from the electric sector. With respect to carbon dioxide, Indiana has the 4th most carbon-intensive
energy supply in the country.17
14
It is important to note that this capability is just as much a function of the capacity of the system and the user’s needs as it is a function of a regulatory environment that is supportive of CHP. 15
Hampson, Anne and Jessica Rackley. “From Threat to Asset – How CHP Can Benefit Utilities.” p. 7, 2014. 16
Energy Information Administration. “State Energy Profile – Indiana Net Electricity Generation by Source, April 2014.” Accessed 7/20/14.
17 Energy Information Administration. “Table 7: Carbon intensity of the energy supply by state 2000-2010.”
Accessed 07/10/14.
Received: January 30, 2015 Indiana Utility Regulatory Commission

HOOSIER ENVIRONMENTAL COUNCIL 9
CHP has the potential to not only accelerate a shift away from coal, but also drastically reduce users’
fuel consumption. Figure 2 illustrates a substantial savings in fuel and emissions when replacing a
typical separate heat and power generation scenario with natural gas-fired CHP. The emissions
reductions rise substantially when replacing fossil fuels with renewable fuels such as landfill gas or
biogas created in an anaerobic digester.
TARGET MARKETS FOR COMBINED HEAT & POWER
CHP can be implemented in a wide variety of settings, including18:
Industrial facilities are the primary users of CHP currently and also have the largest potential for
growth. This is particularly true in Indiana, where industry occupies a larger share of energy
consumption and the economy relative to other states.
Outside of industry, heat generated in a CHP system can be applied to:
Space heating/cooling
Hot water or chilled water
Steam for sterilization (in hospitals or kitchens)
Food processing, where reliable power and hot water are essential to food safety.19
18
Department of Energy Midwest CHP Technical Assistance Partnerships. http://www.midwestchptap.org/markets/. 19
See http://chpassociation.org/uses-of-chp/
COMMERCIAL Data centers Hotels and casinos Multi-family housing Laundries Apartments Office buildings Refrigerated warehouses Restaurants Supermarkets Green buildings
INDUSTRIAL Chemical manufacturing Ethanol Food processing Natural gas pipelines Petrochemicals Pharmaceuticals Pulp and paper Refining Rubber and plastics
INSTITUTIONAL Hospitals Landfills Universities & colleges Wastewater treatment plants Correctional facilities Wood waste (biomass)
Firgure 2: Increased Efficiency Results in Reduced Carbon Emissions
Received: January 30, 2015 Indiana Utility Regulatory Commission

10 HOOSIER ENVIRONMENTAL COUNCIL
Generally speaking, the CHP market exists in three categories20:
Small-scale thermally matched CHP (less than 20 MW): CHP that meets onsite needs for
steam and electricity. At this scale, adopters are less energy-intense industry, commercial facilities
(e.g. office parks) and institutions such as universities.
Heavy Industrial: Energy-intense industry is historically the biggest market for CHP and
includes sectors such as chemical manufacturing, metals manufacturing, and fossil fuel refining.
Onsite use is the primary focus.
Export scale: Changes in electricity prices, electricity market deregulation, and environmental
regulation are driving increased interest in CHP facilities that generate excess electricity to be sold
on the grid.
COMBINED HEAT & POWER TECHNOLOGY
CHP is not new or untested technology; in fact, the first commercial power plant built by Thomas
Edison in 1892 generated electricity and heated surrounding buildings using waste heat from the
plant’s exhaust.21
One of the primary benefits of CHP is that it is flexible and scalable to meet the specific needs of the
user and that it integrates with existing facilities. While most systems use natural gas, CHP can also
take a variety of different fuels including biomass, biogas, landfill gas,22 other waste products,
propane, steam, and coal23.
TOPPING CYCLE CHP
In a topping cycle CHP
configuration, fuel is
combusted in a prime mover
(the device that powers the
generator, for example, a gas
turbine or reciprocating
engine) to generate electricity.
Excess heat is then routed
through a heat recovery unit
to generate steam or hot
water rather than releasing it
through exhaust or some
cooling process.
There are alternative topping cycle configurations, such as using fuel to fire a boiler and employ a
steam turbine to generate electricity. The end result of recycling the excess heat is the same, to wit:
capturing and using energy that otherwise would be lost.
20
ICF International. “CHP Industry – Status Update.” CHPA Annual Meeting, 12/10/13. 21
Department of Energy. “Top 10 Things You Didn’t Know About Combined Heat and Power.” Accessed 6/24/14. 22
The three terms have sometimes overlapping meaning. Biomass refers to raw materials produced directly for energy use, such as sawgrass or wood residue. Biogas refers to gas produced from plant or animal waste through a digestion or fermentation process. Landfill gas is a type of biogas produced from landfills. 23
These examples do not constitute a wholesale endorsement of these fuels.
Figure 3.
Topping Cycle CHP
Received: January 30, 2015 Indiana Utility Regulatory Commission
HOOSIER ENVIRONMENTAL COUNCIL 11
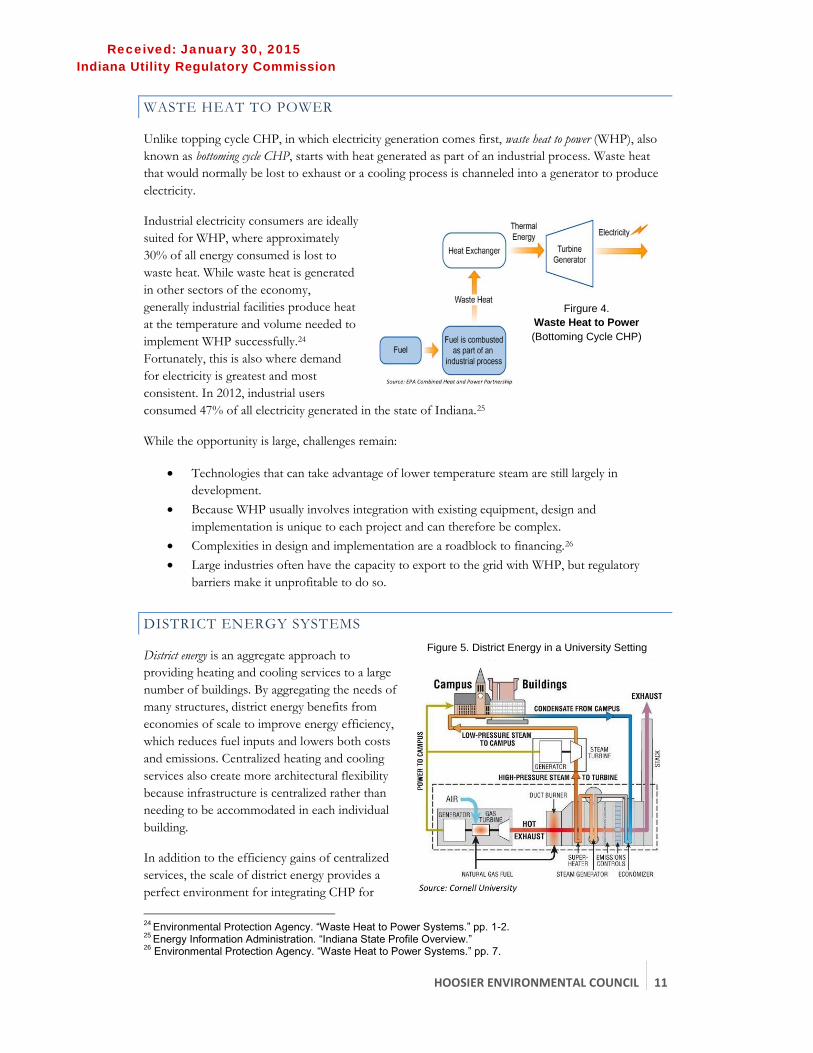
WASTE HEAT TO POWER
Unlike topping cycle CHP, in which electricity generation comes first, waste heat to power (WHP), also
known as bottoming cycle CHP, starts with heat generated as part of an industrial process. Waste heat
that would normally be lost to exhaust or a cooling process is channeled into a generator to produce
electricity.
Industrial electricity consumers are ideally
suited for WHP, where approximately
30% of all energy consumed is lost to
waste heat. While waste heat is generated
in other sectors of the economy,
generally industrial facilities produce heat
at the temperature and volume needed to
implement WHP successfully.24
Fortunately, this is also where demand
for electricity is greatest and most
consistent. In 2012, industrial users
consumed 47% of all electricity generated in the state of Indiana.25
While the opportunity is large, challenges remain:
Technologies that can take advantage of lower temperature steam are still largely in
development.
Because WHP usually involves integration with existing equipment, design and
implementation is unique to each project and can therefore be complex.
Complexities in design and implementation are a roadblock to financing.26
Large industries often have the capacity to export to the grid with WHP, but regulatory
barriers make it unprofitable to do so.
DISTRICT ENERGY SYSTEMS
District energy is an aggregate approach to
providing heating and cooling services to a large
number of buildings. By aggregating the needs of
many structures, district energy benefits from
economies of scale to improve energy efficiency,
which reduces fuel inputs and lowers both costs
and emissions. Centralized heating and cooling
services also create more architectural flexibility
because infrastructure is centralized rather than
needing to be accommodated in each individual
building.
In addition to the efficiency gains of centralized
services, the scale of district energy provides a
perfect environment for integrating CHP for
24
Environmental Protection Agency. “Waste Heat to Power Systems.” pp. 1-2. 25
Energy Information Administration. “Indiana State Profile Overview.” 26
Environmental Protection Agency. “Waste Heat to Power Systems.” pp. 7.
Firgure 4.
Waste Heat to Power
(Bottoming Cycle CHP)
Figure 5. District Energy in a University Setting
Received: January 30, 2015 Indiana Utility Regulatory Commission

12 HOOSIER ENVIRONMENTAL COUNCIL
generating electricity with waste heat, realizing further savings for users.
District energy is well suited to a variety of applications such as downtown business districts,
university campuses, and hospitals. According to the International District Energy Association, there
are 23 district energy systems operating in Indiana today. However, only 5 incorporate CHP
technology.27 Targeting adoption of CHP in existing district energy systems and incentivizing the
development of new district energy is one opportunity for CHP growth outside of the industrial
sector.
MICROTURBINES
Microturbines are a relatively new type of natural gas turbine that operate at capacity levels of 30 to 250
kW, whereas conventional turbine sizes range from 500 kW to 250 megawatts (MW). Microturbines
are well suited for distributed CHP applications due to their ability to accept a variety of fuels and
connection methods, their ability to link in parallel to manage larger loads, their reliability, and their
relatively low emissions.28
Because of these advantages and compatibility with small capacity needs, microturbines have made
up40% of new CHP installations in Indiana since becoming commercially available in 2000. The
disadvantages of microturbines come with higher cost and lower efficiency relative to reciprocating
engines (described below).
RECIPROCATING COMBUSTION ENGINES
Reciprocating engines are used in a variety of applications from automobiles to lawn care equipment and
power generation, including CHP. Though they can accept a variety of fuels, reciprocating engines are
– due to emissions concerns – ones that generally use natural gas-powered spark ignition. Engine sizes
range from a few kilowatts up to 5 MW. This allows CHP to be deployed efficiently in smaller
installations where other technologies may not be successful. It has been utilized, for instance, in
landfill gas operations.29
Fast installation, reliability, black start capability, high efficiency, and cost are the primary advantages
of reciprocating engines. Start-up costs are cheaper than microturbines and conventional gas turbines.
27
International District Energy Association provided a detailed DE locations spreadsheet. 28
Environmental Protection Agency. “Catalog of CHP Technologies.” p. 45. 29
http://energy.gov/sites/prod/files/2013/11/f5/chp_engine.pdf
Figure 6. Microturbine-base CHP (Single-Shaft Design)
Source: EPA Combined Heat and Power Partnership
Received: January 30, 2015 Indiana Utility Regulatory Commission

HOOSIER ENVIRONMENTAL COUNCIL 13
Figure 7. Anaerobic Digester, CHP, and District Heating
Additionally, at capacities below 1 MW, reciprocating engines can regularly achieve 75-80% efficiency,
some of the highest levels possible for CHP.30
BIOMASS OPPORTUNITY FUELS
Because CHP is centered on generating both electricity and thermal energy at high temperatures, it is
incompatible or impractical with most renewable energy sources. The primary class of renewable fuels
are biomass opportunity fuels, which are processed waste materials resulting from some industrial or
agricultural process. This includes:
Biogas created from
processed agriculture
waste through
anaerobic digestion
Black liquor (pulping
process byproduct).
Municipal solid waste
Food processing waste
Landfill gas
Wastewater sludge31
Indiana businesses have already
recognized the potential for
sustainable biomass CHP in
Indiana. In the last decade, 70% of new CHP installations in Indiana were biomass, employing
agricultural waste, landfill gas, wastewater sludge, and food processing waste. In total, biomass CHP
totals 23 MW of capacity in Indiana, with another 14 MW in the final stages of development.32
30
Environmental Protection Agency. “Catalog of CHP Technologies.” pp. 69-71. 31
Environmental Protection Agency. “Combined Heat and Power Partnership: Biomass CHP.” Accessed 6/25/14.
32 GM News. "GM Announces $24 million Landfill Gas Investment: Will be first automaker in North America to generate its own electricity." Accessed 6/25/14.
Figure 6. Microturbine-base CHP (Single-Shaft Design)
Source: EPA Combined Heat and Power Partnership
Received: January 30, 2015 Indiana Utility Regulatory Commission

14 HOOSIER ENVIRONMENTAL COUNCIL
THE ECONOMICS OF COMBINED HEAT & POWER
Combined heat and power is not only cleaner and efficient, but also cost-effective for new generation
capacity and for the purposes of emissions reduction. Additionally, fostering CHP growth will open
up new economic development opportunities and jobs for the state of Indiana.
COST-EFFECTIVE FOR NEW GENERATION
As imminent coal generation retirements come due in the next decade, Indiana utilities will need to
build new generation in the most cost-effective manner available. While coal is still plentiful in
Indiana, its use will continue to decrease. Costs of construction for traditional coal generation
continue to rise due to high construction levels globally, tightness in equipment and engineering
markets, high prices for raw materials, and
pollution control requirements.33 At the
same time, new coal technologies such as
carbon capture and sequestration remain
limited to a few utility-scale projects and are
therefore prohibitively expensive.
Combined heat and power, however,
becomes especially cost-effective at larger
capacity. As Table 1 illustrates, initial
construction costs are slightly more
expensive than advanced natural gas (the
most probable competitor to CHP), but
higher efficiencies resulting in lower fuel
use bring the levelized cost of delivered electricity down to be cheaper than natural gas power-only
generation. CHP also has the additional advantage of being able to accept a variety of fuels, a feature
that functions as a cushion should natural gas prices return to the volatility seen prior to the shale gas
boom.
CHP depends on a number of technical and economic factors to be competitive:
TECHNICAL FACTORS
Scale. CHP is especially competitive at larger capacities of 10 MW or greater, generally
speaking.
Capacity Factor. For CHP to compete at small scale, capacity factors must be fairly high
(above 60%).
Load parity. Any CHP system derives its maximum efficiency from matching as closely as
possible the demand for thermal energy and electricity. If a user needs much more of one or
the other, it will produce excess steam or excess electricity. While this problem can be
mitigated through supplying excess steam or electricity to another party (such as a
neighboring facility or the grid), this entails another layer of complexity and therefore is an
important consideration.
33
Oak Ridge National Laboratory. “Combined Heat and Power: Effective Energy Solutions for a Sustainable Future.” 2008.
Table 1. Levelized Cost of Generation
Generation Type Capital Costs
($/kW)
Levelized Cost of Electricity (cents/kWh)
Dual Unit Advanced PC $3,246 9.6
Dual Unit IGCC $2,934 11.6
Single Unit IGCC with CCS $6,599 14.7
Advanced NGCC $1,023 6.4
Advanced NG CT $676 12.8
NG CHP (> 40 MW) $1,300 6.0
Onshore Wind $2,213 8.0
Solar PV $3,873 13.0
Source: EIA; Bloomberg New Energy Finance
Received: January 30, 2015 Indiana Utility Regulatory Commission

HOOSIER ENVIRONMENTAL COUNCIL 15
ECONOMIC FACTORS
High retail price of electricity. While Indiana continues to have affordable electricity
relative to many states, we find ourselves in a rising cost environment. Since 2001, Indiana
has fallen from 6th to 15th in the energy price rankings, eroding some of our competitive
edge. In that time, electricity prices have risen by over 60% compared to 35% overall in the
United States. Rising prices, of course, impact every sector of our economy and residential
consumers, not just industrial users.34
Longer payback periods. While utilities have a long history of accepting a 15 or 20-year
payback period, industrial users look for a much shorter payback period, which proves to be
a barrier for CHP. Policies that help industrial users reduce their payback period or
encourage the growth of CHP installations owned by utilities or private generators can lower
this barrier.
COST-EFFECTIVE FOR EMISSIONS REDUCTION
Given current regulatory trends, cost-effective solutions for emissions reduction are becoming
increasingly important. While demand-side efficiency is still by far the cheapest form of clean energy,
CHP also exhibits a negative cost of abatement, which means that, in the long term, an investment in
CHP is a profitable investment for the user, with the added bonus of being a source of emissions
reduction.
Importantly, as Figure 8 illustrates, CHP is more cost-effective than many CO2 abatement
technologies that get much more attention in the mainstream, including on-shore wind, concentrated
solar (Solar CSP), nuclear, and coal with carbon capture and sequestration (CCS).35 While multiple
resources have a place in a robust, diverse energy portfolio, Table 2 sheds light on the particular
generation and emissions reduction capabilities of CHP and several other generation technologies.
The effectiveness of CHP for emissions reduction is partially due to the high capacity factor of a cost-
effective CHP installation. Because a CHP system operates almost constantly (up to 85% of the time),
34
Energy Information Administration. “Electricity Data Browser - Average retail price of electricity dataset.” http://www.eia.gov/electricity/data/browser/. Accessed 6/23/14. 35
Oak Ridge National Laboratory. “Combined Heat and Power: Effective Energy Solutions for a Sustainable Future.” 2008. Original Data Source: McKinsey & Co. CO2 Abatement Cost Curve.
Figure 8. Cost of CO2 Reduction Technologies
Received: January 30, 2015 Indiana Utility Regulatory Commission

16 HOOSIER ENVIRONMENTAL COUNCIL
it can result in much higher emissions reductions than similarly-sized solar and wind installations,
which only generate power 25-35% of the time, 36 as seen in Table 2.
Table 2: CHP Energy and CO2 Savings Potential
Category 10 MW CHP 10 MW PV 10 MW Wind Combined Cycle (10 MW Portion)
Annual Capacity Factor 85% 22% 34% 70%
Annual Electricity 74,446 MWh 19,272 MWh 29,784 MWh 61,320 MWh
Annual Useful Heat 103,417 MWht None None None
Footprint Required 6,000 sq ft 1,740,000 sq ft 76,000 sq ft N/A
Capital Costs $20 million $60.5 million $24.4 million $10 million
Annual Energy Savings 308,100 MMBTU 196,462 MMBTU 303,623 MMBTU 154,649 MMBTU
Annual CO2 Savings 42,751 Tons 17,887 Tons 27,644 Tons 28,172 Tons
Annual NOx Savings 59.4 Tons 16.2 Tons 24.9 Tons 39.3 Tons
The values in TABLE 2 are based on:
10 MW Gas Turbine CHP - 28% electric efficiency, 68% total CHP efficiency, 15 ppm NOx emissions
Capacity factors and capital costs for PV and Wind based on utility systems in DOE’s Advanced Energy Outlook 2011
Capital cost and efficiency for natural gas combined cycle system based on Advanced Energy Outlook 2011 (540 MW system proportioned to 10 MW of output), NGCC 48% electric efficiency, NOx emissions 9 ppm
CHP, PV, Wind and NGCC electricity displaces National All Fossil Average Generation resources (eGRID 2012) - 9,572 Btu/kWh, 1,743 lbs CO2/MWh, 1.5708 lbs NOx/MWh, 6.5% T&D losses; CHP thermal output displaces 80% efficient on-site natural gas boiler with 0.1 lb/MMBTU NOx emissions
AN ECONOMIC DEVELOPMENT OPPORTUNITY
CHP presents an opportunity to lower costs for existing businesses and drive the creation of new jobs
to support a growing CHP industry.
Implementing CHP is first and foremost a business decision. In the right economic conditions, a
properly configured CHP system will save the user money by efficiently and reliably producing
electricity onsite at a lower price than the local utility. This frees up money for firms to stay in
business, expand operations, or hire more employees. In the right regulatory environment, businesses
can even create a new revenue stream by selling excess electricity to the grid or excess steam to a
neighboring facility.
In addition to being a boon to the end consumers of energy, investing in the growth of CHP will
drive growth of firms that manufacture, construct, operate, and maintain CHP systems. A national
study of the CHP opportunity in 2008 predicted that increasing CHP from 9% to 20% as a share of
total national capacity could create as many as 1 million new jobs.37. Indiana is already home to several
firms, including Caterpillar, which manufactures a large portion of their CHP product line in Indiana.
Given its strong manufacturing base and ample opportunity for CHP within the state itself, Indiana is
ideally positioned to capitalize on a growing CHP industry and create more quality jobs for Hoosiers.
36
Department of Energy and Environmental Protection Agency. “Combined Heat and Power: A Clean Energy Solution.” Accessed 6/22/14 (DOE/EPA CHP Report)/
37 DOE/EPA CHP Report.
Received: January 30, 2015 Indiana Utility Regulatory Commission

HOOSIER ENVIRONMENTAL COUNCIL 17
COMBINED HEAT & POWER IN INDIANA
CURRENT CAPACITY
Combined heat and power has been used in Indiana in some form since at least 1925 when
Indianapolis began utilizing district energy, with CHP, for heating and cooling downtown. Today,
Indiana has nearly 2,300 MW of capacity installed38, accounting for 8.4%39 of capacity and 9.3%40 of
generation.
While 71% of CHP in the United States
uses natural gas as its primary fuel,
Indiana’s fuel mix relies in almost equal
parts on coal (38%), natural gas (34%),
and waste products (27%).41 The heavier
reliance on fuels other than natural gas
can be explained primarily by two
factors:
Age of CHP fleet. 85% of
capacity in Indiana is over 30
years old. Given historically
volatile natural gas prices, the
abundance of cheap, locally
mined coal, and more lax environmental requirements, coal was likely the more economically
competitive fuel in Indiana for CHP when most of these systems came online. The last CHP
facility to be designed for coal came online in 1985.42
Steel industry CHP use. In Indiana, 63% of CHP is deployed in the metals industry.43 70%
of steel production worldwide uses coal converted to coke as an essential step in the
fabrication process.44 Additionally, several steps in the steelmaking process generate large
amounts of excess heat and other waste byproducts, which are ideal fuels for CHP
integration.
While early CHP development in Indiana was dominated by deployments in industrial settings with
large thermal loads, the last decade in CHP development in Indiana has seen a strong shift toward
small- and medium-scale CHP using biomass as fuel. 70% of new CHP deployments in the last
decade have been biomass.45
38
ICF International. “Combined Heat and Power Installation Database.” http://www.eea-inc.com/chpdata/. Accessed 7/11/14.
39 Energy Information Administration. “Indiana State Electricity Profile.” Accessed 8/5/14.
40 Energy Information Administration. “Electricity Data Browser: Net Generation.” Accessed 8/5/14.
41 All data sourced from ICF International’s Installed CHP Database. Waste products include: Waste, Waste Heat, MSW, Black Liquor, Blast Furnace Gas, Petroleum Coke, Process Gas.
42 ICF International. “Combined Heat and Power Installation Database.” http://www.eea-inc.com/chpdata/. Accessed 7/11/14.
43 ICF International. “Combined Heat and Power Installation Database.” http://www.eea-inc.com/chpdata/. Accessed 7/11/14.
44 World Coal Association. http://www.worldcoal.org/coal/uses-of-coal/coal-steel/. Accessed 7/14/14.
45 ICF International. “Combined Heat and Power Installation Database.” http://www.eea-inc.com/chpdata/.
Accessed 7/11/14.
Table 3. Indiana CHP Capacity by Sector
Sector Capacity (GW) # of Facilities % of Total
Metals 1431840 9 63.17%
Refining 665600 1 29.37%
Educational Institutions 81730 6 3.61%
Food Processing 26600 4 1.17%
District Energy 20000 1 0.88%
Manufacturing 19070 3 0.84%
Waste 6760 3 0.30%
Agriculture 6350 5 0.28%
Chemicals 4875 1 0.22%
Healthcare 3493 2 0.15%
Commercial 250 3 0.01%
Received: January 30, 2015 Indiana Utility Regulatory Commission

18 HOOSIER ENVIRONMENTAL COUNCIL
Looking ahead, Indiana has at least 80 MW of
CHP capacity coming online in the next several
years. SABIC Innovative Plastics is
constructing an 80 MW CHP natural gas facility
at their Mount Vernon manufacturing plant.
According to the company, SABIC has been
considering cogeneration for some time, but it
began to make economic sense with the
introduction of new EPA rules limiting emissions
from industrial boilers.46
See Appendix A for a detailed table of every CHP
installation in Indiana.
POTENTIAL CAPACITY
The potential capacity for CHP in Indiana is a
subject of some confusion and debate. Different
sources cite a wide range of estimates depending
on the assumptions and constraints that are
applied to the analysis. Generally speaking, all
estimates agree that technical potential in the
industrial and commercial sectors amounts to
over 2700 MW.47
In comparing the variety of CHP potential estimates in current literature, it is valuable to keep in mind
the following key points:
Almost all CHP potential estimates in literature today are sourced from ICF International,
which uses a proprietary suite of analytics tools. Most estimates, therefore, come from the
same source, but vary based on assumptions and constraints.
o Technical capacity only considers the technical compatibility of a facility with CHP
technology based on the site’s thermal and electricity needs. This type of analysis
ignores the economic feasibility of the capacity.
o Most analyses only estimate potential capacity based on onsite electricity needs. For
example, if the thermal load of a facility could potentially generate power in excess
of the facility’s electrical needs, the potential capacity estimate is constrained to the
electrical needs of the facility.
For the purpose of this paper, we consider ICF internal estimates from 2014 as the most current and
comprehensive estimate of CHP potential in Indiana. This data includes analysis that allows for
export of power to the grid, which greatly increases estimated potential capacity. Appendix B contains
this data as well as a summary of other estimates that can be found in current literature.
46
Evansville Courier & Press. “SABIC’s power plans will cost Vectren some business.” Published 12/3/2013. Accessed 7/14/14.
47 See Appendix B for detailed data. This potential capacity is based on technical feasibility and only considers onsite use of generation.
In December 2013, General Motors announced a $24 million
investment to expand its use of landfill gas CHP at its Fort
Wayne, Indiana and Orion, Michigan manufacturing plants.
This investment was part of a larger GM commitment to
increase renewable energy use to 125 MW by 2020. The
expansion in Fort Wayne came online in June; the CHP
plants will save $10 million a year in energy costs and reduce
carbon dioxide emissions by over 89,000 metric tons a year
(equivalent to the emissions of 18,542 passenger vehicles).1
Fort Wayne Landfill gas CHP facility (Photo credit: wane.com)
Received: January 30, 2015 Indiana Utility Regulatory Commission

HOOSIER ENVIRONMENTAL COUNCIL 19
EPA BOILER MACT COMPLIANCE OPPORTUNITIES
In addition to overall CHP potential capacity estimates, we also consider current literature that
analyzes potential for CHP as an EPA Boiler MACT (Maximum Available Control Technology)
compliance strategy.
On December 20, 2012, the EPA finalized new rules regulating air pollution from industrial boilers.
Operators of boilers have until January 31, 2016 to comply, with the option to request an additional
year extension.
The EPA Boiler MACT allows for a number of different compliance strategies and will be most
challenging and expensive for owners of coal and oil-fired boilers. In this scenario, conversion to
natural gas is an attractive option. Though the capital investment is high for this approach, it brings
the boiler immediately into compliance, requiring no further action on the part of the owner other
than periodic tune-ups.
For firms considering a switch to natural gas, implementing CHP at the same time represents a
potential opportunity to turn compliance costs into an investment with a decent payback. The
Department of Energy’s Midwest CHP Technical Assistance Partnership assists affected boiler
operators in assessing whether CHP is a feasible investment as part of their Boiler MACT Compliance
strategy. Additionally, private CHP developers48 often offer a free screening.
In Indiana, it is estimated that 67 coal and oil boilers totaling 15,186 MMBTU/hr are affected by the
regulation.49 Replacing the affected boiler units with natural gas boilers and waste heat recovery CHP
would avoid 8.8 million metric tons of CO2. 50
ECONOMICALLY FEASIBLE POTENTIAL
Understanding technical potential for CHP is useful for characterizing the full scope of the CHP
market, but does not consider the many factors that affect the feasibility of a CHP project, including:
Payback period
Availability of capital within a corporate or institutional system51
48
Rolls-Royce, Cummins and Caterpillar are corporations with Indiana ties that are active in CHP development. 49
Cuttica, John. “Combined Heat and Power as a Boiler MACT Compliance Strategy.” Midwest Energy Efficiency Alliance Webinar Series. 1/30/13. http://www.midwestchptap.org/events/PDF/MEEA_Cuttica2013Jan30.pdf. Accessed 7/22/14. Data source: ICF International. 50
Id. 51
“Combined Heat and Power for Industrial Revitalization,” Center for Clean Air Policy, July 2013. The up-front capital expenditures to install CHP systems can pose a barrier even when the investment is expected to be
Table 4. CHP as a Compliance Strategy for EPA’s Boiler MACT
Fuel Type # of Boilers Total
Capacity (MMBTU/hr)
CHP Potential
(MW)*
CO2 Emissions Savings (MMT)**
Equivalent to # of cars taken off the
road
Coal 38 10,128 1012 6.4 1,347,368
Oil 29 5058 506 2.4 505,263
Total 67 15,186 1518 8.8 1,852,631
* CHP potential based on average efficiency of affected boilers of 75%; Average annual load factor of 65%, and simple cycle gas turbine CHP performance (power to heat ratio = 0.7)
** GHG emissions savings based on 8000 operating hours for coal and 6000 hours for oil, with a CHP electric efficiency of 32%, and displacing average fossil fuel central station generation
*** Calculated using EPA’s Greenhouse Gas Equivalencies Calculator (http://www.epa.gov/cleanenergy/energy-resources/calculator.html).
Received: January 30, 2015 Indiana Utility Regulatory Commission
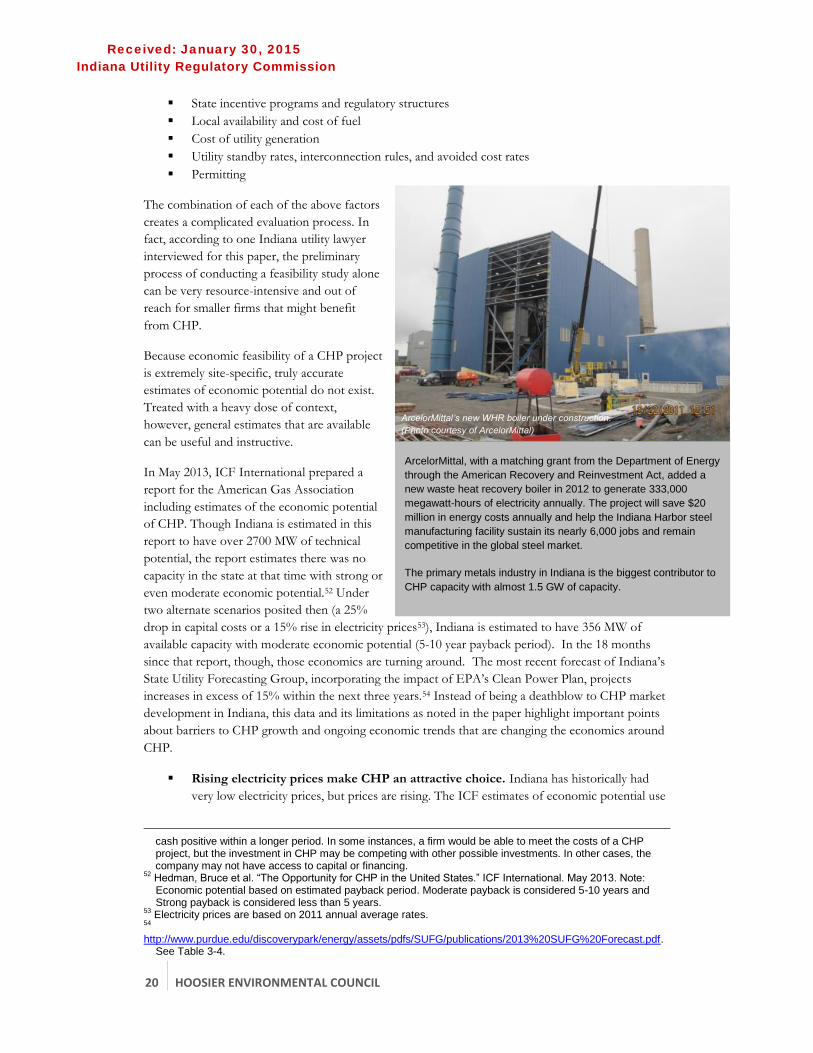
20 HOOSIER ENVIRONMENTAL COUNCIL
State incentive programs and regulatory structures
Local availability and cost of fuel
Cost of utility generation
Utility standby rates, interconnection rules, and avoided cost rates
Permitting
The combination of each of the above factors
creates a complicated evaluation process. In
fact, according to one Indiana utility lawyer
interviewed for this paper, the preliminary
process of conducting a feasibility study alone
can be very resource-intensive and out of
reach for smaller firms that might benefit
from CHP.
Because economic feasibility of a CHP project
is extremely site-specific, truly accurate
estimates of economic potential do not exist.
Treated with a heavy dose of context,
however, general estimates that are available
can be useful and instructive.
In May 2013, ICF International prepared a
report for the American Gas Association
including estimates of the economic potential
of CHP. Though Indiana is estimated in this
report to have over 2700 MW of technical
potential, the report estimates there was no
capacity in the state at that time with strong or
even moderate economic potential.52 Under
two alternate scenarios posited then (a 25%
drop in capital costs or a 15% rise in electricity prices53), Indiana is estimated to have 356 MW of
available capacity with moderate economic potential (5-10 year payback period). In the 18 months
since that report, though, those economics are turning around. The most recent forecast of Indiana’s
State Utility Forecasting Group, incorporating the impact of EPA’s Clean Power Plan, projects
increases in excess of 15% within the next three years.54 Instead of being a deathblow to CHP market
development in Indiana, this data and its limitations as noted in the paper highlight important points
about barriers to CHP growth and ongoing economic trends that are changing the economics around
CHP.
Rising electricity prices make CHP an attractive choice. Indiana has historically had
very low electricity prices, but prices are rising. The ICF estimates of economic potential use
cash positive within a longer period. In some instances, a firm would be able to meet the costs of a CHP project, but the investment in CHP may be competing with other possible investments. In other cases, the company may not have access to capital or financing. 52
Hedman, Bruce et al. “The Opportunity for CHP in the United States.” ICF International. May 2013. Note: Economic potential based on estimated payback period. Moderate payback is considered 5-10 years and Strong payback is considered less than 5 years.
53 Electricity prices are based on 2011 annual average rates.
54
http://www.purdue.edu/discoverypark/energy/assets/pdfs/SUFG/publications/2013%20SUFG%20Forecast.pdf. See Table 3-4.
ArcelorMittal, with a matching grant from the Department of Energy
through the American Recovery and Reinvestment Act, added a
new waste heat recovery boiler in 2012 to generate 333,000
megawatt-hours of electricity annually. The project will save $20
million in energy costs annually and help the Indiana Harbor steel
manufacturing facility sustain its nearly 6,000 jobs and remain
competitive in the global steel market.
The primary metals industry in Indiana is the biggest contributor to
CHP capacity with almost 1.5 GW of capacity.
ArcelorMittal’s new WHR boiler under construction.
(Photo courtesy of ArcelorMittal)
Received: January 30, 2015 Indiana Utility Regulatory Commission

HOOSIER ENVIRONMENTAL COUNCIL 21
late 2011 and early 2012 energy data. Since then, industrial electricity prices in Indiana have
risen nearly 7%55 and the SUFG projects that prices (in inflation-adjusted terms?) will
continue by over 28% by 2030.56 Under a 15% electricity price increase in this study, 356
MW becomes economically viable; rising prices, therefore, have potentially already opened
up some projects to feasible development.
The implementation of state incentives can catalyze growth. In ICF’s analysis, they do
not consider the presence of state policies or incentives to drive CHP growth, but note that
this can have significant impact. For example, the analysis determined that Oregon, like
Indiana, had no strong or moderate potential for CHP, but in-state incentives have catalyzed
CHP development in the state.
POTENTIAL FOR EXPORT
As previously noted, one serious limitation of most CHP potential studies is that capacity estimates
are scoped solely for onsite usage based on a facility’s electricity needs. If a facility has a thermal load
that could feasibly produce more electricity than the facility needs, the additional electricity generation
capacity is not considered as it cannot be used onsite.
The decision to calculate estimates in this way is partly practical. A CHP system operates most
efficiently and captures the full benefits of CHP when thermal and electric loads are matched and
when the energy generated is used onsite. Additionally, in many states, including Indiana, the prospect
of selling capacity back to the local utility is seldom a profitable enterprise.
Despite these practicalities, in the appropriate regulatory environment, tapping the potential for
export of electricity to the grid is an attractive way to provide for growing electricity demand, reduce
costly new generation costs, create a new revenue stream for industrial facilities with export capacity,
and relieve grid congestion. Most facilities with export capacity participate in energy intensive sectors
that face stiff competition overseas; the added revenue from the export of energy may make a critical
difference in their ability to operate in the United States. While this is but one factor among many in
plant longevity and success, it is the same of energy incentives that has led to the development of
special energy contracts for a system’s larger customers. ICF International data provided by the
Alliance for Industrial Efficiency estimates that accounting for export capacity could add an additional
2000 MW of technical capacity to industrial CHP potential in Indiana.57
BARRIERS TO GROWTH
Historically, Indiana has done little to specifically encourage CHP development. This can be explained
at least in part by the strong influence of the coal industry and utilities in Indiana. Most importantly,
though, low electricity prices have made CHP economically infeasible. Each year the American
Council for an Energy-Efficient Economy (ACEEE) releases a state-by-state Energy Efficiency
Scorecard broken down by topic. In 2013, Indiana scored poorly for support of CHP in every
category, with the exception of interconnection rules, which streamlines the process of connecting to
55
Energy Information Administration. “Electricity Data Browser: Average retail price of electricity.” Accessed 8/12/14.
56 Phillips, Timothy et al. “Indiana Electricity Projections: The 2013 Forecast.” State Utility Forecasting Group, December 2013. Note: Percentage reflects % change between projected industrial prices for electricity in 2014 and 2030.
57 ICF International internal estimates for Indiana, 2014. See Appendix B for data.
Received: January 30, 2015 Indiana Utility Regulatory Commission

22 HOOSIER ENVIRONMENTAL COUNCIL
the electricity grid (Table 5).
As noted in the introduction, however, the trends are reversing.
In addition to rising prices, federal policy and national attitudes
are leading to increased efforts to restrain climate-altering
emissions, most recently marked by the EPAs Clean Power Plan,
in which Indiana will be required to cut CO2 emissions from
power plants by 20%58 by 2030. These changes will necessitate
looking at how to make clean energy more affordable and
competitive. It is productive, therefore, to consider the barriers
that are preventing Indiana from leveraging the potential of CHP
as a source of clean energy.
FRANCHISE LAWS
While many states have moved forward with steps to deregulate their utility markets and create
competition to bring down electricity prices, Indiana has debated deregulation on and off over the
years with little progress. Although initial deregulation efforts in some states failed (most notably
California in the 1990s), deregulation has since helped neighboring states such as Ohio and Illinois
achieve lower electricity prices, even as Indiana rates have steadily risen59 (60% since 2001).60
Even without deregulation, there is policy and legislation in place in Indiana to allow for the
development of private generation projects, including conventional combined heat and power as well
as waste heat to power facilities. While making these kinds of projects available to non-utilities is a
critical first step, CHP in Indiana is still hindered by outdated utility regulations that afford utilities
monopoly control over their service franchise areas.
Franchise laws (in particular the Service Area Assignments Act)61 require that any non-utility wishing to
access the grid must “obtain regulatory compliance as well as contractual rights,”62 which add an extra
layer of cost and complexity that often prevent energy consumers from:
Selling excess generation to a neighboring facility
Working with other end users or other facilities within the same firm but at a different site to
aggregate demand for increased efficiency
Locating CHP facilities off-site from where the electricity is consumed63
The end result is that CHP projects are often limited to onsite generation and use. Perhaps of greatest
concern is that franchise laws eliminate competition almost entirely, giving the local utility an
inappropriate amount of influence over the ability of an energy consumer to acquire energy in the
most cost-effective manner available.
58
EPA Clean Power Plan Maps. http://cleanpowerplanmaps.epa.gov/CleanPowerPlan/. Accessed 8/5/14. 59
INDIEC. “Position Paper of Industrial Consumers on Electric Reform.” September 2013, pp. 6-8. 60
Energy Information Administration. “Electricity Data Browser: Retail Electricity Price.” Accessed 7/1/14. 61
INDIEC. “Position Paper of Industrial Consumers on Electric Reform.” September 2013, p. 17. 62
INDIEC. “Position Paper of Industrial Consumers on Electric Reform.” September 2013, p. 10. 63
INDIEC. “Position Paper of Industrial Consumers on Electric Reform.” September 2013, p. 16.
Table 5. ACEEE CHP Scorecard
Category Score
Interconnection 1
RPS/EERS Treatment 0
Net Metering 0
Incentives 0
Emissions 0.5
Financing 0
Additional Policies 0
Total 1.5/5
Received: January 30, 2015 Indiana Utility Regulatory Commission
HOOSIER ENVIRONMENTAL COUNCIL 23
STANDBY RATES
As noted above, the utility regulatory structure in Indiana creates problems for unfettered CHP
development. At the broadest level, rate of return regulation pits the utility against any project that
reduces the amount of power they sell to their consumers. It is understandable, in the traditional
approach to revenue generation, that utilities are not enthusiastic supporters of CHP development.
While a utility cannot prevent a consumer from constructing its own private generation, supporters of
CHP contend that many utilities charge unreasonable standby rates to a private generator, which can
often make or break the economics of a project. Most facilities with CHP onsite still need to
interconnect with the electric grid to provide backup power in case of a power failure onsite. Standby
rates are charged by the utility to reserve enough generation capacity for the purposes of providing
supplemental power, power during planned maintenance, and power during an unanticipated outage.
While standby rates are necessary for utilities to recoup their costs for providing such services, the
charges are often inflated by several factors:
A practice known as “demand ratcheting” unduly penalizes the user by setting standby rates
based on the peak capacity demanded by a customer during an outage. When an outage
occurs, standby rates will be “ratcheted up” based on that incident, often for as many as 12
months following the incident.64
Utilities will treat each private generator separately under the hypothetical assumption that all
could theoretically demand power at the same time. This maximizes the amount of revenue
the utility can collect, but does not reflect the truly low probability that multiple consumers
will be requiring standby power at the same time.
The end result is an unfair burden placed on all distributed generation projects, but is particularly
onerous to CHP/WHP projects, which often operate free of grid support 96% of the time.65
AVOIDED COST RATES
Under current federal and state legislation, utilities are required to buy any excess generation that a
private generator wishes to sell to the grid. However, the utility is only obligated to pay the generator
avoided cost, “the incremental costs to an electric utility of electric energy or capacity or both which, but
for the purchase from the qualifying facility or qualifying facilities, such utility would generate itself or
purchase from another source.”66 Given the economies of scale at which utilities operate, it is no
surprise that this amount is too small to make it a worthwhile venture for most CHP operators. In
fact, the avoided cost is generally estimated by the Indiana State Utility Forecasting Group to be one-
third to one-fourth the retail electricity price.67 Combined with the added complexities created by
franchise laws, this effectively kills nearly 2000 MW of potential export generation that CHP could
provide to the grid.
64
“Guide to Successful Implementation of State Combined Heat and Power Policies.” SEE Action, March 2013. 65
Midwest Cogeneration Association: Comments submitted to Indiana Utility Regulatory Commission regarding Energy Efficiency and DSM submitted to IURC, 6/9/14.
66 18 C.F.R. § 292.101(b)(6)
67 Giraldo, Juan et al. “An Assessment of the Potential for Electricity Generation in Indiana from Biogas Resources.” State Utility Forecasting Group, June 2013.
Received: January 30, 2015 Indiana Utility Regulatory Commission

24 HOOSIER ENVIRONMENTAL COUNCIL
LACK OF END-USER AWARENESS & EXPERTISE
While the federal government has regional technical assistance programs through the Department of
Energy, Indiana has no state-level effort to raise awareness about this technology.
Lack of expertise is also a barrier. Because CHP is intended to be installed onsite, most potential users
are steeped in their own industry and have little or no expertise with electricity generation. This in
turn raises the perception of risk on the part of the potential CHP operator and increases the
complexity involved in evaluating and implementing a CHP project.
ECONOMIC DECISION-MAKING AND RISK THRESHOLDS
As an energy technology that is typically employed by non-utilities, CHP often faces the problem of
mismatched priorities and payback expectations. While minimizing energy costs—particularly in
energy-intensive industries such as metals manufacturing—is of value to consumers, it is often
secondary to their core business. CHP is therefore often passed over for other investment
opportunities that are perceived to be more critical to their core business model.
Additionally, while utilities routinely make investments that they will recoup over a long period of
time (often well over a decade), most private firms do not make investments that have a payback
period of longer than a few years. Other factors that raise the perceived risk level include the
variability in natural gas prices and utility
generation prices. As such, most CHP
projects fall outside of a firm’s typical
“comfort zone.” In fact, a survey of
California businesses conducted in 2003 by
Primen, a developer of renewable energy
projects, indicates that even just a 1-year
payback period would eliminate 40% of
prospective CHP users from making the
investment (see Figure 8). Anecdotal
accounts obtained from energy managers
for several Indiana industrial companies
confirm that dynamic still exists.
ABSENCE OF MANDATORY PORTFOLIO STANDARDS
CHP growth benefits greatly from a policy environment that includes mandatory portfolio standards
that recognize the emissions savings of CHP technology through reductions in overall fuel use. Waste
heat to power, because the electricity generation often does not require any additional fuel (just waste
thermal energy), is more commonly recognized in such programs than conventional CHP.
While Indiana does have a clean energy portfolio standard that recognizes both conventional CHP
and waste heat to power, it is voluntary and has not seen any participation from utilities since its
inception in 2012. Reference to the latest Integrated Resource Plans filed by Indiana’s five Investor-
Owned Electric Utilities indicates that none included and documented CHP as an available resource.68
68
http://in.gov/iurc/2630.htm, accessed 12/1/14.
Figure 8. CHP Market Acceptance Curve
Received: January 30, 2015 Indiana Utility Regulatory Commission

HOOSIER ENVIRONMENTAL COUNCIL 25
CONCLUSIONS & RECOMMENDATIONS
Indiana, along with the rest of the world, is facing an energy future dramatically different from the
one in which it originally thrived. Some things will not change—fossil fuels will still be the dominant
source of energy in the short-to-medium term—but sustainable, efficient, and zero carbon energy
must be central in our focus as we plan for the next 50 years of energy policy and beyond.
Given our historic dependence on cheap coal, this transition may be especially challenging for Indiana
relative to other states with a more diverse energy mix. The good news is that Indiana is rich in
resources to power a clean future. One of these resources is combined heat and power technology.
CHP already makes up 8.4% (2300 MW) of installed capacity, but potential exists to more than double
this source of clean energy if we take intentional action to embrace this opportunity through policies
and regulations designed to drive CHP growth.69 This growth will catalyze economic development in
our state, creating clean energy jobs and a demand for equipment, which Indiana is well suited to
produce locally.
CHP can help Indiana to tackle the following growing energy challenges in our state:
Rising electricity prices due to aging power plants and the rising cost of coal.
The need for new generation in the face of the upcoming wave of coal plant retirements.
Increasing concern about the resiliency and security of our electricity infrastructure given
increased extreme weather events and the rise of cyberterrorism, which poses a real threat to
the grid.70
The need to lower greenhouse gas emissions to comply with federal legislation and to
mitigate climate change in the long term.
In order to usher in a new wave of CHP development, Indiana policymakers and regulators should
consider the following strategies that have been shown to be successful in other states:
The Indiana Utility Regulatory Commission (IURC) must support combined heat
and power and waste heat-to-power technology in Indiana’s new energy efficiency
program. As the state works to replace the prematurely cancelled Energizing Indiana
program, policymakers are presented with their first opportunity to make CHP development
more attractive to utilities. The Alliance for Industrial Efficiency (AIE) argues that a
revitalized plan should include:
Net metering for CHP and WHP: net metering would make generating excess capacity for
the grid economically feasible for CHP users and would benefit utilities by displacing
the need to new generation capital expenditures.
Streamlined interconnection procedures: While Indiana has received high marks from ACEEE
for interconnection standards, as AIE notes71, current rules overburden large industrial
projects. The IURC should ensure that Indiana interconnections are in line with the
Federal Energy Regulatory Commission’s Order No. 792, which is modeled after
California’s interconnection rules, providing a fast track for clean energy development.72
69
ICF International internal estimates for Indiana, 2014. See Appendix B for data 70
Finkle, Jim. “U.S. utility’s control system was hacked, says Homeland Security.” Reuters. 5/20/14. http://www.reuters.com/article/2014/05/21/us-usa-cybercrime-infrastructure-idUSBREA4J10D20140521.
71 Alliance for Industrial Efficiency: Comments submitted to Indiana Utility Regulatory Commission regarding Energy Efficiency and DSM submitted to the IURC, 6/9/14.
72 Hunt, Tam. “FERC’s New ‘Fast-Track’ Rules Will Make Clean Energy Development Easier.” http://www.greentechmedia.com/articles/read/ferc-adopts-new-california-fast-track-interconnection-rules-nationwide. 1/7/14.
Received: January 30, 2015 Indiana Utility Regulatory Commission

26 HOOSIER ENVIRONMENTAL COUNCIL
Reformed standby rates: As noted in the previous section, standby rates often represent an
insurmountable barrier to otherwise feasible CHP projects. See below for detailed
recommendations regarding standby rates.
Require a CHP feasibility study for all state-owned institutions and critical facilities.
CHP has proven a valuable asset for critical facilities in times of crisis and natural disaster.
As the frequency of extreme weather increases, equipping facilities such as hospitals, data
centers, and wastewater treatment facilities with resilient CHP that can operate during a grid
outage is increasingly important.
Provide grants for CHP feasibility studies for privately owned critical facilities (e.g.
private hospitals) or other target adopters (such as universities or landfills). In 2007,
Indiana offered a grant covering up to 50% of the study costs for biomass feasibility studies.
A CHP feasibility study grant could be modeled similarly.73
Launch state-level education and technical assistance efforts. Currently the
Department of Energy funds technical assistance efforts through regional Clean Energy
Application Centers. Indiana should augment these efforts with personnel dedicated to CHP
in Indiana. While detailed financial analysis for every potential CHP site in the state is
unrealistic, Indiana’s Office of Energy Development could follow the DOE model of
providing a basic free screening service that gives the client general guidance on whether
CHP might be an appropriate strategy for their firm. Also, OED could be especially
effective in leading a state effort to identify public facilities (such as correctional facilities,
medical centers and educational institutions) that may be attractive CHP candidates.
Leverage special financing to lower risk for potential investors. Indiana should offer
targeted incentives for clean energy development or CHP specifically. In the past there have
been state incentives targeting alternative energy, distributed energy, and biomass projects.
Unfortunately, all of these have expired. Today, some businesses have access to efficiency
rebates through their utilities and can take advantage of federal investment tax credits, but
Indiana as a state needs to lead with strong energy incentives. These projects could
generically target distributed generation or make a stronger statement by specifically targeting
CHP and waste heat-to-power.
One low-risk source of financing, primarily for public projects, is federal Qualified Energy
Conservation Bonds, which can provide very low interest rates for qualified projects. While
CHP and WHP are not explicitly covered, CHP utilizing renewable fuels (such as biomass or
landfill gas) would qualify. Other examples of successful financing programs around the
country include:
California’s Self-Generation Incentive Program was originally conceived as a peak
load reduction effort. The incentive is paid out based on the capacity of the project,
with a bonus for equipment that is sourced from California manufacturers.
Incentives are also higher for renewable energy such as biomass.
Massachusetts’s Green Communities Act offers a rebate to cover up to 50 percent
of capital costs. Utilities are incentivized to participate and invest; all kilowatt-hours
generated are counted towards their energy efficiency goals. Rebate values are
based on the quality of the project, including efficiency, cost-benefit ratio, and
project risk, ensuring the best opportunities are exploited.
73
OpenEI. “State Grant Program Database.” http://en.openei.org/wiki/State_Grant_Program. Accessed 8/9/14.
Received: January 30, 2015 Indiana Utility Regulatory Commission

HOOSIER ENVIRONMENTAL COUNCIL 27
Implement a feed-in tariff (FIT) or net metering specifically for CHP projects with
export capacity. In order to drive development of export CHP capacity, Indiana should
offer a tiered FIT that ties rates to the price of natural gas and offers premiums based on
emissions reductions and for siting projects in congested parts of the grid. This model has
been successfully implemented in California as part of Governor Brown’s Clean Energy Jobs
Program.74
One example of a successful feed-in tariff that has already benefited CHP in Indiana is
NIPSCO’s Experimental Rate Tariff 665 – Renewable Feed-In Tariff. Since its inception, the
Renewable FIT has driven 7,465 kW of biomass CHP capacity development with an
additional 6,885 kW worth of projects currently in the pipeline.75
Reform regulations for avoided cost rates and standby charges. As noted previously,
avoided cost rates are based on the marginal cost of a unit of electricity. The Midwest
Cogeneration Association offers Oregon’s avoided cost rates as an example to follow.
Avoided cost rates in Oregon are contingent on whether a utility is considered to be
resource deficient or resource sufficient. If a utility is resource deficient, avoided cost rates
incorporate long-term capital expenditures that are avoided by purchasing electricity from a
distributed generator.76
While avoided cost rates affect only the customers who are generating excess load for
export, standby charges affect every CHP generator—indeed, every distributed generation
project in the state. For this reason, reform in this area is especially needed. The State and
Local Energy Efficiency Action Network offers some useful guidelines:
Offer daily, or at least monthly, as-used demand charges for backup power and shared transmission and distribution facilities.
Reflect load diversity of CHP customers in charges for shared delivery facilities.
Allow the customer to provide the utility with a load reduction plan.
Schedule maintenance service at nonpeak times.
Provide an opportunity to purchase economic replacement power. In states with retail competition:
Allow customer-generators the option to buy all of their backup power at market prices.
In states with retail competition, offer a self-supply option for reserves.77
For Indiana, the first two points are paramount, offering a way to alleviate the effect of
ratcheted pricing and more accurately reflect the true cost of standby services to the utility.
Implement a mandatory portfolio standard that recognizes the efficiencies of CHP
and WHP. Indiana should move quickly to make the current clean energy portfolio
standard mandatory and recognize CHP and WHP as eligible technologies. Furthermore,
Indiana needs a forward-thinking demand side management program to incentivize utilities
to get on board and invest in CHP development.
74
Department of Energy and Environmental Protection Agency. “Combined Heat and Power: A Clean Energy Solution.” Accessed 6/22/14.
75 Midwest Cogeneration Association: Comments submitted to Indiana Utility Regulatory Commission regarding Energy Efficiency and DSM submitted to IURC, 6/9/14.
76 Midwest Cogeneration Association: Comments submitted to Indiana Utility Regulatory Commission regarding Energy Efficiency and DSM submitted to IURC, 6/9/14.
77 “Guide to Successful Implementation of State Combined Heat and Power Policies.” SEE Action, March 2013, p. 9.
Received: January 30, 2015 Indiana Utility Regulatory Commission

28 HOOSIER ENVIRONMENTAL COUNCIL
Take steps to reform Indiana’s franchise laws to give CHP generators more
flexibility in siting projects and using the energy. Franchise laws give inappropriate
power and influence to utilities over where private generators site their facilities and what
they do with that energy. Policymakers must find a middle ground to create space for
competition and innovation while still protecting the utilities’ ability to thrive.
As an example, Indiana Industrial Electric Consumers (INDIEC) advocates for distribution-
only rate tariffs that would allow for CHP users to affordably access the utility distribution
grid in order to sell power to a neighboring, affiliated facility. This type of rate tariff has been
available in the natural gas market since 198778; a similar measure for the electricity market
would open the door for development of CHP export capacity.
Combined heat and power is an opportunity with something for everyone, benefiting industrial and
commercial users, the electricity infrastructure, Hoosier job seekers, and the environment. This
untapped potential is a critical component to Indiana’s clean energy future.
78
INDIEC. “Position Paper of Industrial Consumers on Electric Reform.” September 2013, pp. 15-16.
Received: January 30, 2015 Indiana Utility Regulatory Commission

HOOSIER ENVIRONMENTAL COUNCIL 29
APPENDIX A: CURRENT CHP INSTALLATIONS IN INDIANA
Source: CHP Installation Database, compiled by ICF. Up to date, 2012.
Organization Name Facility Name Application Op
Year Prime Mover
Capacity (kw)
Fuel Type
Perry K Citizens Thermal
Energy District Energy 1925
Boiler/Steam Turbine
20,000 COAL
BP Amoco Chemicals Company
Whiting Refinery Refining 1928 Boiler/Steam
Turbine 665,600 NG
Colgate-Palmolive Company
Colgate-Palmolive Company
Chemicals 1940 Boiler/Steam
Turbine 4,875 NG
ArcelorMittal Steel Indiana Harbor
Works Primary Metals 1946
Boiler/Steam Turbine
55,000 WAST
Central Soya Company, Inc.
Central Soya Decatur Plant
Food Processing 1950 Boiler/Steam
Turbine 2,000 COAL
Lakeside Energy US Steel - Gary
Works Primary Metals 1951
Boiler/Steam Turbine
161,000 WAST
Univ. of Notre Dame
Notre Dame Power Plant
Colleges/Univ. 1952 Boiler/Steam
Turbine 23,100 COAL
Rolls Royce Corp Rolls Royce Corp Transportation
Equipment 1963 Combustion Turbine 15,500 BIOMASS
Lewis Cass HS Lewis Cass HS Schools 1968 Reciprocating Eng. 1,750 NG
ArcelorMittal Steel Burns Harbor Plant Primary Metals 1969 Boiler/Steam
Turbine 177,720 WAST
Purdue University Purdue University
Physical Plant Colleges/Univ. 1969
Boiler/Steam Turbine
41,800 COAL
Alcoa Generating Corporation
Alcoa Smelting & Fabrication
Primary Metals 1970 Boiler/Steam
Turbine 755,000 COAL
Caterpillar Tractor Company
Caterpillar Tractor Company
Machinery 1980 Reciprocating Eng. 3,500 OIL
Tate & Lyle Ingredients Americas
Sagamore Cogeneration Plant
Food Processing 1985 Boiler/Steam
Turbine 7,400 COAL
Energy Group Inc Covanta
Indianapolis Inc Solid Waste Facilities 1988
Boiler/Steam Turbine
6,500 WAST
St. Anthony's Medical Center
St. Anthony's Medical Center
Hospitals/Healthcare 1990 Combined Cycle 2,748 NG
Elkhart General Hospital
Elkhart General Hospital
Hospitals/Healthcare 1991 Reciprocating Eng. 745 NG
Culver Educational Foundation
Culver Educational Foundation
Facility/ Culver Military Academy
Misc. Education 1996 Reciprocating
Engine 1,050 NG
ArcelorMittal Steel
ArcelorMittal Steel / Sun Coke / North
Lake Energy Corporation
Primary Metals 1996 Waste Heat to
Power 75,000 WAST
US Steel
Midwest Steel (CHP owned by Portside Energy
LLC / Primary Energy)
Primary Metals 1997 Combined Cycle 63,000 NG
ArcelorMittal Steel Indiana Harbor Primary Metals 1998 Waste Heat to 95,000 WAST
Received: January 30, 2015 Indiana Utility Regulatory Commission

30 HOOSIER ENVIRONMENTAL COUNCIL
Works (CHP project owned by
Cokenergy / Primary Energy)
Power
Cargill, Inc. Cargill - Cerestar Food Processing 2000 Boiler/Steam
Turbine 16,000 NG
Indiana State University
Indiana State University
Colleges/Univ. 2001 Combustion Turbine 14,000 NG
Breeden YMCA / NiSource Inc.
Breeden YMCA Amusement/Recreati
on 2002 Microturbine 120 NG
ArcelorMittal Steel
Indiana Harbor Works (CHP
project owned by Ironside Energy / Primary Energy)
Primary Metals 2002 Boiler/Steam
Turbine 50,000 WAST
Stripco Inc / NiSource Inc.
Stripco Inc Primary Metals 2003 Microturbine 120 NG
Fair Oaks Dairy Fair Oaks Dairy Agriculture 2004 Reciprocating Eng. 750 BIOMASS
Herrema Dairy Herrema Dairy Agriculture 2004 Reciprocating Eng. 700 BIOMASS
Manchester Tank / NiSource Inc.
Manchester Tank Misc. Manufacturing 2005 Microturbine 70 NG
Boss #4 Dairy Boss #4 Dairy Agriculture 2005 Reciprocating Eng. 700 BIOMASS
Hidden View Dairy Hidden View Dairy Agriculture 2006 Reciprocating Eng. 900 BIOMASS
Town of Munster Centenial Park Amusement/Recreati
on 2008 Microturbine 130 BIOMASS
Munster Landfill Munster Landfill Solid Waste Facilities 2009 Microturbine 130 BIOMASS
Notre Dame Energy Center in Stinson-Remick
Hall Colleges/Univ. 2009 Microturbine 30 NG
West Lafayette Wastewater
Treatment Facility
West Lafayette Wastewater
Treatment Facility
Wastewater Treatment
2009 Microturbine 130 BIOMASS
4 Thought Energy McDonald's Restaurants 2011 Reciprocating Eng. . NG
Bio Town Ag, Inc. Bio Town Ag, Inc. Agriculture 2011 Reciprocating Eng. 3,300 BIOMASS
2G Cenergy Duck Farm Food Processing 2013 Reciprocating Eng. 1,200 BIOMASS
Total: 38 2,266,568
Received: January 30, 2015 Indiana Utility Regulatory Commission

HOOSIER ENVIRONMENTAL COUNCIL 31
APPENDIX B: INDIANA CHP TECHNICAL POTENTIAL
Source: ICF Internal Estimates, 2014.
Indiana Industrial CHP Technical Potential - Onsite
SIC Application 50-500 kW (MW)
.5-1 MW (MW)
1-5 MW (MW)
5-20 MW (MW)
>20 MW (MW)
Total MW
20 Food 22 17 52 15 174 280
22 Textiles 3 3 3 0 0 9
24 Lumber and Wood 39 21 27 6 0 93
25 Furniture 1 0 0 0 0 1
26 Paper 19 13 54 110 23 220
27 Printing 4 1 0 0 0 4
28 Chemicals 27 19 165 166 181 558
29 Petroleum Refining 0 4 16 10 0 31
30 Rubber/Misc Plastics 46 19 30 15 0 110
32 Stone/Clay/Glass 0 0 8 6 0 15
33 Primary Metals 14 23 61 21 0 119
34 Fabricated Metals 9 1 0 0 0 9
35 Machinery/Computer Equip 2 3 5 0 0 9
37 Trasportation Equip. 21.6 19 71 90 0 202
38 Instruments 1 0 0 0 0 1
39 Misc. Manufacturing 2 0 0 0 0 2
49 Gas Processing 0 0 0 0 0 0
Total 211 143 492 439 378 1,663
Indiana Industrial CHP Technical Potential - Export
SIC Application 50-500 kW (MW)
.5-1 MW (MW)
1-5 MW (MW)
5-20 MW (MW)
>20 MW (MW)
Total MW
20 Food 20 19 66 81 364 550
22 Textiles 3 3 3 0 0 9
24 Lumber and Wood 39 21 53 13 0 126
25 Furniture 1 0 0 0 0 1
26 Paper 19 13 52 120 741 945
27 Printing 1 0 0 0 0 1
28 Chemicals 28 24 130 406 429 1,018
29 Petroleum Refining 0 4 16 0 398 418
30 Rubber/Misc Plastics 47 22 35 16 0 120
32 Stone/Clay/Glass 0 0 0 0 111 111
33 Primary Metals 14 23 61 21 0 119
34 Fabricated Metals 9 1 0 0 0 10
35 Machinery/Computer Equip 2 3 5 0 0 9
37 Trasportation Equip. 21.6 19 71 90 0 202
38 Instruments 1 0 0 0 0 1
39 Misc. Manufacturing 2 0 0 0 0 2
49 Gas Processing 0 0 0 0 0 0
Total 208 153 492 747 2,043 3,643
Received: January 30, 2015 Indiana Utility Regulatory Commission

32 HOOSIER ENVIRONMENTAL COUNCIL
Indiana Commercial CHP Technical Potential
SIC Application 50-500 kW (MW)
.5-1 MW (MW)
1-5 MW (MW)
5-20 MW (MW)
>20 MW (MW) Total MW
43 Post Offices 1 1 0 0 0 2
52 Retail 44 22 6 0 0 71
4222 Refrigerated Warehouses 1 1 1 0 0 3
4581 Airports 0 2 0 10 0 12
4952 Water Treatment 4 2 0 0 0 6
5411 Food Stores 46 8 0 0 0 54
5812 Restaurants 72 3 1 0 0 75
6512 Commercial Buildings 77 270 116 0 0 463
6513 Multifamily Buildings 10 23 7 0 0 40
7011 Hotels 28 3 15 12 0 57
7211 Laundries 5 1 0 0 0 6
7374 Data Centers 4 3 3 0 0 10
7542 Car Washes 2 0 0 0 0 2
7832 Movie Theaters 0.1 0 0 0 0 0
7991 Health Clubs 6 1 0 0 0 6
7997 Golf/Country Clubs 9 0 0 0 0 9
8051 Nursing Homes 33 2 0 0 0 35
8062 Hospitals 20 22 83 16 0 141
8211 Schools 37 3 0 0 0 40
8221 College/Univ. 10 6 67 81 76 240
8412 Museums 2 1 0 0 0 3
9100 Government Buildings 26 12 16 5 0 60
9223 Prisons 2 1 36 13 0 52
9711 Military 1 1 8 14 0 24
Total 440 386 359 152 76 1,412
Other Indiana CHP Potential Estimates
Source Industrial Potential
(MW)
Commercial Potential
(MW)
Total (MW)
Year Document
Midwest DOE CHP Technical Assistance Partnership*
N/A 949 N/A 2005 Indiana CHP Market Baseline (2005)
ICF International 1663 1412 3075 Oct. 2013 PPT, Potential for CHP in Midwestern
States, October 2013
ACEEE (Sourced from ICF) 2829 238 3068 Sept. 2012 ACEEE Coal Plant Retirement Analysis**
September 2012
AGA (ICF) – Technical Potential
N/A N/A 2705 May 2013 AGA Report on CHP potential
Great Plains Institute/ACEEE (Sourced from ICF)
1480 1593 3073 2013
2013 - http://www.betterenergy.org/sites/gpisd.ne
t/files/Indiana.pdf
Average 1991 1048 3039
*Sourced from ONSITE Energy Corp. **These estimates are of current potential. ACEEE also estimates potential out to 2020 based on projected growth.
Received: January 30, 2015 Indiana Utility Regulatory Commission

HOOSIER ENVIRONMENTAL COUNCIL 33
ACKNOWLEDGEMENTS
The Hoosier Environmental Council would like to acknowledge:
Principal Author Kyle Clark-Sutton Graduate Research Assistant Hoosier Environmental Council Project Director Robert K. Johnson Energy Counsel Hoosier Environmental Council HEC expresses its appreciation to the many energy professionals, regulators and customers who provided insight and constructive criticism through formal and informal consultation.
Received: January 30, 2015 Indiana Utility Regulatory Commission

34 HOOSIER ENVIRONMENTAL COUNCIL
ABOUT HOOSIER ENVIRONMENTAL COUNCIL
The Hoosier Environmental Council (HEC) is devoted to
identifying the biggest environmental challenges facing Indiana,
and uniting people toward a solution. We use a combination of
education, advocacy, and sometimes, litigation, to address those
challenges. The result is a new vision of Indiana’s future: one of
cleaner air, safer water, more protected land, and ultimately, a
healthier, higher quality of life.
HEC is uniquely prepared to help Indiana change its old ways. Our research has already yielded
several influential policy papers on key environmental issues. We have the personnel, experience, and
technological know-how to successfully advocate for the issues most crucial to our future:
transitioning to a clean energy economy, modernizing transportation, preserving open spaces, making
farming more sustainable and healthier, and protecting our public health.
Ultimately, together, we can create a new Indiana that we can be truly proud to call “home.”
www.hecweb.org
3951 North Meridian, Suite 100
Indianapolis, IN 46208
phone: (317) 685-8800
fax: (317) 686-4794
Received: January 30, 2015 Indiana Utility Regulatory Commission