command center - investor presentation
TRANSCRIPT
OTCQB: CCNI
INVESTORPRESENTATION
March 2015
2
Safe Harbor
This presentation includes, and our officers and representatives may from time to time make, certain estimates andother forward-looking statements within the meaning of the safe harbor provisions of the U.S. Private SecuritiesLitigation Reform Act of 1995, including, among others, statements with respect to the Company’s future revenues,earnings, strategies, prospects, consequences and all other statements that are not purely historical and that mayconstitute statements of future expectation. While we believe these statements are accurate, forward-lookingstatements are not historical facts and are inherently uncertain. We cannot assure you that these expectations willoccur, and our actual results may be significantly different. Factors that may cause actual results to differ materiallyfrom those contemplated in any forward-looking statements made by us are sometimes presented within theforward-looking statements themselves or are otherwise discussed in filings we make with the United StatesSecurities and Exchange Commission (SEC), including our Annual Report on Form 10-K and subsequent reports onForm 10-Q and Form 8-K and available on our website: http://www.commandonline.com. Any forward-lookingstatement made by us in this presentation is based only on information currently available to us and speaks only as ofthe date on which it is made. The Company disclaims any obligation to update or revise any forward-lookingstatement, whether written or oral, that may be made from time to time, based on the occurrence of future events,the receipt of new information, or otherwise.
© 2015 Command Center, Inc. All Rights Reserved. The Command Center logo, along with the words and phrasesCommand Center, Command and Real Jobs for Real People are registered trademarks of Command Center, Inc.
3
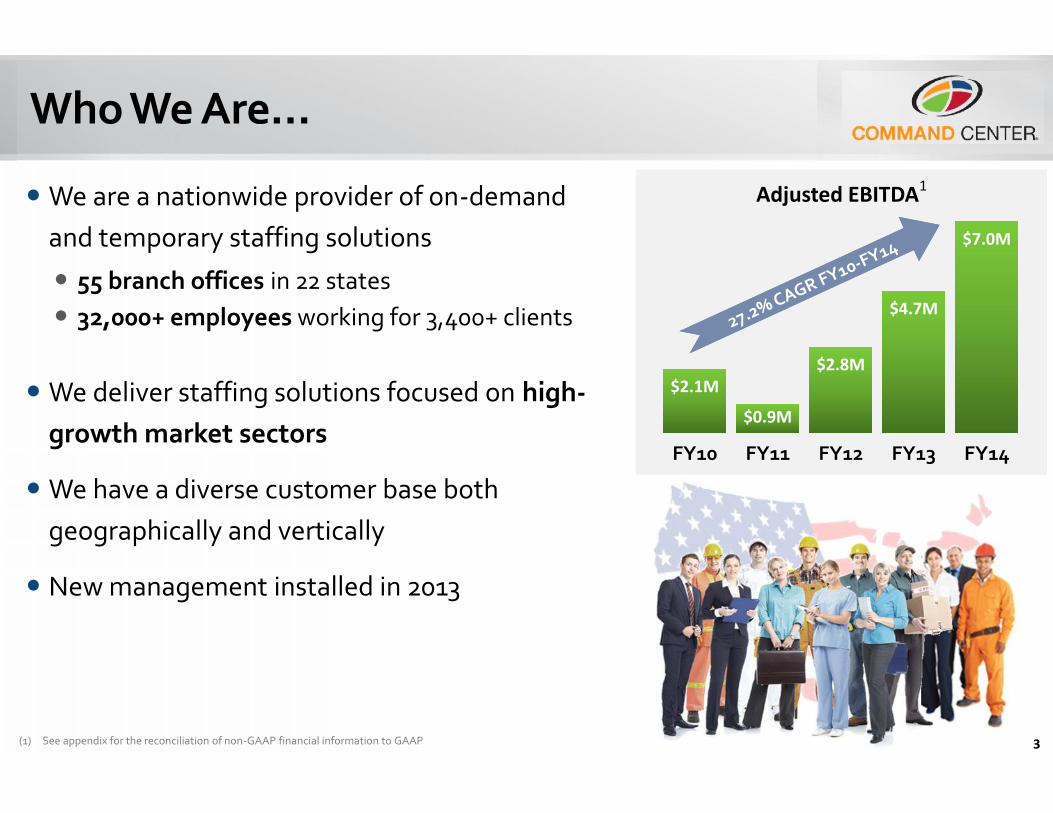
Who We Are…
We are a nationwide provider of on-demandand temporary staffing solutions 55 branch offices in 22 states 32,000+ employees working for 3,400+ clients
We deliver staffing solutions focused on high-growth market sectors
We have a diverse customer base bothgeographically and vertically
New management installed in 2013
$2.1M$0.9M
$2.8M
$4.7M
$7.0M
FY10 FY11 FY12 FY13 FY14
Adjusted EBITDA1
(1) See appendix for the reconciliation of non-GAAP financial information to GAAP
4
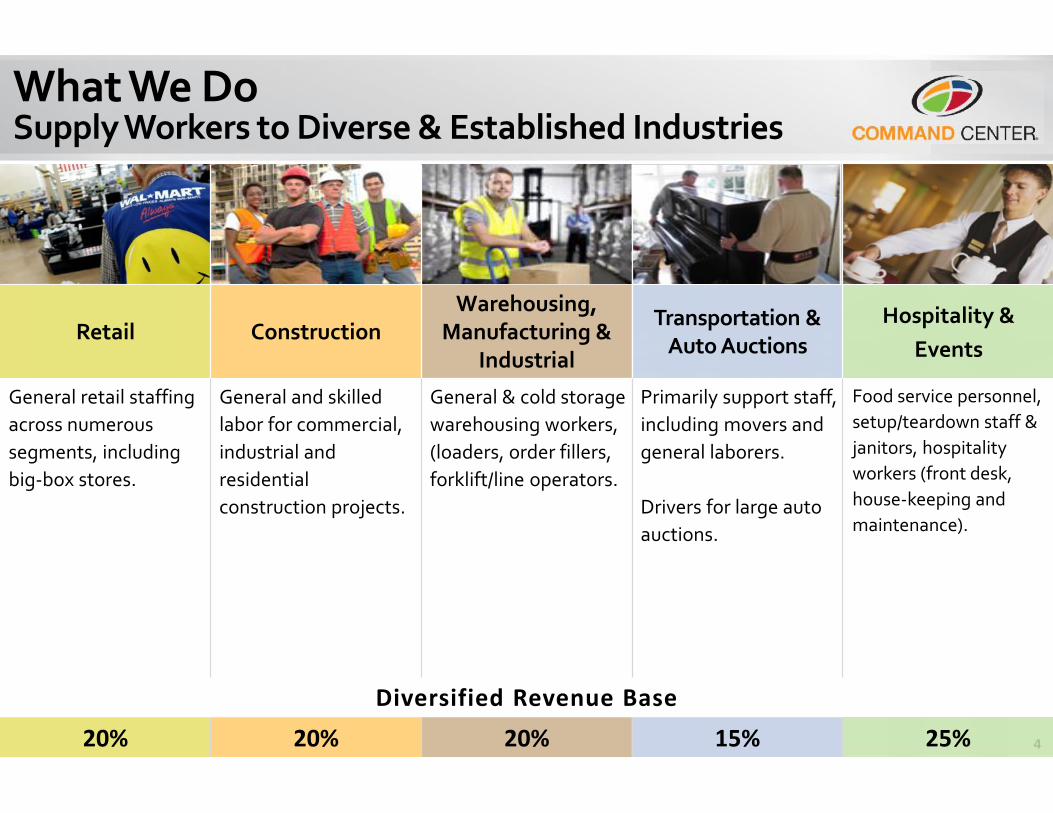
Diversified Revenue Base20% 20% 20% 15% 25%
What We DoSupply Workers to Diverse & Established Industries
Retail ConstructionWarehousing,
Manufacturing &Industrial
Transportation &Auto Auctions
Hospitality &Events
General retail staffingacross numeroussegments, includingbig-box stores.
General and skilledlabor for commercial,industrial andresidentialconstruction projects.
General & cold storagewarehousing workers,(loaders, order fillers,forklift/line operators.
Primarily support staff,including movers andgeneral laborers.
Drivers for large autoauctions.
Food service personnel,setup/teardown staff &janitors, hospitalityworkers (front desk,house-keeping andmaintenance).
5
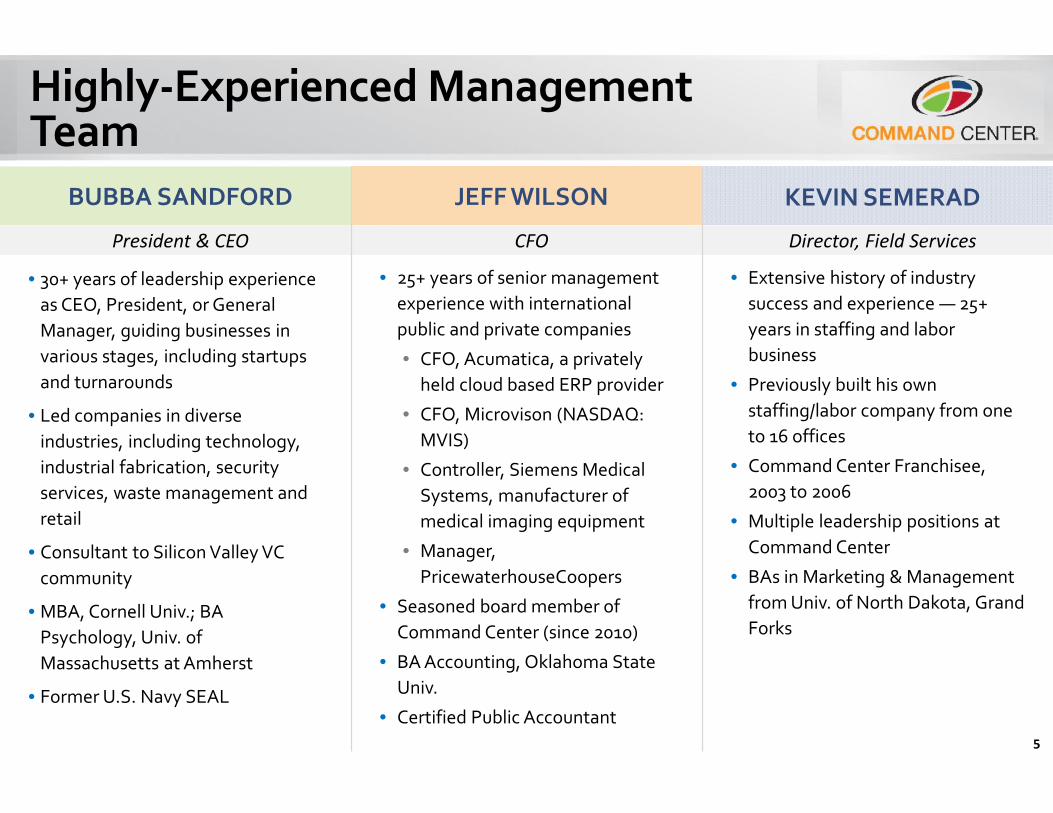
BUBBA SANDFORD JEFF WILSON KEVIN SEMERAD
President & CEO CFO Director, Field Services
• 30+ years of leadership experienceas CEO, President, or GeneralManager, guiding businesses invarious stages, including startupsand turnarounds
• Led companies in diverseindustries, including technology,industrial fabrication, securityservices, waste management andretail
• Consultant to Silicon Valley VCcommunity
• MBA, Cornell Univ.; BAPsychology, Univ. ofMassachusetts at Amherst
• Former U.S. Navy SEAL
• 25+ years of senior managementexperience with internationalpublic and private companies
• CFO, Acumatica, a privatelyheld cloud based ERP provider
• CFO, Microvison (NASDAQ:MVIS)
• Controller, Siemens MedicalSystems, manufacturer ofmedical imaging equipment
• Manager,PricewaterhouseCoopers
• Seasoned board member ofCommand Center (since 2010)
• BA Accounting, Oklahoma StateUniv.
• Certified Public Accountant
• Extensive history of industrysuccess and experience — 25+years in staffing and laborbusiness
• Previously built his ownstaffing/labor company from oneto 16 offices
• Command Center Franchisee,2003 to 2006
• Multiple leadership positions atCommand Center
• BAs in Marketing & Managementfrom Univ. of North Dakota, GrandForks
Highly-Experienced ManagementTeam
6
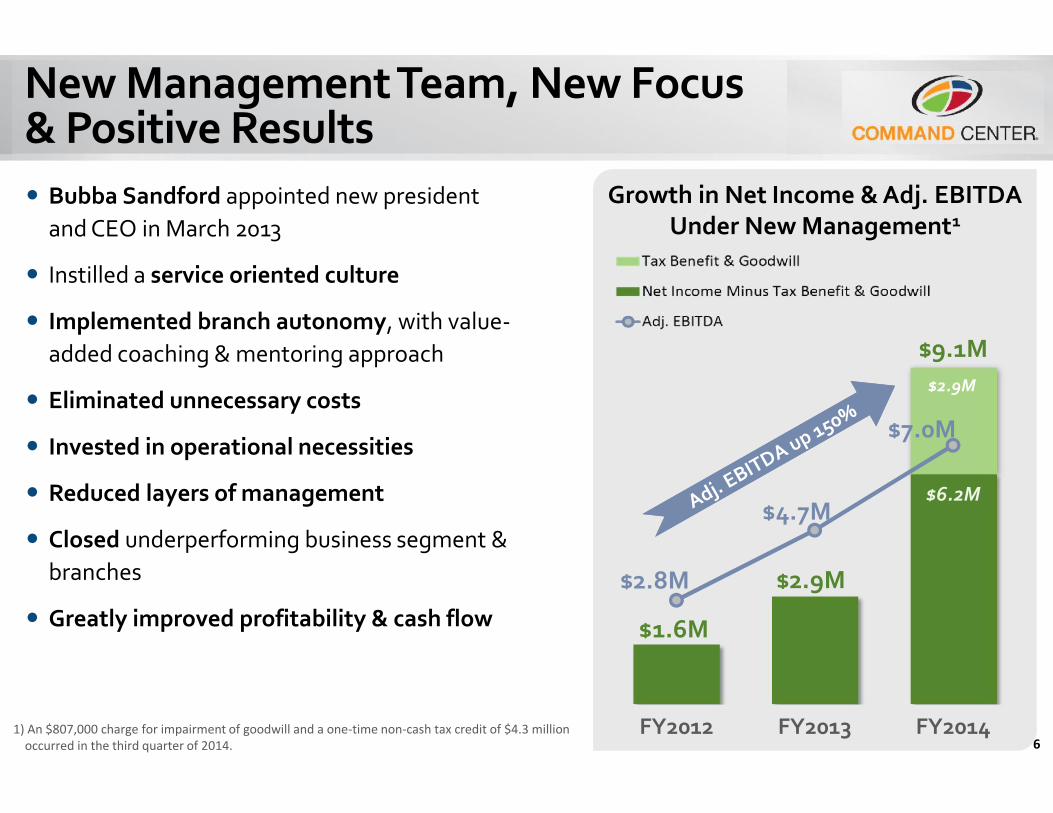
New Management Team, New Focus& Positive Results Bubba Sandford appointed new president
and CEO in March 2013
Instilled a service oriented culture
Implemented branch autonomy, with value-added coaching & mentoring approach
Eliminated unnecessary costs
Invested in operational necessities
Reduced layers of management
Closed underperforming business segment &branches
Greatly improved profitability & cash flow
$6.2M
$2.9M
$1.6M
$2.9M
$9.1M
$2.8M
$4.7M
$7.0M
FY2012 FY2013 FY2014
Growth in Net Income & Adj. EBITDAUnder New Management1
1) An $807,000 charge for impairment of goodwill and a one-time non-cash tax credit of $4.3 millionoccurred in the third quarter of 2014.
7
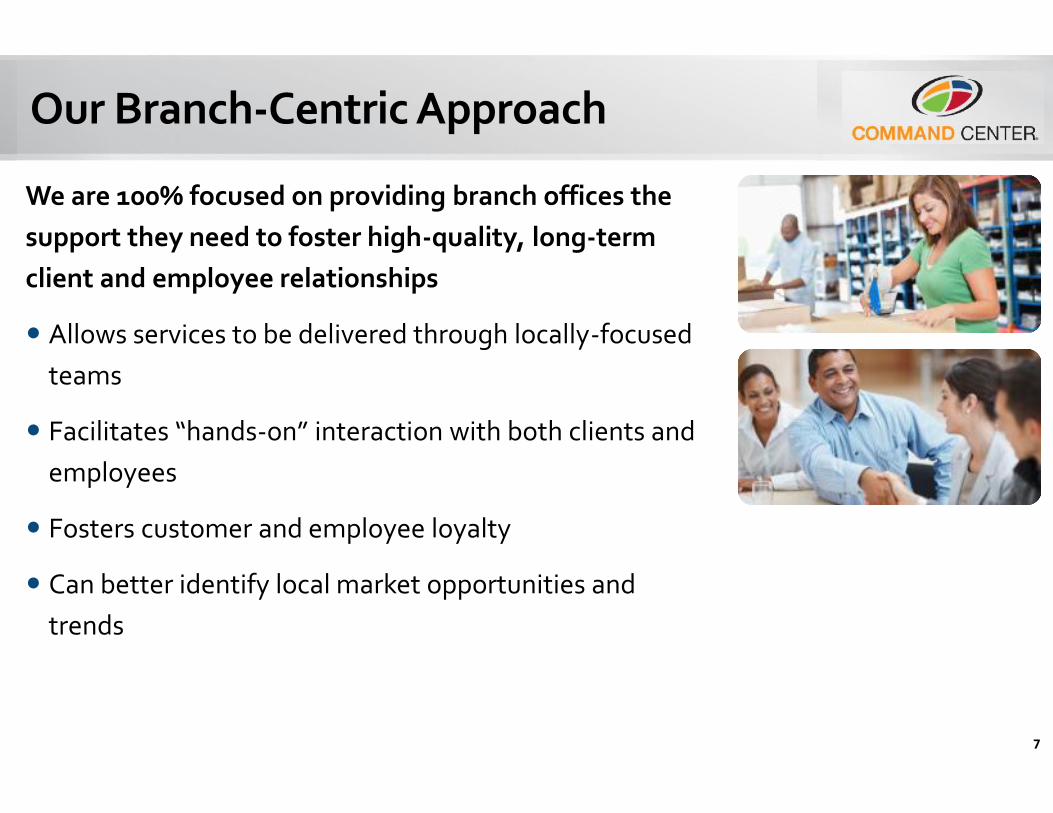
Our Branch-Centric Approach
We are 100% focused on providing branch offices thesupport they need to foster high-quality, long-termclient and employee relationships
Allows services to be delivered through locally-focusedteams
Facilitates “hands-on” interaction with both clients andemployees
Fosters customer and employee loyalty
Can better identify local market opportunities andtrends
8
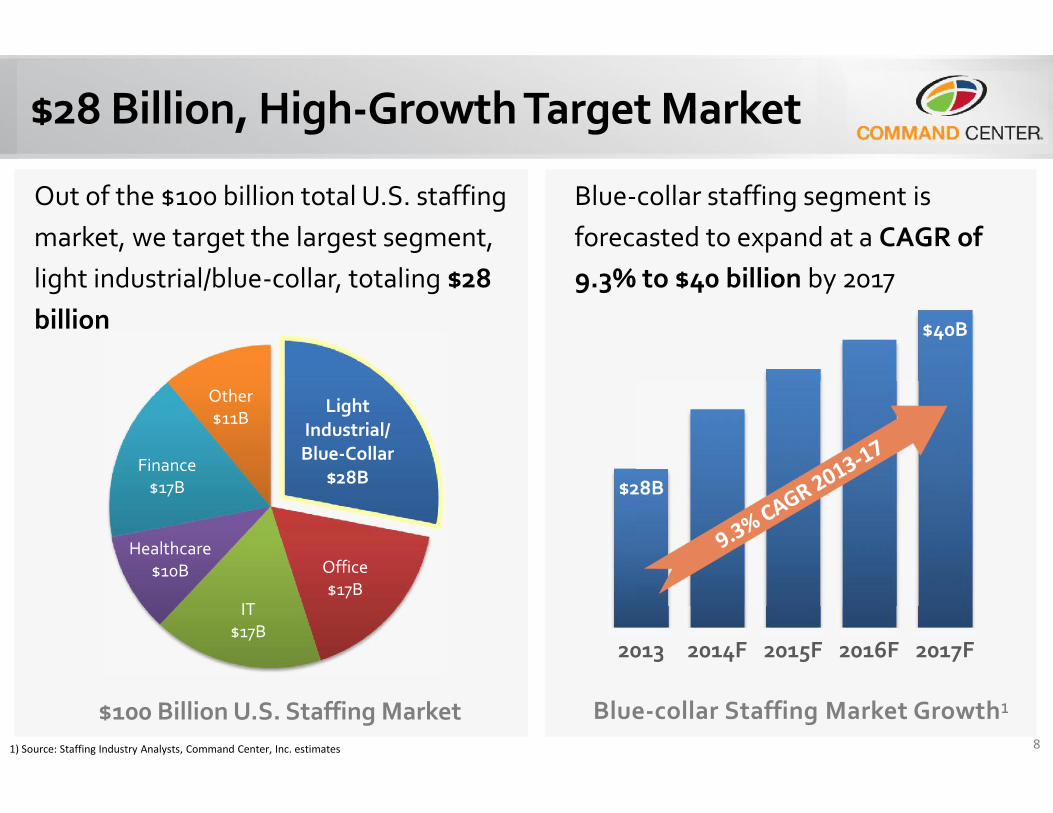
Blue-collar staffing segment isforecasted to expand at a CAGR of9.3% to $40 billion by 2017
$28 Billion, High-Growth Target Market
Out of the $100 billion total U.S. staffingmarket, we target the largest segment,light industrial/blue-collar, totaling $28billion
LightIndustrial/Blue-Collar
$28B
Office$17B
IT$17B
Healthcare$10B
Finance$17B
Other$11B
$100 Billion U.S. Staffing Market1) Source: Staffing Industry Analysts, Command Center, Inc. estimates
$28B
$40B
2013 2014F 2015F 2016F 2017F
Blue-collar Staffing Market Growth¹
9
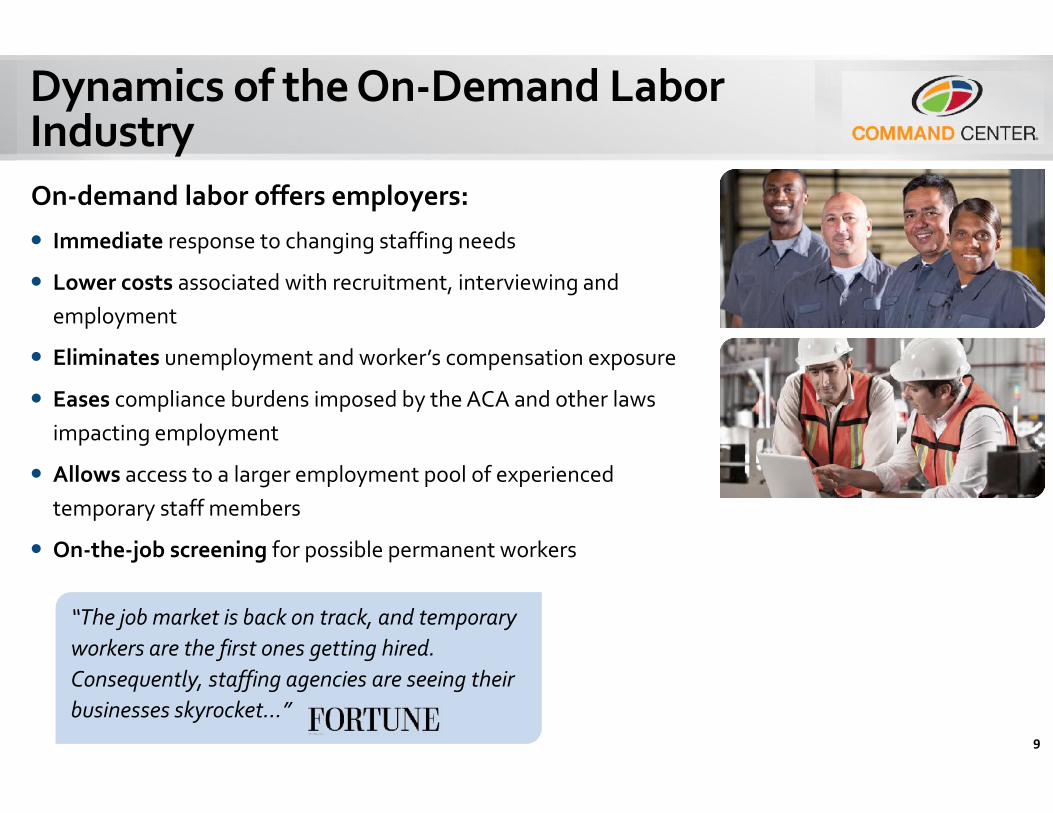
Dynamics of the On-Demand LaborIndustryOn-demand labor offers employers:
Immediate response to changing staffing needs
Lower costs associated with recruitment, interviewing andemployment
Eliminates unemployment and worker’s compensation exposure
Eases compliance burdens imposed by the ACA and other lawsimpacting employment
Allows access to a larger employment pool of experiencedtemporary staff members
On-the-job screening for possible permanent workers
“The job market is back on track, and temporaryworkers are the first ones getting hired.Consequently, staffing agencies are seeing theirbusinesses skyrocket…”
10
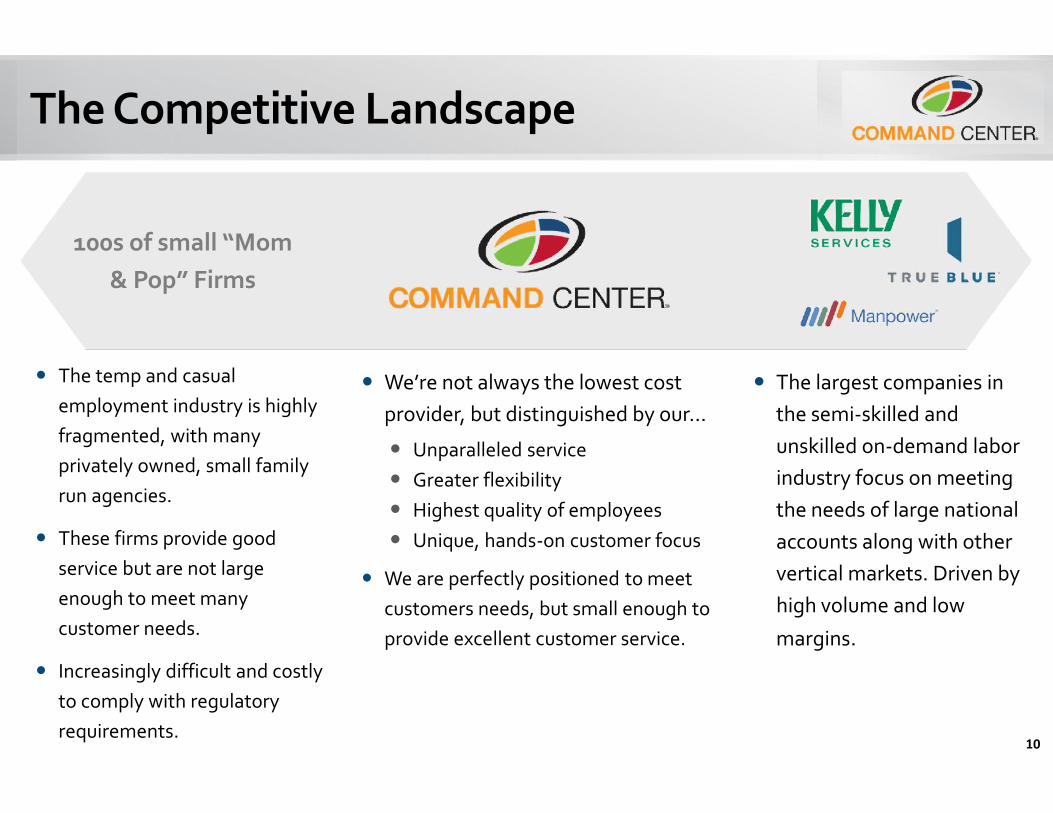
The Competitive Landscape
We’re not always the lowest costprovider, but distinguished by our…
Unparalleled service Greater flexibility Highest quality of employees Unique, hands-on customer focus
We are perfectly positioned to meetcustomers needs, but small enough toprovide excellent customer service.
The largest companies inthe semi-skilled andunskilled on-demand laborindustry focus on meetingthe needs of large nationalaccounts along with othervertical markets. Driven byhigh volume and low
margins.
The temp and casualemployment industry is highlyfragmented, with manyprivately owned, small familyrun agencies.
These firms provide goodservice but are not largeenough to meet manycustomer needs.
Increasingly difficult and costlyto comply with regulatoryrequirements.
100s of small “Mom& Pop” Firms
11
Why Customers Choose Command Center
Customized Solutions: Staffing tailored to the specific needsof our clients
Local & Industry Expertise: Local market knowledge combinedwith extensive experience in multiple industries
Partnered with Clients: We gain insights as we work closelywith our clients on their day-to-day staffing needs
Quality, Loyal Worker Pools: Incentives for temporaryemployees, including paid vacation and safety programs createa strong workforce
Excellence-in-Service: We deliver on staffing solutions wepromise
12
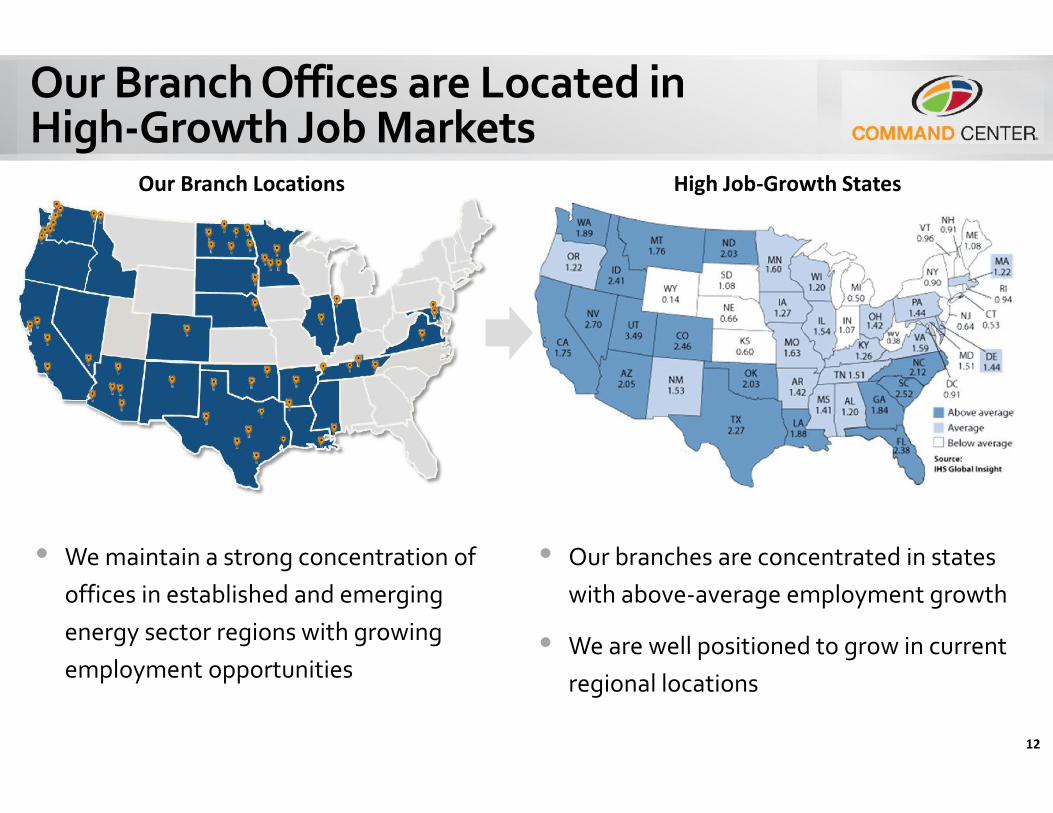
Our Branch Offices are Located inHigh-Growth Job Markets
• We maintain a strong concentration ofoffices in established and emergingenergy sector regions with growingemployment opportunities
• Our branches are concentrated in stateswith above-average employment growth
• We are well positioned to grow in currentregional locations
Our Branch Locations High Job-Growth States
13
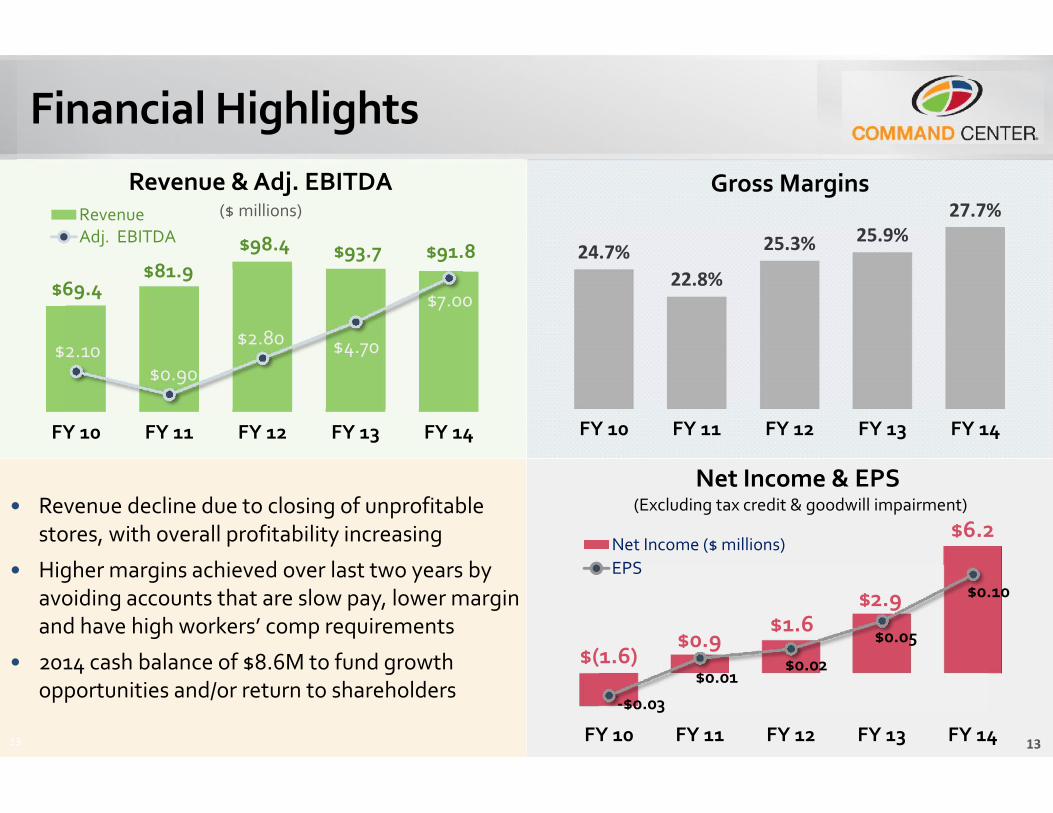
• Revenue decline due to closing of unprofitablestores, with overall profitability increasing
• Higher margins achieved over last two years byavoiding accounts that are slow pay, lower marginand have high workers’ comp requirements
• 2014 cash balance of $8.6M to fund growthopportunities and/or return to shareholders
Financial Highlights
13
Gross Margins
Net Income & EPS(Excluding tax credit & goodwill impairment)
24.7%22.8%
25.3% 25.9%27.7%
FY 10 FY 11 FY 12 FY 13 FY 14
$(1.6)$0.9
$1.6$2.9
$6.2
-$0.03$0.01
$0.02
$0.05
$0.10
FY 10 FY 11 FY 12 FY 13 FY 14
Net Income ($ millions)EPS
$69.4$81.9
$98.4 $93.7 $91.8
$2.10$0.90
$2.80 $4.70
$7.00
FY 10 FY 11 FY 12 FY 13 FY 14
RevenueAdj. EBITDA
Revenue & Adj. EBITDA($ millions)
14
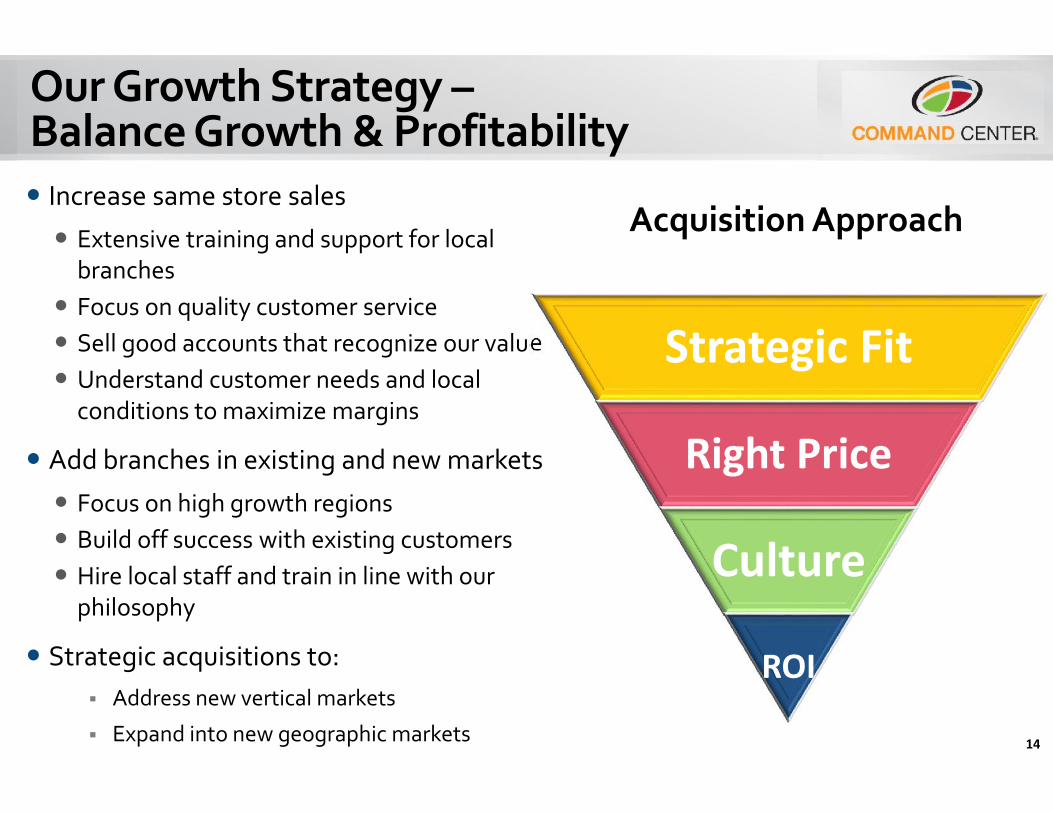
Our Growth Strategy –Balance Growth & Profitability Increase same store sales Extensive training and support for local
branches Focus on quality customer service Sell good accounts that recognize our value Understand customer needs and local
conditions to maximize margins
Add branches in existing and new markets
Focus on high growth regions Build off success with existing customers Hire local staff and train in line with our
philosophy
Strategic acquisitions to: Address new vertical markets
Expand into new geographic markets
Acquisition Approach
Strategic Fit
Right Price
Culture
ROI

15
Comparative Valuation
Command has transitionedfrom a marginally profitable,loosely organized collectionof stores to a integratedprofitable business
Our valuation has improvedbut is still far below ourindustry
Company Ticker EV/EBITDA Price/EPS
On Assignment NYSE: ASGN 12.3 26.0
Kelly Services NASDAQ: KELYA 12.3 29.2
Manpower Group NYSE: MAN 7.6 15.1
TrueBlue NYSE: TBI 9.4 14.2
BG Staffing NYSE: BGSF 8.8 N/A
General EmploymentEnterprises NYSE: JOB N/A N/A
Staffing 360 Solutions OTCQB: STAF N/A N/A
Average 10.1x 21.1xCommand Center OTCQB: CCNI 5.0x 7.0x1
Source: CapitalIQ.1) Valuation as of March 5, 2015, with Command Center TTM Price per Diluted EPS based on net income that excludes a $807,000charge for impairment of goodwill and a one-time non-cash tax credit of $4.3 million that occurred in the third quarter of 2014.
16
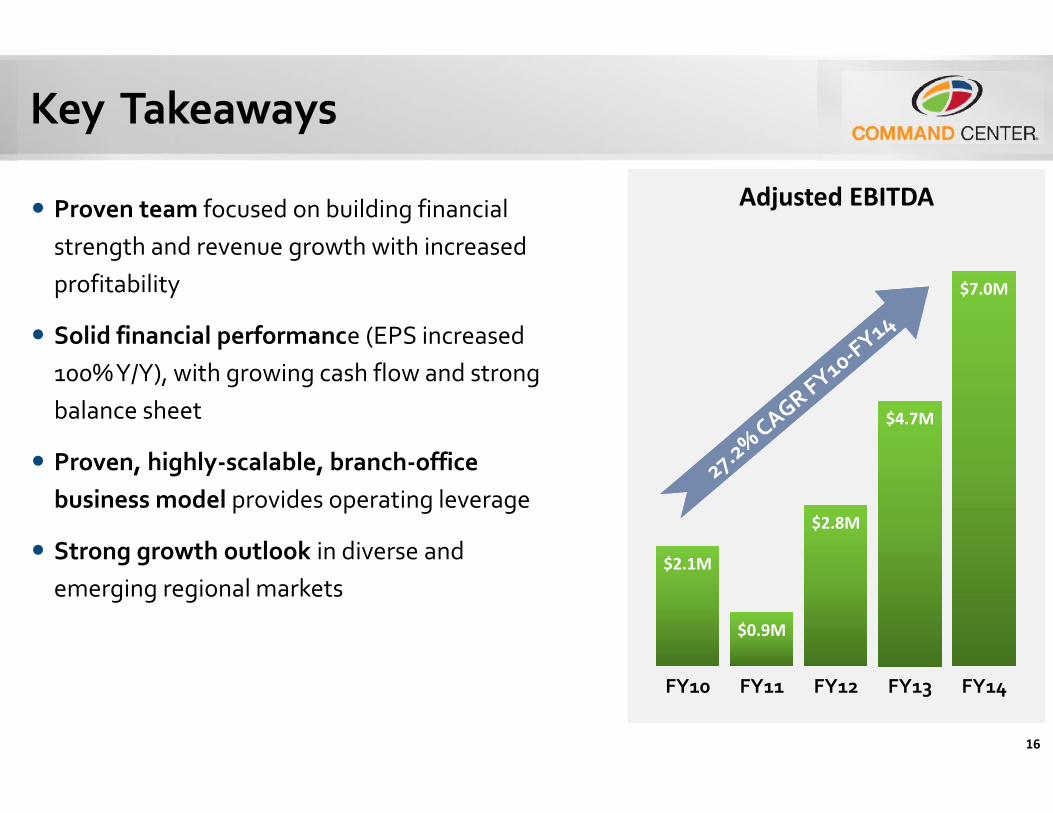
Key Takeaways
Proven team focused on building financialstrength and revenue growth with increasedprofitability
Solid financial performance (EPS increased100% Y/Y), with growing cash flow and strongbalance sheet
Proven, highly-scalable, branch-officebusiness model provides operating leverage
Strong growth outlook in diverse andemerging regional markets
$2.1M
$0.9M
$2.8M
$4.7M
$7.0M
FY10 FY11 FY12 FY13 FY14
Adjusted EBITDA
17
Contact Us
Command Center, Inc.Jeff Wilson, CFO3901 North Schreiber WayCoeur d’Alene, ID 83815Tel (208) 773-7450
Liolios GroupInvestor RelationsChris Tyson, Managing Director20371 Irvine Avenue, Suite A-100Newport Beach, CA 92660Tel (949) [email protected]
®OTCQB:CCNI
APPENDIX
19
$2.1M
$0.9M
$2.8M
$4.7M
$7.0M
FY10 FY11 FY12 FY13 FY14
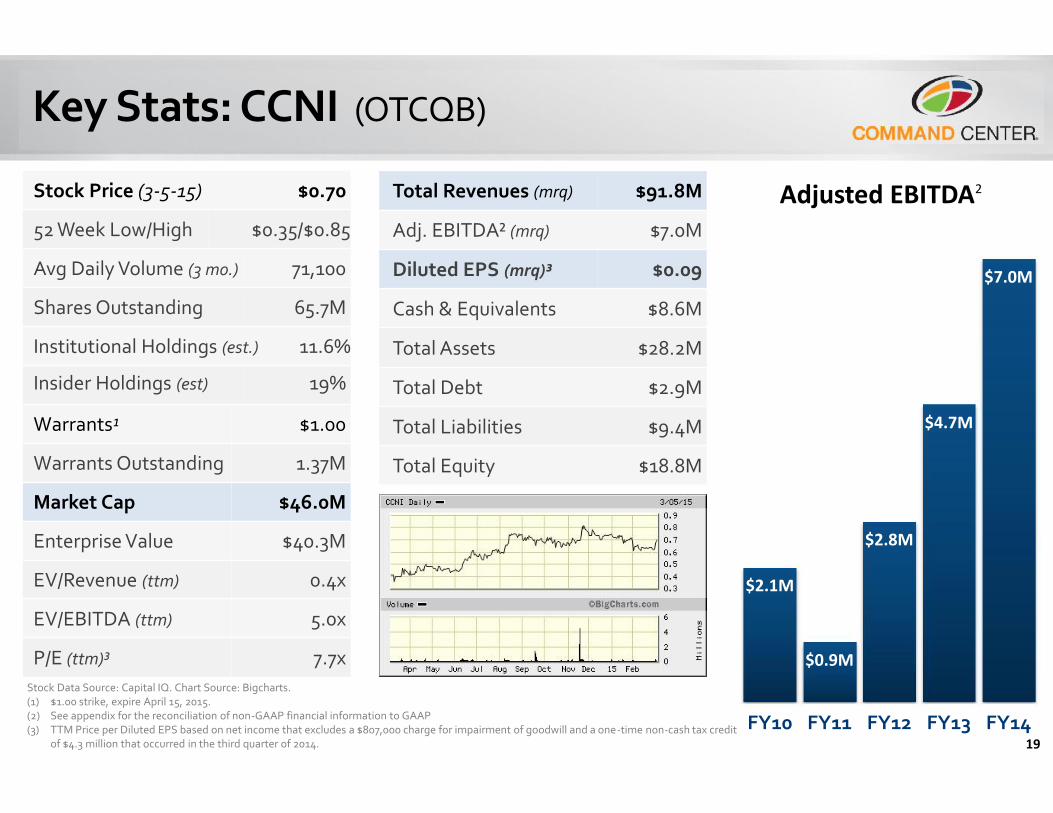
Adjusted EBITDA2Stock Price (3-5-15) $0.70
52 Week Low/High $0.35/$0.85
Avg Daily Volume (3 mo.) 71,100
Shares Outstanding 65.7M
Institutional Holdings (est.) 11.6%
Insider Holdings (est) 19%
Warrants¹ $1.00
Warrants Outstanding 1.37M
Market Cap $46.0M
Enterprise Value $40.3M
EV/Revenue (ttm) 0.4x
EV/EBITDA (ttm) 5.0x
P/E (ttm)³ 7.7x
Total Revenues (mrq) $91.8M
Adj. EBITDA² (mrq) $7.0M
Diluted EPS (mrq)³ $0.09
Cash & Equivalents $8.6M
Total Assets $28.2M
Total Debt $2.9M
Total Liabilities $9.4M
Total Equity $18.8M
Key Stats: CCNI (OTCQB)
Stock Data Source: Capital IQ. Chart Source: Bigcharts.(1) $1.00 strike, expire April 15, 2015.(2) See appendix for the reconciliation of non-GAAP financial information to GAAP(3) TTM Price per Diluted EPS based on net income that excludes a $807,000 charge for impairment of goodwill and a one-time non-cash tax credit
of $4.3 million that occurred in the third quarter of 2014.
20
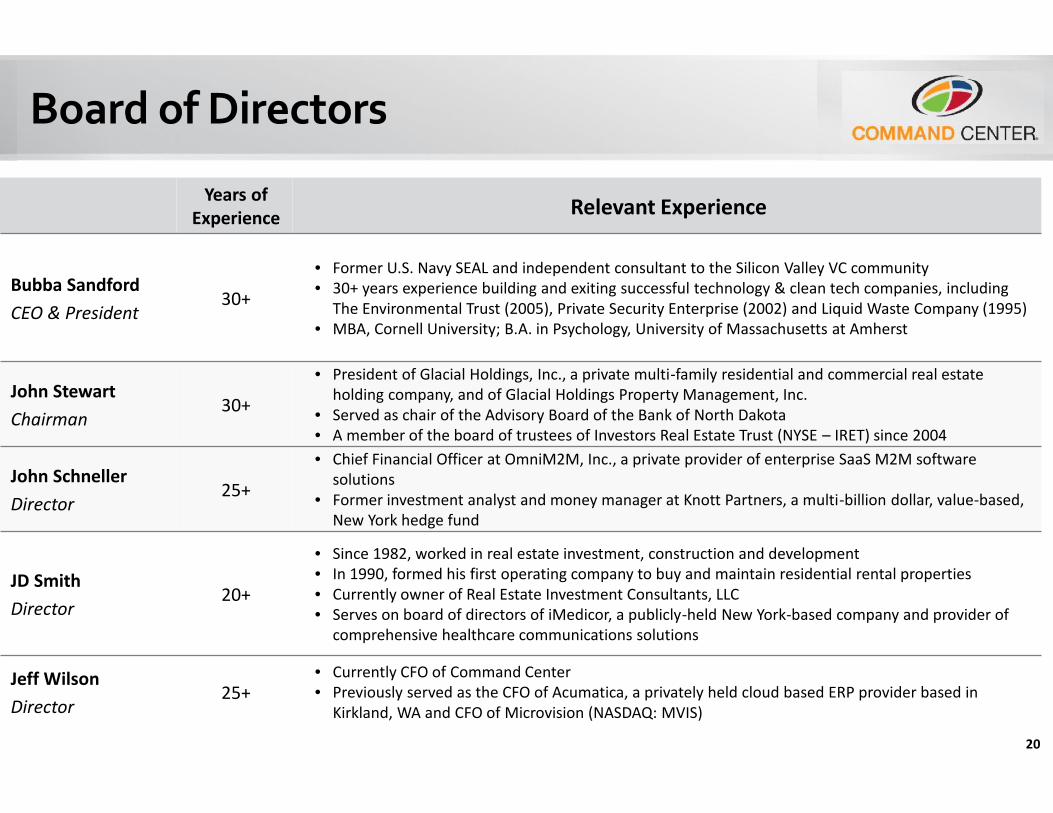
Board of Directors
Years ofExperience Relevant Experience
Bubba SandfordCEO & President
30+• Former U.S. Navy SEAL and independent consultant to the Silicon Valley VC community• 30+ years experience building and exiting successful technology & clean tech companies, including
The Environmental Trust (2005), Private Security Enterprise (2002) and Liquid Waste Company (1995)• MBA, Cornell University; B.A. in Psychology, University of Massachusetts at Amherst
John StewartChairman
30+• President of Glacial Holdings, Inc., a private multi-family residential and commercial real estate
holding company, and of Glacial Holdings Property Management, Inc.• Served as chair of the Advisory Board of the Bank of North Dakota• A member of the board of trustees of Investors Real Estate Trust (NYSE – IRET) since 2004
John SchnellerDirector
25+• Chief Financial Officer at OmniM2M, Inc., a private provider of enterprise SaaS M2M software
solutions• Former investment analyst and money manager at Knott Partners, a multi-billion dollar, value-based,
New York hedge fund
JD SmithDirector
20+
• Since 1982, worked in real estate investment, construction and development• In 1990, formed his first operating company to buy and maintain residential rental properties• Currently owner of Real Estate Investment Consultants, LLC• Serves on board of directors of iMedicor, a publicly-held New York-based company and provider of
comprehensive healthcare communications solutions
Jeff WilsonDirector
25+• Currently CFO of Command Center• Previously served as the CFO of Acumatica, a privately held cloud based ERP provider based in
Kirkland, WA and CFO of Microvision (NASDAQ: MVIS)
21
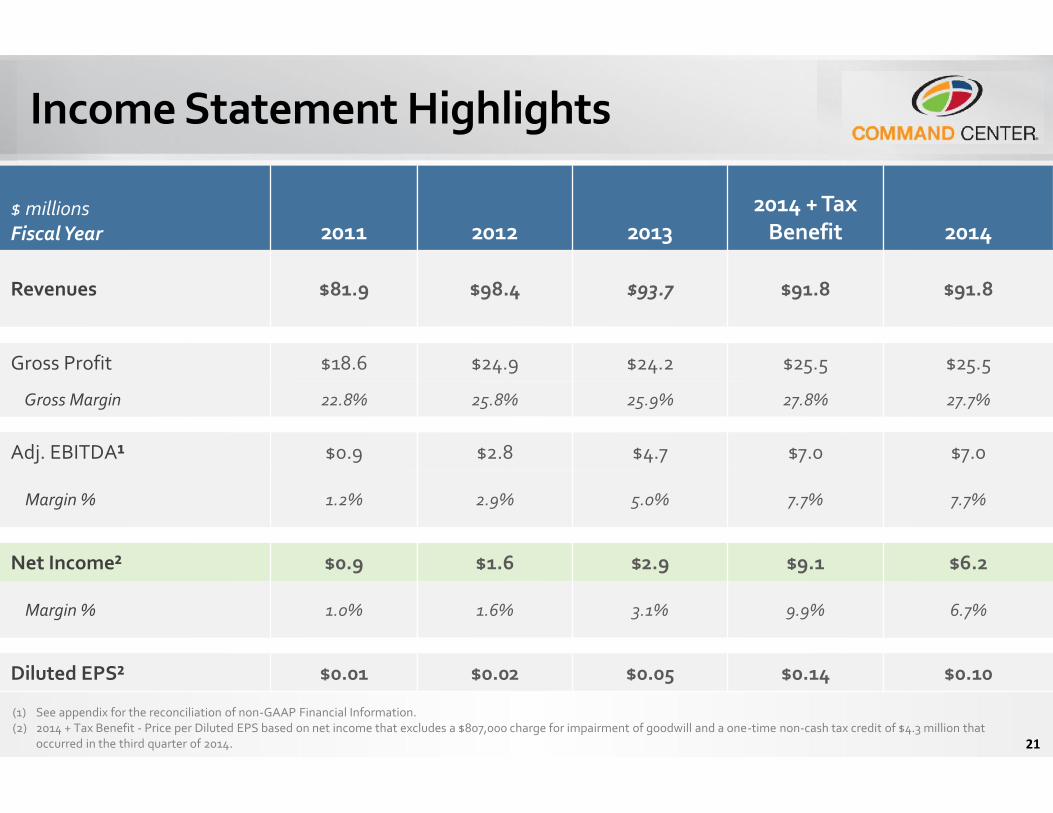
Income Statement Highlights
$ millionsFiscal Year 2011 2012 2013
2014 + TaxBenefit 2014
Revenues $81.9 $98.4 $93.7 $91.8 $91.8
Gross Profit $18.6 $24.9 $24.2 $25.5 $25.5
Gross Margin 22.8% 25.8% 25.9% 27.8% 27.7%
Adj. EBITDA¹ $0.9 $2.8 $4.7 $7.0 $7.0
Margin % 1.2% 2.9% 5.0% 7.7% 7.7%
Net Income² $0.9 $1.6 $2.9 $9.1 $6.2
Margin % 1.0% 1.6% 3.1% 9.9% 6.7%
Diluted EPS² $0.01 $0.02 $0.05 $0.14 $0.10
(1) See appendix for the reconciliation of non-GAAP Financial Information.(2) 2014 + Tax Benefit - Price per Diluted EPS based on net income that excludes a $807,000 charge for impairment of goodwill and a one-time non-cash tax credit of $4.3 million that
occurred in the third quarter of 2014.
22
Reconciliation of Non-GAAP FinancialMeasures In addition to the results prepared in accordance with generally accepted accounting
principles (“GAAP”), the company also presents adjusted EBITDA, a non-GAAP termdefined as earnings before interest, taxes, depreciation and amortization, and the changein fair value of derivative liabilities.
The company uses adjusted EBITDA as a financial measure since management believesinvestors find it a useful tool to perform more meaningful comparisons of past, presentand future operating results, and as a complement to net income and other financialperformance measures.
Adjusted EBITDA is not intended to represent net income as defined by GAAP, and suchinformation should not be considered as an alternative to net income or any othermeasure of performance prescribed by GAAP.
Reconciliations of adjusted EBITDA to GAAP net income for the periods presented areavailable in the company’s quarterly and annual reports filed with the SEC on Forms 10-Qand 10-K, which can be accessed at www.sec.gov or on the company’s website.