comitÉ nacional espaÑol de grandes presas · comitÉ nacional espaÑol de grandes presas the use...
TRANSCRIPT

COMITÉ NACIONAL ESPAÑOL DE GRANDES PRESAS
THE USE OF SOIL-ROCK MIXTURES IN DAMS IN PORTUGAL
Laura Caldeira1 Andrea Brito2
RESUMEN: Soil-rock mixtures are being used in the construction of dam shells. The measured deformations associated to these materials have been lar-ger than expected. This situation represents new challenges to compaction tech-niques and their control as well as to the determination of the characteristics of the embankment that results from the compaction method, as those characteris-tics suffer important changes according to the relative percentage of the existing fractions. For the execution control of the soil-rock mixtures from the Odelouca dam borrow areas, a series of vibratory compaction tests and standard compac-tion tests were performed to estimate reference values for the maximum dry density and optimum water content of these materials. Odelouca dam is a zoned embankment dam, 76 m high, with clayey soil at the core and weathered schist with a significant fraction of oversized particles at the shells. The results of the compaction control, as well as its behaviour during the construction phase, are herein presented.
1 Senior Research Officer, Head of Geotechnical Department, Laboratório Nacional de Engenharia Civil, Portugal. 2 PhD Student, Laboratório Nacional de Engenharia Civil, Portugal.

1. INTRODUCTION
The use, by economical and environmental reasons, of non traditional ma-terials, such as soil-rock mixtures, in earthworks construction, brings to dam engineering new challenges. Usually, this kind of material results from the rocky bulky extraction without explosives, and it can include some oversized particles (about 0.5 m or larger).
Soil-rock mixture material must comply with the following conditions (JAE, 1998): (i) fraction retained on ¾” (19 mm) sieve between 30% and 70%; (ii) fraction passing # 200 (0.074 mm) sieve between 12% and 40%; (iii) and the maximum particles dimension (Dmax) lesser than 2/3 of the layer thickness after compaction and not larger than 0,40 m.
The Portuguese Dam Design standard (NPB, 1993) classifies materials be-tween soil and rockfill as transition materials (Figure 1). According to the same document, soils have a significant fraction of 2-6 mm dimension particles and eventually larger particles disseminated in fine matrix and without having any structure. Rockfill materials present sizes ranging from metric dimension, fixed by construction reasons, to clay’s dimensions, and exhibiting permeabil-ity larger than 10-5 m/s. Finally, the transition materials, herein called soil-rock mixtures, are characterized by a significant fraction of oversized particles, sufficiently to form a structure, associated with a fine matrix. Their stress-strain behaviour is not only determined by the coarse fraction, since the fine material plays an influent part.
GRADATION
EVOLUTIONARY EVOLUTIONARY
ROCK
SOIL
Figure 1 – Typical grain size distribution and structure of (Maranha das
Neves, 1993) of: A) soils; B) soil-rock mixtures; C) rock fill.
Recently, especially in dam and road engineering, some attention has been addressed to soil-rock mixtures, due its anomalous deformation behaviour, forcing, in many cases, to corrective measures. Frequently, these materials present an evolutive nature, with a friable coarser fraction, that, with the con-struction process and in the operation phase, suffers a change of their nature and of their gradation.
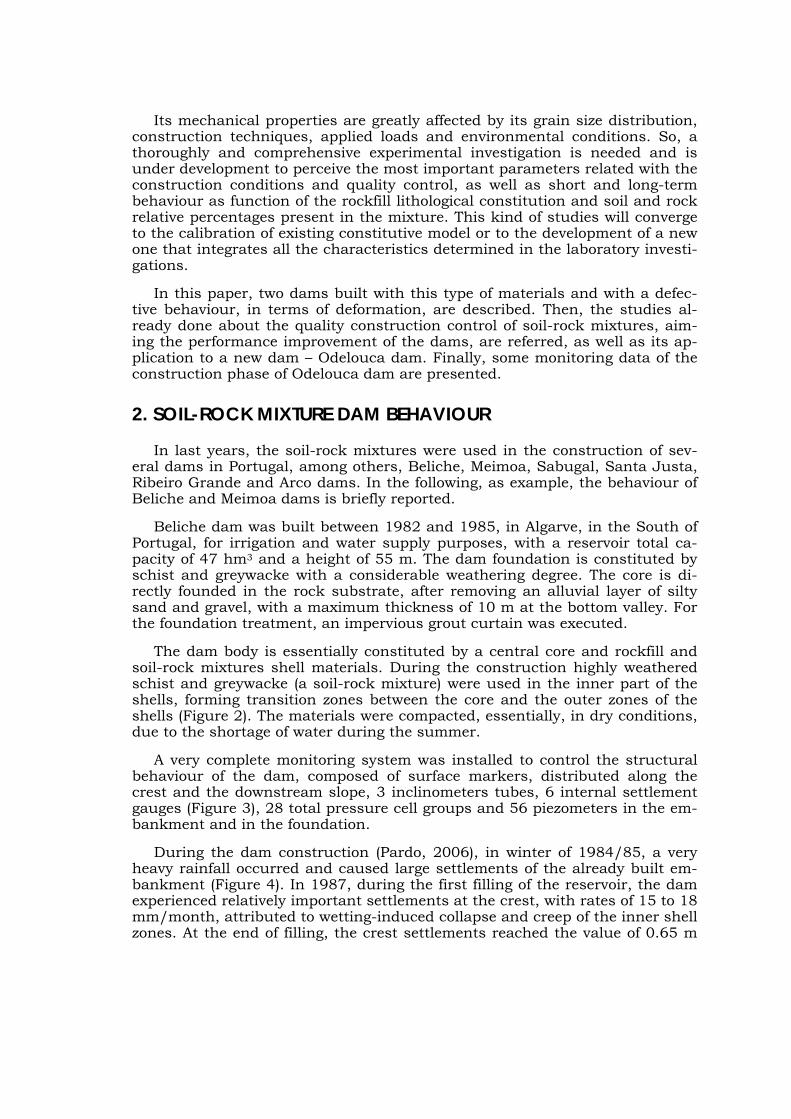
Its mechanical properties are greatly affected by its grain size distribution, construction techniques, applied loads and environmental conditions. So, a thoroughly and comprehensive experimental investigation is needed and is under development to perceive the most important parameters related with the construction conditions and quality control, as well as short and long-term behaviour as function of the rockfill lithological constitution and soil and rock relative percentages present in the mixture. This kind of studies will converge to the calibration of existing constitutive model or to the development of a new one that integrates all the characteristics determined in the laboratory investi-gations.
In this paper, two dams built with this type of materials and with a defec-tive behaviour, in terms of deformation, are described. Then, the studies al-ready done about the quality construction control of soil-rock mixtures, aim-ing the performance improvement of the dams, are referred, as well as its ap-plication to a new dam – Odelouca dam. Finally, some monitoring data of the construction phase of Odelouca dam are presented.
2. SOIL-ROCK MIXTURE DAM BEHAVIOUR
In last years, the soil-rock mixtures were used in the construction of sev-eral dams in Portugal, among others, Beliche, Meimoa, Sabugal, Santa Justa, Ribeiro Grande and Arco dams. In the following, as example, the behaviour of Beliche and Meimoa dams is briefly reported.
Beliche dam was built between 1982 and 1985, in Algarve, in the South of Portugal, for irrigation and water supply purposes, with a reservoir total ca-pacity of 47 hm3 and a height of 55 m. The dam foundation is constituted by schist and greywacke with a considerable weathering degree. The core is di-rectly founded in the rock substrate, after removing an alluvial layer of silty sand and gravel, with a maximum thickness of 10 m at the bottom valley. For the foundation treatment, an impervious grout curtain was executed.
The dam body is essentially constituted by a central core and rockfill and soil-rock mixtures shell materials. During the construction highly weathered schist and greywacke (a soil-rock mixture) were used in the inner part of the shells, forming transition zones between the core and the outer zones of the shells (Figure 2). The materials were compacted, essentially, in dry conditions, due to the shortage of water during the summer.
A very complete monitoring system was installed to control the structural behaviour of the dam, composed of surface markers, distributed along the crest and the downstream slope, 3 inclinometers tubes, 6 internal settlement gauges (Figure 3), 28 total pressure cell groups and 56 piezometers in the em-bankment and in the foundation.
During the dam construction (Pardo, 2006), in winter of 1984/85, a very heavy rainfall occurred and caused large settlements of the already built em-bankment (Figure 4). In 1987, during the first filling of the reservoir, the dam experienced relatively important settlements at the crest, with rates of 15 to 18 mm/month, attributed to wetting-induced collapse and creep of the inner shell zones. At the end of filling, the crest settlements reached the value of 0.65 m

and the loss of freeboard was 0.50 m. The average crest settlement rate de-creased to 5 mm/month at the end of the first filling.
shellshell
Figure 2 – Cross-section of Beliche dam
Figure 3 – Settlements gauges at cross-section 7
The surface markers located in the upstream and downstream crest align-ments, at the end of the first filling, registered maximum values of horizontal displacements, respectively, of 0.18 and 0.32 m, towards downstream. As re-sult, a longitudinal cracking of the crest surface was detected.
In November 1988, after a period of heavy rainfall, the water level at the re-servoir exceeded the maximum water level in about 0.40 m. A new maximum operation level, in normal conditions, was then established at El 50.5 m (NWL= 52 m) and good quality blocks were placed upper part of the upstream slope.
In 1996, the crest settlements reached the maximum value of 0.70 m, the internal horizontal displacements the maximum value of 0.55 m, and the hori-zontal displacements at the crest the maximum value of 0.40 m, towards downstream.

0.5
3.5
6.5
9.5
12.5
15.5
18.5
21.5
24.5
27.5
30.5
33.5
36.5
39.5
42.5
45.5
48.5
51.5
0 200 400 600 800 1000
Settlement (mm)
Ele
vati
on (
m)
83.09.15
83.11.30
84.01.18
84.03.02
84.05.29
84.07.26
84.08.28
84.10.10
84.12.19
85.01.31
85.03.06
85.05.30
0.5
3.5
6.5
9.5
12.5
15.5
18.5
21.5
24.5
27.5
30.5
33.5
36.5
39.5
42.5
45.5
48.5
51.5
0 100 200 300 400 500 600
Settlement (mm)
Ele
vati
on (
m)
85.07.31
85.12.03
86.06.23
86.11.04
87.04.14
87.11.07
88.01.25
88.10.27
90.02.06
90.12.01
91.10.15
93.10.18
95.05.02
98.10.13
Ref: 85.05.30
a) b) Figure 4 – Vertical displacements at A1 settlement gauge during: a) construc-
tion; b) first filling of the reservoir
To minimize the overtopping risk due to occurrence of floods larger than the one considered in the original design and to the loss of freeboard, various options were considered. It was concluded that the most convenient solution, in technical and economical terms, comprised the heightening of dam, the specification of specific operation norms and a minimum adaptation of spill way. The monitoring system was also modified, especially at the crest.
The rehabilitation works took place between August 1997 and June 1998, with the adoption of a crest elevation of 55.7 m and operation levels of NWL= 49.5 m and MWL= 53.8 m.
Meimoa dam was concluded in 1985, near Castelo Branco, in the central part of Portugal, for irrigation and water supply purposes, with a reservoir to-tal capacity of 40.9 hm3 and a height of 56 m. It is a zoned dam, with a core, constituted by clayey soils, a vertical filter and upstream and downstream shells, constituted by materials resulting from excavation (soil-rock mixtures – Figure 5).
The dam foundation is constituted by schist and greywacke highly wea-thered. A superficial 4 m thick layer was removed before the construction. For the foundation watertightness, an inclined grout curtain was executed from the crest.
The monitoring system, installed after construction, is composed by surface markers, distributed along the crest (upstream and downstream alignments) and the upstream and downstream slopes, 9 inclinometers tubes, 49 piezome-

ters in the embankment and in the foundation, foundations drains and a seepage weir placed at the exit of a drainage gallery.
Figure 5 – Cross-section of Meimoa dam
During the first filling of the reservoir some anomalies were detected:
An horizontal displacement, towards upstream, of the concrete beams of the downstream footway (Figure 6a));
Longitudinal (in the upstream zone) and transversal (in the upstream and downstream footways) cracking in the crest pavement, due to dif-ferential settlements, most frequent near the abutments, where the foundations are steeper;
Visible settlements of the embankment in relation to the top protection blocks of the monitoring equipment (piezometers and inclinometer – Figure 6b));
Readings of water levels at piezometers installed at elevations higher than the reservoir water level;
Large displacement rates at the surface markers and inclinometers (Figure 7 – until November 1988).
a) b) Figure 6 – a) Displacement of the footway beam; b) settlement of the crest
pavement

-500
-450
-400
-350
-300
-250
-200
-150
-100
-50
0
03/1986 04/1988 05/1990
Date
Ver
tica
l dis
pla
cem
en
t (
mm
)
10M72
10J72
Reference: July 1986
0
50
100
150
200
250
300
11/1984 11/1986 11/1988 11/1990
Date
Hor
izon
tal d
ispl
acem
ent (
mm
)
I5Downstream
Upstream
Reference: July 1985
a) b)
Figure 7 – Displacements during first filling a) settlements of crest markers; b) top horizontal displacement of an inclinometer
3. CONSTRUCTION QUALITY CONTROL OF SOIL-ROCK MIXTURES
The construction quality control of dams constituted by soil-rock mixtures is still a subject that needs investigation, considering that is necessary to ex-trapolate current test results, been reach by truncated gradation, for the con-struction conditions of the embankments.
Effectively, on the one hand, these materials exhibit a percentage of rockfill material, which, in the course of placing, is normally controlled by only one parameter – void ratio. On the other hand, they exhibit a percentage of soil, which is characterized by two parameters – dry unit weight and water content. Doubts arise about how soil-rock mixtures must be treated. Their behaviour depends of the relative percentage of theirs constituents, be coming close to a soil, if the fine fraction is large and the coarser material is scattered in it, or close to rockfill, if the coarser material touch to each other and the fines oc-cupy the voids left by them. So, an additional parameter must be considered – the coarser material percentage (percentage of retained material in the ¾” sieve from the ASTM series).
In support of this hypothesis, USCOLD (1998) recognizes that the inclusion of rock particles in otherwise fine grained soils can have a significant influence on the engineering properties of the material, depending, among others things, upon the relative percentage of soil and rock present in the mixture. The study mentions that, for mixtures of non cohesive materials (sand and gravel), in a proportion around 20 to 50% of its total weight, an improvement of mixture compaction conditions occurs in relation to the rockfill material, with a conse-quent improvement of its mechanical properties. This conclusion allowed the

acceptance of the use of this type of materials in dam shells. Nevertheless, for clayey and silty mixtures, according to same authors, more studies are needed.
Relatively to rockfill materials, a laboratory study performed by Veiga Pinto (1983) reveals that the parameters influencing, in an ascendant order, their mechanical behaviour are: rock fragments strength, void ratio and stress state. According to the same author, the void ratio is presently the parameter with lesser and lesser influence, since the actual compaction techniques, which take advantage of powerful cylinders, allows the maximum compact-ness. On the other hand, the stress state is dependent on the embankment height. So the material behaviour, in properly compacted works, is especially dependent on the rock fragments strength.
For the embankment construction quality control of soil-rock mixtures, the usual practice is to apply corrective expressions to the Proctor test results (op-timum water content and maximum dry density), in order to have into account the coarser material influence in the reference properties. Corroborating Veiga Pinto findings for rockfill materials, previous studies carried out with soil-rock mixtures showed a strong dependence between corrective expressions and rock fragments strength.
Having for reference the construction of Odelouca dam, with shells consti-tuted by weathered schist and greywacke, with a significant fraction of over-sized particles, a laboratory test program was carried out for the deduction of corrective expressions to apply in the embankment quality control.
3.1. PREVIOUS STUDIES OF SOIL-ROCK MIXTURES COMPACTION
In the soil-rock mixtures embankment construction mixed procedures are adopted: construction techniques employed in the rockfill construction (as crash roller spreading and vibrator roller compaction, with 4.5 kN/m static load per vibration generating line (JAE, 1998)) and construction quality control techniques used in soils embankments, in conjunction with some correction equations properly deduced. Additionally, in order to reduce the energy taken in by the larger particles, maximum dimension is limited to two thirds of the layer thickness (Winter and Suhardi, 1993).
Extraction, transportation, placement, spreading and compaction of these materials induce, in general, a grain size evolution, expressed by fines increas-ing. In this way, it should be expected that materials resulting from this kind of process were characterized by extensive grain size distribution, high com-pactness and good mechanical strength. However, this is not always verified because of significantly mechanical and physical properties changes caused by construction processes, by atmospherically conditions (such as wetting and drying cycles) and by mechanical actions imposed.
Winter and Suhardi recommend the adoption of different proceedings for compaction control according to the coarser fraction present in the mixture. For materials having less than 45 to 50% of particles larger than 20 mm, the matrix properties (i.e. the fine material in the mixture) will control those of the embankment structure, so its construction control can be carried out through truncated grain size distributions (by elimination of the coarser particles). If

the blocks proportion rises significantly above 45 to 50% of the total mass, then physical and mechanical characteristics based on truncated grain size distributions may not be representative. Large scale testing, including in situ testing, may be necessary. This work allows yet concluding that substantially heavier equipment and/or more passes and/or thinner fill layers are neces-sary to guarantee high levels of compaction in coarse granular fills than in their finer grained or matrix dominant fills.
Some laboratory (one-dimensional strain compression) and in situ (plate load) tests were performed to assess the mechanical characteristics of soil-rock mixtures in the earthworks of the highway Via Longitudinal do Algarve (VLA). Tests and studies results (JAE/LNEC, 1994) allow verifying that both coarser and finer fractions influence stress-strain behaviour of the soil-rock mixture. Its behaviour was dependent on the material characteristics (such as type (with distinct physical and mechanical properties), heterogeneity, evolut-ive nature, wetting collapse susceptibility, expansibility and creep) and con-struction conditions (spreading technique, amount of water present, atmos-pheric conditions and compaction methodology).
Houston and Walsh (1993) report that, in order to have into account the coarser fraction influence in the quality control, different laboratory compac-tion tests methodologies can be adopted:
Method 1 (integral sample) – in large moulds, using the integral field mate-rial, for maximum dry density and optimum water content evaluation;
Method 2 (scalp-and-replacing) – in moulds of smaller dimensions, removing the plus ¾” (19 mm) material and replacing it with an equal weight of #4 to ¾” material;
Method 3 (eliminating)– using only the material passing ¾” sieve in a 6” (15.24 cm) mould; the plus ¾” material is discarded;
Method 4 (eliminating and correcting) – using only the minus #4 fraction and correcting the results obtained taking into account the percentages of coarser fraction of the field mixtures (through ASTM D4718, Standard T224 or Stan-dard 5515-89 from USBR).
Method 1 is a very expensive and time-consuming technique, therefore, is rarely used. Methods 2 and 4 are frequently used for materials with 10% to 60% of coarser particles. Method 3, valid when the plus ¾” material is less than 10% by weight (ASTM D698), is only suitable to mixtures with reduced percentage of coarser particles and behaviour clearly controlled by the finer matrix.
Table 1 presents the most used correction equations for the determination of the maximum dry density of the integral material.
The corrective r parameters in the AASHTO and USBR formulas are used to compensate the interference of coarser material blocking the finer material (existing between it) compaction. The ASTM expression doesn’t have any cor-rective parameter, but its application is limited to a coarser fraction lesser than 40%.

Table 1 – Most used corrective equations (adapted from Houston and Walsh, 1993) Equation desig-
nation Reference Equation Comments
AASHTO - 1 AASHTO T224
(1982) MwCFdC
Tmáxd GPP 9,0)1( max
Fmáxd determined using methods A or B,
AASHTO T99 or T180.
AASHTO - 2 AASHTO T224
(1982) FdA
Cw
M
C
wTmáxd
r
P
G
P
max
1
Fmáxd determined using methods A or B,
AASHTO T99 or T180. Correction factor rA depends on coarser fraction.
ASTM ASTM D4718
(2001) Fd
Cw
M
C
wTmáxd P
G
P
max
1
F
máxd determined using ASTM D698 or
D1557.
USBR USBR 5515-89
(1990) Fdu
Cw
M
C
wTmáxd
r
P
G
P
max
1
F
máxd determined using method 5500-89
from USBR. Correction factor ru depends on coarser fraction and fines composition (clayey, silty or sandy).
Tmáxd – Maximum dry density of total material;
Fmáxd – Maximum dry density of the finer fraction;
MG – Solid particle density of the coarser fraction;
CP – Percent by weight of the coarser fraction;
Ar – Correction factor to account for interference of coarser particles in AASHTO equation;
ur – Correction factor to account for interference of coarser particles in USBR equation.
Studies, carried out by LNEC (1987), suggest the use of the scalp-and-replacing method and the correction of the values obtained in the compaction tests, F
optw and Fd max , to calculate the optimum water content and the maxi-
mum dry density of the mixture, as a function of the percentage of the coarser particles (retained in #4 or in ¾” sieves of the ASTM series), as follows:
Fmáxd
FCd
C
Tmáxd PP
100 (1)
100
CCFFTopt
wPwPw
(2)
where Tmáxd and T
optw is the maximum dry density and the water content of the total material, C
d and Cw the dry unit weight and water content of the coarser fraction, FP and Fw the percentage in weight and the water content of the finer fraction (usually taken as F
optw obtained in the compaction tests), CP the per-centage in weight of coarser fraction and a correction coefficient, defined as:
9958.00013.0105 25 CC PP (3)
In 1994, Torrey and Donaghe introduced a new method, calibrated from data till then published for soil-rock mixtures. They performed standard effort compaction tests in different moulds and with materials composed by gravel, sand and non plastic silts or high plasticity clays. For the result treatment, they defined two additional quantities - the density interference coefficient, cI , and the optimum water content factor, optF , expressed as:

MC
Fc GP
FI
100 (4)
ToptC
Fopt
opt wP
wF
100 (5)
where FF is the fraction density factor, given by Fmáxd
FdFF / , F
d the dry unit weight of the finer fraction and MG the soil particles density of the coarser fraction.
To calculate FF , the authors appealed to the following equation:
C
Fmáxd
TmáxdwM
Fmáxd
FwMT
máxdF PG
PGF
100 (6)
The values of cI and optF of each test were represented as a function of coarser content, CP . This representation allowed to verify that the proposed parameters were independent of type of fines present and to suggest correla-tions between these parameters and the coarser fraction, CP .
Besides the methods based on physical properties, there are, in the special-ized bibliography, others soil-rock mixtures control methods based on the de-formability characteristics. Maranha and Veiga Pinto (1983) refer to the soil-rock mixture control method use in Meimoa Dam, which consisted in perform-ing one-dimensional strain compression tests, on 230 mm diameter samples, with two different dry density values (approximately 20 and 21.5 kN/m3), three water contents (between 4 and 11%) and several coarser fractions. The authors intended to control the material oedometric modulus in order to as-sure values between 30 and 40 MPa, so that stiffness contrast between core and downstream shell placed materials was low (Figure 8).
Figure 8 – Correlations between water content, dry density, percent of coarser fraction and oedometric modulus for Meimoa dam (JAE/LNEC, 1994)

3.2. STUDIES FOR ODELOUCA DAM CONSTRUCTION
Odelouca dam is a zoned embankment dam, 76 m high, built in Algarve, in south of Portugal. The crest of dam, 11 m wide, is about 415 m long (Figure 9).
Figure 9 – Odelouca dam cross-section
Odelouca dam creates a reservoir with 7,8 km2 surface and 157 hm3 capac-ity to the maximum water level. Most part of this regularize volume is intended for water supply and a small part will be used for irrigation purposes. The up-stream slope is about 1:2.25 (V:H), beneath the berm, and 1:2 (V:H), above it. The downstream slope is about 1:2.25 (V:H), above the rockfill toe and 1:1.5 (V:H) beneath it.
The embankment materials are clayey soil, at the core, and weathered schist and greywacke, with a significant fraction of oversized particles, at the shells (Figure 3b)). Grain size distribution curves of the materials used in the construction of Odelouca dam are presented in Figure 10.
Figure 10 – Grain size distribution curves of Odelouca dam materials
The selected shell materials should fulfil the following: maximum fines con-tent 30%, particles passing #10, #4 and ¾” sieves, respectively, between 10 and 50%, 18 and 62%, and 33 and 93%, and average and maximum particles diameters, respectively, between 2 and 50, and between 50 and 400 mm.
LEGEND:
1. Residual schist and colluvial material
2. Filter
3. Weathered schist and greywacke
4. Extensive granulometry rockfill
5. Drain
6. Downstream toe rockfill
7. Upstream protection layer (>66,5)
8. Upstream protection layer (<66.5)
GRAIN SIZE DISTRIBUTION CURVES
Particle diameter (mm)

3.2.1 COMPACTION CONTROL BASED ON VIBRATORY TESTS
During the trial embankment construction, LNEC proposed a laboratory testing program for setting up corrective expressions to extrapolate the proper-ties obtained by truncated grading to the actual grading size, according to Tor-rey and Donaghe (1994) methodology. It was admitted that the expressions derived by these authors for gravel, sand, silt and clays mixtures would not be directly applicable due to evolutive nature of the shell material.
In view of the compaction equipment (vibrating roller) used in the dam, laboratory vibratory compaction tests of the integral material were carried out and compared with the Proctor reference values. LNEC have a vast experience in application of vibration in samples reconstitution and preparation for triax-ial compression test in rockfill materials, so similar procedures were used to assess the compaction curves for soil-rock mixtures.
After prior material extraction and homogenization for trial embankments construction, different samples were collected from different lots. The vibratory tests were performed based on specifications, suitably adapted, reported in part 4 of the BS1377, 1990, entitled “British Standard Methods of test for Soils for Civil Engineering Purposes: Part 4. Compaction-related test: 1990”. The standard uses the following equipment: a CBR mould, an electric vibrating hammer, a steel tamper for attachment to the vibrating hammer, a device enabling sample depth measurement and a stop-clock.
The (310 mm inside diameter and 300 mm high) cylindrical mould available (Figure 11), is sectioned longitudinally, connected with rigidity ribs, and fixed to a metal base, in order to be easily removable and transportable. For the compaction, a hammer coupled to a (300 mm diameter, 20 mm thick and 100 N weights) plate of steel was used (see Figure 11). The gap between the mould and the plate is about 10 mm. The total force exerted, including the hammer and plate weights, reaches 2,954 N. In view of the mould diameter (300 mm), the maximum dimension of the mixture particles was limited to 2”, and tests have been performed (Brito, 2006) with varying percentages of the coarser fraction (material retained in ¾" sieve) present in the mixture (Figure 12).
a) b)
Figure 11 – a) Electric vibrating hammer and mould; b) cylindrical mould

Medium CoarseFineCoarseMediumFineClay
Silt Sand
Fine Medium Coarse
Gravel Block
MediumFine
0
10
20
30
40
50
60
70
80
90
100
0.001 0.01 0.1 1 10 100 1000
0
10
20
30
40
50
60
70
80
90
100
Lower limit
Upper limit
Pc= 30%
Pc=40%
Pc=50%
Pc= 60%
Pc=70%
Specificação LNEC E 196 - 1967
Sedimentation Sieving
#200
#140
#80
#60
#40
#20
#10
#4 3/8"
3/4" 1" 2" 3" 4"
% p
ass
ing
% r
eta
ined
Particles diamenter (mm)
Figure 12 – Grain size distributions of mixtures with particles limited to 2” with varying percentages of the coarse fraction
During compaction, the thickness variation as function of vibration time was measured and some observations can be drawn: (i) for high values of the water content and high vibration times, fine materials reflux occurred system-atically; (ii) for the higher water content tested (13.8%), after about 2 minutes of vibration, some swelling was detected, possibly due to material segregation, consequently, with a reduction of its dry density; (iii) for the remainder tests, regardless of water content, the maximum dry density was reached after nine minutes of vibration.
To validate the use of vibration tests in the compaction study, the results obtained through this procedure were compared with the conventional Proctor tests, performed for the material passing ¾” sieve.
The results as function of the vibration time are displayed in Figure 13 and compared with the compaction curve obtained in the standard Proctor test. This figure analysis allows concluding:
for the dry side of the compaction curve and for a water content devia-tion larger than 1%, it is not possible to achieve, by the vibration proc-ess, dry densities comparable to those obtained by the standard proc-ess, regardless of the vibration time;
for the wet side of the compaction curve and for high water content, the vibration process had to be stopped after some time of vibration due to the occurrence of reflux;
for small water content deviations in the wet side, some segregation of materials was produced, reaching the maximum dry density after only about 2 minutes of vibration;
the values of dry density and optimum water content obtained by vibra-tion after 9 minutes and by standard compaction are practically coinci-

dent, so one may conclude that, in this instance, the energy applied are equivalent;
the curve obtained by standard compaction presents a far more flat-tened shape than the one obtained after 9 minutes of vibration, so, the identification of the optimum point is facilitated in the vibration proce-dures.
16.0
16.5
17.0
17.5
18.0
18.5
19.0
8 9 10 11 12 13 14 15 16 17
Water content (%)
Dry
un
it w
eigh
t (k
N/m
3 )
Vibration tests
Standard Proctor test
1 min
2 min
3 min
6min
9 min
12 min
Figure 13 – Comparison of the compaction curves obtained by vibration and by the standard Proctor test (Caldeira and Brito, 2007)
Then, vibration compaction tests, with different percentages of coarse frac-tion (between 30 and 67.7%), were performed using the available lots. The compaction curves obtained after nine minutes of vibration, with different per-centages of coarser fraction are represented in Figure 14. The optimum points, considered in the interpretation of the testing that follows, are also marked.
17.5
18.0
18.5
19.0
19.5
20.0
20.5
21.0
21.5
22.0
7 8 9 10 11 12 13 14 15
Teor em água (%)
Pes
o vo
lúm
ico
seco
(k
N/m
3 )
0% de grossos
30% de grossos
50% de grossos
67,7% de grossos
Ponto óptimo
Figure 14 – Joint representation of compaction curves, after nine minutes
of vibration, and their optimum points
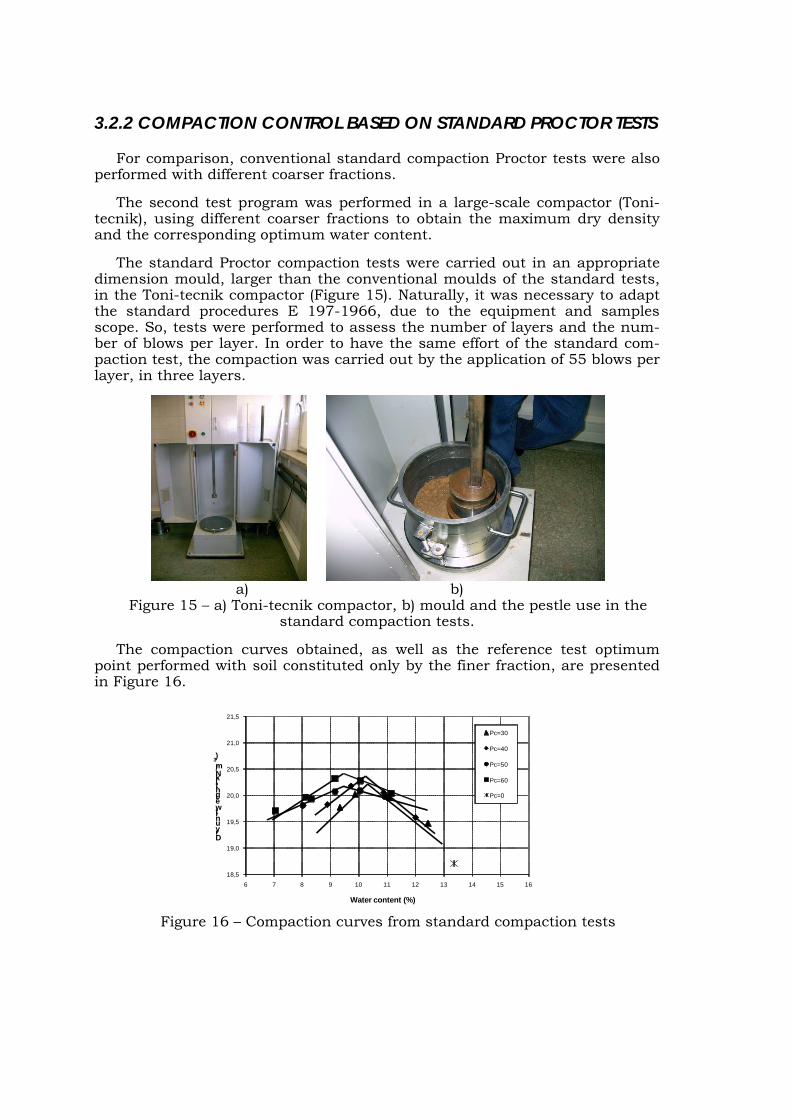
3.2.2 COMPACTION CONTROL BASED ON STANDARD PROCTOR TESTS
For comparison, conventional standard compaction Proctor tests were also performed with different coarser fractions.
The second test program was performed in a large-scale compactor (Toni-tecnik), using different coarser fractions to obtain the maximum dry density and the corresponding optimum water content.
The standard Proctor compaction tests were carried out in an appropriate dimension mould, larger than the conventional moulds of the standard tests, in the Toni-tecnik compactor (Figure 15). Naturally, it was necessary to adapt the standard procedures E 197-1966, due to the equipment and samples scope. So, tests were performed to assess the number of layers and the num-ber of blows per layer. In order to have the same effort of the standard com-paction test, the compaction was carried out by the application of 55 blows per layer, in three layers.
a) b)
Figure 15 – a) Toni-tecnik compactor, b) mould and the pestle use in the standard compaction tests.
The compaction curves obtained, as well as the reference test optimum point performed with soil constituted only by the finer fraction, are presented in Figure 16.
18,5
19,0
19,5
20,0
20,5
21,0
21,5
6 7 8 9 10 11 12 13 14 15 16
Dry unit weight (kN/m
3)
Water content (%)
Pc=30
Pc=40
Pc=50
Pc=60
Pc=0
Figure 16 – Compaction curves from standard compaction tests

As one can realize, the maximum dry density values are all between 20.2 to 20.3 kN/m3, not varying with the coarser fraction. With regard to the water content, larger variations occur, being the higher value recorded for the mix-ture with the higher percentage of fines, as it would be expected, since the finer fraction can absorb higher amount of water than coarser fraction.
The comparison of Figures 14 and 16 allows concluding that the vibration compaction method is more efficient for these materials than the standard method, causing larger reduction of the voids of the mixture, probably, due to the changes in arrangements of the coarser particles.
3.2.3 – CORRECTIVE EQUATIONS
Torrey and Donaghe (1994) approach was adopted in tests results analysis. The values of interference coefficient of the dry density, cI , and the corrective factor of the optimum water content, optF , have been evaluated.
A higher correlation data for the tests was found when a bi-logarithms rela-tionship is adopted between cI and optF and the coarser fraction, CP , as fol-lows, for vibratory tests:
)9929.0((%)log0802.17193.1log 2 RPI Cc (7)
)9769.0((%)log845.0873.1log 2 RPF Copt (8)
and, as follows, for standard Proctor tests:
)9983.0(log1909.19067.1log 2 RPI CC (9)
)9983.0(log8291.08535.1log 2 RPF Gopt (10)
Some water content determinations were made for each fraction present in the mixture. A small oscillation of the coarser fraction water content relatively to the average value (equal to about 4.7%) was evidenced. This variation prac-tically turned out to be independent from the water content of the integral ma-terial.
To improve the correlation between the experimental results and the inter-polation expression of the corrective factor of the optimum water content, it was considered relevant to test a new methodology. The coarser fraction water content was assumed constant. On the basis of the optimum water content of the total material, the water content of the finer fraction was evaluated and the following expressions derived, respectively, from the vibratory and stan-dard compaction tests:
)9809.0(369.1115.17784.40617.319 223 RPPPw GGGF (11)
)9801.0(412.14793.12071.26 22 RPPw GGF (12)
It shell be noted that this water content values can be compare directly with water content of the finer fraction.
As mentioned before, the tests had been carried with coarser fractions be-tween 30 and 67.6%. In the sense of validate the tests application conditions, Figure 17 shows fraction density factor and maximum dry unit weigh of the

total material versus the percent coarser fraction obtained using the original Torrey and Donaghe equation and equations (1), (7) and (9).
60
70
80
90
100
110
120
130
140
150
0 10 20 30 40 50 60 70 80 90 100
FF (%)
PG (%)
Torrey e Donaghe (1994)
Vibratory compaction tests.
Standard compaction tests.
a)
18
19
20
21
22
23
24
25
26
27
28
0 10 20 30 40 50 60 70 80 90 100
d máx
T
PG (%)
Torrey and Donaghe (1994)
Standard compaction tests
Vibratory compaction tests
Maximum dry unit weight of the finer fraction
Current portuguese equation
b)
Figure 17 – a) Fraction density factor; b) maximum dry density of integral material versus coarser fraction
The figures analysis allows concluding that expressions (7) and (8) present fraction density factor values higher then 100%, for percent coarser fractions inferior to 20%, in the vibratory compaction tests, and 35%, in the standard compaction tests, which does not seem to have any real counterpart. For these percentages of coarser fractions, it’s verified that the maximum dry density of the total material is practically equal to the dry density of the finer fraction corrected for the presence of coarse particles. In the remaining domain, the curves have a very regular path and exceeding the Torrey and Donaghe ex-pression. In terms of maximum dry density of the total material, the values, now deduced, are always larger than the maximum dry density of the finer fraction, obtained in the standard Proctor test. These results are the conse-quence of the presence, in the interior of the finer matrix, of coarser particles with higher density.
Figure 18 presents optimum water content of total material as function of the coarser fraction based on Torrey and Donaghe expressions and equations (8), (10) to (12). The results calculated from the equations (10) to (12) show that the optimum water content of the total material is always monotonically decreasing with the percent coarser fraction, being the values gotten for the Odelouca mixtures always superiors to the deduced ones for Torrey and Dona-ghe. For higher coarser fraction percentages, the curves tend asymptotically to water contents (of 5.9%, Torrey and Donaghe expression, 8.5%, expression

(10), and of 8.8%, expression (8)) well superior to the gotten ones for the coarser fraction (about 4.7% on average). Thus, one suggests that the field of application of these expressions is limited inferiorly to 10% of coarser fraction and superiorly to 70%.
The alternative expression (11) presents a very different path from the re-mains, especially for extreme percentages of coarser fractions (reduced or very high). Comparing with the previous expressions, it will have some meaning from 25% until about 65% of percent coarser fraction, not seeming believable for superior percentages, where the curve evolves, first, in an ascending way, quickly descending, until the water content of the coarser fraction. The alter-native expression (12) has similar course to expressions (8) and (10) until per-centages of about 65% coarser fractions, starting to evolve in a descending way to the water content of the coarser fraction. Thus, it is suggested that the application field of this expression is limited only inferiorly to 10% of coarser fraction, being able to be applied in the remaining domain.
0
3
6
9
12
15
18
21
24
0 10 20 30 40 50 60 70 80 90 100
woptT
PG (%)
Torrey e Donaghe (1994)
Standard compaction tests
Standard compaction tests - water content of the finer fraction
Vibratory compaction tests
Vibratory compaction tests - water content of the finer fraction
Optimum water content of the finer fraction
Optimum water content of the coarser fraction
Figure 18 – Optimum water content of total material as function of the coarser fractions
4. CONSTRUCTION OF ODELOUCA DAM
The grain size distributions of the shell materials of the dam tested during construction are represented in Figure 19, as well as the granulometric range defined in the design. In the contact zones with the core, finer materials were employed.
The construction quality control of the compacted layers was done by the application of Hilf’s method (Hilf, 1959) to the fraction of the soil-rock mixture passing #4 sieve. Hilf’s method allows the evaluation of the degree of compac-tion and optimum water content deviation without the previous knowledge of the corresponding water content, as well as the ignorance of the standard Proctor reference curve. It also allows, with certain closeness, to justify the decision of acceptance or rejection of layers within a sufficiently short term,

without causing significant disruptions or interruptions to the construction work.
0,0
10,0
20,0
30,0
40,0
50,0
60,0
70,0
80,0
90,0
100,0
0,001 0,01 0,1 1 10 100 1000
% p
assi
ng
Diameter (mm)
Figure 19 – Grain size distribution of shell materials of Odelouca Dam
Basically, the procedure consists in performing an in situ sand cone test for the density determination of the layer in analysis. Then, the material collected is taken to the laboratory. The sample is divided in at least three specimens. One specimen, with the in work placing water content, is compacted with the standard effort and the respective unit weight is determined. In a proper graphic (Figure 20), the obtained density value is plotted in the 0% of water content deviation vertical line (point A). Next step consists in adding to the second specimen about 2% of weight of water and to perform a new compac-tion, in aim of the new density determination. The new density value, referred to in situ water content (transformed density), is plotted in the +2% of water content deviation vertical line in the graphic (point B).
The determination of a third point (point C) depends on the relative position of points A and B. If point B has a density higher than point A, a 4% of mate-rial weight of water is added to the third specimen. A new compaction is per-formed and the corresponding density is evaluated. Dividing this value for 1.04, one finds out the density referred to the natural water content (point C). The correspondent value is plotted in 4% deviation vertical line, in the same graphic. On the other end, if point B has a transformed density inferior to point A, the specimen should be dried (in about 2% of its weight) to perform a new compaction. The three points obtained are sufficient to define a parabolic curve, corresponding to the transformed density related to the in work placing water content, if the endpoints have ordinates below the midpoint. Otherwise it’s necessary to perform another compaction, with a different quantity of wa-ter, to determine a fourth point. After that, the three points closer to the maximum transform density must be chosen. Through these points a vertical axis parable (named the transform wet density curve) should be drawn and its peak coordinates are calculated (point with the maximum density).
The degree of compaction (D) and the compaction efficiency (C) are then evaluated by the following expressions:

peakparabolethetoingcorrespondDensity
densitysituInD (13)
contentwaterdeviationatDensity
densitysituInC
%0 (14)
Figure 20 – Hilf`s method graphic
The difference between the optimum water content and the in situ water content is the abscissa of the parabola peak. This value is corrected by adding the indicated value in the curve closest to the peak, taking into account the correction sign.
This method is relatively quick and easy to use and is therefore widespread in the compaction control of embankments. Nevertheless, the method only provides relative magnitudes (of compaction degree and water content devia-tion). So, it is common to complement it with the overnight oven determination of the in situ water content and the specimens’ water content after compaction tests, which allows the assessment of the dry density and establishment of the compaction curve based on three points.
Hilf’s method was developed only for fine soils. So, in order to set the appli-cations conditions and the applicability of this method to soil-rock mixtures, a testing program was implemented. First step consisted in performing a stan-dard Proctor test to establish the reference compaction curves for the passing material in the ¾” sieve, from the ASTM series, and for the passing in the #4 sieve. After the determination of the Proctor reference curve, Hilf’s method was applied, in laboratory, simulating for three in situ water contents, differing approximately 1% from each other, for the two material gradations.
The tests performed in laboratory allow concluding that: (i) Hilf’s method is applicable indifferently for the material passing ¾” sieve and #4 sieve, (ii) it is
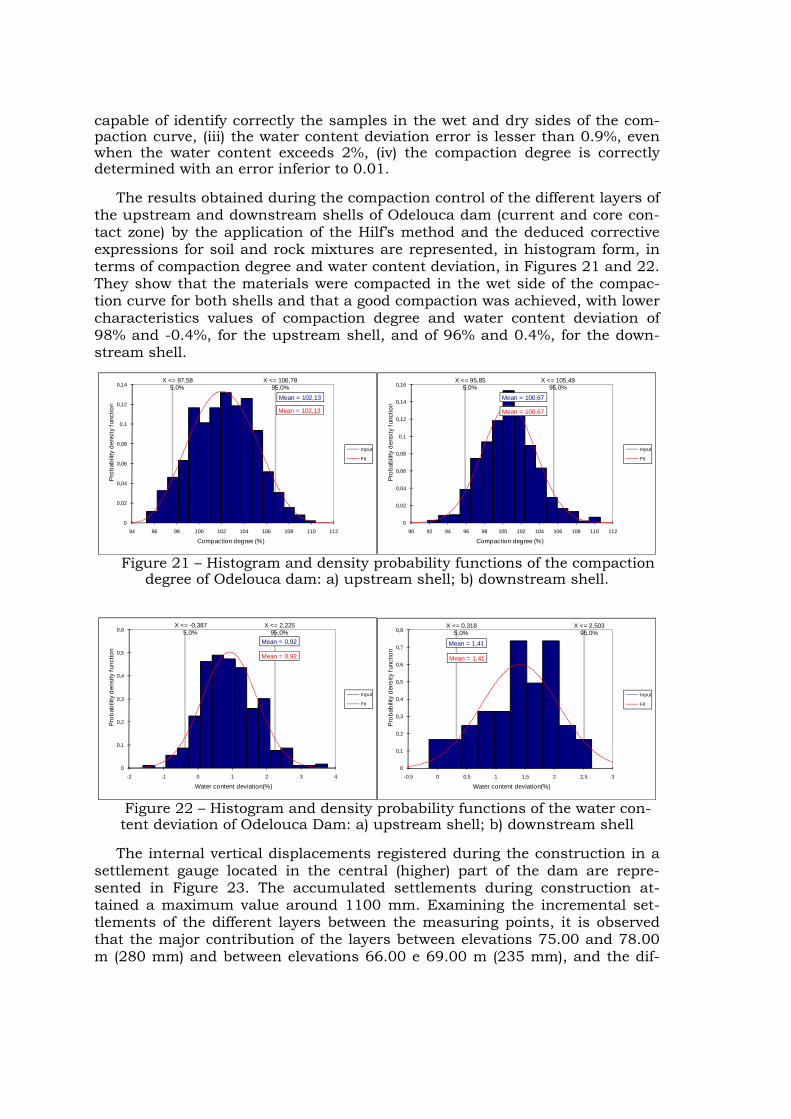
capable of identify correctly the samples in the wet and dry sides of the com-paction curve, (iii) the water content deviation error is lesser than 0.9%, even when the water content exceeds 2%, (iv) the compaction degree is correctly determined with an error inferior to 0.01.
The results obtained during the compaction control of the different layers of the upstream and downstream shells of Odelouca dam (current and core con-tact zone) by the application of the Hilf’s method and the deduced corrective expressions for soil and rock mixtures are represented, in histogram form, in terms of compaction degree and water content deviation, in Figures 21 and 22. They show that the materials were compacted in the wet side of the compac-tion curve for both shells and that a good compaction was achieved, with lower characteristics values of compaction degree and water content deviation of 98% and -0.4%, for the upstream shell, and of 96% and 0.4%, for the down-stream shell.
Mean = 102,13
Mean = 102,13
X <= 97,585,0%
X <= 106,7895,0%
0
0,02
0,04
0,06
0,08
0,1
0,12
0,14
94 96 98 100 102 104 106 108 110 112
Pro
bab
ility
den
sity
fun
ctio
n
Compaction degree (%)
Input
Fit
Mean = 100,67
Mean = 100,67
X <= 95,855,0%
X <= 105,4995,0%
0
0,02
0,04
0,06
0,08
0,1
0,12
0,14
0,16
90 92 94 96 98 100 102 104 106 108 110 112
Pro
bab
ility
den
sity
fun
ctio
n
Compaction degree (%)
Input
Fit
Figure 21 – Histogram and density probability functions of the compaction
degree of Odelouca dam: a) upstream shell; b) downstream shell.
Mean = 0,92
Mean = 0,92
X <= -0,3875,0%
X <= 2,22595,0%
0
0,1
0,2
0,3
0,4
0,5
0,6
-2 -1 0 1 2 3 4
Pro
bab
ility
den
sity
fun
ctio
n
Water content deviation(%)
Input
Fit
Mean = 1,41
Mean = 1,41
X <= 0,3185,0%
X <= 2,50395,0%
0
0,1
0,2
0,3
0,4
0,5
0,6
0,7
0,8
-0,5 0 0,5 1 1,5 2 2,5 3
Pro
bab
ility
den
sity
fun
ctio
n
Water content deviation(%)
Input
Fit
Figure 22 – Histogram and density probability functions of the water con-tent deviation of Odelouca Dam: a) upstream shell; b) downstream shell
The internal vertical displacements registered during the construction in a settlement gauge located in the central (higher) part of the dam are repre-sented in Figure 23. The accumulated settlements during construction at-tained a maximum value around 1100 mm. Examining the incremental set-tlements of the different layers between the measuring points, it is observed that the major contribution of the layers between elevations 75.00 and 78.00 m (280 mm) and between elevations 66.00 e 69.00 m (235 mm), and the dif-

ferent stiffness of the layers in the central third of the dam. It is expected the major settlement will be in this region, but not presenting the stiffness con-trast as shown in Figure 23. This effect could be in fact caused by different compaction characteristics of the layers or/and due to the exposure to severe atmospheric conditions.
The comparison of construction settlements of Odelouca and Beliche dam, allows to conclude that the maximum value is of the same order of magnitude, taking to account the different heights of the dams. Nevertheless, the progres-sion of the settlements is more regular in Odelouca. After heavy rains, the set-tlements only increased in the exposed layer and it did not affect the remain-ing embankment. As the compaction was done with water content larger than the optimum, lesser displacements than the ones observed in Beliche and Meimoa are expected for Odelouca dam during the first filling of the reservoir.
35.10
38.10
41.10
44.10
47.10
50.10
53.10
56.10
59.10
62.10
65.10
68.10
71.10
74.10
77.10
80.10
83.10
86.10
89.10
92.10
95.10
98.10
101.10
104.10
107.10
0 200 400 600 800 1000 1200
Settlement (mm)
Ele
va
tio
n (
m)
03.04.2008
09.05.2008
06.06.2008
08.07.2008
08.08.2008
05.09.2008
08.10.2008
05.11.2008
12.12.2008
08.01.2009
06.02.2009
12.03.2009
09.04.2009
11.05.2009
09.06.2009
35.10
38.10
41.10
44.10
47.10
50.10
53.10
56.10
59.10
62.10
65.10
68.10
71.10
74.10
77.10
80.10
83.10
86.10
89.10
92.10
95.10
98.10
101.10
104.10
0 50 100 150 200 250 300
Settlement (mm)
Ele
vati
on
(m
)
03.04.2008
09.05.2008
06.06.2008
08.07.2008
08.08.2008
05.09.2008
08.10.2008
05.11.2008
12.12.2008
08.01.2009
06.02.2009
12.03.2009
09.04.2009
11.05.2009
09.06.2009
Figure 23 – Settlements during Odelouca dam construction: a) accumu-lated; b) incremental
3. CONCLUSIONS
Having for reference the shells of Odelouca dam, this paper presents re-sults from vibratory and standard compaction tests, carried out for the deduc-tion of corrective expressions to apply in the embankment quality control in soil-rock mixtures.

The Torrey and Donaghe (1994) methodology was adopted in the tests re-sults analysis and correlation equations were established for the determina-tion of the maximum dry density and the optimum water content of the inte-gral material and the optimum water content of the finer fraction as function of coarser fraction percentage. A comparison of the different expressions is here present, as well as, the conditions of application of each one.
In terms of maximum dry density, as it could be expected, it can be seen that the standard process is more efficient in mixtures with a small coarser percentage and the vibratory compaction otherwise. Normally, in the field, the soil-rock mixtures are compacted with vibratory rollers. Thus, the equations derived with the vibratory tests should be used. The most used expressions used in Portugal show some differences in relation to the one’s here deduced.
These corrective expressions and Hilf’s method were applied for quality con-trol during the construction of Odelouca dam. The shell materials were com-pacted in the wet side of the compaction curves. In this dam, the settlements during the construction phase presented the same order of magnitude of Be-liche dam. Neverthless, lesser displacements than the ones observed in Be-liche and Meimoa are expected for Odelouca dam during the first filling of the reservoir.
REFERENCES
American National Standard – ASTM – D4718-87 (2001). Standard Practice for Correction of Unit Weight and Water Content for Soils Containing Oversize Particles.
Brito, A. (2006). Compactação de aterros de barragens. Novas Metodologias de Controlo. Tese de mestrado de Geotecnia para Engenharia Civil, Instituto Superior Técnico.
Caldeira, L. e Brito, A. (2007). Controlo da compactação de misturas de solo-enrocamento da barragem de Odelouca através de ensaios de vibração. Revista Luso-Brasileira de Geotecnia Nº.109, Março de 2007, pp.43-75.
JAE/LNEC (1994). Controlo de Construção e Caracterização Físico-Mecânica de Aterros de Mistura de Solo-Enrocamento. Fevereiro de 1994.
JAE (1998). Normas da Junta Autónoma de Estradas. Lisboa, 1998.
Hilf, J. W. (1959). A Rapid Method of Construction Control for Embankments of Cohesive Soil. Engineering Monograph No.26, Bureau of Reclamation, p.23.
Houston, S. L. and Walsh, K. D. (1993). Comparison of Rock Correction Me-thods For Compaction of Clayey Soils. Journal of Geot. Eng., Vol.119, Nº4, 763-778, April.
LNEC (1987). Aterros com Misturas de Solos e Enrocamentos. O Caso Particular dos Xistos Alterados Existentes em Portugal.
Maranha Neves, E. and Veiga Pinto, A. (1983). Compaction Control and Random Fill Materials. 8th Europ. Conf. on SMFE, Helsínquia.

Maranha das Neves, E. (1993). Fills and Embankments. General Report, Int. Symposium on Hard Soils and Soft Rocks, Athens, Vol.3, Sept.
NPB (1993). Normas de Projecto de Barragens.
Pardo de Santayana, Fernando (2006). Structural Behaviour of Beliche Earth-Rock Dam After Rehabilitation Works, 22nd Congress of Large Dams, Barcelona, Spain.
Torrey, V. H. e Donaghe, R. T. (1994). Compaction Control of Earth-Rock Mix-tures: A New Approach. Geotechnical Testing Journal, ASTM, VOl.17, No. 3, September 1994, pp. 371-386.
USBR 5515-89 (1989). Procedure for Performing Laboratory Compaction of Soils Containing Gravel. U.S. Dept. of the Interior. Bureau of Reclamation. Denver. Colo.
USCOLD (1998). Construction Testing of Embankment Materials Containing Large Particles. U.S: Committee on Large Dams, April 1988.
Veiga Pinto, A. (1983). Previsão do Comportamento Estrutural de Barragens de Enrocamento. Tese para obtenção do grau de especialista. Lisboa, LNEC.
Winter, M.G.; Suhardi (1993). The Effect of Stone Content on the Determina-tion of Acceptability for Earthworking. Proc. Conf. Engineered Fills. University of Newcastle upon Tyne. 312-319.