combustion optimisation handbook
DESCRIPTION
A 12 page technical guide produced for ABB's Measurement Products business explaining how its oxygen probe technology can be deployed in power generation applications to help optimise combustion efficiency.TRANSCRIPT

Power and productivityfor a better world TM
A beginner’s guide to combustion optimizationImprove efficiency, lower environmental impact, reduce downtime
ABB Instrumentation
IntroductionThis guide discusses how best to optimize combustion efficiency in any application using combustion plant.
Combustion optimization in some form or other has become an absolute necessity for all combustion processes. Optimization improves efficiency, reduces environmental impact, reduces maintenance requirements and increases the time between maintenance shutdowns. There are many types of application where combustion optimization will be a key requirement. These include:
– Process heaters - the driver here is to increase throughput of feedstock, not necessarily fuel efficiency
– Waste incinerators - waste throughput is the main driver but environmental impact also has to be considered
– Steam raising, for power generation or other processes, pulp and paper, food and beverage etc, where fuel efficiency is the main driver
In any of the above examples, poor control of the combustion process may ultimately lead to damage to the plant, with problems such as soot formation, hotspots and/or corrosion in the flue ducts, to name but a few. In each case, the incidence of such problems, especially if left unresolved, will result in increased maintenance expenditure and a reduction in the life cycle of the plant.
Combustion guide_AS_v6.indd 1 19/6/09 3:39:43 pm
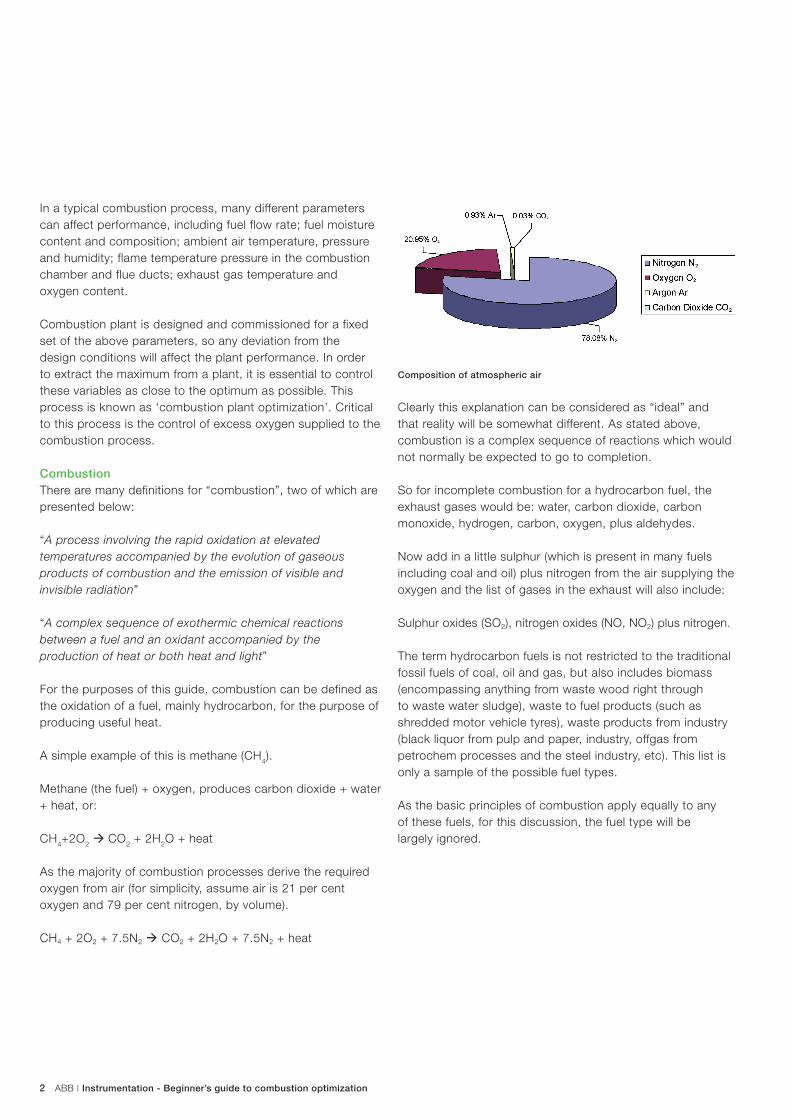
ABB | Instrumentation - Beginner’s guide to combustion optimization22
In a typical combustion process, many different parameters can affect performance, including fuel flow rate; fuel moisture content and composition; ambient air temperature, pressure and humidity; flame temperature pressure in the combustion chamber and flue ducts; exhaust gas temperature and oxygen content.
Combustion plant is designed and commissioned for a fixed set of the above parameters, so any deviation from the design conditions will affect the plant performance. In order to extract the maximum from a plant, it is essential to control these variables as close to the optimum as possible. This process is known as ‘combustion plant optimization’. Critical to this process is the control of excess oxygen supplied to the combustion process.
CombustionThere are many definitions for “combustion”, two of which are presented below:
“A process involving the rapid oxidation at elevated temperatures accompanied by the evolution of gaseous products of combustion and the emission of visible and invisible radiation”
“A complex sequence of exothermic chemical reactions between a fuel and an oxidant accompanied by the production of heat or both heat and light”
For the purposes of this guide, combustion can be defined as the oxidation of a fuel, mainly hydrocarbon, for the purpose of producing useful heat.
A simple example of this is methane (CH4).
Methane (the fuel) + oxygen, produces carbon dioxide + water + heat, or:
CH4+2O2 ‡ CO2 + 2H2O + heat
As the majority of combustion processes derive the required oxygen from air (for simplicity, assume air is 21 per cent oxygen and 79 per cent nitrogen, by volume).
CH4 + 2O2 + 7.5N2 ‡ CO2 + 2H2O + 7.5N2 + heat
Clearly this explanation can be considered as “ideal” and that reality will be somewhat different. As stated above, combustion is a complex sequence of reactions which would not normally be expected to go to completion.
So for incomplete combustion for a hydrocarbon fuel, the exhaust gases would be: water, carbon dioxide, carbon monoxide, hydrogen, carbon, oxygen, plus aldehydes.
Now add in a little sulphur (which is present in many fuels including coal and oil) plus nitrogen from the air supplying the oxygen and the list of gases in the exhaust will also include:
Sulphur oxides (SO2), nitrogen oxides (NO, NO2) plus nitrogen.
The term hydrocarbon fuels is not restricted to the traditional fossil fuels of coal, oil and gas, but also includes biomass (encompassing anything from waste wood right through to waste water sludge), waste to fuel products (such as shredded motor vehicle tyres), waste products from industry (black liquor from pulp and paper, industry, offgas from petrochem processes and the steel industry, etc). This list is only a sample of the possible fuel types.
As the basic principles of combustion apply equally to any of these fuels, for this discussion, the fuel type will be largely ignored.
Composition of atmospheric air
Combustion guide_AS_v6.indd 2 19/6/09 3:39:44 pm

ABB | Instrumentation - Beginner’s guide to combustion optimization 3
Combustion efficiencyIdeal or perfect combustion assumes that exactly the right amount of oxygen is supplied to completely combust the supplied fuel; this ratio is known as the stoichiometric air / fuel mixture.
Each fuel will have a different ratio, the exact amount being based on the hydrogen/carbon ratio of the selected fuel.
Using the example above, for methane this will be 9.52 units of air to one unit of methane.
Under such circumstances, all the potential chemical energy will be released from the fuel as heat and a combustion efficiency of 100 per cent is achieved.
In reality, however, this is impossible to achieve. If only the theoretical amount of air was available, the combustion process would not go to completion due to incomplete mixing of fuel and air, resulting in un-burned combustibles in the waste gases. These combustibles will still retain some unreleased potential chemical energy and so the combustion process is less than 100 per cent efficient.
To improve this situation, additional air is supplied, often termed as “excess air”.
Too much excess air, however, will also decrease efficiency. Some of the heat generated is lost via the stack as hot flue gases, known as flue gas heat loss or stack losses.
Whilst heat released from the combustion process can approach 100 per cent efficiency, the transfer of this heat to raising steam introduces losses. To ensure optimum combustion efficiency, the amount of excess air supplied needs to be closely monitored and controlled. Continuous monitoring of the exhaust gases is therefore required, with the oxygen value being the preferred measurement for combustion control.
The percentage of oxygen by volume in the exhaust gases of a combustion process is directly related to excess air, fuel/air ratio and combustion efficiency.
Combustion efficiency is a key factor when calculating the total efficiency of combustion plant. In simple terms, it describes the total energy contained per unit of fuel minus the energy carried away by the flue gas and unburned fuel exiting the stack.
Excess Air Oxygen
Natural gas 5 to 10% 1 to 2%
Propane gas 5 to 10% 1 to 2%
Town gas 5 to 10% 1 to 2%
Number 6 Oil 10 to 15% 2 to 3%
Coal (Pulverized) 15 to 20% 3 to 4%
Coal (Stocker) 20 to 30% 4 to 6%
Biomass fuels 15 to 40% 3 to 8%
Combustion efficiency calculations are based on complete fuel consumption and take into account:
– The chemical composition of a particular fuel and the amount of potential energy locked inside it
– The net temperature of the stack gases– The amount of oxygen left over following the
combustion process
Together, these factors can be used to derive an efficiency measurement based on the potential maximum heating value of the fuel compared against the actual heating value being lost through stack losses.
Efficient combustion of a fuel in any industrial process is clearly essential in reducing operation costs, which can be considerable, and also reducing pollution to enable compliance with local environmental legislation.
A useful method of determining the combustion efficiency is to use the Siegert formula.
Based on empirical data, it uses the net exhaust temperature, a fuel constant calculated from the hydrogen/carbon ratio of the fuel and the excess oxygen measurement of the exhaust gas:
Efficiency = 100 - (K(T1-T2) / (20.8 - % O2)
Typical exhaust gas composition
Combustion guide_AS_v6.indd 3 19/6/09 3:39:46 pm
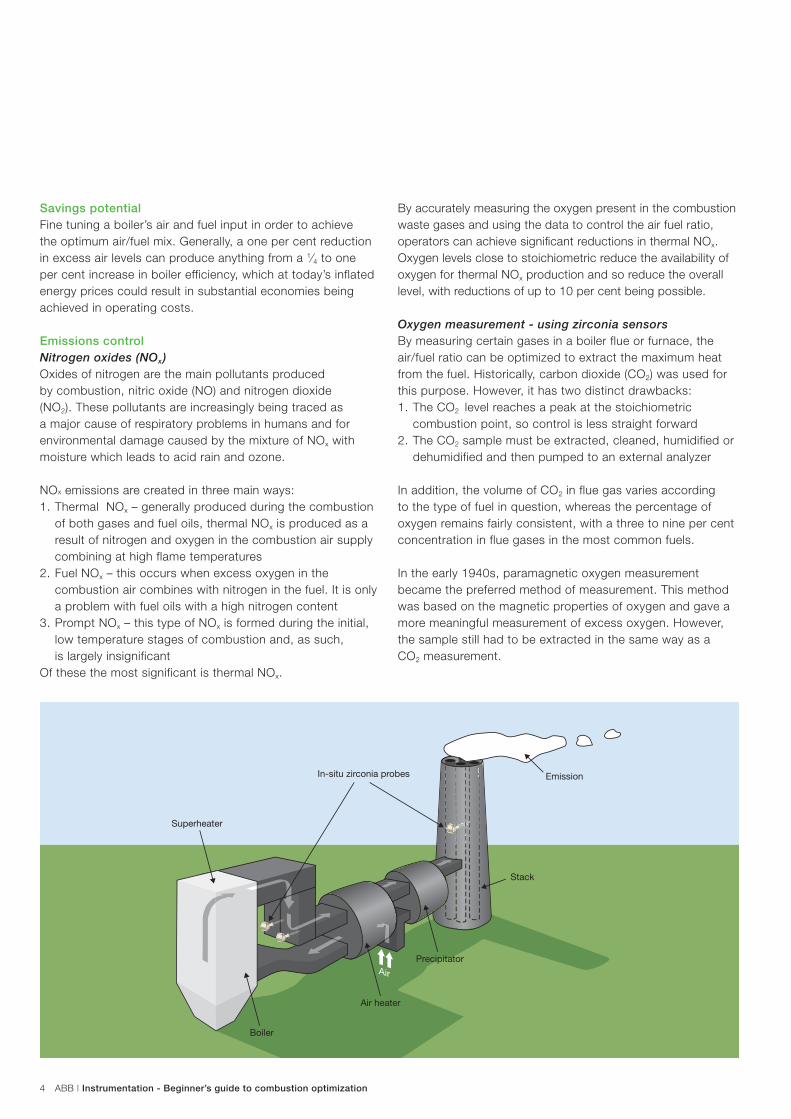
ABB | Instrumentation - Beginner’s guide to combustion optimization4
Savings potentialFine tuning a boiler’s air and fuel input in order to achieve the optimum air/fuel mix. Generally, a one per cent reduction in excess air levels can produce anything from a 1⁄4 to one per cent increase in boiler efficiency, which at today’s inflated energy prices could result in substantial economies being achieved in operating costs.
Emissions controlNitrogen oxides (NOx)Oxides of nitrogen are the main pollutants produced by combustion, nitric oxide (NO) and nitrogen dioxide (NO2). These pollutants are increasingly being traced as a major cause of respiratory problems in humans and for environmental damage caused by the mixture of NOx with moisture which leads to acid rain and ozone.
NOx emissions are created in three main ways:1. Thermal NOx – generally produced during the combustion
of both gases and fuel oils, thermal NOx is produced as a result of nitrogen and oxygen in the combustion air supply combining at high flame temperatures
2. Fuel NOx – this occurs when excess oxygen in the combustion air combines with nitrogen in the fuel. It is only a problem with fuel oils with a high nitrogen content
3. Prompt NOx – this type of NOx is formed during the initial, low temperature stages of combustion and, as such, is largely insignificant
Of these the most significant is thermal NOx.
By accurately measuring the oxygen present in the combustion waste gases and using the data to control the air fuel ratio, operators can achieve significant reductions in thermal NOx. Oxygen levels close to stoichiometric reduce the availability of oxygen for thermal NOx production and so reduce the overall level, with reductions of up to 10 per cent being possible. Oxygen measurement - using zirconia sensorsBy measuring certain gases in a boiler flue or furnace, the air/fuel ratio can be optimized to extract the maximum heat from the fuel. Historically, carbon dioxide (CO2) was used for this purpose. However, it has two distinct drawbacks:1. The CO2 level reaches a peak at the stoichiometric
combustion point, so control is less straight forward2. The CO2 sample must be extracted, cleaned, humidified or
dehumidified and then pumped to an external analyzer
In addition, the volume of CO2 in flue gas varies according to the type of fuel in question, whereas the percentage of oxygen remains fairly consistent, with a three to nine per cent concentration in flue gases in the most common fuels.
In the early 1940s, paramagnetic oxygen measurement became the preferred method of measurement. This method was based on the magnetic properties of oxygen and gave a more meaningful measurement of excess oxygen. However, the sample still had to be extracted in the same way as a CO2 measurement.
Air
Combustion guide_AS_v6.indd 4 19/6/09 3:39:47 pm
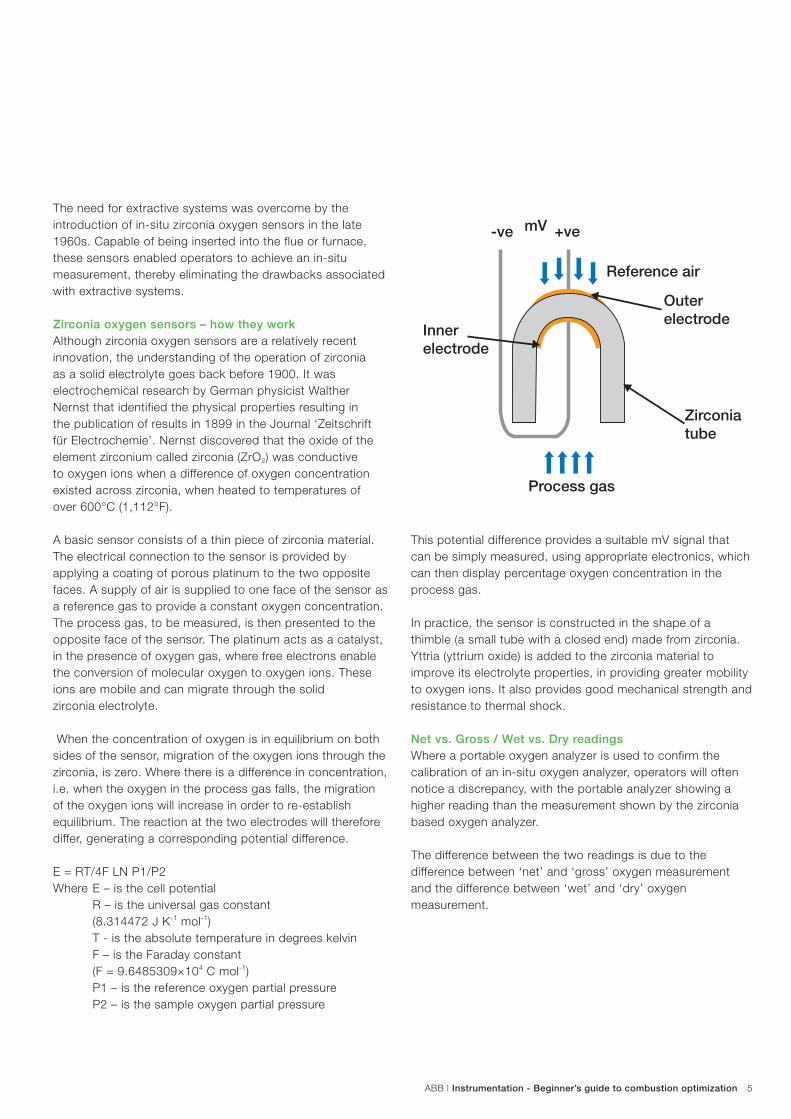
ABB | Instrumentation - Beginner’s guide to combustion optimization 5
The need for extractive systems was overcome by the introduction of in-situ zirconia oxygen sensors in the late 1960s. Capable of being inserted into the flue or furnace, these sensors enabled operators to achieve an in-situ measurement, thereby eliminating the drawbacks associated with extractive systems.
Zirconia oxygen sensors – how they workAlthough zirconia oxygen sensors are a relatively recent innovation, the understanding of the operation of zirconia as a solid electrolyte goes back before 1900. It was electrochemical research by German physicist Walther Nernst that identified the physical properties resulting in the publication of results in 1899 in the Journal ‘Zeitschrift für Electrochemie’. Nernst discovered that the oxide of the element zirconium called zirconia (ZrO2) was conductive to oxygen ions when a difference of oxygen concentration existed across zirconia, when heated to temperatures of over 600°C (1,112°F).
A basic sensor consists of a thin piece of zirconia material. The electrical connection to the sensor is provided by applying a coating of porous platinum to the two opposite faces. A supply of air is supplied to one face of the sensor as a reference gas to provide a constant oxygen concentration. The process gas, to be measured, is then presented to the opposite face of the sensor. The platinum acts as a catalyst, in the presence of oxygen gas, where free electrons enable the conversion of molecular oxygen to oxygen ions. These ions are mobile and can migrate through the solid zirconia electrolyte.
When the concentration of oxygen is in equilibrium on both sides of the sensor, migration of the oxygen ions through the zirconia, is zero. Where there is a difference in concentration, i.e. when the oxygen in the process gas falls, the migration of the oxygen ions will increase in order to re-establish equilibrium. The reaction at the two electrodes will therefore differ, generating a corresponding potential difference.
E = RT/4F LN P1/P2Where E – is the cell potential
R – is the universal gas constant (8.314472 J K-1 mol-1)
T - is the absolute temperature in degrees kelvin F – is the Faraday constant
(F = 9.6485309×10⁴ C mol-1) P1 – is the reference oxygen partial pressure P2 – is the sample oxygen partial pressure
This potential difference provides a suitable mV signal that can be simply measured, using appropriate electronics, which can then display percentage oxygen concentration in the process gas.
In practice, the sensor is constructed in the shape of a thimble (a small tube with a closed end) made from zirconia. Yttria (yttrium oxide) is added to the zirconia material to improve its electrolyte properties, in providing greater mobility to oxygen ions. It also provides good mechanical strength and resistance to thermal shock.
Net vs. Gross / Wet vs. Dry readingsWhere a portable oxygen analyzer is used to confirm the calibration of an in-situ oxygen analyzer, operators will often notice a discrepancy, with the portable analyzer showing a higher reading than the measurement shown by the zirconia based oxygen analyzer.
The difference between the two readings is due to the difference between ‘net’ and ‘gross’ oxygen measurement and the difference between ‘wet’ and ‘dry’ oxygen measurement.
Process gas
Inner electrode
Outer electrode
Zirconia tube
Reference air
-ve mV +ve
Combustion guide_AS_v6.indd 5 19/6/09 3:39:49 pm
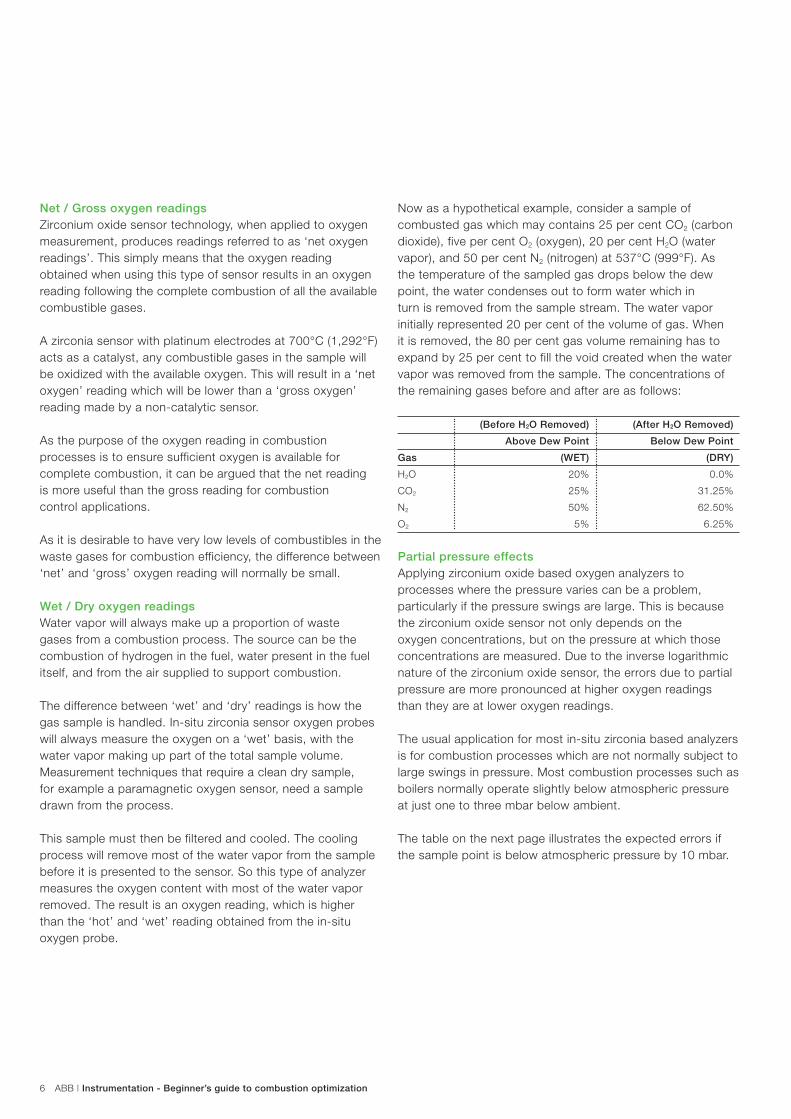
ABB | Instrumentation - Beginner’s guide to combustion optimization6
Net / Gross oxygen readingsZirconium oxide sensor technology, when applied to oxygen measurement, produces readings referred to as ‘net oxygen readings’. This simply means that the oxygen reading obtained when using this type of sensor results in an oxygen reading following the complete combustion of all the available combustible gases.
A zirconia sensor with platinum electrodes at 700°C (1,292°F) acts as a catalyst, any combustible gases in the sample will be oxidized with the available oxygen. This will result in a ‘net oxygen’ reading which will be lower than a ‘gross oxygen’ reading made by a non-catalytic sensor.
As the purpose of the oxygen reading in combustion processes is to ensure sufficient oxygen is available for complete combustion, it can be argued that the net reading is more useful than the gross reading for combustion control applications.
As it is desirable to have very low levels of combustibles in the waste gases for combustion efficiency, the difference between ‘net’ and ‘gross’ oxygen reading will normally be small.
Wet / Dry oxygen readingsWater vapor will always make up a proportion of waste gases from a combustion process. The source can be the combustion of hydrogen in the fuel, water present in the fuel itself, and from the air supplied to support combustion.
The difference between ‘wet’ and ‘dry’ readings is how the gas sample is handled. In-situ zirconia sensor oxygen probes will always measure the oxygen on a ‘wet’ basis, with the water vapor making up part of the total sample volume. Measurement techniques that require a clean dry sample, for example a paramagnetic oxygen sensor, need a sample drawn from the process.
This sample must then be filtered and cooled. The cooling process will remove most of the water vapor from the sample before it is presented to the sensor. So this type of analyzer measures the oxygen content with most of the water vapor removed. The result is an oxygen reading, which is higher than the ‘hot’ and ‘wet’ reading obtained from the in-situ oxygen probe.
Now as a hypothetical example, consider a sample of combusted gas which may contains 25 per cent CO2 (carbon dioxide), five per cent O2 (oxygen), 20 per cent H2O (water vapor), and 50 per cent N2 (nitrogen) at 537°C (999°F). As the temperature of the sampled gas drops below the dew point, the water condenses out to form water which in turn is removed from the sample stream. The water vapor initially represented 20 per cent of the volume of gas. When it is removed, the 80 per cent gas volume remaining has to expand by 25 per cent to fill the void created when the water vapor was removed from the sample. The concentrations of the remaining gases before and after are as follows:
(Before H2O Removed) (After H2O Removed)
Above Dew Point Below Dew Point
Gas (WET) (DRY)
H2O 20% 0.0%
CO2 25% 31.25%
N2 50% 62.50%
O2 5% 6.25%
Partial pressure effectsApplying zirconium oxide based oxygen analyzers to processes where the pressure varies can be a problem, particularly if the pressure swings are large. This is because the zirconium oxide sensor not only depends on the oxygen concentrations, but on the pressure at which those concentrations are measured. Due to the inverse logarithmic nature of the zirconium oxide sensor, the errors due to partial pressure are more pronounced at higher oxygen readings than they are at lower oxygen readings.
The usual application for most in-situ zirconia based analyzers is for combustion processes which are not normally subject to large swings in pressure. Most combustion processes such as boilers normally operate slightly below atmospheric pressure at just one to three mbar below ambient.
The table on the next page illustrates the expected errors if the sample point is below atmospheric pressure by 10 mbar.
Combustion guide_AS_v6.indd 6 19/6/09 3:39:49 pm

ABB | Instrumentation - Beginner’s guide to combustion optimization 7
Concentration Theoretical cell Cell output mV Difference Analyzer display % error of reading Error in %O2
of reading oxygen output in adjusted for
at reduced pressure
pressure difference
1% 63.78 mV 63.98 mV -0.21 mV 0.99% O2 -0.99% 0.01% O2
2% 49.24 mV 49.45 mV -0.21 mV 1.98% O2 -0.99% 0.02% O2
3% 40.74 mV 40.95 mV -0.21 mV 2.97% O2 -0.99% 0.03% O2
4% 34.71 mV 34.92 mV -0.21 mV 3.96% O2 -0.99% 0.04% O2
5% 30.04 mV 30.24 mV -0.21 mV 4.95% O2 -0.99% 0.05% O2
6% 26.21 mV 26.42 mV -0.21 mV 5.94% O2 -0.99% 0.06% O2
7% 22.98 mV 23.19 mV -0.21 mV 6.93% O2 -0.99% 0.07% O2
8% 20.18 mV 20.39 mV -0.21 mV 7.92% O2 -0.99% 0.08% O2
9% 17.71 mV 17.92 mV -0.21 mV 8.91% O2 -0.99% 0.09% O2
10% 15.50 mV 15.71 mV -0.21 mV 9.90% O2 -0.99% 0.10% O2
Examining column four in the table shows that the mV error is a constant offset. This shows that calibration of the probe whilst in-situ, with the process running at normal fixed pressure, will compensate for the difference in pressure between the sample and the sensor reference air.
An application that in-situ zirconia based analyzers cannot easily handle is where the process pressure is not only significantly different to ambient pressure, but large variations are also experienced. When both the process oxygen concentration and process pressure changes, it is impossible to ascertain whether the change in the display of the oxygen analyzer is attributable to a change in the process pressure or to a change in the oxygen concentration.
There are two possible solutions in use to overcome this situation. The most common is to balance the reference air supply pressure to that of the process.
The alternative method is to compensate for the difference in pressure between the reference air and the sample. This is simply done by measuring the instantaneous sample pressure, input the data into the oxygen analyzer, or the plant’s DCS, which can then automatically adjust the oxygen reading for the difference between atmospheric pressure and the sample pressure.
E = RT/4F LN (Preference * O2 reference) / (Psample * O2 sample)
Where: E – is the cell potential R – is the universal gas constant
(8.314472 J K-1 mol-1) T – is the absolute temperature in degrees Kelvin F – is the Faraday constant
(F = 9.6485309×10⁴ C mol-1) Preference – is the reference absolute pressure Psample – is the sample absolute pressure O2 reference – is the reference oxygen concentration O2 sample – is the sample oxygen concentration
Combustion guide_AS_v6.indd 7 19/6/09 3:39:49 pm
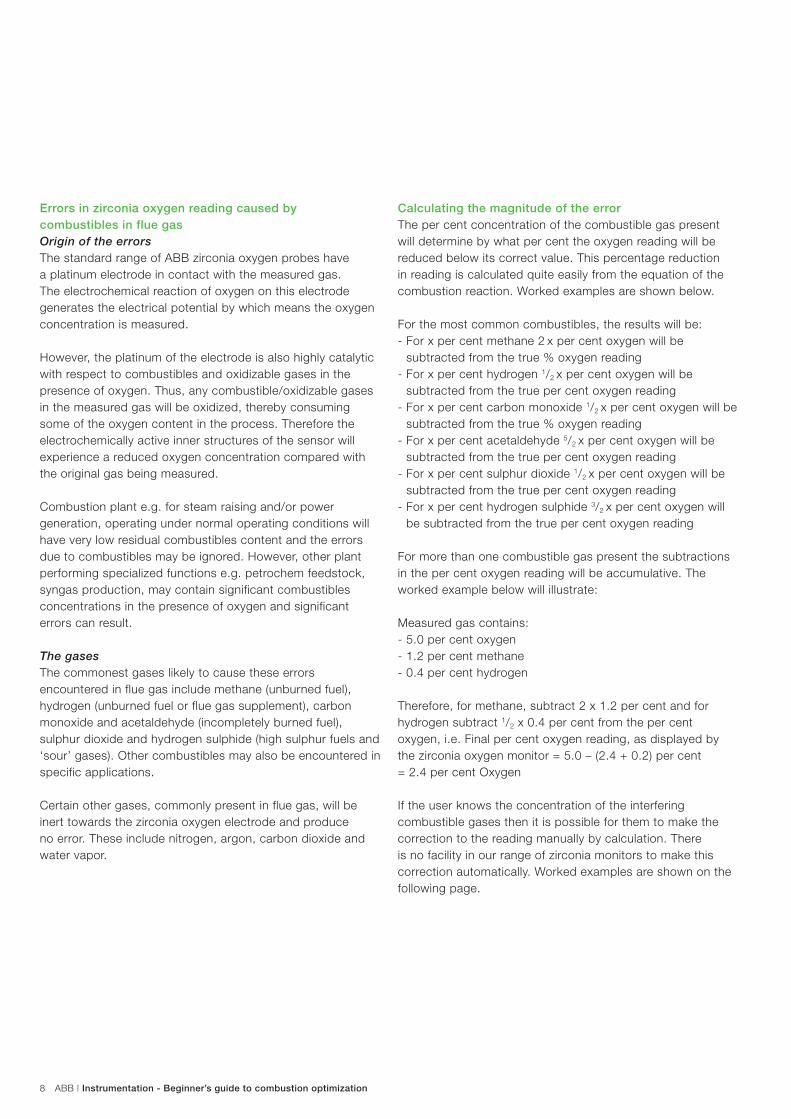
ABB | Instrumentation - Beginner’s guide to combustion optimization8
Errors in zirconia oxygen reading caused by combustibles in flue gasOrigin of the errors The standard range of ABB zirconia oxygen probes have a platinum electrode in contact with the measured gas. The electrochemical reaction of oxygen on this electrode generates the electrical potential by which means the oxygen concentration is measured.
However, the platinum of the electrode is also highly catalytic with respect to combustibles and oxidizable gases in the presence of oxygen. Thus, any combustible/oxidizable gases in the measured gas will be oxidized, thereby consuming some of the oxygen content in the process. Therefore the electrochemically active inner structures of the sensor will experience a reduced oxygen concentration compared with the original gas being measured.
Combustion plant e.g. for steam raising and/or power generation, operating under normal operating conditions will have very low residual combustibles content and the errors due to combustibles may be ignored. However, other plant performing specialized functions e.g. petrochem feedstock, syngas production, may contain significant combustibles concentrations in the presence of oxygen and significant errors can result.
The gases The commonest gases likely to cause these errors encountered in flue gas include methane (unburned fuel), hydrogen (unburned fuel or flue gas supplement), carbon monoxide and acetaldehyde (incompletely burned fuel), sulphur dioxide and hydrogen sulphide (high sulphur fuels and ‘sour’ gases). Other combustibles may also be encountered in specific applications.
Certain other gases, commonly present in flue gas, will be inert towards the zirconia oxygen electrode and produce no error. These include nitrogen, argon, carbon dioxide and water vapor.
Calculating the magnitude of the errorThe per cent concentration of the combustible gas present will determine by what per cent the oxygen reading will be reduced below its correct value. This percentage reduction in reading is calculated quite easily from the equation of the combustion reaction. Worked examples are shown below.
For the most common combustibles, the results will be:- For x per cent methane 2 x per cent oxygen will be
subtracted from the true % oxygen reading- For x per cent hydrogen 1/2 x per cent oxygen will be
subtracted from the true per cent oxygen reading- For x per cent carbon monoxide 1/2 x per cent oxygen will be
subtracted from the true % oxygen reading- For x per cent acetaldehyde 5/2 x per cent oxygen will be
subtracted from the true per cent oxygen reading- For x per cent sulphur dioxide 1/2 x per cent oxygen will be
subtracted from the true per cent oxygen reading- For x per cent hydrogen sulphide 3/2 x per cent oxygen will
be subtracted from the true per cent oxygen reading
For more than one combustible gas present the subtractions in the per cent oxygen reading will be accumulative. The worked example below will illustrate:
Measured gas contains:- 5.0 per cent oxygen- 1.2 per cent methane- 0.4 per cent hydrogen
Therefore, for methane, subtract 2 x 1.2 per cent and for hydrogen subtract 1/2 x 0.4 per cent from the per cent oxygen, i.e. Final per cent oxygen reading, as displayed by the zirconia oxygen monitor = 5.0 – (2.4 + 0.2) per cent = 2.4 per cent Oxygen
If the user knows the concentration of the interfering combustible gases then it is possible for them to make the correction to the reading manually by calculation. There is no facility in our range of zirconia monitors to make this correction automatically. Worked examples are shown on the following page.
Combustion guide_AS_v6.indd 8 19/6/09 3:39:50 pm

ABB | Instrumentation - Beginner’s guide to combustion optimization 9
Calculating the error from first principlesThe per cent reduction in oxygen content, and hence the per cent reduction in the oxygen reading, is calculated from the per cent concentration of the combustible and the volume ratio of oxygen involved in its combustion. The ratio of volume oxygen consumed to volume of combustible is the same as the molecular ratio as determined by the chemical combustion equation.
Consider methane as a worked example. The equation for its combustion is:
CH4 + 2 O2 ‡ CO2 + 2 H2O
Hence, each volume of methane consumes two volumes of oxygen and, hence, x per cent methane reduces the oxygen reading by 2 x per cent.
The combustion equations for the other gases described above are:
- H2 + 1/2 O2 ‡ H2O- CO + 1/2 O2 ‡ CO2
- CH3CHO + 5/2 O2 ‡ 2 CO2 + 2 H2O- SO2 + 1/2 O2 ‡ SO3
- H2S + 3/2 O2 ‡ H2O + SO2
The ratios, and hence the errors, for sulphur dioxide and hydrogen sulphide may not be precisely according to the combustion equations shown. The oxidation of sulphur dioxide may not go to completion in the timescale of passing through the catalytic electrode and some of the sulphur dioxide from the hydrogen sulphide oxidation may oxidize further to sulphur trioxide.
SummaryThis guide has hopefully helped you to achieve a better understanding of combustion optimization, how to achieve it and the role that zirconia oxygen measurement can play in providing more accurate control of the combustion process.
As stressed throughout this guide, combustion optimization is not a precise science, being subject to a wide number of variables, any one of which can affect performance.
As a leader in the provision of instrumentation and other equipment for combustion control and optimization, ABB is well placed to help you with advice, expertise and products for your application.
For more information about how you can make your combustion process more efficient, or if you have any queries about the information in this guide, call +44 (0)1453 826661.
Alternatively, you can visit our web site at www.abb.com/instrumentation.
Combustion guide_AS_v6.indd 9 19/6/09 3:39:50 pm
ABB | Instrumentation - Beginner’s guide to combustion optimization10
Air/fuel ration – page 3 Carbon dioxide (as means of measuring flue gas) – page 4 Combustion – page 2Combustion efficiency – page 3Combustion optimization – page 1Combustion plant – page 2Dew point – page 6 Dry oxygen measurement – pages 5, 6Dry readings – pages 5, 6Emissions control – page 4 Errors (caused by partial pressure) – pages 6, 7Errors (in zirconia oxygen reading) – pages 8, 9Excess air – page 3 Excess oxygen – page 4 Gross oxygen measurement – pages 5, 6 Gross readings – pages 5, 6In-situ zirconia oxygen sensors – page 5Nernst, Walther – page 5 Net oxygen measurement – pages 5, 6 Net readings – pages 5, 6Nitrogen oxide (NOx) – page 4 Oxygen measurement – page 4 Paramagnetic oxygen measurement – pages 4, 6 Partial pressure effects – page 6 Platinum – pages 5, 8Portable oxygen analyzers – page 5Siegert formula – page 3Stoichiometric – pages 3, 4Walther Nernst – page 5Wet oxygen measurement – pages 5, 6 Wet readings – pages 5, 6Yttria – page 5 Yttrium oxide – page 5 Zirconia sensors – pages 4, 5
Index of key terms
Combustion guide_AS_v6.indd 10 19/6/09 3:39:50 pm

ABB | Instrumentation - Beginner’s guide to combustion optimization 11
Notes
Combustion guide_AS_v6.indd 11 19/6/09 3:39:50 pm

Power and productivityfor a better world TM
Contact us
Ref
: AD
-Com
bust
ion-
Gui
de-E
N-I
ssue
1For more information please contact:
GermanyABB Automation Products GmbHBorsigstr. 263755 AlzenauPhone: +49 551 905 534Fax: +49 551 905 555
UKABB Limited Oldends LaneStonehouseGloucestershire, GL10 3TAPhone: +44 1453 826 661Fax: +44 1453 829 671
ItalyABB S.p.A.ABB SACE Division Via Statale 11322016 Lenno (CO)Phone: +39 0344 58111Fax: +39 0344 56278
www.abb.com/instrumentation
USAABB Inc. Automation Technology Products125 E. County Line RdWarminster PA 18974-4995Phone: +1 215 674 6000Fax: +1 215 674 7183
ChinaABB Engineering (Shanghai) Ltd.No.5, Lane 369, Chuangye Road,Kangqiao Town, Nanhui District,Shanghai 201319, P.R. ChinaPhone: +86(0) 21 6105 6666Fax: +86(0) 21 6105 6677
We reserve the right to make technical changes or modify the contents of this document without prior notice. With regard to purchase orders, the agreed particulars shall prevail. ABB does not accept any responsibility whatsoever for potential errors or possible lack of information in this document.
We reserve all rights in this document and in the subject matter and illustrations contained therein. Any reproduction, disclosure to third parties or utilization of its contents – in whole or in parts – is forbidden without prior written consent of ABB.
Printed in UK (06.2009) ©Copyright 2009 ABB All rights reserved
Combustion guide_AS_v6.indd 12 19/6/09 3:39:51 pm