combining social and government open data for...
TRANSCRIPT

Combining Social and Government Open Data for Participatory Decision-Making
Evangelos Kalampokis1, 2, Michael Hausenblas1, Konstantinos Tarabanis2
1 Digital Enterprise Research Institute, National University of Ireland, Galway
{firstname.lastname}@deri.org 2 Information Systems Lab, University of Macedonia, Thessaloniki, Greece
{ekal, kat}@uom.gr
Abstract. In the last years, several research endeavors were launched aiming at involving popular social media platforms in electronic participation. These early endeavors seem to present some essential limitations related mainly to scalability and uptake. In order to avoid these limitations, we introduce a two-phased approach for supporting participatory decision-making based on the integration and analysis of social and government open data. The proposed approach is based on the literature related to the analysis of massive amounts of social data for future events prediction. In this paper we also present a Web data driven architecture for the implementation of the proposed approach. The architecture is based on the use of linked data paradigm as a layer that will enable integration of data from different sources. We anticipate that the proposed approach will (i) allow decision makers to understand and predict public opinion and reaction about specific decisions; and (ii) enable citizens to inadvertently contribute in decision-making.
Keywords: eParticipation, Open government data, Social data, Linked data, Data driven architecture.
1 Introduction
In modern western democracies the power of decision-making have been assigned to people who have been elected through legitimate processes to represent the public. However, this does not go without responsibilities as “representing means acting in the interest of the represented, in a manner responsive to them” [1]. The representatives must act in such a way that there is no conflict, or that if it occurs an explanation is called for. To this end, public participation was introduced as a group of procedures designed to consult, involve and inform the public to allow those affected by a decision to have an input into that decision [2], [3].
Information and communication technologies have made it possible to enhance traditional participation procedures by electronic means, introducing in this way the concept of electronic participation (eParticipation). As a result, the last years a number of eParticipation initiatives launched throughout the globe [4], [5].
However, the efficiency of these initiatives has been put to the question mainly because they proved rather unsuccessful to attract large numbers of participants, which would constitute a representative sample of the affected population [6], [7]. In order to overcome this issue, governments and academia started to consider using popular social media platforms such as Facebook, Twitter and WordPress and exploiting social data in eParticipation [8]. Social data refers to data that is created and voluntarily shared by citizens through social media platforms. This sort of data can be characterized as subjective because it communicates personal opinions, thoughts and preferences.
In this context, a number of research endeavors were recently launched aiming at involving popular social media platforms in eParticipation [9-11]. However, these approaches seem to present scalability limitations considering the fact that social data is streamed in large quantities every second (e.g. as of early 2011 Twitter users send more than 140 million tweets per day1). For example, the approach suggested in [9] could face scalability problems as it aims at enabling policy-makers to identify, monitor and get involved in debates of interest carried out in social media platforms. They also seem to inherit the essential uptake limitations of traditional eParticipation platforms as they try to transfer the same techniques in the reality of social media. The approach described in [10] is related to this as it is based on the publishing of specific policy applications called Padgets to social media platforms as embedded petitions, poll or social tagging applications in the sidebar of a popular blog, wiki or forum.
Recently, a number of works have been published on the analysis of massive amounts of social data in order to understand real world phenomena and predict relevant trends in various domains such as elections [12], box-office revenues [13] and stock market [14]. The approach that these works follow is based on the use of independent variables related to both social data and real world objective facts in order to predict dependent variables i.e. election results, box-office revenues and stock market indices.
At the same time, a large number of governments worldwide started to massively make their data available on the Web through Open Government Data (OGD) portals. The government data provided through these portals includes statistics, reports, geo-spatial information and every day incidents reports [15]. This sort of data can be differentiated from social data as it is objective i.e. unbiased and not influenced by personal prejudices.
The aim of this paper is to introduce a two-phased approach for supporting participatory decision-making and a Web data oriented architecture that will enable the implementation of the proposed approach. Our approach is based on the integration of social and government data as well as on the results of the works that analyze massive amounts of social data to predict future events. The architecture is based on the use of linked data paradigm as a layer that will enable integration of data from different sources. The central idea of linked data is to extend the Web with a data commons by creating typed links between data from different sources [16], [17]. We anticipate that the proposed approach will (i) allow decision makers to understand
1 http://blog.twitter.com/2011/03/happy-birthday-twitter.html

public opinion and predict public reactions about specific decisions; and (ii) enable citizens to inadvertently contribute in the decision-making process.
The remaining of this paper is organized as follows. In section 2 we describe related work as regards the use of social data for future events prediction in various domains as well as the use and characteristics of government data. In section 3 the proposed approach is described while in section 4 the architecture that will enable the implementation of our approach is presented. Finally conclusions are drawn and future work is discussed in section 5.
2 Related Work
In this section we present a review of the literature on (a) the use of social data for understanding real world phenomena and predicting relevant trends, and (b) the characteristics and use of government data.
2.1 Social Data to Understand and Predict Real Word Phenomena
In the last years, a number of works have been published in the literature as regards the use of social data for understanding real world phenomena and predicting relevant trends. In particular, social data (mainly data from Twitter) have been successfully used to: forecast box office revenues for movies [13]; spatiotemporally detect earthquakes and typhoons in real-time [18]; predict election results [12]; predict stock markets [14]; analyze consumers reactions to specific brands [19]; analyze and predict the belief about the possibility that swine flu virus will become a pandemic [20]; predict Oscar award winners [21]; predict changes in topics and identify key players and topics of discussion in live media events [22].
Although these studies are carried out following different approaches, we identified that they all use a two-phased process:
(i) Data collection and filtering (ii) Data analysis
As regards the collection of social data different approaches are followed in the existing literature. The most common approach involves the use of the Twitter Search API2, which is usually queried over frequent intervals in order to provide close to real-time data. However, the growing rate of new social data and the amount of data that is poor in information creates a need for finding an approach to overcome this issue. The majority of the works includes a filtering mechanism in order to enable the analysis of only data of interest. The simplest approach involves the use of keywords that describe the topic of interest. For example, Asur & Huberman in [13] used keywords present in the title of a movie as a search argument in order to identify tweets that refer to a specific movie while Tumasjan et al. in [12] used the names of German political parties or selected politicians to identify tweets that refer to them. In the same context, Diakopoulos & Shamma [22] looked for specific hashtags relevant
2 http://search.twitter.com/api/

to the topic of interest. Hashtags are short strings that start with the # symbol and denote that a tweet is related to a specific topic. The keyword and hashtag filtering is mainly performed through the Twitter API functionality. However, some works use more advanced methods such as machine-learning algorithms. For example, Sakaki et al. in [18] employed a support vector machine to clarify that a tweet is truly referring to an actual earthquake occurrence and not e.g. to a movie containing the word “earthquake” in its title.
Table 1. Social data to understand and predict real world phenomena
Domain Collection and Filtering Analysis Asur & Hubersman [13]
Box-office revenue prediction
Twitter search API with keyword search
Linear regression (quantity, sentiment, distribution)
Bollen et al. [14] Stock market prediction
All tweets Time series analysis with Granger Causality (sentiment)
Bothos et al. [21] Oscar awards prediction
Google and keyword search
Agents realizing prediction markets paradigm (sentiment)
Cullota [23] Forecast influenza rates
Twitter search API and a dataset from Gardenhose with keyword search
Linear regression (quantity)
Diakopoulos & Shamma [22]
Reactions in live media events
Twitter search API and hashtags filtering
Observation and comparison to timing information of the event (quantity, sentiment)
Jansen et al. [19] Consumer opinion Summize and keyword filtering
(sentiment)
Ritterman et al. [20]
Public opinion about swine flu
Time dimension and keyword search
Support vector machine (quantity)
Sakaki et al. [18] Real-time events (earthquakes) detection
Twitter search API and filtering based on keywords and support vector machine algorithm
Time series analysis with kalman and particle filters (quantity, location)
Tumasjan et al. [12]
Election results prediction
Keyword search Observation and evaluation with mean absolute error (quantity)
The existing works analyze the data and create prediction models that use different
independent variables to predict the dependent ones. The literature suggests that the majority of the works use independent variables that are related to social data characteristics such as the rate at which social data on a specific topic is created, the sentiment of the data, the location of the user who creates the data. In the simplest cases one variable is used for the development of the prediction model. For example, Tumasjan et al. in [12] used only the number of tweets mentioning a political party prior to the German national elections while Bollen et al. [14] and Diakopoulos &

Shamma [22] only the public mood derived from tweets sentiment. In addition, in some cases more than one variables were used. Sakaki et al. [18] used the number of tweets describing earthquakes or typhoons in real-time and the location of the users who posted the tweet.
Interestingly however, Asur & Hubersman [13] aiming at predicting box-office revenues created a linear regression model using not only independent variables related to social data but also variables about objective real-world facts. In particular, they used the number of tweets about a movie on certain period before and after its release, the sentiment of those tweets and the number of theatres a particular movie is released in. They also showed that the use of objective data adds to the accuracy of the prediction.
Finally, as regards the analysis models different approaches are considered in the literature. Some use linear regression model using least squares [13] while other probabilistic spatio-temporal algorithm based on Kalman and Particle filtering [18]. Ritterman et al. [20] used the Support Vector Machine algorithm to carry out regression. Finally, Bothos et al. [21] utilized computational agents.
Table 1 summarizes the review of the existing approaches for exploiting social data to understand and predict real world phenomena. Again, the review reveals that these approaches follow a two-phased process: (i) data collection and filtering and (ii) data analysis. As regards the filtering, we identified a deficit in the existing approaches as the majority of them use keyword and hashtag search. As regards the analysis, the review identified that the majority of the studies use only independent variables related to social data characteristics such as quantity and sentiment. Interestingly however, the review revealed also indications that the use of objective facts can improve the accuracy of the analysis and prediction models.
2.2 Open Government Data
In the last couple of years, a large number of governments worldwide started to massively make non-personal government data available on the Web. This Open Government Data (OGD) movement follows the open data philosophy suggesting making data freely available to everyone, without limiting restrictions. It is based on the publication of data in open formats and ways that make it accessible and readily available to the public and allow reuse [24].
Recently, Kalampokis et al. [15] analyzed 24 OGD initiatives around the globe in order to propose an OGD classification scheme that could describe all relevant initiatives. This study revealed some interesting characteristics of government data with regards to the employed technological approaches as well as the content.
In particular, current OGD initiatives use the following main technological approaches for publishing their data: • Making data available of the Web as downloadable files in well-known formats
such as PDF, Excel, CSV, KML, XML etc. • Making data available of the Web as linked data through RESTful APIs and/or
SPARQL search interfaces.
The majority of the existing initiatives fall into the first category while three of them provide linked data, namely Data.gov.uk3, Data.gov4 and Catálogo de Datos de Asturias5. In addition, Data.gov.uk and Data.gov are the biggest and most advanced initiatives and the ones concentrating the most interesting characteristics.
Their analysis also suggested that government data included in the identified initiatives contribute towards most of the declared objectives of OGD i.e. enhance transparency, enable economic growth, improve citizens’ every day life and support public administration’s function. More specifically, data related to governmental spends, financial statements and statistics and building permits can enhance transparency. This type of data is provided by some of the initiatives such as Data.gov.uk. The liberation of geo-spatial data and/or census statistics data can contribute towards economic growth. Data describing the location of schools, bus stops, hospitals etc., street crime levels, available social workers and meals programs for homeless can provide social value to citizens. This sort of data is the most common one and appears in the majority of the initiatives. Finally, the function of public administration can be supported by government data related to legislation and the organizational structure of public sector.
Finally, although current OGD initiatives provide data regarding a wide range of topics, there are no evidences in the literature on how government data could be used in decision-making.
3 The Two-Phased Approach
As already mentioned, the proposed approach aims at supporting participatory decision-making and enabling decision makers to understand public opinion and predict public reactions about a decision. This ability will allow decision makers to timely implement corrective actions, e.g. better information provision, in order to alleviate foreseen reactions. The proposed approach aims also at enabling citizens to inadvertently participate in democratic decision-making, as they will continue to express their opinion in their favorite social media platforms without being aware of the fact that these opinions could have an impact on the decision-making process.
Our approach is based on the integration of subjective social and objective government data and on the two-phased process emerged from the review on future events prediction using massive amounts of social data. In Fig. 1, the proposed approach is conceptually depicted where social data is transferred through the two phases, i.e. Data Collection and Filtering and Data Analysis, while government data is used to improve both of these phases. The aim of the former phase is to narrow social data based on criteria such as the topic of the decision and the target group that is affected by the decision. The aim of the latter phase is to predict public opinion and reactions using independent variables related to both subjective social and objective government data.
3 http://data.gov.uk 4 http://data.gov 5 http://risp.asturias.es

In the rest of this section we describe each of the two phases. In order to enhance clarity in the proposed approach’s presentation, we introduce real-life scenarios in which we deploy datasets from existing data sources. In particular, we use Twitter as a source of social data and Data.gov.uk as a source of government data.
Fig. 1. The two-phased approach for participatory decision-making
3.1 Data Collection and Filtering
Social data is streamed in large quantities every second, creating significant information overload for the users interested in making sense of the information related to a specific context. This is particularly true in decision-making where decision makers want to listen to people that are expressed about a specific topic of interest or/and are affected by a particular decision, and not to the whole population. So, after its collection, social data should go through a filtering stage in order to be narrowed based on some criteria.
Existing approaches in the literature use keyword search or hashtag search in order to alleviate the problem of information overload. However, this type of search can only support the selection of social data related to a specific topic of interest, e.g. immigration, or to a specific event, e.g. publication of a new draft law. In our approach, we want to enhance such solutions with capabilities that will enable the filtering of social data based on the target group i.e. people affected by a particular decision. This could include for example, the identification of data created by female users above the age of 18 or the identification of data created by citizens that live in areas characterized by high crime levels.
To this end, we propose that we should enrich social data with government data. Characteristics of target groups such as age group, gender and area of residence could be linked to variables included in government datasets that provide objective facts related to these characteristics.
In order to make our point clear we now describe a real-world scenario. According to this scenario the government of the United Kingdom announces to citizens a draft law on public budget cutting in police forces. Before the enactment of the particular draft law the government wants to know what citizens think about the specific action.

Moreover, the government is particularly interested in the opinion of the residents of areas presenting crime level above average.
Fig. 2. Filtering tweets based on the crime level of the location
According to our approach, social data will be collected from Twitter before and after the announcement of the draft law. In order to identify only those tweets that are posted by residents of areas with crime level above average we will aggregate data from Data.gov.uk that provides crime levels and statistics in neighborhood areas in the 43 English and Wales’s police forces through a RESTful API6 and data from Twitter. By linking the “location” attribute of tweets to the “crime area” attribute of the Data.gov.uk dataset we can filter the collected tweets and identify tweets posted by residents of areas with high crime level. Fig. 2 depicts the linking of the two datasets using as a “joint point” the particular location i.e. Leicestershire.
3.2 Data Analysis
The aim of the data analysis phase is to enable decision makers to understand public opinion and predict public reactions on specific decisions. In this sub-section we describe how integrated social and government data can be exploited towards this direction. In order to make our proposition clear we proceed with the same example about public budget cutting in police forces. Understand public opinion: It refers to the ability of decision makers to understand what is the current opinion of citizens towards a specific decision. This can be achieved by estimating several variables such as the quantity of social data related to a decision, the sentiment of this data and users influence on topics related to a decision. The quantity of the posts can be an indicator of peoples’ attention that a specific decision attracts. The sentiment of the posts can reflect the public mood towards the decision. Moreover, the strength of the sentiment can differentiate between mild and strong emotions. Finally, the measure of users influence can reveal opinion leaders who have noteworthy impact on the formation of public opinion.
6 http://data.gov.uk/apps/police-api
In our example, after the identification of posts that are related to the specific draft law and created by residents of areas with high crime levels, the quantity and sentiment of the posts from each area is calculated. These two figures will provide an indication of public opinion to decision makers that will support them in the decision-making process. Predict public reactions: This refers to the ability of decision makers to predict what will be the public reaction on a decision. In the literature, the analysis of social data quantity and sentiment is mainly used for future events prediction. In addition, real world objective facts are used to enhance the accuracy of the prediction models. So, it is important to integrate social and objective government data in order to improve the data analysis phase. In particular, this integration aims at linking specific characteristics of target groups such as location, age, gender etc to social data related variables such as quantity and sentiment as well as to variables related to real word objective facts coming from government data.
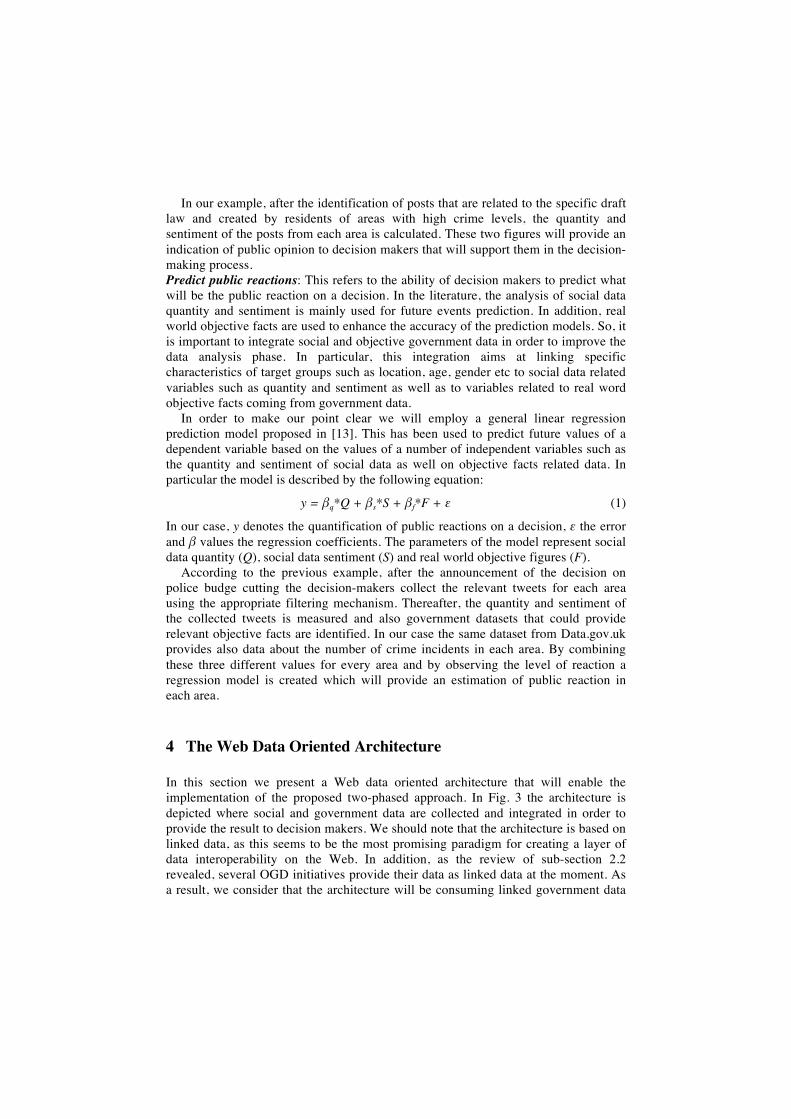
In order to make our point clear we will employ a general linear regression prediction model proposed in [13]. This has been used to predict future values of a dependent variable based on the values of a number of independent variables such as the quantity and sentiment of social data as well on objective facts related data. In particular the model is described by the following equation:
y = βq*Q + βs*S + βf*F + ε (1)
In our case, y denotes the quantification of public reactions on a decision, ε the error and β values the regression coefficients. The parameters of the model represent social data quantity (Q), social data sentiment (S) and real world objective figures (F).
According to the previous example, after the announcement of the decision on police budge cutting the decision-makers collect the relevant tweets for each area using the appropriate filtering mechanism. Thereafter, the quantity and sentiment of the collected tweets is measured and also government datasets that could provide relevant objective facts are identified. In our case the same dataset from Data.gov.uk provides also data about the number of crime incidents in each area. By combining these three different values for every area and by observing the level of reaction a regression model is created which will provide an estimation of public reaction in each area.
4 The Web Data Oriented Architecture
In this section we present a Web data oriented architecture that will enable the implementation of the proposed two-phased approach. In Fig. 3 the architecture is depicted where social and government data are collected and integrated in order to provide the result to decision makers. We should note that the architecture is based on linked data, as this seems to be the most promising paradigm for creating a layer of data interoperability on the Web. In addition, as the review of sub-section 2.2 revealed, several OGD initiatives provide their data as linked data at the moment. As a result, we consider that the architecture will be consuming linked government data

and thus in Fig. 3 we use the Linking Open Data cloud diagram (created by Cyganiak and Jentzsch, http://lod-cloud.net/) to depict OGD.
Fig. 3. The Web data oriented architecture
The components of the architecture and their role in supporting the two phases of our approach can be described as follows: • User Interface: It will enable the decision maker to provide input in order to
describe the problem related to a decision as well as the target group. It will also enable decision maker to select different variables and analysis models in order to receive the final output.
• Logic: It has two distinct roles in order to support the two-phased approach. As regards the filtering phase it will support mining components in the identification of relevant social and government data. As regards the analysis phase it will enable the analysis of the integrated data following different approaches e.g. regression analysis using several variables such as quantity and sentiment that will previously specified.
• RDF store: It will support the storing of linked data. • Integrator: It will enable the linking of the different pieces of data coming from
the two sources. This component will support both phases and thus will enable the integration of (a) social data with objective data related to the specified target group and (b) variables related to social data and real world objective facts coming from government data.
• OGD Mining: It will enable the collection of OGD that is related to a specific decision and target group’s characteristics based on criteria that the decision maker will provide.
• Social Data Mining: It will enable the collection of social data related to a decision using APIs of different social media platform such as Twitter, Facebook, FriendFeed and Google Buzz that allow real time access to their data. This component will be also transforming social data to linked data format.
5 Conclusions and Future Work
The eParticipation initiatives launched during the last years proved rather unsuccessful to attract large numbers of participants, which would constitute a

representative sample of the affected population. In order to overcome this issue, governments and academia started to consider using popular social media platforms and exploiting social data in eParticipation. In this context, a number of research endeavors were recently launched aiming at involving popular social media platforms in eParticipation. However, these approaches seem to present some scalability limitations, if we consider the vast amounts of social data made available on the Web. They also seem to inherent traditional eParticipation uptake limitations as they try to transfer the same techniques in the reality of social media.
At the same time, Open Government Data (OGD) initiatives emerged worldwide aiming to unlock government data, aggregate them and make them available through one-stop access points. This kind of data differentiates from social data as it is objective i.e. unbiased and not influenced by personal prejudices.
In this paper we introduce a two-phased approach for supporting participatory decision-making and a Web data driven architecture that will enable the implementation of the proposed approach. The approach is based on the integration of social and government data as well as on the results of the works that analyze social data to predict future events. The architecture is based on the use of linked data paradigm as a layer that will enable integration of data from different sources.
Future work is envisaged in a number of directions. We aim to study real world data sets and create a conceptual model describing the join points of social and government data realities. We also aim to implement the proposed architecture and identify real world use case scenarios in order to evaluate both the proposed approach and the foreseen system.
Acknowledgments. The work presented in the paper is partly funded by the EU under Grant No. 256261 (Puzzled by Policy – CIP-ICT-PSP-2009-3bis), EC FP7 under Grant Agreement No. 257943 Creating Knowledge out of Interlinked Data (LOD2) and Science Foundation Ireland under Grant No. SFI/08/CE/I1380 (Lion-2).
References
1. Pitkin, H. F.: The Concept of Representation. University of California Press, Berkeley (1972)
2. Smith, L.G., Nell, C.Y.: FORUM: The Converging Dynamics of Interest Representation in Resources. Environmental Management 21, 139-146 (1997)
3. Creighton, J. L.: The Public Participation Handbook: Making Better Decisions Through Citizen Involvement. Jossey-Bass, San Francisco (2005)
4. Panopoulou, E., Tambouris, E., Tarabanis, K.: eParticipation Initiatives in Europe: Learning from Practitioners. In: Tambouris, E., Macintosh, A., Glassey O. (eds.) ePart 2010. LNCS 6229, pp. 54-65. Springer, Heidelberg (2010)
5. Tambouris, E., Kalampokis, E., Tarabanis, K.: A survey of e-participation research projects in the European Union. International Journal of Electronic Business 6(6), 554-571 (2008)
6. Sæbø, Ø., Rose, J., Nyvang, T.: The Role of Social Networking Services in eParticipation. In: Macintosh, A., Tambouris, E. (eds.) ePart 2009. LNCS 5694, pp. 46-55. Springer-Verlang, Berlin. Heidelberg (2009)
7. Ferro, E., Molinari, F.: Making Sense of Gov 2.0 Strategies: No Citizens, No Party. In: Prosser, A., Parycek, P. (eds.) Proceedings of EDEM 2009 (2009)
8. Osimo, D.: Web 2.0 in Government: Why and How? JRC Scientific and Technical Reports. European Commission, Joint Research Centre, Institute for Prospective Technological Studies (2008), http://ftp.jrc.es/EURdoc/JRC45269.pdf
9. Addis, M., Taylor, S., Nasser, B. I., Yoshi, S., Karamagioli, E., Wandhoefer, T., Fallon, F., Fletcher, R., Wilson, C.: New ways for policy-makers to interact with citizens through open social network sites - a report on initial results. In: Internet, Politics, Policy 2010 Conference. Oxford, UK (2010), http://works.bepress.com/timo_wandhoefer/2
10. Charalabidis, Y., Gionis, G., Ferro, E., Loukis, E.: Towards a Systematic Exploitation of Web 2.0 and Simulation Modeling Tools in Public Policy Process. In: Tambouris, E., Macintosh, A. and Glassey, O. (eds.) ePart 2010. LNCS 6229, pp. 1-12. IFIP, Germany (2010)
11. Hartman, A., Jain, A. N., Ramanathan, J. Ramfos, A., Van der Heuvel, W., Zirpinis, C., Tai, S., Charalabidis, Y., Pasic, A., Johannessen, T., Gronsund, T.: Participatory Design of Public Sector Services. In: Andersen, K.N. et al. (eds.) EGOVIS 2010, LNCS 6267, pp. 219-233. Springer-Verlang, Berlin-Heidelberg (2010)
12. Tumasjan, A., Sprenger, T.O., Sandner, P.G., Welpe, I.M.: Predicting Elections with Twitter: What 140 Characters Reveal about Political Sentiment. In Fourth International AAAI Conference on Weblogs and Social Media, Washington, DC (2010)
13. Asur, S., Huberman, B.A.: Predicting the Future With Social Media. In: 2010 IEEE/WIC/ACM International Conference on Web Intelligence and Intelligent Agent Technology, pp. 492-499. IEEE Press, Torondo (2010)
14. Bollen, J., Mao, H., Zeng, X.J.: Twitter mood predicts the stock market. Technical report, arXiv:1010.3003, CoRR (2010)
15. Kalampokis, E., Tambouris, E., Tarabanis, K.: A Classification Scheme for Open Government Data: Towards Linking Decentralized Data. International Journal of Web Engineering and Technology 6(3), 266-285 (2011)
16. Bizer, C., Heath, T., Berners-Lee, T.: Linked Data—The Story So Far, Special Issue on Linked Data. International Journal on Semantic Web and Information Systems 5(3), 1-22 (2009)
17. Hausenblas, M.: Exploiting Linked Data to Build Web Applications. IEEE Internet Computing 13(4), 68–73 (2009)
18. Sakaki, T., Okazaki, M., Matsuo, Y.: Earthquake shakes twitter users: real-time event detection by social sensors. In WWW’10 19th International Conference on World Wide Web, pp. 851-860, ACM, New York (2010)
19. Jansen, B.J., Zhang, M., Sobel, K., Chowdury, A.: Twitter power: Tweets as electronic word of mouth. Journal of the American Society for Information Science 60, 2169-2188 (2009)
20. Ritterman, J., Osborne, M., Klein, E.: Using Prediction Markets and Twitter to Predict a Swine Flu Pandemic. In: First International Workshop on Mining Social Media, pp. 9-17, Sevilla (2009)
21. Bothos, E., Apostolou, D., Mentzas, G.: Using Social Media to Predict Future Events with Agent-Based Markets. IEEE Intelligent Systems 25(6), 50-58 (2010)
22. Diakopoulos, N.A., Shamma, D.A.: Characterizing debate performance via aggregated twitter sentiment. In 28th International Conf. on Human Factors in Computing Systems, pp. 1195-1198, ACM, New York (2010)
23. Cullota, A.: Detecting influenza outbreaks by analyzing Twitter messages. http://arxiv.org/pdf/1007.4748
24. Alonso, J. et al.: Improving Access to Government through Better Use of the Web (2009), http://www.w3.org/TR/2009/NOTE-egov-improving-20090512