combining ability and heterosis studies in cgms based
TRANSCRIPT

COMBINING ABILITY AND
HETEROSIS STUDIES IN CGMS
BASED HYBRIDS OF PIGEONPEA
(Cajanus cajan (L.) Millsp)
PULINDALA SYAMALA B.Sc. (Ag.)
MASTER OF SCIENCE IN AGRICULTURE
(GENETICS AND PLANT BREEDING)
2017

COMBINING ABILITY AND HETEROSIS
STUDIES IN CGMS BASED HYBRIDS OF
PIGEONPEA (Cajanus cajan (L.) Millsp)
BY PULINDALA SYAMALA
B.Sc. (Ag.)
THESIS SUBMITTED TO THE
ACHARYA N.G. RANGA AGRICULTURAL UNIVERSITY
IN PARTIAL FULFILMENT OF THE REQUIREMENTS
FOR THE AWARD OF THE DEGREE OF
MASTER OF SCIENCE IN AGRICULTURE (GENETICS AND PLANT BREEDING)
CHAIRPERSON: Dr. N.V. NAIDU
DEPARTMENT OF GENETICS AND PLANT BREEDING
SRI VENKATESWARA AGRICULTURAL COLLEGE, TIRUPATI
ACHARYA N.G. RANGA AGRICULTURAL UNIVERSITY
GUNTUR – 522 509, ANDHRA PRADESH.
2017
DECLARATION
I, Miss. P. SYAMALA, hereby declare that the thesis entitled
“COMBINING ABILITY AND HETEROSIS STUDIES IN CGMS
BASED HYBRIDS OF PIGEONPEA (Cajanus cajan (L.) Millsp)”
submitted to the Acharya N.G. Ranga Agricultural University for the
degree of Master of Science in Agriculture is the result of original research
work done by me. I also declare that no material contained in this thesis has
been published earlier in any manner.
Place: TIRUPATI (P. SYAMALA)
TAM/2015-030
Date:

CERTIFICATE
This is to certify that Miss. P. SYAMALA has satisfactorily
prosecuted the course of research and that thesis entitled “COMBINING
ABILITY AND HETEROSIS STUDIES IN CGMS BASED HYBRIDS
OF PIGEONPEA (Cajanus cajan (L.) Millsp)” submitted is the result of
original research work and is of sufficiently high standard to warrant its
presentation to the examination. I also certify that neither the thesis nor its
part thereof has been previously submitted by her for a degree of any
university.
Date: (Dr. N.V. NAIDU)
Chairperson

CERTIFICATE
This is to certify that the thesis entitled “COMBINING ABILITY
AND HETEROSIS STUDIES IN CGMS BASED HYBRIDS OF
PIGEONPEA (Cajanus cajan (L.) Millsp).” submitted in partial fulfillment
of the requirements for the degree of MASTER OF SCIENCE IN
AGRICULTURE of the Acharya N.G. Ranga Agricultural University, Guntur
is a record of the bonafide original research work carried out by Miss. P.
SYAMALA under our guidance and supervision.
No part of the thesis has been submitted by the student for any other
degree or diploma. The published part and all assistance received during the
course of the investigations have been duly acknowledged by the author of the
thesis.
Thesis approved by the Student’s Advisory Committee
Chairperson : Dr. N. V. NAIDU
Director of Research
ANGRAU,
Guntur - 522 509.
______________
Member : Dr. C. V. SAMEER KUMAR
Principal Scientist,
Pigeonpea Breeding,
ICRISAT, Patancheru,
Telangana - 502 324.
______________
Member : Dr. D. MOHAN REDDY
Professor
Dept. of Genetics and Plant Breeding
S.V. Agricultural College,
Tirupati – 517 502.
______________
Member : Dr. B. RAVINDRA REDDY
Assistant Professor
Statistics and Mathematics
S.V. Agricultural College,
Tirupati – 517 502.
______________
Date of final viva-voce:

ACKNOWLEDGEMENTS
It is the lavish and boundless blessings of the almighty Lord Jesus Christ
that I have been able to complete my studies successfully hitherto and present
this humble piece of work, for which I am eternally indebted.
With pleasure and humbleness, I place on record my profound sense of
gratitude, indebtedness and heartfelt thanks to my Major Advisor
Dr. N. V. Naidu, Director of Research, Guntur, ANGRAU, for his valuable
suggestions, keen interest, able guidance and bountiful encouragement. His
critical comments instilled in me the spirit of confidence, which led to the
successful completion of thesis work.
There is no greater delight than to express my profound sense of gratitude to
Dr. C. V. Sameer Kumar, Principal Scientist, ICRISAT and Co-Chairman of my
Advisory Committee for his initiative, benevolence, constant encouragement and
ready help which enabled me to overcome several stumbling blocks during the
period of my investigation and also in the preparation of this thesis. I express my
sincere thanks to him for sparing his precious time in execution and preparation of
the thesis.
I express my deep sense of gratitude to Dr. D. Mohan Reddy, Professor, Department of Genetics and Plant Breeding, S.V. Agricultural college,
Tirupati, member of my advisory committee for sparing his precious time and
giving pragmatic suggestions during the course of my research work, which
helped a lot in bringing the thesis to the present format.
I sincerely accentuate my everlasting gratitude to the revered member
of my Advisory Committee Dr. B. Ravindhra Reddy, Assistant Professor,
Department of Statistics and Mathematics, S.V. Agricultural College, Tirupati
for his valuable guidance and cooperation throughout my period of thesis.
It’s an immense pleasure to express heartfelt respect to
Dr. K. Hariprasad Reddy, professor and head Dr. M. Reddi Sekhar,
Professor, Dr. M. Shanthi Priya, Associate Professor, B.Rupesh Kumar
Reddy, Assistant Professor and D. Bharati, Assistant Professor Department of
Genetics and Plant Breeding, S.V. Agricultural College, Tirupati for their help
and guidance during the period of my study which enabled the successful
completion of my work.
I allocate my highest respect and whole hearted regards from my inner
core of my heart to my ever loved Parents, Smt. Kajamma and
Sri. Sudhakar, who have given me life and taught the concepts of life and their
dedicated efforts to educate me to this level and without whose valuable moral
support, the thesis would not have seen the light of the day. They are ineffable
and to their benevolent feet of, I am dedicating this thesis with great pleasure.

I heart fully express my thanks to my family members whose encouragement
made me achieve my goals.
With boundless affection, I owe an encompassing debt to my beloved
sister Saradha, brothers Syam, and brother-in-law China babulu for their
constant encouragement throughout my career. They have been fountain of
inspiration throughout my life without whose help in every walk of life this
work would not have been possible.
I feel immense pleasure to express my sincere thanks to Dr. A.
Hingane, Mr. Ramaiah, Mr. Srinivas, Mr. Prasad, Mrs. Pamela, Mrs. Jyothi,
Mrs. Samantha, Mr. Anji Reddy, Mr. Malla Reddy, Mr. Rajesh, Mr. Suneet,
Mr. Sudhakar, Mr. Sarvesh, Mr. Satyanarayana, Mr. Pratapulu and other
staff members of Pigeonpea Breeding, ICRISAT for their help in conducting
the research trials at Patancheru.
I am thankful to all the staff of LSU, Library, Housing and Food
Services, ICRISAT, Patancheru. I am profoundly thankful to Dr. Abhishek
Rathore, Principal Scientist, Statistics Unit, ICRISAT and Mr. Anil Kumar,
and Ms. Roma Das (Scientific Officers, Statistics Unit, ICRISAT).
I express my heartfelt gratitude and thanks to my seniors, Yamini,
Mallikarjuna, Kavitha, Paramesh, Kalpana, Praveen, Ravi, Sruthi, Raza, Sofia, Sudharshan, Sowmya, Bhargavi, Sreevallidevi and Mahesh for their
valuable guidance and encouragement.
No words are enough to express the affection to classmates,
Sindhu, Mahitha, Aparna, Beemesh, Raju and Prakasha for their help,
constant encouragement and companionship in my personal and professional
life for moral support during research work.
Diction is my predilection to express my heartful thanks to my joyful
friends gallery Bharathi, Shanthi, Parimala, Madhuri, Himasree,
Madhuravani, Manasa, Bhindhu, Anusha and Priya.
It is a pleasure to acknowledge the affection and inspiration rendered
by my juniors Kavitha, Saritha, Nandhini, Suma, Bhavana, Meghala and
Maithri.
I acknowledge the help of Muniratham, Lakshmi, Muniratham and
Tyagraj Naidu, non-teaching staff of Department of Genetics and Plant
Breeding, S.V. Agricultural College, Tirupati.
I humbly thank the authorities of Acharya N.G. Ranga Agricultural
University, Guntur and International crops research institute for the semi-arid
tropics, Hyderabad for providing me the opportunity in getting admission into
Post graduation and also for all the facilities extended during the period of my
post-graduation programme.
Syamala…

LIST OF CONTENTS
Chapter
No.
Title Page
No.
I INTRODUCTION
II REVIEW OF LITERATURE
III MATERIAL AND METHODS
IV RESULTS AND DISCUSSION
V SUMMARY AND CONCLUSIONS
LITERATURE CITED

LIST OF TABLES
Table
No. Title
Page
No.
3.1 Details of genotypes used in the present investigation
3.2 Description of female parental lines (CMS lines) used
in the development of pigeonpea hybrids
3.3 Description of male parental lines (R lines) used in
the development of pigeonpea hybrids
3.4 Analysis of variance of RBD
3.5 ANOVA structure for combining ability
4.1 Analysis of variance for yield and yield components
in pigeonpea
4.2 Mean performance of 5 lines, 4 testers and one
standard check for seed yield and yield components in
pigeonpea
4.3 Mean performance of 20 hybrids for seed yield and
yield components in pigeonpea
4.4 Range, mean, coefficient of variability, heritability
and genetic advance for yield and yield components in
parents and hybrids in pigeonpea
4.5 Realized heterosis over mid parent (MP), better parent
(BP) and standard check (SC) for yield and yield
component of pigenpea
4.6 Analysis of variance for combining ability in Line x
Tester experiments for 11 characters in pigeonpea
4.7 Magnitude of genetic variance due to general and
specific combining abilities for 11 characters of
pigeonpea
4.8 Estimation of general combing ability (gca) effects in
parents for yield and yield components of pigeonpea
4.9 Estimation of specific combing ability (sca) effects in
hybrids for yield and yield components of pigeonpea

Table
No. Title
Page
No.
4.10 Best parents, general combiners and hybrids with high
sca effects for different characters in pigeonpea
4.11 High yielding hybrids over standard check (Maruti)
and estimates of their genetic parameters in pigeonpea
4.12 Proportionate contribution of lines, testers and line x
tester interaction towards total variance in hybrids (in
per cent) in pigeonpea
4.13 Correlation coefficients for yield and yield
components in parents of pigeonpea
4.14 Correlation coefficients for yield and yield
components in hybrids of pigeonpea
4.15 Direct and indirect effects of yield component
characters on seed yield in parents of pigeonpea
4.16 Direct and indirect effects of yield component
characters on seed yield in hybrids of pigeonpea

LIST OF FIGURES
Figure
No. Title
Page
No.
4.1 Phenotypic co-efficient of variation for 11 characters
in parents and hybrids of pigeonpea
4.2 Genotypic co-efficient of variation for 11 characters
in parents and hybrids of pigeonpea
4.3 Heritability and genetic advance as per cent of mean
for 11 characters in parents and hybrids of pigeonpea
4.4 Pie-chart of gca and sca variances for 11 characters
in pigeonpea
4.5 Phenotypic correlation of yield components with
seed yield of pigeonpea
4.6 Genotypic correlation of yield components with seed
yield of pigeonpea

LIST OF SYMBOLS AND ABBREVIATIONS
X : Grand Mean
% : Per cent
µg : Microgram
ANOVA : Analysis of Variances
CD : Critical Differences
cm : Centimetre
Cov : Covariance
CV : Co-efficient of Variation
DAS : Days after sowing
df : Degree of Freedom
et al. : And others
F1 : First Filial Generation
Fig. : Figure
FS : Full-sibs
G : Genotypic
g : Gram
GA : Genetic advance
GAM : Genetic Advance as percent of Mean
gca : General combining ability
GCV : Genotypic Co-efficient of variation
H : Heritability in broad sense
h2
: Heritability in broad sense
ha : Hectare
HI : Harvest Index
HS : Half-sibs
i.e. : That is
Kg : Kilogram
Kg ha-1
: Kilogram per hectares
L x T : Line x Tester
M ha : Million hectares
ml : Milliliter
MSL : Mean Sea Level
Mt : Million tonnes
nm : Nanometer
No. : Number
OD : Optical Density
P : Phenotypic

PCV : Phenotypic Co-efficient of Variation
Per se : As such with mean
r : Correlation Co-efficient
RBD : Randomized Block Design
rg : Genotypic correlation co-efficient
rp : Phenotypic correlation co-efficient
rpm : revolution per minute
mg : Milligram
S.No. : Serial Number
sca : Specific combining ability
SEm : Standard Error of Mean
viz., : Namely
σ2
: Variance

The present investigation comprising of nine parents of pigeonpea
(Cajanus cajan (L.) Millsp.) and 20 cross combinations developed through
Line X Tester (5 X 4) crossing programme were evaluated for genetic
parameters, heterosis, combining ability, character association and path
coefficient analysis during kharif, 2016. The experiment was laid out in
Randomized Block Design with three replications at the International Crops
Research Institute for Semi-Arid Tropics (ICRISAT), Hyderabad and
observations were recorded on 11 characters.
Analysis of variance indicated the existence of significant differences
among the genotypes for all the characters. Among the parents, the lines ICPB-
2047 and ICPB-2048, the testers ICPL-87119 and ICPL-20123 and among the
crosses, ICPA-2092 x ICPL-20108, ICPA-2092 X ICPL-87119 and ICPA-
2047 X ICPL-20108 showed high mean performance for secondary branches
per plant, pods per plant, harvest index and seed yield per plant in parents and
crosses indicating that simple selection may be practiced for improving these
characters.
The magnitude of standard heterosis was high for secondary branches
per plant, pods per plant, harvest index and seed yield per plant, whereas for
seeds per pod and days to 75% maturity it was very low. Out of 20 crosses, the
crosses viz., ICPA-2092 x ICPL-20108, ICPA-2047 x ICPL-20108, ICPA-2047
Name of the Author : P.SYAMALA
Title of the Thesis : COMBINING ABILITY AND HETEROSIS
STUDIES IN CGMS BASED HYBRIDS OF
PIGEONPEA (Cajanus cajan (L.) Millsp)
Major Advisor : Dr. N.V. NAIDU
Degree to which it
is submitted : MASTER OF SCIENCE
Faculty : AGRICULTURE
Department : GENETICS AND PLANT BREEDING
University : Acharya N.G. Ranga Agricultural University
Year of submission : 2017
ABSTRACT

x ICPL-20116 and ICPA-2047 x ICPL-20123 had recorded significant and
maximum heterosis for most of the characters.
The analysis of variance for combining ability indicated the
predominance of non-additive gene action for all the traits due to higher sca
variance than gca variance. Among the parents, ICPB-2078 and ICPB-2043
were the best general combiners for days to 50% flowering and days to 75%
maturity, while ICPB-2047 for plant height, primary branches per plant,
secondary branches per plant, seeds per pod, harvest index and seed yield per
plant. ICPB-2092, ICPB-2078 and ICPB-20123 were the promising parents for
pods per plant, 100-seed weight and seed protein. Based on sca effects, per se
performance and heterosis, the crosses viz., ICPA-2092 x ICPL-87119 and
ICPA-2092 x ICPL-20116 were identified as the best specific crosses for
hybrid breeding programme while the crosses ICPA-2092 x ICPL-20123,
ICPA-2048 x ICPL-20116, ICPA-2078 x ICPL-20108, ICPA-2043 x ICPL-
87119, ICPA-2048 x ICPL-20108, ICPA-2092 x ICPL-20116, ICPA-2092 x
ICPL-87119, ICPA-2078 x ICPL-87119, ICPA-2047 x ICPL-87119, ICPA-
2043 x ICPL-20108 and ICPA-2047 x ICPL-20123 were identified for
advancing through recombination breeding programme.
Character association studies revealed that selection based on all the
characters except secondary branches per plant, seed protein, 100-seed weight
in parents and seed protein, 100-seed weight in crosses will be effective for
selection in improvement of seed yield as they had significant and positive
correlation with seed yield per plant. Path analysis revealed high positive direct
influence of pods per plant on seed yield and it also had positive indirect
effects on seed yield via most of the characters in both parents and crosses.
Hence, selection for pods per plant alone can be suggested for the
improvement of seed yield per plant in pigeonpea.

Chapter – I
Introduction

Chapter - I
INTRODUCTION
Pigeonpea [Cajanus cajan (L.) Millsp] (2n=22), popularly known as
arhar or tur or redgram is an often cross pollinated crop belonging to Fabaceae
family. It is a protein rich staple food and is consumed in the form of split
pulse as dal. The seeds contain 14-29% protein with excellent quality being
high in Lysine. Therefore, it is an important complement to cereals, root crops
and some horticultural crops which are major constituents of the diet of people.
It is also used for fodder and fuel purposes. It plays an important role in
sustaining soil productivity by fixing atmospheric nitrogen. The fallen leaves
of pigeonpea enrich the soil with organic matter. Because of deep root system,
it will also helps to bring the nutrients from deeper layers, hence it can be
grown as intercrop with groundnut, sorghum, maize, pearl millet, mungbean,
soybean, cotton, castor etc.
Pigeonpea is the second most important pulse crops in India after
Chickpea. India accounts for 91% of the world’s Pigeonpea production and has
the privilege of occupying the first place both in area and production globally
among kharif grown legumes. India occupies first place in the world with an
area of 3.82 M ha with a production of 2.78 Mt and productivity of 727 kg/ha
(FAO, 2014-15). It is grown extensively in states like Maharashtra, Karnataka,
Andhra Pradesh, Madhya Pradesh, Utter Pradesh, Gujarat, and Orissa. In
Andhra Pradesh, it is cultivated in an area of 3.71 M ha with a production of
1.65 Mt and with productivity of 445 kg/ha (FAO STAT).
Pigeonpea varietal improvement program started in India in 1931 with
selection from landraces for traits such as seed size, fusarium wilt, plant type
and yield (Ramanujam and Singh, 1981). During this period over 100
pigeonpea cultivars have been released in India (Singh et. al., 2006), but the
crop productivity remained stagnant. This is a matter of concern in view of
increasing population and reducing per capita availability of protein that led to

malnutrition among growing children and women, in particular. Considering
the above mentioned constraints, new scientific approaches and tools are
needed to raise the productivity of this important pulse crop. In this context,
CMS-based hybrid technology was developed and the world’s first pigeonpea
commercial hybrid namely ICPH 2671 was released, with 46% yield advantage
in farmer’s field (Saxena et. al., 2013). This is considered a milestone in the
history of pulse breeding so far. In order to popularize hybrids, it is necessary
that new high yielding hybrids are bred for different climatic conditions.
Selecting parents based on their per se performance may not always
lead to fruitful results (Allard, 1960). Hence, parents selected based on
combining ability studies would throw up more desirable segregants and
understanding the magnitude of gene action involved in the inheritance of
quantitative characters of economic importance. Studies on general combining
ability of parents and specific combining ability of hybrids, heterosis effects,
gene action, direct and indirect effects on yield will provide information for
selecting suitable parents and hybrids, respectively for an efficient breeding
programme.
Line x Tester mating design, as suggested by Kempthorne (1957), is an
appropriate method to identify superior parents and hybrids based on gca and
sca, respectively and to study nature of gene action. This design provides
information on more number of parents with limited number of single crosses.
Hence, in the present study, an attempt was made to understand the genetic
nature of yield and yield components through studies involving five lines and
four testers in Line x Tester mating design.
Seed yield is a complex quantitative character, which is subjected to the
environmental fluctuations and largely dependent on various components.
Knowledge on genotypic and phenotypic correlations among yield components
and their relationship with yield will be useful in selecting superior genotypes.
Path coefficient analysis permits separation of correlation coefficient into
components of direct and indirect effects (Dewey and Lu, 1959). Direct
selection for yield is not a reliable approach since it is highly influenced by the
environment. Therefore, it is essential to identify the component characters
through which yield can be improved. Thus correlation in conjunction with
path analysis would give better insight into the cause and effect relationship
between different character pairs.
Keeping in view the above perspectives, the present research workon
was formulated with the following objectives:
1. To estimate the variability parameters for seed yield and yield
contributing characters among the parental genotypes.
2. To identify the superior parents and crosses by combining ability
analysis using L x T mating design.
3. To study the nature of gene action and magnitude of heterosis for seed
yield and yield attributing characters.
4. To estimate the relationship among the yield contributing characters and
with seed yield in hybrids.
5. To identify the character(s), which are directly or indirectly influence
seed yield in hybrids.

Chapter – II
Review of Literature

Chapter - II
REVIEW OF LITERATURE
An attempt was made to critically review the literature of past research
work documented in relevance to the objectives of present study in pigeonpea
(Cajanus cajan (L.) Millsp) under the following heads:
2.1 VARIABILITY AND GENETIC PARAMETERS
2.2 HETEROSIS
2.3 COMBINING ABILITY
2.4 CHARACTER ASSOCIATION
2.5 PATH COEFFICIENT ANALYSIS
2.1 VARIABILITY AND GENETIC PARAMETERS
(Genetic Variability, Heritability and Genetic Advance)
The success of any breeding programme depends on the amount of
variability present for different characters in a population and its efficient
management. The genetic coefficient of variation is a useful measure of the
magnitude of genetic variance present in the population.
Estimation of genetic variability alone cannot indicate the possible
improvement achieved through selection, but it should be used in conjunction
with heritability. The degree of success depends on the magnitude of
heritability as it measures the relative amount of the heritable portion of
variability.
Genetic advance (GA) under selection gives an idea about how much of
genetic gain could be obtained due to selection. Hence, the estimates of genetic
variability, viability, heritability and genetic advance had an immense value in
identifying the superior genotypes.

A brief review of literature on genetic parameters is furnished here
under:
Bainiwal and Jatasra (1981) studied the nature of genetic variability
using 29 genotypes of pigeonpea and noticed that maximum variability for
secondary branches followed by primary branches and seed yield. The
expected genetic advance was also observed to be high for seed yield,
secondary branches, plant height and primary branches.
Jagshoran (1983) evaluated 100 genotypes of pigeonpea and reported
that the range for phenotypic variability was high for all the characters except
seeds per pod. High estimates of genotypic coefficient of variation and
heritability were observed to be accompanied by moderate to high genetic
advance for pods per plant, days to maturity, plant height and days to flower
across the environments.
Balyan and Sudhakar (1985), in their study on genetic variability
noticed that primary branches, secondary branches, pods per plant, 100-seed
weight and seed yield per plant exhibited high estimates of phenotypic and
genotypic coefficients of variation, heritability and genetic advance as per cent
of mean suggesting predominance of additive gene effects for the characters.
Jagshoran (1985) observed that the characters days to 50% flowering,
days to maturity, plant height, primary branches per plant, pods per plant,
100-seed weight and seed yield per plant had high amount of genotypic and
phenotypic coefficients of variation, while it was low for pod length and seeds
per pod.
Sidhu et al. (1985) observed that genetic variability was highest for
pods per plant while it was lowest for seeds per pod.
Bhongale and Raut (1987) screened 80 genotypes of pigeonpea to study
the extent of genetic variability for yield and yield contributing characters and
highest genotypic coefficient of variation for yield per plant followed by pod
number was observed. Days to 50% flowering, days to maturity and 100-seed
weight had high heritability coupled with high genetic advance.
Konwar and Hozarika (1988) studied 16 pigeonpea genotypes for
genetic variability and reported high heritability with high genetic advance for
days to maturity, days to flowering and plant height.
Patil el al. (1989) observed high amount of genotypic coefficient of
variation for branches per plant followed by pods per plant, plant height, seed
yield per plant and seeds per pod, while low estimates were observed for days
to 50% flowering and days to maturity and high heritability and genetic
advance for plant height and 100-seed weight.
Natarajan et al. (1990) noticed the highest genotypic coefficient of
variation for pods followed by clusters per plant and seed yield, while it was
lowest for seeds per pod. High heritability coupled with high genetic advance
was observed for plant height and seed yield per plant, while low heritability
with low genetic advance for seeds per pod.
Holker et al. (1991) reported high heritability and high genetic advance
for days to 50% flowering, days to maturity and pods per plant.
Khapre and Nerker (1992) observed high amount of genotypic and
phenotypic coefficients of variation for plant height, primary branches per
plant, pods per plant and seed yield per plant, while low estimates were
observed for days to 50% flowering and days to maturity. High heritability and
high genetic advance was observed for days to 50% flowering, pods per plant
and seed yield per plant and high heritability and low genetic advance was
reported for days to maturity.
Khapre et al. (1993) noticed that plant height, pods per plant, seeds per
pod, seed yield per plant and harvest index had high genotypic and phenotypic
coefficients of variation, while low estimates of genotypic coefficient of
variation were recorded for shelling per cent and seeds per pod.

Ghodke et al. (1994) evaluated 10 genotypes under three cropping
systems for deciding the selection criteria and noticed that high heritability for
pods per plant, days to 50% flowering and days to maturity and high genetic
advance as per cent of mean for secondary branches and pods.
Aher et al. (1996) reported that the estimates of genotypic and
phenotypic coefficients of variation were highest for plant height, primary
branches per plant, secondary branches per plant and pods per plant, while low
estimates were observed for days to 50% flowering, days to maturity, seeds per
pod and 100-seed weight. High heritability and low genetic advance was
reported for days to 50% flowering, days to maturity, plant height, primary
branches per plant, seeds per pod and protein content.
Dahat et al. (1997) noticed that high amount of genotypic and
phenotypic coefficients of variation for primary and secondary branches per
plant, plant height, pods per plant and seed yield per plant both in sole as well
as intercrop situations. High heritability accompanied with high genetic
advance was also observed for secondary branches per plant, plant height, pods
per plant, seed yield per plant under both the conditions.
Aher et al. (1998) reported high magnitude of variability for secondary
branches per plant followed by seed yield per plant, days to 50% flowering and
plant height, while low estimates of variability were observed for pods per
plant. High heritability accompanied with high genetic advance was observed
for primary and secondary branches per plant, followed by seed yield per plant,
days to 50% flowering and plant height.
Pansuriya et al. (1998) studied 20 early maturing pigeonpea genotypes
and reported that dry matter per plant, plant height and pods per plant showed
wide range of phenotypic variation. The genotypic and phenotypic coefficients
of variation were highest for dry matter per plant, harvest index, pods per plant
and seed yield per plant, high heritability estimates for all the characters and
high genetic advance for dry matter per plant followed by pods per plant and
plant height.

Patel and Patel (1998) observed high genotypic and phenotypic
coefficients of variation for clusters per plant, pods per plant, plant height,
primary branches per plant and seed yield in all hybrids.
Takalkar et al. (1998) observed maximum variability for pods per plant
followed by straw yield per plant. The high heritability estimates were
observed for all the characters under study except straw yield per plant. The
expected genetic advance was high for pods per plant, plant height, straw yield
per plant and days to maturity and low genetic advance was observed for
branches per plant, seeds per pod, 100-seed weight and harvest index.
Basavarajaiah et al. (1999) noticed high amount of phenotypic and
genotypic coefficient of variation for days to 50% flowering, pods per plant,
seed yield per plant and length of pod bearing branches. High heritability and
high genetic advance were observed for 100-seed weight and seed yield per
plant.
Kingshlin and Subbaraman (1999) reported high heritability and high
genetic advance for pod length, seeds per pod and low genetic advance for
days to 50% flowering.
Srininivas et al. (1999) carried out studies in a line x tester set with two
male sterile lines and 11 pollen parents. They noticed that genetic variability
was highest for pods per plant and lowest for seeds per pod, high heritability
for all the characters except seeds per pod and maximum genetic advance for
pods per plant.
Deshmukh et al. (2000) noticed highest genetic variability for secondary
branches per plant under inter crop. Heritability estimates were high for 100-
seed weight, primary and secondary branches per plant under sole as well as
inter cropping and for plant height and seed yield per plant under sole crop and
plant spread under inter crop. High heritability accompanied with high genetic
advance was recorded for characters plant height, pods per plant and plant
spread.

Venkateswarlu (2001) observed the maximum variability for pods per
plant followed by yield per plant and plant height. The high heritability
coupled with high genetic advance was observed for seed yield per plant, days
to maturity and yield per plant.
Magar (2003) reported that genotypic and phenotypic coefficients of
variation were highest for pods per plant, plant spread, seed yield per plant and
primary branches per plant and high heritability and genetic advance was
observed for pods per plant and seeds per pod.
Gohil (2006) studied 39 genotypes of pigeonpea for 13 characters
related to yield and yield contributing characters and noticed high phenotypic
coefficients of variation were observed for grain yield per plant, plant height,
branches per plant, clusters per plant, pods per plant, pods per cluster and
harvest index. Grain yield per plant, days to 50% flowering, days to maturity,
clusters per plant, pods per plant, pods per cluster and harvest index showed
high heritability. Considering high genetic advance, percentage of mean was
found for grain yield per plant, clusters per plant, pods per plant and harvest
index.
Firoz Mahamad et al. (2006) studied 49 genotypes of vegetable
pigeonpea that high amount of PCV and GCV for branches for per plant, pods
per plant, green pod yield and green seed yield per plant. High heritability
coupled with high genetic advance was observed for plant height, branches per
plant, pods per plant and 100-seed weight.
Anantharaju and Muthiah (2008) reported low amount of PCV and
GCV for days to 50% flowering, days to maturity and pod length, high
heritability coupled with high genetic advance as percent of mean were
observed for seed yield per plant, seeds per pod and 100-seed weight.
Kalaimagal et al. (2008) reported high genotypic and phenotypic
coefficients of variation and genetic advance for plant height, clusters and pods

per plant and low variability, moderate heritability and genetic advance were
observed for seed yield per plant.
Singh et al. (2008) studied seven genotypes and 10 interspecific crosses
and reported high PCV and GCV for all the characters except for days to 50%
flowering and days to maturity. High heritability accompanied with high
genetic advance was observed for primary branches per plant, pod length, 100-
seed weight and seed yield per plant, whereas days to 50% flowering showed
high heritability and low genetic advance as per cent of mean.
Dodake et al. (2009) studied 21 genotypes and observed that the
variability in plant spread, 100-seed weight, days to 50% flowering, days to
maturity and seed yield per plant were heritable and additive type of gene
action was operative for the characters.
Bhadru (2010) analyzed 27 accessions and recorded moderate to high
phenotypic and genotypic coefficient of variation for pods, seed yield per
plant, plant height and plant spread. High heritability accompanied with high
genetic advance as per cent of mean was observed for pods per plant, primary
and secondary branches per plant, test weight, plant height and plant spread.
Patel and Acharya (2011) reported high GCV and PCV for yield per
plant, pods per plant and branches per plant. High heritability coupled with
moderate to high genetic advance for grain yield per plant, plant height, pods
per plant, days to 50% flowering and days to maturity.
Sreelakshmi et al. (2011) studied 36 hybrids and three checks of
pigeonpea and noted higher value of PCV over GCV for yield and yield related
characters. High heritability coupled with high genetic advance as per cent of
mean were observed for seed yield, primary branches per plant and secondary
branches per plant.
Jaggal et al. (2012) evaluated 135 pigeonpea [Cajanus cajan (L.)
Millsp.] accessions of mini core collection for 14 characters related to yield
and noticed high genotypic and phenotypic coefficient of variation, genetic

advance mean and heritability was recorded for harvest index and seed yield.
High heritability and genetic advance mean also found in plant height, days to
50% flowering, days to maturity and seed protein.
Nagy et al. (2013) studied 45 genotypes of pigeonpea and reported pod
clusters per plant had the highest magnitude of GCV and PCV followed by
seed yield per plant and pods per plant. High heritability coupled with high
genetic advance was recorded for pods per plant, pod clusters per plant, seed
yield per plant and 100-seed weight.
Rangare et al. (2013) evaluated 27 genotypes of pigeonpea for 13
characters related to yield and noticed high heritability coupled with high
genetic advance for days to maturity, days to 50% flowering, plant height, pods
per plant, biological yield per plant, seed yield per plant and harvest index.
Prasad et al. (2013) studied 11 parents and their 28 hybrids of pigeonpea
and reported high magnitude of PCV and GCV was observed for primary and
secondary branches per plant, leaf area, pods per plant, harvest index, pollen
viability and grain yield. All the characters exhibited low heritability in narrow
sense except leaf area and 100-seed weight and low to high genetic advance as
per cent of mean.
Saroj et al. (2013) evaluated 70 pigeonpea genotypes. Highest GCV was
recorded for secondary branches per plant followed by pods per plant.
Heritability in broad sense ranged from 61.33 (seeds per pod) to 98.26 (days to
50% flowering). High genetic advance were observed for primary branches per
plant, secondary branches per plant, 100-seed weight, grain yield per plant,
pods per plant, plant height and days to 50% flowering.
Kumar et al. (2014) evaluated 38 genotypes of pigeonpea [Cajanus
cajan (L.) Millsp] for yield and yield contributing characters. Moderate to high
PCV and GCV were recorded for 50% flowering, pods per plant, seed, grain
yield and straw yield. High heritability and genetic advance was observed for
pods, plant height, test weight, days to maturity and primary and secondary

branches per plants, whereas the characters like days to 50% flowering, test
weight, pod length and primary branches showed high heritability along with
moderate or low genetic advance.
Ajay et al. (2014) evaluated F2 and F3 generations from three crosses of
pigeonpea namely BRG-1×ICP-8863, TTB-7×ICP-8863 and TTB-
7×ICPL87119 for yield and yield contributing characters. High variance,
heritability and genetic advance were recorded for secondary branches per
plant, pods per plant and seed yield in F2 and F3 generations.
Vanisree and Sreedhar (2014) evaluated 482 genotypes of pigeonpea
and reported that the characters seed yield per plant, pods per plant, plant
height, primary branches and days to 50% flowering showed higher genotypic
and phenotypic coefficient of variation. High heritability, high genetic variance
and high genetic advance as per cent of mean was recorded for seed yield per
plant, pods per plant, plant height, days to 50% flowering and days to maturity.
Lakhote et al. (2015) evaluated 24 vegetable type genotypes of
pigeonpea and reported high GCV and PCV for plant height, 100 green pod
weight, 100 green seed weight, shelling percentage, TSS (per cent), days to
50% flowering, pod length, as well as for primary branches. High heritability
and genetic advance was reported for 100 green pod weight and days to 50%
flowering.
Pandey et al. (2015) reported secondary branches per plant showed
highest phenotypic as well as genotypic coefficient of variation followed by
seed yield per plant and biological yield. High heritability coupled with high
genetic advance as per cent of mean was observed by 100-seed weight, pods
per plant, seed yield per plant, biological yield per plant and secondary
branches per plant suggesting preponderance of additive gene action in the
expression of these characters, while plant height, primary branches per plant,
pods per plant, seeds per pod and harvest index showed high heritability with
moderate genetic advance as per cent of mean suggesting greater role of non
additive gene action.

Ram et al. (2016) reported that phenotypic and genotypic variances,
heritability and genetic advances were estimated for yield and yield characters
in 30 pigeonpea genotypes. The highest GCV was recorded for secondary
branches per plant followed by pods per plant. Heritability in broad sense
ranged from 60.31 (seeds per pod) to 96.28 (days to 50% flowering). High
genetic advance were observed for primary branches per plant indicating the
prevalence of additive gene action for inheritance.
2.2 HETEROSIS
Heterosis is a complex biological phenomenon manifested in the
superiority of hybrids over the parental forms. The term “heterosis” was first
coined by Shull (1914) to refer to the phenomenon in which the F1 obtained by
crossing two genetically dissimilar individuals showed an increase or decrease
in vigour over the mid-parent value (Muntzing, 1945). The term
“heterobeltiosis” was proposed later (Bitzer et al 1968; Fonesca and Patterson,
1968) to denote the expression of heterosis over better parent helps the breeder
in eliminating the less productive crosses at F1 itself. The potency of heterosis
breeding is enormous in terms of increasing the productivity of crops and could
be used as indicative of crosses which are likely to generate productive
transgressive segregants (Singh and Jain, 1970).
Heterosis manifestation for seed yield is expressed in the form of
increased seed yield, which inturn is dependent on the contribution of its
components. Therefore, all the component characters of yield need to be
studied together with regard to heterosis manifestation in order to assess the
worth of a cross (Grafius, 1956).
The discovery of heterosis in chickpea (Pal, 1945) opened the way for
heterosis breeding in pulses. Varying degrees of heterosis with respect to yield
and yield components have been observed in several pulse crops. Considerable
extent of heterosis for yield and other characters has been reported in many
legumes (Singh, 1974), including pigeonpea.

Solomon et al. (1957) were the first to report hybrid vigour for seed
yield in pigeonpea. A wide range of heterosis is also present for almost all
characters in pigeonpea.
Chaudhary et al. (1980) reported that the heterosis and heterobeltiosis
were highly significant for days to flowering, days to maturity, plant height,
primary branches, pods per plant, seeds per pod, pod length, 100-seed weight
and seed yield per plant.
Singh et al. (1983) studied 24 hybrids derived from line x tester design
and reported the heterosis response upto 221% for seed yield.
Gupta et al. (1983) evaluated early maturing pigeonpea hybrids based
on genetic male sterility and reported 42% higher yield over the check, UPAS-
120.
Mohammad Sheriff and Subramanian (1983) while studying the mode
of inheritance of seven quantitative characters in pigeonpea observed
dominance and over dominance gene effects responsible for the high degree of
heterosis for yield and its components.
Patel (1985) evaluated 28 crosses derived from eight parental diallel.
High heterosis was observed for the characters pods per plant (-8.13 to
126.7%) and seed yield (-14.8 to 107.9%) while, relatively low heterosis was
observed for days to maturity (-5.5 to 1.6%), seeds per pod (-13.0 to 15%) and
100-seed weight (-24.8 to 22.3%).
Patel (1988) evaluated 60 hybrids from three genetic male sterile lines
and reported considerable degree of heterosis over mid and better parents for
days to maturity, plant height, pods per plant, seed yield per plant and harvest
index and low heterosis was observed in respect of pod length, seeds per pod
and 100-seed weight.
Rao (1989) reported considerable degree of heterosis for seed yield and
component characters among a set of 63 hybrids derived through line x tester

mating between three genetic male sterile lines and 21 short duration pollen
parents.
Rana (1990) studied 45 hybrids derived through line x tester mating
design using three genetic male sterile lines and 15 pollinators and reported
desirable heterosis for seed yield and its component characters like pods per
plant, branches per plant and per day productivity.
Mehetre et al. (1993) studied the hybrids of 18 pigeonpea varieties and
the results showed significant heterosis values over better parent for seed yield
(-27.5 to 193.8%). For other characters, such as plant height, plant spread,
branches per plant and pods per plant heterosis over mid parent was noted,
whereas days to flowering and days to maturity over both mid and better
parents.
Narladkar and Khapre (1994) observed significant heterosis over better
parent (39.99) and standard hybrid ICPH8 (147.37) for seed yield from the
study of three male sterile lines and eight diverse testers, and their 24 hybrids.
Sinha et al. (1994) reported the desirable relative heterosis for seed
yield in 38 hybrids out of 60 cross combinations. Heterosis was also noticed
for pods per plant and 100-seed weight, while poor or negative heterosis was
recorded for seeds per pod.
Narladkar and Khapre (1996) reported that the crosses involving MS
Hy9 showed marked heterosis for height at first effective branch, primary
branches, pods per plant and seed yield per plant from the study involving 11
parents and 24 hybrids through line x tester mating design.
Manivel et al. (1999) in a study of 40 hybrids from a line x tester
analysis reported that significant negative heterobeltiosis for days to 50%
flowering (-16.7%) and positive significant heterobeltiosis for plant height
(37.6%), 100-seed weight (25.7%) and seed yield per plant (146.4%).

Hooda et al. (1999) reported high heterosis for plant height, primary
branches per plant, pods per plant, seed yield per plant and significant negative
heterosis for days to maturity from a study of 40 hybrids of short duration
pigeonpea.
Khorgade et al. (2000a) noticed significant heterotic effect over mid
parent and standard check for seed yield per plant in 24 pigeonpea hybrids
derived from three genetic male sterile lines and eight diverse testers. An
appreciable amount of heterosis was also reported for days to 50% flowering,
plant height, primary branches per plant, pods per plant, 100-seed weight and
protein content.
Pandey and Singh (2002) reported that standard heterosis was ranged
from 8.75 to 144.32% for seed yield. Out of 36 combinations, 12 registered
significant positive heterosis for seed yield per plant, primary and secondary
branches per plant, clusters per plant and pods per plant by evaluating three
genetic male sterile lines and 12 diverse genotypes.
Chandirakala and Raveendran (2002) reported that heterosis on seed
yield per plant was positively associated with heterosis for branches per plant,
pods per plant, and 100-seed weight by assessing three genetic male sterile
lines, ten testers and their hybrids in line x tester cross.
Sekhar et al. (2004) noticed heterosis values of 51.3 and 171.6% for
seed yield per plant over standard control Sel 90308 and a better parent,
respectively from the study of 36 hybrids involving three male sterile lines and
12 pollinator lines.
Raju and Muthiah (2007) carried out an experiment involving four lines
and three testers along with their hybrids and observed that the hybrid C05 X
1CPL-87119 was considered as the best with maximum heterosis for seed
weight and C06 X ICPL-87119 for seed yield and other yield contributing
characters.

Patel and Tikka (2008) studied 45 hybrids from three lines and 15
testers and observed that, for pods per plant 10 and 20 hybrids recorded
significant positive heterosis over better parent and control respectively. For
seed yield, 18 and 29 hybrids exhibited positive heterosis over the better parent
and control, respectively.
Sarode et al. (2009) estimated heterosis using five lines and three testers
in line x tester mating design. Maximum heterosis was recorded for pods per
plant (52.11%) followed by 100-seed weight, seeds per pod, pods per plant and
primary and secondary branches.
Shoba and Balan (2010) studied 27 early maturing hybrids resulting
from line x tester analysis and reported significant standard heterosis for plant
height, branches per plant, pods per plant, seeds per pod and single plant yield
(varied from -25.0% to 325%).
Chandirakala et al. (2010) studied the heterosis, heterobeltiosis and
standard heterosis in 30 GMS based pigeonpea hybrids. Among these, 13
hybrids exhibited significant and positive heterosis over all the three bases of
estimation. The 2 hybrids showed highly significant and positive heterosis over
mid parent, better parent and standard check. The proportion of hybrids
exhibiting significant heterotic effect for yield with genetic male sterile line
MS Prabhat DT was greater as compared to lines, MS Prabhat NDT and MS
CO5.
Pandey et al. (2013) evaluated 60 hybrids along with their parents and
standard check variety (NDA 2) and reported that heterobeltiosis for seed yield
per plant was significantly superior of 14 hybrids and 15 hybrids over standard
variety. Among all the crosses, NDACMS1-64 x NDA98-6, NDACMS1-6 x
NDA5-14, NDACMS1-4 x IPA208, NDACMS1-6 x ICP870 recorded more
than 20% standard heterosis for seed yield.

Gite and Madrap (2014) studies revealed that highest values for mid
parent heterosis and heterobeltiosis for plant height, primary and secondary
branches per plant, pods per plant and 100-seed weight.
Patel and Tikka (2014) reported high heterosis was recorded for grain
yield per plant, pods per plant and harvest index, while, medium heterosis for
plant height, branches per plant, 100-seed weight, protein content, biological
yield and reproductive period. Days to flowering, days to maturity, seeds per
pod and pod length recorded low magnitude of heterosis.
Patil et al. (2014) recorded highly significant positive heterosis over
better parent for seed yield and its component with protein content. The best
three hybrids on the basis of heterobeltiosis were GT 102 x ICPL 87119
(33.80%), ICPL 87119 x AGT 2 (25.23%) and BSMR 853 x ICPL 87119
(25.35%).
Ajay et al. (2015) observed maximum positive heterosis over mid parent
was observed for seed yield per plant (132.88%) and pods per plant (114.53%).
In addition to it, maximum heterosis over better parent was observed for pods
per plant (96.97%) followed by seed yield per plant (96.11%), and concluded
that significant heterosis was observed for branches per plant and pods per
plant have resulted in increased yield of hybrids.
Kumar et al. (2015) reported that majority of hybrids showed standard
heterosis in desirable direction for yield and yield attributing characters over
the standard checks (Asha and Maruti).
Mhasal et al. (2015) studied 11 genotypes of pigeonpea and found that
the cross ICPA-2047A × AKPR-324 depicted high mean performance (33.67)
and high magnitude of useful heterosis (17.72% over check PKV-TARA and
23.17% over check Asha). Another cross ICPA-2047A × AKPR-372 also
revealed high mean performance (33.00g) and high magnitude of useful
heterosis (15.38% over check PKV-TARA and 20.73% over Asha).

Reddy et al. (2015) reported that 24 pigeonpea hybrids showed
maximum heterosis over mid parent, better parent and standard check were
observed for seed yield per plant, followed by secondary branches and pods
per plant. High heterosis, more than 100%, over the check, ‘Asha’ more than
50% over mid parent and more than 30% over better parent, was noticed in the
hybrids, ‘ICPH 3762’ and ‘ICPH 3474’.
Singh and Singh (2016) concluded the cross, MAL-17 × NDA 49-6
(266.32%) showed maximum estimates of yield heterosis, also exhibited
significant heterosis for days to 50% flowering, primary and secondary
branches, pods per plant, pod length and harvest index.
2.3 COMBINING ABILITY
Sprague and Tatum (1942) defined the terms general combining ability
(gca) and specific combining ability (sca). The gca refers to average
performance of a parent in a series of hybrid combinations and is attributable
to additive (fixable) gene action, while sca refers to the deviation in the
performance of crosses in certain specific combinations (worse or better) that
would be expected on the basis of average performance of the lines involved in
it and is attributed primarily to dominant and epistatic gene effects (non-
additive and non-fixable). Combining ability analysis helps the breeder in
selecting the parents to be used in the hybridization programmes and to select
an appropriate breeding method by providing necessary information on the
nature of gene action governing a character.
Several research workers have studied combining ability and nature of
gene action in pigeonpea which are briefly reviewed here under:
Mehetre et al. (1988) reported that both additive as well as non-additive
gene effects were important for all the characters studied except seeds per pod
from the study involving 36 crosses along with their nine diverse parents.
Dhameliya et al. (1994) reported good gca effect for seed yield per
plant, earliness, dwarfness, pods per plant, pod length, seeds per pod, seed

weight and protein content. The magnitude of additive genetic variance was
higher than non-additive variance for all the characters except seed yield per
plant from the information on combining ability derived from 10 pigeonpea
genotypes.
Achamma Oommen et al. (1996) reported that primary branches was
determined by both additive and non-additive genes, whereas secondary
branches, plant height, days to flowering, days to maturity, clusters per plant,
length of pod bearing branches, pods per plant, seeds per pod, 100-seed weight
and seed yield were determined by additive genes.
Srinivas et al (1998) studied six medium to late duration pigeonpea
lines, three testers and the resulting 18 hybrids and revealed that the
predominance of non-additive gene action for all the characters.
Pandey (1999) observed genetic variation due to over-dominance and
non-additive type of gene action for days to flowering, plant height, primary
and secondary branches per plant, clusters per plant, pods per plant and seed
yield per plant and partial dominance of additive gene action for days to
maturity.
Jayamala and Rathnaswamy (2000) reported non-additive gene action
for the expression of days to first flowering, branches per plant, plant height,
pods per plant, days to maturity, seeds per pod and additive gene action for
seed yield.
Khorgade et al. (2000b) carried out an experiment involving three
genetic male sterile lines and eight testers of pigeonpea and indicated the
predominance of additive gene effects for seed yield per plant except plant
height.
Ajay Kumar et al. (2001) studied three genetic male sterile lines and
nine testers in L x T design and revealed that non-additive genetic variance
was controlled the expression of yield per plant, primary branches per plant,

pods per plant, seeds per pod and 100-seed weight whereas additive genetic
variance governed the expression of days to flowering and plant height.
Pandey and Singh (2002) studied three lines, 12 testers and resulting 36
crosses in L x T design and the estimates of σ2 gca and σ
2 sca suggested partial
dominance of additive gene action for pods per plant and non-additive genetic
variance for days to flowering, days to maturity, plant height, primary branches
per plant, percent pod setting, harvest index and seed yield per plant. Out of the
36 cross combinations, 10 showed higher magnitude of sca effects involving
high x high and low x high combining ability effects of lines and testers,
respectively, for seed yield per plant, secondary branches per plant, clusters per
plant, pods per plant and percent pod setting.
Jahagirdar (2003) analyzed the combining ability of 24 hybrids of
pigeonpea obtained from crosses between three lines and 8 testers along with
their parents and revealed the significant non-additive gene action for all the
characters, as variance due to sca were higher than gca variances.
Lohithaswa and Dharmaraj (2003) reported non-additive gene action for
shoot vigour index, days to maturity, plant height, seeds per pod and seed yield
per plant, while additive gene action was noticed for days to 50% flowering,
100-seed weight and protein content.
Sunil kumar et al. (2003) studied combining ability of 10 genotypes in
diallele fashion revealed non-additive gene action for all the characters except
days to 50% flowering, 100-seed weight and protein content, for which
additive gene action was predominant. Majority of the crosses showing high
sca effects for seed yield involving low x low or low x average general
combiners.
Pandey (2004) reported that in lines, good gca effects were observed for
seed yield per plant, secondary branches per plant, clusters per plant and pods
per plant while in testers, good gca effects were observed for primary branches
per plant and% pod setting from a study involving three genetic male sterile

lines and 12 testers in line x tester design. Out of 36 crosses, 10 crosses
showed significant sca effects for seed yield per plant, secondary branches per
plant, clusters per plant, pods per plant and per cent pod setting.
Sekhar et al. (2004) revealed the predominance of non-additive gene
action for days to 50% flowering, days to maturity, plant height, plant spread,
clusters per plant, pods per cluster, pods per plant, seeds per pod, 100-seed
weight, seed yield per plant, biomass and harvest index by using three lines
and 12 testers.
Banu et al. (2007) studied gca and sca effects in 45 pigeonpea hybrids
along with their parents and revealed the pre-dominance of non-additive gene
action for days to 50% flowering, days to maturity, plant height, primary
branches per plant, clusters per plant, pods per plant, seeds per pod, pod length,
100-seed weight and single plant yield.
Raju and Muthiah (2007) studied 12 crosses along with their parents
viz., four lines and three testers and noticed significant role of non-additive
gene action for all the character except primary branches per plant and phenol
content.
Phad et al. (2007) reported significant gca and sca effects for seed yield
per plant, plant spread, primary branches per plant, secondary branches per
plant and pods per plant from the study of five lines, 12 testers and their
hybrids in L x T design.
Yadav et al. (2008) carried out an experiment involving 10 diverse
parents in diallel fashion and the results revealed that the mean squares due to
gca and sca effects were significant for all characters except seeds per pod.
The ratio of gca and sca genetic variances indicated preponderance of non-
additive gene effects for all the characters except days to 50% flowering, days
to maturity and pod length.

Phad et al. (2009) evaluated 60 crosses involving five lines and 12
testers in L x T fashion, some crosses showed high significant sca effects for
primary branches per plant, pods per plant and seed yield per plant.
Vaghela et al. (2009) studied 28 hybrids along with their eight parents
of pigeonpea and revealed higher magnitude of sca variance over gca variance
for all the characters which indicated preponderance of non-additive gene
action.
Patel et al. (2010) studied 45 hybrids resulting from three genetic male
sterile lines and 15 testers and indicated that non-additive variances observed
for plant height, branches per plant, seed yield per plant and protein content,
whereas days to flowering, days to maturity, pods per plant, seeds per pod, pod
length and reproductive period were governed by additive genetic variances.
Gupta et al. (2011) observed that lines ‘CMSGT 33A’, ‘CMSGT 100A’,
‘CMSGT 288A’, ‘CMSGT 301A’ and ‘CMSGT 311A’ among females
(A lines); and ‘GTR 27’ and ‘GTR 29’ among males (R lines) were good
general combiners for seed yield and other one or more characters. ‘CMSGT
311A’× ‘GTR 29’, ‘CMSGT 310A’ × ‘GTR 27’, ‘CMSGT 288A’ × ‘GTR 26’,
‘CMSGT 301A’ × ‘GTR 27’, ‘CMSGT 301A’ × ‘GTR 30’ and ‘CMSGT
100A’ × ‘GTR 28’ showed desired higher sca effects for seed yield per plant,
pods per plant, 100-seed weight, water absorption, leaf area index at 100 DAS
and rate of photo synthesis at 80 DAS, respectively.
Parmar et al. (2012) observed that lines ICPA 2086, ICPA 2089, ICPA
2052, Asha and GT 101 were good general combiners for seed yield and
crosses ICPA 2086 x ASHA, ICPA 20 x JKE 114 and GT 33 x JKM 189
showed higher sca effect for seed yield per plant.
Meshram et al. (2013) noticed predominance of non additive gene
action was observed for almost all the characters including seed yield except
plant height which was under the influence of additive gene action. None of the
parents exhibit significant gca effects for all the characters under study.

However, among the lines AKCMS 10A, AKCMS 13A and AKCMS 09A and
among the testers AKPR 8, AKPR 359 and AKPR 292 were identified as
potential parents as they exhibited significant gca effects for most of the
important characters.
Yamunura et al. (2014) noticed predominance of non-additive gene
effects for 10 characters indicating relevance of heterosis breeding for
improving yield attributes. The gca effects of parents revealed that ICPA-2078,
GT-308A, PKV-TATA, ARCCV-2 and GPHR-08-11 were good general
combiners for seed yield and its direct components. The estimates of sca
effects revealed that nine experimental hybrids had significant, desirable and
positive sca effects for seed yield. The cross combination ICPA-2092 x
VIPUL, ICPA-2078 x BSMR-856 and ICPA-2078 x ARCCV-2 were good
specific combiners for secondary branches, pods per plant, seed yield per plant.
Patil et al. (2015) reported higher magnitude of specific combining
ability (sca) effect showed that, hybrid yield was under the control of non-
additive genes. Among A-lines, ICPA-2204 was the best general combiner.
Among testers, ICPL-20116 was the best general combiner. Among hybrids,
ICPA-2208 x ICPL-20108 a cross between high general combining ability
(gca) parents was the best with positive significant sca effect and higher mean
performance for grain yield, hundred seed mass, seeds per pod and resistance
to fusarium wilt disease.
Patel and Tikka (2015) observed the specific combining ability (sca)
variance was found to be more important compared to general combining
ability (gca) variance for days to flowering, days to maturity, plant height,
branches per plant, pods per plant, seeds per pod, pod length, 100-seed weight,
seed yield per plant, protein content, biological yield per plant, harvest index,
vegetative period and reproductive period.
Tikle et al. (2016) observed the estimates of gca effects indicated male
parent ICPL-87119 was good general combiner for days to maturity and pollen
fertility and among the female parent ICP-2043 was good general combiner.

Cross combinations ICP-2043 x ICP-87119, ICP-2048 x ICP-20108, ICP-2078
x ICP-87119 and ICP-2092 x ICP-20108 were found to be good specific
combinations for seed yield plant and other desirable characters.
2.4. CHARACTER ASSOCIATION
Genetic improvement of yield is the primary concern to plant breeder as
yield is a complex, quantitatively inherited character and is highly influenced
by the environment. On the contrary, the yield component characters are not
only less complex and relatively simply inherited and are influenced much less
due to environmental deviations. Thus effective improvement in yield may be
brought about through selections in yield components (Grafius, 1956 and
Srivastava et al. 1972).
Yield component characters show associations among themselves and
with yield. Unfavourable associations between the desired attributes under
selection may limit genetic advance. Hence, study of associations of
component characters with yield enables a plant breeder to know how
improvement of one character will bring about simultaneous improvement in
other characters and also aid in planning of an effective selection programme.
Hence a brief review of literature is presented here under.
Asawa et al. (1981) noted that yield was positively correlated with
secondary branches, pods per plant, seeds per plant and days to maturity and
weak correlation among seeds per plant and pods per plant.
Balyan and Sudhakar (1985) reported seed yield per plant had positive
and significant association with plant height, days to maturity, primary
branches, and secondary branches, pods per plant, seeds per pod and 100-seed
weight.
Bhongale and Raut (1987) found that plant height, branches per plant,
pod number, pod weight and seeds per pod were positively correlated with
each other and also with seed yield.

Angadi et al. (1988) noted that pod yield was significantly correlated
with seed yield, pods per plant, days to flowering and plant height.
Balakrishnan and Natarajaratnam (1989) revealed that seed yield had
a positive correlation with pods per plant and pod setting percentage. Among
the yield components, 100-seed weight was positively correlated with pods per
plant.
Natarajan et al. (1990) observed pod number, cluster number and plant
height were positively and significantly correlated with yield. They also
reported that plant height, branch number, cluster number, seed number and
100-seed weight were highly correlated.
Paul and Upadhaya (1991) observed positive correlation of yield per
hectare with branches per plant, pods per plant, pods per cluster and yield per
plant. The correlation between the pods per plant and yield per plant was found
to be positively significant and the length of pod was significant but negatively
correlated with yield per plant as well as with the pods per plant.
Dhameliya and Pathak (1994) reported significant and positive
association of seed yield with plant height and pods per plant, whereas
significant and negative association of seed yield with pod length and seeds per
pod. They also reported that days to 50% flowering, days to maturity, plant
height, primary branches per plant, pod length, seeds per pod and 100-seed
weight were highly correlated.
Salunke et al. (1995) observed in a study of 54 diverse genotypes of
pigeonpea that seed yield was significantly and positively associated with pods
per plant, primary and secondary branches, plant spread, plant height and
100-seed weight. It had a strong negative association with seeds per pod. The
yield components like days to 50% flowering, days to maturity, plant height,
plant spread, primary and secondary branches and 100-seed weight were
positively associated with each other.

Gumber et al. (1996) studied 28 genotypes and noted that the days to
flowering and days to maturity showed significant positive association among
themselves and with seed yield.
Chandirakala and Raveendran (1998) indicated that seed yield was
significantly and positively correlated with branches per plant, pods per plant,
clusters per plant, seeds per pod, 100-seed weight.
Srinivas et al. (1999) reported that seed yield per plant had significant
and positive association with plant height, primary branches, secondary
branches and pods per plant.
Basavarajaiah et al. (1999) studied 81 genotypes of pigeonpea and
indicated significant positive correlation of seed yield observed with pods per
plant and branches per plant.
Deshmukh et al. (2000) noticed that seed yield was positively and
significantly associated with all characters under different cropping systems.
Pods per plant exhibited highly significant correlation with seed yield which
was also significantly associated with majority of the characters under sole
crop whereas, secondary branches per plant was significantly associated with
majority of the characters under inter crop.
Bharadwaj and Gupta (2004) studied 55 diverse genotypes of pigeonpea
and reported that the protein content was positively correlated with days to
flowering, harvest index and days to maturity, but exhibited negative
correlation with plant height, primary and secondary branches, pods per plant,
seeds per pod, 100-seed weight and seed yield per plant.
Chattopadhyay and Dhiman (2005) studied 100 accessions of pigeonpea
and the reported that plant height, seeds per pod contributed positively and
directly, whereas 100-seed weight was negatively correlated with seed yield.
Gangwar and Bajpai (2006) observed negative correlations for protein
content with primary branches, pod length, 100-seed weight and seed yield.

Baskaran and Muthiah (2007) assessed 27 genotypes and their
correlation studies indicated that seed yield per plant had significant positive
relationship with pods per plant, clusters per plant, 100-seed weight and plant
height.
Mahajan et al. (2007) evaluated nine pigeonpea genotypes to understand
the contribution of various characters to the yield and reported that pods per
plant, pod length, plant height and days to maturity had significant positive
association with yield.
Singh et al. (2008) studied 29 genotypes of pigeonpea and reported that
seed yield per plant exhibited positive and significant correlation with pods per
plant and harvest index, indicating the higher values for these characters
contribute towards higher yield potential.
Dodake et al. (2009) noticed that the seed yield was positively and
significantly correlated with days to 50% flowering, plant spread and pods per
plant.
Sawant et al. (2009) studied 46 genotypes and revealed that the
genotypic correlation coefficients were higher than corresponding phenotypic
correlations. Seed yield showed significant positive correlation with plant
spread, secondary branches per plant, pods per plant and days to maturity.
Sodavadiya et al. (2009) observed that genotypic correlation
coefficients were higher than phenotypic correlation coefficients. Seed yield
per plant had significant and positive association with days to 50% flowering,
days to maturity, branches per plant, pods per plant and 100-seed weight at
both genotypic and phenotypic levels.
Bhadru (2010) reported that seed yield was significantly and positively
associated with days to 50% flowering, plant height, primary and secondary
branches per plant, pods per plant and raceme length.

Mittal et al. (2010) noted that seed yield was positively associated with
plant height, branches per plant, pods per plant and harvest index in pigeonpea
genotypes.
Linge et al. (2010) found that yield was positively and significantly
correlated with all characters except for first primary branch from ground level
and seeds per pod in 40 inter specific derivatives of pigeonpea.
Thanki and Sawargaonkar (2010) reported significant and positive
correlation of pods per plant and harvest index with seed yield per plant in 28
different genotypes of pigeonpea.
Hamid et al. (2011) evaluated 100 germplasm lines of pigeonpea and
noted high strong and positive correlation of seed yield with pods per plant
followed by pod length.
Patel and Acharya (2011) found that yield was significantly and
positively correlated with plant height, branches per plant, pods per plant, pod
length, seeds per pod and 100-seed weight in 64 F6 progenies of pigeonpea.
Rathore and Sharma (2011) found that seed yield per plant was
positively correlated with seeds per plant in 25 erect groups whereas, pod
clusters per plant, pods per plant and 100-seed weight in 25 semi-spreading
groups of pigeonpea.
Devi et al. (2012) reported significant positive correlation of seed yield
with pods per plant in parents (five lines and three testers) and plant height,
pods per plant and harvest index in 15 crosses of pigeonpea.
Udensi and Ikpeme (2012) found that there were significant positive
correlations between plant height and leaves per plant, leaf area per plant and
seeds per plant, leaves per plant and pod length per plant.
Arbad et al. (2013) conducted characters association studies for seed
yield and its components in pigeonpea and found that pods, secondary
branches per plant, plant height, primary branches per plant showed

significantly positive correlation with seed yield at genotypic and phenotypic
levels.
Birhan (2013) reported that seed yield had positive and significant
phenotypic and genotypic association with plant height, biomass yield per
plant, pods per plant, seeds per plant, days to maturity, days to flowering and
seeds per pod.
Nagy et al. (2013) conducted association studies in 45 pigeonpea
germplasm accessions and found that, seed yield per plant showed the highest
significant positive correlation with pods per plant followed by pod cluster per
plant, primary branches per plant and pod length.
Prasad et al. (2013) found that primary branches per plant, secondary
branches per plant, pods per plant, pod bearing zone, harvest index and pollen
viability exhibited positive and significant correlation with grain yield in
pigeonpea.
Singh et al. (2013) showed that the seed yield per plant was found to be
significant positively associated with seeds per pod, pod length and plant
height at genotypic level in pigeonpea.
Rekha et al. (2013) reported strong positive association of seed yield
with pods per plant, secondary branches per plant, primary branches per plant
and plant height.
Saroj et al. (2013) revealed that the days to 50% flowering had
significant and strongly positive association with yield per plant, primary
branches per plant, pods per plant, days to maturity, 100-seed weight and plant
height in both genotypic and phenotypic level.
Kothimbire et al. (2015) concluded the correlation analysis for yield per
plant recorded highly significant and positive association with days to 50%
flowering, days to maturity, plant height, primary branches, secondary
branches and pods per plant.

Pandey et al. (2016) found that biological yield per plant, pods per
plant, 100-seed weight, harvest index and secondary branches per plant showed
positive and highly significant correlation with grain yield per plant to emerge
as most important associates of seed yield.
2.5 PATH COEFFICIENT ANALYSIS
Path coefficient analysis which is a standard partial regression
coefficient, measures the direct influence of one variable upon another and
permits the separation of correlation coefficient into components of direct and
indirect effects (Dewey & Lu, 1959). Direct selection for yield is not a reliable
approach since it is highly influenced by the environment. Therefore, it is
essential to identity the component characters through which yield can be
improved. Thus, correlation in conjunction with path analysis would give
better insight into the cause and effect relationship between different character
pairs. The available literature on path coefficient analysis is furnished here
under.
Dumbre et al. (1985) revealed that days to flowering had highest
positive direct effect on seed yield followed by pods per plant, 100-seed weight
and plant height. The indirect effects via these characters were also positive for
all characters except seeds per pod which had negative indirect effect via 100-
seed weight.
Marekar and Nerkar (1987) observed biomass and harvest index had
largest positive direct effect on seed yield and days to first flowering, days to
maturity, plant height, height at first effective branch, primary branches,
secondary branches, clusters and 100-seed weight had indirect positive effects
on seed yield.
Angadi et al. (1988) noticed that pod yield was the only character with a
direct effect on seed yield. Pods per plant, plant height, branches per plant and
days to flower influenced seed yield through pod yield which alone had direct
influence on seed yield.

Balakrishnan and Natarajaratnam (1989) observed that pods per plant
had the highest positive direct effect on seed yield followed by harvest index
and dry matter efficiency.
Natarajan et al. (1990) reported that cluster number followed by pod
number showed high positive direct effect on seed yield.
Satpute (1994) revealed that seeds per pod exhibited highest magnitude
of positive direct effect on seed yield, followed by dry matter production.
Salunke et al. (1995) noticed that pods per plant, seeds per pod, and
100-seed weight had direct positive effects on seed yield. The pods per plant
and 100-seed weight also exhibited high positive indirect effects on seed yield
through most of the other characters. It was suggested that pods per plant,
seeds per pod and 100-seed weight could prove useful as selection criteria for
early pigeonpea.
Paul et al. (1996) revealed that six independent characters having
positive direct effect on seed yield, maximum contribution was of pods per
plant, followed by dry matter at maturity and 100-seed weight.
Kingshlin and Subbaraman (1997) assessed that pod length, seeds per
pod and 100-seed weight made the greatest contribution towards seed yield,
both directly and indirectly.
Musaana and Nahdy (1998) indicated that pod clusters per plant, pods
per plant, seeds per pod and seed weight were the main yield components
having maximum direct effects on yield.
Chandirakala and Raveendran (1998) revealed from their studies on 13
pigeonpea genotypes that 100-seed weight had the highest positive direct effect
on seed yield followed by pods per plant and clusters per plant. Branches per
plant, pods per plant, clusters per plant, seeds per pod and 100-seed weight
showed high positive indirect effect on seed yield.

Srinivas et al. (1999) observed high and positive direct effect of pods
per plant, plant height and secondary branches on seed yield.
Basavarajaiah et al. (1999) evaluated 81 pigeon pea genotypes and
reported that plant height, branches per plant and pods per plant showed
maximum direct effects on seed yield.
Bharadwaj and Gupta (2004) reported that protein content showed
positive direct effect and negative correlation with yield.
Chattopadyay and Dhiman (2005) observed that plant height and seeds
per pod contributed positive and direct effect on seed yield.
Mittal et al. (2006) reported from a study of 21 diverse progenies of
pigeonpea that seeds per pod, followed by pods per plant and plant height had
high positive direct effect on seed yield.
Baskaran and Muthiah (2007) revealed pods per plant, 100-seed weight
and plant height to be the major contributors for seed yield. Selection based on
these attributes will be most advantageous in pigeonpea.
Mahajan et al. (2007) evaluated nine genotypes, maximum direct
positive and negative contribution to yield was observed from pods per plant
and days to flower initiation, respectively.
Anuradha et al. (2007) studied 30 genotypes of pigeonpea and revealed
that the harvest index had a high positive direct effect on seed yield followed
by seeds per pod, primary branches per plant.
Jogendra Singh et al (2008) noticed that pods per plant, 100-seed weight
and harvest index are main components of seed yield. Hence, more emphasis
should be given on these characters in selection programme.
Sawant et al. (2009) revealed that pods per plant had the highest
positive direct effect on seed yield, followed by plant spread and 100-seed
weight.

Sodavadiya et al. (2009) reported that 100-seed weight days to maturity
and pod length exerted high direct effects on seed yield. 100-seed weight, days
to maturity also contributed indirectly towards seed yield per plant through
most of the characters.
Bhadru (2010) noticed that days to 50% flowering, plant spread,
primary and secondary branches per plant, pods and raceme length had
moderate to low direct effect on seed yield.
Patel and Acharya (2011) found that pods per plant had the highest
positive direct effect on grain yield per plant.
Rathore and Sharma (2011) indicated maximum positive direct effect on
seed yield was exhibited by seeds per plant in erect group and days to 50%
flowering in semi-spreading group.
Sreelakshmi et al. (2011) in their studies on pigeonpea revealed that
maximum direct effect on seed yield was exhibited by primary branches per
plant, days to 50% flowering and pods per plant.
Devi et al. (2012) showed that out of 14 characters, pods per plant, days
to flowering, plant height and pod length in parents while pods per plant in
crosses showed high positive direct effect on seed yield, indicating that these
characters should be given due importance while making selection for
increased seed yield in pigeonpea.
Nag and Sharma (2012) found that, pod clusters per plant had the
highest direct effect on seed yield whereas, pods per plant and days to maturity
had the highest indirect effect on seed yield via the characters pods per plant
and days to 50% flowering, respectively.
Udensi and Ikpeme (2012) showed that 100-seed weight had the highest
positive direct effect on yield. This was followed by the pod length per plant,
leaves and leaf area, while plant height had very high negative direct effect.

Arbad et al. (2013) reported that, pods, secondary branches per plant,
plant height, and primary branches per plant were the most important
characters with high direct and positive indirect effect.
Birhan (2013) showed that, days to maturity had the highest positive
direct effect on seed yield followed by plant height and seeds per plant
whereas, genotypic path analysis revealed that, maximum direct effect on seed
yield was exerted by days to flowering and days to maturity followed by seeds
per plant and plant height. Thus, seeds per plant and plant height were the
potent contributor to seed yield which could be used as indirect selection
criteria.
Reddy and Rangare (2013) noticed from their path analysis of 27
genotypes of pigeonpea that harvest index had high positive direct effect on
seed yield followed by biological yield per plant and days to 50% flowering. It
also indicated that harvest index, biological yield per plant and days to 50%
flowering are important characters in deciding the grain yield per plant.
Pahwa et al. (2013) reported that leaf area, specific leaf weight, pods per
plant and plant height had direct positive contribution towards seed yield.
Prasad et al. (2013) found that primary branches per plant, secondary
branches per plant, pods per plant, harvest index and pollen viability exhibited
positive and high direct effects ranged from 0.060 to 0.430.
Rekha et al. (2013) showed that pods per plant exerted highest positive
direct effect on seed yield whereas, primary branches per plant and 100-seed
weight had moderate and low positive direct effects on seed yield, respectively.
Saroj et al. (2013) showed that pods per plant, 100-seed weight, days to
50% flowering, primary branches and secondary branches per plant had
maximum direct effect on grain yield per plant.
Singh et al. (2013) showed that, seeds per pod exhibited the highest
magnitude of direct effects on seed yield, followed by primary branches per

plant and pod length. Pod length and seeds per pod showed positive and
significant correlation (0.529 and 0.794) with seed yield per plant and also
exhibited positive and strong direct effects (0.531 and 0.266) on seed yield per
plant.
Arbad et al. (2014) reported pods per plant, secondary branches per
plant, plant height, and primary branches per plant were the most important
character which can be used to improve yield in pigeonpea.
Pandey et al. (2016) identified biological yield per plant followed by
harvest index, pods per plant, days to maturity, primary branches per plant,
100-seed weight and seeds per pod as most important direct yield contributing
characters in pigeonpea.

Chapter – III
Material and Methods

Chapter – III
MATERIALS AND METHODS
The present study was undertaken with a view to evaluate heterosis and
combing ability by adopting L x T analysis in pigeonpea during kharif, 2016 at
ICRISAT, Hyderabad. The experimental site is situated at an altitude of 545 m
above mean sea level, 17° 53’N latitude and 78° 27’E longitude
geographically. The materials used and methods followed in the present
investigation are described below.
3.1 MATERIALS
The experimental material comprised of nine parental genotypes viz., five
females (lines) namely, ICPB-2078, ICPB-2043, ICPB-2047, ICPB-2048 and
ICPB-2092, four males (testers) namely, ICPL-87119, ICPL-20108, ICPL-
20116 and ICPL-20123, 20 cross combinations obtained through line x tester
mating design. The standard check included in the experiment was Maruti.
Parents resistent to fusarium wilt and sterility mosaic and give higher yield.
The details of parents and their source are furnished in the Table 3.1.
3.2 METHODS
3.2.1 Field Layout
The hybrids made during kharif, 2015 at ICRISAT, Hyderabad were evaluated
during kharif, 2016 at ICRISAT, Hyderabad. The parents (five lines and four
testers) and 20 cross combinations along with standard check were sown on
25th
july, 2016 in a randomized block design with three replications. Each entry
was grown in four rows of 4m length in each plot. The spacing adopted
between row to row was 75 cm and 30 cm between plant to plant within a row.
Five plants were tagged randomly for recording the data.

Table 3.1. Details of genotypes used in the present investigation:
S. No. Genotype Pedigree
1. ICPH 3933 ICPA 2078 x ICPL 87119
2. ICPH 2671 ICPA 2043 x ICPL 87119
3. ICPH 2740 ICPA 2047 x ICPL 87119
4. ICPH 2751 ICPA 2048 x ICPL 87119
5. ICPH 3461 ICPA 2092 x ICPL 87119
6. ICPH 4187 ICPA 2078 x ICPL 20108
7. ICPH 3467 ICPA 2043 x ICPL 20108
8. ICPH 3481 ICPA 2047 x ICPL 20108
9. ICPH 3496 ICPA 2048 x ICPL 20108
10. ICPH 3762 ICPA 2092 x ICPL 20108
11. ICPH 4395 ICPA 2078 x ICPL 20116
12. ICPH 3473 ICPA 2043 x ICPL 20116
13. ICPH 4022 ICPA 2092 X ICPL 20116
14. ICPH 3487 ICPA 2047 X ICPL 20116
15. ICPH 3502 ICPA 2048 X ICPL 20116
16. ICPH 4539 ICPA 2078 x ICPL 20123
17. ICPH 3474 ICPA 2043 x ICPL 20123
18. ICPH 3488 ICPA 2047 X ICPL 20123
19. ICPH 3503 ICPA 2048 X ICPL 20123
20. ICPH 4013 ICPA 2092 X ICPL 20123
21. Maruti Selection from landraces of
Maharashtra.

Table 3.2. Description of female parental lines (CMS lines) used in the development of pigeonpea hybrids
S.
No CMS line Pedigree
Days to
50%
flowering
Days to
maturity
Plant
height
(cm)
100 Seed
weight
(g)
Seed
colour
1 ICPA 2043 ICPA 2043 (ICPA 2039 x ICPL 20176) x ICPL 20176 x
ICPL 20176 x ICPL 20176 x ICPL 20176 x ICPL 20176
114 162 198 10 Brown
2 ICPA 2047 ICPA 2047 (ICPA 2039 x ICPL 99050) x ICPL 99050 x
ICPL 99050 x ICPL 99050 x ICPL 99050 x ICPL 99050
112 165 242 10.8 Brown
3 ICPA 2048 ICPA 2048 (ICPA 2039 x ICPL 99052) x ICPL 99052 x
ICPL 99052 x ICPL 99052 x ICPL 99052 x ICPL 99052
123 168 235 12.9 Brown
4 ICPA 2078 ICPA 2078 (ICPA 2039 x ICPL 118) x ICPL 118 x ICPL
118 x ICPL 118 x ICPL 118 x ICPL 118
103 146 132 13.7 Brown
5 ICPA 2092 ICPA 2092 (ICPA 2039 x ICPL 96058) x ICPL 96058 x
ICPL 96058 x ICPL 96058 x ICPL 96058 x ICPL 96058
120 167 220 9.7 Light
brown
Source: Pigeonpea Breeding Department, ICRISAT, Patancheru, (Telangana).

Table 3.3. Description of male parental lines (R lines) used in the development of pigeonpea hybrids
S.
No R line Pedigree
Days to 50%
flowering
Days to
maturity
Plant height
(cm)
100 Seed
weight
(g)
Seed
colour
1 ICPL 87119 C 11 x ICP 1-6W3B 122 172 228 10.6 Brown
2 ICPL 20108 MS 3783 x ICPL 87119 (IPH
487 Inbred)
122 165 235 11.4 Cream
3 ICPL 20116 MS 3783 x ICPL 87119 125 181 275 10.8 Brown
4 ICPL 20123 MS 3783 x ICPL 87119 (IPH
487 Inbred)
122 168 228 10.8 Brown
Source: Pigeonpea Breeding Department, ICRISAT, Patancheru, (Telangana).

3.2.2 Crop Husbandry
The field was ploughed and harrowed to a fine tilth. The crop was raised
during kharif 2016. A fertilizer dose of 20:50:0 NPK kg/ha was applied to the
crop as a basal application. Weeding was carried out two times i.e. 30 DAS
and 60 DAS. Recommended cultural practices and plant protection measures
were taken to raise a good crop.
3.2.3 Data Recorded
3.2.3.1 Number of days to 50% flowering:
The number of days taken from date of sowing to the day when 50% of
flowering of the plants in each genotype in each replication.
3.2.3.2 Number of days to 75% maturity:
The number of days recorded from the date of sowing to the day when 75% of
the pods in the genotype had turned brown and matured.
3.2.3.3 Plant height (cm):
The plant height was measured in centimeters of a stretched plant from ground
level to the tip of the main stem at maturity.
3.2.3.4 Number of primary branches per plant:
Number of branches arising from the main stem was recorded at harvest.
3.2.3.5 Number of secondary branches per plant:
Total number of branches arising from primary branches was recorded at
harvest.
3.2.3.6 Number of pods per plant:
Number of well filled matured pods was counted at the time of harvest.

3.2.3.7 Number of seeds per pod:
The average of seeds on ten fully developed, mature and undamaged pods
taken at random from each selected plant.
3.2.3.8 100-seed weight (g):
One hundred dry seeds were counted and weighed in grams from each sample
plant.
3.2.3.9 Seed yield per plant:
The seeds from each sample plant were dried and weighed in grams.
3.2.3.10 Harvest index (%):
The ratio of single plant seed yield to the total plant dry weight (roots and
fallen leaves included) was taken and expressed in per cent.
Harvest index = 100(g) dry weightplant Total
(g) yield seedplant Singlex
3.2.3.11 Seed protein (%):
Protein content in this study refers to the total protein content in the seed. Thes
method of Lowry et al. (1951) was adopted for estimating protein content with
folin-ciacalteau reagent. The seed sample of 500 mg was homogenized with 10
ml of cold 10% TCA (Trichloro Acetic Acid). Seed sample in TCA was
collected in a test tube and kept in ice for 15 minutes. The contents were
centrifuged at 3500 rpm for 15 minutes. The pellet was washed thrice with 5
ml of TCA, 3 ml of hexane and 1ml of acetone. It was suspended in 4 ml of 2N
Sodium hydroxide, thoroughly mixed and incubated at room temperature
overnight. The contents were centrifuged at 3500 rpm for 15 minutes. Two ml
of the supernatant was collected and the volume was made upto 10 ml with
distilled water. Then 0.1 ml of the sample extract was used to estimate the
protein content by adding 5 ml of alkaline copper sulphate solution. After 10
minutes 0.5 ml of freshly prepared folin-ciacalteau reagent was added,

thoroughly mixed and allowed to stand for 30 minutes for color development.
The optical density was measured at 660 nm in a spectrophotometer against a
reagent blank. 0.1 ml of distilled water was used in place of the sample in
preparation of blank. A standard curve was prepared with a range of 0 to 300
µg ml-1
of bovine serum albumin and it was linear within range (R2
= 0.997).
The protein content of the sample was calculated substituting sample OD
values in the formula derived from the graph (Y= 1.838X), where Y = OD
values of the sample and X = concentration of the protein (µg ml-1
). Then the
concentration of protein in µg ml-1
was converted in per cent for different
entries.
3.3. STATISTICAL ANALYSIS OF DATA
Mean values were computed for the observations recorded in respect of 11
characters in each of the genotypes and were subjected to statistical analysis by
SAS package.
3.3.1 Analysis of Variance:
The mean values of data recorded for 11 characters in each entry of three
replications were first subjected to ANOVA as given below.
Table 3.2. Analysis of variance of RBD.
Source of
variation
Degree of
freedom
Sum of
squares
Mean sum of
squares F ratio
Replication (r-1) RSS Mr Mr/Me
Genotypes (g-1) GSS Mg Mg/Me
Error (r-1) (g-1) ESS Me -
Total (rg-1) TSS
Where,
r = Number of replications
t = Number of genotypes
Mr = Mean sum of squares due to replications

Mg = Mean sum of squares due to genotypes
Me = Mean sum of squares due to error.
3.3.2 Estimation of genetic parameters
Mean data of all characters is subjected to ANOVA and ANCOVA analysis to
get the estimates of mean sum of squares and mean sum of products and were
utilized for calculation of genetic parameters.
3.3.2.1 Phenotypic and genotypic variance:
The phenotypic and genotypic variances were estimated according the Lush
(1940).
Genotypic variance 2gσ
nsreplicaito ofNumber
error todue MSS - genotypes todue MSS
Phenotypic variance 2pσ = 2
eσσ2g
Where,
2gσ = Genotypic variance
2eσ = Error variance
3.3.2.2 Genotypic and phenotypic coefficient of variation:
Genotypic (GCV) and phenotypic (PCV) coefficient of variation was
calculated by the formulae given by Burton (1952).
GCV (%) = X
σgx 100
PCV (%) = X
σ px 100
Where,
g, p and X are genotypic standard deviation, phenotypic standard deviation
and general mean of the character, respectively.

Categorization of the range of variation was done as proposed by Siva
Subramanian and Madhava Menon (1973).
Less than 10% - Low
10 – 20 % - Moderate
More than 20% - High
3.3.2.3 Heritability (Broad sense) h2
(b):
Heritability in broad sense was estimated using the formula of Allard (1960).
Broad sense Heritability = p
2
g2
σ
σx 100
where,
2
g = Genotypic variance
2
p = Phenotypic variance
Heritability estimates were categorized as suggested by Johnson et al. (1955).
Less than 30% - Low
30 – 60 % - Moderate
More than 60% - High
3.3.2.4 Genetic advance:
Estimated as per the formula proposed by Lush (1949) and Johnson et al.
(1955).
GA = k p H
where,
GA = Genetic advance
p = Phenotypic standard deviation
H = Heritability (broad sense)
k = Selection differential at 5% selection intensity
Genetic advance as percent of mean (GA as percent mean)

Genetic advance as percent of mean was calculated as per the formula.
GA as percent of mean = X
GAx 100
where,
GA = Genetic advance
X = Grand mean of the character
The range of genetic advance as percent of mean was classified as suggested
by Johnson et al. (1955).
Less than 10% - Low
10 – 20 % - Moderate
More than 20% - High
3.3.3 Estimation of Heterosis:
Heterosis can be classified into three types on the basis of estimation.
3.3.3.1 Relative heterosis:
Heterosis was expressed as per cent increase or decrease of F1 over the mid
parental value.
Relative heterosis (%) = 100 x MP
MPF1
Where,
F1 = Mean of F1
Mp = Mean of mid parent
3.3.3.2 Heterobeltiosis:
Heterobeltiosis was expressed as per cent increase or decrease of F1 over the
better parent value.
Heterobeltiosis (%) = 100 x BP
BPF1

Where,
BP = Mean of better parent
3.3.3.3 Standard heterosis:
Standard heterosis was expressed as per cent increase or decrease observed by
F1 over the standard check variety.
Standard Heterosis (%) = 100 x SC
SCF1
Where,
SC = Mean of standard check
Test for significance of heterosis was conducted following the formula given
by Arunachalum (1976).
Relative heterosis = /5.1
F1
rS
Heterobeltiosis = /2
F1
rS
Standard heterosis = /2
SCF1
rS
Where,
EMS = Error mean squares
r = Number of replications
The calculated ‘t’ value was compared with table ‘t’ value at error degree of
freedom.
3.3.4 Combining Ability Analysis
Analysis of variance for combining ability in randomized block design,
including parents and hybrids was carried out as per the model given by Singh
and Chaudhary (1977).

Table 3.3. ANOVA structure for combining ability
Source of variation Degree of freedom Mean sum of squares
Replications (r-1)
Genotypes (g-1) Mg
Parents (p-1)
Parents vs. Hybrids 1
Hybrids (c-1)
Lines (l-1) Ml
Testers (t-1) Mt
Line x Testers (l-1) (t-1) Mlt
Error (r-1) (a-1) Me
Where;
r, g, c, l, and t are number of replications, genotypes, parents, hybrids, lines and
testers, respectively. Ml, Mt, Mlt, Me are the mean sum of squares of lines,
testers, lines x testers and error, respectively.
The mathematical model for combining ability analysis was given below
Yijk = µ+gi+gj+Sij+rk+eijk
Where;
Yijk = Any measurable character of the cross i x j
µ = Population mean effect
gi = gca effect of the female parent
gj = gca effect of the male parent
Sij = sca effect of the cross ij
rk= kth
replication effect
eijk = Environmental effect particular to (ijk)th
individual.

3.3.4.1 gca and sca effects: The individual effects are estimated as follows
Xi.. X…
gca effect of lines (gi) = --------- - ---------
rl rlt
Xj.. X…
gca effect of testers (gj) = ---------- - ---------
rl rlt
Xij Xj.. Xj.. X…
gca effect of hybrids = ---------- - ---------- - -------- + --------
r rt rl rlt
Where;
X.i. = Total of ith
line over‘t’ testers and ‘r’ replications
X.j. = Total of jth
tester over ‘l’ lines and ‘r’ replications
X… = total of all hybrids combinations over all replications
Xij. = Total of the hybrid between ith
line and jth
tester over ‘r’ replications.
t = Number of testers
l = Number of lines
r = Number of replications
3.3.4.2 Estimation of standard errors for combining ability effects: The
standard error pertaining to gca effects of lines and testers and sca effects of
different cross combinations were calculated as shown below.
SE for gca effects of lines (gi) = rt
EMS
SE for gca effects of testers (gj) =rl
EMS
SE for sca effects of hybrids (Sij) =r
EMS
SE (gi – gj) lines =rt
2EMS

SE (gi – gj) testers =rl
2EMS
SE (Sij – Sik) =r
2EMS
Cov HS ( line) =rt
ΜΜ 31
Cov. HS (testers) = rl
ΜΜ 31
Cov. HS (average) =
3
21 Μ2tl
Μ1tΜ1d
tl2ltr
1
Cov. FS =
3r
CovHStlr6rCovHS
3r
4Μ3Μ4Μ2Μ4Μ1Μ
2
gca = Cov HS =
Aσ
4
F1or
tlr
ΜΜΜΜ 2
2
3231
2
sca = Dσ2
F1or
r
MM 2
2
43
2 gca :
2 sca =
sca
gca2
2
σ
σ
3.3.5 Character association
Genotypic and phenotypic correlation coefficients were calculated using the
method given by Johnson et al. (1955).
3.3.5.1 Genotypic correlation coefficient (rg)
rg (xixj) =
igig
jig
xVxV
xxCov

Where,
rg (xixj) = Genotypic correlation between ‘ith
’ and ‘jth
’ characters
Vg (xi ) = Genotypic variance of ‘ith
’ character
Vg(xj) = Genotypic variance of ‘jth
’ character
Cov(g) (xixj ) = Genotypic covariance between ‘ith
’ and ‘jth
’ characters.
3.3.5.2 Phenotypic correlation coefficient (rp)
rp (xixj) =
ipip
jip
xVxV
xxCov
Where,
Vp(xi) = Phenotypic variance of ‘ith
’ character
Vp(xj) = Phenotypic variance of ‘jth
’ character
Cov (xixj) = Phenotypic covariance between ‘ith
’ and ‘jth
’ characters.
The significance of correlation coefficients was tested by comparing the
genotypic and phenotypic correlation coefficients with table value [Fisher and
Yates (1967)] at (n-2) degrees of freedom at 5% and 1% level where, ‘n’
denotes the number of treatments used in the calculations.
3.3.6 Path coefficient analysis
Path coefficient analysis was carried out by the procedure originally proposed
by Wright (1921) which was subsequently elaborated by Dewey and Lu (1959)
to estimate the direct and indirect effects of the individual characters on yield.
The following set of simultaneous equations were formulated and solved for
estimating various direct and indirect effects.
r1y = p1y + r12p2y + r13p3y + ………….. + r1ipiy
r2y = r21p1y + p2y + r23p3y + ………….. + r2ipiy
. . . . .
. . . . .
riy = ri1p1y + ri2p2y + ri3p3y + ……………. + piy

where,
r12 to ri-1 = Coefficient of correlation among causal factors.
p1y to piy = Direct effects of characters ‘1’ to i on character ‘y’.
The above equations were written in matrix forms as under:
A C B
r1y 1 r12 r13 …………. r1i p1y
r2y r21 1 r23 ..………… r2i p2y
r3y r31 r32 1 …………… r3i p3y
. = . . . . .
. . . . . .
. . . . . .
. . . . . .
riy ri1 ri2 ri3 ..………… 1 piy
Then B = [C]-1
A
where,
C11 C12 C13 .…………. C1i
C21 C22 C23 ..………… C2i
[C]-1
= . . . .
. . . .
. . . .
Ci1 Ci2 Ci3 ..………… Cii
Then, direct effects were calculated as follows:
P1y = yriCI
i
111
C1i r1y
P2y = yriCI
i
111
C2i r2y
Piy = yriCI
i
111
Cii riy
Besides the direct and indirect effects, the residual effect which measures the
contribution of the characters not considered in the causal scheme was
obtained as:

Residual effect (PRY) = 2
iyiy2y2y1y1y ]rp rp r[P-1
where,
PRY = Residual effect
Piy = Direct effect of ‘xi’ on ‘y’
riy = Correlation coefficient of ‘xi’ with ‘y’.
The scales for path coefficients as proposed by Lenka and Mishra (1973) are as
follows:
Value for Direct or Indirect effect Rate or Scale
0.00-0.09 Negligible
0.10-0.19 Low
0.20-0.29 Moderate
0.30-0.99 High
More than 1.00 Very high

Chapter – IV
Results& Discussion

Chapter - IV
RESULTS AND DISCUSSION
The results obtained on mean performance, genetic parameters,
heterosis, combining ability and character association for 11 characters viz.,
days to 50% flowering, days to 75% maturity, plant height, primary branches
per plant, secondary branches per plant, pods per plant, seeds per pod, 100-
seed weight, harvest index, seed protein, and seed yield per plant were
discussed here under.
4.1 ANALYSIS OF VARIANCE
Analysis of variance for Randomized Block Design with respect to 11
characters is presented in Table 4.1. The mean sum of squares for treatments
were found to be significant for all the traits, indicating the existence of
sufficient genetic variation among the genotypes studied, while the mean sum
of squares for replications were found to be non-significant for all the traits
except days to 50% flowering, secondary branches per plant and seeds per pod.
4.2 MEAN PERFORMANCE
The mean performance of the parents, standard check (Maruti) and
hybrids were presented in Tables 4.2 and 4.3, respectively. The results and
discussions were furnished character wise hereunder.
4.2.1 Yield Attributes
4.2.1.1 Days to 50% flowering: Among the lines ICPB-2078 (100.00 days)
and ICPB-2047 (122.33), among testers ICPL-20116 (118.67 days) and ICPL-
20108 (123.00 days) were early and late in flowering, respectively with a mean
of 117.70 days (Table 4.2). Among hybrids early flowering was observed in
ICPA-2078 x ICPL-87119 (110.33 days) while ICPA-2047 x ICPL-20108 &
ICPA-2047 x ICPL-20123 (121.33 days) and ICPA-2047 x ICPL-20116
(120.33 days) were very late (Table 4.3).

Table 4.1. Analysis of variance for yield and yield components in pigeonpea
S.
No. Characters
Mean sum of squares
Replication (df = 2) Treatments (df = 28) Error (df = 56)
1 Days to 50% flowering 10.25** 84.06** 1.63
2 Days to 75% maturity 0.65 83.92** 2.02
3 Plant height (cm) 4.00 696.25** 2.59
4 Primary branches per plant 1.70 11.66** 1.51
5 Secondary branches per plant 12.86* 201.34** 3.15
6 Number of pods per plant 5.58 55906.25** 14.30
7 Number of seeds per pod 0.07** 0.18** 0.01
8 100-seed weight (g) 0.03 2.06** 0.36
9 Harvest index (%) 0.35 312.72** 1.38
10 Seed protein (%) 0.91 1.58** 0.61
11 Seed yield per plant (g) 0.80 4890.24** 1.37
** Significant at 0.01; * Significant at 0.05

Table 4.2. Mean performance of lines, testers and standard check for seed yield and yield components in pigeonpea
Parents
Days 50%
to
flowering
Days
75% to
maturity
Plant
height
(cm)
Primary
branches
per plant
Secondary
branches
per plant
Number
of pods
per plant
Number
of seeds
per pod
100-seed
weight
(g)
Harvest
index
(%)
Seed
protein
(%)
Seed yield
per plant
(g)
LINES
ICPB2078 100.00 160.33 84.33 10.00 16.00 52.40 3.20 11.63 17.70 16.81 13.74
ICPB2043 109.67 166.67 126.67 10.67 21.67 173.87 3.47 9.77 31.13 17.62 57.57
ICPB2047 122.33 175.67 159.50 15.33 31.00 406.40 4.13 9.07 40.47 18.03 114.07
ICPB2048 121.00 181.00 145.33 14.67 24.67 351.67 3.50 10.13 37.97 18.26 107.55
ICPB2092 121.67 175.67 127.33 14.00 29.00 325.80 3.40 9.80 38.97 19.35 93.29
TESTERS
ICPL87119 122.67 183.33 137.50 13.00 15.67 572.53 3.60 10.27 42.57 17.35 179.57
ICPL20108 123.00 180.33 131.00 14.67 24.67 282.60 3.90 10.50 36.70 16.53 83.97
ICPL20116 118.67 174.67 128.67 10.67 16.00 351.40 3.63 9.73 44.77 17.23 89.40
ICPL20123 120.33 181.33 162.00 14.33 37.33 352.00 3.63 10.20 41.43 17.83 104.92
Mean of parents 117.70 175.44 133.59 13.04 24.00 318.74 3.61 10.12 36.86 17.67 93.79
Range (min) 100.00 160.33 84.33 10.00 15.67 52.40 3.20 9.07 17.70 16.53 13.74
Range (max) 123.00 183.33 162.00 15.33 37.33 572.53 4.13 11.63 44.77 19.35 179.57
Standard check
(Maruti) 111.00 168.33 134.67 14.67 13.33 261.40 3.80 10.53 33.83 20.87 70.18
S.Em 1.37 1.68 13.94 1.62 4.98 37.33 0.20 0.58 0.92 0.08 14.13
C.D. (0.05) 4.16 5.08 42.28 4.91 15.10 113.24 0.62 1.75 2.79 0.24 42.87
C.V.(%) 2.11 1.76 11.48 17.26 38.96 15.79 8.89 8.00 7.72 0.57 24.12

Table 4.3. Mean performance of 20 hybrids for seed yield and yield components in pigeonpea
Crosses
Days 50%
to
flowering
Days
75% to
maturity
Plant
height
(cm)
Primary
branche
s per
plant
Secondary
branches
per plant
Number
of pods
per
plant
Number
of seeds
per pod
100-
seed
weight
(g)
Harvest
index
(%)
Seed
protein
(%)
Seed yield
per plant (g)
ICPA 2078 x ICPL 87119 110.33 169.67 133.67 12.00 26.33 223.53 3.57 11.60 28.37 16.78 61.10
ICPA 2078 x ICPL 20108 111.33 171.33 134.17 11.00 25.33 158.73 3.90 12.20 36.90 16.50 53.91
ICPA 2078 x ICPL 20116 115.67 168.67 134.33 9.67 15.67 241.93 3.70 11.63 56.20 16.69 88.57
ICPA 2078 x ICPL 20123 112.33 175.33 140.00 9.67 23.67 192.67 3.40 11.93 25.70 17.77 51.37
ICPA 2043 x ICPL 87119 113.33 164.00 120.67 12.33 27.33 251.40 3.60 10.13 32.37 17.40 69.83
ICPA 2043 x ICPL 20108 113.67 171.67 125.53 13.00 25.33 352.27 3.83 10.77 42.57 18.28 104.28
ICPA 2043 x ICPL 20116 111.00 174.00 146.67 11.67 28.00 383.73 3.47 10.20 35.97 18.61 116.07
ICPA 2043 x ICPL 20123 113.33 169.67 125.33 12.67 29.33 252.67 3.80 9.87 30.93 16.69 68.12
ICPA 2047 x ICPL 87119 113.67 173.33 150.67 14.00 34.67 410.07 3.60 10.43 39.47 17.69 119.27
ICPA 2047 x ICPL 20108 121.33 178.67 144.33 15.67 37.00 294.27 3.90 10.00 66.37 16.62 143.57
ICPA 2047 X ICPL 20116 120.33 175.33 148.00 16.00 36.67 399.73 3.87 9.63 36.53 17.93 115.39
ICPA 2047 X ICPL 20123 121.33 175.00 152.63 15.67 27.33 335.67 4.10 10.63 36.30 16.91 92.57
ICPA 2048 x ICPL 87119 119.33 181.67 139.67 13.33 31.00 424.27 3.70 10.43 39.77 17.51 129.27
ICPA 2048 x ICPL 20108 116.67 176.33 128.17 13.67 28.00 252.07 3.83 10.50 31.37 17.01 74.92
ICPA 2048 X ICPL 20116 111.33 176.00 113.33 14.67 15.00 143.00 2.97 11.97 39.00 16.56 40.77
ICPA 2048 X ICPL 20123 116.67 173.33 136.93 16.33 47.33 337.33 3.67 10.07 33.27 18.13 93.10
ICPA 2092 x ICPL 87119 120.33 169.67 129.33 14.67 42.33 543.40 3.53 10.33 42.07 17.59 147.51
ICPA 2092 x ICPL 20108 118.67 176.00 148.00 15.00 37.00 712.07 3.80 10.17 64.73 17.20 200.86
ICPA 2092 X ICPL 20116 120.00 175.33 149.67 14.00 24.00 317.73 3.70 10.37 36.33 16.33 102.13
ICPA 2092 X ICPL 20123 119.33 177.00 134.67 12.00 21.67 197.27 3.80 12.07 29.13 17.70 61.06
Mean of hybrids 116.00 173.60 136.79 13.35 29.15 321.19 3.69 10.75 39.17 17.29 96.68
Range (Min) 110.33 164.00 113.33 9.67 15.00 143.00 2.97 9.63 25.70 16.33 40.77
Range (Max) 121.33 181.67 152.63 16.33 47.33 712.07 4.10 12.20 66.37 18.61 200.86
Standard check (Maruti) 111.00 168.33 134.67 14.67 13.33 261.40 3.80 10.53 33.83 20.87 70.18
S.Em 0.98 1.44 11.26 2.00 3.52 69.34 0.13 0.59 1.37 0.08 19.49
C.D (0.05) 2.84 4.18 32.63 5.81 10.19 200.84 0.38 1.71 3.97 0.24 56.44
C.V. (%) 1.52 1.58 8.92 19.97 24.11 18.37 5.62 8.58 10.99 0.55 21.31

4.2.1.2 Days to 75% maturity: The genotype, ICPB-2078 (160.33 days)
among lines and ICPL-20116 (174.67 days) among testers were early to mature
whereas the line ICPB-2048 (181.00 days) and the tester ICPL-87119 (183.33
days) were late to mature with a mean of 175.44 days (Table 4.2). Among
hybrids it ranged from 164.00 days (ICPA-2043 x ICPL-87119) to 181.67 days
(ICPA-2048 x ICPL-87119) with a mean of 173.60 days (Table 4.3).
4.2.1.3 Plant height (cm): The mean plant height for parents was 133.59 cm.
The line ICPB-2047 (159.50 cm) and the tester ICPL-20123 (162.00cm) were
the tallest, while the line ICPB-2078 (84.33 cm) and the tester ICPL-20116
(128.67 cm) were the shortest parents (Table 4.2). Among the hybrids ICPA-
2047 x ICPL-20123 (152.63 cm) was the tallest, whereas ICPL-2048 x ICPL-
20116 (113.33 cm) was the shortest with a mean plant height of 136.79 cm.
Out of 20 hybrids, ten hybrids were observed to have higher plant height than
the mean (Table 4.3).
4.2.1.4 Primary branches per plant: The line ICPB-2047 (15.33) and the
tester ICPL-20108 (14.67) recorded more primary branches with a mean of
13.04. The line ICPB-2078 (10.00) and the tester ICPL-20116 (10.67) had
lowest primary branches per plant among the parents (Table 4.2). Among the
hybrids, ICPA-2048 x ICPL-20123 (16.33) and ICPB-2078 x ICPL-20116
(9.67), ICPB-2078 x ICPL-20123 (9.67) showed more and less primary
branches per plant, respectively, with a cross mean of 13.35. Ten hybrids
surpassed the mean of F1 hybrids (Table 4.3).
4.2.1.5 Secondary branches per plant: The mean of the parents was 24.00.
Among the parents, the line ICPB-2047 (31.00) and the tester ICPL-20123
(37.33) showed more secondary branches per plant whereas the line ICPB-
2078 (16.00) and the tester ICPL-87119 (15.67) had lowest secondary branches
per plant (Table 4.2). Among the hybrids, ICPA-2048 x ICPL-20123 (47.33)
and ICPL-2048 x ICPL-20116 (15.00) showed highest and lowest values for
this trait with a cross mean of 29.15, seven hybrids surpassed mean value out
of 20 hybrids (Table 4.3).

4.2.1.6 Pods per plant: The genotype ICPB-2047 (406.40) among lines and
ICPL-87119 (572.53) among testers recorded more pods per plant, whereas the
line ICPB-2078 (52.40) and the tester ICPL-20108 (282.60) recorded less pod
number per plant (Table 4.2). Among hybrids it ranged from 143.00
(ICPL-2048 x ICPL-20116) to 712.07 (ICPA-2092 x ICPL-20108) with a cross
mean of 321.19. Nine hybrids recorded highest value than the mean (Table
4.3).
4.2.1.7 Seeds per pod: Among the lines ICPB-2047 (4.13) and ICPB-2078
(3.20), among the testers ICPL-20108 (3.90) and ICPL-87119 (3.60) showed
maximum and minimum seeds per pod, respectively with the parental mean of
3.61 (Table 4.2). Among the hybrids, ICPA-2047 x ICPL-20123 (4.10) showed
highest, whereas ICPL-2048 x ICPL-20116 (2.97) showed lowest values for
this trait. Eleven hybrids were showed higher values than hybrid mean (3.69)
(Table 4.3).
4.2.1.8 100-seed weight (g): Among the lines ICPB-2078 (11.63g) and ICPB-
2047 (9.07g), among the testers ICPL-20108 (10.50g) and ICPL-20116 (9.73g)
recorded maximum and minimum seed weight with a parental mean of 10.12
(Table 4.2). It was ranged from 9.63 (ICPA-2047 x ICPL-20116) to 12.20
(ICPA-2078 x ICPL-20108) among hybrids. Seven hybrids exceeded the mean
seed weight (10.75) (Table 4.3).
4.2.1.9 Harvest index (%): Line ICPB-2047 (40.47) and the tester ICPL-
20116 (44.77) recorded highest harvest index whereas the line ICPB-2078
(17.70) and the tester ICPL-20108 (36.70) had lowest harvest index with a
mean of 36.86 (Table 4.2). In hybrids, it ranged from 25.70 (ICPA-2078 x
ICPL-20123) to 66.37 (ICPA-2047 x ICPL-20108) with a mean of 39.17.
Seven hybrids showed high harvest index than hybrid mean (Table 4.3).
4.2.1.10 Seed yield per plant (g): The genotype ICPB-2047 (114.07) among
the lines and ICPL-87119 (179.57) among the testers showed highest seed
yield per plant. The line ICPB-2078 (13.74) and the tester ICPL-20108 (83.97)
had lowest seed yield among the parents with a mean of 93.79 (Table 4.2). In
hybrids, it ranged from 40.77 (ICPA-2048 x ICPL-20116) to 200.86 (ICPA-
2092 x ICPL-20108) with a mean of 96.68. Nine hybrids recorded highest
seed yield per plant over the F1 mean (Table 4.3).
4.2.2 Quality Attributes
4.2.2.1 Seed protein (%): The line ICPB-2092 (19.35) and the tester ICPL-
20123 (17.83) recorded superior protein percentage with a mean of 17.67. The
line ICPB-2078 (16.81) and the tester ICPL-20108 (16.53) had low seed
protein among the parents (Table 4.2). Seed protein in F1’s ranged from 16.33
(ICPA-2092 x ICPL-20116) to 18.61 (ICPA-2043 x ICPL-20116) with a mean
of 17.29 (Table 4.3).
Among the parents, the line ICPB-2047 was promising for seed yield
and other yield contributing characters and the testers ICPL-20123 was found
most desirable for yield and other yield contributing characters with high per
se performance. The lines ICPB-2078 and ICPB-2043 were promising for
earliness.
The hybrids ICPA-2092 x ICPL-20108 recorded high per se
performance for yield. Cross combinations involving the lines ICPA-2078 and
ICPA-2043 recorded high performance for earliness. Hence, these genotypes
were compared for combining ability, heterosis along with phenotypic per se
performance to identify the superior genotypes for further breeding
programmes to improve the yield.
4.3 GENETIC VARIABILITY, HERITABILITY AND GENETIC
ADVANCE
Improvement in any crop species depends upon the amount of variation
present in a given breeding material and its mode of utilization in the breeding
programmes. The measure of transmission of a character from parent to
offspring is termed as heritability. The consistency of performance of selected
material in succeeding generations depends upon the magnitude of heritable
variation present in relation to the observed variation. The estimates of

genotypic variation alone could not provide the necessary heritable variance
that is required for selection. Hence, information on heritability is a
prerequisite for planning a sound-breeding programme for selection. The
genetic advance is commonly predicted, as a product of heritability, phenotypic
standard deviation and selection differential. High estimates of heritability
accompanied by high genetic advance indicates the importance of additive
gene effects in governing the characters. High heritability accompanied by a
low genetic advance indicates the presence of non-additive (epistasis and
dominance) component. Therefore, the estimate of heritability and genetic gain
is important to have an idea about effectiveness of selection.
In the present study, phenotypic co-efficient of variation (PCV) and
genotypic co-efficient of variation (GCV), estimates of heritability (broad
sense) and genetic advance as per cent of mean for eleven characters in nine
parents and 20 hybrids were furnished in the Table 4.4. The estimates of PCV
and GCV for parents and hybrids were also presented in Fig. 4.1 and Fig. 4.2
respectively, whereas heritability and genetic advance as per cent of mean for
parents and hybrids are given in Fig. 4.3. The results and discussion were
presented on character wise hereunder.
4.3.1 Yield Attributes
4.3.1.1 Days to 50% flowering: Low Phenotypic co-efficient of variation
(6.69) and genotypic co-efficient of variation (6.59) in parents was noted for
the traits. Heritability estimate for this trait was high (97.07) with moderate
genetic advance (15.75) and genetic advance as per cent of mean was 13.38
(Table 4.4).
Low PCV and GCV estimates observed for this trait were recorded
among hybrids 3.25 and 3.42 respectively. Heritability estimate for this trait
was high (90.61) with a low genetic advance (7.40) and genetic advance as per
cent of mean (6.38) (Table 4.4).

Table 4.4. Range, mean, coefficient of variability, heritability and genetic advance for yield and yield components in parents and hybrids in
pigeonpea
Characters Range Mean GCV PCV
Heritability
(%)
Genetic
advance
Genetic
advance as %
of mean
Parents Hybrids Parents Hybrids Parents Hybrids Parents Hybrids Parents Hybrids Parents Hybrids Parents Hybrids
Days 50% to
flowering 100.00-123.00 110.33-121.33 117.70 116.00 6.59 3.25 6.69 3.42 97.07 90.61 15.75 7.40 13.38 6.38
Days to 75%
maturity 160.33-183.33 164.00-181.67 175.44 173.60 4.29 2.26 4.36 2.40 96.54 88.18 15.22 7.57 8.68 4.36
Plant height
(cm) 84.33-162.00 113.33-152.63 133.59 136.79 17.09 7.94 17.12 8.04 99.69 97.45 46.97 22.08 35.16 16.14
Primary
branches per
plant
10.00-15.33 9.67-16.33 13.04 13.35 14.81 13.84 17.44 16.65 72.13 69.07 3.38 3.16 25.91 23.70
Secondary
branches per
plant
15.67-37.33 15.00-47.33 24.00 29.15 31.29 27.65 31.75 28.47 97.08 94.35 15.24 16.13 63.50 55.33
Number of
pods per plant 52.40-572.53 143.00-712.07 318.74 321.19 45.55 42.44 45.55 42.46 99.99 99.89 299.07 280.64 93.83 87.37
Number of
seeds per pod 3.20-4.13 2.97-4.10 3.61 3.69 7.44 6.29 7.97 6.79 87.11 86.00 0.52 0.44 14.30 12.03
100-seed
weight (g) 9.07-11.63 9.63-12.20 10.12 10.75 6.31 6.82 8.05 9.13 61.40 55.85 1.03 1.13 10.19 10.50
Harvest index
(%) 17.70-44.77 25.70-66.37 36.86 39.17 22.14 28.33 22.25 28.54 99.05 98.59 16.73 22.70 45.40 57.95
Seed protein
(%) 16.53-19.35 16.33-18.61 17.67 17.29 4.07 2.81 5.88 5.29 47.89 28.31 1.03 0.53 5.80 3.08
Seed yield per
plant (g) 13.74-179.57 40.77-200.86 93.79 96.68 47.56 40.87 54.08 43.19 99.93 99.91 91.85 81.36 97.93 84.15

Fig. 4.1. Phenotypic co-efficient of variation for 11 characters in parents and
hybrids of pigeonpea
Fig. 4.2. Genotypic co-efficient of variation for 11 characters in parents and
hybrids of pigeonpea
DF= Days to 50% flowering SB= Secondary branches per plant HI= Harvest index
DM= Days to 75% maturity PP= Pods per plant SN= Seed protein
PH= Plant height SP= Seeds per pod SY= Seed yield per plant
PB= Primary branches per plant SW= 100-seed weight
0
10
20
30
40
50
60
DF DM PH PB SB PP SP SW HI SN SY
Ph
enoty
pic
Coef
fici
ent
of
Vari
ati
on
Characters
Parents Hybrids
0
5
10
15
20
25
30
35
40
45
50
DF DM PH PB SB PP SP SW HI SN SY
Gen
oty
pic
Coef
fici
ent
of
Vari
ati
on
Characters

Fig. 4.3. Heritability and genetic advance as per cent of mean for 11 characters in parents and hybrids of pigeonpea
DF= Days to 50% flowering SB= Secondary branches per plant PB= Primary branches per plant SW= 100-seed weight SN= Seed protein
DM= Days to 75% maturity PP= Pods per plant SP= Seeds per pod HI= Harvest index SY= Seed yield per plant
PH= Plant height
0
20
40
60
80
100
120
DF DM PH PB SB PP SP SW HI SN SY
Her
ita
bil
ity
an
d G
AM
(%
)
Characters
Parents Heritability Parents Genetic Advance as per cent of mean
Hybrids Heritability Hybrids Genetic Advance as per cent of Mean

This trait exhibited low PCV and GCV in parents and hybrids indicating that
the selection can be done at later generations. This is in confirmity with Patil et
al. (1989), Kapre and Nerker (1992), Aher et al. (1996) and Anantharaju and
Muthaiah (2008). High heritability coupled with moderate genetic advance as
per cent of mean in parents for this trait can be improved by simple selection
methods. High heritability coupled with low genetic advance as per cent of
mean in hybrids indicating the predominance of non-additive gene action.
Similar results were reported by Patel and Acharya (2011) and Kumar et al.
(2014).
4.3.1.2 Days to 75% maturity: Low PCV and GCV estimates of 4.29 and
4.36 in parents were observed for this trait. Heritability estimates for this trait
was high (96.54) with moderate genetic advance (15.22) and low genetic
advance as per cent of mean (8.68) (Table 4.4).
In hybrids, the PCV (2.40) and GCV (2.26) estimates were low. High
heritability (88.18) estimates were recorded for this trait with a low genetic
advance (7.57) and genetic advance as per cent of mean (4.36) (Table 4.4).
This trait exhibited low PCV and GCV both in parents and hybrids
indicating that the selection can be done in later generations. This is in
agreement with the results of Anantharaju and Muthaiah (2008), Aher et al.
(1996), Patil et al. (1989) and Khapre and Nerker (1992). High heritability in
parents and hybrids indicates less influence of environment on this trait. High
heritability coupled with low genetic advance as per cent of mean indicate that
it is controlled by non-additive gene action. Similar results were also reported
by Aher et al. (1996) and Gohil (2006).
4.3.1.3 Plant height: In parents, plant height recorded moderate PCV (17.12)
and GCV (17.09). High heritability (99.69), high genetic advance (46.97) and
genetic advance as per cent of mean (35.16) were observed for this trait
(Table 4.4).

Low PCV (8.04) and GCV (7.94) for this trait was observed in hybrids,
while heritability estimates were high (97.45) with high genetic advance
(22.08) and moderate genetic advance as per cent of mean (16.14) (Table 4.4).
Moderate PCV and GCV in parents and low PCV and GCV in hybrids
indicates the selection may be effective in later generations for this trait. High
heritability with high genetic advance as per cent of mean indicates importance
of additive effects for this trait and is confirmed with the results of Vanisree
and Sreedhar (2014), Kumar et al. (2014), Rnagare et al. (2013), and Jaggal et
al. (2012).
4.3.1.4 Primary branches per plant: Moderate PCV (17.44) and GCV
(14.81) was recorded in parents for this trait. Heritability estimate was high
(72.13) with low genetic advance (3.38) and high genetic advance as per cent
of mean (25.91) (Table 4.4).
This trait recorded moderate PCV (16.65) and GCV (13.84) values in
hybrids. The heritability estimate (69.07) was high with a low genetic advance
(3.16) and high genetic advance as per cent of mean (23.70) (Table 4.4).
This trait exhibited moderate variability among parents and hybrids
indicating its amenability for selection in early generation. High heritability
coupled with high genetic advance as per cent of mean was also reported for
parents and hybrids by Sreelakhmi et al. (2011), Kumar et al. (2014), Lakhote
et al. (2015), Jogendra Singh et al. (2008) and Bhadru (2010).
4.3.1.5 Secondary branches per plant: This trait recorded high PCV (31.75)
and GCV (31.29) in parents. High heritability estimate (97.08) was observed
with moderate genetic advance (15.24) and high genetic advance as per cent of
mean (63.50) (Table 4.4).
This trait recorded high PCV (28.47) and GCV (27.65) values in
hybrids. High heritability (94.35) with moderate genetic advance (16.13) and
high genetic advance as per cent of mean (55.33) was recorded for this trait in
hybrids (Table 4.4).

This trait exhibited high PCV and GCV both in parents and hybrids
indicating existence of high variability for this character. This is in agreement
with the results of Pandey et al. (2015), Lakhote et al. (2015), and Prasad et al.
(2013). High heritability with high genetic advance as per cent of mean was
observed in parents and hybrids indicating that the selection is effective
because of additive gene action for this trait. These results are in confirmity
with Aajay et al. (2014), Kumar et al. (2014), and Pandey et al. (2015).
4.3.1.6 Pods per plant: High PCV (45.55) and GCV (45.55) was recorded for
this trait in parents. High heritability (99.99) estimates recorded with a high
genetic advance (299.07) and genetic advance as per cent of mean (93.83).
Hybrids recorded high PCV (42.46) and GCV (42.44). High heritability
(99.89) was recorded with high genetic advance (280.64) and genetic advance
as per cent of mean (87.37) (Table 4.4).
This trait showed high variability both in parents and hybrids. Hence
this trait can be improved in early generations. High heritability coupled with
high genetic advance as per cent of mean was recorded in parents and hybrids
suggests the preponderance of additive gene action. This is in agreement with
the results Vanisree and Sreedhar (2014), Saroj et al. (2013), Patel and
Acharya (2011) and Nagy et al. (2013).
4.3.1.7 Seeds per pod: Low PCV (7.97) and GCV (7.44) and high heritability
(87.11) estimates were recorded in parents with low genetic advance (0.52) and
moderate genetic advance as per cent of mean (14.30) (Table 4.4).
In hybrids also low PCV (6.79) and GCV (6.29) was recorded. High
heritability (86.00) coupled with low genetic advance (0.44) and moderate
genetic advance as per cent of mean (12.03) was recorded (Table 4.4).
In this present study low variability observed both in parents and
hybrids. Low variability for this trait was also reported by Jagshoran (1985),
Sidhu et al. (1985), Natarajan et al. (1990), Kapre et al. (1993) and Aher et al.
(1996). High heritability along with moderate genetic advance as per cent of

mean indicates that this trait can be improved by simple selection methods.
These results are in conformity with the findings of Pandey et al. (2015),
Kingshlin and Subbaraman (1999) and Magar (2003).
4.3.1.8 100-seed weight (g): In parents, low PCV (8.05) and GCV (6.31), high
heritability (61.40) low genetic advance (1.03) and moderate genetic advance
as per cent of mean (10.19) was recorded (Table 4.4).
In hybrids low variation recorded in terms of PCV (9.13) and GCV
(6.82) was observed. Moderate heritability (55.85), with low genetic advance
(1.13) and moderate genetic advance as per cent of mean (10.50) (Table 4.4).
This trait exhibited low PCV and GCV both in parents and hybrids
indicating that the selection can be done in later generations. High heritability
coupled with moderate genetic advance as per cent of mean was noticed,
indicating that this trait is governed by additive and non-additive gene action.
This is in confirmity with the results of Bhongale and Raut (1987), Patil et al.
(1989), Basavarajaiah et al. (1999), Anantharaju and Muthaiah (2008) and
Bhadru (2010).
4.3.1.9 Harvest index: High PCV (22.25) and GCV (22.14) was recorded in
parents for this trait. High heritability (99.05), moderate genetic advance
(16.73) and high genetic advance as per cent of mean (45.40) were also
recorded (Table 4.4).
In hybrids high PCV (28.54) and GCV (28.33) values were recorded.
High estimates of heritability (98.59) coupled with high genetic advance
(22.70) and high genetic advance as per cent of mean (57.95) were recorded
for this trait (Table 4.4).
Harvest index exhibited high variability both in parents and hybrids
indicating the availability of variability for selection of this trait in early
generations. High variability for harvest index was also reported earlier by
Pansuriya et al. (1998), Prasad et al. (2013), Jaggal et al. (2012) and Khapre et
al. (1993). High heritability and high genetic advance as per cent of mean was

observed in parents and hybrids, indicating this trait is controlled by additive
gene action. This is in confirmity with the results of Rangare et al. (2013),
Jaggal et al. (2012) and Gohil (2006).
4.3.1.10 Seed yield per plant: In parents, high variability was recorded PCV
(54.08) and GCV (47.56). Higher estimates of heritability (99.93), genetic
advance (91.85) and genetic advance as per cent of mean (97.93) were
observed (Table 4.4).
In case of hybrids higher estimates of PCV (43.19) and GCV (40.87)
were recorded. High estimate of heritability (99.91) was registered along with
high genetic advance (81.36) and genetic advance as per cent of mean (84.15)
(Table 4.4).
Seed yield exhibited higher variability in parents and hybrids, indicating
that selection can be recorded in early generations to improve this trait. High
heritability coupled with high genetic advance as per cent of mean recorded for
seed yield in the present study indicates that the trait is controlled by additive
gene action and thus selection is effective. These results are in conformity of
the findings of Pandey et al. (2015), Vanisree and Sreedhar (2014), Nagy et al.
(2013) and Patel and Acharya (2011).
4.3.2 Quality Attributes
4.3.2.1 Seed protein: Low variability in terms of PCV (5.88) and GCV (4.07)
was observed in parents. Moderate heritability (47.89) and also low genetic
advance (1.03) and genetic advance as per cent of mean (5.80) were also
observed for this trait (Table 4.4).
In case of hybrids a very low PCV (5.29) and GCV (2.81) values were
recorded. Low heritability (28.31) with a very low genetic advance (0.53) and
genetic advance as per cent of mean (3.08) were also observed for this trait
(Table 4.4).

A Very low variability in parents and hybrids noticed for seed protein,
indicates a limited scope of selection for this character. This is in conformity
with the findings of Gohil (2006). Moderate heritability coupled with low
genetic advance as per cent of mean in parents and low heritability coupled
with low genetic advance as per cent of mean in hybrids, indicates that this
trait is controlled by non-additive gene action. This is supported by the
findings of Aher et al. (1996).
From the present study, it can be concluded that simple selection may be
effective for secondary branches per plant, pods per plant, harvest index and
seed yield per plant as these characters are under the control of additive gene
action as evidenced by higher estimates of genetic parameters.
4.4 HETEROSIS
Estimation of the extent of heterosis in diverse cross combinations
would always be useful in choosing the best performing hybrids for
commercial exploitation. In general, the extent of heterosis has often been
estimated over mid or better parent with the objective of studying the nature of
gene action involved in the parental combinations. However, heterosis
recorded over mid or better parent has little utility if parents have relatively
poor per se performance. For commercial exploitation, the magnitude of
heterosis should be at least 20 to 30% higher than the standard variety. Hence,
the heterosis over the standard parent was estimated and is termed as standard
heterosis.
In present investigation, estimates of heterosis for 20 hybrids over mid
parent, better parent and standard variety was presented in Table 4.5 and the
relative merit of superior hybrids is discussed here under.
4.4.1 Yield Attributes
4.4.1.1 Days to 50% flowering: Heterosis for this trait ranged from -7.21% to
5.79% (ICPA-2078 x ICPL-20116) and -10.05% to -0.82% (ICPA-2047 x
ICPL-20123) over mid parent and better parent, respectively, while for

Table 4.5. Realized heterosis over mid parent (MP), better parent (BP) and standard check (SC) for yield and yield components in pigenpea
Crosses Days 50% to flowering Days to 75% maturity Plant height (cm)
MP BP SC MP BP SC MP BP SC
ICPA 2078 x ICPL 87119 -0.9 -10.05** -0.6 -1.26* -7.45** 0.79 20.51** -2.79** -0.74
ICPA 2078 x ICPL 20108 -0.15 -9.49** 0.3 0.59 -4.99** 1.78** 24.61** 2.42* -0.37
ICPA 2078 x ICPL 20116 5.79** -2.53** 4.2** 0.7 -3.44** 0.2 26.13** 4.40** -0.25
ICPA 2078 x ICPL 20123 1.97** -6.65** 1.2 2.63** -3.31** 4.16** 13.67** -13.58** 3.96**
ICPA 2043 x ICPL 87119 -2.44** -7.61** 2.1* -6.29** -10.55** -2.57** -8.64** -12.24** -10.4**
ICPA 2043 x ICPL 20108 -2.29** -7.59** 2.4* -1.06* -4.81** 1.98** -2.56** -4.17** -6.78**
ICPA 2043 x ICPL 20116 -2.77** -6.46** 0 1.95** -0.38 3.37** 14.88** 13.99** 8.91**
ICPA 2043 x ICPL 20123 -1.45* -5.82** 2.1* -2.49** -6.43** 0.79 -13.16** -22.63** -6.93**
ICPA 2047 x ICPL 87119 -7.21** -7.34** 2.4* -3.44** -5.45** 2.97** 1.46* -5.54** 11.88**
ICPA 2047 x ICPL 20108 -1.09 -1.36 9.31** 0.37 -0.92 6.14** -0.63 -9.51** 7.18**
ICPA 2047 X ICPL 20116 -0.14 -1.63* 8.41** 0.1 -0.19 4.16** 2.72** -7.21** 9.9**
ICPA 2047 X ICPL 20123 0 -0.82 9.31** -1.96** -3.49** 3.96** -5.05** -5.78** 13.34**
ICPA 2048 x ICPL 87119 -2.05** -2.72** 7.51** -0.27 -0.91 7.92** -1.24 -3.90** 3.71**
ICPA 2048 x ICPL 20108 -4.37** -5.15** 5.11** -2.40** -2.58** 4.75** -7.24** -11.81** -4.83**
ICPA 2048 X ICPL 20116 -7.09** -7.99** 0.3 -1.03* -2.76** 4.55** -17.27** -22.02** -15.84**
ICPA 2048 X ICPL 20123 -3.31** -3.58** 5.11** -4.32** -4.41** 2.97** -10.89** -15.47** 1.68
ICPA 2092 x ICPL 87119 -1.50* -1.90** 8.41** -5.48** -7.45** 0.79 -2.33** -5.94** -3.96**
ICPA 2092 x ICPL 20108 -3.00** -3.52** 6.91** -1.12* -2.40** 4.55** 14.58** 12.98** 9.9**
ICPA 2092 X ICPL 20116 -0.14 -1.37 8.11** 0.1 -0.19 4.16** 16.93** 16.32** 11.14**
ICPA 2092 X ICPL 20123 -1.38* -1.92** 7.51** -0.84 -2.39** 5.15** -6.91** -16.87** 0
Cont....

Crosses Primary branches per plant Secondary branches per plant Number of pods per plant
MP BP SC MP BP SC MP BP SC
ICPA 2078 x ICPL 87119 4.35 -7.69 -18.18** 66.32** 64.58** 97.5** -28.46** -60.96** -14.49**
ICPA 2078 x ICPL 20108 -10.81 -25.00** -25** 24.59** 2.7 90** -5.23** -43.83** -39.28**
ICPA 2078 x ICPL 20116 -6.45 -9.38 -34.09** -2.08 -2.08 17.5 19.83** -31.15** -7.45**
ICPA 2078 x ICPL 20123 -20.55** -32.56** -34.09** -11.25* -36.61** 77.5** -4.71** -45.27** -26.29**
ICPA 2043 x ICPL 87119 4.23 -5.13 -15.91* 46.43** 26.15** 105** -32.64** -56.09** -3.83**
ICPA 2043 x ICPL 20108 2.63 -11.36 -11.36 9.35 2.7 90** 54.34** 24.65** 34.76**
ICPA 2043 x ICPL 20116 9.38 9.38 -20.45** 48.67** 29.23** 110** 46.11** 9.20** 46.8**
ICPA 2043 x ICPL 20123 1.33 -11.63 -13.64* -0.56 -21.43** 120** -3.90** -28.22** -3.34**
ICPA 2047 x ICPL 87119 -1.18 -8.7 -4.55 48.57** 11.83** 160** -16.22** -28.38** 56.87**
ICPA 2047 x ICPL 20108 4.44 2.17 6.82 32.93** 19.35** 177.5** -14.58** -27.59** 12.57**
ICPA 2047 X ICPL 20116 23.08** 4.35 9.09* 56.03** 18.28** 175** 5.50** -1.64* 52.92**
ICPA 2047 X ICPL 20123 5.62 2.17 6.82** -20.00** -26.79** 105** -11.48** -17.40** 28.41**
ICPA 2048 x ICPL 87119 -3.61 -9.09 -9.09 53.72** 25.68** 132.5** -8.19** -25.90** 62.31**
ICPA 2048 x ICPL 20108 -6.82 -6.82 -6.82 13.51** 13.51* 110** -20.52** -28.32** -3.57**
ICPA 2048 X ICPL 20116 15.79** 0.00 0.00 -26.23** -39.19** 12.5 -59.32** -59.34** -45.29**
ICPA 2048 X ICPL 20123 12.64* 11.36 11.36** 52.69** 26.79** 255** -4.12** -4.17** 29.05**
ICPA 2092 x ICPL 87119 8.64 4.76 0.00 89.55** 45.98** 217.5** 20.98** -5.09** 107.88**
ICPA 2092 x ICPL 20108 4.65 2.27 2.27 37.89** 27.59** 177.5** 134.08** 118.56** 172.41**
ICPA 2092 X ICPL 20116 13.51* 0.00 -4.55 6.67 -17.24** 80** -6.16** -9.58** 21.55**
ICPA 2092 X ICPL 20123 -15.29** -16.28** -18.18** -34.67** -41.96** 62.5** -41.79** -43.96** -24.53**
Cont....

Crosses Number of seeds per pod 100-seed weight (g) Harvest index (%)
MP BP SC MP BP SC MP BP SC
ICPA 2078 x ICPL 87119 4.90** -0.93 -6.14** 5.94 -0.29 10.13* -5.86* -33.36** -16.16**
ICPA 2078 x ICPL 20108 9.86** 0 2.63** 10.24** 4.87 15.82** 35.66** 0.54 9.06**
ICPA 2078 x ICPL 20116 8.29** 1.83 -2.63 8.89* 0.00 10.44* 79.94** 25.54** 66.11**
ICPA 2078 x ICPL 20123 -0.49 -6.42** -10.53** 9.31* 2.58 13.29** -13.08** -37.97** -24.04**
ICPA 2043 x ICPL 87119 1.89 0.00 -5.26* 1.16 -1.3 -3.8 -12.17** -23.96** -4.33
ICPA 2043 x ICPL 20108 4.07** -1.71 0.88 6.25 2.54 2.22 25.50** 15.99** 25.81**
ICPA 2043 x ICPL 20116 -2.35 -4.59* -8.77** 4.62 4.44 -3.16 -5.23* -19.66** 6.31*
ICPA 2043 x ICPL 20123 7.04** 4.59* 0.00 -1.17 -3.27 -6.33 -14.75** -25.34** -8.57**
ICPA 2047 x ICPL 87119 -6.90** -12.90** -5.26* 7.93 1.62 -0.95 -4.94* -7.28** 16.65**
ICPA 2047 x ICPL 20108 -2.90* -5.65** 2.63** 2.21 -4.76 -5.06 72.01** 64.00** 96.16**
ICPA 2047 X ICPL 20116 -0.43 -6.45** 1.75 2.48 -1.03 -8.54 -14.27** -18.39** 7.98**
ICPA 2047 X ICPL 20123 5.58** -0.81 7.89** 10.38* 4.25 0.95 -11.36** -12.39** 7.29**
ICPA 2048 x ICPL 87119 4.23** 2.78 -2.63 2.29 1.62 -0.95 -1.24 -6.58** 17.54**
ICPA 2048 x ICPL 20108 3.60* -1.71 0.88 1.78 0.00 -0.32 -15.98** -17.38** -7.29**
ICPA 2048 X ICPL 20116 -16.82** -18.35** -21.93** 20.47** 18.09** 13.61** -5.72** -12.88** 15.27**
ICPA 2048 X ICPL 20123 2.8 0.92 -3.51 -0.98 -1.31 -4.43 -16.20** -19.71** -1.67
ICPA 2092 x ICPL 87119 0.95 -1.85 -7.02** 2.99 0.65 -1.9 3.19 -1.17 24.33**
ICPA 2092 x ICPL 20108 4.11** -2.56 0.00 0.16 -3.17 -3.48 71.10** 66.12** 91.33**
ICPA 2092 X ICPL 20116 5.21** 1.83 -2.63 6.14 5.78 -1.58 -13.22** -18.84** 7.39**
ICPA 2092 X ICPL 20123 8.06** 4.59* 0.00 20.67** 18.30** 14.56** -27.53** -29.69** -13.89**
Cont....

Crosses Seed protein (%) Seed yield per plant (g)
MP BP SC MP BP SC
ICPA 2078 x ICPL 87119 -1.73 -3.27 -19.57** -36.79** -65.97** -12.94**
ICPA 2078 x ICPL 20108 -1.02 -1.82 -20.93** 10.34** -35.80** -23.19**
ICPA 2078 x ICPL 20116 -1.94 -3.15 -20.02** 71.74** -0.93 26.2**
ICPA 2078 x ICPL 20123 2.59 -0.36 -14.86** -13.42** -51.04** -26.81**
ICPA 2043 x ICPL 87119 -0.49 -1.25 -16.61** -41.10** -61.11** -0.49
ICPA 2043 x ICPL 20108 7.05* 3.75 12.4** 47.36** 24.19** 48.59**
ICPA 2043 x ICPL 20116 6.81* 5.64 10.8** 57.96** 29.84** 65.39**
ICPA 2043 x ICPL 20123 -5.82* -6.38* -20** -16.15** -35.07** -2.94*
ICPA 2047 x ICPL 87119 0.01 -1.87 -15.22** -18.77** -33.58** 69.94**
ICPA 2047 x ICPL 20108 -3.84 -7.82* -20.37** 44.99** 25.85** 104.57**
ICPA 2047 X ICPL 20116 1.68 -0.55 -14.09** 13.42** 1.15 64.42**
ICPA 2047 X ICPL 20123 -5.70* -6.21* -18.98** -15.46** -18.85** 31.9**
ICPA 2048 x ICPL 87119 -1.65 -4.09 -16.09** -9.95** -28.01** 84.2**
ICPA 2048 x ICPL 20108 -2.21 -6.83* -18.48** -21.76** -30.34** 6.75**
ICPA 2048 X ICPL 20116 -6.66* -9.28** -20.62** -58.60** -62.10** -41.91**
ICPA 2048 X ICPL 20123 0.5 -0.68 13.1** -12.37** -13.44** 32.66**
ICPA 2092 x ICPL 87119 -4.11 -9.06** -15.69** 8.12** -17.86** 110.18**
ICPA 2092 x ICPL 20108 -4.14 -11.11** -17.59** 126.64** 115.31** 186.21**
ICPA 2092 X ICPL 20116 -10.73** -15.61** -21.76** 11.81** 9.48** 45.53**
ICPA 2092 X ICPL 20123 -4.8 -8.53** -15.19** -38.39** -41.80** -13**
** Significant at 1% level
* Significant at 5% level

standard heterosis it ranged from -0.6% (ICPA-2078 x ICPL-87119) to 9.31%
(ICPA-2047 x ICPL-20123 & ICPA-2047 x ICPL-20108). The cross ICPA-
2047 x ICPL-87119 recorded maximum negative significant heterosis over mid
parent (-7.21%) and ICPA-2078 x ICPL-87119 for better parent (-10.05%),
while the cross ICPA-2078 x ICPL-87119 recorded negative non-significant
standard heterosis (-0.6%) (Table 4.5).
Heterosis for mid parent was negative and highly significant in 12
hybrids, heterobeltiosis in 17 hybrids and negative non-significant standard
heterosis was observed in one cross only. The hybrids ICPA-2078 x ICPL-
87119 (L x H), ICPA-2078 x ICPL-20108 (L x H), ICPA-2048 x ICPL-20116
(H x H) and ICPA-2043 x ICPL-87119 (L x H) exhibited desirable
heterobeltiosis for earliness. The per se performance and heterosis were in
same direction. These results are supported by Manivel et al. (1999) and Dheva
et al. (2008).
4.4.1.2 Days to 75% maturity: The cross ICPA-2043 x ICPL-87119 recorded
maximum negative significant relative heterosis (-6.29%), heterobeltiosis (-
10.55%) and significant standard heterosis (-2.57%). Heterosis over mid parent
ranged from -6.29% (ICPA-2043 x ICPL-87119) to 2.63% (ICPA-2078 x
ICPL-20123), whereas over better parent, it ranged from -10.55% (ICPA-2043
x ICPL-87119) to -0.19% (ICPA-2047 x ICPL-20116, ICPA-2048 x ICPL-
87119 and ICPA-2092 x ICPL-20116) and standard heterosis from -2.57%
(ICPA-2043 x ICPL-87119) to 7.92% (ICPA-2048 x ICPL-87119) (Table 4.5).
Heterosis over mid parent was negative and significant in 11 hybrids,
heterobeltiosis in 15 hybrids and standard heterosis in one cross ICPA-2043 x
ICPL-87119 with desirable per se performance. The significant negative
heterosis for this trait is advantageous in getting early maturing hybrids.
Salanki et al. (2008) reported that most of the promising hybrids shown
significant negative heterosis for days to 75% maturity suggesting that high
yield in hybrids can be achieved along with early maturity. Similar results were
documented by Aher et al. (2006), Bhanu et al. (2007), Dheva et al. (2008a),
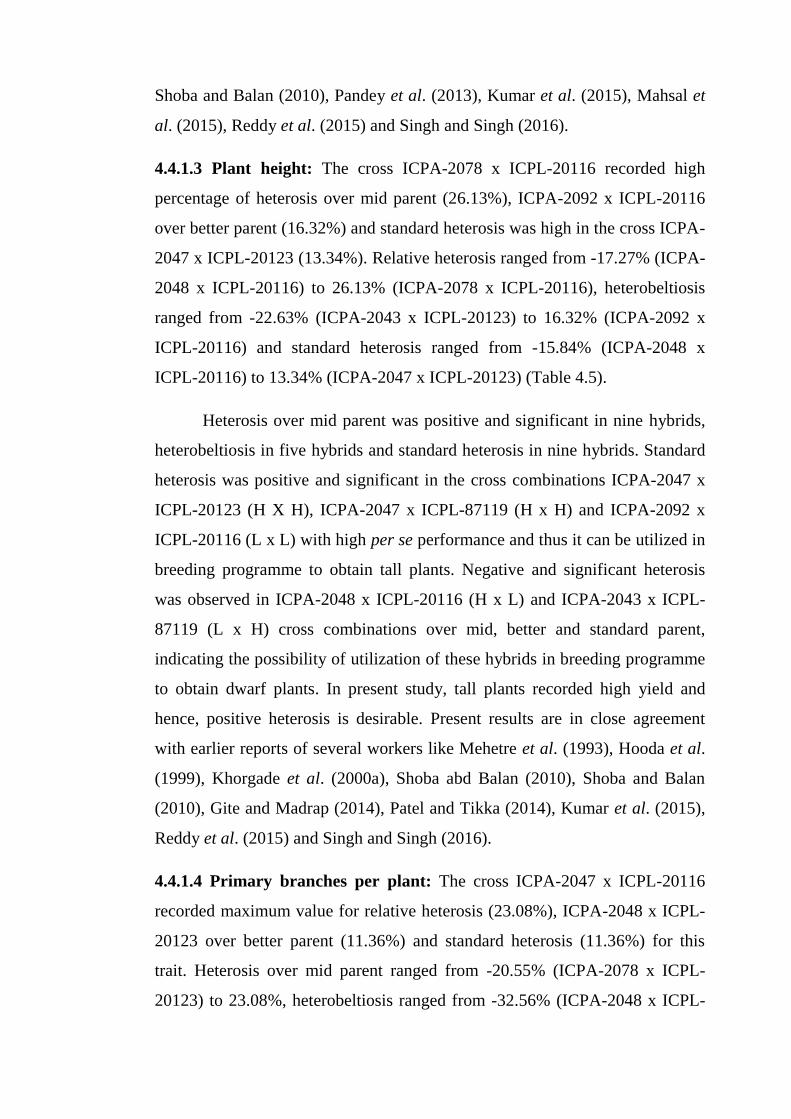
Shoba and Balan (2010), Pandey et al. (2013), Kumar et al. (2015), Mahsal et
al. (2015), Reddy et al. (2015) and Singh and Singh (2016).
4.4.1.3 Plant height: The cross ICPA-2078 x ICPL-20116 recorded high
percentage of heterosis over mid parent (26.13%), ICPA-2092 x ICPL-20116
over better parent (16.32%) and standard heterosis was high in the cross ICPA-
2047 x ICPL-20123 (13.34%). Relative heterosis ranged from -17.27% (ICPA-
2048 x ICPL-20116) to 26.13% (ICPA-2078 x ICPL-20116), heterobeltiosis
ranged from -22.63% (ICPA-2043 x ICPL-20123) to 16.32% (ICPA-2092 x
ICPL-20116) and standard heterosis ranged from -15.84% (ICPA-2048 x
ICPL-20116) to 13.34% (ICPA-2047 x ICPL-20123) (Table 4.5).
Heterosis over mid parent was positive and significant in nine hybrids,
heterobeltiosis in five hybrids and standard heterosis in nine hybrids. Standard
heterosis was positive and significant in the cross combinations ICPA-2047 x
ICPL-20123 (H X H), ICPA-2047 x ICPL-87119 (H x H) and ICPA-2092 x
ICPL-20116 (L x L) with high per se performance and thus it can be utilized in
breeding programme to obtain tall plants. Negative and significant heterosis
was observed in ICPA-2048 x ICPL-20116 (H x L) and ICPA-2043 x ICPL-
87119 (L x H) cross combinations over mid, better and standard parent,
indicating the possibility of utilization of these hybrids in breeding programme
to obtain dwarf plants. In present study, tall plants recorded high yield and
hence, positive heterosis is desirable. Present results are in close agreement
with earlier reports of several workers like Mehetre et al. (1993), Hooda et al.
(1999), Khorgade et al. (2000a), Shoba abd Balan (2010), Shoba and Balan
(2010), Gite and Madrap (2014), Patel and Tikka (2014), Kumar et al. (2015),
Reddy et al. (2015) and Singh and Singh (2016).
4.4.1.4 Primary branches per plant: The cross ICPA-2047 x ICPL-20116
recorded maximum value for relative heterosis (23.08%), ICPA-2048 x ICPL-
20123 over better parent (11.36%) and standard heterosis (11.36%) for this
trait. Heterosis over mid parent ranged from -20.55% (ICPA-2078 x ICPL-
20123) to 23.08%, heterobeltiosis ranged from -32.56% (ICPA-2048 x ICPL-

20123) to 11.36% and standard heterosis ranged from -34.09% (ICPA-2048 x
ICPL-20123) to 11.36% (Table 4.5).
Four hybrids recorded positive significant heterosis over mid parent,
positive and non-significant heterobeltiosis was observed in seven hybrids and
positive significant standard heterosis was observed in three hybrids. The
hybrids viz., ICPA-2048 x ICPL-20123 (H x H), ICPA-2047 x ICPL-20116 (H
x L) and ICPA-2047 x ICPL-20123 (H x H) exhibited high standard heterosis
in desirable direction along with high per se performance. Similar results were
reported by Chaudhary et al. (1980), Narladkar and Khapre (1996), Hooda et
al. (1999), Khorgade et al. (2000a), Pandey and Singh (2002), Sarode et al.
(2009), Singh and Singh (2016), Patel and Tikka (2014), Gite and Madrap
(2014). Pandey (1999), Shoba and Balan (2010) and Kumar et al. (2015)
reported significant positive standard heterosis for this trait.
4.4.1.5 Secondary branches per plant: The cross ICPA-2092 x ICPL-87119
recorded high percentage of heterosis over mid parent (89.55%).
Heterobeltiosis in ICPA-2078 x ICPL-87119 (64.58%) and standard heterosis
in ICPA-2048 x ICPL-20123 (255.0%) were recorded for this trait. Relative
heterosis ranged from -34.67% (ICPL-2092 x ICPL-20123) to 89.55%,
heterobeltiosis ranged from -41.96% (ICPL-2092 x ICPL-20123) to 64.58%
and standard heterosis ranged from 62.5% (ICPL-2092 x ICPL-20123) to
255.0% (Table 4.5).
Twelve hybrids recorded positive significant heterosis over mid parent,
11 hybrids over better parent, whereas 19 hybrids out of 20 hybrids showed
positive significant heterosis over the standard check. The hybrids viz., ICPA-
2048 x ICPL-20123 (H X H), ICPA-2092 x ICPL-87119 (H X L), ICPA-2092
x ICPL-20108 (H X H), ICPA-2047 x ICPL-20108 (H X H), ICPA-2047 x
ICPL-20116 (H X L) and ICPA-2047 x ICPL-87119 (H X L) exhibited high
standard heterosis in desirable direction along with high per se performance.
The six hybrids involving ICPA-2048, ICPA-2092 and ICPA-2047 as parents
showed highest desirable standard heterosis along with high mean performance

for this trait. These results are in accordance with the results reported by
Pandey and Singh (2002), Sarode et al. (2009), Chandirakala et al. (2010), Gite
and Madrap (2014), Patel and Tikka (2014), Reddy et al.(2015) and Singh and
Singh (2016).
4.4.1.6 Pods per plant: The cross ICPA-2092 x ICPL-20108 recorded
maximum relative heterosis (134.08%), heterobeltiosis (118.56%) and standard
heterosis (172.41%). Heterosis over mid parent ranged from -59.32% (ICPA-
2048 x ICPL-20116) to 134.08%, heterobeltiosis from -60.96% (ICPA-2078 x
ICPL-87119) to 118.56% and standard heterosis from -45.29% (ICPA-2048 x
ICPL-20116) to 172.41% (Table 4.5).
Heterosis in positive direction is desirable for this trait as more pods can
lead to higher seed yield per plant. Out of 20 hybrids, six hybrids showed
positive significant relative heterosis, three hybrids showed heterobeltiosis and
11 hybrids showed positive significant standard heterosis. The two hybrids
involving ICPA-2092 as one of the parent showed highest desirable standard
heterosis along with high performance for this trait. These results are in
agreement with the earlier findings of Chaudhary et al. (1980), Patel (1988),
Rana (1990), Mehetre et al. (1993), Hooda et al. (1999), Khorgade et al.
(2000a), Pandey and Singh (2002), Sarode et al. (2009), Ajay et al. (2015),
Patel and Tikka (2008), Sekhar et al. (2004) and Gite and Madrap (2014) over
better parent, whereas Pandey (1999), Sekhar et al (2004), Patel and Tikka
(2008), Shoba and Balan (2010) and Reddy et al. (2015) for desirable heterosis
over standard check.
4.4.1.7 Seeds per pod: The cross ICPA-2078 x ICPL-20108 recorded highest
positive significant heterosis over mid parent (9.86%). Heterobeltiosis in
ICPA-2092 x ICPL-20123 (4.59%) and standard heterosis in ICPA-2047 x
ICPL-20123 (7.89%) were recorded for this trait. Relative heterosis ranged
from -16.82% (ICPA-2048 x ICPL-20116) to 9.86%, heterobeltiosis from -
18.35% (ICPA-2048 x ICPL-20116) to 4.59% and standard heterosis ranged
from -21.93% (ICPA-2048 x ICPL-20116) to 7.89% for this trait (Table 4.5).

Heterosis over mid parent was positive and significant in 11 hybrids,
heterobeltiosis in two hybrids and standard heterosis in three cross. The cross
ICPA-2047 x ICPL-20123, ICPA-2078 x ICPL-20108 and ICPA-2047 x ICPL-
20108 which involved high x high and low x high parental combinations
showed high desirable standard heterosis with high mean performance for this
trait. High heterosis was also reported earlier by Sarode et al. (2009) and
Shoba and Balan (2010).
4.4.1.8 100-seed weight (g): The cross ICPA-2092 x ICPL-20123 recorded
highest positive significant heterosis over mid parent (20.67%) and better
parent (18.30%). Standard heterosis was recorded for ICPA-2078 x ICPL-
20108 (15.82%). Relative heterosis ranged from -1.17% (ICPA-2043 x ICPL-
20123) to 20.67%, heterobeltiosis from -4.76% (ICPA-2047 x ICPL-20108) to
18.30% and standard heterosis from -8.54% (ICPA-2047 x ICPL-20116) to
15.82% for this trait (Table 4.5).
Heterosis over mid parent was positive and significant in six hybrids,
heterobeltiosis in two hybrids and standard heterosis in six hybrids. The cross
ICPA-2078 x ICPL-20108, ICPA-2092 x ICPL-20123 and ICPA-2048 x ICPL-
20116 which involved high x high, low x high and high x low parental
combinations showed higher desirable standard heterosis with high mean
performance for this trait. Desirable relative heterosis for this trait was also
reported by Patel et al. (1992), Khorgade et al. (2000a), Sarode et al. (2009)
and Patel and Tikka (2014), while Chaudary et al. (1980), Manivel et al.
(1999) and Gite and Madrap (2014) reported significant positive
heterobeltiosis.
4.4.1.9 Harvest index: The cross ICPA-2078 x ICPL-20116 recorded
maximum positive and significant heterosis over mid parent (79.94%).
Heterobeltiosis was recorded for ICPA-2092 x ICPL-20108 (66.12%) and
standard heterosis for ICPA-2047 x ICPL-20108 (96.16%). Relative heterosis
ranged from -27.53% (ICPA-2092 x ICPL-20123) to 79.94%, heterobeltiosis
from -37.97% (ICPA-2078 x ICPL-20123) to 66.12% and standard heterosis

ranged from -24.04% (ICPA-2078 x ICPL-20123) to 96.16% for this trait
(Table 4.5).
Positive and significant values observed in five, four and 13 hybrids for
heterosis over mid parent, better parent and standard check, respectively.
Positive heterosis is desirable as high harvest index will result in high
economic yield. High heterosis over mid-parent, better parent and standard
check recorded in three hybrids (ICPA-2047 x ICPL-20108, ICPA-2092 x
ICPL-20108 and ICPA-2078 x ICPL-20116) along with high per se
performance. These hybrids can be exploited in hybrids production. The
significant positive heterosis was also reported by Singh et al. (1983), Patel
and Tikka (2014) and Singh and Singh (2016).
4.4.1.10 Seed yield per plant: Out of 20 hybrids, the cross ICPA-2092 x
ICPL-20108 recorded maximum heterosis over mid parent (126.64%), better
parent (115.31%) and standard check (186.21%) coupled with high per se
performance. Relative heterosis for seed yield ranged from -58.60% (ICPL-
2048 x ICPL-20116) to 126.64%, heterobeltiosis from -65.97% (ICPA-2078 x
ICPL-87119) to 115.31% and standard heterosis from -41.91% (ICPL-2048 x
ICPL-20116) to 186.21% (Table 4.5).
Nine hybrids showed positive significant heterosis over their mid
parent, five hybrids over better parent and 13 hybrids over standard heterosis.
The hybrids ICPA-2092 x ICPL-20108 and ICPA-2047 x ICPL-20108 may
throw superior segregants for seed yield in the succeeding generations for
selection and isolation of superior genotypes as they also had significant
positive heterobeltiosis. These results are in confirmity with the findings of
Narladker and Kapre (1996), Manivel et al. (1999), Khorgade et al. (2000a),
Pandey and Singh (2002), Sekhar et al. (2004), Aher (2006), Patel and Tikka
(2008), Shoba and Balan (2010), Chandirakala et al. (2010), Vaghela et al.
(2011), Pandey et al. (2013), Patil et al. (2014), Kumar et al. (2015), Reddy et
al. (2015) and Singh and Singh (2016).

4.4.2 Quality attributes
4.4.2.1 Seed protein: The cross ICPA-2043 x ICPL-20108 recorded positive
significant heterosis over mid parent (7.05%). The cross ICPA-2043 x ICPL-
20116 recorded positive heterosis over better parent (5.64%), but standard
heterosis was negative and significant (13.1%). Heterosis over mid parent
ranged from -10.73% (ICPA-2092 x ICPL-20116) to 7.05%, heterobeltiosis
from -15.61% (ICPA-2092 x ICPL-20116) to 5.64% and standard heterosis
from -21.76% (ICPA-2092 x ICPL-20116) to 13.1% (Table 4.5).
Three hybrids (ICPA 2048 X ICPL 20123, ICPA 2043 x ICPL 20123
and ICPA 2043 x ICPL 20116) recorded positive significant heterosis over
standard parent, along with high per se performance. Significant positive
heterosis was also observed earlier by Khorgade et al. (2000a), Patel and Tikka
(2014) and Patil et al. (2014), while negative heterosis was noticed by Pankaja
Reddy et al. (1979) for seed protein.
In present investigation, the cross combinations, ICPA-2092 x ICPL-
20108, ICPA-2047 x ICPL-20108, ICPA-2047 x ICPL-20116 and ICPA-2047
x ICPL-20123 showed positive significant heterosis in desirable direction for
most of the traits along with seed yield. The differences in the magnitude of
positive and negative heterosis in hybrids for different characters indicates
presence of dominance or positive action of genes. Wide range of heterosis
recorded for different characters can be exploited due to non-allelic interaction.
In most of the cross combinations the significant positive heterosis was
observed for seed yield per plant was mainly due to the manifestation of
heterosis for its component characters viz., plant height, secondary branches
per plant, pods per plant, harvest index. This clearly indicates that heterosis for
seed yield was through heterosis for individual component characters.

4.5 COMBINING ABILITY
Combining ability studies helps the breeder in selecting the parents and
breeding methods to be employed to improve a particular trait, as it provides
the information on the genetic nature of the traits. General combing ability
(gca) is attributed to additive (fixable) gene action, while specific combing
ability (sca) is attributed primarily due to dominance, over dominance and
epistatic effects of genes (non-additive). The non-additive gene action is
mostly non-fixable, but often brings about in phenotypes that are not attainable
under normal additive gene action. The ratio of gca to sca variance provides an
estimate of the predominance of additive gene effects or the non-additive gene
effects.
The analysis of variance for combining ability was carried out for 11
characters and mean sum of squares are presented in Table 4.6. Treatments
(genotypes) registered highly significant differences for all the characters. The
parents and hybrids exhibited significant differences for all the characters,
while parents vs. hybrids also showed significant differences for all the
characters except primary branches per plant.
The effects of hybrids was partitioned into lines, testers and their
interactions. The lines were found to be significant for days to 50% flowering,
primary branches per plant and 100-seed weight(g). Among testers, the
differences were non-significant for all the characters. The interaction effects
(lines x testers) were found to be significant for all the characters.
Estimates of the relative contribution of gca and sca in a population are
of interest to plant breeders, as selection of breeding methods most appropriate
for specific objectives may differ appreciably based on type of gene action.
The estimates of components of variance and their ratio (σ2gca / σ
2sca)
indicated the preponderance of non-additive gene action for all the traits in the
study (Table 4.7 and Fig. 4.4). Estimates of additive and dominance variance
indicated that the dominance variance was predominant for all the characters.

Non-additive gene action was found high for pods per plant followed by seed
yield per plant, harvest index and plant height.
In the present investigation, the combining ability analysis was carried
out based on mean value of five plants for nine parents and twenty hybrids
derived from 5 lines x 4 testers programme. General combining ability effects
of the parents and specific combining ability effects of hybrids are presented in
the Table 4.8 and Table 4.9 for parents and hybrids, respectively, and the
results and discussion are presented character wise hereunder.
4.5.1 Yield Attributes
4.5.1.1 Days to 50% flowering: The lines ICPB-2078 (-3.58) and ICPB-2043
(-3.17) had highly significant negative gca effect which is related to earliness.
None of the testers recorded significant gca effects for this trait, indicating
there is limited variability for improving this character. The lines ICPB-2092
(3.58) and ICPB-2047 (3.17) showed positive significant gca effects (Table
4.8).
Five hybrids viz., ICPA-2047 x ICPL-87119 (-4.90), ICPA-2048 x
ICPL-20116 (-4.33), ICPA-2043 x ICPL-20116 (-1.50), ICPA-2078 x ICPL-
87119 (-1.48) and ICPA-2078 x ICPL-20108 (-1.42) recorded negative and
highly significant sca effects indicating the possibility of improvement for
early flowering. On contrary, the hybrids viz., ICPA-2048 x ICPL-87119
(3.93), ICPA-2078 x ICPL-20116 (3.58), ICPA-2047 x ICPL-20108 (1.83),
ICPA-2047 x ICPL-20123 (1.57) and ICPA-2047 x ICPL-20116 (1.50)
registered positive and highly significant sca effects, indicating that these
hybrids late in flowering (Table 4.9).
Non-additive gene action recorded for days to 50% flowering in the
present investigation was in confirmity with the results reported by Pandey
(1999), Jayamala and Rathnaswamy (2000), Pandey and Singh (2002), Sekhar
et al. (2004), Patel et al. (2010) and Patel and Tikka (2015).

Table 4.6. Analysis of variance for combining ability in Line x Tester design for 11 characters in pigeonpea
Source of variation Df
Days 50%
to
flowering
Days to
75%
maturity
Plant
height
(cm)
Primary
branches
per plant
Secondary
branches
per plant
Number
of pods
per plant
Number
of seeds
per pod
100-
seed
weight
(g)
Harvest
index
(%)
Seed
protein
(%)
Seed yield
per plant
(g)
Replications 2 10.25** 0.65 4.00 1.70 12.86** 5.58 0.07** 0.03 0.35 0.91 0.80
Treatments 28 84.06** 83.92** 696.25** 11.66** 201.34** 55906.25** 0.18** 2.06** 312.72** 1.58** 4890.24**
Parents 8 182.45** 171.67** 1565.96** 12.62** 170.83** 63237.60** 0.23** 1.48** 200.47** 2.11** 5969.87**
Parents vs Hybrids 1 54.04** 63.35** 190.17** 1.82 493.87** 111.70** 0.12** 7.26** 99.46** 2.58* 156.17**
Hybrids 19 44.21** 48.06** 356.70** 11.77** 198.78** 55755.92** 0.17** 2.04** 371.20** 1.31* 4684.82**
Lines 4 137.21** 104.73 800.29 42.31** 216.64 93235.74** 0.17 5.34* 227.56 1.03 8098.74
Testers 3 4.71 27.33 41.88 0.68 202.37 37248.83 0.31 0.27 804.63 0.33 4982.43
Line x Tester 12 23.09** 34.35** 287.53** 4.36** 191.94** 47889.42** 0.14** 1.37** 310.73** 1.65** 3472.45**
Error 56 1.63 2.02 2.59 1.51 3.15 14.30 0.10 0.36 1.38 0.60 1.37
** Significant at 1% level, * Significant at 5% level
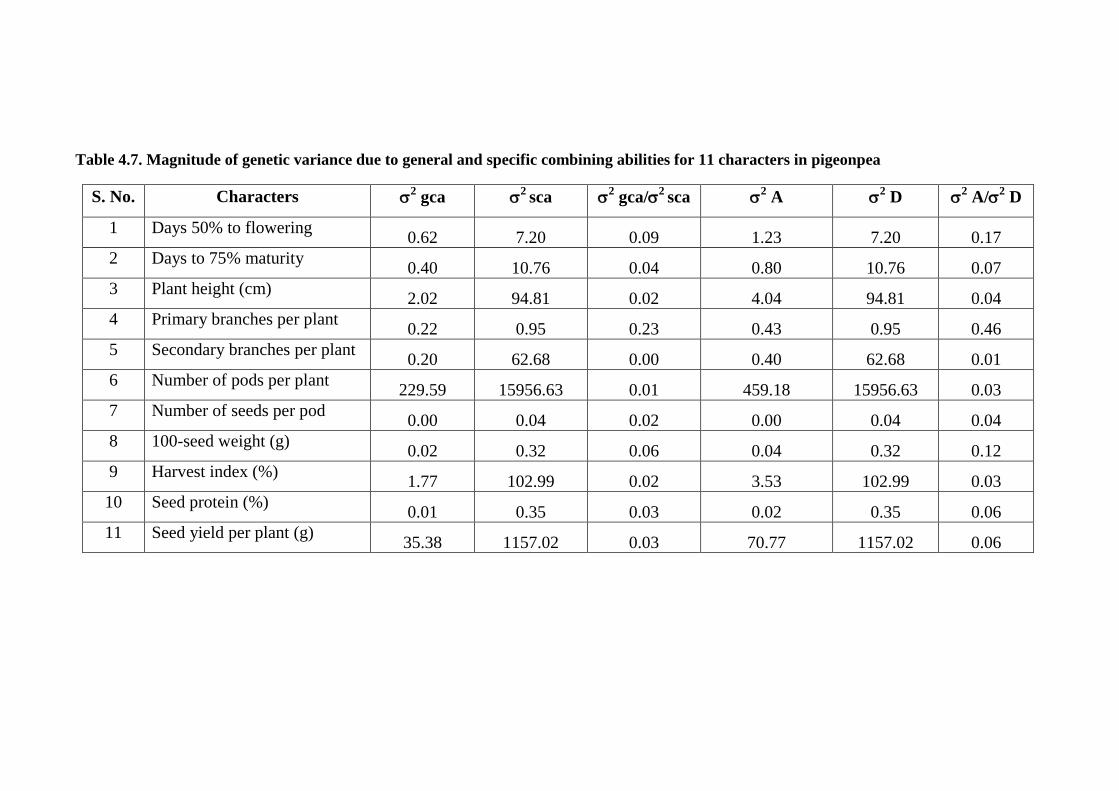
Table 4.7. Magnitude of genetic variance due to general and specific combining abilities for 11 characters in pigeonpea
S. No. Characters 2 gca
2 sca
2 gca/
2 sca
2 A
2 D
2 A/
2 D
1 Days 50% to flowering 0.62 7.20 0.09 1.23 7.20 0.17
2 Days to 75% maturity 0.40 10.76 0.04 0.80 10.76 0.07
3 Plant height (cm) 2.02 94.81 0.02 4.04 94.81 0.04
4 Primary branches per plant 0.22 0.95 0.23 0.43 0.95 0.46
5 Secondary branches per plant 0.20 62.68 0.00 0.40 62.68 0.01
6 Number of pods per plant 229.59 15956.63 0.01 459.18 15956.63 0.03
7 Number of seeds per pod 0.00 0.04 0.02 0.00 0.04 0.04
8 100-seed weight (g) 0.02 0.32 0.06 0.04 0.32 0.12
9 Harvest index (%) 1.77 102.99 0.02 3.53 102.99 0.03
10 Seed protein (%) 0.01 0.35 0.03 0.02 0.35 0.06
11 Seed yield per plant (g) 35.38 1157.02 0.03 70.77 1157.02 0.06

Table 4.8. Estimation of general combing ability (gca) effects in parents for yield and yield components in pigeonpea
Parents
Days
to 50%
flowering
Days
to 75%
maturity
Plant
height
(cm)
Primary
branches
per plant
Secondary
branches
per plant
Number of
pods per
plant
Number
of seeds
per pod
100-seed
weight (g)
Harvest
index (%)
Seed
protein
(%)
Seed yield per
plant (g)
LINES
ICPB2078 -3.58** -2.35** -1.25* -2.77** -6.40** -116.97** -0.04 1.10** -2.38** -0.36 -32.95**
ICPB2043 -3.17** -3.77** -7.24** -0.93** -1.65** -11.17** -0.01 -0.50** -3.71** 0.45* -7.11**
ICPB2047 3.17** 1.98** 12.12** 1.98** 4.77** 38.74** 0.18** -0.57** 5.50** -0.01 21.01**
ICPB2048 0.00 3.23** -7.26** 1.15** 1.18* -32.02** -0.14** -0.00 -3.32** 0.01 -12.17**
ICPB2092 3.58** 0.90* 3.63** 0.57 2.10** 121.43** 0.02 -0.01 3.90** -0.09 31.21**
SE 0.35 0.41 0.51 0.36 0.57 1.28 0.03 0.19 0.38 0.22 0.34
(gi-gj) 0.50 0.58 0.72 0.50 0.80 1.80 0.04 0.27 0.54 0.32 0.48
TESTERS
ICPL87119 -0.60 -1.93** -1.99** -0.08 3.18** 49.34** -0.09** -0.16 -2.76** 0.10 8.71**
ICPL20108 0.33 1.20** -0.75 0.32 1.38** 32.69** 0.17** -0.02 9.22** -0.17 18.82**
ICPL20116 -0.33 0.27 1.61** -0.15 -5.28** -23.96** -0.15** 0.01 1.64** -0.07 -4.10**
ICPL20123 0.60 0.47 1.13* -0.08 0.72 -58.07** 0.07** 0.17 -8.10** 0.14 -23.44**
SE 0.31 0.37 0.45 0.32 0.51 1.14 0.02 0.17 0.34 0.20 0.30
(gi-gj) 0.44 0.52 0.64 0.45 0.72 1.61 0.03 0.24 0.48 0.28 0.43
** Significant at 1% level, * Significant at 5% level

Table 4.9. Estimation of specific combing ability (sca) effects in hybrids for yield and yield components in pigeonpea
Crosses
Days
50% to
flowering
Days to
75%
maturity
Plant
height (cm)
Primary
branches
per plant
Secondary
branches per
plant
Number of
pods per
plant
Number
of seeds
per pod
100-seed
weight (g)
Harvest
index
(%)
Seed
protein
(%)
Seed yield per
plant (g)
ICPA 2078 x ICPL 87119 -1.48* 0.35 0.11 1.50* 0.40 -30.03** 0.01 -0.08 -5.66** -0.25 -11.35**
ICPA 2078 x ICPL 20108 -1.42* -1.12 -0.63 0.10 1.20 -78.17** 0.09 0.38 -9.11** -0.26 -28.65**
ICPA 2078 x ICPL 20116 3.58** -2.85** -2.82** -0.77 -1.80 61.68** 0.20** -0.22 17.77** -0.17 28.93**
ICPA 2078 x ICPL 20123 -0.68 3.62** 3.33** -0.83 0.20 46.52** -0.31** -0.08 -2.99** 0.69 11.07**
ICPA 2043 x ICPL 87119 1.10 -3.90** -6.90** 0.00 -3.35** -107.96** 0.01 0.05 -0.33 -0.45 -28.46**
ICPA 2043 x ICPL 20108 0.50 0.63 -3.27** 0.27 -3.55** 9.56** -0.01 0.54 -2.11** 0.71 -4.12**
ICPA 2043 x ICPL 20116 -1.50* 3.90** 15.50** -0.60 5.78** 97.68** -0.06 -0.05 -1.13 0.94* 30.59**
ICPA 2043 x ICPL 20123 -0.10 -0.63 -5.34** 0.33 1.12 0.72 0.06 -0.54 3.57** -1.20** 1.98**
ICPA 2047 x ICPL 87119 -4.90** -0.32 3.75** -1.25 -2.43* 0.79 -0.18** 0.42 -2.44** 0.30 -7.14**
ICPA 2047 x ICPL 20108 1.83** 1.88* -3.83** 0.02 1.70 -98.36** -0.13* -0.15 12.48** -0.49 7.05**
ICPA 2047 X ICPL 20116 1.50* -0.52 -2.52* 0.82 8.03** 63.76** 0.15** -0.55 -9.77** 0.71 1.79**
ICPA 2047 X ICPL 20123 1.57* -1.05 2.60* 0.42 -7.30** 33.80** 0.17** 0.29 -0.27 -0.52 -1.69*
ICPA 2048 x ICPL 87119 3.93** 6.77** 12.13** -1.08 -2.52* 85.76** 0.24** -0.15 6.68** 0.11 36.04**
ICPA 2048 x ICPL 20108 0.33 -1.70* -0.61 -1.15 -3.72** -69.79** 0.12* -0.22 -13.70** -0.12 -28.42**
ICPA 2048 X ICPL 20116 -4.33** -1.10 -17.80** 0.32 -10.05** -122.20** -0.43** 1.21** 1.51* -0.67 -39.65**
ICPA 2048 X ICPL 20123 0.07 -3.97** 6.28** 1.92** 16.28** 106.24** 0.06 -0.84* 5.52** 0.68 32.02**
ICPA 2092 x ICPL 87119 1.35 -2.90** -9.10** 0.83 7.90** 51.44** -0.09 -0.24 1.76* 0.29 10.90**
ICPA 2092 x ICPL 20108 -1.25 0.30 8.33** 0.77 4.37** 236.76** -0.08 -0.55 12.45** 0.17 54.15**
ICPA 2092 X ICPL 20116 0.75 0.57 7.64** 0.23 -1.97 -100.92** 0.14* -0.38 -8.37** -0.81 -21.66**
ICPA 2092 X ICPL 20123 -0.85 2.03* -6.88** -1.83* -10.30** -187.28** 0.02 1.17** -5.83** 0.35 -43.39**
S.E 0.70 0.83 1.01 0.71 1.14 2.55 0.05 0.38 0.77 0.45 0.68
Sij-Sjk 2.98 3.51 4.31 3.03 4.83 10.83 0.23 1.60 3.25 1.90 2.88

The lines viz., ICPB-2078 and ICPB-2043 were found to be good combiners
for earliness as indicated by significant negative gca effects and may be used
in crop improvement programmes in the development of genotypes with
earliness. Five hybrids recorded significant negative sca effects viz., ICPA-
2047 x ICPL-87119 (H x H), ICPA-2048 x ICPL-20116 (H x H), ICPA-2043 x
ICPL-20116 (L x H), ICPA-2078 x ICPL-87119 (L x H) and ICPA-2078 x
ICPL-20108 (L x H). Out of five hybrids, three hybrids involved atleast one
parent as low general combiner indicating the influence of non-additive gene
action for earliness. This trait can be improved by diallel selective mating or
intermating in segregating populations in the above cross combinations.
4.5.1.2 Days to 75% maturity: The lines ICPB-2043 (-3.77) and ICPB-2078
(-2.35) and the tester ICPL-87119 (-1.93) showed significant negative gca
effect indicating their use as general combiners in getting early maturing types.
Among the lines ICPB-2048 (3.23), ICPB-2047 (1.98), ICPB-2092 (0.90) and
the testers ICPL-20108 (1.20) recorded positive significant gca effects (Table
4.8).
The hybrids, ICPA-2048 x ICPL-20123 (-3.97), ICPA-2043 x ICPL-
87119 (-3.90), ICPA-2092 x ICPL-87119 (-2.90), ICPA-2078 x ICPL-20116
and ICPA-2048 x ICPL-20108 (-1.70) showed significant and negative sca
effects indicating that the possibility to get early maturing hybrids whereas,
ICPA-2048 x ICPL-87119 (6.77), ICPA-2043 x ICPL-20116 (3.90), ICPA-
2078 x ICPL-20123 (3.62), ICPA-2092 x ICPL-20123 (2.03) and ICPA-2047 x
ICPL-20108 (1.88) recorded positive and highly significant sca effect
indicating late maturity (Table 4.9).
High magnitude of sca variance than gca variance indicates non-
additive gene action for this trait. The predominance of non-additive gene
action in the inheritance of days to 75% maturity was earlier reported by
Srinivas et al. (1998), Jayamala and Rathnaswamy (2000), Pandey and Singh
(2002), Lohithaswa and Dharmaraj (2003), Sunilkumar et al. (2003), Sekhar et

al. (2004), Raju and Muthiah (2007), Patel et al. (2010) and Patel and Tikka
(2015).
The lines ICPB-2043 and ICPB-2078 and the tester ICPL-87119
displayed negative significant gca effects for days to 75% maturity. Hence,
they can be utilized as good donor sources in breeding for earliness. The
resulted cross combinations between them also showed significant negative sca
effects for early maturity. Five hybrids recorded significant negative sca
effects viz., ICPA-2048 x ICPL-20123 (H x H), ICPA-2043 x ICPL-87119 (L x
H), ICPA-2092 x ICPL-87119 (H x H) and ICPA-2078 x ICPL-20116 (L x L).
ICPA-2048 x ICPL-20108 (H x H) Out of five hybrids, two hybrids involved
atleast one parent as low general combiner indicating the influence of non-
additive gene action for earliness. This trait can be improved by diallel
selective mating or intermating in segregating populations in the above
combinations.
4.5.1.3 Plant height: The lines ICPB-2047 (12.12), ICPB-2092 (3.63) and the
testers ICPL-20116 (1.61), ICPL-20123 (1.13) recorded significant positive
effect for plant height, whereas the line ICPB-2048 (-7.26), ICPB-2043 (-7.24),
ICPB-2078 (-1.25) and the testers ICPL-87119 (-1.99) (Table 4.8) showed
highly significant negative gca effect indicating the possibility of obtaining
dwarf plants. The high sca effect than gca effect indicated the importance of
non-additive gene action for plant height.
Eight out of 20 hybrids ICPA-2043 x ICPL-20116 (15.50), ICPA-2048
x ICPL-87119 (12.13), ICPA-2092 x ICPL-20108 (8.33), ICPA-2092 x ICPL-
20116 (7.64), ICPA-2048 x ICPL-20123 (6.28), ICPA-2047 x ICPL-87119
(3.75), ICPA-2078 x ICPL-20123 (3.33) and ICPA-2047 x ICPL-20123 (2.60)
recorded positive significant sca effects with high per se performance for this
trait (Table 4.9).
These results are in confirmity with the findings of Srinivas et al.
(1998), Pandey (1999), Pandey and Singh (2002), Lohithaswa and Dharmaraj

(2003), Sunilkumar et al. (2003), Sekhar et al. (2004), Yadav et al. (2008),
Vaghela et al. (2009), Patel et al. (2010) and Patel and Tikka (2015).
4.5.1.4 Primary branches per plant: Positive significant gca effects were
observed in the lines ICPB-2047 (1.98) and ICPB-2048 (1.15) along with high
per se performance. On contrary, the line ICPB-2078 (-2.77) and ICPB-2043
(-0.93) recorded negative significant gca effects. None of the testers were
positive significant for this trait (Table 4.8).
Only one cross ICPA-2048 x ICPL-20123 (H X H) recorded significant
sca effect with high performance (Table 4.9), indicating the operation of
additive gene action and can be exploited through pedigree method. It was also
reported by Srinivas et al. (1998), Pandey (1999), Ajay Kumar et al. (2001),
Pandey and Singh (2002), Jahagirdar (2003), Sunilkumar et al. (2003), Yadav
et al. (2008), Phad et al. (2009) and Patel and Tikka (2015) in the inheritance
of primary branches per plant.
4.5.1.5 Secondary branches per plant: The lines ICPB-2047 (4.77), ICPB-
2092 (2.10) and ICPB-2048 (1.18) and the testers ICPL-87119 (3.18) and
ICPL-20108 (1.38) recorded highly significant positive gca effect. On
contrary, the lines ICPB-2078 (-6.40) and ICPB-2043 (-1.65) and the testers
ICPL-20116 (-5.28) showed significant and negative gca effects (Table 4.8).
Out of 20 hybrids, five hybrids recorded positive and significant and
eight hybrids recorded negative and significant sca effects for this trait
indicating operation of non-additive gene action.
Lines, viz., ICPB-2047, ICPB-2092 and ICPB-2048 recorded positive
significant gca effect along with high mean performance and they were found
to be best general combiners. Out of 20 hybrids, five hybrids viz., ICPA-2048 x
ICPL-20123 (H x H), ICPA-2047 x ICPL-20116 (H x L), ICPA-2092 x ICPL-
87119 (H x L) and ICPA-2092 x ICPL-20108 (H x H) with high per se
performance. The second cross involved one parent with significant gca effect
and the other with poor negative gca effects and may throw the desirable

transgressive segregants if additive genetic system present in good combiners
and the epistatic effects present in cross acts in a complementary fashion to
maximize desirable plant attributes which could be exploited for further
breeding purposes. Hence these combinations may be handled through diallel
mating or intermating in segregating populations followed by cyclic selections
for improving this character.
Srinivas et al. (1998), Jahagirdar (2003), Sunilkumar et al. (2003),
Pandey (2004), Raju and Muthiah (2007), Vaghela et al. (2009) and Yamunura
et al. (2014) also reported similar results.
4.5.1.6 Pods per plant: The lines ICPB-2092 (121.43) and ICPB-2047 (38.74)
and the testers ICPL-87119 (49.34) and ICPL-20108 (32.69) recorded highly
significant positive gca effect for this trait indicating their use as good general
combiners to get maximum pods per plant. On contrary, the genotypes, ICPB-
2078 (-116.97), ICPB-2048 (-32.02), ICPB-2043 (-11.17) and ICPL-20123
(-58.07) and ICPL-20116 (-23.96) recorded negative significant gca effects
(Table 4.8).
Ten hybrids recorded positive significant sca effects for this trait and
eight hybrids recorded negative non-significant sca effects indicating that the
trait controlled by non-additive gene action.
Non-additive gene action was predominant for pods per plant in the
present study and is in agreement with earlier reports of Pandey (1999),
Jayamala and Rathnaswamy (2000), Ajay Kumar et al. (2001), Sunilkumar et
al. (2003), Sekhar et al. (2004), Raju and Muthiah (2007), Yadav et al. (2008),
Vaghela et al. (2009), Phad et al. (2009), Gupta et al. (2011), Patil et al. (2015)
and Patel and Tikka (2015).
Among the lines, ICPB-2092 and ICPB-2047 and the tester ICPL-87119
were found to be best general combiners. The cross combinations, ICPA-2092
x ICPL-20108 (H X L), ICPA-2048 x ICPL-20123 (H X H) and ICPA-2043 x
ICPL-20116 (L X H), ICPA-2048 x ICPL-87119 (H x H), ICPA-2047 x ICPL-

20116 (H x H), ICPA-2092 x ICPL-87119 (H x H), ICPA-2047 x ICPL-20123
(H x H), ICPA-2043 x ICPL-20108 (L x L) recorded significant sca effects.
These results clearly indicated that the hybrids showing H X H combinations
may be exploited through the simple pedigree method while H X L and L X L
cross combinations through diallel selective mating or intermating in
segregating populations followed by cyclic selections for improvement this
character.
4.5.1.7 Seeds per pod: The line ICPB-2047 (0.18) and the testers ICPL-20108
(0.17) and ICPL-20123 (0.07) showed positive significant gca effect with high
per se performance and it can be utilized as good general combiner in breeding
programmes for improving this trait. The lines ICPB-2048 (-0.14) and the
testers ICPL-20116 (-0.15) and ICPL-87119 (-0.09) showed negative
significant gca effects (Table 4.8).
Among hybrids, ICPA-2048 x ICPL-87119 (0.24), ICPA-2078 x ICPL-
20116 (0.20), ICPA-2047 x ICPL-20123 (0.17), ICPA-2047 x ICPL-20116
(0.15), ICPA-2092 x ICPL-20116 (0.14) and ICPA-2048 x ICPL-20108 (0.12)
showed significant positive sca effect with high per se performance and were
found to be good specific combiners, while seven hybrids, ICPA-2048 x ICPL-
20116 (-0.43), ICPA-2078 x ICPL-20123 (-0.31), ICPA-2047 x ICPL-87119
(-0.18) and ICPA-2047 x ICPL-20108 (-0.13) recorded negative significant sca
effects (Table 4.9).
Non-additive gene action was found to be important in controlling this
character, which is in agreement with the results of Patel et al. (1992), Ajay
Kumar et al. (2001), Lohithaswa and Dharmaraj (2003), Sekhar et al. (2004),
Raju and Muthiah (2007), Yadav et al. (2008), Patel et al. (2010) and Patel and
Tikka (2015).
4.5.1.8 100-seed weight (g): The line ICPB-2078 (1.10) showed positive and
significant gca effect (Table 4.8) and it can be utilized as good general
combiner in breeding programmes for improving this trait. None of the testers

were found to be the good combiners. The lines ICPB-2047 (-0.57) and ICPB-
2043 (-0.50) showed negative significant gca effects.
Among hybrids, ICPA-2048 x ICPL-20116 (1.21) and ICPA-2092 x
ICPL-20123 (1.17) recorded desirable positive and significant sca effects for
this trait (Table 4.9). ICPA-2048 x ICPL-20123 (-0.84) had negative
significant sca effect. The hybrids, ICPA-2048 x ICPL-20116 (H X L) and
ICPA-2092 x ICPL-20123 (L X H) were found to be good specific combiners.
The importance of non-additive gene action for 100-seed weight as recorded in
this present study is in agreement with the findings of Singh et al. (1983),
Srinivas et al. (1998), Ajay Kumar et al. (2001), Jahagirdar (2003), Sekhar et
al. (2004), Raju and Muthiah (2007), Yadav et al. (2008), Vaghela et al.
(2009), Gupta et al. (2011), Patel et al. (2010) and Patel and Tikka (2015).
4.5.1.9 Harvest index: Among parents, the lines ICPB-2047 (5.50) and ICPB-
2092 (3.90) and the testers ICPL-20108 (9.22) and ICPL-20116 (1.64)
recorded highly significant positive gca effect. On contrary, the genotypes,
ICPB-2043 (-3.71), ICPB-2048 (-3.32), ICPB-2078 (-2.38), ICPL-20123
(-8.10) and ICPL-87119 (-2.76) recorded negative significant gca effects
(Table 4.8).
Out of 20 hybrids, eight hybrids recorded positive significant and nine
hybrids recorded negative significant sca effects and thus it is evident that
harvest index is under the control of non-additive gene action.
This type results were reported by Patel et al. (1992), Sekhar et al
(2004) and Patel and Tikka (2015).
Among the lines, ICPB-2047 and ICPB-2092 and the tester ICPL-20116
were found to be best general combiners. The cross combinations, ICPA-2078
x ICPL-20116 (L x H), ICPA-2047 x ICPL-20108 (H x L), ICPA-2092 x
ICPL-20108 (H x L), ICPA-2048 x ICPL-87119 (H x H) and ICPA-2092 x
ICPL-87119 (H x H) exhibited positive significant sca effects besides high per
se performance. The superiority of hybrids with low x low and high x low

general combiners may be due to complementary gene actions. Population
improvement through mass selection or bi-parental mating and recurrent
selection may be employed to release the variability or alternatively heterosis
breeding can also be exploited in view of high sca variances and high x high
cross combination may be exploited through the simple pedigree method.
4.5.1.10 Seed yield per plant (g): The lines ICPB-2092 (31.21) and ICPB-
2047 (21.01) and the testers ICPL-20108 (18.82) and ICPL-87119 (8.71)
recorded highly significant positive gca effects. On contrary, the lines ICPB-
2078 (-32.95), ICPB-2048 (-12.17) and ICPB-2043 (-7.11) and the tester
ICPL-20123 (-23.44), ICPL-20116 (-4.10) reported highly significant negative
gca effects (Table 4.8).
Out of 20 hybrids, 10 hybrids recorded positive significant sca effects
while 10 hybrids recorded negative significant sca effects.
The relative importance of non-additive gene action for seed yield per
plant in the present study is in agreement with the results of Srinivas et al.
(1998), Pandey (1999), Ajay Kumar et al. (2001), Lohithaswa and Dharmaraj
(2003), Sunilkumar et al. (2003), Jahagirdar (2003), Pandey (2004), Sekhar et
al. (2004), Yadav et al. (2008), Vaghela et al. (2009), Phad et al. (2009), Patel
et al. (2010), Gupta et al. (2011), Parmar et al. (2012), Meshram et al. (2013),
Yamunura et al. (2014), Patil et al. (2015), Patel and Tikka (2015) and Tikle et
al. (2016).
For seed yield per plant, the lines ICPB-2047 and the tester ICPL-87119
were found to be good general combiners for their utility in breeding
programmes in the improvement of seed yield. The hybrids ICPA-2043 x
ICPL-20116 (L X L), ICPA-2047 x ICPL-20108 (H X L), ICPA-2047 x ICPL-
20116 (H x L), ICPA-2048 x ICPL-87119 (H x H), ICPA-2092 x ICPL-87119
(L x H) and ICPA-2092 x ICPL-20108 (L X L) recorded significant sca
effects. These results clearly indicates that the hybrids showing H X H
combination may be exploited through the simple pedigree method while the
other combinations (H X L or L X L) through diallel selective mating or

intermating in segregating populations followed by cyclic selections for
improvement of this character.
4.5.2 Quality attributes
4.5.2.1 Seed protein: In parents, only one line ICPB-2043 (0.45) showed
positive significant gca effect and among hybrids, one cross ICPA-2043 x
ICPL-20116 (0.94) showed positive significant sca effect with high per se
performance. The superiority of cross (ICPA-2043 x ICPL-20116) with low x
low combination may be due to complementary gene action. Population
improvement through mass selection or bi- parental mating and recurrent
selection may be employed to release the variability or alternatively heterosis
breeding can also be exploited in view of high sca variances.
Low gca / sca variance ratio, indicated that seed protein is controlled by
non-additive gene action, which was also reported by Patel et al. (2010) and
Patel and Tikka (2015)
Based on the overall gca effects, the hybrids were classified as H X H,
H X L, L X H combinations. Both the parents with low overall gca status (L X
L) also produced hybrids with high (H) overall sca status and the hybrids with
H X H gca combination of parents expressed high (H) as well as low (L)
overall sca status. On contrary, the hybrids involving high (H) x low (L) or low
(L) x high (H) gca status expressed high (H) overall sca status in higher
frequency in most of the hybrids indicating major role of non-additive gene
action. So these hybrid combinations are suitable for heterosis breeding. The
combinations of H X H or L X L can be utilized to get useful transgressive
segregants in the subsequent segregating generations.
From the results of study, it is concluded that based on per se
performance and gca effects of the parents, ICPB-2078 and ICPB-2043 were
the best general combiners for days to 50% flowering and days to 75%
maturity, while ICPB-2047 for plant height, primary branches per plant,
secondary branches per plant, seeds per pod, harvest index and seed yield per

Table 4.10. Best parents, general combiners and hybrids with high sca effects for different characters in pigeonpea
S.
NO Character(s)
Best
performing
parents
Good
general
combiner
Best performing crosses Crosses with high sca
effect
Crosses with high
standard heterosis
1 Days 50% to flowering ICPB-2078
ICPB-2043
ICPB-2078
ICPB-2043
ICPL-87119
ICPA-2078 x ICPL-87119
ICPA-2043 x ICPL-20116
ICPA-2078 x ICPL-20108
ICPA-2047 x ICPL-87119
ICPA-2048 x ICPL-20116
ICPA-2043 x ICPL-20116
ICPA-2078 x ICPL-87119
2 Days to 75% maturity ICPB-2078
ICPB-2043
ICPL-20116
ICPB-2043
ICPB-2078
ICPL-87119
ICPA-2043 x ICPL-87119
ICPA-2078 x ICPL-20116
ICPA-2078 x ICPL-87119
ICPA-2048 x ICPL-20123
ICPA-2043 x ICPL-87119
ICPA-2092 x ICPL-87119
ICPA-2043 x ICPL-87119
3 Plant height (cm) ICPL-20123
ICPB-2047
ICPB-2048
ICPB-2047
ICPB-2092
ICPL-20116
ICPA-2047 x ICPL-20123
ICPA-2047 x ICPL-87119
ICPA-2092 x ICPL-20116
ICPA-2043 x ICPL-20116
ICPA-2048 x ICPL-87119
ICPA-2092 x ICPL-20108
ICPA-2047 x ICPL-20123
ICPA-2047 x ICPL-87119
ICPA-2092 x ICPL-20116
4 Primary branches per
plant
ICPB-2047
ICPB-2048
ICPL-20108
ICPB-2047
ICPB-2048
ICPA-2048 x ICPL-20123
ICPA-2047 x ICPL-20116
ICPA-2047 x ICPL-20123
ICPA-2048 x ICPL-20123
ICPA-2078 x ICPL-87119
ICPA-2048 x ICPL-20123
ICPA-2047 x ICPL-20116
ICPA-2047 x ICPL-20123
5 Secondary branches per
plant
ICPL-20123
ICPB-2047
ICPB-2092
ICPB-2047
ICPL-87119
ICPB-2092
ICPA-2048 x ICPL-20123
ICPA-2092 x ICPL-87119
ICPA-2092 x ICPL-20108
ICPA-2048 x ICPL-20123
ICPA-2047 x ICPL-20116
ICPA-2092 x ICPL-87119
ICPA-2048 x ICPL-20123
ICPA-2092 x ICPL-87119
ICPA-2092 x ICPL-20108
ICPA-2047 x ICPL-20108
6 Number of pods per
plant
ICPL-87119
ICPB-2047
ICPL-20123
ICPB-2092
ICPL-87119
ICPB-2047
ICPA-2092 x ICPL-20108
ICPA-2092 x ICPL-87119
ICPA-2048 x ICPL-87119
ICPA-2092 x ICPL-20108
ICPA-2048 x ICPL-20123
ICPA-2043 x ICPL-20116
ICPA-2092 x ICPL-20108
ICPA-2092 x ICPL-87119
ICPA-2048 x ICPL-87119
Cont...

S.
NO Character
Best
performing
parents
Good
general
combiner
Best performing
crosses
Crosses with high sca
effect
Crosses with high
standard heterosis
7 Number of seeds per
pod
ICPB-2047
ICPL-20108
ICPL-20116
ICPB-2047
ICPL-20108
ICPA-2047 x ICPL-20123
ICPA-2047 x ICPL-20108
ICPA-2078 x ICPL-20108
ICPA-2048 x ICPL-87119
ICPA-2047 x ICPL-20123
ICPA-2047 x ICPL-20116
ICPA-2047 x ICPL-20123
ICPA-2047 x ICPL-20108
ICPA-2078 x ICPL-20108
8 100-seed weight (g) ICPB-2078
ICPL-20108
ICPL-87119
ICPB-2078
ICPA-2078 x ICPL-20108
ICPA-2092 x ICPL-20123
ICPA-2048 x ICPL-20116
ICPA-2048 x ICPL-20116
ICPA-2092 x ICPL-20123
ICPA-2078 x ICPL-20108
ICPA-2092 x ICPL-20123
ICPA-2048 x ICPL-20116
9 Harvest index (%) ICPL-20116
ICPL-87119
ICPB-2047
ICPL-20108
ICPB-2047
ICPB-2092
ICPA-2047 x ICPL-20108
ICPA-2092 x ICPL-20108
ICPA-2078 x ICPL-20116
ICPA-2078 x ICPL-20116
ICPA-2047 x ICPL-20108
ICPA-2092 x ICPL-20108
ICPA-2047 x ICPL-20108
ICPA-2092 x ICPL-20108
ICPA-2078 x ICPL-20116
10 Seed protein (%) ICPB-2092
ICPB-2048
ICPB-2047
ICPL-20123
ICPB-2043
ICPA-2043 x ICPL-20116
ICPA-2043 x ICPL-20108
ICPA-2048 x ICPL-20123
ICPA-2043 x ICPL-20116
ICPA-2043 x ICPL-20116
ICPA-2043 x ICPL-20108
ICPA-2048 x ICPL-20123
11 Seed yield per plant
(g)
ICPL-87119
ICPB-2047
ICPB-2048
ICPB-2092
ICPB-2047
ICPL-20108
ICPA-2092 x ICPL-20108
ICPA-2092 x ICPL-87119
ICPA-2047 x ICPL-20108
ICPA-2092 x ICPL-20108
ICPA-2048 x ICPL-87119
ICPA-2043 x ICPL-20116
ICPA-2092 x ICPL-20108
ICPA-2092 x ICPL-87119
ICPA-2047 x ICPL-20108
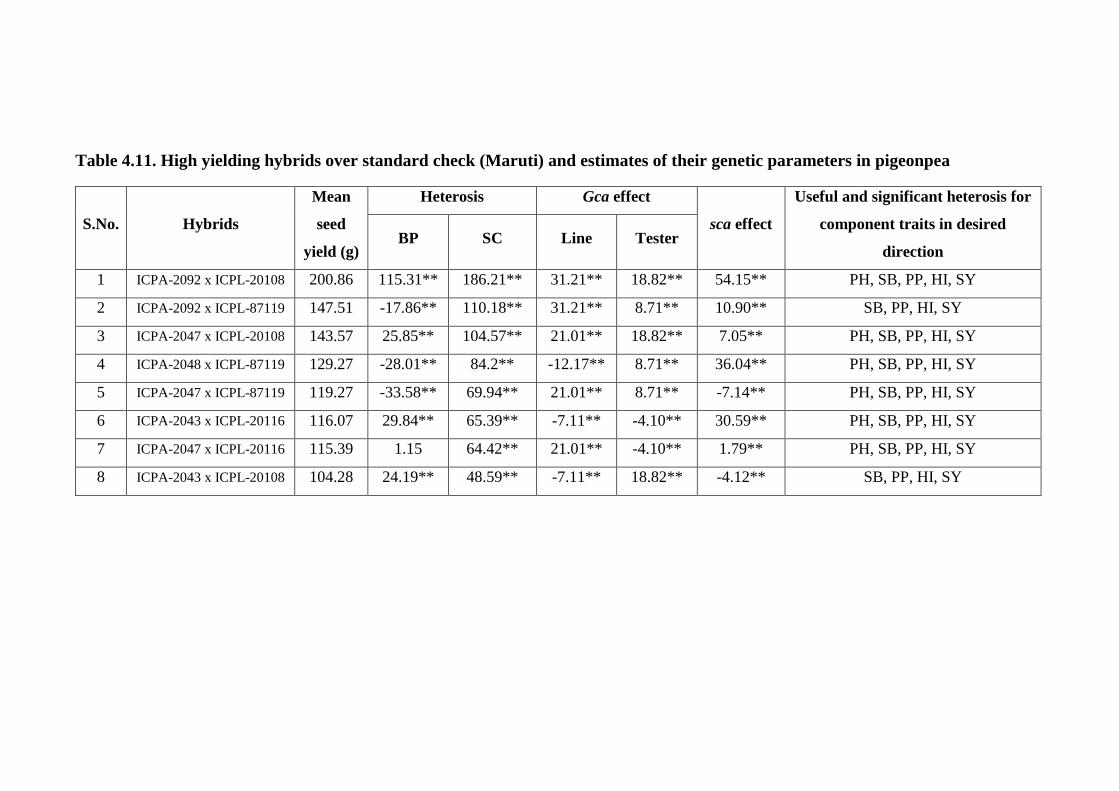
Table 4.11. High yielding hybrids over standard check (Maruti) and estimates of their genetic parameters in pigeonpea
S.No. Hybrids
Mean
seed
yield (g)
Heterosis Gca effect
sca effect
Useful and significant heterosis for
component traits in desired
direction BP SC Line Tester
1 ICPA-2092 x ICPL-20108 200.86 115.31** 186.21** 31.21** 18.82** 54.15** PH, SB, PP, HI, SY
2 ICPA-2092 x ICPL-87119 147.51 -17.86** 110.18** 31.21** 8.71** 10.90** SB, PP, HI, SY
3 ICPA-2047 x ICPL-20108 143.57 25.85** 104.57** 21.01** 18.82** 7.05** PH, SB, PP, HI, SY
4 ICPA-2048 x ICPL-87119 129.27 -28.01** 84.2** -12.17** 8.71** 36.04** PH, SB, PP, HI, SY
5 ICPA-2047 x ICPL-87119 119.27 -33.58** 69.94** 21.01** 8.71** -7.14** PH, SB, PP, HI, SY
6 ICPA-2043 x ICPL-20116 116.07 29.84** 65.39** -7.11** -4.10** 30.59** PH, SB, PP, HI, SY
7 ICPA-2047 x ICPL-20116 115.39 1.15 64.42** 21.01** -4.10** 1.79** PH, SB, PP, HI, SY
8 ICPA-2043 x ICPL-20108 104.28 24.19** 48.59** -7.11** 18.82** -4.12** SB, PP, HI, SY

Table 4.12. Proportionate contribution of lines, testers and line x tester interaction towards total variance in hybrids (in per cent) in
pigeonpea
S. No. Characters Lines Testers Lines x Testers interaction
1 Days 50% to flowering 65.34 1.68 32.98
2 Days to 75% maturity 45.88 8.98 45.14
3 Plant height (cm) 47.23 1.85 50.91
4 Primary branches per plant 75.67 0.92 23.41
5 Secondary branches per plant 22.94 16.07 60.98
6 Number of pods per plant 35.20 10.55 54.25
7 Number of seeds per pod 20.79 28.39 50.82
8 100-seed weight (g) 55.24 2.09 42.67
9 Harvest index (%) 12.91 34.23 52.87
10 Seed protein (%) 16.51 4.00 79.50
11 Seed yield per plant (g) 36.39 16.79 46.81

plant. ICPB-2092, ICPB-2078 and ICPB-20123 were the promising parents for
pods per plant, 100-seed weight and seed protein.
Critical observation of per se performance, standard heterosis and sca
effects of hybrids, indicated ICPA-2078 x ICPL-20116, ICPA-2048 x ICPL-
20116 and ICPA-2092 x ICPL-20123, were the promising hybrids for harvest
index and 100-seed weight, while ICPA-2043 x ICPL-20116 and ICPA-2048 x
ICPL-87119 for plant height, pods per plant, seed protein and seed yield per
plant. Whereas ICPA-2047 x ICPL-20116 and ICPA-2048 x ICPL-20123 for
primary and secondary branches per plant, pods per plant, seeds per pod and
seed yield per plant, ICPA-2078 x ICPL-87119 for days to 50% flowering and
ICPA-2043 x ICPL-87119 for days to 75% maturity. Similarly, the hybrids
viz., ICPA-2092 x ICPL-87119 and ICPA-2092 x ICPL-20108 were found to
be most rewarding for pods per plant, harvest index, secondary branches per
plant and seed yield (Table 4.10). The details of the hybrids which showed
highly significant standard heterosis along with their genetic parameter
estimates were presented in Table 4.11.
The proportional contribution of lines, testers and line x tester
interaction towards total variation in hybrids (%) was presented in Table 4.12.
The contribution of lines towards total variation was maximum in respect of
days to 50% flowering, days to 75% maturity, primary branches per plant.
Plant height, secondary branches per plant, pods per plant, seeds per pod,
harvest index, seed protein and seed yield per plant which are attributable
highly by the line x tester interaction.
4.6 CHARACTER ASSOCIATION
Generally, direct selection for yield is not aimed at, as it is a complex
and quantitatively inherited character and is highly influenced by environment.
High genotypic and environmental interactions are likely to restrict the
improvement, if selection is based on yield as a simple trait. Therefore,
correlation between yield and yield components are of considerable importance
in selection programmes.

In present study, the results obtained revealed that the genotypic
correlation coefficients were higher than phenotypic correlation coefficients
and in the same direction. Significant phenotypic correlations will be useful
when coupled with significant genotypic correlations. Here, phenotypic and
genotypic correlation coefficients were computed separately for parents and
hybrids to assess the direction and magnitude of association existing between
seed yield and other component characters and are presented in Tables 4.13
and 4.14 respectively. The phenotypic and genotypic correlation coefficients
were also given in Fig. 4.5 and 4.6, respectively.
4.6.1 Association of Yield Components with Seed Yield in Parents and
hybrids
Seed yield per plant showed significant and positive association with
days to 50% flowering (0.798**, 0.543**), days to 75% maturity (0.845**,
0.264*), plant height (0.684**, 0.521**), primary branches per plant (0.494**,
0.430**), pods per plant (0.987**, 0.933**), seeds per pod (0.428*, 0.274*)
and harvest index (0.799**, 0.710**). Further, secondary branches per plant,
and seed protein recorded positive correlations with seed yield per plant. 100-
seed weight showed significant and negative association with seed yield (Table
4.13).
Seed yield per plant was associated significantly and positively with all
characters except 100-seed weight and seed protein. 100-seed weight was
associated significantly and negatively with seed yield. Seed protein showed
positive association at phenotypic level and positive and significant association
at genotypic level with seed yield per plant.
Seed yield had positive significant association with all the characters
except secondary branches per plant, 100-seed weight and seed protein in
parents, while in hybrids, all the characters had positive significance with seed
yield except 100-seed weight and seed protein. Seed yield can be increased
with an increase in days to 50% flowering, days to 75% maturity, plant height,
primary branches per plant, pods per plant, seeds per pod and harvest index in

Table 4.13. Correlation coefficients for yield and yield components in parents of pigeonpea
Characters Days
50% to
flowering
Days to
75%
maturity
Plant
height
(cm)
Primary
branches
per plant
Secondary
branches
per plant
Number
of pods
per plant
Number
of seeds
per pod
100-seed
weight
(g)
Harvest
index
(%)
Seed
protein
(%)
Seed yield
per plant
(g)
Days 50% to flowering P
G
1.0000
1.0000 0.913**
0.936**
0.788**
0.803**
0.729**
0.844**
0.425*
0.439*
0.832**
0.844**
0.602**
0.682**
-0.541**
-0.689**
0.892**
0.910**
0.268
0.418*
0.798**
0.811**
Days to 75% maturity P
G
1.0000
1.0000
0.759**
0.755**
0.675**
0.805**
0.363
0.377*
0.843**
0.858**
0.461*
0.527**
-0.313
-0.429*
0.822**
0.839**
0.140
0.258
0.845**
0.859**
Plant height (cm) P
G
1.0000
1.0000
0.682**
0.801**
0.681**
0.695**
0.700**
0.702**
0.656**
0.705**
-0.622**
-0.804**
0.792**
0.799**
0.312
0.424*
0.684**
0.685**
Primary branches per
plant P
G
1.0000
1.0000
0.653**
0.767**
0.496**
0.585**
0.509**
0.712**
-0.331
-0.486**
0.462*
0.567**
0.354
0.445*
0.494**
0.587**
Secondary branches per
plant P
G
1.0000
1.0000
0.134
0.136
0.376*
0.406*
-0.369*
-0.428*
0.303
0.315
0.379*
0.619**
0.122
0.126
Number of pods per plant P
G
1.0000
1.0000
0.477**
0.511**
-0.456*
-0.584**
0.857**
0.861**
0.206
0.301
0.987**
0.987**
Number of seeds per pod P
G
1.0000
1.0000
-0.451*
-0.735**
0.551**
0.576**
-0.015
-0.185
0.428*
0.455*
100-seed weight (g) P
G
1.0000
1.0000
-0.608**
-0.809**
-0.324
-0.717**
-0.402*
-0.520**
Harvest index (%) P
G
1.0000
1.0000
0.260
0.384*
0.799**
0.801**
Seed protein (%) P
G
1.0000
1.0000
0.197
0.283
Seed yield per plant (g) P
G
1.0000
1.0000
** Significant at 0.01; * Significant at 0.05
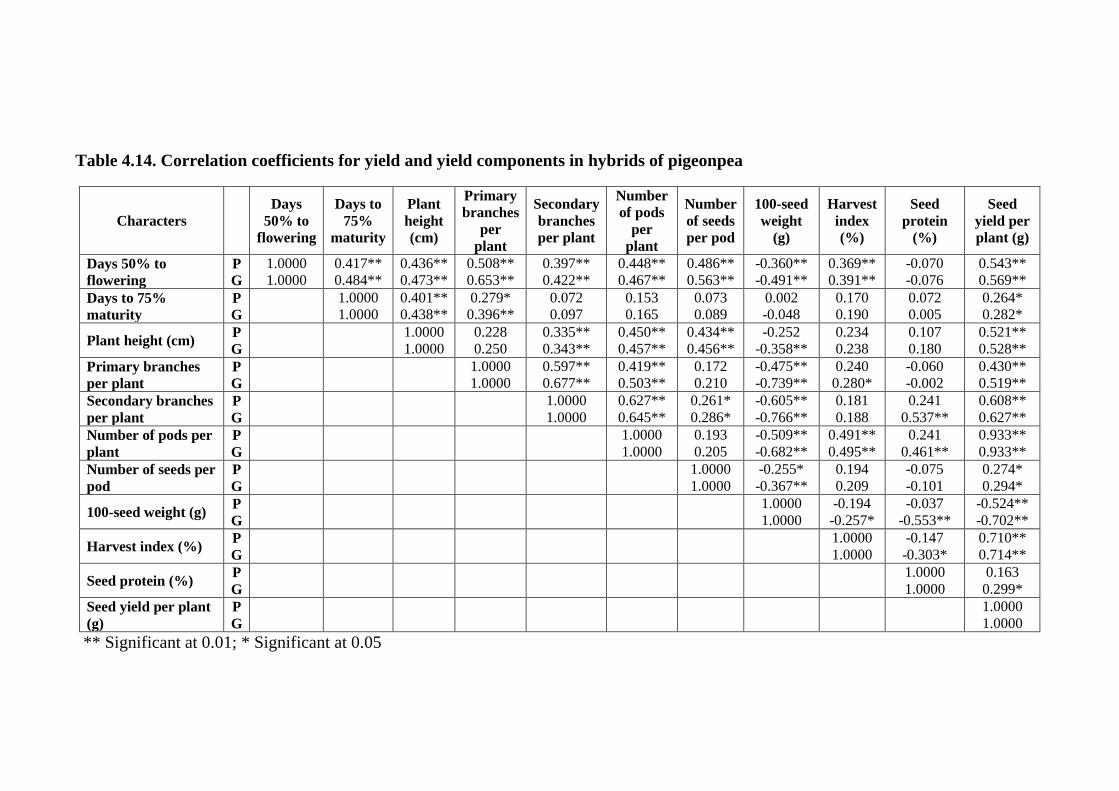
Table 4.14. Correlation coefficients for yield and yield components in hybrids of pigeonpea
Characters
Days
50% to
flowering
Days to
75%
maturity
Plant
height
(cm)
Primary
branches
per
plant
Secondary
branches
per plant
Number
of pods
per
plant
Number
of seeds
per pod
100-seed
weight
(g)
Harvest
index
(%)
Seed
protein
(%)
Seed
yield per
plant (g)
Days 50% to
flowering
P
G
1.0000
1.0000
0.417**
0.484**
0.436**
0.473**
0.508**
0.653**
0.397**
0.422**
0.448**
0.467**
0.486**
0.563**
-0.360**
-0.491**
0.369**
0.391**
-0.070
-0.076
0.543**
0.569**
Days to 75%
maturity
P
G
1.0000
1.0000
0.401**
0.438**
0.279*
0.396**
0.072
0.097
0.153
0.165
0.073
0.089
0.002
-0.048
0.170
0.190
0.072
0.005
0.264*
0.282*
Plant height (cm) P
G
1.0000
1.0000
0.228
0.250
0.335**
0.343**
0.450**
0.457**
0.434**
0.456**
-0.252
-0.358**
0.234
0.238
0.107
0.180
0.521**
0.528**
Primary branches
per plant
P
G
1.0000
1.0000
0.597**
0.677**
0.419**
0.503**
0.172
0.210
-0.475**
-0.739**
0.240
0.280*
-0.060
-0.002
0.430**
0.519**
Secondary branches
per plant
P
G
1.0000
1.0000
0.627**
0.645**
0.261*
0.286*
-0.605**
-0.766**
0.181
0.188
0.241
0.537**
0.608**
0.627**
Number of pods per
plant
P
G
1.0000
1.0000
0.193
0.205
-0.509**
-0.682**
0.491**
0.495**
0.241
0.461**
0.933**
0.933**
Number of seeds per
pod
P
G
1.0000
1.0000
-0.255*
-0.367**
0.194
0.209
-0.075
-0.101
0.274*
0.294*
100-seed weight (g) P
G
1.0000
1.0000
-0.194
-0.257*
-0.037
-0.553**
-0.524**
-0.702**
Harvest index (%) P
G
1.0000
1.0000
-0.147
-0.303*
0.710**
0.714**
Seed protein (%) P
G
1.0000
1.0000
0.163
0.299*
Seed yield per plant
(g)
P
G
1.0000
1.0000
** Significant at 0.01; * Significant at 0.05

Fig. 4.5. Phenotypic correlation of yield components with seed yield of
pigeonpea
Fig. 4.6. Genotypic correlation of yield components with seed yield of
pigeonpea
DF= Days to 50% flowering SB= Secondary branches per plant HI= Harvest index
DM= Days to 75% maturity PP= Pods per plant SN= Seed protein
PH= Plant height SP= Seeds per pod
PB= Primary branches per plant SW= 100-seed weight
-0.6
-0.4
-0.2
0
0.2
0.4
0.6
0.8
1
1.2
DF DM PH PB SB PP SP SW HI SN
Corr
elati
on
Coef
fici
ents
Characters
Parents Hybrids
-0.8
-0.6
-0.4
-0.2
0
0.2
0.4
0.6
0.8
1
1.2
DF DM PH PB SB PP SP SW HI SN
Co
rre
lati
on
Co
effi
cien
t
Characters
Parents Hybrids

parents and hybrids and secondary branches per plant in hybrids. Hence, these
characters can be considered as selection criteria for selection of higher
yielding genotypes as these are directly associated with seed yield. Similar
results were reported by Asawa et al. (1981), Natarajan et al. (1990), Paul and
Upadhaya (1991), Dhameliya and Pathak (1994), Deshmukh et al. (2000),
Baskaran and Mutiah (2007), Mahajan et al. (2007), Jogendra Singh et al.
(2008), Dodake et al. (2009), Balyan and Sudhakar (1985), Bhongale and Raut
(1987), Salunke et al. (1995), Srinivas et al. (1999) and Bhadru (2010).
4.6.2. Association among Yield Components in Parents and hybrids
In parents, pods per plant showed significant and positive association
with plant height (0.700**), days to 75% maturity (0.843**) and days to 50%
flowering (0.832**) and primary branches per plant (0.496**), while the
association was positive non-significant with secondary branches per plant. It
was indicated that increase in plant height, days to 75% maturity, days to 50%
flowering and primary branches per plant will increase pods per plant, finally
the total seed yield. In hybrids, pods per plant was associated positively and
significantly with plant height (0.450**), days to 50% flowering (0.448**),
primary branches per plant (0.419**) and secondary branches per plant
(0.627**), while its association with days to 75% maturity was non-significant
and positive. It was indicated that increase in plant height, days to 50%
flowering, primary branches per plant and secondary branches per plant will
increase primary branches per plant and thus pods per plant, which was highly
correlated with seed yield. This is in confirmity with the results of Vanisree
and Sreedhar (2014), Saroj et al. (2013) and Kothimbire et al. (2015) for days
to 50% flowering, Chandhirikala and Subbaraman (2010) and Kothimbire et al.
(2015) for days to 75% maturity, Bhadru (2010), Linge et al. (2010), Prakash
(2011), Rekha et al. (2013) and Saroj et al. (2013) for primary branches per
plant, Linge et al. (2010), Prakash (2011), Prasad et al. (2013), Rekha et al.
(2013), Saroj et al. (2013) and Arbad et al. (2014) for plant height.

Secondary branches per plant displayed significant and positive
association with days to 50% flowering (0.425*, 0.397**), plant height
(0.681**, 0.335**) and primary branches per plant (0.653**, 0.597**) and
positive non-significant association with days to 75% maturity in parents and
hybrids. This is in confirmity with the results of Bhadru (2010), Linge et al.
(2010), Prakash (2011) and Rekha et al. (2013) for days to 50% flowering,
Anuradha et al. (2007), Linge et al. (2010), Prakash (2011) and Rekha et al.
(2013) for days to 75% maturity, Prakash (2011), Devi et al. (2012), Rekha et
al. (2013) and Saroj et al. (2013) for primary branches per plant and Rekha et
al. (2013), Arbad et al. (2014), Pandey et al. (2015) for Plant height.
Plant height manifested significant positive association with days to
50% flowering (0.788**, 0.436**) and days to 75% maturity (0.759**,
0.401**) in parents and hybrids. These results were in accordance with the
findings of Rekha et al. (2013) for days to 75% maturity and Bharathi and
Saxena (2013) and Saroj et al. (2013) for days to 50% flowering.
Primary branches per plant had significant positive association with
days to 50% flowering (0.729**), plant height (0.682**) and days to 75%
maturity (0.675**) in parents, while in hybrids it had positive significant
association with days to 50% flowering (0.508**) and days to 75% maturity
(0.279*). The results indicated that increase in days to 50% flowering, plant
height and days to 75% maturity in parents and days to 50% flowering and
days to 75% maturity in hybrids will increase pods per plant, finally it will
result in improvement of seed yield. These results were in accordance with the
results of Anuradha et al. (2007), Das et al. (2007), Prakash (2011), Vange and
Moses (2009) and Saroj et al. (2013) for days to 50% flowering and days to
75% maturity, while Bhadru et al. (2010), Linge et al. (2010), Nagy et al.
(2013), Rekha et al. (2013) and Saroj et al. (2013) for Plant height.
Days to 75% maturity expressed significant and positive association
with days to 50% flowering (0.913**, 0.417**) in parents and in hybrids,
indicated that delay in flowering will increase in crop duration. This was also

supported by Prakash (2011), Hamid et al. (2011), Nagy et al. (2013), Prasad
et al. (2013), Rekha et al. (2013) and Saroj et al. (2013).
Harvest index exhibited significant positive association with days to
75% maturity (0.822**), days to 50% flowering (0.892**), primary branches
per plant (0.462*), plant height (0.792**), pods per plant (0.857**) and seeds
per pod (0.551**), while it had positive non-significant correlation with
secondary branches per plant suggesting that increase in days to 75% maturity,
days to 50% flowering, primary branches per plant, plant height, pods per plant
and seeds per pod will increase harvest index. In hybrids, harvest index had
high and positive and significant association with days to 50% flowering
(0.369**), pods per plant (0.491**), while it had positive and non-significant
correlation with days to 75% maturity, plant height, secondary branches per
plant and seeds per pod indicating that increase in days to 50% flowering and
pods per plant will increase the harvest index. Similar results were also
reported earlier by Mittal et al. (2010), Pandey et al. (2016), Sodavadiya et al.
(2009), Kothimbire et al. (2015) and Pandey et al. (2015).
Seeds per pod expressed positive and significant association with days
to 50% flowering, days to 75% maturity, plant height, primary and secondary
branches per plant and pods per plant in parents, while it had positive and
significant association with days to 50% flowering, plant height and secondary
branches per plant revealing that increase in these characters may increase in
seeds per pod. This trait showed positive non-significant association with days
to 75% maturity, primary branches per plant and pods per plant in hybrids.
These results were in agreement with the reports of Nethravathi and patil
(2014), Pandey et al. (2016), Vijayalakshmi et al. (2013), Arbad et al. (2014),
Ajay et al. (2016), Sodavadiya et al. (2009), Pandey et al. (2015), Bhadru
(2010), Kothimbire et al. (2015) and Saroj et al. (2013).
The trait, 100-seed weight exhibited significant and negative association
with days to 50% flowering (-0.541**), plant height (-0.622**), secondary
branches per plant (-0.369*), pods per plant (-0.456*) and seeds per pod

(-0.451*). In hybrids, 100-seed weight exhibited significant and negative
association with days to 50% flowering (-0.360**), primary branches per plant
(-0.475**), secondary branches per plant (-0.605**), pods per plant (-0.509**)
and seeds per pod (-0.255*). These results in tune with the findings of Patel et
al. (2011), Singh et al. (2013), Vanisree et al. (2013), Rao et al. (2013), Patel
and Acharya (2011), Pandey et al. (2015), Saroj et al. (2013), Nagy et al.
(2013) and Rekha et al. (2013).
Seed protein had positive and non-significant association with days to
50% flowering (0.268), days to 75% maturity (0.140), plant height (0.312),
primary branches per plant (0.354), pods per plant (0.206) and harvest index
(0.260), it had positive and significant association with secondary branches per
plant (0.379*). In hybrids, the trait exhibited positive and non-significant
association with days to 75% maturity and plant height, secondary branches
per plant and pods per plant. None of the characters showed positive and
significant association with seed protein. These results are in close agreement
with Baskaran and Muthiah (2007), Rekha et al. (2013) and Devi et al. (2012).
It was evident from the present investigation that highly significant and
positive association of pods per plant, days to 50% flowering, days to 75%
maturity, plant height, primary branches per plant, pods per plant, seeds per
pod, harvest index with seed yield per plant in parents and hybrids. Seed
protein had non-significant and positive association with seed yield in parents
and hybrids. The positive and non-significant association of secondary
branches per plant with seed yield in parents became positive and significant in
hybrids.
Non-significant and positive associations observed among the yield
components in parents viz., were secondary branches per plant with pods per
plant become significant and positive in hybrids. The positive and significant
association in parents between character pairs viz., plant height with primary
branches per plant; days to 75% maturity with pods per plant and seeds per
pod; days to 75% maturity, plant height, primary branches per plant, seeds per

pod with harvest index; seeds per pod with pods per plant, primary branches
per plant and seed protein with secondary branches per plant became non-
significant in hybrids.
Negative and significant association of among character pairs in parents
became negative and significant in hybrids viz., 100-seed weight with plant
height and harvest index. Negative non-significant association of 100-seed
weight with primary branches per plant in parents became negative and
significant in hybrids.
Positive and non-significant association of harvest index with seed
protein and seed protein with primary branches per plant in parents became
negative and non-significant in hybrids. Negative and non-significant
association of 100-seed weight with days to 75% maturity in parents became
Positive and non-significant in hybrids. These changes in correlations between
pairs of characters in parents and hybrids might have resulted due to the
modifications in the linkages as a result of re-combinations in the populations.
In general, the yield component traits which showed significant and
positive association with seed yield in parents and hybrids are of prime
importance in determining the seed yield. Such a situation is favourable to a
plant breeder as it helps in simultaneous improvement of the characters along
with seed yield per se. Hence, the emphasis should be given on days to 50%
flowering, days to 75% maturity, plant height, primary branches per plant,
pods per plant, seeds per pod and harvest index for obtaining higher yield in
pigeonpea.
4.7 PATH COEFFICIENT ANALYSIS
The observed correlation between yield and a particular yield
component is the net result of direct effect of component traits and indirect
effects through the other yield attributes. The direct effect may be different
from the observed correlations. The total correlation between yield and a
component trait may sometimes be misleading since it may be the overestimate

or under estimate because of its association with other traits. Hence, direct
selection by correlated response sometimes may be not fruitful. If the direct
effect is equal to correlation co-efficient, then correlation explains the true
relationship and simple and direct selection will be effective for this traits.
If the correlation co-efficient is positive, but the direct effect is negative
or negligible the indirect effects seem to be the cause of correlation. In such
situations, the other factors have to be considered simultaneously. If correlation
is negative, but the direct effect is positive and high, a restricted simultaneous
selection model is to be followed i.e., restrictions are to be imposed to nullify
the undesirable indirect effects in order to make use of the direct effect.
In the present study, path coefficient analysis for nine parents and 20
hybrids was worked out and furnished in Tables 4.14 and 4.15 respectively.
The results and discussion are presented hereunder.
4.7.1 Direct and Indirect Effects of Yield Attributes
4.7.1.1 Days to 50% flowering
In parents, days to 50% flowering exhibited negligible positive direct
effect on seed yield (0.0225). It had positive indirect effects through days to
75% maturity (0.1592), plant height (0.0763) and pods per plant (0.8531)
which resulted in positive correlation with seed yield (0.798**). In hybrids this
trait exhibited direct positive effect on seed yield (0.0507). Its positive indirect
effects through days to 75% maturity (0.0305), plant height (0.0333),
secondary branches per plant (0.0372), pods per plant (0.2773), 100-seed
weight (0.0317) and harvest index (0.1302) resulted in positive correlation with
seed yield (0.543**). Its positive direct effect on seed yield was also reported
earlier by Bhadru (2010), Rathore and Sharma (2011), Sreelakshmi et al.
(2011), Reddy and Rangare (2013) and Saroj et al. (2013).

Table 4.15. Direct and indirect effects of yield component characters on seed yield in parents of pigeonpea
Characters
Days
50% to
flowering
Days to
75%
maturity
Plant
height
(cm)
Primary
branches
per
plant
Secondary
branches
per plant
Number
of pods
per
plant
Number
of seeds
per pod
100-
seed
weight
(g)
Harvest
index
(%)
Seed
protein
(%)
Seed yield
per plant
(g)
Days 50% to
flowering
P
G
0.0225
-0.0946
0.1592
0.1908
0.0763
0.0588
-0.0473
0.0152
-0.0104
-0.0232
0.8531
0.8218
-0.0057
-0.0029
-0.0051
-0.0187
-0.2991
-0.2849
-0.0004
0.0002
0.798**
0.811**
Days to 75% maturity P
G
0.0207
-0.0891
0.1733
0.2026
0.0729
0.0563
-0.0425
0.0142
-0.0094
-0.0211
0.8622
0.8316
-0.0041
-0.0021
-0.0032
-0.0122
-0.2758
-0.2624
-0.0024
0.0030
0.845**
0.859**
Plant height (cm) P
G
0.0170
-0.0725
0.1248
0.1486
0.1013
0.0767
-0.0510
0.0168
-0.0130
-0.0287
0.7127
0.6778
-0.0072
-0.0036
-0.0056
-0.0206
-0.2655
-0.2496
0.0045
-0.0065
0.684**
0.685**
Primary branches per
plant
P
G
0.0138
-0.0668
0.0958
0.1336
0.0672
0.0596
-0.0769
0.0216
-0.0101
-0.0254
0.4574
0.5133
-0.0058
-0.0038
-0.0025
-0.0107
-0.1409
-0.1606
0.0081
-0.0120
0.494**
0.587**
Secondary branches
per plant
P
G
0.0110
-0.0473
0.0762
0.0921
0.0617
0.0476
-0.0366
0.0119
-0.0213
-0.0463
0.1809
0.1739
-0.0026
-0.0013
-0.0037
-0.0124
-0.1097
-0.1057
-0.0013
0.0012
0.122
0.126
Number of pods per
plant
P
G
0.0186
-0.0795
0.1451
0.1723
0.0701
0.0532
-0.0341
0.0113
-0.0037
-0.0082
1.0298
0.9776
-0.0048
-0.0024
-0.0043
-0.0156
-0.2909
-0.2726
0.0010
-0.0015
0.987**
0.987**
Number of seeds per
pod
P
G
0.0113
-0.0543
0.0627
0.0849
0.0646
0.0531
-0.0396
0.0161
-0.0050
-0.0120
0.4413
0.4540
-0.0113
-0.0051
-0.0036
-0.0173
-0.1694
-0.1675
0.0028
-0.0026
0.428*
0.455*
100-seed weight (g) P
G
-0.0124
0.0673
-0.0595
-0.0943
-0.0614
-0.0603
0.0208
-0.0088
0.0084
0.0219
-0.4789
-0.5824
0.0044
0.0034
0.0093
0.0262
0.2073
0.2572
-0.0020
0.0056
-0.402*
-0.520**
Harvest index (%) P
G
0.0199
-0.0854
0.1412
0.1684
0.0795
0.0607
-0.0320
0.0110
-0.0069
-0.0155
0.8850
0.8442
-0.0056
-0.0027
-0.0057
-0.0214
-0.3385
-0.3157
0.0018
-0.0028
0.799**
0.801**
Seed protein (%) P
G
-0.0004
0.0007
-0.0210
-0.0231
0.0232
0.0191
-0.0315
0.0100
0.0014
0.0022
0.0494
0.0556
-0.0016
-0.0005
-0.0010
-0.0057
-0.0312
-0.0345
0.0199
-0.0259
0.197
0.283
** Significant at 0.01; * Significant at 0.05

Table 4.16. Direct and indirect effects of yield component characters on seed yield in hybrids of pigeonpea
Characters
Days
50% to
flowering
Days to
75%
maturity
Plant
height
(cm)
Primary
branches
per
plant
Secondary
branches
per plant
Number
of pods
per
plant
Number
of seeds
per pod
100-
seed
weight
(g)
Harvest
index
(%)
Seed
protein
(%)
Seed yield
per plant
(g)
Days 50% to
flowering
P
G
0.0507
0.0834
0.0305
-0.0189
0.0333
0.0491
-0.0327
0.0880
0.0372
-0.0210
0.2773
0.2146
-0.0005
0.0103
0.0317
-0.0374
0.1302
0.1920
-0.0023
-0.0218
0.543**
0.569**
Days to 75% maturity P
G
0.0211
0.0404
0.0732
-0.0389
0.0307
0.0454
-0.0160
0.0491
0.0066
-0.0047
0.0948
0.0759
-0.0001
0.0018
0.0001
-0.0038
0.0599
0.0936
0.0024
0.0014
0.264*
0.282*
Plant height (cm) P
G
0.0221
0.0394
0.0294
-0.0170
0.0765
0.1038
-0.0133
0.0306
0.0309
-0.0169
0.2789
0.2101
-0.0005
0.0086
0.0223
-0.0272
0.0827
0.1167
0.0035
0.0519
0.521**
0.528**
Primary branches per
plant
P
G
0.0255
0.0540
0.0180
-0.0140
0.0157
0.0234
-0.0649
0.1359
0.0580
-0.0352
0.2730
0.2400
-0.0002
0.0041
0.0440
-0.0573
0.0879
0.1426
0.0012
0.0024
0.430**
0.519**
Secondary branches
per plant
P
G
0.0199
0.0348
0.0051
-0.0036
0.0250
0.0348
-0.0398
0.0951
0.0946
-0.0504
0.3865
0.2945
-0.0003
0.0053
0.0536
-0.0587
0.0615
0.0888
0.0078
0.1536
0.608**
0.627**
Number of pods per
plant
P
G
0.0227
0.0390
0.0112
-0.0064
0.0345
0.0475
-0.0286
0.0710
0.0590
-0.0323
0.6194
0.4594
-0.0002
0.0036
0.0452
-0.0523
0.1733
0.2429
0.0080
0.1331
0.933**
0.933**
Number of seeds per
pod
P
G
0.0244
0.0464
0.0056
-0.0039
0.0336
0.0485
-0.0119
0.0299
0.0244
-0.0145
0.1124
0.0891
-0.0011
0.0185
0.0219
-0.0274
0.0647
0.0959
-0.0026
-0.0215
0.274*
0.294*
100-seed weight (g) P
G
-0.0184
-0.0411
-0.0001
0.0019
-0.0195
-0.0372
0.0327
-0.1027
-0.0580
0.0390
-0.3201
-0.3167
0.0003
-0.0067
-0.0874
0.0759
-0.0685
-0.1262
-0.0014
-0.1573
-0.524**
-0.702**
Harvest index (%) P
G
0.0187
0.0326
0.0124
-0.0074
0.0179
0.0247
-0.0162
0.0395
0.0165
-0.0091
0.3043
0.2272
-0.0002
0.0036
0.0170
-0.0195
0.3528
0.4910
-0.0049
-0.0876
0.710**
0.714**
Seed protein (%) P
G
-0.0035
-0.0063
0.0053
-0.0002
0.0082
0.0187
-0.0024
0.0011
0.0224
-0.0268
0.1496
0.2118
0.0001
-0.0014
0.0036
-0.0413
-0.0523
-0.1490
0.0331
0.2887
0.163
0.299*
** Significant at 0.01; * Significant at 0.05

4.7.1.2 Days to 75% maturity
Days to 75% maturity had high positive direct effect on seed yield
(0.1733) but its positive indirect effects via days to 50% flowering (0.0207),
plant height (0.0729) and pods per plant (0.8622) nullified indirect negative
effects and resulted high positive correlation with seed yield (0.845**). In
hybrids this trait exhibited negligible positive direct effect on seed yield
(0.0732). But its positive indirect effects via days to 50% flowering (0.0211),
plant height (0.0307), secondary branches per plant (0.0066), pods per plant
(0.0948), 100-seed weight (0.001), harvest index (0.0599) and seed protein
(0.0024) suppressed negative indirect effects and resulted in positive
correlation with seed yield (0.264**). Positive direct effect of days to 75%
maturity on seed yield was supported by Mahajan et al. (2007), Birhan (2013),
Nag and Sharma (2012) and Pandey et al. (2016).
4.7.1.3 Plant height (cm)
Plant height exhibited high direct positive effect on seed yield (0.1013).
The low positive indirect effects through days to 50% flowering (0.0170), days
to 75% maturity (0.1248), pods per plant (0.7127) and seed protein (0.0045)
suppressed negative indirect effects and resulted in positive correlation with
seed yield (0.684**). In hybrids plant height had negligible positive direct
effect on seed yield (0.0765). The indirect positive effects via days to 50%
flowering (0.0221), days to 75% maturity (0.0294), secondary branches per
plant (0.0309), pods per plant (0.2789), 100-seed weight (0.0223), harvest
index (0.0827) and seed protein (0.0035) suppressed negative indirect effects
and resulted in positive correlation with seed yield (0.521**). The positive
direct effect on seed yield was confirmity with the results of Chattopadyay and
Dhiman (2005) and Baskaran and Muthiah (2007).
4.7.1.4 Primary branches per plant
In parents, primary branches per plant had low negative direct effect on
seed yield (-0.0769). The indirect positive effects via days to 50% flowering

(0.0138), days to 75% maturity (0.0958), plant height (0.0672), pods per plant
(0.4574) and seed protein (0.0081) suppressed negative direct and indirect
effects and resulted in positive correlation with seed yield (0.494**). In
hybrids, primary branches per plant showed negitive direct effect on seed yield
(-0.0649). It’s positive indirect effects via days to 50% flowering (0.0255),
days to days to 75% maturity maturity (0.0180), plant height (0.0157),
secondary branches per plant (0.0580), pods per plant (0.2730), 100-seed
weight (0.0440), harvest index (0.0879) and seed protein (0.0012) nullified
negative direct and indirect effects and resulted in high positive correlation
with seed yield (0.430**). Its negative direct effect on seed yield was also
reported earlier by Saroj et al. (2013) and Vijayalakshmi et al. (2013).
4.7.1.5 Secondary branches per plant
In parents, secondary branches per plant had low negative direct effect
on seed yield (-0.0213). Its positive indirect effects via days to 50% flowering
(0.0110), days to 75% maturity (0.0762), plant height (0.0617) and pods per
plant (0.1809) nullified direct and indirect negative effects and resulted high
positive correlation with seed yield (0.122). In hybrids, it had positive direct
effect on seed yield (0.0946). Its positive indirect effects via days to 50%
flowering (0.0199), days to 75% maturity (0.0051), plant height (0.0250), pods
per plant (0.3865), 100-seed weight (0.0536), harvest index (0.0615) and seed
protein (0.0078) suppressed negative indirect effects and produced high
positive correlation with seed yield (0.608**). Negative direct effect on seed
yield in parents was supported by Vijayalakshmi et al. (2013), Arbad et al.
(2014), Pandey et al. (2016), Saroj et al. (2013), Ram et al. (2016), Pandey et
al. (2015) and Sreelakshmi et al. (2010). Its positive direct effect on seed yield
in hybrids was also reported by Bhadru (2010), Kothimbire et al. (2015), Singh
et al. (2010) and Devi et al. (2012).
4.7.1.6 Pods per plant
In parents, pods per plant had high direct effect of this trait on seed yield
was high and positive (1.0298). Its positive indirect effects via days to 50%

flowering (0.0186), days to 75% maturity (0.1451), plant height (0.0701) and
seed protein (0.0010) nullified the negative indirect effects and resulted in
highly significant positive correlation with seed yield (0.987**). In hybrids,
pods per plant had high positive direct effect on seed yield (0.6194). It also
exerted positive indirect effects via days to 50% flowering (0.0227), days to
75% maturity (0.0112), plant height (0.0345), secondary branches per plant
(0.0590), 100-seed weight (0.0452), harvest index (0.1733) and seed protein
(0.0080).These positive direct and indirect effects were high enough to nullify
negative indirect effects and resulted in significant positive correlation with
seed yield (0.933**).The high positive direct effect on seed yield in parents
and hybrids was also reported by Mittal et al. (2010), Jogendra Singh et al.
(2008), Sawant et al. (2009), Pahwa et al. (2013), Saroj et al. (2013), Arbad et
al. (2014) and Pandey et al. (2016).
4.7.1.7 Seed per pod
In parents, seeds per pod exhibited negative direct effect on seed yield
(-0.0113). However, its positive effects via days to 50% flowering (0.0113),
days to 75% maturity (0.0627), plant height (0.0646), pods per plant (0.4413)
and seed protein (0.0028) suppressed negative direct and indirect effects and
resulted high positive correlation with seed yield (0.428**). In hybrids, it had
negative direct effect on seed yield (-0.0011). Its positive indirect effects via
days to 50% flowering (0.0244), days to 75% maturity (0.0056), plant height
(0.0336), secondary branches per plant (0.0244), pods per plant (0.1124), 100-
seed weight (0.0219) and harvest index (0.0647), nullified negative direct and
indirect effects and finally resulted in high positive association with seed yield
(0.274**). Its negative direct effect on seed yield in parents and hybrids was
earlier reported by Vanisree et al. (2013), Bhadru (2010) and Rekha et al.
(2013).
4.7.1.8 100-seed weight (g)
In parents, direct effect of 100-seed weight on seed yield was very low
and positive (0.0093). It had negative indirect effect via days to 50% flowering

(-0.0124), days to 75% maturity (-0.0595), plant height (-0.0614), pods per
plant (-0.4789) and seed protein (-0.0020) suppressed positive direct and
indirect effects and resulted in high negative correlation with seed yield
(-0.402*). In hybrids, it exerted negative direct effect on seed yield (-0.0874).
Its negative indirect effects through days to 50% flowering (-0.0184), days to
75% maturity (-0.0001), plant height (-0.0195), secondary branches per plant
(-0.0580), pods per plant (-0.3201), harvest index (-0.0685) and seed protein
(-0.0014) suppressed positive indirect effects and resulted in high negative
correlation with seed yield (-0.524**). Negative direct effect of this trait on
seed yield was in confirmity with the results of Vijayalakshmi et al. (2013) and
Singh et al. (2013).
4.7.1.9 Harvest index (%)
In parents, harvest index exerted negative direct effect on seed yield
(-0.3385). Its positive indirect effects through days to 50% flowering (0.0199),
days to 75% maturity (0.1412), plant height (0.0795), pods per plant (0.8850)
and seed protein (0.0018) suppressed negative direct and indirect effects and
finally resulted in positive correlation with seed yield (0.799**). In hybrids,
direct effect of this character on seed yield was positive and high (0.3528). It
also exerted positive indirect effects through days to 50% flowering (0.0187),
days to 75% maturity (0.0124), plant height (0.0179), secondary branches per
plant (0.0165), pods per plant (0.3043) and 100-seed weight (0.0170). These
positive direct and indirect effects were high enough to nullify the negative
indirect effects and resulted in significant positive correlation with seed yield
(0.710**). The negative direct effect of harvest index on seed yield in parents
was supported by Mittal et al. (2010). The positive direct effect of harvest
index on seed yield in hybrids was reported by Prasad et al. (2013), Reddy and
Rangare et al. (2013) and Pandey et al. (2016).

4.7.2 Direct and Indirect Effects of Quality Attributes
4.7.2.1 Seed protein (%)
In parents, direct effect of seed protein on seed yield was positive
(0.0199). Its correlation on seed yield was also positive (0.197) indicating the
existence of positive indirect effects via plant height (0.0232), secondary
branches per plant (0.0014) and pods per pod (0.0494). In hybrids, it exerted
positive direct effect on seed yield (0.0331). Its positive indirect effects via
days to 75% maturity (0.0053), plant height (0.0082), secondary branches per
plant (0.0224), pods per plant (0.1496), seeds per pod (0.0001) and 100-seed
weight (0.0036) suppressed negative indirect effects and resulted in positive
correlation with seed yield (0.163). The positive direct effect of seed protein on
seed yield was also reported by Bharadwaj and Gupta (2004) and Anuradha et
al. (2007).
From the findings of path analysis, it is evident that pods per plant had
high direct effect on seed yield and found to be the main factor. It had strong
positive correlation with seed yield in parents and hybrids. Hence, direct
selection for pods per plant would be effective. Similarly, days to 75%
maturity and plant height also exerted high direct effects on seed yield
followed by days to 50% flowering and seed protein in parents in the
decreasing order. Though 100-seed weight had positive direct effect, they
recorded negative correlation with seed yield. This may be attributed to the
direct effects of these characters on seed yield were neutralized by their
indirect effects mainly via pods per plant in parents. Whereas in hybrids, days
to 50% flowering, days to 75% maturity, plant height, secondary branches per
plant, harvest index and seed protein, exhibited positive direct effect and
positive association on seed yield.
In parents, the character primary branches per plant followed by
secondary branches per plant, seeds per pod and harvest index had negative
direct influence on seed yield but they had significant and positive association
with seed yield. In hybrids, similar results were observed for primary branches

per plant, seeds per pod and 100-seed weight. This may be due to their high
positive indirect contribution via pod per plant except for 100-seed weight.
Hence, the indirect effects of most of the characters were found positive and
high via pods per plant both in parents and hybrids.
The genotypic residual effect was 0.0047 in parents and 0.0197 in
hybrids, while phenotypic residual effects were 0.0094 and 0.0187 in parents
and hybrids, respectively. Here, the residual effects observed were very low,
indicating that the characters not included in the present study exert
insignificant effect on seed yield. It is assumed that the causal system
visualized in path taken into account factors involved in determining the end
product. Since, the determination of such product is very complex, it is not
obviously possible to have a complete path diagram. This warrants the
inclusion of residual path in the analysis.

Chapter – V
Summary & Conclusions

Chapter - V
SUMMARY AND CONCLUSIONS
The present investigation entitled "Combining ability and heterosis
studies in CGMS based hybrids of pigeonpea (Cajanus cajan (L.) Millsp)" was
undertaken to study the nature and magnitude of gene action, combining ability
of parents and hybrids, extent of heterosis, variability parameters correlations
between yield and yield components and direct and indirect effects of yield
contributing traits on seed yield. The experiment was carried out in
Randomized Block Design with three replications during Kharif, 2016 with
five lines viz., ICPB-2078, ICPB-2043, ICPB-2047, ICPB-2048 and ICPB-
2092, four testers viz., ICPL-87119, ICPL-20108, ICPL-20116 and ICPL-
20123 and their 20 hybrids of pigeonpea obtained by L x T mating design
along with a standard check (Maruti) at ICRISAT, Hyderabad, Telangana.
Data was collected on days to 50% flowering, days to 75% maturity, plant
height, primary branches per plant, secondary branches per plant, pods per
plant, seeds per pod, 100-seed weight, harvest index, seed protein and seed
yield per plant.
An overall view of mean performance of parents revealed that the no
single genotype was superior in respect of all the traits studied. However,
among the lines, ICPB-2078 and ICPB-2043 were found to be the best for
earliness, while ICPB-2047 was found promising for seed yield and other yield
contributing characters except 100-seed weight. Among the testers, ICPL-
87119 emerged as the best for days to 50% flowering, days to 75% maturity,
plant height, pods per plant, 100-seed weight, harvest index and seed yield per
plant, which can be utilised in the breeding programmes.
The genotypic co-efficient of variation (GCV) and phenotypic co-
efficient of variation (PCV) were high for secondary branches per plant, pods
per plant, harvest index and seed yield per plant both in parents and hybrids.
Heritability (broad sense) estimates were high for all the characters except seed

protein and 100-seed weight both in parents and hybrids. Genetic advance as
per cent of mean was high for primary branches per plant, secondary branches
per plant, pods per plant, harvest index and seed yield per plant in both parents
and hybrids. High GCV and PCV, heritability and genetic advance as per cent
mean were observed for the characters secondary branches per plant, pods per
plant, harvest index and seed yield per plant both in parents and hybrids,
indicating these characters are under the control of additive genetic variance.
Hence, simple directional selection could be effective for improving these
characters.
The analysis of variance revealed considerable genotypic variation
among the parents and hybrids for all the characters. The magnitude of
heterosis expressed by the hybrids for 11 characters varied among themselves.
The magnitude of standard heterosis was high for secondary branches per
plant, pods per plant, harvest index and seed yield per plant, whereas for seeds
per pod and days to 75% maturity it was very low. Out of 20 hybrids, the
hybrids viz., ICPA- 2092 x ICPL-20108, ICPA-2047 x ICPL-20108, ICPA-
2047 x ICPL-20116 and ICPA-2047 x ICPL-20123 had recorded significant
and maximum heterosis for most of the characters.
Studies on heterosis suggested that higher and significant heterosis was
contributed through characters studied except days to 75% maturity, days to
50% flowering, primary branches per plant, seeds per pod, 100-seed weight
and seed protein in ICPA-2092 x ICPL-20108, ICPA-2047 x ICPL-20108 and
ICPA-2047 x ICPL-20116 and through the traits except days to 75% maturity,
days to 50% flowering, primary branches per plant, 100-seed weight and seed
protein in ICPA-2047 x ICPL-20123. Hence, significant positive heterosis
observed for seed yield per plant was mainly due to the manifestation of
heterosis for its component characters viz., plant height, secondary branches
per plant, pods per plant and harvest index. This would clearly indicate that
heterosis for seed yield was through heterosis for individual component
characters.

Analysis of variance for combining ability revealed that presence of
considerable variability for majority of characters among the lines than in
testers and substantial variability for most of characters among hybrids. High
and significant variances due to line x tester interaction components indicated
differential behaviour of lines with testers across the characters.
The proportional contribution of lines, testers and line x tester
interaction towards total variation in hybrids indicated the contribution of lines
towards total variation was maximum in respect of days to 50% flowering,
days to 75% maturity, primary branches per plant. Plant height, secondary
branches per plant, pods per plant, seeds per pod, harvest index, seed protein
and seed yield per plant, which were contributed highly by the line x tester
interaction.
Predominance of non-additive gene action for all the characters was
noticed from the ratio of gca / sca variance suggesting that there is a good
scope for heterotic breeding. The ratio of variance due to additive and
dominance components indicated the predominance of dominant gene action in
the genetic control of all the characters.
Based on per se performance and gca effects, the parents ICPB-2078
and ICPB-2043 was the best general combiners for days to 50% flowering and
days to 75% maturity, while ICPB-2047 for plant height, primary branches per
plant, secondary branches per plant, seeds per pod, harvest index and seed
yield per plant. ICPB-2092, ICPB-2078 and ICPB-20123 were the promising
parents for pods per plant, 100-seed weight and seed protein. Based on sca
effects, per se performance and heterosis, the hybrids viz., ICPA-2092 x ICPL-
87119 and ICPA-2092 x ICPL-20108 were identified as the best specific
hybrids for hybrid breeding programme, while the hybrids ICPA-2092 x ICPL-
20123, ICPA-2048 x ICPL-20116, ICPA-2078 x ICPL-20108, ICPA-2043 x
ICPL-87119, ICPA-2048 x ICPL-20108, ICPA-2092 x ICPL-20116, ICPA-
2092 x ICPL-87119, ICPA-2078 x ICPL-87119, ICPA-2047 x ICPL-87119,

ICPA-2043 x ICPL-20108 and ICPA-2047 x ICPL-20123 were identified for
advancing through recombination breeding programme.
Character association studies revealed that selection based on all the
characters except secondary branches per plant, seed protein, 100-seed weight
in parents and seed protein, 100-seed weight in hybrids will be effective for
bringing improvement in seed yield as they had significant and positive
correlation with seed yield per plant. In parents, inter-se association between
days to 50% flowering with days to 75% maturity; plant height, primary
branches per plant with days to 50% flowering and days to 75% maturity; pods
per plant, seeds per pod with plant height, days to 75% maturity and days to
50% flowering with primary branches per plant; harvest index with days to
50% flowering and pods per plant was significant positive among themselves
in both the parents and hybrids, whereas the association between character pair
secondary branches per plant with pods per plant was positive non-significant
in parents become significant positive in hybrids. Positive non-significant
association of harvest index with seed protein and seed protein with primary
branches per plant in parents became negative non-significant in hybrids.
Negative non-significant association of 100-seed weight with days to 75%
maturity in parents became Positive non-significant in hybrids. These changes
in correlations between pairs of characters from parents to hybrids might have
resulted due to the modifications in the linkages as a result of re-combinations
in those populations. Thus simultaneous selection for one trait brings
considerable improvement in another trait and finally seed yield.
Path coefficient analysis indicated a direct selection for pods per plant
would be effective due to high positive direct effect on seed yield. In parents,
though 100-seed weight had positive direct effects, it had recorded negative
correlation with seed yield which may be due to indirect effects mainly via
pods per plant in parents. Days to 50% flowering, days to 75% maturity, plant
height, secondary branches per plant, harvest index and seed protein, exhibited
positive direct effect and positive association on seed yield. Hence direct and

indirect effects of pods per plant on seed yield indicated that the selection for
pods per plant will be effective in the improvement of seed yield.
Based on the study, it is suggested that inter-mating of superior
segregants followed by recurrent selection or multiple crossing in a judicious
approach would be rewarding to harness both additive and non-additive gene
effects in the present set of biological material. The transgressive segregants
produced as a result of this will lead to the development of desirable high
yielding genotypes of pigeonpea.

Literature Cited

LITERATURE CITED
Achamma oommen, Namboodiri, K.M.N and Vijayakumar, N.K. 1996.
Combining ability in pigeonpea (Cajanus cajan (L.) Millsp). Journal of
Tropical Agriculture. 34:1, 1-5.
Aher, G.U., Madrap, I.A., Tike, M.A and Gore, D.R. 2006. Heterosis and
inbreeding depression in pigeonpea. Journal of Maharashtra
Agricultural Universities. 31(1): 33-37.
Aher, R.P., Shinde, G.C and Kute, N.S. 1996. Genetic variability in pigeonpea.
Journal of Maharashtra Agricultural Universities. 21: 482-483.
Aher, R.P., Thombre, B.B and Dahat, D.V. 1998. Genetic variability and
character association in pigeonpea. Legume Research. 21: 41-44.
Ajay Kumar, Srivastava, D.P., Singh, I.P and Dixit, G.P. 2001. Combining
ability analysis of male sterile lines and hybrids in pigeonpea. Legume
Research. 24:3, 178-181.
Ajay, B.C., Byregowda, M., Babu, H.P., Kumar, G.N.V and Reena M. 2014.
Variability and transgressive segregation for yield and yield
contributing traits in pigeonpea crosses. Electronic Journal of Plant
Breeding. 5(4): 786-791.
Ajay, B.C., Byregowda, M., Kumar, G.N.V., Reena, M., Babu, H.P and
Ganapathy, K.N. 2015. Heterosis and inbreeding depression for yield
attributing characters in F2 and F3 generations of pigeonpea. The
National Academy of Science. 38 (2): 179-181.
Allard, R.W. 1960. Principles of Plant Breeding. John Wiley and Sons Inc.
New York. pp:485.
Anantharaju, P and Muthiah, A.R. 2008. Studies on genetic variability in F2
population of pigeonpea. Madras Agricultural Journal. 95(7-12): 431-
436.
Angadi, S.P., Kulkami, R.S and Rao, M.R.G. 1988. Note on character
association and path analysis in pigeonpea (Cajanus cajan (L.) Millsp).
Legume Research. 11:2, 99-100.
Anuradha B., Koteswara Rao, Y., Rama Kumar P.V and Srinivas Rao, V.
2007. Correlation and path analyses for seed yield and yield
contributing characters in pigeonpea (Cajanus cajan (L.) Millsp). The
Andhra Agricultural Journal. 54(1&2): 9-12.
Arbad, S.K., Deosarkar D.B and Kothimbire S.S. 2014. Correlation and path
analysis for grain yield and its attributing traits in pigeonpea. Bioinfelt.
11 (1B): 237-241.

Arbad, S.K., Madrap, I.A and Kawre, P. 2013. Studies on characters
association and path analysis for seed yield and its components in
pigeonpea. International Journal of Plant Sciences. 8(1): 137-139.
Arunachalam, V. 1976. The utility of covariance of combining ability in plant
breeding. Theoretical and Applied Genetics. 47: 303-306.
Asawa, B.M., Chandra, R.K and Pandey, R.L. 1981. Character correlations and
divergence in pigeonpea. Indian Journal of Agricultural Sciences. 51:
12-17.
Bainiwal, C.R and Jatasra, D.S. 1981. Studies on variability and correlations in
pigeonpea. Indian Journal of Agricultural Research. 15(3): 161-165.
Balakrishnan and Natarajaratnam. 1989. Association of yield attributes in
pigeonpea. Madras Agricultural Journal. 176(6): 348-350.
Balyan, H.S and Sudhakar, M.V. 1985. Variability, character association and
path coefficient studies on genotypes of early maturity group in
pigeonpea (Cajanus cajan (L.) Millsp.). Madras Agriuuliural Journal.
72:168-12.
Banu, M.R., Muthaiah, A.R and Ashok, S. 2007. Heterosis studies in
pigeonpea. Advances in Plant Sciences. 20 (1): 37-38.
Basavarajaiah, D., Byre Gowda, M., Kulakarni, R.S and Ramesh, S. 1999.
Character association and path coefficient analysis in pigeonpea. Crop
Research. 17: 386-389.
Baskaran, K and Muthiah, A.R. 2007. Associations between yield and yield
attributes in pigeonpea (Cajanus cajan (L.) Millsp). Legume Research.
30 (1): 64-66.
Bhadru, D. 2010. Studies on genetic parameters and interrelationships among
yield and yield contributing traits in pigeonpea (Cajanus cajan (L.)
Millsp). Legume Research. 33(1): 23-27.
Bharadwaj, D.N and Gupta, P. 2004. Associations of yield and quality
contributing parameters in pigeonpea. Farm Science Journal. 13: 2,
133-135.
Bharathi Mudaraddi and Saxena K.B. 2013. Character association between
seed yield and component traits among CMS-based pigeonpea hybrids.
Electronic Journal of Plant Breeding. 4(1): 1086-1089.
Bhongale, A.T and Raut, R.S. 1987. Genetic variability, correlation among
different lines of pigeonpea. PKV Research Journal. 11(2): 123-126.
Birhan. 2013. Correlation and path analysis in pigeonpea (Cajanus cajan (L.)
Millsp.). Indian Journal of Agricultural Research. 47(5): 441-444.

Bitzer, M.J., Fonesca, S., Papathanasiou, G and Patterson, F.L. I968. Coined
the term "Heterobeltiosis" (Cited by Fonesca S and Patterson F L 1968).
Burton, G.W. 1952. Quantitative inheritance in grasses. Proceedings of Sixth
International Grassland Congress. 1:277-283.
Chandirakala, R and Raveendran, T.S. 1998. Studies on association and path
analysis in pigeonpea. Indian Journal of Agricultural Research. 32(3):
211-216.
Chandirakala, R and Raveendran, T.S. 2002. Heterosis in pigeonpea. Annals of
Agricultural Research. 23(2): 304-308.
Chandirakala, R., Subbaraman, N and Hameed, A. 2010. Heterosis for yield in
pigeonpea [Cajanus cajan (L.) Millsp.]. Electronic Journal of Plant
Breeding. 1 (2): 205208.
Chattopadyay, K and Dhiman, K.R. 2005. Characterization, variability,
diversity and path coefficient analysis of pigeonpea germplasm from
north-east India under rainfed upland condition in Tripura. Legume
Research. 28(2): 140-142.
Chaudhary, V.P., Makne, V.G and Chopde, P.R. 1980. Diallel analysis in
pigeonpea. Indian Journal of Agricultural Sciences. 50: 388-390.
Dahat, D.V., Deshmukh, R.B and Patil, J.V. 1997. Genetic variability and
character association in pigeonpea grown as sole and intercrop in pearl
millet. Indian Journal of Agricultural Research. 31: 82-86.
Das, A.M., Biswas, K and Dasgupta, T. 2007. Association between yield and
yield components in short duration pigeonpea [Cajanus cajan (L.)
Millsp.]. Indian Agriculture. 51 (3&4): 173-176.
Deshmukh, R.B., Rodge, R.G., Patil, J.V and Sahane, D.V. 2000. Genetic
variability and character association in pigeonpea under different
cropping systems. Journal of Maharashtra Agricultural Universities.
25(2): 176-178.
Devi, S.R., Prasanthi, L., Reddy, K.H.P and Reddy, B.V.B. 2012. Studies on
interrelationships of yield and its attributes and path analysis in
pigeonpea (Cajanus cajan (L.) Millsp.). Legume Research. 35(3): 207-
213.
Dewey, D.R and Lu, K.H. 1959. A correlation path coefficient analysis of
components of crested wheat grass. Agronomy Journal. 51: 515-518.
Dhameliya, H.R and Pathak, A.R and Zaveri, P.P. 1994. Genetic analysis of
heterogeneous population in pigeonpea (Cajanus cajan (L.) Millsp).
Gujarat Agricultural University Research Journal. 20: 1, 46-51.

Dhameliya, H.R and Pathak, A.R. 1994. Correlation studies in segregating
generations of pigeonpea. International Chickpea and Pigeonpea
Newsletter. pp: 30-32.
Dheva, N.G., Patil, A.N and Wanjari, K.B. 2008. Heterosis for economic
characters in CGMS based hybrids of pigeonpea. Annals of Plant
Physiology. 22 (2): 231234.
Dodake, S.S., Patil, B.B., Gare, B.N and Burli, A.V. 2009. Genetic variability
and correlation studies in pigeonpea under sub-montane zone of
Maharashtra. Journal of Maharastra Agricultural Universities. 34(2):
144-146.
Dumbre, A.D., Deshmukh, R.B and Patil, J.V. 1985. Path analysis in
pigeonpea. Leguma Research. 8(1): 37-38.
FAO. 2009. FAO-Quarterly Bulletin of Statistics. Food and Agricultural
Organization of United Nations, Rome.
Firoz Mahamad, Gowda, M.B and Girish, G. 2006. Genetic variability and
association studies in vegetable pigeonpea. Environment and Ecology.
245: Special 4, 1124-1129.
Fisher, R.A and Yates, F. 1967. Statistical tables for biological, agricultural
and medical research. Oliver and Boyd Ltd., Edinburgh. 46-63.
Fonesca, S and Patterson, F.L. 1968. Hybrid Vigour in seven parent diallel in
common wheat (T. aestivum L.). Crop Science. 8: 85-88.
Gangwar, L.K and Bajpai, G.C. 2006. Seed protein relationship in interspecific
populations in genus Cajanus. . Indian Journal of Pulses Research. 19:
2, 250.
Ghodke, M.K., Makne, V.G., Jahagirdar, J.E and Khapre, P.R. 1994.
Heritability and genetic advance in pigeonpea under three cropping
systems. Journal of Maharashtra Agricultural Universities. 19: 278-
279.
Gite, U.K., Madrap, I.A., Patil, D.K and Kamble, K.R. 2014. Exploitation of
heterosis in CMS based hybrids in pigeonpea (Cajanus cajan (L.)
Millsp.). Journal of Agriculture Research & Technology. 39(1): 138-
140.
Gohil, R.H. 2006. Genetic divergence and variability in pigeonpea. Research
on Crops. 7(3): 748-750.
Grafius, J.E. 1956. Components in oats. A geometrical interpretation.
Agronomy Journal. 48: 419-423.

Gumber, R.K., Sarvjeet Singh and Sandhu, T.S. 1996. Association of seed
yield with different phases of the reproductive period in pigeonpea.
Indian Journal of Genetics and Plant Breeding. 56(3): 318-322.
Gupta, D.K., Acharya, S. and Patel, J.B. 2011. Combining ability and heterosis
studies in pigeonpea using A2 cytoplasm from Cajanus scarabaeoides
as source of male sterility. Journal of Food Legumes 24(1): 58-64.
Gupta, S.C., Reddy, L.J and Faris, D.G. 1983. Early maturity pigeonpea
hybrids. International Pigeonpea Newsletters. 2: 19-20.
Hamid, A., Husna, A., Haque, M.M and Islam, M.R. 2011. Genetic variability
in pigeonpea (Cajanus cajan (L.) Millsp.). Electronic Journal of Plant
Breeding. 2(1): 117-123.
Hooda, J.S., Tomer, Y.S., Singh, V.P and Singh, S. 1999. Heterosis and
inbreeding depression in pigeonpea (Cajanus cajan (L.) Millsp).
Legume Research. 22(1): 62-64.
Jaggal, L.G., Patil, B.R., Nadaf, H.L., Talikoti, M.M., Jakkeral, S.A and Naik,
P.M. 2012. Studies on genetic characteristics of pigeonpea minicore
collection. Crop Improvement. 39(2): 146-153.
Jagshoran. 1983. Studies on genetic variability for some quantitative characters
in pigeonpea. Madras Agricultural Journal. 70(1): 146-148.
Jagshoran. 1985. Genetic variability for some quantitative characters in
pigeonpea. International Pigeonpea Newsletter. 4: 13-15.
Jahagirdar, J.E. 2003. Line x Tester analysis for combining ability in
pigeonpea. Indian Journal of Pulses Research. 16:1, 17-19.
Jayamala, P and Rathnaswamy, R. 2000. Combining ability in pigeonpea.
Madras Agricultural Journal. 87: 7/9,418-422.
Jogendra Singh, Bhadana, V.P and Shiv Datt. 2008. Correlation and path
coefficient analysis among yield and its contributing traits in pigeonpea
(Cajanus cajan (L.) Millsp). Environment and Ecology. 26(3A): 1396-
1399.
Johnson, H.W., Robinson, H.O and Comstock, R.E. 1955. Estimates of genetic
and environmental variability in soybean. Agronomy Journal. 47: 314-
318.
Kalaimagal, T., Amala Balu, P and Sumathi, P. 2008. Genetic studies in
segregating populations of pigeonpea. Crop improvement. 35(1): 31-34.
Kempthorne, O. 1957. An Introduction to Genetic Statistics. John Wiley and
Sons, Inc., New York. 222-240.
Khapre, P,R„ Pawar, D.T., Misal, V.M and Chavan, K.M. 1993. Genetic
variability, correlation and path coefficient analysis in newly developed

strains of pigeonpea. Journal of Maharashtra Agricultural Universities.
18(3): 494-496.
Khapre, P.R and Nerker, Y.S. 1992. Genetic variability and character
association in pigeonpea under different cropping systems. Journal of
Maharashtra Agricultural Universities. 17: 445-448.
Khorgade, P.N., Wankhade, R.R and Satange, I.V. 2000a. Heterosis studies in
pigeonpea hybrids based on male sterile lines. Indian Journal of
Agricultural Sciences. 34: 168-171.
Khorgade, P.W., Wankhade, R.R and Wanjari, K.B. 2000b. Combining ability
analysis in pigeonpea using male sterile lines. Indian Journal of
Agricultural Research. 34(2): 112-116.
Kingshlin, M and Subbaraman, N. 1997. Character association and path
analysis in pigeonpea (Cajanus cajan (L). Millsp). Legume Research.
20(3/4): 175-178.
Kingshlin, M and Subbaraman, N. 1999. Correlation and path coefficient
analysis among quantitative characters in pigeonpea. Crop Research.
20(2): 151-154.
Konwar, B.K and Hozarika, M.H. 1988. Genetic variability in pigeonpea. Crop
Improvement. 15: 98-100.
Kothimbire, S.S., Arbad, S.K. and Choulwar. S.B. 2015. Characters association
and path analysis for seed yield and its components in pigeonpea
(Cajanus cajan (L.) Millsp.). Trends in Biosciences. 8(6): 1556-1559.
Kumar, S., Debnath, M.K., Kumar, C.V.S., Singh, P.K and Sultana, R. 2015.
Study of heterosis and pollen fertility in CGMS based pigeonpea
(Cajanus cajan (L.) Millsp.) hybrids. Research in Environment and Life
Sciences. 9 (1): 107-110.
Kumar, S., Kumar, S., Singh, S.S., Elanchezhian, R and Shivani. 2014. Studies
on genetic variability and inter-relationship among yield contributing
characters in pigeonpea grown under rainfed lowland of eastern region
of India. Journal of Food Legumes. 27(2): 104-107.
Lakhote, S.J., Patil, H.E., Mali, R.A and Ingle P. 2015. Genetic analysis for
yield and yield contributing traits in vegetable type genotypes in
pigeonpea (Cajanus cajan (L.) Millsp.). International Journal of
Tropical Agriculture. 33 (2): 161-167.
Lenka, D and Mishra, B. 1973. Path coefficient analysis of yield in rice
varieties. Indian Journal of Agricultural Science. 43: 376-379.
Linge, S.S., Kalpande, H.V., Sawargaonkar, B.V., Hudge, B.V and Thanki,
H.P. 2010. Study of genetic variability and correlation in inter specific

derivatives of pigeonpea [Cajanus cajan (L) Millsp.]. Electronic
Journal of Plant Breeding. 1(4): 929-935.
Lohithaswa, H.C and Dharmaraj, P.S. 2003. Implications of heterosis,
combining ability and per se performance in pigeonpea. Karnataka
Journal of Agricultural Sciences. 16(3): 403-407.
Lowry, O.H., Rosebrough, N.J., Farr, A.L and Randall, R.J. 1951. Protein
measurement with the folin phenol reagent. Journal of Biological
Chemistry. 193: 265-276.
Lush, J.L, 1940. Intra-sire correlation on regression of offspring on dams as a
method of estimating heritability characters. Proceedings of American
Society of Animal Production. 33: 298-330.
Magar, M.N. 2003. Genetic variability, path analysis and genetic diversity in
pigeonpea (Cajanus cajan (L.) Millsp.). M.Sc (Ag) Thesis submitted to
MPKV, Rahuri.
Mahajan, V., Shukla, S.K., Tiwari, V., Prasad, S.V.S and Gupta, H.S.2007.
Path analysis in pigeonpea (Cajanus cajan (L.) Millsp.) in mid-altitudes
of north-western Himalayas. Crop Improvement. 34: 1, 56-58.
Manivel, P., Rangaswamy, P and Samdur, M.P. 1999. Heterosis studies
involving genetic male sterile lines of pigeonpea. Crop Research. 18:
240-242.
Marekar, R.V and Nerker, Y.S. 1987. Correlation and path analysis in F1
generation of pigeonpea. PKV Research Journal. 11(1): 1-6.
Mehetre, S.S., Deshmukh, R.B., Rodge, R.C and Karale, M.U. 1993. Heterosis
in pigeonpea (Cajanus cajan (L.) Millsp). Legume research. 16(2): 67-
70.
Mehetre, S.S., Sonone, A.H., Deshmukh, R.B and Karale, M.U. 1988.
Combining ability in pigeonpea. Legume research. 11(2): 81-84.
Meshram, M.P. Patil, A.N. and Kharkar, A. 2013. Combining Ability Analysis
in Medium Duration CGMS Based Hybrid Pigeonpea (Cajanus cajan
(L.) Millsp.). Journal of Food Legumes 26(3 & 4): 29-33.
Mhasal, G.S., Marawar, M.W., Solanke, A.C and Tayade, S.D. 2015. Heterosis
and combining ability studies in medium duration pigeonpea F1 hybrids.
Journal of Agricultural Research. 53(1): 11-22.
Mittal, V.P., Brar, K.S and Paramjit Singh. 2006. Identification of component
traits contributing to seed yield in pigeonpea (Cajanus cajan (L.)
Millsp). Journal of Arid Legumes. 3(2): 66-67.

Mittal, V.P., Singh, Pand Brar, K.S. 2010. Character association and path
coefficient analysis for yield components in pigeonpea, Cajanus cajan
(L.). Madras Agricultural Journal. 97(10-12): 319-320.
Muntzing, A. 1945. Hybrid vigour in crosses between purelines of Galeopsis
tetrahit. Hereditas Lund. 31: 391-398.
Musaana, M.S and Nahdy, M.S. 1998. Path coefficient analysis of yield and its
components in pigeonpea.. African Crop Science Journal. 6(2): 143-
148.
Nag, Y.K and Sharma, R.N. 2012. Genetic diversity and path coefficient
analysis in pigeonpea (Cajanus cajan (L.) Millsp.) germplasm
accessions of Bastar origin. Electronic Journal of Plant Breeding. 3(2):
818-824.
Nagy, K., Sharma, R.N., Nandah, C and Kanwer S.S. 2013. Genetic variability
and association studies among yield attributes in pigeonpea (Cajanus
cajan (L.) Millsp.) accessions of Bastar. The Ecoscan. 4: 267-271.
Narladkar, V.W and Khapre, P.R. 1994. Heterosis in pigeonpea. Journal of
Maharastra Agricultural Universities. 19(3): 378-381.
Narladkar, V.W and Khapre, P.R. 1996. Heterosis for yield and yield
components in pigeonpea. Annals of Agricultural Research. 17(1): 100-
103.
Natarajan, C, Thyagarajan, K and Ayymperumal, A. 1990. Genetic variability,
correlation and path analysis in pigeonpea. Madras Agricultural
Journal. 77: 378-381.
Nethravathi, K.H. and Patil, B.R. 2014. Character association and path
coefficient analysis for yield and its components in pigeonpea.
Karnataka J. Agric. Sci. 27 (2): 225-226.
Pahwa, K., Ghai, N., Kaur, J and Singh, S. 2013. Relative efficiency of
different selection indices for grain yield in pigeonpea (Cajanus cajan
(L.) Millsp.). Journal of Plant Science Research. 29(2): 159-163.
Pal, B.P. 1945. Studies in hybrid vigour 1. Notes on hybrid vigour in gram,
sesamum, chilli and maize. Indian Journal of Genetics and Plant
Breeding. 5: 106-121.
Pandey, N and Singh, N.B. 2002. Hybrid vigour and combining ability in long
duration pigeonpea (Cajanus cajan (L.) Millsp) hybrids involving male
sterile lines. Indian Journal of Genetics and Plant Breeding. 62(3): 221-
225.
Pandey, N. 1999. Heterosis and combining ability in pigeonpea. Legume
Research. 22(3): 147-151.

Pandey, N. 2004. Line x tester analysis in long duration hybrid pigeonpea.
Legume Research. 27(2): 79-87.
Pandey, P., Kumar, R and Pandey, V.R. 2015. Genetic studies for quantitative
traits in pigeonpea (Cajanus cajan (L.) Millsp.). Research on Crops.16
(1): 154-161.
Pandey, P., Kumar, R. and Pandey, V.R. 2016. Genetic association studies for
yield and yield related traits in pigeonpea (Cajanus cajan (L.) Millsp.).
Legume Research. 39(2): 189-193.
Pandey, P., Kumar, R., Pandey, V.R., Jaiswal, K.K and Tripathi, M. 2013.
Studies on heterosis for yield and its component traits on CGMS based
pigeonpea (Cajanus cajan (L.) Millsp.) hybrids. International Journal
of Agricultural Research. 8(4): 158-171.
Pankaja Reddy, R., Vidyasagar Rao, K and Rao, G.P. 1979. Heterosis and
combining ability in pigeonpea. Indian Journal of Genetics and Plant
Breeding. 39(2): 240-246.
Pansuriya, A.G., Pandya, H.M and Kathiria, K.B. 1998. Genetic variability and
correlation in early maturing genotypes of pigeonpea. Gujarat
Agricultural University Research Journal. 23: 23-27.
Parmar, R.K., Tikle, A.N. and Kandalker. V.S. 2012. Combining ability studies
in pigeonpea (Cajanus cajan (L.) Millsp.) hybrids. Journal of Food
Legumes 25(3): 231-234.
Patel, D.B. 1985. Heterosis and combining ability in pigeonpea (Cajanus cajan
(L.) Millsp). M.Sc. (Ag.) Thesis, Gujarat Agricultural University, Sardar
Krishninagar, Gujarat, India.
Patel, G.V. 1988. Evaluation of some pigeonpea genotypes for combining
ability and heterosis using male-sterile lines. M.Sc. (Ag.) Thesis
submitted to Gujarat Agricultural University, S.K. Nagar.
Patel, G.V., Zaveri, P.O and Pathak, A.R. 1992. Combining ability analysis of
parents and hybrids using genetic male sterility in pigeonpea. Indian
Journal of Genetics and Plant Breeding. 52: 292-296.
Patel, J. B and Acharya, S. 2011. Genetic divergence and character association
in Indo-African derivatives of pigeonpea (Cajanus cajan (L.) Millsp.).
Journal of Food Legumes. 24(3): 198-201.
Patel, K.N and Patel, D.R. 1998. Studies on genetic variability in pigeonpea.
International Chickpea and Pigeonpea Newsletter. 5: 28-30.
Patel, M.P and Tikka, S.B.S. 2008. Heterosis for yield and yield components in
pigeonpea. Journal of Food Legumes. 21(1): 65-66.

Patel, M.P., Tikka, S.B.S., Patel, C.G and Gami, R.A. 2010. Combining ability
analysis to identify superior male sterile and pollinator lines in
pigeonpea. Green Farming. 1(5): 444-446.
Patel, P.T and Tikka, S.B.S. 2014. Hybrid vigor in cytoplasmic geneic male
sterility system based hybrids for seed yield and its associated traits in
pigeonpea (Cajanus cajan (L.) Millsp.). Indian Journal of Genetics and
Plant Breeding. 74(2): 257-260.
Patel, P.T. and Tikka, S.B.S. 2015. Combining ability of CMS lines and pollen
fertility restorers in pigeonpea (Cajanus cajan (L.) Millsp.). Journal of
Food Legumes 28(1): 11-25.
Patil, H.S., Nakhede, B.N and Deokar, A.B. 1989. Genetic parameters,
character association and path analysis in pigeonpea. Journal of
Maharashtra Agricultural Universities. 14: 54-56.
Patil, S.B., Hingane, A.J., Sameer Kumar, C.V., Mula Myer, R., Vijaya Kumar
and Saxena, K.B. 2015. Combining ability studies of pigeonpea CGMS
lines with an obcordate leaf Marker. Journal of Food Legumes 28(2): 7-
12.
Patil, S.S., Nizama, J.R., Botve, R.R and Patel, S.R. 2014. An investigation of
heterobeltiosis for seed yield and its components with protein content in
pigeonpea (Cajanus cajan (L.) Millsp.). Trends in Bioscience. 7(8):
609-611.
Paul, P.R., Singh, R.M., Nandan, R and Raina, R. 1996. Character association
and path coefficient analysis in hybrid pigeonpea. Madras Agricultural
Journal. 83(1): 34-37.
Paul, S.K and Upadhaya, L.P. 1991. Interrelationship between yield and yield
contributing characters in pigeonpea (Cajanus cajan (L.) Millsp).
International Journal of Tropical Agriculture. IX(2): 135-140.
Phad, D.S, Madrap, I.A and Dalvi, V.A. 2009. Heterosis in relation to
combining ability effects and phenotypic stability in pigeonpea. Journal
of Food Legumes. 22(1): 59-61.
Phad, D.S., Madrap, I.A. and Dalvi, V.A. 2007. Study of combining ability
analysis in pigeonpea under different environments for yield
contributing characters. Legume Research. 30(2): 123-127.
Prakash, N.B. 2011. Genetic divergence based on metric and physiological
traits in pigeonpea [Cajanus cajan (L.) Millsp.]. M.Sc Thesis. Acharya
N G Ranga Agricultural University, Andhra Pradesh, India.
Prasad, Y., Kumar, K and Mishra, S.B. 2013. Studies on genetic parameters
and interrelationships among yield and yield contributing traits in
pigeonpea (Cajanus cajan (L.) Millsp.). The Bioscan. 8(1): 207-211.

Raju, P.A and Muthiah, A.R. 2007. Heterosis and combining ability for
quantitative and qualitative traits in pigeonpea. (Cajanus cajan (L.)
Millsp). Research on Crops. 8(3): 625-631.
Ram, K., Saxena, K., Shrimali Tushar, M and Geeta, B. 2016. A Study on
genetic variability, correlation and path analysis in pigeon pea (Cajanus
cajan (L.) Millsp). International Journal of Agriculture Sciences. 8(51):
2287-2289.
Rana, S.G. 1990. Analysis of genetic variation, heterosis and maintenance of
male sterile lines in pigeonpea (Cajanus cajan (L.) Millsp). M.Sc. (Ag.)
Thesis, Gujarat Agricultural University, Sardar Krishninagar, Gujarat,
India.
Rangare, N.R., Reddy, G.E and Kumar, S.R. 2013. Study of heritability,
genetic advance and variability for yield contributing characters in
pigeonpea (Cajanus cajan (L.) Millsp.). Trends in Biosciences. 6(5):
660-662.
Rao, H.S. 1989. Evaluation of hybrids using genetic male sterility systems in
pigeonpea (Cajanus cajan (L.) Millsp). M. Sc. (Ag.) Thesis, Gujarat
Agricultural University, Sardar Krishninagar, Gujarat, India.
Rao, P.J.M., Malathi, S., Reddy, D.V.V and Upender, M. 2013. Genetic
Studies of Association and Path Coefficient Analysis of Yield and its
Component Traits in Pigeon Pea (Cajanus CajanL. Millsp.).
International Journal of Scientific and Research Publications. 3(8): 1-5.
Rathore, H.K and Sharma, R.N. 2011. Association studies among yield
attributes in erect and semi-spreading pigeonpea (Cjanus cajan (L.)
Millsp.). Elixir Agriculture. 30: 1843-1847.
Reddy, V.G., Jayalakshmi, V. and Sreenivas, T. 2015. Studies on fertility
restoration and extent of heterosis in CMS based pigeonpea hybrids.
Journal of Food Legumes. 28(1): 26-30.
Rekha, R., Prasanthi, L., Reddi, M.S and Priya, M.S. 2013. Variability,
character association and path analysis for yield and yield attributes in
pigeonpea. Electronic Journal of Plant Breeding. 4(4): 1331-1335.
Salunke, J.S., Aher, R.P., Shinde, G.C and Kute, N.S. 1995. Correlation and
path coefficient analysis in early pigeonpea. Legume Research. 18(3/4):
162-166.
Sarode, S.B., Singh, M.N and Singh, U.P. 2009. Heterosis in long duration
pigeonpea (Cajanus cajan (L.) Millsp). International Journal of Plant
Sciences. 4(1): 106-108.
Saroj, S.K., Singh, M.N., Kumar, R., Singh, T and Singh, M.K. 2013. Genetic
variability, correlation and path analysis for yield attributes in
pigeonpea. The Bioscan. 8(3): 941-944.

Satpute, R.G. 1994. Plant population effects on the interrelationship of seed
yield and its components in pigeonpea (Cajanus) genotypes. Legume
Research. 17(2): 96-100.
Sawant, M.N., Sonone, A.H and Anarase, S.A. 2009. Character association,
path coefficient analysis and genetic diversity in pigeonpea. Journal of
Maharashtra Agricultural Universities. 34(2): 134-137.
Sekhar, M.R., Singh, S.P., Mehra, R.B and Govil, J.N. 2004. Combining
ability and heterosis in early maturing pigeonpea (Cajanus cajan (L.)
Millsp) hybrids. Indian Journal of Genetics and Plant Breeding. 64(3):
212-216.
Shoba, D and Balan, A. 2010. Heterosis in CMS/GMS based pigeonpea
(Cajanus cajan (L.) Millisp.) hybrids. Agricultural Science Digest.
30(1): 32-36.
Shull, G.H. 1914. Duplicate genes for capsule form in bursea pastoris
zeitschar Indutiva. Abstammu Vererbungkhra. 12: 97-149.
Sidhu, P.S., Verma, M.M., Cheema, H.S and Sra, S.S. 1985. Genetic
relationships among yield components in pigeonpea. Indian Journal of
Agricultural Sciences. 55(4): 232-235.
Singh, J., Badana V.P and Datt, S. 2008. Correlation and path coefficient
analysis among yield and its contributing traits in pigeonpea.
Environment and Ecology. 26 (3A): 1396-1399.
Singh, J., Fiyaz, R.A., Kumar, S., Ansari, M.A and Gupta, S. 2013. Genetic
variability, correlation and path coefficient analysis for yield and its
attributing traits in pigeonpea (Cajanus cajan (L.) Millsp.) grown under
rainfed conditions of Manipur. Indian Journal of Agricultural Sciences.
83(8): 852-858.
Singh, K. B and Jain, R.P. 1970. Heterosis in mungbean. Indian Journal of
Genetics and Plant Breeding. 30: 244-250.
Singh, KB. 1974. Exploitation of heterosis in pulse crops. Indian Journal of
Genetics and Plant Breeding. 34: 752-756.
Singh, R.K and Chaudhary, B.D. 1977. Biometrical methods in quantitative
genetic analysis. Kalyani Publishers, New Delhi.
Singh, R.S and Singh, M.N. 2016. Heterosis and inbreeding depression for
yield and yield traits in pigeonpea (Cajanus cajan (L.) Millsp.).
Environment & Ecology. 34(1A): 395-399.
Singh, S.P., Govil, J.N and Ram, H .1983. Combining ability and heterosis in
early pigeonpea hybrids. Indian Journal of Genetics and Plant
Breeding. 43: 418-486.

Sinha, S.C. Singh, K.N and Ram Lakhan.1994. Combining ability and
heterosis in pigeonpea. Indian Journal of Pulses Research. 7: 63-65.
Siva Subramanian, P and Menon, P.M. 1973. Genotypic and phenotypic
variability in rice. Madras Agricultural Journal. 60: 1093-1096.
Sodavadiya, P.R., Pithia, M.S., Savaliya, J.J., Pansuriya, A.G and Karat, V.P.
2009. Studies on characters association and path analysis for seed yield
and its components in pigeonpea (Cajanus cajan (L.) Millsp). Legume
Research. 32(3): 203-205.
Solomon, S., Argikar, G.P., Salanki, M.S and Morbad, I.R. 1957. A study of
heterosis in (Cajanus cajan (L.) Millsp). Indian Journal of Genetics. 17
(1): 90-95.
Spargue, G.T and Tatum, L.A. 1942. General vs. Specific combining ability in
single crosses of corn. Journal of American Society of Agronomy. 43:
923-932.
Sreelakshmi, C.H., Kumar, C.V.S and Shivani, D. 2011. Genetic analysis for
yield and its components in hybrid pigeonpea. Electronic Journal of
Plant Breeding. 2(3): 413-416.
Sreelakshmi, Ch., Sameer Kumar, C.V. and Shivani, D. 2010. Genetic analysis
of yield and its component traits in drought tolerant genotypes of
pigeonpea (Cajanus cajan L. Millspaugh). Electronic Journal of Plant
Breeding. 1(6): 1488-1491.
Srinivas, T., Jain, K.C and Reddy, M.S.S. 1998. Combining ability studies of
medium and long duration pigeonpea. (Cajanus cajan (L.) Millsp).
Annals Agricultural Research. 19(3): 299-303.
Srinivas, T., Jain, K.C., Reddy, M.V and Reddy, M.S.S. 1999. Genetic
relationships among yield components in pigeonpea. Indian Journal of
Pulses Research. 12(2): 180-186.
Srivastava, J.P., Singh, H.N and Singh, S.P. 1972. Genetic Studies on yield
components in pea (Pisum sativum (L.) var. arvence Pior). Indian
Journal of Agricultural Sciences. 42: 1001-1004.
Sunilkumar, Lohithaswa, H.C and Dharmaraj, P.S. 2003. Combining ability
analysis for grain yield, protein content and other quantitative traits in
pigeonpea. Journal of Maharastra Agriculntral Universities. 28(2):
141-144.
Takalkar, N.G., Rewak, A.P and Birari, S.P. 1998. Studies on genetic
variability, heritability and genetic advance in early group of pigeonpea.
Annals of Agricultural Research. 19: 117-119.
Tikle, A.N., Sameer Kumar, Vijay Kumar, R. and Saxena, K.B. 2016. Gene
action and combining ability estimates using cytoplasmic-genic male

sterile lines to develop pigeonpea hybrids for rainfed condition.
International Journal of Scientific and Research Publications. 6(1):
2250-3153.
Udensi, O and Ikpeme, E.V. 2012. Correlation and path analysis of seed yield
and its contributing traits in (Cajanus cajan (L.) Millsp.). American
Journal of Experimental Agriculture. 2(3): 351-358.
Venkateswarlu, O. 2001. Genetic variability in pigeonpea (Cajanus cajan (L.)
Millsp). Legume Research. 24(3): 205 - 206.
Vaghela, K.O., Desai, R.T., Nizama, J.R., Patel, J.D and Vishal Sharma. 2009.
Combining ability analysis in pigeonpea (Cajanus cajan (L.) Millsp).
Legume Research. 32(4): 274-277.
Vange, T and Moses, O.E. 2009. Studies on genetic characteristics of
pigeonpea germplasm at Otobi, Benue state of Nigeria. World Journal
of Agricultural Sciences. 5 (6): 714-719.
Vaghela, K.O., Desai, R.T., Nizama, J.R., Patel, J.D and Kodappully, V.C.
2011. Heterosis study for yield components in pigeonpea [Cajanus
cajan (L.) Millsp.]. Crops Research. 12: 192-194.
Vanisree, S., Sreedhar M and Surender Raju, Ch. 2013. Studies on genetic
characteristics of pigeon pea and determination of selection criteria with
path co-efficient analysis. 4(2): 223-226.
Vijayalakshmi, P., Anuradha, Ch., Pavankumar, D., Sreelaxmi, A and
Anuradha, G. 2013. Path Coefficient and Correlation response for Yield
Attributes in Pigeon Pea (Cajanas cajan L.). International Journal of
Scientific and Research Publications. 3(4): 1-6.
Vanisree, S and Sreedhar, M. 2014. Genetic analysis of yield and yield
components and determination of selection criteria in pigeonpea
germplasm. Journal of Food Legumes. 27(1): 68-70.
Wright, S. 1921. Correlation and causation. Journal of Agricultural Sciences.
20: 557-585.
Yadav, A.S., Tank, C.J., Acharya, S and Patel, J.B. 2008. Combining ability
analysis involving Indo-African genotype of pigeonpea. Journal of
Food Legumes. 21(2): 95-98.
Yamanura, Lokesha R., Dharmaraj, P.S., Muniswamy, S. and Diwan, J.R.
2014. Estimation of Heterosis, Combining ability and Gene action in
Pigeonpea (Cajanus cajan (L.) Millsp.). Electronic Journal of Plant
Breeding. 5(2): 173-178.
