combined deletion of id2 and id3 genes reveals multiple...
TRANSCRIPT

of April 17, 2014.This information is current as
ExpansionInvariant NKT Cell Development andReveals Multiple Roles for E Proteins in
GenesId3 and Id2Combined Deletion of
Jia Li, Di Wu, Ning Jiang and Yuan Zhuang
http://www.jimmunol.org/content/191/10/5052doi: 10.4049/jimmunol.1301252October 2013;
2013; 191:5052-5064; Prepublished online 11J Immunol
MaterialSupplementary
2.DC1.htmlhttp://www.jimmunol.org/content/suppl/2013/10/11/jimmunol.130125
Referenceshttp://www.jimmunol.org/content/191/10/5052.full#ref-list-1
, 15 of which you can access for free at: cites 47 articlesThis article
Subscriptionshttp://jimmunol.org/subscriptions
is online at: The Journal of ImmunologyInformation about subscribing to
Permissionshttp://www.aai.org/ji/copyright.htmlSubmit copyright permission requests at:
Email Alertshttp://jimmunol.org/cgi/alerts/etocReceive free email-alerts when new articles cite this article. Sign up at:
Print ISSN: 0022-1767 Online ISSN: 1550-6606. Immunologists, Inc. All rights reserved.Copyright © 2013 by The American Association of9650 Rockville Pike, Bethesda, MD 20814-3994.The American Association of Immunologists, Inc.,
is published twice each month byThe Journal of Immunology
at Univ of T
exas-Austin on A
pril 17, 2014http://w
ww
.jimm
unol.org/D
ownloaded from
at U
niv of Texas-A
ustin on April 17, 2014
http://ww
w.jim
munol.org/
Dow
nloaded from
The Journal of Immunology
Combined Deletion of Id2 and Id3 Genes Reveals MultipleRoles for E Proteins in Invariant NKT Cell Development andExpansion
Jia Li,* Di Wu,†,‡ Ning Jiang,†,‡ and Yuan Zhuang*
The invariant NKT (iNKT) cells represent a unique group of ab T cells that have been classified based on their exclusive usage of
the invariant Va14Ja18 TCRa-chain and their innate-like effector function. Thus far, the transcriptional programs that control
Va14Ja18 TCRa rearrangements and the population size of iNKT cells are still incompletely defined. E protein transcription
factors have been shown to play necessary roles in the development of multiple T cell lineages, including iNKT cells. In this study,
we examined E protein functions in T cell development through combined deletion of genes encoding E protein inhibitors Id2 and
Id3. Deletion of Id2 and Id3 in T cell progenitors resulted in a partial block at the pre-TCR selection checkpoint and a dramatic
increase in numbers of iNKT cells. The increase in iNKT cells is accompanied with a biased rearrangement involving Va14 to
Ja18 recombination at the double-positive stage and enhanced proliferation of iNKT cells. We further demonstrate that a 50%
reduction of E proteins can cause a dramatic switch from iNKT to innate-like gd T cell fate in Id2- and Id3-deficient mice.
Collectively, these findings suggest that Id2- and Id3-mediated inhibition of E proteins controls iNKT development by restricting
lineage choice and population expansion. The Journal of Immunology, 2013, 191: 5052–5064.
Development of T cells in the thymus generates multipletypes of T cells that belong to different lineages, definedprimarily by the types of TCRs they use. The ab T lin-
eage is specified after expression of the pre-TCR composed of theTCRb-chain and the invariant pre–TCRa-chain. These precursorT cells then undergo proliferative expansion before rearranging theTCRa-chain. Upon generation of the ab TCR, most ab T cellsdifferentiate into CD8 cytolytic or CD4 helper lineages based ontheir ability to recognize peptide Ags presented by either the MHCclass I or class II molecules, respectively. A small fraction of abT cells form the NKT cell lineage owing to their TCR selectionby lipid Ags presented by CD1d, an MHC-like molecule (1, 2).NKT cells represent a distinct effector group that is capable ofproviding diverse and fast effector functions and thus is alsoclassified as innate-like T cells (3).A large fraction of NKT cells use a canonical TCRa-chain
resulting from Va14 to Ja18 rearrangement and are thus namedinvariant NKT (iNKT) cells (4). The remaining NKT cells, re-ferred to as type II NKT cells, also show highly restricted Va-Jausages and recognize lipid Ags different from those recognized
by iNKT cells (5–8). iNKT cells share the same developmentalhistory with the rest of ab T cells up to the double-positive (DP
stage) (DP for CD4 and CD8 expression), where the TCRa generearranges. Expression and selection of an appropriate TCRa-
chain at this stage have been shown to provide the driving forcein iNKT cell development (9–11). Most of our understanding ofiNKT lineage development is based on events during and after
TCRa gene expression at the DP stage. It is not entirely clearwhether the highly restricted Va-Ja usage for NKT cells is simply
a result of TCR-mediated selection or additional regulation priorto TCR selection (12, 13).E proteins and their inhibitors Id proteins have been shown to
play important roles at the pre-TCR, the gdTCR, and the abTCRcheckpoints (14, 15). E proteins are basic-HLH motif–containing
transcription factors, which bind E-box DNA sequences as dimers(16). Id proteins inhibit E protein function through competitivedimerization with E proteins, thereby preventing E proteins from
binding to DNA (17). Two E protein genes, E2A and HEB, andtwo Id genes, Id3 and Id2, have been shown to be involved in
producing E proteins and Id proteins, respectively, during T celldevelopment (18). Although removal of a single E protein gene
only resulted in partial defects in T cell development, deletion ofboth E2A and HEB genes in the early stages of T cell developmentresulted in nearly complete block in ab lineage development and
severe impairment in gd lineage development (19). Conditionaldeletion of E2A and HEB at the DP stage with CD4-Cre also
demonstrated an essential role for E proteins in CD4 lineage andiNKT lineage development (20–22). In contrast to E protein geneknockout, deletion of Id3 early in T cell development resulted in
a significant increase in gd lineage T cells (23), although thisincrease is almost exclusively restricted to innate-like gd T cells
expressing the Vg1.1Vd6.3 TCRs (24). The enhanced gd lineagedevelopment has been attributed to elevated levels of E protein
activities because deletion of Id3 and E2A together can correct theinnate gd T phenotype. These genetic studies clearly demonstratedthat E protein dosage plays an important role in influencing the
fate choice between the gd and ab lineages at the pre-TCR and
*Department of Immunology, Duke University Medical Center, Durham, NC 27710;†Department of Biomedical Engineering, The University of Texas at Austin, Austin,TX 78712; and ‡Institute for Cellular and Molecular Biology, The University ofTexas at Austin, Austin, TX 78712
Received for publication May 13, 2013. Accepted for publication September 16,2013.
This work was supported by National Institutes of Health Grants R01GM-059638,R21RR-032742 (to Y.Z.), and K99AG040149 (to N.J.), the Duke University MedicalCenter Bridge Fund (to Y.Z.), Cancer Prevention and Research Institute of TexasGrant R1120 (to N.J.), and by Welch Foundation Research Grant F1785 (to N.J.).
Address correspondence and reprint requests to Prof. Yuan Zhuang, Department ofImmunology, Duke University Medical Center, DUMC-Box 3010, Durham, NC27710. E-mail address: [email protected]
The online version of this article contains supplemental material.
Abbreviations used in this article: CD1dtet, CD1d tetramer; DN, double-negative;DP, double-positive; iNKT, invariant NKT; PLZF, promyelocytic leukemia zinc fin-ger; SP, single-positive.
Copyright� 2013 by TheAmericanAssociation of Immunologists, Inc. 0022-1767/13/$16.00
www.jimmunol.org/cgi/doi/10.4049/jimmunol.1301252
at Univ of T
exas-Austin on A
pril 17, 2014http://w
ww
.jimm
unol.org/D
ownloaded from

gdTCR checkpoints, reminiscent of E protein functions at theabTCR checkpoint (14, 25).Given that Id2 has been shown to collaborate with Id3 in reg-
ulating the TCR checkpoint (22), it is speculated that Id2 couldalso collaborate with Id3 in regulating the pre-TCR and gdTCRcheckpoints. In this study, we used Lck-Cre (26) to delete both Id2and Id3 at the pre-TCR and gdTCR checkpoints. Deletion of bothId2 and Id3 resulted in a partial block at the pre-TCR checkpointand increased production of innate gd T cells, suggesting opposingroles for Id genes in regulating the ab lineage and the innate gdlineage. More importantly, analysis of Id2 and Id3 double-deficientanimals also revealed a novel role for Id2 and Id3 in regulating thedevelopment and expansion of iNKT cells. The mutant mice showeda dramatic increase in numbers of iNKT cells. A biased rearrange-ment involving Va14-Ja18 was detected in preselecting DP cells,indicating a role for Id proteins in regulating Va14-Ja18 rear-rangement prior to CD1d-mediated selection. Results presentedin this study further suggest a dosage-dependent mechanism forId genes in repressing the fate of innate-like gd T cells versusiNKT cells during T cell development.
Materials and MethodsMice
The Lck-Cre transgenic allele (26) and flox alleles for the Id3 (27), Id2(28), E2A (26), and HEB (19) genes have been previously described. Miceused in this study have been maintained on 129/sv and C57BL/6 mixedbackground in a specific pathogen-free facility managed by Duke Uni-versity Division of Laboratory Animal Resources. All procedures havebeen conducted according to protocols approved by the Institutional An-imal Care and Use Committee.
Cell staining and flow cytometry
BrdU staining (BD Biosciences) was performed according to the manu-facturer’s protocol. Intracellular staining was performed after 2% para-formaldehyde fixation and 0.5% saponin permeabilization. Staining forpromyelocytic leukemia zinc finger (PLZF) Ab (provided by Dr. DerekSant’Angelo) was carried out using a Foxp3 staining buffer set (eBio-science). CD1d tetramers (CD1dtet) with or without loaded PBS57 Agwere obtained from the Tetramer Facility of the National Institutes ofHealth. CD1d staining was done in dark for 30 min at room temperaturebefore Ab staining of other cell surface markers. FACS was performed ona FACSCanto II (BD Biosciences). Doublets and dead cells were gated outbefore data analysis. Data were analyzed with FlowJo software (Tree Star).
In vitro OP9-DL1 culture
FACS sorting of double-negative (DN) cells was performed after Dynabeadbiotin binder (Invitrogen) treatment to deplete CD4 single-positive (SP),CD8 SP, and DP cells. The remaining cells were stained with CD44,CD25, TCRb, TCRgd, and CD27 Abs. A mixture of CD4, CD8, Gr-1,Mac-1, B220, and NK1.1 Abs was included in staining as the dumpchannel to eliminate non-T cells and any residual CD4 SP, CD8 SP, andDP cells. Cells were cultured in MEM-a medium (10% FBS, penicillin/streptomycin, and 5 ng/ml IL-7 for all cultures and additional 5 ng/mlFlt3 ligand for the DN3 culture) on OP9-DL1 cell–coated plates. Lympho-cytes were harvested and analyzed by FACS at the specified time points.
V(D)J rearrangement analysis
cDNA from FACS-sorted thymocyte fractions were prepared as described(22). For Va14-Ja18 usage in CD1dtet-sorted iNKT cells, cDNAs wereamplified with primers as described (21, 29). RT-PCR products weresubcloned into TOPO TA vector (Invitrogen) and sequenced. Ja genesegment usage was determined using the V-QUEST search program (30)and verified by manual check. For Ja repertoire analysis of DP cells,a Va8- or Va14-specific primer and a Ca primer were used to generatelibraries for Ion Torrent high-throughout sequencing. Data were convertedto the FAST format (31) on a Galaxy platform (http://galaxyproject.org/)before being submitted to the High/V-QUEST search engine (32). ATCRbV-D-J rearrangement assay was performed with primers Vb5-59 and Jb2.7-39 according to the protocol described previously (19). Genomic DNAwasextracted from FACS-sorted cell fractions.
ResultsConditional removal of Id2 and Id3 with Lck-Cre impairs T celldevelopment
We hypothesized that Id2 may play a redundant role and func-tionally compensate for the loss of function of Id3 at the pre-TCRcheckpoint. To test this hypothesis, we used Lck-Cre to drive con-ditional deletion of Id3 and Id2 before the pre-TCR and gdTCRcheckpoints. PCR analysis of fractionated thymocytes demon-strated that Lck-Cre–mediated deletion of the Id2 and Id3 floxedalleles started at the DN3 stage and achieved near completionby the DP stage (Supplemental Fig. 1). Mice carrying the Lck-Cre transgene or the floxed alleles alone did not show any phe-notype (Supplemental Fig. 2A). Lck-Cre–induced Id2 deletionalone did not produce any developmental abnormalities, whereasdeletion of both copies of Id3 plus one copy of Id2 resulted ina dramatic increase in gd T cells and a reduction in ab T cells(Fig. 1A, bottom panel), a result similar to a previous report of Id3knockout mice (23). Deletion of both Id2 and Id3 with Lck-Cre (referred to as L-DKO hereafter) resulted in a phenotype sig-nificantly different from these control groups. The total thymiccellularity of L-DKO mice was reduced to an average of 36%(among 1.5-mo-old young adults) or 43% (at the weaning age) incomparison with age-matched Cre2 control mice (Fig. 1B). Con-sistent with an earlier study involving CD4-Cre–mediated deletionof Id2 and Id3 at the DP stage, Lck-Cre–mediated deletion of Id2and Id3 at the DN stage also resulted in a complete block in CD8lineage development (22) (Fig. 1A, upper panel). L-DKO micealso exhibited a significant increase in numbers and percentagesof CD42CD82 (DN) cells (Fig. 1A, middle panel). Furtheranalysis showed that the increase in DN cells could be attributedmostly to a change in the CD42CD82CD252CD442 (DN4)fraction (from 6.76 1.13 105 in Cre2 mice to 26.56 5.23 105
in L-DKO mice; Supplemental Fig. 2B). The absolute numbers ofDN3 and DP cells in L-DKO mice were decreased to approxi-mately half of the Cre2 controls (Supplemental Fig. 2B, 2C).Collectively, these results indicated that Lck-Cre induced dele-tion of Id2 and Id3 perturbed T cell development at multiple stages,including the DN3 stage.
Accumulation of CD42CD82TCRblo cells occurs duringneonatal life
Further examination of L-DKO thymocytes showed that their CD4+
CD82 cells expressed TCRb at a level lower than that of CD4 SPin Cre2 controls (Fig. 1C). TCRblo cells were also observedamong most CD42CD82 cells and peripheral CD4 T cells inL-DKO mice. Both L-DKO and Id2+/fId3f/fLck-Cre+ mice alsoshowed a small fraction of TCRb2 cells among the CD4 T cells inthe thymus and periphery. A separate FACS analysis showed thatthese TCRb2CD4+CD82 T cells were innate-like gd T cells asreported in Id3 knockout mice (24). To uncover the primary de-velopmental defects and to limit the potential cross-regulationfrom effector T cells generated in the mutant mice, we switchedto examination of neonatal animals (Fig. 1D). Among day 3 neo-nates, CD4 cells were not detected in L-DKO mice, indicatinga developmental block in the transition from DP to CD4 SP. CD42
CD82TCRblo T cells were also absent at this early stage. In con-trast, a dramatic increase in CD42CD82TCRblo T cells and gdT cells became apparent 10 d after birth concomitant with the ap-pearance of CD4 cells. By day 20 (weaning age), both CD42CD82
TCRblo T cells and CD4 cells exhibited a further increase in per-centages relative to other populations in the thymus of L-DKOmice. CD4 cells in the mutant mice expressed a lower level ofTCRb in comparison with the CD4 cells in the Cre2 control mice
The Journal of Immunology 5053
at Univ of T
exas-Austin on A
pril 17, 2014http://w
ww
.jimm
unol.org/D
ownloaded from

FIGURE 1. Early T cell development is perturbed by Lck-Cre–induced knockout of Id2 and Id3. (A) Total thymocytes were analyzed in two-dimensional
plots of either CD4 and CD8a (top panel) or TCRb and TCRd (bottom panel). The DN fractions (defined by CD42CD82NK1.12B2202Gr-12Mac-12) of
thymocytes were displayed by CD44 and CD25 expression (middle panel). Samples are from 2-mo-old Id2+/+Id3+/+LckCre2, Id2f/fId3+/+LckCre+, Id2+/f
Id3f/fLckCre+, and Id2f/fId3f/fLckCre+ mice as indicated on the top of each column. Percentages of cells in each quadrant are displayed. (B) Cell counts of
total thymocytes in 1.5-mo-old and 20-d-old mice. The mean value for 1.5-mo-old Cre2 control mice is 2.46 0.23 108 (n = 7), and for Cre+ L-DKO mice
is 0.85 6 0.13 3 108 (n = 8). The p value of the t test between the two groups is ,0.0001. The mean value for 20-d-old Cre2 control mice is 13 6 1.1 3107 (n = 5), and for Cre+ L-DKO is 5.6 6 1.2 3 107 (n = 5). The p value of the t test between the two groups is 0.0017. (C) Expression level of TCRb
among indicated cell fractions isolated from thymus, spleen, and lymph nodes. (D) FACS analysis of day 3, 10, and 20 neonatal Cre2 and Cre+Id2f/fId3f/f
thymocytes. Plots shown are CD4/CD8a staining of total thymocytes (top panel) and TCRb/TCRd staining of DN fractions (bottom panel). Percentages of
cells in each quadrant are shown. Results are representative of three Cre2 and Cre+ pairs at each time point. (E) Cre2 (red) and Cre+ (blue) samples from
day 20 shown in (D) were further analyzed in an overlay histogram to display TCRb expression in DP and CD4 SP cells.
5054 Id PROTEINS RESTRICT iNKT LINEAGE DEVELOPMENT
at Univ of T
exas-Austin on A
pril 17, 2014http://w
ww
.jimm
unol.org/D
ownloaded from

(Fig. 1E). Based on these findings, we chose 20-d-old animals tofurther dissect T cell development in L-DKO mice.
A partial block at the pre-TCR checkpoint
Given that Lck-Cre initiates Id2 and Id3 deletion at the DN3 stage,we first evaluated the effect of Id deletion on pre-TCR selection.We used CD27 to separate DN3 cells into DN3a (CD27lo) andDN3b (CD27hi) fractions (Fig. 2A). CD27 upregulation is tightlycorrelated with pre-TCR selection among DN3 cells (33). Anal-ysis of L-DKO mice showed that the percentage of DN3b cellswithin the DN3 fraction was reduced to approximately one-half ofthat in Cre2 control littermates (Fig. 2B). To determine whetherthis block in pre-TCR selection was due to any major perturba-tions of TCRb gene rearrangement, we examined TCRb geneusage based on V-D-J rearrangements (19). A random pattern of
Jb usage was detected among DN3 and DN4 cells in Cre2 miceand DN3 cells from L-DKO mice (Fig. 2C). This result indicateda relatively normal TCRb usage among DN3 cells in L-DKO mice.However, both CD42CD82TCRb+ and CD42CD82TCRb2 cellsin L-DKO mice showed a perturbed pattern of D-J usage.To further evaluate the efficiency of pre-TCR selection, we tested
the differentiation capability of DN3 cells in an OP9-DL1 culturesystem (34). DN3 cells from both Cre2 control and L-DKO samplesexpanded dramatically and differentiated into the DP stage within6 d in culture (Fig. 2D, 2E). However, DN3a cells from L-DKOmice progressed from DN to DP in a slower kinetics in compar-ison with the Cre2 controls (Fig. 2D). The kinetic difference be-tween these two genotype groups was also evident among thesorted DN3b cells (Fig. 2E), which represents cells having un-dergone b-selection (33). Collectively, these data indicate that
FIGURE 2. Pre-TCR checkpoint is partially blocked. (A) Separation DN3a and DN3b fractions with CD27 marker. DN cells were defined as CD42CD82
NK1.12B2202Gr-12Mac-12 here in FACS sorting. DN3 fraction was first gated as a c-Kit2CD25+ fraction of DN thymocytes before analysis with CD44
and CD27. (B) Summary of DN3b percentages in total DN3 from four independent sortings. Means 6 SE are 13 6 1.3% for Cre2 and 7.2 6 0.86% for
Cre+ samples with p = 0.01. (C) TCRb D-J rearrangement assay with Vb5 and Jb2.7 primers. Lane orders are: M, size marker; L-DKO DN3; L-DKO DN4
TCRb+; L-DKO DN4 TCRb2; Cre2 DN3; Cre2 DN4; Rag22/2. The predicted size for each rearrangement is: Jb2.7, 282 bp; Jb2.6, 495 bp; Jb2.5, 638 bp;
Jb2.4, 730 bp; Jb2.3, 869 bp; Jb2.2, 1135 bp; Jb2.1, 1338 bp. (D) OP9-DL1 culture of DN3a thymocytes sorted from Cre2 controls (left panel) and L-DKO
mice (right panel). Twenty thousand cells were seeded in each well for the time course experiments. CD4 and CD8 staining of total cultured cells are shown
for days 2, 4, and 6 in culture. Results are representative of three repeats of independently sorted cells. (E) OP9-DL1 culture of DN3b thymocytes sorted
from Cre2 controls (left panel) and L-DKO mice (right panel). Four thousand cells were seeded in each well for the time course experiments. Analysis was
carried out as described in (D). Results are representative of three repeats of independently sorted cells.
The Journal of Immunology 5055
at Univ of T
exas-Austin on A
pril 17, 2014http://w
ww
.jimm
unol.org/D
ownloaded from
Lck-Cre–mediated deletion of Id2 and Id3 impaired the pre-TCRcheckpoint.
CD4+CD82TCRblo and CD42CD82TCRblo cells in L-DKOmice are mostly iNKT cells and type II NKT cells
iNKT cells are known to express lower levels of TCR than those ofconventional ab T cells and are phenotypically classified intoeither the CD4+CD82 or CD42CD82 compartment. The devel-opment of iNKT cells also begins in the neonatal stage (4) witha time frame similar to the CD4+CD82TCRblo cells and CD42
CD82TCRblo cells in L-DKO mice. We therefore examined thepossibility that the TCRblo cells in L-DKO mice were iNKT cells.FACS analysis of thymocytes revealed that most CD4+ cells anda third of CD42CD82 cells in L-DKO mice were recognized byan Ag-loaded CD1dtet that specifically binds to the canonicalTCR on iNKT cells (Fig. 3A). PLZF has been shown to be a sig-nature transcription factor for innate T lymphocytes, includingVg1.1Vd6.3 gd T cells and iNKT cells (35). Intracellular stainingwith anti-PLZF Ab demonstrated an overall increased in expres-sion of PLZF in CD4+CD82 and CD42CD82 cells but not DPcells in L-DKO mice (Fig. 3B). PLZF expression was found inboth ab1 and gd+ fractions of CD42CD82 cells in the mutantmice. Furthermore, a small fraction of TCR2CD42CD82 cellsalso expressed PLZF, indicating their possible lineage relationshipwith TCR+ PLZF-expressing cells. On average, the absolutenumbers of CD4 SP and DN fractions in L-DKO mice were ∼9-and 28-fold higher, respectively, than those of the age-matchedCre2 controls (Fig. 3C). Because most CD4 SP and DN fractionsin L-DKO mice expresses PLZF, we conclude that Id2 and Id3double deletion leads to a significant increase in numbers of PLZF-expressing thymocytes. Sequencing analysis of cDNA productsamplified with Va14- and Ja18-specific primers confirmed theexclusive usage of the canonical invariant Va14Ja18 TCR in CD4CD1dtet+ cells isolated from L-DKO mice (Fig. 3D).The lipid Ag used in the CD1dtet specifically recognizes
iNKT cells. Type II NKT cells have been shown to use severalhighly restricted VaJa rearrangements, including Va3 to Ja9rearrangement (7, 8). Therefore, we examined Va3Ja9 usage inthe TCRbloCD1dtet2 CD42CD82 and CD4+CD82 cells in themutant mice. Va3Ja9 products but not Va14Ja18 products werereadily detected by PCR in TCRbloCD1dtet2 cells (Fig. 3E).Sequence analysis of Va3Ja9 products from TCRbloCD1dtet2
cells indicated that a third of them were in-frame and the remainingtwo-thirds were out-of-frame Va3Ja9 rearrangements (Fig. 3F).Therefore, other Va rearrangements must also be involved in gen-erating functional TCRa-chains in the TCRbloCD1dtet2 fraction.To further test lineage identity of the expanded TCRlo cells in
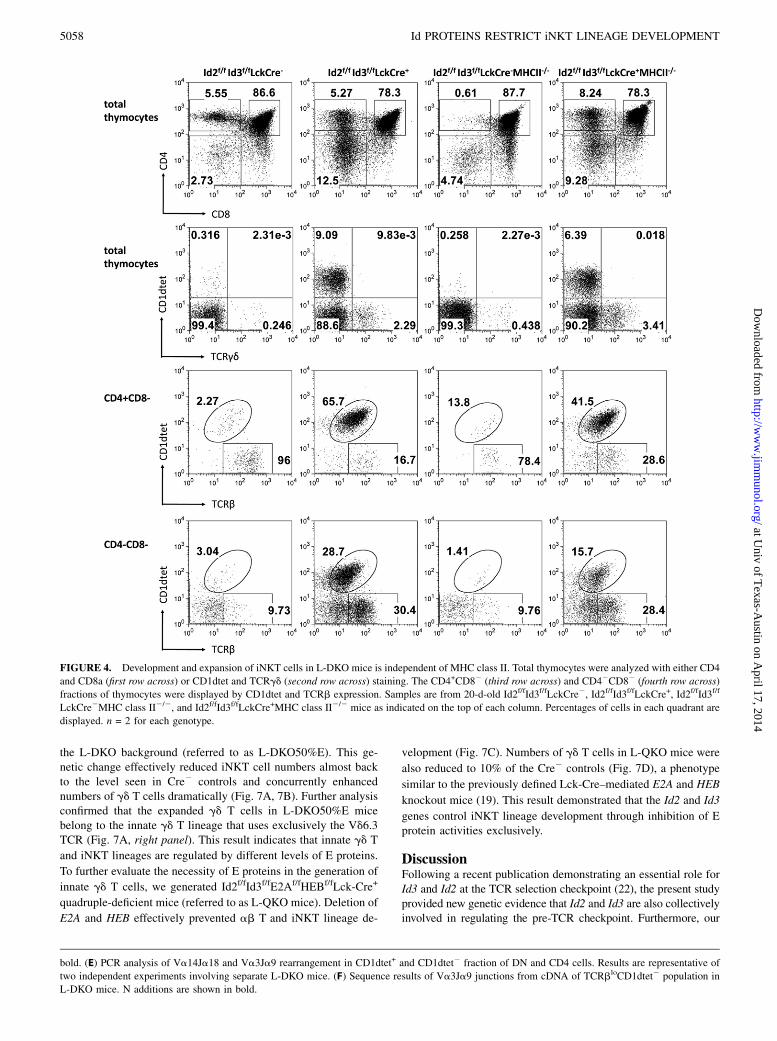
L-DKO mice, we bred L-DKO mice to the MHC class II–defi-cient background. Both TCRbloCD1dtet+ and TCRbloCD1dtet2
cells in L-DKO mice were generated in the absence of MHCclass II selection (Fig. 4), demonstrating that these cells wereunrelated to the conventional helper T cell lineages. Thus, weconclude that Lck-Cre–mediated deletion of Id2 and Id3 resulted inincreased generation of both iNKT cells and type II NKT cells.
Expansion of stage 1 iNKT cells in L-DKO mice
Further analysis showed that most iNKT cells developed in L-DKOmice do not express NK1.1 and DX5 even though they havedownregulated CD24 (Fig. 5A). FACS analysis also showed thatiNKT cells in L-DKO mice expressed low levels of CD44 (Fig.1A). These features together with PLZF expression indicated thatiNKT cell development in L-DKO mice has progressed to stage 1(36, 37), where cells undergo proliferative expansion (38). Indeed,in vivo BrdU pulse labeling revealed a significantly higher fraction
of cycling cells among CD4+ population in L-DKO mice (most ofwhich are iNKT cells) in comparison with the conventional CD4SP cells in Cre2 controls (Fig. 5B, 5C). The percentage of cyclingcells was also higher in the DN TCRlo fraction of L-DKO mice(most of which are presumed type II NKT cells) in comparisonwith the conventional CD4 SP cells in Cre2 controls. The sameanalysis indicated a relative normal pattern of cell cycle forL-DKO mice at the DN2, DN3, and DP stages of T cell develop-ment (Fig. 5C, Supplemental Fig. 3). This proliferative behaviorof NKT cells was observed at both weaning and young adult age(Fig. 5B). Repertoire analysis with a panel of TCR Vb isotype-specific Abs revealed a broad pattern of Vb usage among CD4+
cells of L-DKO mice, indicating that the expanded iNKT cells inL-DKO mice remain polyclonal (Table I). However, the overallpatterns of Vb usage in L-DKO mice were different from theconventional Vb8 . Vb7 . Vb2 rule (39), indicating the pos-sibility of an altered selection during development or expansionphase of these iNKT cells. Furthermore, five of six L-DKO miceshowed increased Vb usage involving Vb8.3, Vb11, or Vb13.Taken together, these results indicated that Id2 and Id3 deletionresulted in an expansion of immature iNKT cells.
Id2 and Id3 deletion results in a biased rearrangement towardVa14-Ja18
Given that iNKT cell development is dependent on Va14 to Ja18rearrangement, which typically occurs during the DP window ofthymocyte development, we asked whether Id2 and Id3 deletionaffects TCRa rearrangement. We assessed the Ja usage by per-forming high-throughput sequencing of rearrangement productsinvolving either Va8 or Va14 genes from the preselecting CD4+
CD8+CD692 DP cells. CD1dtet+ and CD69+ postselecting cellswere gated out to avoid the contamination of NKT cells or matureab T cells (Supplemental Fig. 4). Ja usage was captured by PCRamplification with a Va-specific primer and a Ca primer. A broadpattern of Ja usage involving Va8 rearrangements was detected inboth Cre2 control and L-DKO cells (Fig. 6A). Because Va8 is oneof the commonly used Va genes (40), the random distribution ofJa usage indicates that a significant fraction of DP cells undergoesrelatively normal TCRa rearrangements. In contrast to the Va8result, Va14 rearrangements exhibited a highly skewed patterntoward Ja18 usage in L-DKO mice (Fig. 6B). This bias towardJa18 was associated with Va14 but not Va8 (Fig. 6A). It remainsa possibility that some of these Va14-Ja18 rearrangements maycome from NKT cells that have downregulated their surface TCR.However, this argument cannot fully explain the fact that a sig-nificant number of unproductive Va14-Ja18 rearrangements werealso observed in three independent L-DKO DP samples (18, 19,and 61%; Fig. 6B, lower panel). In particular, one of the threesamples (Fig. 6B, center pie chart) showed more unproductiverearrangements (61%) than productive rearrangements (37%),which presents a typical preselecting repertoire. In contrast, un-productive Va14-Ja18 rearrangements were detected at a muchlower frequency in three wild-type control samples (0, 0.01, and5%; Fig. 6B, upper panel). This result suggests that Id2 and Id3deletion promotes Va14 to Ja18 rearrangements among devel-oping T cells when Va14 is involved in rearrangements.
Increased iNKT development in Id2- and Id3-deficient mice isdriven by high levels of E proteins
The major targets of Id proteins are E protein transcription factors,although E proteins are not the only Id-interacting proteins re-ported thus far (41). To test whether enhanced iNKT develop-ment is indeed regulated by E proteins, we lowered the E proteindosage by removing one copy each of the E2A and HEB genes on
5056 Id PROTEINS RESTRICT iNKT LINEAGE DEVELOPMENT
at Univ of T
exas-Austin on A
pril 17, 2014http://w
ww
.jimm
unol.org/D
ownloaded from

FIGURE 3. CD42CD82TCRlo and CD4+CD82TCRlo cells in L-DKO mice are NKT cells. (A) Representative staining of total lymphocytes with CD4,
CD8, TCRb, and CD1dtet. CD4 and CD8 staining of total thymocytes were used to define DN and CD4 SP gates. DN and CD4 fractions of each genotype
were analyzed with either unloaded CD1dtet as a control or PBS57-loaded CD1dtet. The percentages of CD1dtet+ or TCRb+CD1dtet2 cells in CD4 and DN
fractions are displayed in the plots. (B) Intracellular staining of PLZF in CD4 SP (CD4+CD82), DP (CD4+CD8+), and DN (CD42CD82) fraction of total
lymphocytes. DN fraction is further separated by TCRb and TCRd. DN TCRb2TCRd2, DN TCRblo, and DN TCRd+ populations were analyzed. (C) Cell
counts for CD1dtet+ iNKT cells in CD4 SP and DN fractions in 20-d-old pups. The mean values for CD4 SP iNKT cells are 1.436 0.313 105 and 12.7662.343 105 in Cre2 controls and L-DKO, respectively, with p = 0.0013. The mean values for DN iNKT cells are 0.646 0.153 105 and 17.816 5.083 105
in Cre2 controls and L-DKO, respectively, with **p = 0.0097. Five mice of each genotype group were used in the analysis. (D) Sequence results of
Va14Ja18 junctions from cDNA of DN CD1dtet+ and CD4 CD1dtet+ populations in L-DKO mice. N additions are shown in (Figure legend continues)
The Journal of Immunology 5057
at Univ of T
exas-Austin on A
pril 17, 2014http://w
ww
.jimm
unol.org/D
ownloaded from
the L-DKO background (referred to as L-DKO50%E). This ge-netic change effectively reduced iNKT cell numbers almost backto the level seen in Cre2 controls and concurrently enhancednumbers of gd T cells dramatically (Fig. 7A, 7B). Further analysisconfirmed that the expanded gd T cells in L-DKO50%E micebelong to the innate gd T lineage that uses exclusively the Vd6.3TCR (Fig. 7A, right panel). This result indicates that innate gd T
and iNKT lineages are regulated by different levels of E proteins.
To further evaluate the necessity of E proteins in the generation of
innate gd T cells, we generated Id2f/fId3f/fE2Af/fHEBf/fLck-Cre+
quadruple-deficient mice (referred to as L-QKO mice). Deletion of
E2A and HEB effectively prevented ab T and iNKT lineage de-
velopment (Fig. 7C). Numbers of gd T cells in L-QKO mice were
also reduced to 10% of the Cre2 controls (Fig. 7D), a phenotype
similar to the previously defined Lck-Cre–mediated E2A and HEB
knockout mice (19). This result demonstrated that the Id2 and Id3
genes control iNKT lineage development through inhibition of Eprotein activities exclusively.
DiscussionFollowing a recent publication demonstrating an essential role forId3 and Id2 at the TCR selection checkpoint (22), the present studyprovided new genetic evidence that Id2 and Id3 are also collectivelyinvolved in regulating the pre-TCR checkpoint. Furthermore, our
bold. (E) PCR analysis of Va14Ja18 and Va3Ja9 rearrangement in CD1dtet+ and CD1dtet2 fraction of DN and CD4 cells. Results are representative of
two independent experiments involving separate L-DKO mice. (F) Sequence results of Va3Ja9 junctions from cDNA of TCRbloCD1dtet2 population in
L-DKO mice. N additions are shown in bold.
FIGURE 4. Development and expansion of iNKT cells in L-DKO mice is independent of MHC class II. Total thymocytes were analyzed with either CD4
and CD8a (first row across) or CD1dtet and TCRgd (second row across) staining. The CD4+CD82 (third row across) and CD42CD82 (fourth row across)
fractions of thymocytes were displayed by CD1dtet and TCRb expression. Samples are from 20-d-old Id2f/fId3f/fLckCre2, Id2f/fId3f/fLckCre+, Id2f/fId3f/f
LckCre2MHC class II2/2, and Id2f/fId3f/fLckCre+MHC class II2/2 mice as indicated on the top of each column. Percentages of cells in each quadrant are
displayed. n = 2 for each genotype.
5058 Id PROTEINS RESTRICT iNKT LINEAGE DEVELOPMENT
at Univ of T
exas-Austin on A
pril 17, 2014http://w
ww
.jimm
unol.org/D
ownloaded from

FIGURE 5. Characterization of NKT cells in L-DKO mice. (A) Total thymocytes from Cre2 control L-DKO mice were displayed for CD1dtet and CD24
expression (left column), NK1.1 and TCRb expression (middle column), and DX5 and TCRb expression (right column). (B) BrdU incorporation among DP
and CD4+ SP thymocytes analyzed at 4 h after BrdU injection of 20-d-old (left panel) or 2-mo-old mice (right panel). The percentage of BrdU+ cells for
each subpopulation is shown in histograms. (C) Summary of BrdU+ percentages in DN2, DN3, DP, CD4+CD82, and DN TCRb+ fractions from three
independent experiments of 20-d-old pups. Significant difference was observed between L-DKO and control mice among the CD4+CD82 fraction (mean
value, 3.85 6 0.61 and 8.56 6 0.72% for Cre2 controls and L-DKO, respectively, with **p = 0.0076). Numbers of DN TCR+ cells in the Cre2 control
group were too small to be included in this analysis.
The Journal of Immunology 5059
at Univ of T
exas-Austin on A
pril 17, 2014http://w
ww
.jimm
unol.org/D
ownloaded from

study also revealed a previously unanticipated role for Id3 and Id2in regulating iNKT cell development.Two models have been proposed to explain the development
of iNKT cells (13). The “pre-commitment” model postulates thatiNKT cell fate is predetermined prior to CD1d-mediated selec-tion. This idea has been supported by the finding that Va14-Ja18rearrangements can be detected prior to the appearance of con-ventional ab T cells in the mouse fetus (12). However, this findingis inconsistent with the fact that most Va14-Ja18 rearrangementsoccur as secondary rearrangements in DP cells, from which iNKTcells are generated continuously in postnatal life (9–11). The“mainstream” (or TCR-instructive) model argues that iNKT cellsacquire their lineage identity upon CD1d-mediated TCR selectionof DP cells that have successfully produced the canonical Va14-Ja18 TCR resulting from the sequential rearrangement of theTCRa gene segments. Recent studies further demonstrated thata strong TCR signal is associated with activation of NKT lineage-specific transcription factors such as PLZF (42). Mounting evi-dence supports the idea that CD1d-mediated selection, togetherwith signaling events involving the SLAM receptors, drive iNKTlineage differentiation (37). In light of these previous findings, ourobservation of a biased Va14-Ja18 rearrangement in L-DKO miceprovides an alternative view to the existing models. We proposethat Va14-Ja18 rearrangement is not a random event and issubject to repression by concerted activity of Id3 and Id2.Multiple factors may contribute to the overall increase in
numbers of iNKT cells in L-DKO mice. The Ja repertoire analysisof L-DKO DP cells clearly revealed a biased usage of Va14-Ja18when Va14 is used in rearrangement. Because Ja18 usage was notaltered when Va8 was used in rearrangements, the biased Va14-Ja18 rearrangement in D-LKO mice cannot be simply due totargeted regulation at the Ja18 site. Given that each Va gene isregulated by an independent promoter, we propose that Va14 maybe subject to targeted regulation in L-DKO mice. However, Va14must be working in concert with Ja18 in L-DKO mice to promoteVa14-Ja18 usage. This biased Va14-Ja18 usage may only affecta small fraction of DP cells because the pattern of Va8 rear-rangements, a relatively common Va, seems unperturbed in L-DKO mice. Therefore, altered Va14-Ja18 usage alone is not suf-ficient to explain the overall increase in iNKT cell numbers. Ourstudy has further revealed that most iNKT cells detected in thethymus of L-DKO mice are proliferating immature iNKT cells. Theexpansion of immature iNKT cells after TCRa rearrangement couldbe another reason for the increase of iNKT cells in L-DKO mice.The expansion of iNKT cells in L-DKO mice could also be at-
tributed to other T lineage cells developing along with iNKT cellsthat may inadvertently affect the development and expansion ofiNKT cells (43). These include the innate gd T cells that developedin the neonatal stage and the small number of conventional CD4 SPcells made through positive selection (22). Indeed, CD4 SP cells thatdeveloped in Id3-deficient background have been shown to exhibitvarious effector phenotypes (44), which could potentially influencethe development and expansion of iNKT cells. To resolve this issue,we have tested our L-DKO mice on an MHC class II–deficientbackground and observed a similar expansion of iNKT cells as inL-DKO mice. The effect of innate gd T cell on the development ofiNKT cells in our L-DKO model could be further investigated in thefuture by crossing the L-DKO mice to the TCRd-deficient back-ground.Under our experimental conditions, the innate gd lineage and
iNKT lineage are selectively expanded in response to increasinglevels of E proteins. The tight correlation between E proteindosage and unique TCR types such as Vg1.1Vd6.3 of innate gdT cells and Va14Ja18 of iNKT cells provides a genetic frame-T
able
I.TCRVbrepertoireanalysisofL-D
KO
CD4+
thym
ocytes
Mouse
Strain
Vb2
Vb3
Vb4
Vb5.1/5.2
Vb6
Vb7
Vb8.1/8.2
Vb8.3
Vb9
Vb10b
Vb11
Vb12
Vb13
Cre
2(LIIIV
49)1m
1.45
3.15
4.96
5.91
8.11
2.51
73.44
0.37
1.87
3.79
3.23
1.16
Cre
2(LIIV41)1.5m
3.12
2.87
5.22
7.33
7.57
2.96
8.64
4.54
0.89
2.92
4.5
3.53
1.4
Cre
2(LIIIV
25)2m
1.45
2.76
5.21
4.8
7.83
4.1
7.04
4.74
0.47
2.14
3.56
2.66
1.42
B62m
3.94
3.62
6.8
5.23
7.53
2.99
9.79
5.09
0.78
3.66
5.39
4.26
1.93
B62m
3.78
3.86
7.26
5.2
7.6
2.73
9.5
4.82
0.97
3.69
4.73
3.63
1.74
Average
6SD
2.756
1.22
3.256
0.48
5.896
1.06
5.696
1.00
7.736
0.24
3.066
0.61
8.396
1.32
4.536
0.64
0.706
0.26
2.866
0.84
4.396
0.74
3.466
0.58
1.536
0.30
L-D
KO
(LIIIV
24)2m
2.01
2.67
2.54
2.94
3.23
4.48
4.36
18.2
2.29
2.48
8.13
2.96
3.04
L-D
KO
(LIIIV
26)2m
0.60
1.16
0.63
3.74
1.78
47.31
2.04
0.25
0.56
12.7
0.68
4.15
L-D
KO
(LIIIV
17)2m
1.61
2.06
1.86
2.47
3.05
4.19
6.57
7.87
1.45
1.76
27
2.61
10.8
L-D
KO
(LIIIV
47)1m
0.99
0.79
1.83
2.06
1.98
3.32
10.7
2.45
1.39
0.93
9.91
0.90
8.44
L-D
KO
(LIIIV
48)1m
1.32
1.05
0.99
2.47
4.22
4.13
11.7
2.49
0.62
0.70
3.65
0.95
3.34
L-D
KO
(LIIIV
50)1m
0.28
0.68
0.72
2.55
2.9
3.33
14.5
3.29
1.18
1.16
2.84
0.66
10.9
Average
6SD
1.146
0.64
1.406
0.79
1.436
0.76
2.716
0.58
2.866
0.89
3.916
0.48
9.196
3.76
6.066
6.33
1.206
0.71
1.276
0.73
10.716
8.81
1.466
1.04
6.786
3.71
Frequencies
ofVbusageareshow
nas
percentages
amongCD4+CD82fractionofthymocytesisolatedfrom
five
controlmiceandsixL-D
KOmice.TheaverageandSDarecalculatedforeach
group.Numbersin
parentheses
areidentifiersofthe
miceusedin
theexperim
ent.Absusedin
theanalysisarefrom
aTCRVbscreeningpanel
from
BD
Pharmingen.
m,Mouse
agein
months.
5060 Id PROTEINS RESTRICT iNKT LINEAGE DEVELOPMENT
at Univ of T
exas-Austin on A
pril 17, 2014http://w
ww
.jimm
unol.org/D
ownloaded from

work for further understanding how TCR rearrangement, expres-sion, and signaling are coupled with E protein–mediated lineagedifferentiation programs.Investigation of PLZF expression shed new light on the lineage
relationship between Vg1.1Vd6.3 gd T cells and iNKT cells (45,46). Although these two innate lineages seem to be developedindependently during thymopoiesis, they clearly share a similar
developmental blueprint by employing PLZF-mediated transcrip-tional regulation and possess similar innate-like features such asrestricted TCR usage, acquisition of effector memory like phe-notypes upon maturation, and coexpression of IL-4 and IFN-g (35).Furthermore, a recent RNA expression profiling analysis classifiediNKT cell as a lineage closely related to gd T cells (47). Thisresult supports the idea that NKT cells could be evolutionarily
FIGURE 6. Ja repertoire analysis of
DP cells. (A) Ja repertoire analysis of
Va8-Ca PCR products amplified from
a Cre2 control (top) and L-DKO (bot-
tom) CD692 DP cells. Bar graphs depict
relative percentages of each Ja gene
usage separated by productive and un-
productive rearrangements. Ja genes are
shown according to their relative posi-
tions in the TCRa locus starting with
the Va-proximal Ja61 gene. Analysis was
based on 24,124 and 17,482 sequence
reads for Cre2 control and L-DKO cells,
respectively. (B) Ja repertoire analysis of
Va14-Ca PCR products amplified from
a Cre2 control (top) and L-DKO (bottom)
CD692 DP cells. Each pie chart repre-
sents result of a single animal. The rela-
tive percentages of J gene usage were
depicted in shaded slices with Ja18 high-
lighted in yellow. Sequence reads were
37,811, 10,994, and 7,468 for wild-type
samples and 37,758, 46,141, and 7,960
for mutant samples.
The Journal of Immunology 5061
at Univ of T
exas-Austin on A
pril 17, 2014http://w
ww
.jimm
unol.org/D
ownloaded from

FIGURE 7. E protein dosages at the DN3 stage control lineage outcomes. (A) Effects of E protein dosage on T cell development revealed by analysis of
Cre2 control, L-DKO, and L-DKO50%E (Id2f/fId3f/fE2A+/fHEB+/fLck-Cre+) mice. Total thymocytes were analyzed with either CD4 and CD8 staining (far
left column), CD1dtet and TCRb staining (middle left column), or CD1dtet and TCRd staining (middle right column). TCRd+ cells were further analyzed for
Vd6.3 expression (far right column). (B) Cell counts of each T cell fractions as defined in (A). Three mice for each genotype group were included in the
analysis. (C) FACS analysis of L-QKO mice. Results of CD4 and CD8 analysis of total thymocytes (left column) are shown along with the CD1dtet and
TCRb analysis of gated DN fractions (right column). Results are representative of three pairs of animals. (D) Cell counts for total thymocytes (top) and gd
T cells (bottom) in the thymus of 20-d-old L-QKO mice. n = 3 pairs, p , 0.0005 for both plots.
5062 Id PROTEINS RESTRICT iNKT LINEAGE DEVELOPMENT
at Univ of T
exas-Austin on A
pril 17, 2014http://w
ww
.jimm
unol.org/D
ownloaded from

closer to innate gd T cells than the conventional T cells thatperform adaptive immune functions. Our study raised the possi-bility that E protein–mediated regulation may function upstreamof PLZF and other innate lineage-relevant transcription factors.The genetic models established in this study identified E proteinsas an important transcriptional switch controlling lineage choicebetween iNKT and other alternative T cell lineages.
AcknowledgmentsWe thank Drs. A. Lasorella and A. Iavarone for sharing the Id2f strain;
Dr. D. Sant’Angelo for providing the PLZF Ab; Dr. M. Krangel for in-
sightful discussion throughout the course of the experiments; Dr. S. Unnira-
man for advice on DNA methylation assays; Dr. Sophia Sarafova for
critiques; B. Zhang, Y. Lin, and I. Belle (Zhuang Laboratory) for com-
ments and critiques; M. Dai for technical assistance in generating the
initial L-DKO breeding colony; the Duke Cancer Center Flow Cytometry
Facility for assistance in cell sorting; the Duke Cancer Center Sequencing
Facility for assistance in Ion Torrent sequencing analysis; and the National
Institutes of Health Tetramer Facility for providing CD1d tetramer.
DisclosuresThe authors have no financial conflicts of interest.
References1. Bendelac, A., P. B. Savage, and L. Teyton. 2007. The biology of NKT cells.
Annu. Rev. Immunol. 25: 297–336.2. Kawano, T., J. Cui, Y. Koezuka, I. Toura, Y. Kaneko, K. Motoki, H. Ueno,
R. Nakagawa, H. Sato, E. Kondo, et al. 1997. CD1d-restricted and TCR-mediated activation of va14 NKT cells by glycosylceramides. Science 278:1626–1629.
3. Brennan, P. J., M. Brigl, and M. B. Brenner. 2013. Invariant natural killer T cells:an innate activation scheme linked to diverse effector functions. Nat. Rev.Immunol. 13: 101–117.
4. Koseki, H., K. Imai, F. Nakayama, T. Sado, K. Moriwaki, and M. Taniguchi.1990. Homogenous junctional sequence of the V14+ T-cell antigen receptoralpha chain expanded in unprimed mice. Proc. Natl. Acad. Sci. USA 87: 5248–5252.
5. Girardi, E., I. Maricic, J. Wang, T. T. Mac, P. Iyer, V. Kumar, and D. M. Zajonc.2012. Type II natural killer T cells use features of both innate-like and con-ventional T cells to recognize sulfatide self antigens. Nat. Immunol. 13: 851–856.
6. Patel, O., D. G. Pellicci, S. Gras, M. L. Sandoval-Romero, A. P. Uldrich,T. Mallevaey, A. J. Clarke, J. Le Nours, A. Theodossis, S. L. Cardell, et al. 2012.Recognition of CD1d-sulfatide mediated by a type II natural killer T cell antigenreceptor. Nat. Immunol. 13: 857–863.
7. Park, S. H., A. Weiss, K. Benlagha, T. Kyin, L. Teyton, and A. Bendelac. 2001.The mouse CD1d-restricted repertoire is dominated by a few autoreactive T cellreceptor families. J. Exp. Med. 193: 893–904.
8. Arrenberg, P., R. Halder, Y. Dai, I. Maricic, and V. Kumar. 2010. Oligoclon-ality and innate-like features in the TCR repertoire of type II NKT cells re-active to a b-linked self-glycolipid. Proc. Natl. Acad. Sci. USA 107: 10984–10989.
9. Gapin, L., J. L. Matsuda, C. D. Surh, and M. Kronenberg. 2001. NKT cellsderive from double-positive thymocytes that are positively selected by CD1d.Nat. Immunol. 2: 971–978.
10. Bezbradica, J. S., T. Hill, A. K. Stanic, L. Van Kaer, and S. Joyce. 2005.Commitment toward the natural T (iNKT) cell lineage occurs at the CD4+8+
stage of thymic ontogeny. Proc. Natl. Acad. Sci. USA 102: 5114–5119.11. Egawa, T., G. Eberl, I. Taniuchi, K. Benlagha, F. Geissmann, L. Hennighausen,
A. Bendelac, and D. R. Littman. 2005. Genetic evidence supporting selection ofthe Va14i NKT cell lineage from double-positive thymocyte precursors. Im-munity 22: 705–716.
12. Makino, Y., R. Kanno, H. Koseki, and M. Taniguchi. 1996. Development ofVa4+ NK T cells in the early stages of embryogenesis. Proc. Natl. Acad. Sci.USA 93: 6516–6520.
13. MacDonald, H. R. 2002. Development and selection of NKT cells. Curr. Opin.Immunol. 14: 250–254.
14. Bain, G., C. B. Cravatt, C. Loomans, J. Alberola-Ila, S. M. Hedrick, andC. Murre. 2001. Regulation of the helix-loop-helix proteins, E2A and Id3, by theRas-ERK MAPK cascade. Nat. Immunol. 2: 165–171.
15. Lee, S. Y., J. Stadanlick, D. J. Kappes, and D. L. Wiest. 2010. Towards a mo-lecular understanding of the differential signals regulating ab/gd T lineagechoice. Semin. Immunol. 22: 237–246.
16. Murre, C., P. S. McCaw, H. Vaessin, M. Caudy, L. Y. Jan, Y. N. Jan,C. V. Cabrera, J. N. Buskin, S. D. Hauschka, A. B. Lassar, et al. 1989. Inter-actions between heterologous helix-loop-helix proteins generate complexes thatbind specifically to a common DNA sequence. Cell 58: 537–544.
17. Benezra, R., R. L. Davis, D. Lockshon, D. L. Turner, and H. Weintraub. 1990.The protein Id: a negative regulator of helix-loop-helix DNA binding proteins.Cell 61: 49–59.
18. Jones, M. E., and Y. Zhuang. 2011. Stage-specific functions of E-proteins at theb-selection and T-cell receptor checkpoints during thymocyte development.Immunol. Res. 49: 202–215.
19. Wojciechowski, J., A. Lai, M. Kondo, and Y. Zhuang. 2007. E2A and HEB arerequired to block thymocyte proliferation prior to pre-TCR expression. J.Immunol. 178: 5717–5726.
20. Jones, M. E., and Y. Zhuang. 2007. Acquisition of a functional T cell receptorduring T lymphocyte development is enforced by HEB and E2A transcriptionfactors. Immunity 27: 860–870.
21. D’Cruz, L. M., J. Knell, J. K. Fujimoto, and A. W. Goldrath. 2010. Anessential role for the transcription factor HEB in thymocyte survival, Tcrarearrangement and the development of natural killer T cells. Nat. Immunol.11: 240–249.
22. Jones-Mason, M. E., X. Zhao, D. Kappes, A. Lasorella, A. Iavarone, andY. Zhuang. 2012. E protein transcription factors are required for the develop-ment of CD4+ lineage T cells. Immunity 36: 348–361.
23. Ueda-Hayakawa, I., J. Mahlios, and Y. Zhuang. 2009. Id3 restricts the devel-opmental potential of gd lineage during thymopoiesis. J. Immunol. 182: 5306–5316.
24. Verykokakis, M., M. D. Boos, A. Bendelac, E. J. Adams, P. Pereira, andB. L. Kee. 2010. Inhibitor of DNA binding 3 limits development of murineslam-associated adaptor protein-dependent “innate” gd T cells. PLoS ONE 5:e9303.
25. Rivera, R. R., C. P. Johns, J. Quan, R. S. Johnson, and C. Murre. 2000. Thy-mocyte selection is regulated by the helix-loop-helix inhibitor protein, Id3.Immunity 12: 17–26.
26. Pan, L., J. Hanrahan, J. Li, L. P. Hale, and Y. Zhuang. 2002. An analysis of T cellintrinsic roles of E2A by conditional gene disruption in the thymus. J. Immunol.168: 3923–3932.
27. Guo, Z., H. Li, M. Han, T. Xu, X. Wu, and Y. Zhuang. 2011. Modeling Sjogren’ssyndrome with Id3 conditional knockout mice. Immunol. Lett. 135: 34–42.
28. Niola, F., X. Zhao, D. Singh, A. Castano, R. Sullivan, M. Lauria, H. S. Nam,Y. Zhuang, R. Benezra, D. Di Bernardo, et al. 2012. Id proteins synchronizestemness and anchorage to the niche of neural stem cells. Nat. Cell Biol. 14:477–487.
29. Hager, E., A. Hawwari, J. L. Matsuda, M. S. Krangel, and L. Gapin. 2007.Multiple constraints at the level of TCRa rearrangement impact Va14i NKT celldevelopment. J. Immunol. 179: 2228–2234.
30. Brochet, X., M. P. Lefranc, and V. Giudicelli. 2008. IMGT/V-QUEST: the highlycustomized and integrated system for IG and TR standardized V-J and V-D-Jsequence analysis. Nucleic Acids Res. 36(Web Server issue): W503-8.
31. Blankenberg, D., A. Gordon, G. Von Kuster, N. Coraor, J. Taylor, andA. Nekrutenko; Galaxy Team. 2010. Manipulation of FASTQ data with Galaxy.Bioinformatics 26: 1783–1785.
32. Alamyar, E., V. Giudicelli, S. Li, P. Duroux, and M. P. Lefranc. 2012. IMGT/HighV-QUEST: the IMGT web portal for immunoglobulin (IG) or antibody andT cell receptor (TR) analysis from NGS high throughput and deep sequencing.Immunome Res. 8: 26.
33. Taghon, T., M. A. Yui, R. Pant, R. A. Diamond, and E. V. Rothenberg. 2006.Developmental and molecular characterization of emerging b- and gd-selectedpre-T cells in the adult mouse thymus. Immunity 24: 53–64.
34. Schmitt, T. M., and J. C. Zuniga-Pflucker. 2002. Induction of T cell developmentfrom hematopoietic progenitor cells by Delta-like-1 in vitro. Immunity 17: 749–756.
35. Alonzo, E. S., and D. B. Sant’Angelo. 2011. Development of PLZF-expressinginnate T cells. Curr. Opin. Immunol. 23: 220–227.
36. Godfrey, D. I., and S. P. Berzins. 2007. Control points in NKT-cell development.Nat. Rev. Immunol. 7: 505–518.
37. Das, R., D. B. Sant’Angelo, and K. E. Nichols. 2010. Transcriptional control ofinvariant NKT cell development. Immunol. Rev. 238: 195–215.
38. Benlagha, K., T. Kyin, A. Beavis, L. Teyton, and A. Bendelac. 2002. A thymicprecursor to the NK T cell lineage. Science 296: 553–555.
39. Mallevaey, T., J. P. Scott-Browne, J. L. Matsuda, M. H. Young, D. G. Pellicci,O. Patel, M. Thakur, L. Kjer-Nielsen, S. K. Richardson, V. Cerundolo, et al.2009. T cell receptor CDR2b and CDR3b loops collaborate functionally toshape the iNKT cell repertoire. Immunity 31: 60–71.
40. Guo, J., A. Hawwari, H. Li, Z. Sun, S. K. Mahanta, D. R. Littman,M. S. Krangel, and Y. W. He. 2002. Regulation of the TCRa repertoire by thesurvival window of CD4+CD8+ thymocytes. Nat. Immunol. 3: 469–476.
41. Lasorella, A., and A. Iavarone. 2006. The protein ENH is a cytoplasmic se-questration factor for Id2 in normal and tumor cells from the nervous system.Proc. Natl. Acad. Sci. USA 103: 4976–4981.
42. Seiler, M. P., R. Mathew, M. K. Liszewski, C. J. Spooner, K. Barr, F. Meng,H. Singh, and A. Bendelac. 2012. Elevated and sustained expression of thetranscription factors Egr1 and Egr2 controls NKT lineage differentiation in re-sponse to TCR signaling. Nat. Immunol. 13: 264–271.
43. Lee, Y. J., S. C. Jameson, and K. A. Hogquist. 2011. Alternative memory in theCD8 T cell lineage. Trends Immunol. 32: 50–56.
44. Miyazaki, M., R. R. Rivera, K. Miyazaki, Y. C. Lin, Y. Agata, and C. Murre.2011. The opposing roles of the transcription factor E2A and its antagonist Id3that orchestrate and enforce the naive fate of T cells. Nat. Immunol. 12: 992–1001.
45. Alonzo, E. S., R. A. Gottschalk, J. Das, T. Egawa, R. M. Hobbs, P. P. Pandolfi,P. Pereira, K. E. Nichols, G. A. Koretzky, M. S. Jordan, and D. B. Sant’Angelo. 2010.
The Journal of Immunology 5063
at Univ of T
exas-Austin on A
pril 17, 2014http://w
ww
.jimm
unol.org/D
ownloaded from

Development of promyelocytic zinc finger and ThPOK-expressing innate gdT cells is controlled by strength of TCR signaling and Id3. J. Immunol. 184:1268–1279.
46. Kreslavsky, T., A. K. Savage, R. Hobbs, F. Gounari, R. Bronson, P. Pereira,P. P. Pandolfi, A. Bendelac, and H. von Boehmer. 2009. TCR-inducible PLZFtranscription factor required for innate phenotype of a subset of gd T cells
with restricted TCR diversity. Proc. Natl. Acad. Sci. USA 106: 12453–12458.
47. Bezman, N. A., C. C. Kim, J. C. Sun, G. Min-Oo, D. W. Hendricks,Y. Kamimura, J. A. Best, A. W. Goldrath, and L. L. Lanier; ImmunologicalGenome Project Consortium. 2012. Molecular definition of the identity andactivation of natural killer cells. Nat. Immunol. 13: 1000–1009.
5064 Id PROTEINS RESTRICT iNKT LINEAGE DEVELOPMENT
at Univ of T
exas-Austin on A
pril 17, 2014http://w
ww
.jimm
unol.org/D
ownloaded from