combined ac electroosmosis and dielectrophoresis for ... · combined ac electroosmosis and...
TRANSCRIPT

Combined AC electroosmosis and dielectrophoresisfor controlled rotation of microparticles
Md. Walid Rezanoor and Prashanta DuttaSchool of Mechanical and Materials Engineering, Washington State University, Pullman,Washington 99164-2920, USA
(Received 17 December 2015; accepted 18 February 2016; published online 2 March 2016)
Electrorotation is widely used for characterization of biological cells and materials
using a rotating electric field. Generally, multiphase AC electric fields and
quadrupolar electrode configuration are needed to create a rotating electric field
for electrorotation. In this study, we demonstrate a simple method to rotate
dielectrophoretically trapped microparticles using a stationary AC electric field.
Coplanar interdigitated electrodes are used to create a linearly polarized nonuniform
AC electric field. This nonuniform electric field is employed for dielectrophoretic
trapping of microparticles as well as for generating electroosmotic flow in the vicinity
of the electrodes resulting in rotation of microparticles in a microfluidic device. The
rotation of barium titanate microparticles is observed in 2-propanol and methanol sol-
vent at a frequency below 1 kHz. A particle rotation rate as high as 240 revolutions
per minute is observed. It is demonstrated that precise manipulation (both rotation
rate and equilibrium position) of the particles is possible by controlling the frequency
of the applied electric field. At low frequency range, the equilibrium positions of the
microparticles are observed between the electrode edge and electrode center. This
method of particle manipulation is different from electrorotation as it uses induced
AC electroosmosis instead of electric torque as in the case of electrorotation.
Moreover, it has been shown that a microparticle can be rotated along its own axis
without any translational motion. VC 2016 AIP Publishing LLC.
[http://dx.doi.org/10.1063/1.4943032]
I. INTRODUCTION
With recent advances in low cost lithographic microfabrication techniques, lab-on-a-chip
devices find increasing uses in various disciplines including biomedical research and analytical
chemistry. These chips can handle ultra-low sample volume, which makes them a popular tool
for biological cell manipulation, sorting, extraction, transportation, and characterization. In these
small chips, it is possible to take advantage of several electrokinetic phenomena such as electroro-
tation,1 dielectrophoresis,2 electroosmosis,3 etc., due to the fact that high electric field can be gen-
erated in a micron/sub-micron test space by applying relatively low electric potential. These phe-
nomena are often utilized independently or in combination to achieve the desired manipulation of
microparticles. Electrorotation is typically used to characterize biological cells,4 whereas dielectro-
phoresis is used for characterization, manipulation, and separation of biological particles.5–7
Electroosmosis is generally required to transport biological cells in small microfluidic chips.8–10
Electric field induced microparticle rotation has become a powerful technique to evaluate
cell membrane dielectric properties.11–13 The advantage of this technique is that it allows nonin-
vasive study of individual cells in vitro. Apart from the measurement of dielectric properties,
cell rotation can be useful in studying cell morphology. Rotational motion of microparticles is
typically induced by applying a rotating electric field. A rotating electric field can be created
by arranging four electrodes and by exciting alternate electrodes with an AC signal having
phase difference.14,15 When a particle is placed in such an electric field, dipole moment is
induced in the particle. If the electric field is rotated, there will be an electric torque due to
1932-1058/2016/10(2)/024101/14/$30.00 VC 2016 AIP Publishing LLC10, 024101-1
BIOMICROFLUIDICS 10, 024101 (2016)
Reuse of AIP Publishing content is subject to the terms at: https://publishing.aip.org/authors/rights-and-permissions. Downloaded to IP: 134.121.73.146 On: Wed, 02 Mar
2016 16:18:55

interaction of new orientation of the electric field and remnant dipole of the particle resulting
from previous orientation of the electric field. This electric torque is responsible for cell/micro-
particle rotation as demonstrated by Huang et al.16 Through a comprehensive theoretical work,
Pickard17 reported that a rotating electric field is indeed required for observing particle rotation
due to the Born-Lertes effect. Despite that, Pohl and Crane18 have reported rotation of yeast
cells in a stationary electric field which met with skepticism by researchers in the field of elec-
trorotation. The purpose of that work was to study the yield of yeast collection on electrodes
by dielectrophoresis where cell rotation was observed as a secondary effect. However, cell rota-
tion was not observed for all cells as some random cells chose to rotate whereas others were
stationary. It was hypothesized that a charge transfer process at the cell-fluid interface may be
responsible for electro-hydrodynamic effects, which resulted in rotation of cells. No reasonable
explanations existed at that time, though it was the first work that demonstrated cell rotation in
a stationary electric field. Later, Hou and Chang19 demonstrated the rotation of small latex par-
ticles in a cylindrical path. In their study, latex particles were rotated along an axis parallel to
electrodes by applying a DC bias to an AC electric field in a planar microelectrode configura-
tion. Although rotation of particles as well as band formation is shown, it is not clear whether
the particles rotated on their own axis, which is known as self-rotation.
In a recent study, self-rotation of biological cells is reported in an opto-electrokinetic chip
using high frequency stationary electric field,20 but the reasons for self-rotation remain unclear.
Lately, Vaillier et al.21 presented a comprehensive study of biological cell behavior in a station-
ary AC electric field, and demonstrated human cell rotation close to the electrode edge at mod-
erate frequencies (30–65 KHz). They have argued that fluid vortices formed due to Joule heat-
ing combined with the dielectrophoretic force caused the cells to rotate within a very narrow
frequency range. However, they did not observe any self-rotation of cells at low applied electric
frequency where the AC electroosmotic flow might be dominant.
The AC electroosmotic flow is induced due to ionic cloud migration in response to tangen-
tial applied electric field on electrode surface, and only occurs when applied frequency is far
below charge relaxation frequency of the fluid.22 Fluid flow in this low frequency regime is
demonstrated as a useful tool for trapping microparticles on the electrode surface using coplanar
electrodes.23–25 For example, Wu et al.24 used the AC electroosmotic flow to bring bacteria to
a trapping area or a stagnation zone for faster detection by an electric impedance spectroscopy.
Though trapping of particles is achieved in those studies, none of them demonstrated the con-
trolled rotation of particles. The competition of hydrodynamic drag and electrostatic force is
also employed for cell separation. Zhou et al.26 demonstrated that interplay of AC electroosmo-
sis and dielectrophoresis can be used for cell separation in this low frequency regime.
Tathireddy et al.27 used the AC electroosmotic flow induced on electrode at low frequencies to
analyze nanoparticle dynamics. Even though coupling of hydrodynamic and electric forces on
the particle at low frequency exhibits interesting particle dynamics and separation trends, con-trolled particle rotation, where the particle rotation axis remains stationary, has not been
addressed in the literature.
In this work, we present a controlled particle rotation in a stationary electric field (Fig. 1)
due to AC electroosmotic flow on the dielectrophoretically trapped microparticles. It has been
demonstrated that particle equilibrium position and rotation rates are the direct result of the
interplay of hydrodynamic and electric forces active on the particle. We specifically stay at the
low frequency regime to take advantage of the AC electroosmotic perturbation to create hydro-
dynamic torque on the dielectrophoretically trapped microparticles. To our knowledge, con-
trolled self-rotation of the dielectrophoretically trapped microparticles using AC electroosmosis
has not been reported before. The rest of the paper has been organized in following manner.
First, particle dynamics in the presence of dielectrophoresis and AC electroosmosis is briefly
discussed. Next, the fabrication technique for the microfluidic chip used in our experiments is
explained. Then, experimental setup and methods used for this study are discussed. Finally, par-
ticle equilibrium positions and rotation rates are analyzed due to the combined effect of dielec-
trophoresis and AC electroosmosis.
024101-2 Md. Walid Rezanoor and P. Dutta Biomicrofluidics 10, 024101 (2016)
Reuse of AIP Publishing content is subject to the terms at: https://publishing.aip.org/authors/rights-and-permissions. Downloaded to IP: 134.121.73.146 On: Wed, 02 Mar
2016 16:18:55

II. PARTICLE DYNAMICS
Electrokinetic motion of particles in a microfluidic chip depends heavily on the geometry of
the chip and the electrode layout among many other parameters. Like the experimental work of
Tathireddy et al.,27 we have used coplanar electrode strips arranged in an array laid out at the
bottom of the test chamber (Fig. 2). This layout can create non-uniformity in the electric field
required for dielectrophoretic manipulation. Even though we have multiple electrodes in the test
chamber, particle dynamics above each electrode is exactly the same. Hence, it will suffice to an-
alyze particle motion above one electrode. Figure 1 represents a segment of the test chamber
showing one electrode at the center and half width of two other adjacent electrodes on each side.
A. Influence of dielectrophoretic force on particle
Dielectrophoresis is a nonlinear electrokinetic phenomenon and it can be used to manipu-
late particles. Unlike other electrokinetic phenomena, dielectrophoretic force is only active at
the regions of non-uniform electric fields.28 In the case of coplanar electrodes, non-uniform
electric field lines have roughly semicircular shape as shown in Fig. 1(a). Electric field strength
is highest at the electrode edges, and its magnitude decreases away from the electrode edge. As
a matter of fact, the magnitude of the electric field decays exponentially in the vertical direction
as we move further away from the electrode surface.29 Depending on the relative polarizability
of the particle with respect to the suspending media, a particle might go towards the higher
(positive DEP) or lower (negative DEP) electric field regions. The relative polarizability can be
determined by the Clausius-Mossotti factor as
K ¼ ~ep � ~em
~ep þ 2~em; (1a)
FIG. 1. (a) Schematic of electric field lines on coplanar electrodes. Particle influenced by negative dielectrophoresis (red)
will move away from electrodes. Particle under positive dielectrophoretic (blue) force will move towards closest electrode
edge. (b) Schematic of AC electroosmotic flow circulating on coplanar electrodes. If a particle is placed above electrode,
viscous drag will push it away from electrode (red). When placed between electrodes (blue), viscous drag will bring it
closer to electrode.
FIG. 2. Schematic of the microchip. Coplanar electrodes lie at the bottom surface of test chamber on a glass substrate.
Particle movement is observed using a microscope positioned right above the chip (figure not drawn to scale).
024101-3 Md. Walid Rezanoor and P. Dutta Biomicrofluidics 10, 024101 (2016)
Reuse of AIP Publishing content is subject to the terms at: https://publishing.aip.org/authors/rights-and-permissions. Downloaded to IP: 134.121.73.146 On: Wed, 02 Mar
2016 16:18:55

where subscripts “p” and “m” denote particle and media, respectively, and ~e is the complex
permittivity given as
~e ¼ e� jr=2 p f : (1b)
Here, e and r are permittivity and conductivity, respectively. Thus, the Clausius-Mossotti factor
is a complex number, which depends on the fluid and particle dielectric properties as well as on
the driving frequency f . The real part of K, Re½K�, determines the direction of dielectrophoretic
force on a particle. For instance, if K > 0, the particle will be subjected to positive dielectropho-
resis and it will go towards the higher electric field region, and vice versa. Figure 1(a) shows the
direction of the particle during the positive (pDEP) and negative (nDEP) dielectrophoresis.
The time averaged dielectrophoretic force on a particle can be found as
h~FDEPi ¼ 2pemr3Re½K�rE*2
rms; (2)
where r is the particle radius and E*
rms is the root mean squared electric field.
B. Influence of AC electroosmotic flow
At the polarizable surfaces, i.e., metal electrodes, the electric double layer (EDL) is
induced due to the excitation of electrodes.22,30,31 Excess accumulated charge in this EDL inter-
acts with the tangential component of the external electric field. This gives rise to the electroos-
motic flow over the electrode surface and can be modeled by the Helmholtz-Smoluchowski
equation30
hu*slipi ¼ �em
2gRe ~WD
~E�t
h i; (3)
where hu*slipi, g, ~WD, and ~E�t are time averaged electroosmotic slip velocity, viscosity of me-
dium, complex potential drop across electric double layer, and complex conjugate of tangential
electric field, respectively. Electroosmotic flow in AC electric field over bar electrodes has been
demonstrated by Ramos et al.22,31 Typically, for coplanar electrodes, the direction of this veloc-
ity is from the edge of the electrode to the center as shown in Fig. 1(b). Maximum velocity
occurs at the electrode edge and diminishes towards the center of the electrode. This creates
two counter rotating circulating fluid vortices above the electrode. A microparticle placed in
this flow field will experience the hydrodynamic force and will migrate away from electrode
edges where the flow velocity is highest, as can be seen from Fig. 1(b). At large frequencies
(above �100 kHz), ion migration cannot keep up with rapidly changing electrode polarity and
an electric double layer cannot form over the electrode. This means electroosmotic flow at large
frequencies will subside to the point that particle motion will not be affected by the fluid flow.
Hence, at high frequencies, AC electroosmotic flow can be suppressed and particle motion can
be controlled by means of dielectrophoresis. However, at low frequencies, the motion of the
particle will be the result of net force due to both dielectrophoretic and hydrodynamic forces
on the particle as well as the weight of the particle. The combined electric and hydrodynamic
forces coupled with particle weight create a unique window to observe rotational effect on the
particle.
III. MICROFLUIDIC CHIP DESIGN AND FABRICATION
A. Microfluidic chip specifications
A microfluidic chip is designed and fabricated in the cleanroom facility, located at
Washington State University. The test compartment is 10 mm long, 5 mm wide, and 150 lm
deep as shown in Fig. 2(a). Titanium (Ti) electrodes are patterned on top of a glass substrate
using photolithographic techniques. A recess is molded onto a polydimethylsiloxane (PDMS)
024101-4 Md. Walid Rezanoor and P. Dutta Biomicrofluidics 10, 024101 (2016)
Reuse of AIP Publishing content is subject to the terms at: https://publishing.aip.org/authors/rights-and-permissions. Downloaded to IP: 134.121.73.146 On: Wed, 02 Mar
2016 16:18:55
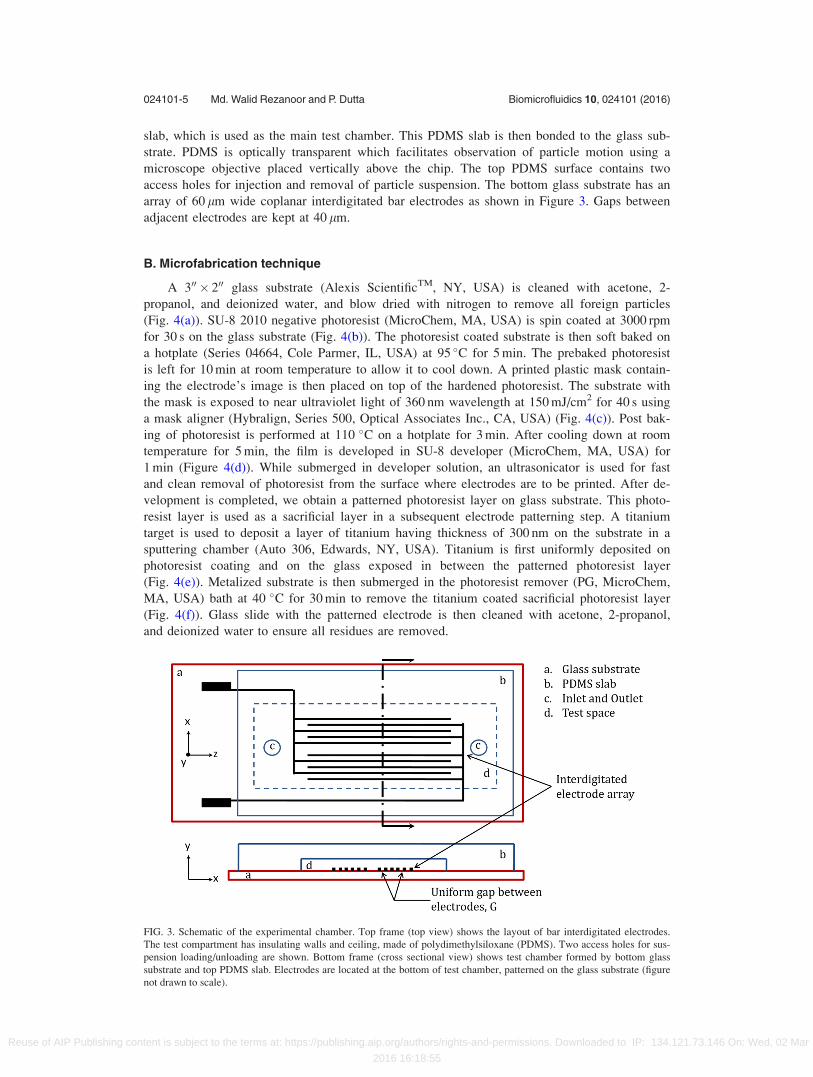
slab, which is used as the main test chamber. This PDMS slab is then bonded to the glass sub-
strate. PDMS is optically transparent which facilitates observation of particle motion using a
microscope objective placed vertically above the chip. The top PDMS surface contains two
access holes for injection and removal of particle suspension. The bottom glass substrate has an
array of 60 lm wide coplanar interdigitated bar electrodes as shown in Figure 3. Gaps between
adjacent electrodes are kept at 40 lm.
B. Microfabrication technique
A 300 � 200 glass substrate (Alexis ScientificTM, NY, USA) is cleaned with acetone, 2-
propanol, and deionized water, and blow dried with nitrogen to remove all foreign particles
(Fig. 4(a)). SU-8 2010 negative photoresist (MicroChem, MA, USA) is spin coated at 3000 rpm
for 30 s on the glass substrate (Fig. 4(b)). The photoresist coated substrate is then soft baked on
a hotplate (Series 04664, Cole Parmer, IL, USA) at 95 �C for 5 min. The prebaked photoresist
is left for 10 min at room temperature to allow it to cool down. A printed plastic mask contain-
ing the electrode’s image is then placed on top of the hardened photoresist. The substrate with
the mask is exposed to near ultraviolet light of 360 nm wavelength at 150 mJ/cm2 for 40 s using
a mask aligner (Hybralign, Series 500, Optical Associates Inc., CA, USA) (Fig. 4(c)). Post bak-
ing of photoresist is performed at 110 �C on a hotplate for 3 min. After cooling down at room
temperature for 5 min, the film is developed in SU-8 developer (MicroChem, MA, USA) for
1 min (Figure 4(d)). While submerged in developer solution, an ultrasonicator is used for fast
and clean removal of photoresist from the surface where electrodes are to be printed. After de-
velopment is completed, we obtain a patterned photoresist layer on glass substrate. This photo-
resist layer is used as a sacrificial layer in a subsequent electrode patterning step. A titanium
target is used to deposit a layer of titanium having thickness of 300 nm on the substrate in a
sputtering chamber (Auto 306, Edwards, NY, USA). Titanium is first uniformly deposited on
photoresist coating and on the glass exposed in between the patterned photoresist layer
(Fig. 4(e)). Metalized substrate is then submerged in the photoresist remover (PG, MicroChem,
MA, USA) bath at 40 �C for 30 min to remove the titanium coated sacrificial photoresist layer
(Fig. 4(f)). Glass slide with the patterned electrode is then cleaned with acetone, 2-propanol,
and deionized water to ensure all residues are removed.
FIG. 3. Schematic of the experimental chamber. Top frame (top view) shows the layout of bar interdigitated electrodes.
The test compartment has insulating walls and ceiling, made of polydimethylsiloxane (PDMS). Two access holes for sus-
pension loading/unloading are shown. Bottom frame (cross sectional view) shows test chamber formed by bottom glass
substrate and top PDMS slab. Electrodes are located at the bottom of test chamber, patterned on the glass substrate (figure
not drawn to scale).
024101-5 Md. Walid Rezanoor and P. Dutta Biomicrofluidics 10, 024101 (2016)
Reuse of AIP Publishing content is subject to the terms at: https://publishing.aip.org/authors/rights-and-permissions. Downloaded to IP: 134.121.73.146 On: Wed, 02 Mar
2016 16:18:55

Next, another SU-8 2035 mold on a glass slide (Fig. 4(g)) is created for the PDMS mold-
ing following the steps of Figs. 4(a)–4(d). This SU-8 mold will be used as the master for creat-
ing the test chamber later; hence, the height of this mold is kept at 150 lm. The increased
thickness of the mold requires changes in baking time, duration, and UV exposure time. We
have used similar process parameters, as described by Jubery et al.32 for fabrication of the thick
mold. The flexible and transparent channel, which caps the electrode and forms the test space,
is made out of PDMS (184 Sylgard Elastomer, MI, USA) by soft lithography. Briefly, the two
components of PDMS are mixed at 10:1 (v/v) and poured on the prepared mold (Fig. 4(h)).
The PDMS slab is cured at 60 �C for 4 h on a hotplate and stripped from the mold (Fig. 4(i)).
The stripped PDMS slab now is conformed to the shape of the test chamber. After pattern
transfer is completed, two 500 lm diameter holes are punched out at both ends of the test
chamber impression to allow fluid and particles to be injected into the chamber.
The PDMS slab with chamber impression and electrode integrated glass substrate are
exposed to oxygen plasma (PE 200, South Bay Tech, CA, USA) at 21 W and 170 mTorr pres-
sure for 30 s. Oxidized PDMS and glass surfaces are brought into contact immediately follow-
ing the exposure to form an irreversible covalent siloxane bond33 (Fig. 4(j)). The fabricated test
chamber is leak proof and can be accessed through two holes punched out earlier.
IV. MATERIALS AND EXPERIMENTAL SETUP
A. Microparticle and solvent
In this study, rotation of barium titanate microparticles is observed in nonaqueous media.
Barium titanate ceramics find many uses in resistors, capacitors, gas sensors, and other elec-
tronic devices. Because of their large dielectric constant, barium titanate particles are very suit-
able for observing positive dielectrophoresis in most commonly used solvents. Also, their rela-
tively large density makes it possible for them to stay close to the electrode surface at the
bottom of the chip, where one can investigate particle dynamics under the influence of AC elec-
troosmotic flow.
Barium titanate glass microspheres are purchased from Coshperic (Santa Barbara, CA, USA).
Microparticles are obtained in powder form and the mean diameter of these particles is 30 lm.
FIG. 4. Illustration of microchip fabrication sequence. (a) Clean (5 step cleaning) glass substrate. (b) Spin coated, pre baked
SU-8 2010 photoresist on glass substrate. (c) Patterning of SU-8 photoresist by plastic mask containing electrode pattern.
(d) Developed photoresist exposing part of glass substrate where electrode material will be deposited. (e) Deposition of
300 nm thick titanium on the substrate. (f) Patterned electrodes on glass substrate after removal of sacrificial SU-8 with
excess metal deposition. (g) Steps (a) to (d) are followed to create a replica of the test compartment using SU-8 2035 thick
photoresist on a separate glass substrate. (h) Liquid polydimethylsiloxane is poured onto the mold and cured. (i) Cured pol-
ydimethylsiloxane slab containing emboss of test compartment is stripped from the glass substrate (flip side view). Two
holes are punched out to act as inlet and outlet. (j) Glass substrate with electrodes (step f) and polydimethylsiloxane slab
(step i) are exposed to oxygen plasma and contact bonded to complete the fabrication process.
024101-6 Md. Walid Rezanoor and P. Dutta Biomicrofluidics 10, 024101 (2016)
Reuse of AIP Publishing content is subject to the terms at: https://publishing.aip.org/authors/rights-and-permissions. Downloaded to IP: 134.121.73.146 On: Wed, 02 Mar
2016 16:18:55

The density of these particles is 4.5 gm/cc. The electrical conductivity of these barium titanate
particles is negligible at �10�13 S/m, while the dielectric constant of those particles is roughly
3000.34 Non-aqueous solvents, 2-propanol (PrOH) and methanol (MeOH), are chosen as media
for our experiments. They are ideal for large electrical potential applications without the fear of
hydrolysis, which is relatively common in the case of water. The solvents are obtained from
Capitol Scientific, Austin, TX, USA. The dielectric constant of 2-propanol and methanol is 18.9
and 33.7, respectively.35 The viscosity of 2-propanol and methanol is 2.044 mPa s and
0.545 mPa s, respectively,36 while the density of 2-propanol and methanol is 0.786 gm/cc and
0.7914 gm/cc, respectively.37 Ionic conductivity is calculated roughly to be 1.1� 10�6 S/m and
8.5� 10�6 S/m for 2-propanol and methanol, respectively, from the electroosmotic mobility
values.38
B. Method
Dilute suspension of microparticles is prepared by adding 1 mg of microparticle powder in
500 ll of solvent. Prepared suspension is then loaded into the test chamber via polystyrene tub-
ing and syringe. The inlet diameter of access holes to test chamber is slightly smaller than tub-
ing diameter (�700 lm) which allows for a tight fit and leak proof loading of suspension in the
chip. The syringe and loading tube are detached from the test chamber after loading the particle
suspension to ensure no pressure build-up. This measure is taken to suppress any pressure driven
fluid flow in the test chamber. After ensuring no fluid movement in the test chamber, the chip is
placed under a standard microscope objective (Leitz Ergolux, Buffalo Grove, IL, USA) and wired
up to the power supply, as shown in Fig. 5. A function generator (Tektronix TM504, Beaverton,
OR, USA) is used to apply single phase AC electric potentials at the electrodes. The amplitude
of the electric potential is kept fixed at 7.5 V at all times, while the frequency is varied between
40 Hz and 700 Hz to observe the effect on particle dynamics. An oscilloscope (Tektronix TDS
2002, Beaverton, OR, USA) is used to measure the driving frequency and potential.
Owing to the transparency of the PDMS slab, it is easy to visualize particle motion through
the top thick PDMS layer of the channel during the experiment. A Canon powershot camera
with 30 fps rate (A2850, Melville, NY, USA) is fitted to the microscope to capture particle
movement. These movie files are transferred to a computer and particle spin rate is measured
during post processing steps. An open source video editing software (OpenShot Video Editor)
is used to measure the spin rate by calculating the number of frames elapsed between each
rotation.
FIG. 5. Schematic of the setup: (a) Microfluidic chip, (b) function generator, (c) microscope objective, (d) digital camera,
(e) image processor, (f) syringe pump, and (g) waste pool.
024101-7 Md. Walid Rezanoor and P. Dutta Biomicrofluidics 10, 024101 (2016)
Reuse of AIP Publishing content is subject to the terms at: https://publishing.aip.org/authors/rights-and-permissions. Downloaded to IP: 134.121.73.146 On: Wed, 02 Mar
2016 16:18:55
It would be ideal if individual particles could be loaded in the test space for investigation.
However, the simple chip design adopted for this study does not have a provision for letting
one microparticle at a time into the test space. Rather, the test space is filled with numerous
particles. Particles in close proximity can give rise to “particle-particle interaction” and can
influence particle dynamics under the applied electric field.39 To avoid such interactions, a zone
has been selected by thorough inspection of the entire test space, where a lone particle is avail-
able and whose vicinity (radius of 100 lm) is clear of any other particle. Dynamics of that lone
particle is observed, recorded, and measured.
V. RESULTS AND DISCUSSION
A. Particle equilibrium under AC electric field
In this section, we present the equilibrium position of particles in 2-propanol and methanol
at different applied frequencies of the electric field. In our experiments, the applied frequency
range for 2-propanol is from 40 to 90 Hz, while for methanol the range is from 200 to 700 Hz.
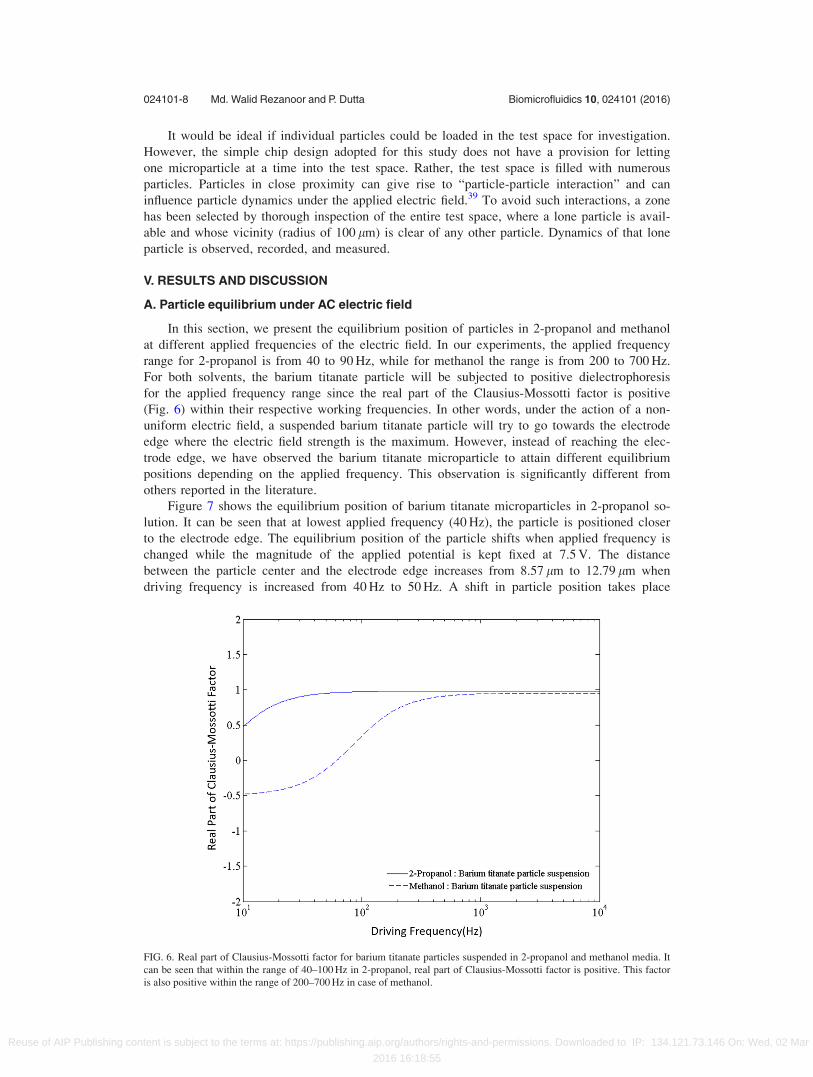
For both solvents, the barium titanate particle will be subjected to positive dielectrophoresis
for the applied frequency range since the real part of the Clausius-Mossotti factor is positive
(Fig. 6) within their respective working frequencies. In other words, under the action of a non-
uniform electric field, a suspended barium titanate particle will try to go towards the electrode
edge where the electric field strength is the maximum. However, instead of reaching the elec-
trode edge, we have observed the barium titanate microparticle to attain different equilibrium
positions depending on the applied frequency. This observation is significantly different from
others reported in the literature.
Figure 7 shows the equilibrium position of barium titanate microparticles in 2-propanol so-
lution. It can be seen that at lowest applied frequency (40 Hz), the particle is positioned closer
to the electrode edge. The equilibrium position of the particle shifts when applied frequency is
changed while the magnitude of the applied potential is kept fixed at 7.5 V. The distance
between the particle center and the electrode edge increases from 8.57 lm to 12.79 lm when
driving frequency is increased from 40 Hz to 50 Hz. A shift in particle position takes place
FIG. 6. Real part of Clausius-Mossotti factor for barium titanate particles suspended in 2-propanol and methanol media. It
can be seen that within the range of 40–100 Hz in 2-propanol, real part of Clausius-Mossotti factor is positive. This factor
is also positive within the range of 200–700 Hz in case of methanol.
024101-8 Md. Walid Rezanoor and P. Dutta Biomicrofluidics 10, 024101 (2016)
Reuse of AIP Publishing content is subject to the terms at: https://publishing.aip.org/authors/rights-and-permissions. Downloaded to IP: 134.121.73.146 On: Wed, 02 Mar
2016 16:18:55

within the range of 40–90 Hz in the case of 2-propanol in barium titanate suspension. At 90 Hz,
the particle reaches the centerline and stays there for any frequency greater than 90 Hz. In other
words, our experimental study shows that the equilibrium position of the particle moves from
the center of the electrode to the edge as the frequency is decreased. The particle shows similar
behavior above every electrode, and these experiments are quite reversible.
Similar motion of barium titanate particle is observed in methanol as shown in Fig. 8. In
this case, the particle motion is observed within the range of 200–700 Hz which is an order of
magnitude higher than in the case of 2-propanol. In this case as well, at higher frequencies, the
particle is seen to reach the electrode centerline. The frequency dependent equilibrium position
of particles suggests that other electric field driven mechanisms are involved in our experimen-
tal observation. If only positive dielectrophoresis is active, particles should stay at the electrode
edge at all applied frequencies. Yet, we observe from Figs. 7 and 8 that there is a distinct parti-
cle motion from electrode edge towards the center as applied frequency is increased. The shift
in the particle’s equilibrium position with changing frequency cannot be fully explained by
dielectrophoretic force alone. We hypothesize that AC electroosmotic fluid flow is responsible
for this frequency dependent behavior of barium titanate particles.
Seminal work of Ramos et al.22,31 demonstrated that in the case of coplanar electrodes,
electroosmotic flow is induced on the electrode surface at low frequencies resulting from the
interaction of tangential components of nonlinear electric field and ions accumulated in an elec-
tric double layer. It is established that typically the direction of this AC electroosmotic flow is
from the electrode edge towards the center. When a particle resides close to the electrode sur-
face, the hydrodynamic force felt by the particle due to AC electroosmotic flow counteracts the
dielectrophoretic force and prohibits the particle from reaching the electrode edge. As a matter of
fact, the electroosmotic flow velocity is a strong function of driving frequency. Hence, increase
in frequency causes the rise in flow velocity and hydrodynamic force on the particle. This in turn
shifts the force balance and the particle moves towards the electrode center. To prove this hy-
pothesis, a numerical model is employed which takes into account both electric field driven force
FIG. 7. Barium titanate particle of roughly 25 lm diameter is shown above a 60 lm wide electrode. Particle equilibrium
position varies with driving frequency for a constant applied potential (7.5 V). Particle’s center location is displayed with
respect to the edge of the electrode in all cases. Electrode center is shown as a vertical dashed-dotted line. Particle positions
observed in 2-propanol at (a) 40 Hz, (b) 45 Hz, and (c) 50 Hz.
024101-9 Md. Walid Rezanoor and P. Dutta Biomicrofluidics 10, 024101 (2016)
Reuse of AIP Publishing content is subject to the terms at: https://publishing.aip.org/authors/rights-and-permissions. Downloaded to IP: 134.121.73.146 On: Wed, 02 Mar
2016 16:18:55

and viscous force on the particle. In our numerical model, owing to the low Reynolds number in
the microfluidic device, the fluid flow velocity is obtained from the Stokes equation as
gr2~u �rp~~I ¼ 0: (4)
Here, g is the viscosity of fluid, ~u is the fluid velocity, p is the pressure, and~~I is an identity
tensor. It is important to note that the electric double layer next to the electrode surface was
not estimated explicitly. The contribution of electric double layer and resulting AC electroos-
motic flow is accounted for using a slip velocity (Eq. (3)) at the electrode surface, while no
penetration and no slip velocity are used at the insulating surfaces. In our experimental work,
no external pressure is applied during particle electrorotation experiments. Thus, the pressure is
set to zero at all boundary points.
In our numerical scheme, momentum conservation equations (Eq. (4)) are solved along with
the incompressible continuity equation (r �~u ¼ 0) to determine the resultant flow field in an
applied electric field. The computation of electroosmotic flow velocity requires a complex electric
field,~~E ¼ �r~/. In this study, the complex electric potential, ~/, is obtained from Eq. (5)40
r � ð~er~/Þ ¼ 0: (5)
In this simplified model, the estimation of potential distribution in the electric double layer is
not required. Rather, a mixed boundary condition is used on the electrode surface to take into
account the potential drop in the electric double layer as41
n̂ � rr~/ ¼ �jx CDLð~/ext � ~/Þ: (6)
Here, ~/ext is applied potential at the electrode, n̂ is the unit normal, x is the applied angular
frequency, and CDL is total capacitance of the electric double layer. The electric potential is set
FIG. 8. Barium titanate particle of roughly 25 lm diameter is shown above a 60 lm wide electrode. Particle equilibrium
position varies with driving frequency for a constant applied potential (7.5 V). In all cases, particle’s center location is dis-
played with respect to the edge of the electrode. Electrode center is shown as a vertical dashed-dotted line. Particle posi-
tions observed in methanol at (a) 300 Hz, (b) 400 Hz, and (c) 500 Hz.
024101-10 Md. Walid Rezanoor and P. Dutta Biomicrofluidics 10, 024101 (2016)
Reuse of AIP Publishing content is subject to the terms at: https://publishing.aip.org/authors/rights-and-permissions. Downloaded to IP: 134.121.73.146 On: Wed, 02 Mar
2016 16:18:55

to zero at the insulating surface, while time periodic electric potential is used on the active
electrode surfaces. For electroosmotic slip velocity (Eq. (3)), the potential drop across the elec-
tric double layer ( ~WD) can be calculated from the difference of electrode potential (~/ext) and
the potential at the bulk electrolyte (~/). All required material properties for numerical simula-
tions are presented in Section IV A.
Next, viscous and time averaged dielectrophoretic forces acting on a particle are calculated
from the flow field (~u) and the electric field (~~E ) as
~FHD ¼þ�P~~I þ gðr�u þr�uTÞ� �
� d~A; (7)
h~FDEPi ¼1
4Re ~emð Þ
þ~~E ~~E�þ ~~E
�~~E
� �� j~~E j2~~I
� �� n̂dA; (8)
where Reð~emÞ is the real part of the particle’s complex permittivity,~~E�
is the conjugate of the
electric field~~E , and A is the surface area.
Under quasi-equilibrium condition, the location of the particle’s equilibrium position can
be obtained from
~FDEP;x þ ~FHD;x ¼ 0; (9)
~FDEP;y þ ~FHD;y þ ~Fg ¼ 0: (10)
We used an iterative scheme to obtain the equilibrium location of the particle. At equilibrium
condition, the velocity of particle approaches zero.
The predicted lateral (x) equilibrium positions of the particle qualitatively match with the
experimental observations for both 2-propanol (Fig. 9(a)) and methanol (Fig. 9(b)). The reason
for relatively large error bars in experimental measurements is primarily due to the large var-
iance in particle size (65 lm) from the mean particle size, which is 30 lm.
Our numerical work confirms that particle’s equilibrium position shifts towards the center
with an increase in the frequency and this is due to the AC electroosmotic flow dependence on
FIG. 9. Predicted and measured barium titanate particle position in (a) 2-propanol and (b) methanol in a domain having
60 lm wide electrode and 40 lm gap between electrodes. Here, the lateral shift is the distance between the electrode edge
and the particle center. Applied potential is 7.5 V. The numerically predicted slip velocity at the tip (edge) of the electrode
is presented with the dotted line as a function of frequency. The vertical (y) equilibrium positions of particle are also calcu-
lated from the force balance in the y-direction by considering particle’s weight, dielectrophoretic force, and viscous drag
from the AC electroosmotic flow, but they are not presented here due to lack of reliable experimental data in the vertical
direction.
024101-11 Md. Walid Rezanoor and P. Dutta Biomicrofluidics 10, 024101 (2016)
Reuse of AIP Publishing content is subject to the terms at: https://publishing.aip.org/authors/rights-and-permissions. Downloaded to IP: 134.121.73.146 On: Wed, 02 Mar
2016 16:18:55

frequency as shown in Fig. 9. The AC electroosmotic flow is sensitive to applied frequency for
both 2-propanol and methanol. Our model predicts that there is a gradual rise of velocity until
peak velocity is achieved in both cases. In the case of 2-propanol, it can be seen from Fig. 9(a)
that within the operating frequency range the electroosmotic velocity keeps rising on the elec-
trode surface. The electroosmotic velocity plotted in Fig. 9(a) is calculated at the tip of the
electrode where its magnitude is the highest. This gradual rise in velocity causes increased
hydrodynamic force on the particle, which shifts the equilibrium position further towards the
electrode center. At 90 Hz, the particle reaches close to the electrode center (located at
x¼ 30 lm) and stays there with further increase in frequency. Though estimated electroosmotic
slip velocity keeps rising after 90 Hz, particle position remains unchanged as it reaches the elec-
trode centerline. The reason for that is, close to the electrode center, a counter flow originating
from the other electrode edge gets prominent on the particle. Hence, increase in the AC electro-
osmotic velocity does not necessarily mean change in particle position since the net force on
the particle will be zero when it reaches the electrode center.
Barium titanate particles exhibit similar behavior in methanol but the frequency range in
this case is 200–700 Hz as can be seen from Fig. 9(b). The difference in the frequency range in
case of two media arises from different charging time of the double layer in respective medium.
Double layer charging time and the resulting electroosmotic flow over the electrode surface
depend on the fluid properties such as electrical conductivity, permittivity, and Debye length.41
Difference in these properties of the two media used is responsible for the observed difference
in the experimental frequency range.
B. Particle rotation
We have observed barium titanate particle rotation in both suspensions, i.e., in 2-propanol
and in methanol. Figure 10 shows stable rotation of an irregular barium titanate particle in
methanol for an applied potential of 7.5 V. We intentionally selected a particle with an irregular
shape, as the irregularity of the particle, in this case, is useful to observe a different particle ori-
entation as a function of time. The particle spin is recorded to be 131 revolutions per minute
for an applied frequency of 450 Hz. The particle equilibrium position observed is stable and
measured to be �18.58 lm while it is going through rotational motion. The particle rotation is
due to the hydrodynamic torque generated around the particle. The origin of hydrodynamic tor-
que lies on non-uniform flow distribution around the particle. At the region in between the par-
ticle and electrode surface, there exists high horizontal flow velocity compared to far above
from the electrode. This non-uniformity of flow creates hydrodynamic torque on the particle.
FIG. 10. A barium titanate particle rotating at 131 rpm about an axis parallel to electrode edge at 450 Hz and 7.5 V in meth-
anol. Particle orientation is shown at (a) 0 s, (b) 0.554 s, (c) 1.09 s. Particle position displayed here is roughly 18.58 lm
away from the electrode edge and is stable. Controlled and stable particle rotations are obtained for uniform microsphere,
although a particle with defects is shown in this figure for vivid demonstration of particle rotation. See movies in the sup-
plementary materials.42
024101-12 Md. Walid Rezanoor and P. Dutta Biomicrofluidics 10, 024101 (2016)
Reuse of AIP Publishing content is subject to the terms at: https://publishing.aip.org/authors/rights-and-permissions. Downloaded to IP: 134.121.73.146 On: Wed, 02 Mar
2016 16:18:55

Uniform spheroids also exhibit similar rotational motion (see movies in the supplementary
materials42). Particle rotation has been observed within the range of frequencies used during
our experiments at their respected equilibrium positions.
The rotation rate of barium titanate particles is shown in Fig. 11 for both 2-propanol and in
methanol. In the case of 2-propanol (Fig. 11(a)), the observed rotation rate has a peak around
60 Hz and gradually decays when frequency is increased. The initial rise of the particle rotation
rates from 40 to 60 Hz is due to the increased AC electroosmotic flow rates. However, at the
same time the particle gets pushed further towards the electrode center. With the further
increase in frequency (above 60 Hz), the particle shifts significantly towards the electrode center
and particle rotation rate decays with it. A detailed investigation of the flow velocity profile
over the electrode is needed to explain the decrease in the rotation rate.
Green et al.30 have studied AC electroosmotic flow created by coplanar electrodes, and
they found that electroosmotic velocity is the maximum at the electrode edge and it decreases
toward the center of the electrode. This sharp decrease in flow velocity is responsible for the
decay in the rotation rate with the increase in the frequency. Thus, it can be concluded that
electroosmotic flow created over the electrode is able to push the particle equilibrium towards
the electrode center, but at the same time, flow non-uniformity around the particle goes down
at higher frequencies. Also, as the particle approaches the electrode centerline, a counter flow is
experienced by the particle originating from the other edge of the electrode. A combination of
these two effects experiences dwindling particle rotation rates at positions near the electrode
center. A similar trend is seen for barium titanate particles immersed in methanol (Fig. 11(b)).
The only discrepancy in this case is we have not seen a rise to the peak rotation rate as is visi-
ble in the case of 2-propanol. This happens because in case of methanol instability in flow has
been detected at lower frequencies (100–200 Hz). Most probably, Faradic reaction takes place,
which alters the flow field and particle rotation rates in this low frequency regime. However, at
frequencies greater than 200 Hz, in the case of methanol, a similar trend of particle equilibrium
positions and rotation rates is observed.
VI. CONCLUDING REMARKS
A simple experimental technique is presented to rotate microparticles in a microfluidic de-
vice using a stationary AC electric field. A microfluidic chip is fabricated out of glass and
PDMS. The glass substrate has an array of interdigitated coplanar titanium electrodes. Particle
dynamics is observed via the top clear PDMS surface of the channel. Two different fluid media,
2-propanol and methanol, are used to rotate barium titanate microparticles using a stationary
electric field. It has been shown that the combination of positive dielectrophoresis and AC elec-
troosmotic flow can be used to control particle equilibrium position and rotation rate by chang-
ing the frequency of the applied electric field. In 2-propanol, the equilibrium position shifts
within the frequency range of 40–90 Hz and a total lateral shift of 17 lm across electrode width
FIG. 11. Rotation rates of regular barium titanate particle in (a) 2-propanol and (b) methanol are plotted as a function of
driving frequency for an applied electric potential amplitude of 7.5 V. At all frequencies, particle position is found stable
while it undergoes rotational motion due to the combined positive dielectrophoresis and electroosmosis.
024101-13 Md. Walid Rezanoor and P. Dutta Biomicrofluidics 10, 024101 (2016)
Reuse of AIP Publishing content is subject to the terms at: https://publishing.aip.org/authors/rights-and-permissions. Downloaded to IP: 134.121.73.146 On: Wed, 02 Mar
2016 16:18:55

is recorded. In methanol, a shift in particle position is recorded within the frequency range of
200–700 Hz and the total lateral shift is 12 lm. It is also observed that the movement of the
particle is always symmetric with respect to the centerline of bar electrodes. In other words, the
lateral movement of the particle is observed between one of the electrode edges and the electrode
centerline. It has been demonstrated that barium titanate particles go through stable rotation at
their equilibrium position. These rotation rates are a function of equilibrium positions and fre-
quency. We have observed a maximum rotation rate of 105 revolutions per minute in 2-propanol
at 60 Hz and 205 revolutions per minute in methanol at 200 Hz. Hydrodynamic torque induced
on the particle due to non-uniform flow field in the channel is probably responsible for particle
rotation. This novel microparticle rotation method will be helpful for visualization of biological
cell morphology with the inexpensive standard laboratory tools.
ACKNOWLEDGMENTS
This work was supported in part by the National Science Foundation under Grant No. CBET
1250107.
1J. Huang, K. Yu, G. Gu, and M. Karttunen, Phys. Rev. E 67(5), 051405 (2003).2H. A. Pohl and H. Pohl, Dielectrophoresis: The Behavior of Neutral Matter in Nonuniform Electric Fields (CambridgeUniversity Press, Cambridge, 1978).
3J. D. Salgado, K. Horiuchi, and P. Dutta, J. Micromech. Microeng. 16, 920–928 (2006).4K. R. Foster, F. A. Sauer, and H. P. Schwan, Biophys. J. 63(1), 180 (1992).5R. Pethig, Biomicrofluidics 4(2), 022811 (2010).6T. B. Jones, IEEE Eng. Med. Biol. Mag. 22(6), 33–42 (2003).7T. Z. Jubery, S. K. Srivastava, and P. Dutta, Electrophoresis 35, 691–713 (2014).8Y. Takamura, H. Onoda, H. Inokuchi, S. Adachi, A. Oki, and Y. Horiike, Electrophoresis 24(1–2), 185–192 (2003).9G. T. Roman, T. Hlaus, K. J. Bass, T. G. Seelhammer, and C. T. Culbertson, Anal. Chem. 77(5), 1414–1422 (2005).
10I. M. Lazar and B. L. Karger, Anal. Chem. 74(24), 6259–6268 (2002).11M. Washizu and T. Jones, J. Electrost. 38(3), 199–211 (1996).12Y. Huang, R. Holzel, R. Pethig, and X.-B. Wang, Phys. Med. Biol. 37(7), 1499 (1992).13X.-B. Wang, Y. Huang, P. R. Gascoyne, F. F. Becker, R. H€olzel, and R. Pethig, Biochim. Biophys. Acta 1193(2),
330–344 (1994).14A. Goater and R. Pethig, Parasitology 117(07), 177–189 (1999).15W. Arnold and U. Zimmermann, J. Electrost. 21(2), 151–191 (1988).16C. Huang, A. Chen, M. Guo, and J. Yu, Biotechnol. Lett. 29(9), 1307–1313 (2007).17W. F. Pickard, Il Nuovo Cimento 21(2), 316–332 (1961).18H. A. Pohl and J. S. Crane, Biophys. J. 11(9), 711–727 (1971).19D. Hou and H.-C. Chang, Phys. Fluids 18(7), 071702 (2006).20L. H. Chau, W. F. Liang, F. W. K. Cheung, W. K. Liu, W. J. Li, S. C. Chen, and G. B. Lee, PloS One 8(1), e51577 (2013).21C. Vaillier, T. Honegger, F. Kermarrec, X. Gidrol, and D. Peyrade, PloS One 9(4), e95231 (2014).22A. Gonzalez, A. Ramos, N. Green, A. Castellanos, and H. Morgan, Phys. Rev. E 61(4), 4019 (2000).23S.-J. Liu, H.-H. Wei, S.-H. Hwang, and H.-C. Chang, Phys. Rev. E 82(2), 026308 (2010).24J. Wu, Y. Ben, D. Battigelli, and H.-C. Chang, Ind. Eng. Chem. Res. 44(8), 2815–2822 (2005).25J. Wu, Y. Ben, and H.-C. Chang, Microfluid. Nanofluid. 1(2), 161–167 (2005).26H. Zhou, L. R. White, and R. D. Tilton, J. Colloid Interface Sci. 285(1), 179–191 (2005).27P. Tathireddy, Y.-H. Choi, and M. Skliar, J. Electrost. 66(11), 609–619 (2008).28T. Z. Jubery and P. Dutta, Numerical Heat Transfer, Part A 64, 107–131 (2013).29H. Morgan and N. G. Green, AC Electrokinetics: Colloids and Nanoparticles (Research Studies Press, 2003).30N. G. Green, A. Ramos, A. Gonzalez, H. Morgan, and A. Castellanos, Phys. Rev. E 66(2), 026305 (2002).31A. Ramos, H. Morgan, N. Green, and A. Castellanos, J. Phys. D: Appl. Phys. 31(18), 2338 (1998).32T. Z. Jubery, M. R. Hossan, D. R. Bottenus, C. F. Ivory, W. Dong, and P. Dutta, Biomicrofluidics 6, 016503 (2012).33D. C. Duffy, J. C. McDonald, O. J. A. Schueller, and G. M. Whitesides, Anal. Chem. 70(23), 4974–4984 (1998).34K. Yao, L. Zhang, X. Yao, and W. Zhu, J. Mater. Sci. 32(14), 3659–3665 (1997).35G. K. Scriba, J. Chromatogr. A 1159(1), 28–41 (2007).36S. P. Porras, M. L. Riekkola, and E. Kenndler, Electrophoresis 24(10), 1485–1498 (2003).37J. A. Monick, Alcohols: Their Chemistry, Properties, and Manufacture (Reinhold Book Corporation, New York, 1968).38I. E. Valk�o, H. Sir�en, and M. L. Riekkola, J. Microcolumn Sep. 11(3), 199–208 (1999).39M. R. Hossan, R. Dillon, A. K. Roy, and P. Dutta, J. Colloid Interface Sci. 394, 619–629 (2013).40M. R. Hossan, R. Dillon, and P. Dutta, J. Comput. Phys. 270, 640–659 (2014).41M. Z. Bazant, K. Thornton, and A. Ajdari, Phys. Rev. E 70(2), 021506 (2004).42See supplementary material at http://dx.doi.org/10.1063/1.4943032 for rotation of barium titanate microparticles in 2-
propanol and methanol at different electric field frequency.
024101-14 Md. Walid Rezanoor and P. Dutta Biomicrofluidics 10, 024101 (2016)
Reuse of AIP Publishing content is subject to the terms at: https://publishing.aip.org/authors/rights-and-permissions. Downloaded to IP: 134.121.73.146 On: Wed, 02 Mar
2016 16:18:55