com mesurar la relació entre innovació i productivitat
TRANSCRIPT

Innovation and productivity in Innovation and productivity in
firmsfirmsBronwyn H. Hall
University of Maastricht and UC Berkeley

OutlineOutline
� Intro
� Innovation
� Productivity
� Modeling the relationship
� Empirical evidence

MotivationMotivation
� Why this topic?
� Productivity growth a major determinant of economic welfare
� Innovative activity (new goods and services, improvements to production efficiency) widely thought to contribute to productivity growth
� Is this true? And by how much?

IntroductionIntroduction
� What are the mechanisms connecting innovation and productivity?
◦ Improvements within existing firms
� Creation of new goods & services, leading to
increased demand for firm’s products
� Process and organizational innovation leading
to efficiency gains in production
◦ Entry of more efficient firms and firms on
technology frontier
◦ Exit of less efficient firms

Sweden
Jun
e
200
8
Definition of innovationDefinition of innovation
� The first attempt to put a new product or process into practice (Fagerberg, Mowery, and Nelson, Oxford Handbook of Innovation, Chapter 1)
� “An innovation is the implementation of a new or significantly improved product (good or service), or process, a new marketing method, or a new organisational method in business practices, workplace organisation or external relations.” (Oslo Manual, OECD 2005, third edition, p. 46)
Measuring innovationMeasuring innovation
� Large literature using R&D (capital) as a
proxy for innovation input
◦ Hall, Mairesse, Mohnen 2010 survey
� Smaller literature using patents as a
proxy for intermediate innovation output
� Both measures have weaknesses,
especially outside manufacturing sector.
� Now we have more direct measures – do
they help?
Measuring innovationMeasuring innovation
� Earlier work:◦ SPRU – obtained by asking industry participants◦ Acs & Audretsch – 1982 trade journals, etc.
� Innovation surveys (CIS in Europe, also in Latin American and other countries, in US as of 2008):◦ Product or process new to market (yes/no)◦ Share of sales during past 3 years from new
products◦ Later surveys have expenditures on various
kinds of innovation investments – nonresponseproblems
� Next two figures add the new US data to graphs produced by OECD in Measuring Innovation
June 2008 Sweden
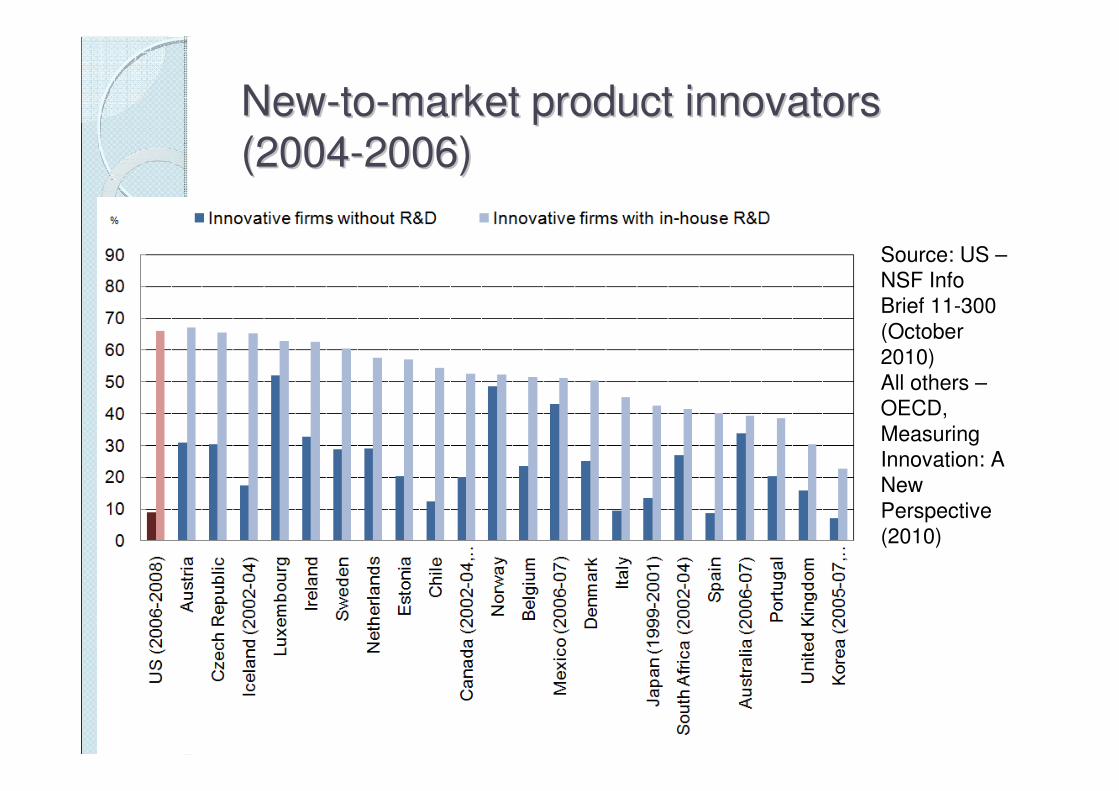
NewNew--toto--market product innovators market product innovators
(2004(2004--2006)2006)
Source: US –
NSF Info
Brief 11-300
(October
2010)
All others –
OECD,
Measuring
Innovation: A
New
Perspective
(2010)
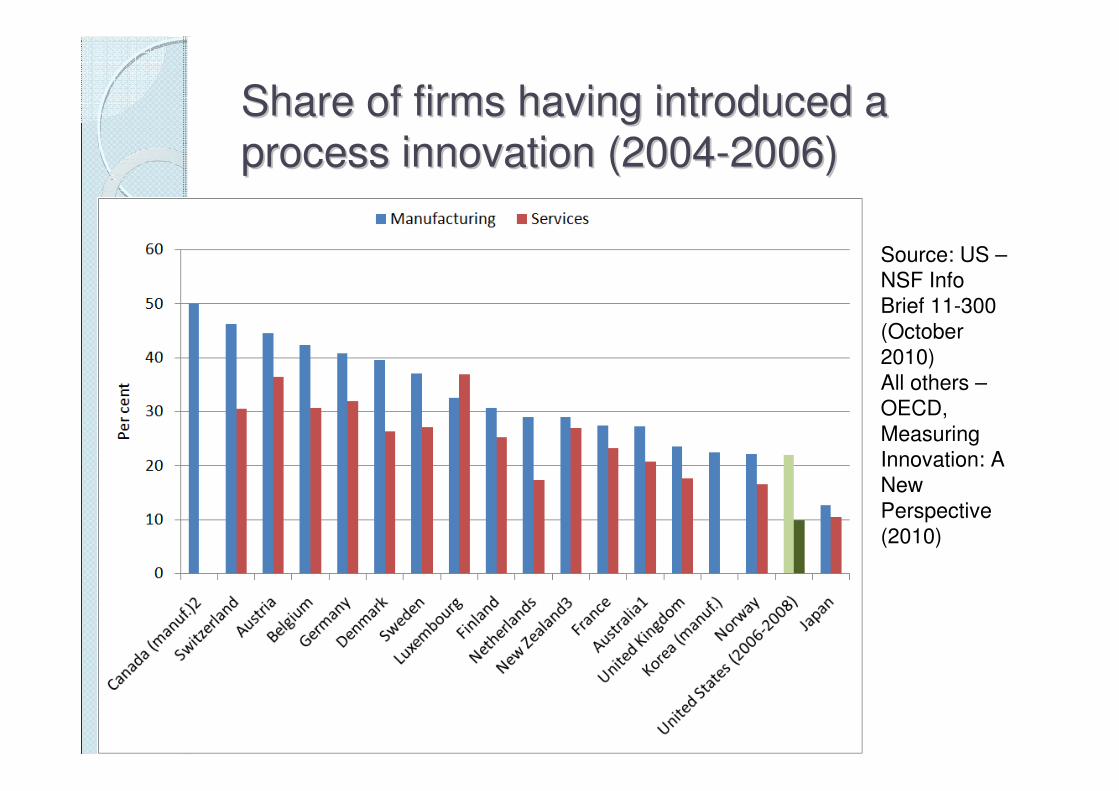
Share of firms having introduced a Share of firms having introduced a
process innovation (2004process innovation (2004--2006)2006)
Source: US –
NSF Info
Brief 11-300
(October
2010)
All others –
OECD,
Measuring
Innovation: A
New
Perspective
(2010)
ProductivityProductivity
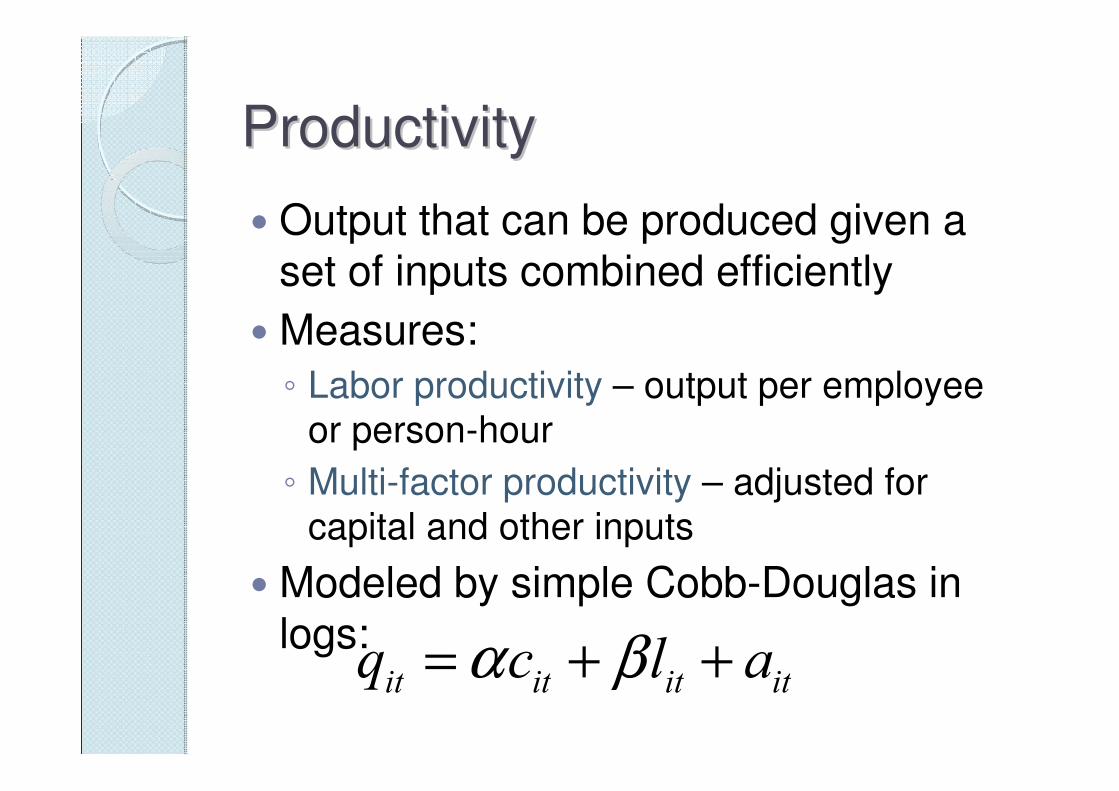
� Output that can be produced given a set of inputs combined efficiently
� Measures:
◦ Labor productivity – output per employee
or person-hour
◦ Multi-factor productivity – adjusted for
capital and other inputs
� Modeled by simple Cobb-Douglas in logs:
it it it itq c l aα β= + +
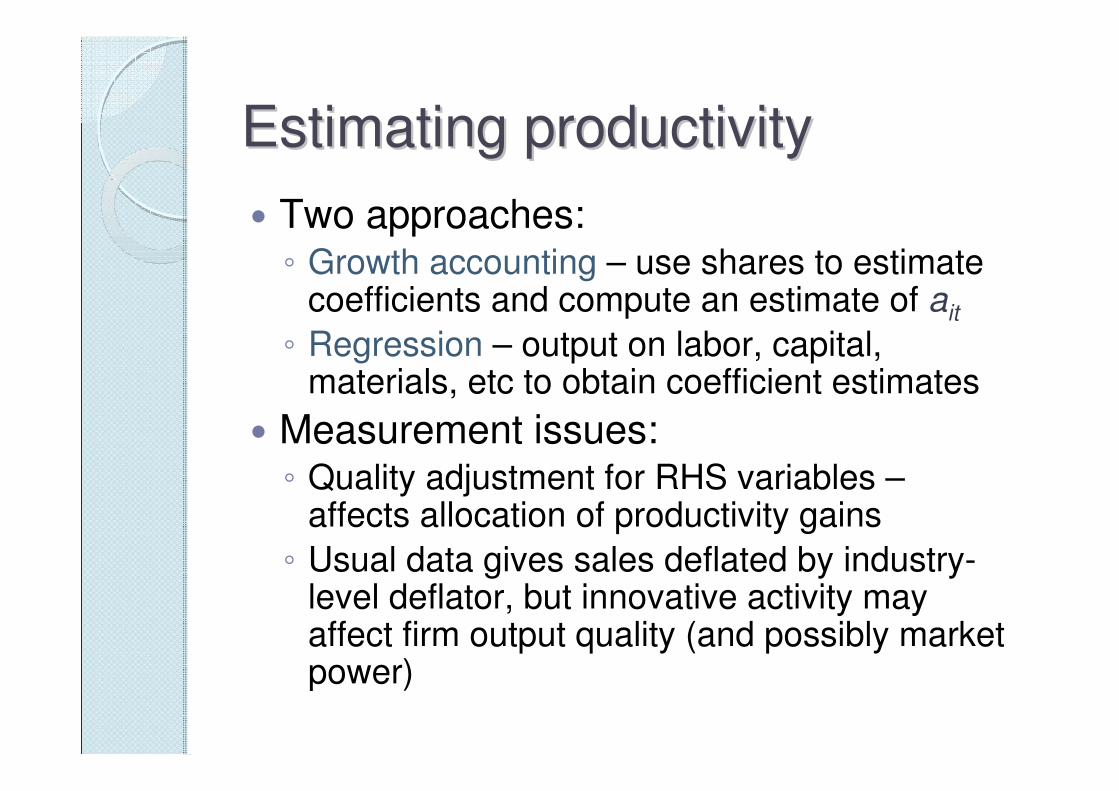
Estimating productivityEstimating productivity
� Two approaches:◦ Growth accounting – use shares to estimate
coefficients and compute an estimate of ait
◦ Regression – output on labor, capital, materials, etc to obtain coefficient estimates
� Measurement issues:◦ Quality adjustment for RHS variables –
affects allocation of productivity gains
◦ Usual data gives sales deflated by industry-level deflator, but innovative activity may affect firm output quality (and possibly market power)
Adding demand and Adding demand and
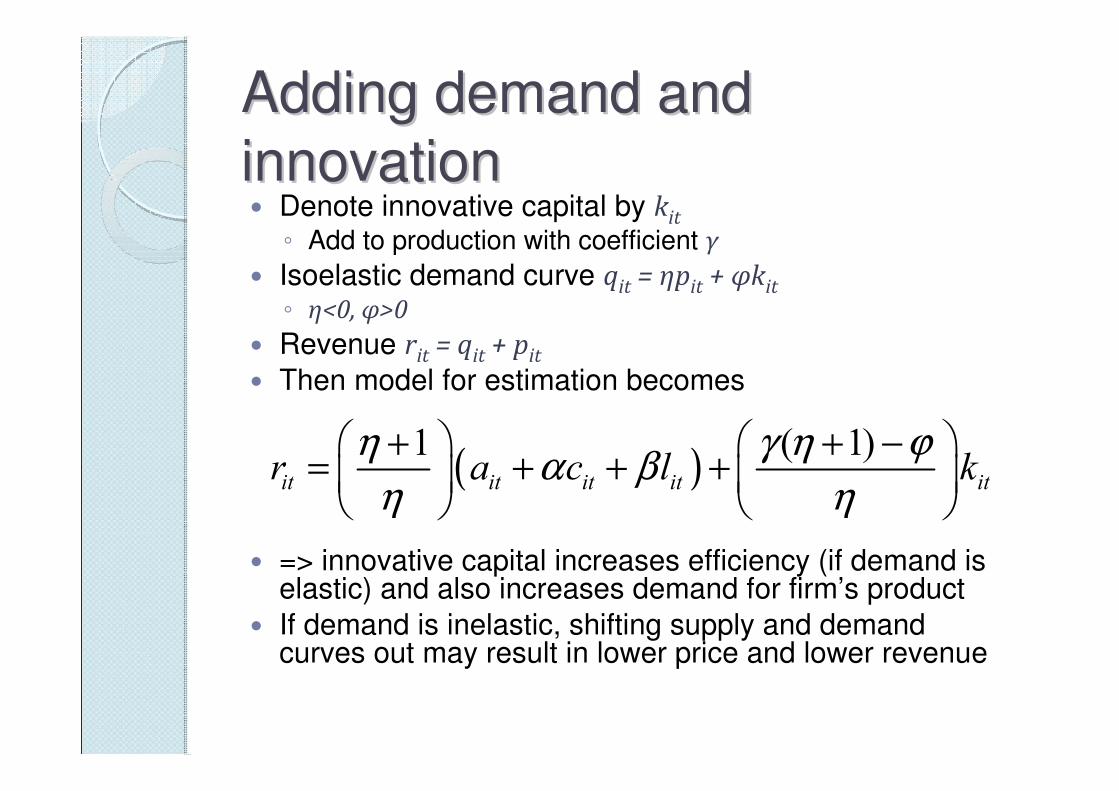
innovationinnovation� Denote innovative capital by kit
◦ Add to production with coefficient γ
� Isoelastic demand curve qit = ηpit + φkit
◦ η<0, φ>0
� Revenue rit = qit + pit
� Then model for estimation becomes
� => innovative capital increases efficiency (if demand is elastic) and also increases demand for firm’s product
� If demand is inelastic, shifting supply and demand curves out may result in lower price and lower revenue
( )1 ( 1)
it it it it itr a c l kη γ η ϕ
α βη η
+ + −= + + +
Reviewing the evidenceReviewing the evidence
� Focus here on micro evidence using CDM model (Crepon Duguet Mairesse1998)
◦ Innovation survey data reveals that some
non-R&D firms innovate and some R&D
firms do not innovate
◦ Data is usually cross-sectional, so
simultaneity between R&D, innovation,
and productivity
◦ Model attempts to accommodate these
features of the data

CDM ModelCDM Model
� Stylized summary
◦ Doing R&D and R&D intensity = f (firm
size, industry, other characteristics)
◦ Innovating and Innovation intensity =
f (predicted R&D, other firm
characteristics)
◦ Labor productivity = f (capital or
investment, predicted innovation, ……)
What have we learned from CIS What have we learned from CIS
about the innovation measures? about the innovation measures? � R&D-productivity revisited
◦ CDM model of R&D ⇒ innovation ⇒productivity
◦ estimated for ~12 countries (or more)
◦ confirmed rates of return to R&D found in
earlier studies
◦ Like patents, innovation output statistics
are much more variable (“noisier”) than
R&D, and R&D tends to predict
productivity better
June 2008 Sweden
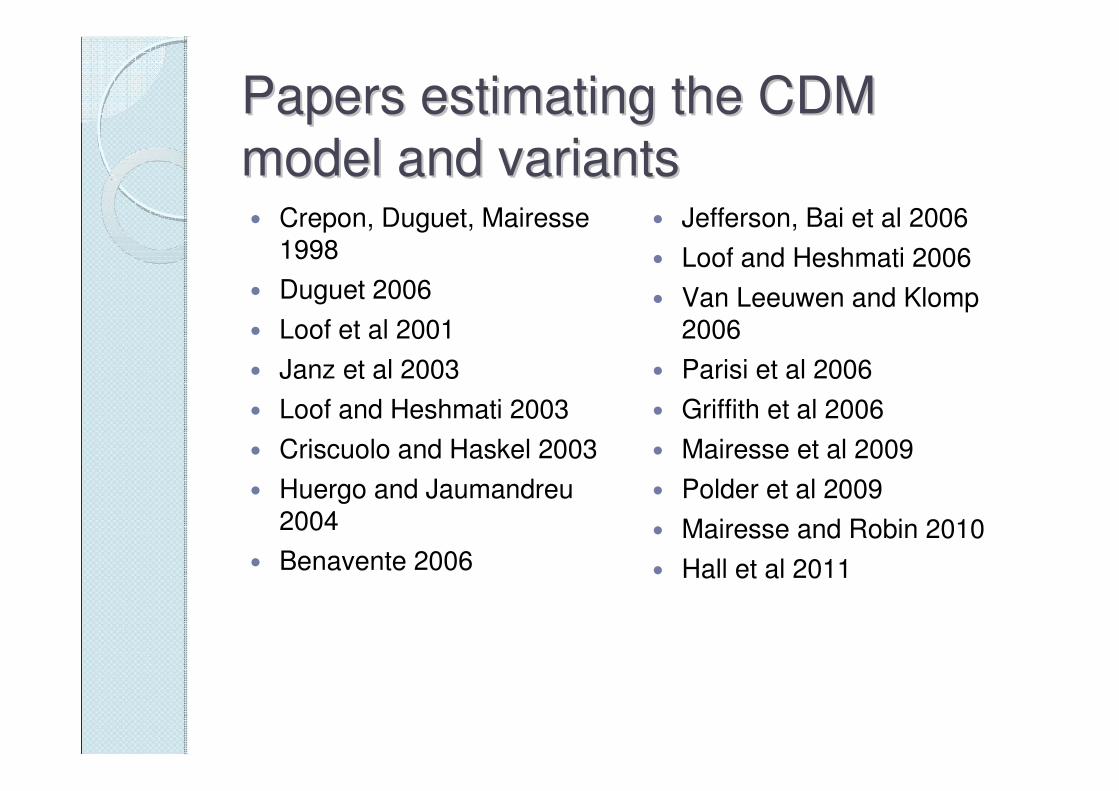
Papers estimating the CDM Papers estimating the CDM
model and variantsmodel and variants� Crepon, Duguet, Mairesse
1998
� Duguet 2006
� Loof et al 2001
� Janz et al 2003
� Loof and Heshmati 2003
� Criscuolo and Haskel 2003
� Huergo and Jaumandreu2004
� Benavente 2006
� Jefferson, Bai et al 2006
� Loof and Heshmati 2006
� Van Leeuwen and Klomp2006
� Parisi et al 2006
� Griffith et al 2006
� Mairesse et al 2009
� Polder et al 2009
� Mairesse and Robin 2010
� Hall et al 2011

Level Level vsvs growthgrowth
� CDM is in terms of productivity levelsprimarily for data availability reasons
� It seems more natural to think of innovative activity as affecting productivity growth
� Some work along these lines, but matching across surveys usually leaves a very selected sample, possibly not representative
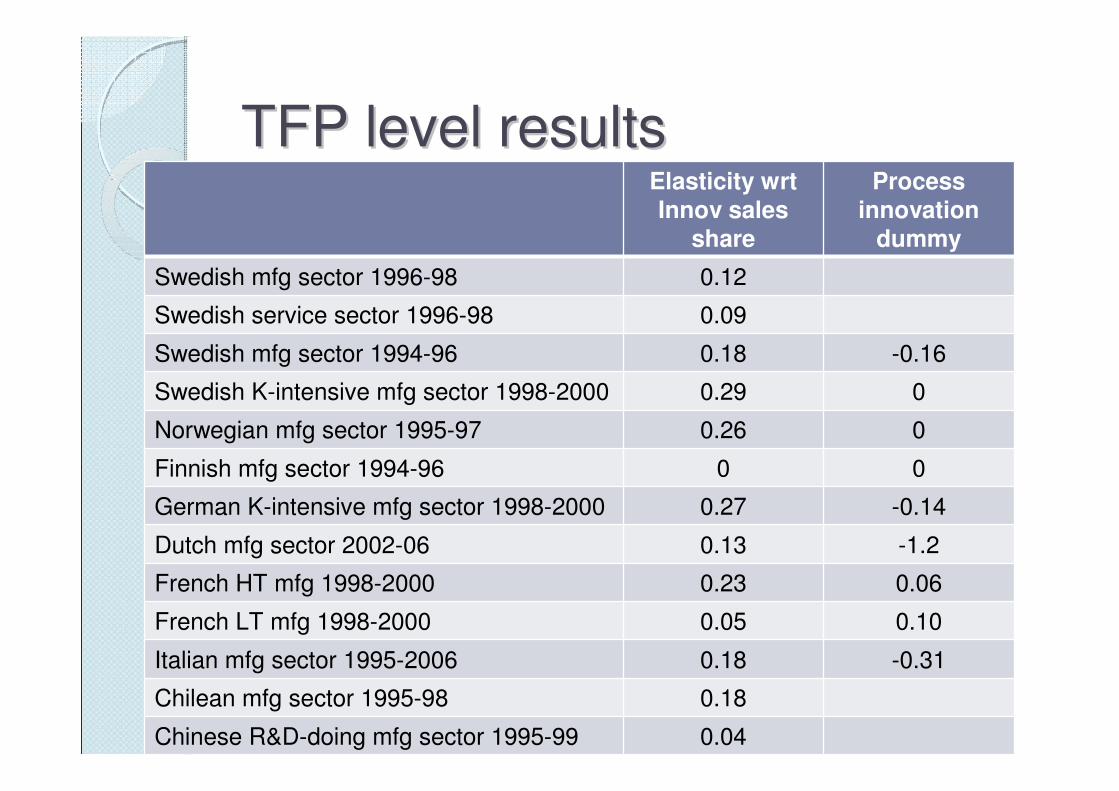
TFP level resultsTFP level resultsElasticity wrt
Innov sales
share
Process
innovation
dummy
Swedish mfg sector 1996-98 0.12
Swedish service sector 1996-98 0.09
Swedish mfg sector 1994-96 0.18 -0.16
Swedish K-intensive mfg sector 1998-2000 0.29 0
Norwegian mfg sector 1995-97 0.26 0
Finnish mfg sector 1994-96 0 0
German K-intensive mfg sector 1998-2000 0.27 -0.14
Dutch mfg sector 2002-06 0.13 -1.2
French HT mfg 1998-2000 0.23 0.06
French LT mfg 1998-2000 0.05 0.10
Italian mfg sector 1995-2006 0.18 -0.31
Chilean mfg sector 1995-98 0.18
Chinese R&D-doing mfg sector 1995-99 0.04
TFP levels on TFP levels on innovinnov sales sales
shareshare� Robustly positive, supports the view that
product innovation shifts the firm’s demand curve out◦ Elasticities range from 0.04 to 0.29 with a
typical standard error of 0.03
◦ K-intensive and hi-tech firms have higher elasticities (equalized rates of return)
� Coefficient of process innovation dummy usually insignificant or negative, suggesting market power – profits may increase, but revenue productivity does not
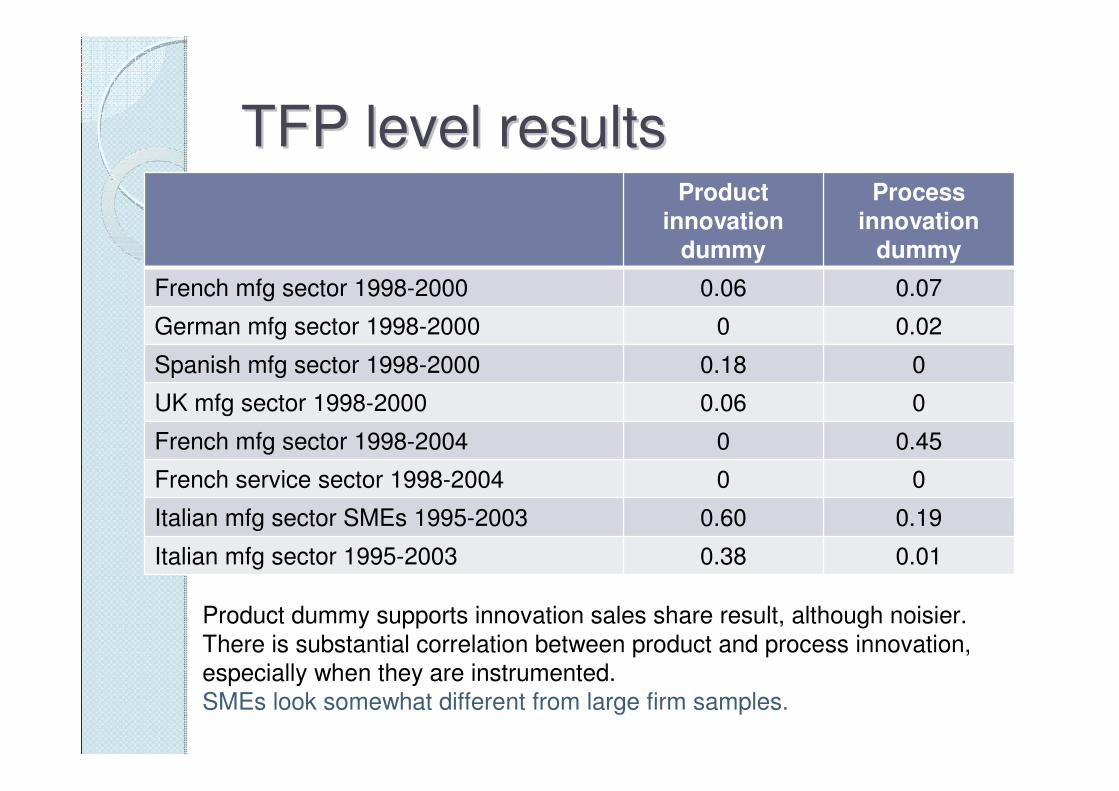
TFP level resultsTFP level resultsProduct
innovation
dummy
Process
innovation
dummy
French mfg sector 1998-2000 0.06 0.07
German mfg sector 1998-2000 0 0.02
Spanish mfg sector 1998-2000 0.18 0
UK mfg sector 1998-2000 0.06 0
French mfg sector 1998-2004 0 0.45
French service sector 1998-2004 0 0
Italian mfg sector SMEs 1995-2003 0.60 0.19
Italian mfg sector 1995-2003 0.38 0.01
Product dummy supports innovation sales share result, although noisier.
There is substantial correlation between product and process innovation,
especially when they are instrumented.
SMEs look somewhat different from large firm samples.
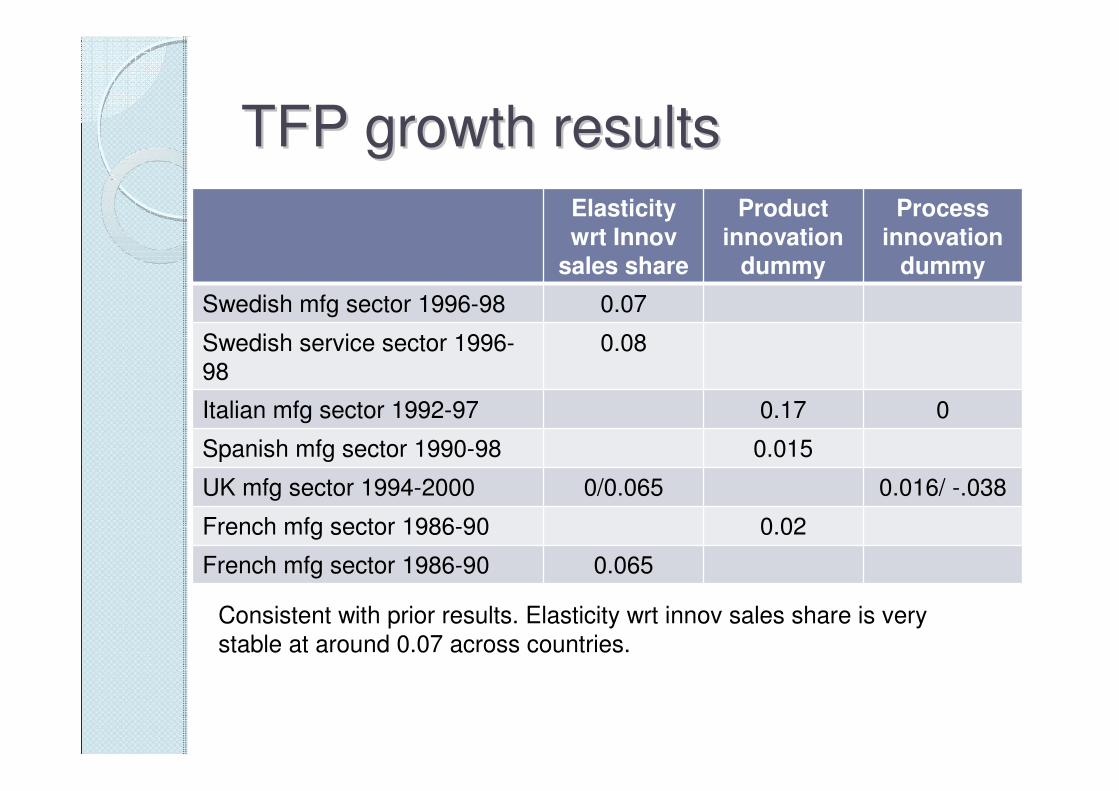
TFP growth resultsTFP growth results
Elasticity
wrt Innov
sales share
Product
innovation
dummy
Process
innovation
dummy
Swedish mfg sector 1996-98 0.07
Swedish service sector 1996-
98
0.08
Italian mfg sector 1992-97 0.17 0
Spanish mfg sector 1990-98 0.015
UK mfg sector 1994-2000 0/0.065 0.016/ -.038
French mfg sector 1986-90 0.02
French mfg sector 1986-90 0.065
Consistent with prior results. Elasticity wrt innov sales share is very
stable at around 0.07 across countries.
ConclusionsConclusions
� Product innovation generally has a substantial positive impact on revenue productivity at the firm level
� Process innovation less so, impact is zero or negative in general, although not for SMEs.◦ Suggests that demand facing large firms is
less elastic than that facing SMEs.◦ Existing firms improve their productivity by
pushing out the demand curve rather than by increasing production efficiency◦ Suggests a closer look at the role of entry
and exit in improving sectoral productivity