colorado state tax basics 2015 - colorado fiscal … state tax basics ... chapter 1 – fundamentals...
TRANSCRIPT
1
Colorado State Tax Basics
2015

2
Table of Contents
Chapter 1 – Fundamentals of a Good Tax System---------------------------------------------------------------------3
Principle One: Provide Adequate and Timely Revenue-------------------------------------------------------------3
Principle Two: Distribute Burdens Equitably--------------------------------------------------------------------------5
Principle Three: Promote Economic Efficiency and Growth-------------------------------------------------------6
Principle Four: Be Simple and Professionally Administered-------------------------------------------------------7
Principle Five: Ensure Accountability------------------------------------------------------------------------------------8
Colorado Fiscal Institute Tax Principles---------------------------------------------------------------------------------9
Chapter 2 – Colorado’s Tax System---------------------------------------------------------------------------------------10
Tax Collections in Colorado-----------------------------------------------------------------------------------------------10
How Colorado Ranks in Comparison to Other States ------------------------------------------------------------- 12
Who Pays Colorado Taxes?-----------------------------------------------------------------------------------------------13
What Doesn’t Get Paid – The Effect of Tax Expenditures---------------------------------------------------------15
Chapter 3 – Colorado’s Tax Portfolio ------------------------------------------------------------------------------------16
State Taxes -------------------------------------------------------------------------------------------------------------------16
Income Tax---------------------------------------------------------------------------------------------------------------- 16
Individual Income Tax------------------------------------------------------------------------------------------------17
Corporate Income Tax-----------------------------------------------------------------------------------------------18
Excise Taxes---------------------------------------------------------------------------------------------------------------18
Sales and Use Tax-----------------------------------------------------------------------------------------------------18
Severance Tax----------------------------------------------------------------------------------------------------------22
Motor Fuels Tax-------------------------------------------------------------------------------------------------------23
Cigarette Taxes--------------------------------------------------------------------------------------------------------23
Alcohol Taxes---------------------------------------------------------------------------------------------------------- 24
Marijuana Taxes-------------------------------------------------------------------------------------------------------24
Other Taxes----------------------------------------------------------------------------------------------------------------25
Gaming Taxes----------------------------------------------------------------------------------------------------------25
Estate and Inheritance Taxes-------------------------------------------------------------------------------------- 25
Regulatory and Business Taxes------------------------------------------------------------------------------------26
Local Taxes------------------------------------------------------------------------------------------------------------------- 26
Property Taxes------------------------------------------------------------------------------------------------------------26
Sales Taxes-----------------------------------------------------------------------------------------------------------------32

3
CHAPTER 1
FUNDAMENTALS OF A GOOD TAX SYSTEM
A tax system is a set of rules and regulations that allow a government to collect the revenue needed to
fund public services. The National Conference of State Legislatures (NCSL) has articulated a set of
principles that help define a good tax policy structure.1 The following analysis evaluates Colorado’s tax
system using the NCSL tax principles.
Principle One: Provide Adequate and Timely Revenue
Revenue Adequacy
The purpose of a tax system is to raise adequate revenue to fund public services. Adequacy is
measured by whether the system generates sufficient revenue to fund legislatively-enacted priorities.
These priorities typically include K-12 education, health, human services and corrections.
Inherent in this principle is the notion that the need for public services should drive the collection of
tax revenue. Certain states (such as Colorado with the implementation of the Taxpayer’s Bill of Rights,
or TABOR) have ignored this, flipping the principle on its head and capping funding based on a formula
that attempts to define the need for public services based on a defined amount of revenue.
Unfortunately, this “reversed accounting” system has created a funding deficit that is projected to
worsen in the
future. A 2011
study conducted by
the University of
Denver states that
even with a strong
economic recovery
from the Great
Recession and
sustained job
growth over the
next decade,
Colorado will not
produce adequate
revenue to support
Medicaid funding
and public schools,
let alone the other
programs funded
1 This is a condensed summary of the principles. For a complete listing and a more in-depth discussion, please see: Snell, Ronald, “New Realities in State
Finance,” The National Conference of State Legislatures, Washington D.C., 2004.

4
through the General Fund, such as higher education and corrections2. The study forecasts that over the
next 15 years, the state’s annual spending on Medicaid will nearly triple and the funding required for
public education will more than double. Meanwhile the General Fund will only grow 86 percent.
Adequacy is an issue for nearly every major area of the state budget. The Colorado Department of
Transportation is suffering from inadequacy of state funds. CDOT estimates that the state needs to
increase funding by $2.1 billion annually to accommodate growth and maintain the current
transportation system.3
Schools are facing a billion dollar shortfall in state funds as well. The Colorado School Finance Project
predicts that an additional $2.9 billion dollars is needed annually to provide all Colorado students with
a sufficient education (defined as 100 percent proficiency).4 This doesn’t even include maintenance
and construction of school buildings and facilities.
However, no increases in funding are anticipated. Even in the health sector, where current revenues
will likely support funding at 2007 levels, funding is decidedly inadequate. Health care coverage in
Colorado left roughly 741,000 people uninsured in 2013, which equates to about one in every seven
Coloradans.5
Revenue Timeliness
A good tax system must also ensure that revenues remain adequate over time. A tax system's revenues
are inadequate when its portfolio of taxes grows at a slower rate than the cost of maintaining public
services. The formula contained in Colorado’s TABOR amendment guarantees that state revenue
increases more slowly than the economy by forcing rebates of revenue collected in excess of per capita
inflationary increases. TABOR also promises a shortfall in revenue since the price of items purchased by
state government increases faster than the Consumer Price Index (“CPI”). Traditionally, annual
increases in the CPI have been below the increase in costs associated with public purchases, such as
health care and education.6 When costs exceed available revenue, reductions in service levels occur.
Long-term structural changes in the economy can also reduce tax revenue. For example, the sales tax is
a large source of revenue for Colorado (estimated to be just over 26 percent of General Fund revenue
collections in FY 2014-15).7 However, the amount of revenue Colorado collects from the sales tax has
been decreasing because of the shift in personal consumption from taxed goods to untaxed services.
This means that over time, revenue collected from sales taxes will support fewer and fewer public
services even with a constant sales tax rate.
2 Financing Colorado’s Future: An Analysis of the Fiscal Sustainability of State Government, University of Denver Center for Colorado’s Economic Future,
April 2011 at http://www.du.edu/economicfuture/documents/CCEF_ReportPhase1.pdf. 3 THE NEXT STEP: To maintain and improve Colorado’s transportation system, Move Colorado, March 26, 2010 at
http://movecolorado.org/news_room/assets/perspectives/nextstep.pdf. 4 Investing in P-12 Education and Achieving State Education Requirements, 2008, Colorado School Finance Project, accessed January 7, 2011 at
http://www.cosfp.org/AdeqUpdate/AdequacyWork/InvestingInEducation.pdf. 5 Colorado Health Access Survey, Colorado Health Institute, October 17, 2014 at http://www.coloradohealthinstitute.org/key-issues/category/health-
coverage-and-the-uninsured. 6 BLS Statistics were used for a 15 year comparison of the Higher Education Price Index, the Employment Cost Index and the Medical Care Cost Index with
the Consumer Price Index for Denver, Boulder Greeley. 7 Budget in Brief, Colorado General Assembly Joint Budget Committee, FY 2014-15, accessed October 28, 2014 at
http://www.tornado.state.co.us/gov_dir/leg_dir/jbc/FY14-15BIB.pdf.
5
The second component of adequacy over time involves revenue timeliness. This principle is important
because it allows states to account for and weather the impact of cyclical economic changes.
Successful balancing strategies include a diverse tax portfolio and a budget reserve to stabilize cyclical
variations.
Colorado’s state tax system is heavily dependent on income tax and on capital gains taxes due
primarily to the large amount of investment-dependent income in Colorado. Colorado is one of the top
10 states most heavily dependent on income tax.8 This results in greater volatility in revenue since the
incomes of top earners, which comprise a large portion of state tax collections, tend to be more
susceptible to economic booms or busts.
Additionally, Colorado ranks 10th highest in capital gains dependence among the 41 states with an
income tax.9 Such a heavy dependence on capital gains revenue means that shocks to the stock
market can have devastatingly volatile consequences for revenue in Colorado. This effect was evident
during the economic downturn in 2001, when Colorado’s drop in tax revenue was one of the steepest
in the country. A similar trend was identified in the more recent economic downturn in 2009.
One impediment to adequacy over time is the practice of designating a particular revenue source for a
specific expenditure, commonly called “earmarking.” Earmarking often restricts or prevents flexible
allocations of tax revenue across spending priorities.
These restrictions prevent governments from making adjustments to ensure stable revenue amidst
changing economic conditions. A high-quality revenue system minimizes the use of tax earmarking.
Colorado relies heavily on earmarked revenue to finance public services. For example, the K-12
education system receives state funding from a special education fund that is funded by an earmark of
0.33 percent state income tax collections10. Similarly, all revenues generated from the Colorado Lottery
are earmarked to support state parks, recreation, open space, conservation education and wildlife
projects.11
Principle Two: Distribute Burdens Equitably
A successful tax system distributes the cost of public services equitably amongst taxpayers. Two
fundamental principles of equitable taxation are “vertical equity” and “horizontal equity.”
Vertical Equity
A tax system displays vertical equity when it fairly distributes taxes among people with different
incomes. One way to distribute taxes fairly is to distribute the cost of public services based on a
taxpayer’s ability to pay. Another way is to require that taxpayers pay taxes proportionately, which
means paying an equal percentage of taxes relative to their income.
8 Povich, Elaine S., Volatile Income Tax Revenues Stump States, Stateline, The Pew Charitable Trusts, October 13, 2014 at
http://www.pewtrusts.org/en/research-and-analysis/blogs/stateline/2014/10/13/volatile-income-tax-revenue-stumps-states 9 Dadayan, Lucy and Boyd, Donald, April “Surprises” More Surprising than Expected, State Revenue Special Report, The Nelson A. Rockefeller Institute of
Government, June 2014 at http://www.rockinst.org/pdf/government_finance/state_revenue_report/2014-06-12-Special_Report.pdf. 10
Amendment 23, Great Education Colorado, accessed January 10, 2011 at http://www.greateducation.org/statistics-faqs/funding-faqs/amendment-23/. 11
Where the Money Goes, Colorado Lottery, accessed January 10, 2011 at http://www.coloradolottery.com/index.cfm/ID/69/Where-the-Money-Goes/

6
The vertical equity (or inequity) of a tax system is characterized by the distribution of taxes among
people in different circumstances. A tax system can be defined as either “progressive” or “regressive.”
A progressive tax system increases taxation as incomes increase. A regressive tax system, on the other
hand, is one where low-income earners pay a greater share of their incomes in taxes than do those
with high incomes.
The combined state and local tax systems of most states are regressive. State income taxes that are
based on the progressive federal income tax are progressive; however, sales and excise taxes are
regressive as are property taxes.
Source: Institute of Taxation and Economic Policy
Overall, Colorado’s tax system is regressive, although it does have comparable regressivity to that of
the average U.S. state and local tax system. In Colorado, those making the least pay a higher
proportion of their income in taxes than those in the highest income groups.
Horizontal Equity
Horizontal equity is the distribution of taxes among people with the same income. The general
principle is that those with similar circumstances should have similar tax obligations.
Colorado’s tax system includes tax provisions that benefit one segment of the population and
disadvantage another. One of the most prevalent of those provisions is the business personal property
tax. Businesses that rely heavily on high-valued machinery and equipment pay significantly more in
property taxes than businesses that require little to no capital equipment.
This kind of disparity results in horizontal inequities.
Principle Three: Promote Economic Efficiency and Growth
In general, the central purpose of collecting taxes is to raise revenue. However, tax policy is often used
to promote or incentivize certain behaviors. For example, excise taxes may be used to discourage

7
certain behaviors that create public and social costs. Using tax policy to steer economic behavior can
be considered economically inefficient because a large portion of tax breaks go to people and
businesses for doing what they would have done anyway.
How a state tax system affects economic growth is an important policy consideration. When
considering taxes on individuals and businesses, the usual concern is over tax policies so significant
that they would cause taxpayers to move from, or avoid locating in, a state or that would cause them
to shop across state borders. Yet, when evaluating its competitive position, a state should be aware
that tax policy is only one consideration in business location decisions. The quality of publicly provided
services is often a more important consideration.
Colorado’s tax system includes many sales tax exemptions and income tax credits valued at more than
$2.6 billion annually.12 Many more income tax exemptions and special deductions are not reported at
the state-level since they are applied to the calculation of federal taxable income. As will be discussed
in detail later, Colorado’s taxable income is based on federal taxable income. Thus, federal exemptions
and deductions, such as student loan interest deductions and the deduction for moving expenses, cost
Colorado income tax revenue even though they are not enacted by the state.
Principle Four: Be Simple and Professionally Administrated
A good tax system should be designed simply. Simplicity minimizes administrative collections costs and
taxpayer compliance costs. It also reinforces confidence in the fairness of a tax system by reducing
evasion.
Certainty
A key part of simplicity is certainty. Certainty requires that the number and types of changes made to a
tax system will be kept to a minimum. Individuals and businesses should not be subject to frequent
changes in tax rates or tax base because it interferes with economic choices and the ability to develop
long-term financial plans. As a corollary, in states such as Colorado where changes in rates require
voter approval, a large number of tax-generating initiatives will decrease political capital for achieving
tax revenue adequacy.
Colorado’s tax system has remained fairly constant over time. The Taxpayer’s Bill of Rights (TABOR)
amendment restricts changes in the tax system by requiring voter approval for tax increases and new
taxes that generate net increases in revenue. Since TABOR’s passage in 1992, the state of Colorado has
enacted only one significant tax increase — a tobacco tax increase approved in 2005.
Tax Administration
Our current revenue system is dependent on voluntary compliance. Voluntary compliance requires
professional tax administration. Tax administration involves assessing and collecting taxes owed.
Professional and uniform tax administration, both throughout the state and within individual
jurisdictions, enhances the effectiveness of voluntary compliance. Tax evasion is a quantitatively
12
Colorado Tax Profile and Expenditure Report 2012, Colorado Department of Revenue at https://www.colorado.gov/pacific/sites/default/files/2012.pdf.

8
significant phenomenon that affects the adequacy, equity, economic efficiency and simplicity of
administration of a tax system.
The problem of tax evasion also raises challenging questions about the appropriate design of the tax
compliance system. Questions include how many resources should be devoted to auditing suspected
evaders and for which taxes, how these resources should be allocated across classes of taxpayers and
how many resources should be devoted to taxpayer assistance versus monitoring.
Principle Five: Ensure Accountability
Notice and Transparency
The essence of accountability is that tax laws should be explicit and transparent. Truth-in-taxation
policies that require clearly written notices to taxpayers and hearings on tax policy changes are simple
methods of providing accountability. For state governments, tax expenditure reports are another way
of enhancing accountability. A tax expenditure report shows the costs, expressed in lost tax revenue, of
a tax credit or exemption that is intended to benefit specific taxpayers or encourage a public policy
goal. In addition to identifying the revenue lost from certain tax preferences, tax expenditure reports
may also provide data that can be used to evaluate the effectiveness and efficiency of tax policies.
Accountability in a larger sense means that policymakers examine the costs and benefits of using
revenue measures to put policies into effect. Since the budget process makes expenditures explicit, the
ideal revenue system includes tax expenditures as a direct appropriation in the budgetary system.
However, tax policy will inevitably continue to be used toward other policy objectives. Therefore,
lawmakers have a responsibility to ensure that tax policies produce their intended effect and do so at a
reasonable cost. Earmarked funds, tax expenditures and all other special tax preferences should be
reviewed regularly to assess their efficiency and effectiveness as policy measures.
Colorado produces few resources on government accountability and transparency, although there
have been improvements over the past couple of years. One major improvement is the addition of a
biennial tax expenditure report and tax overview called the Colorado Tax Profile and Expenditure
Report13. This report, made permanent by legislation in 2014, was first produced in 2013 and will be
produced every other year from now on. This report includes a listing of all tax expenditures,
information on who pays taxes in the state, and other data gathered from Colorado tax returns.
Another useful resource is the State Taxpayer Accountability Report (STAR). The STAR report is
produced annually by the Office of the State Controller and summarizes the fiscal operations in the
state14. The Colorado Department of Treasury also provides a resource for taxpayers to track where
their tax dollars go based on their income15.
Too often, the effects of legislative action on revenue collection or the distribution of tax responsibility
are unknown or unclear. This approach to tax policy has led to the increased number of credits and
exemptions and increased complexity and administration costs without a clear demonstration of the
resulting benefit.
13
Found here: https://www.colorado.gov/pacific/sites/default/files/2012.pdf 14
Found here: http://www.colorado.gov/dpa/dfp/sco/STAR/star.htm 15
Found here: http://www.colorado.gov/taxtracks/

9
Colorado Fiscal Institute Tax Principles:
The Colorado Fiscal Institute (CFI) promotes tax and budget policies that are effective, efficient,
equitable, transparent and accountable. CFI takes positions on new tax expenditures that affect the
sustainability and equity in Colorado’s state budget and tax system. We examine policy changes and
ideas using a set of principles, developed from the National Conference of State Legislatures’
guidelines that reflect our mission of sound fiscal policy to improve the well-being of individuals,
communities and the state as a whole.
CFI’s principles for evaluating tax credits, deductions and exemptions:
1. Is the tax expenditure effective? When evaluating a new tax credit, deduction or exemption,
CFI considers whether the proposed tax policy change is proven to meet a targeted goal. CFI
also considers the return on investment from the tax expenditure when compared to the
benefit and cost of investing in other state priorities.
2. Is the tax expenditure economically efficient? CFI evaluates all tax credits, deductions and
exemptions from an economic standpoint. A good tax expenditure will produce the intended
outcome without significant additional cost or disruption to public spending or the economy.
CFI also considers the behavior the tax policy is intended to incentivize and if this behavior
would occur without the change in law.
3. Is the tax expenditure equitable? Equity in evaluating tax policy changes focuses on who
benefits from the favored tax treatment proposed by the credit, deduction or exemption and
whether the beneficiaries, both direct and indirect, need the favorable treatment. All tax
expenditures create winners and losers in the tax system, and CFI evaluates the impact of the
policy change on who pays taxes in light of who currently shoulders the largest tax
responsibility. CFI evaluates the equitable distribution of the tax benefit based on ability to pay
and other principles of equity.
4. Will the tax expenditure be regularly reviewed and evaluated? Tax credits, deductions and
expenditures, just like any General Fund appropriations, need regular review to evaluate
whether they are working and to let taxpayers know how their money is being used. In order to
determine if a tax expenditure is achieving its targeted goal and is the best use of taxpayer
dollars, such tax breaks must be reviewed and evaluated regularly based on a clear set of
objectives. CFI always considers the measures of transparency and accountability that are
included in any new tax break or economic incentive.
5. Will the tax expenditure increase or decrease income inequality? Growing income inequality
is one of the top roadblocks to economic recovery because it limits the economic power of low-
and middle-income families. CFI considers the impact of the credit, deduction or exemption on
income inequality when evaluating any new tax credit. CFI prioritizes policies that broadly
benefit working families and generally opposes policies that create special tax treatment for
small groups of taxpayers. CFI analyzes the balance between the benefit promised by the
proposed tax policy and the impact of the change in revenue in order to determine the best
investment of taxpayer dollars.

10
CHAPTER 2
COLORADO’S TAX SYSTEM
Tax Collections in Colorado
In 2013, the state of Colorado collected $10.3 billion in tax revenue. 16 This is a 9.6 percent increase
from the previous year, when revenue collections peaked at just more than $9.4 billion.
The chart below shows a 10-year history of tax collections in Colorado. Colorado’s tax collections have
largely tracked federal tax collections. One exception occurred after the 2001 recession, when
declining capital gains and tax reductions implemented by the Colorado General Assembly led to a
steep drop in state tax revenue. Since that time, Colorado’s tax collections per $1,000 of personal
income gradually increased with economic growth until 2009, when tax collections decreased more
than 25 percent with recession. This decline was 10 percent greater than the average decline in tax
collections in the United States.17
Source: Colorado Legislative Council, 2009
16
Colorado Department of Revenue 2013 Annual Report, Colorado Department of Revenue, accessed October 28, 2014 at
https://www.colorado.gov/pacific/sites/default/files/2013%20Annual%20Report_0.pdf. 17
Kirk, Ron, Colorado’s Revenue and Tax Structure Power Point presentation, Colorado Reform Roundtable Fiscal Reform Subcommittee meeting, Aug. 6,
2010.

11
The chart (right) shows
the change in Colorado
taxes per $1,000 of
income between FY
1998-99 to FY 2008-09.
Colorado’s decrease in
tax revenue has been
fairly uniform across all
the types of taxes that
the state collects. The
largest decrease in taxes paid per $1,000 of income is in corporate income tax collection (39 percent).
The only tax that has increased during the past 10 years is the tobacco tax.
Colorado collects taxes to fund basic government programs through the General Fund. Individual and
corporate income taxes and sales and use taxes make up more than 97 percent of General Fund
revenue. Currently, individual income taxes make up the largest portion of General Fund revenues (65
percent).18
Income taxes have not always played such an important role in financing public services in Colorado.
While the general portfolio of taxes has remained the same, in 1975, individual income tax only made
up 38 percent of the General Fund. Several reasons account for this shift. First, sales tax collections
have decreased as a result of many sales tax exemptions that were enacted in the late 1970s and early
1980s when the state had significant budget surpluses. These exemptions were never repealed, unlike
the many income tax reductions enacted in the late 1970s and early 1980s that were largely repealed
to help the state's budget during the recession. A second reason for the shift is that federal tax reform
broadened the tax base upon which individual income taxes are levied. Since Colorado uses federal
taxable income as its starting point for the calculation of Colorado's income tax base (discussed later in
more detail), the broadening of the federal tax base increased the state's reliance on individual income
taxes.
64.5%8.2%
28.7%
4.0%
General Fund Revenues
FY 2014-15
38.8%
8.0%
36.6%
16.5%
General Fund Revenues
FY 1975-76
Individual Income Tax
Corporate Income Tax
Sales and Use Tax
Other Taxes
Source: Joint Budget Committee, Legislative Council
18
Budget in Brief, Colorado General Assembly Joint Budget Committee, FY 2014-15.

12
How Colorado Taxes Rank in Comparison to Other States
There are two primary ways of comparing states in terms of revenues. The first is the per capita
measure, which is derived by dividing total government revenue by total population. The second
method relates revenue to total personal income (wages, salaries, dividends, interest, etc.). The most
prevalent rankings measure taxes per $1,000 of income.
Measuring revenue relative to personal income shows taxes relative to wealth. By contrast, measuring
revenue on a per capita basis does not take into account ability to pay. The “per $1,000 of income”
approach allocates taxes to those who pay them, in proportion to how much is paid. A “taxes per
capita” approach spreads total taxes across the entire population (including children, institutionalized
populations and other non-taxpayers) and assumes equal distribution of taxes for all individuals. The
personal income calculation generally results in a lower ranking for Colorado than the per capita
calculation.
By any measure, though, taxes are low in Colorado. Colorado’s state taxes, per $1,000 of income, rank
second from the bottom (48th) in the nation.19 Alaska has the highest and New Hampshire the lowest.
The chart below shows the most recent Legislative Council calculations on tax rankings for all types of
taxes:
19
Kirk,Ron, How Colorado Compares in State and Local Taxes, Colorado Legislative Council Brief, June 29, 2012 at
http://www.cosfp.org/HomeFiles/COLegCouncil/HowCOComparesInStateandLocalTaxes06.29.2012.pdf.

13
Who Pays Colorado Taxes?
Examining how the state ranks in comparison to other states is one method of analyzing our tax
system. Another way to evaluate it is by analyzing the percentage of income paid in taxes by
individuals in various income brackets. The Institute of Taxation and Economic Policy (ITEP) produces a
report that analyzes the amount of each type of tax paid by each income quintile.20 The results show
that the highest share of income paid in taxes (9 percent) is paid by those in the lowest income
brackets — those making less than $39,000 per year — while the top 1 percent of all Colorado
taxpayers pays the lowest percentage of their income in taxes.
The combined state and local tax rate for the top one percent of Colorado families — with average
incomes of $1.3 million — is 5.9 percent, before accounting for the tax savings from federal itemized
deductions. After the federal offset, the effective tax rate is only 4.6 percent.21 The average tax rate on
families in the middle of the income distribution — those earning between $39,000 and $59,000 — is
8.7 percent before the federal offset and 8.3 percent after. This is nearly double the effective rate that
the richest Coloradans pay. The tax rate on the poorest Colorado families — those in the bottom two
quintiles, earning less than $39,000 — is the highest of all. At 9 percent, it is more than twice the
effective rate on the very wealthy.
The ITEP report also reveals the regressivity inherent in Colorado’s tax system. While income taxes are
slightly progressive because they are based on a progressive federal income tax, property tax and sales
taxes are regressive and result in those with the lowest incomes paying more in taxes than those with
higher incomes. This is an example of vertical inequity.
However, Colorado is not the most regressive of all states. In fact, despite the fact that Colorado’s tax
system is regressive overall, Colorado allows large federal deductions and exemptions, making
20
Who Pays? A Distributional Analysis of the Tax Systems of all 50 States (4th
Edition), Institute of Taxation and Economic Policy, January 2013 at
http://www.itep.org/pdf/whopaysreport.pdf 21
The Federal Deduction Offset accounts for the exporting of a taxpayers state taxes to their federal tax burden through an itemized deduction.

14
Colorado’s flat-rate income tax structure more progressive than other states with a similar tax
structure. Even “low tax” states can be highly regressive — the determining factor is the amount of tax
on the lowest income brackets in relation to the highest.
It should be noted though, that while the lowest-income Coloradans pay the highest percentage of
their income in taxes, the highest-income Coloradans pay the largest bulk of taxes overall. Colorado
taxpayers with income of more than $100,000 pay 60 percent of all of the taxes collected in the state.22
Tax Rates
Another important component of the Colorado tax system is the tax rate. There are two different ways
to define the tax rate. The “nominal” or “marginal” tax rate is the rate that is multiplied by the tax base
to yield the amount of tax. Essentially, the nominal tax rate is the stated tax rate. In Colorado, the
nominal tax rate is 4.63 percent for income taxes and 2.9 percent for sales and use taxes.
By contrast, the “effective”
tax rate is the amount of tax
paid as a percentage of a
taxpayer’s total tax
responsibility. This is
considered a more accurate
measure for comparing
taxes because it takes into
account the differing tax
bases of different taxpayers.
Effective tax rates are
typically lower than
marginal rates because
most tax systems have
some forms of deductions,
exclusions, credits and other
22
CFI analysis of Colorado Tax Profile and Expenditure Report 2012

15
adjustments that are taken into account when using this measure of taxes. The chart above from the
Colorado Department of Revenue shows Colorado effective tax rates in 2010. 23
What Doesn’t Get Paid – The Effect of Tax Expenditures
Tax expenditures are revenues foregone because a provision of the tax code permits certain taxpayers
to pay less tax than they would pay under a baseline tax system. They include deductions and
exclusions from tax liability, reduced tax rates, tax credits, tax deferrals, tax exemptions and tax
refunds.
Tax expenditures are tools that policymakers use to align public finance with social and economic
goals. They are often utilized to address market failures and to promote social equity. While tax
expenditures can prove useful for promoting certain economic outcomes, the resulting increase in the
complexity of tax laws often means higher administrative and compliance costs, and market
distortions.
Tax expenditures also reduce the tax base. As a result, government revenues may need to be raised
from other sources and/or tax rates may need to increase in order to provide substitute revenues to
finance government services.
For instance, in Colorado in
2011, annual sales tax
expenditures reduced
revenues by $1.97 billion.24 In
comparison, total sales tax
collections were $2.19
billion.25 The amount of
money that is given away in
tax expenditures directly
reduces the revenues
available for public
investments.
The pie chart (right) shows
what happens if tax expenditures were added to total General Fund appropriations for 2009. The
amount of revenue spent on tax expenditures would then be equal to 24 percent of the total General
Fund. It would almost equal the amount of revenue appropriated for all health and human services and
would be greater than spending for all corrections, higher education and other government services
combined.
23
Colorado Tax Profile & Expenditure Report 2012. 24
Ibid. 25
2008 Colorado Department of Revenue Annual Report, Colorado Department of Revenue, accessed January 10, 2011 at
http://www.colorado.gov/cs/Satellite?blobcol=urldata&blobheader=application/pdf&blobkey=id&blobtable=MungoBlobs&blobwhere=1229571401799&s
sbinary=true.

16
CHAPTER 3
COLORADO’S TAX PORTFOLIO
STATE TAXES
Income Tax
The income tax has become the largest tax source that funds Colorado’s state government. In 2013,
income tax receipts accounted for 60 percent of total tax collections.26 Nationally, income taxes
represented only 40 percent of tax collections.27
History of the Income Tax in Colorado
Now the state’s largest revenue source, the personal income tax was originally adopted by the voters
via a constitutional referendum in 1936. This was more than two decades after the 16th Amendment to
the federal constitution that authorized a national income tax. At the end of the 1930’s, income tax
receipts were small in terms of total tax collections. Motor fuel, sales and use and liquor taxes each
accounted for more state tax revenue than income taxes.
In the first full-year of collections, slightly more than three-fifths of the $2.8 million in total collections
was from individual income tax. Corporate income taxes accounted for the other $1.8 million. The
legislature allocated 65 percent of the tax revenues to the state General Fund for the first two years.
Since this time in 1947, all income tax collections have been allocated to the General Fund.
In 1937, income tax rates ranged from 1 percent on the first $1,000 of income to 6 percent on income
more than $10,000. The top rate was increased in 1947 to 10 percent for incomes over $11,000. In
1960, the rates were increased to 3 percent for the first $1,000 but reduced to 9 percent for income
over $10,000.
The income tax system in Colorado was designed by the legislature until the early 1960s. In 1962,
voters adopted a constitutional amendment that allowed the legislature to define income tax law by
reference to federal tax law. The Colorado Income Tax Act of 1964 made the federal adjusted gross
income the basis for determining Colorado income. Specific modifications and exemptions were
incorporated into legislation between 1964 and 1987. In that year, 1987, as a response to federal tax
changes, a new income tax act was adopted by the General Assembly. That act established a single tax
rate of 5 percent for individuals and corporations, as well as simplification in terms of tax preparation.
The Taxpayer’s Bill of Rights (TABOR) amendment, adopted in 1992, codified the requirement that the
same rate apply to both individuals and corporations.
The income tax rate was subsequently reduced to 4.75 percent in 1999 and 4.63 percent in 2000. This
is the current tax rate. Referendum C, adopted by the voters in 2005, allows the income tax rate to
decline to 4.5 percent under specified circumstances after 2010.
26
Colorado Department of Revenue 2013 Annual Report. 27
State Government Tax Collections: 2013, United States Census Bureau, accessed October 28, 2014 at
http://factfinder2.census.gov/faces/tableservices/jsf/pages/productview.xhtml?src=bkmk.

17
Income Tax “Coupling”
Like most states, Colorado’s income tax system is “coupled” with the federal income tax system. This
means Colorado taxpayers begin with federal taxable income when calculating how much tax is owed
on their Colorado state tax return. As such, Colorado’s income tax system automatically incorporates
all federal tax provisions that occur “above the line” or before the calculation of federal taxable
income.
While this coupled system contributes to the simplicity of the state income tax system, it also can
result in reduced state revenue based solely on congressional tax policy changes. The considerations of
federal tax policymakers are often different or in conflict with Colorado’s needs. Federal tax policy is
not specifically tailored to unique state conditions.
Colorado, along with all other states, has the option to insulate portions of its internal tax code from
federal income tax changes by “decoupling.” Decoupling simply means state tax provisions do not
follow the federal tax code without active adoption by the state legislature. To date, Colorado has not
decoupled from any portions of the federal tax code.
Individual Income Taxes
Colorado currently has a flat tax rate of 4.63 percent. Ten other states also have a flat (or single)
individual income tax rates, as opposed to graduated rates. Thirty-three states have graduated
individual income tax rates that range from 2 percent to 13.3 percent. Seven states have no individual
income tax and two states tax only dividends and interest income at a flat rate.28
Colorado’s individual income tax generated $5.5 billion in 2013.29 As stated above, the individual
income tax share of the General Fund has grown over time. In 1975, individual income taxes made up
39 percent of the General Fund, while in 2013, individual income taxes accounted for 65 percent of the
General Fund30.
Colorado ranks 28th out of 43 states for individual income taxes when measured by $1,000 of personal
income.31 Colorado’s total tax amount per $1,000 of income ($20.74) was higher than the national
average of $20.12 for the 43 states with an individual income tax.
While a flat rate on taxes tends to be regressive, Colorado’s individual income tax remains fairly
progressive since it is tied to the progressive federal tax code. Income earners who make less than
$20,000 per year pay 0.7 percent of their income in individual income taxes while the top 1 percent of
Colorado earners (those making $480,000 or more) pay an average of 3.2 percent.32 However, those
making more than $100,000 annually pay 60 percent of total taxes in the state and only make up about
16 percent of all taxpayers.33
28
State Individual Income Tax Rates, 2000-2014, Tax Foundation at http://taxfoundation.org/article/state-individual-income-tax-rates. 29
Colorado Department of Revenue 2013 Annual Report. 30
Budget in Brief, Colorado General Assembly Joint Budget Committee, FY 2014-15 31
Kirk, How Colorado Compares in State and Local Taxes. 32
Who Pays? A Distributional Analysis of the Tax Systems of all 50 States. 33
Colorado Tax Profile and Expenditure Report 2012

18
Corporate Income Taxes
Colorado’s corporate income tax rate is 4.63 percent, the same as the individual income tax rate. Thirty
states, including Colorado, have a flat corporate income tax rate. Colorado is the lowest and
Pennsylvania is the highest. Fourteen states have a graduated corporate income tax. The lowest rate of
any bracket is 1 percent and the highest is 12 percent.
To determine the amount of money taxed at the state level, Colorado business returns begin with
federal taxable income. At the federal level, a business subtracts its federal deductions from its gross
receipts to calculate federal taxable income. Federal taxable income is then “apportioned” — or
allocated — among the states in which the business operates to determine a business’s tax liability in
states where business income is generated.
States use a variety of methods to apportion income. In 2008, the Colorado Legislature voted to make
Colorado a single-sales factor apportionment state. This means when a business is apportioning its
federal taxable income among states, it assigns to Colorado the share of its federal taxable income that
is proportionate to the percentage of total sales made in the state. Other states use factors such as
property owned in the state, number of employees in the state and actual presence in the state to
determine state tax liability. Federal taxable income is apportioned to Colorado entirely based on the
amount of sales a business has in the state.
Corporate income tax collections yielded $652 million in 2013.34 This is an increase of 33 percent from
2012. Corporate income tax revenue makes up 11 percent of income tax collections and 8.2 percent of
General Fund revenue collections in Colorado.35
Colorado ranks 42nd out of 46 states for corporate income taxes per $1,000 of income. The national
average for all 46 states is $3.29.36 Colorado businesses pay $1.55.37 Currently, there is no information
on who pays these taxes by industry or business type.
Excise Taxes
Sales and Use Tax
In 2013, Colorado collected a little over $2.4 billion in state sales and use tax revenues.38 This was a 5
percent increase from the prior year. Yet, the percentage of the General Fund that is made up of sales
and use tax collections has been declining. In 1976, sales and use taxes generated 37 percent of the
General Fund. In 2013, sales and use taxes generated less than 28.7 percent.39 The reasons for the
decrease include an increased number of sales and use tax exemptions, an increase in untaxed e-
commerce and a shift from the purchase of taxable goods to untaxed services.
Colorado is also one of 32 states where local governments collect sales and use taxes. Changes in the
state sales and use tax base affect local sales tax collections. Those effects vary depending on whether
34
Colorado Department of Revenue 2013 Annual Report. 35
Budget in Brief, Colorado General Assembly Joint Budget Committee, FY 2014-15. 36
Kirk, How Colorado Compares in State and Local Taxes. 37
Ibid. 38
Colorado Department of Revenue 2013 Annual Report. 39
Budget in Brief, Colorado General Assembly Joint Budget Committee, FY 2014-15

19
the locality is a “home rule” jurisdiction. Local sales taxes are discussed in the section of this paper
about local taxes.
Colorado’s sales tax ranks 44th of 45 states per $1,000 of personal income. Five states have no state
sales tax. The average amount of sales tax paid by all states is $19.68 per $1,000 of income. Colorado
taxpayers pay $10.86.40
Sales and use taxes are the most regressive form of taxes in the Colorado tax system. The lowest
quintile of taxpayers pays 5.6 percent of their income in sales tax while the highest 1 percent of
earners pays only 0.8 percent.41 One of the reasons for the disparity is the fact that lower-income
taxpayers are more likely to spend all of their income each month, and therefore be subject to more
sales taxes, than those with a higher income who save more. Lower-income families also tend to
purchase more taxable goods and fewer untaxed services than higher-income individuals.
History of Sales and Use Tax in Colorado
Following the national trend, Colorado increased its reliance on excise taxes in the 20th Century.
Preceded by a “privilege” tax on insurance companies (1883), an inheritance tax (1901), and a motor
fuel tax (1919), the state’s first general sales tax law was enacted as the “Emergency Retail Sales Tax
Act of 1935,” which levied the first excise tax on general retail sales of tangible personal property.
Although the act was scheduled to expire in 1937, the Old Age Pension Amendment, initiated in 1936,
earmarked 85 percent of the proceeds of the sales tax and rendered the new temporary tax
permanent. When the 1935 law was enacted, a service tax was also imposed on professional and
personal services, but increasing opposition from professional groups led to its repeal in 1945.
To prevent circumvention of the sales tax, a use tax was also added in 1937, imposing a 2 percent levy
on tangible personal property purchased outside Colorado and brought into the state for storage, use
or consumption. The use tax rate in Colorado is the same as the sales tax rate.
Sales Tax Rate
The 1935 act imposed a tax rate of 2 percent on the sales price of tangible personal property, unless
the property became a component part of a manufactured product. Gasoline and special fuels were
also exempt. The rate was raised to 3 percent in 1965, and for 15 months during 1983 and 1984, was
temporarily raised to 3.5 percent due to a budgetary shortfall. The rate then reverted back to 3 percent
on Aug. 1, 1984.
Effective January 1, 2001, the rate was lowered to 2.9 percent due to the state repeatedly collecting
more revenue than was allowed under the Taxpayer’s Bill of Rights (TABOR). This was viewed as an
alternative to a general refund, allowing a direct benefit to those who specifically paid the sales or use
tax in proportion to the amount paid, rather than refunding the same amount to everyone in the state.
40
Kirk, Colorado’s Revenue and Tax Structure Power Point presentation. 41
Who Pays? A Distributional Analysis of the Tax Systems of all 50 States.

20
Sales Tax Base
The sales tax base is defined as taxable sales of tangible personal property, plus telephone/telegraph
services, gas and electric service for commercial consumption, prepared food or drink, and lodging
accommodations. There are a variety of sales that are not taxable because the transaction is exempt
from the tax, to promote either parity within an industry, social equity or a desirable behavior. The two
largest taxable sales
that are exempt
from sales tax are
the sales and
purchase of
component parts of
a manufactured
product and the sale
of food for domestic
home consumption
(i.e., groceries).42
Taxing Services
Since the enactment
of the state sales tax
on goods, much of
consumer spending has shifted as the service industry has grown rapidly in Colorado and across the
country. There is now more money spent on services than goods in Colorado. The chart (above) from
Colorado Legislative Council shows that in 1963, just more than 65 percent of Colorado’s economic
output was attributable to non-taxable
services compared to 2008, when
services comprised almost 80 percent
of state output.
Colorado’s sales tax base includes only
14 services.43 According to Colorado
Legislative Council, all other states
include more services than Colorado in
their sales tax mix, with the highest
number of services taxed being in
Hawaii at 166.44 The most commonly
taxed services by all states are: tuxedo
rentals; photocopying/photofinishing;
printing; software; event admissions;
42
State Income Tax Credits, Rebates, and Modifications & State Sales and Use Tax Exemptions. 43
Sigalla, Fiona, Sales Tax on Services, Colorado Legislative Council Memorandum, January 29, 2010 at
http://www.colorado.gov/cs/Satellite?blobcol=urldata&blobheader=application/pdf&blobkey=id&blobtable=MungoBlobs&blobwhere=1251607101016&s
sbinary=true. 44
Ibid.

21
cellular and intrastate telephone utilities; and leases and rentals.
If Colorado extended its sales tax base to include personal services, even the most conservative
estimates show that sales tax revenue would increase by 18 to 29 percent and would continue to
increase between 19 and 33 percent annually45.
Sales Tax Exemptions
There were a total of 78 exemptions from state sales and use taxes in Colorado in 2009 accounting for
$1.97 billion in revenue.46 The top three exemptions from sales and use taxes are the purchase of
component parts of manufactured products, food for domestic consumption and gasoline. The top
three exemptions account for more than half of exempted revenue.47
Vendor Credit
In Colorado, vendors (retail businesses) are required to collect sales tax from customers and remit it to
the Department of Revenue. If a vendor properly complies with this requirement, they are eligible for a
tax credit against some of the tax they were required to remit.
Colorado has one of the most generous vendor credits in the country because it is not subject to any
ceiling. In 2008, Colorado lost more than $68.5 million in revenue as a result of the vendor credit.48
Thirteen percent of that lost revenue went to just one retailer - Walmart.
In 2009, the vendor tax credit was temporarily suspended as a budget-balancing measure.49 The
suspension was estimated to increase revenue by more than $71 million dollars in FY 2010-11.50 The
suspension expired at the end of 2011.
The vendor credit was reinstated by the General Assembly for 2012. It was reinstated at 2.2 percent
and has now been increased to 3.3 percent.
Internet Sales Tax
In recent years, internet sales have become a growing source of lost revenue for Colorado and other
states with sales taxes. Current law says that states may only require the collection of sales taxes by
businesses with a physical presence, or “nexus” in the state. In practice, this means that internet
retailers without warehouses, offices or stores in Colorado are not required to collect Colorado sales
taxes on sales to people in the state. As more and more Coloradans shop online, this loophole becomes
a bigger and bigger problem for the state budget.
45
Financing Colorado’s Future: An Analysis of the Fiscal Sustainability of State Government 46
Colorado Tax Profile and Expenditure Report 2012 47
Ibid. 48
Materra, Philip and McIlvaine, Leigh, Skimming the Sales Tax: How Wal-Mart and other Big Retailers (Legally) Keep a Cut of the Taxes We Pay on
Everyday Purchase, Good Jobs First, Novemner 2008 at http://www.goodjobsfirst.org/sites/default/files/docs/pdf/skimming.pdf. 49
Colorado Senate Bill 09-212 accessed January 10, 2011 at
http://www.leg.state.co.us/clics/clics2009a/csl.nsf/fsbillcont3/9908363968A6ECCB87257551005B26B5?open&file=212_enr.pdf 50
Scanlon, Terry, 2011-12 budget presents a test for new leadership: Don’t fail Colorado communities, Colorado Fiscal Policy Institute, Nov. 10, 2010 at
http://www.cclponline.org/uploads/files/ritter_final_budget_brief.pdf.

22
In 2010, the Colorado legislature attempted to mitigate the problem of lost sales tax revenue from
internet sales. Effective March 1, 2010, House Bill 10-1193 stipulated that any retailer not collecting
sales tax in Colorado must inform Colorado customers that, while sales tax is not being collected by the
retailer, use taxes may still be owed on their purchases. Specifically, the law requires a non-collecting
Internet retailer to: (1) inform customers of their use tax obligation at the time of purchase, (2) provide
customers with a year-end summary of purchases for use tax purposes, and (3) supply a similar report
showing an annual total to the Colorado Department of Revenue.
Since its passage, Colorado’s internet sales tax law has been debated in court. In 2012, a U.S. District
Court determined that the law was unconstitutional, but the ruling was overturned by the 10th Circuit
Court of Appeals based on a jurisdictional challenge. In February of 2014, the Denver U.S. District Court
ruled for a preliminary injunction preventing the state from enforcing the law. The law is currently
headed to the United States Supreme Court, although the issue for review is only who has jurisdiction
to decide the fate of the law.
Colorado is not the first state to confront the problem of internet sales tax loss. Several other states,
including New York and North Carolina, have passed laws attempting to compel the collection of sales
tax on internet purchase. As a result, Congress is currently considering legislation, known as the
Marketplace Fairness Act, which would allow states to require internet sellers not physically located in
their state to collect taxes on online and catalog purchases made by consumers in the state.
Severance Taxes
Colorado’s severance tax was created in 1977 with the intent to recapture portions of the state’s
“wealth endowment” that was lost due to the excavation and extraction of nonrenewable resources.51
Revenue collected was to be held in a trust to help offset the cost of mitigating negative impacts from
nonrenewable resource development.
Severance tax revenue is divided evenly between the Department of Natural Resources and the
Department of Local Affairs. Each department uses funding from severance taxes differently. The
Department of Natural Resources uses the funding for water projects, for natural resources-related
programs and for low-income energy assistance. The Department of Local Affairs distributes its funding
to local governments to offset the impact of natural resource extraction.52
Colorado’s severance tax is levied on the value of extracted natural resources. More than 81 percent of
the severance tax revenue comes from natural gas. The remaining severance tax revenue is from oil,
coal and other minerals. Colorado’s severance tax also incorporates a tax credit to offset taxes paid on
resources at the local level. Since producers pay a local property tax on extracted resources, the state
allows 87.5 percent of local property taxes paid to be credited against severance tax liability.53
51
Schrock, Jason, Severance Tax and FML Revenue, Colorado Legislative Council Memorandum, Dec. 30, 2008 at
http://www.colorado.gov/cs/Satellite?blobcol=urldata&blobheader=application
percent2Fpdf&blobkey=id&blobtable=MungoBlobs&blobwhere=1251606227916&ssbinary=true. 52
Ibid. 53
2012 Colorado Severance Tax Forms and Instructions, Colorado Department of Revenue, accessed October 28, 2014 at
http://www.colorado.gov/cs/Satellite?blobcol=urldata&blobheader=application%2Fpdf&blobkey=id&blobtable=MungoBlobs&blobwhere=125183182988
0&ssbinary=true.

23
Severance tax collections in 2013 were $148 million.54 Severance tax collections are projected to be
$250.2 million, or 9.5 percent of cash fund collections in FY 2014-15.55
When the combined state severance tax and the local property tax is considered, Colorado ranks
second to last of all states that have severance taxes and fourth among the five western states that
have a severance tax, including Wyoming, New Mexico, Oklahoma and Utah.56
Motor Fuels Tax
A motor fuels tax was enacted in 1919 as part of the Colorado Constitution. Gasoline, gas blends and
special fuels such as diesel, bio-diesel, kerosene, liquefied petroleum gases and natural gas are all
taxable under this article of the constitution. The tax rate on motor fuels and special fuels has not
increased since 1991 and 1992, respectively.
Colorado has two primary motor fuels taxes and a motor vehicle registration fee. Colorado’s two motor
fuels taxes include a fuel excise tax (also known as the gas tax) of 22 cents per gallon on all non-diesel
motor fuel sold and a diesel fuel tax of 20.5 cents per gallon.
The combination of those three sources raised $1.1 billion for transportation services in 2013.57 The
funds collected from these three sources go into the Highway Users Tax Fund, although they are
essentially cash funds. Transportation-related taxes and fees are estimated to make up 43 percent of
the total 2014-15 cash fund collections.58
Colorado ranks 32nd out of 50 states in fuel taxes. Coloradans pay $2.90 per $1,000 of income on motor
fuel taxes. The national average is $2.89.59
Cigarette Taxes
Cigarette taxes were enacted in 1964 as part of the Colorado Constitution. The tax rate was last
increased in 2004 to 84 cents per 20 cigarettes with the passage of Amendment 35, which earmarked
the revenue as follows:
• 46 percent to increase access to health insurance for children and working families
• 19 percent to support community clinics that provide primary health care services to
low-income, uninsured patients
• 16 percent to fund comprehensive tobacco education, prevention and cessation
programs
• 16 percent to support prevention, detection and treatment programs for cancer,
chronic pulmonary disease and cardiovascular disease
• 3 percent to the General Fund to support the Old-Age Pension fund and municipal and
county governments for health-related expenses.60
54
Colorado Department of Revenue 2013 Annual Report. 55
Budget in Brief, Colorado General Assembly Joint Budget Committee, FY 2014-15. 56
Kirk, How Colorado Compares in State and Local Taxes. 57
Colorado Department of Revenue 2013 Annual Report. 58
Budget in Brief, Colorado General Assembly Joint Budget Committee, FY 2014-15. 59
Kirk, How Colorado Compares in State and Local Taxes. 60
Amendment 35 Implementation: Upholding the Promise to Voters, Colorado Children’s Campaign, Feb. 1, 2005 at
http://www.coloradokids.org/file_download/31501a8d-dc60-47a0-bae2-23ebedc1e59b.

24
In comparison with other states, Colorado has a relatively low rank of 35th in the nation in cigarette tax
collections per $1,000 of income.61 The national average is $1.37 and Coloradans pay $1.02. In 2013,
approximately $165 million was collected by the state as a result of this tax levy.62
Alcohol Taxes
Shortly after the repeal of prohibition, Colorado enacted a statute imposing a liquor tax. Colorado has
one of the lowest liquor tax rates in the country. Per $1,000 of income, liquor tax collections in
Colorado rank 43rd nationally.63 Tax rates on liquor vary based on the type of beverage, from 8 cents
per gallon on beer to 60.26 cents per liter on spirits. This tax levy brought in just under $40 million in
tax collections for the state in 2013.64
Marijuana Taxes
In 2000, Colorado voters passed Amendment 20 to the Colorado Constitution, which established a
caregiver-patient system for medical marijuana and permitted qualifying patients or caregivers to
possess six marijuana plants or two ounces of useable marijuana for medical purposes. In 2007, a
Denver district judge ruled that this violated state law. In response, the Colorado General Assembly
passed HB 10-1284, which established a framework for medical marijuana centers (dispensaries),
cultivation facilities and manufacturers of edible marijuana products.
In 2012, Colorado and Washington were the first two states to approve measures allowing recreational
cultivation and use of marijuana among adults 21 years of age or older within each state.
Both medical marijuana and recreational marijuana are taxed in Colorado, but at different rates.
Medical marijuana is typically taxed at a much lower rate than recreational because medical marijuana
is subject to just state and local sales taxes. Recreational marijuana is subject to state and local sales
tax and also to a 15 percent excise tax and a special state sales tax rate of 10 percent. Additionally,
each city can apply higher tax rates to recreational marijuana.65 For example, the Denver sales tax rate
is 3.62 percent for medical marijuana and 7.12 percent for recreational marijuana. The effect is
compounded by state and district taxes. The final rate for medical marijuana in Denver is 7.62 percent,
compared to the recreational rate of 21.12 percent.66
As of August 2014, recreational marijuana has generated more than $34 million for FY 2013-14 and
medical marijuana has generated more than $33 million.67
61
Kirk, How Colorado Compares in State and Local Taxes. 62
Colorado Department of Revenue 2013 Annual Report. 63
Kirk, How Colorado Compares in State and Local Taxes. 64
Colorado Department of Revenue 2013 Annual Report. 65
Market Size and Demand for Marijuana in Colorado, Prepared by the Marijuana Policy Group for the Colorado Department of Revenue, 2014 at
https://www.colorado.gov/pacific/sites/default/files/Market%20Size%20and%20Demand%20Study%2C%20July%209%2C%202014%5B1%5D.pdf. 66
City and County of Denver Colorado Tax Guide, Topic No. 93, Tax Rates and Rounding, City and County of Denver, January 1, 2014 at
http://www.denvergov.org/Portals/571/documents/TaxGuide/Tax%20Rates%20and%20Rounding%20-%2093.pdf. 67
Colorado Marijuana Tax Data, Colorado Department of Revenue, accessed Dec. 29, 2014 at https://www.colorado.gov/pacific/revenue/colorado-
marijuana-tax-data.
25
Other Taxes
While the taxes listed above generate the most significant amount of revenue for the state, there are
several other taxes that complete the Colorado state tax portfolio.
Gaming Taxes
Gaming is a self-contained (“cash-funded”) state function that receives no tax dollars for operations or
expenses. There are 40 casinos in Colorado including two tribal casinos, seven casinos in Central City,
17 casinos in Black Hawk and 14 casinos in Cripple Creek. Gaming is taxed and regulated by the
Department of Revenue.
A graduated tax is imposed upon limited gaming retailers and operators. The amount of tax paid is
dependent on the adjusted gross proceeds (AGP) from gaming. The AGP tax rate is between 0.25 and
20 percent of AGP. In 2013, Colorado casinos grossed $748 million and paid $104 million in taxes
(effective rate of 14 percent).68
Proceeds from gaming go into the Limited Gaming Fund. The Limited Gaming Fund Supports the
following (determined by Constitution):
• 28 percent to the State Historical Society (used for historic preservation and restoration)
• 12 percent to Gilpin and Teller counties
• 10 percent to Cripple Creek, Central City and Black Hawk
• 50 percent to the General Fund
In 2008, Colorado voters passed Amendment 50. The measure was a citizen initiative which allowed
$100 maximum bets, the addition of craps and roulette and permitted casinos to remain open 24
hours a day. The amendment also required voter approval for any increase in gaming tax rates.69
Beginning in 2010, the proceeds from the implementation of Amendment 50 have been distributed as
follows:
• 78 percent to the Colorado Community College system
• 12 percent to Gilpin and Teller Counties
• 10 percent to the towns of Cripple Creek, Central City and Black Hawk
In FY 2013-14, Amendment 50 distributions totaled $9.6 million. Community colleges received $6.5
million70.
Estate and Inheritance Taxes
The Colorado estate tax, based on the federal estate tax, was phased out beginning Dec. 31, 2004, due
to federal tax law changes.
68
Gaming in Colorado: Fact Book and 2013 Abstract, Colorado Division of Gaming, accessed October 29, 2014 at
https://www.colorado.gov/pacific/sites/default/files/2013%20Fact%20%26%20Abstract.pdf 69
Amendment 50, Colorado Department of Revenue, Division of Gaming, accessed January 10, 2011 at http://www.colorado.gov/cs/Satellite/Rev-
Gaming/RGM/1218795716371. 70
Focus Colorado: Economic and Revenue Forecast, Colorado Legislative Council Staff Economics Section, September 22, 2014 at
http://www.colorado.gov/cs/Satellite?blobcol=urldata&blobheader=application%2Fpdf&blobkey=id&blobtable=MungoBlobs&blobwhere=125203479493
7&ssbinary=true.
26
Regulatory and Business Taxes
Regulatory taxes on the licensing of businesses, including sales licenses, liquor licenses, cigarette
licenses and special fuels licenses and permits generated more than $57 million in 2013.71 The largest
revenue generating activities in this category include an underground storage tank surcharge ($26
million) and PUC utility supervision fees ($11 million).72
LOCAL TAXES
Colorado is one of the most fiscally decentralized states in the nation. It is one of only four states in
which the state government generates less tax revenue than the local governments.73 Revenue
collections by Colorado state government rank 47th per $1,000 of income.74 However, revenue
collections by state and local governments combined move Colorado to 44th.75
This pattern of weak state government has been reinforced by various constitutional revenue limits
adopted in the past two decades. TABOR’s constitutionally mandated elections on all tax rate changes
and its revenue limit, which forces government spending to lose pace with the growth in the economy,
has affected state finances dramatically. Local governments have had more opportunity and success in
securing public support for retaining money collected above the revenue limit and for increasing tax
rates.
Property and sales taxes are the major source of local tax revenue. According to Legislative Council,
local governments’ tax collections rank 8th out of states that collect taxes locally. Local governments in
every state collect property taxes, and local governments in all but 15 states collect sales taxes.76 In
2008, local (municipal, county, school and special districts) taxes accounted for 51 percent of combined
state and local taxes.77
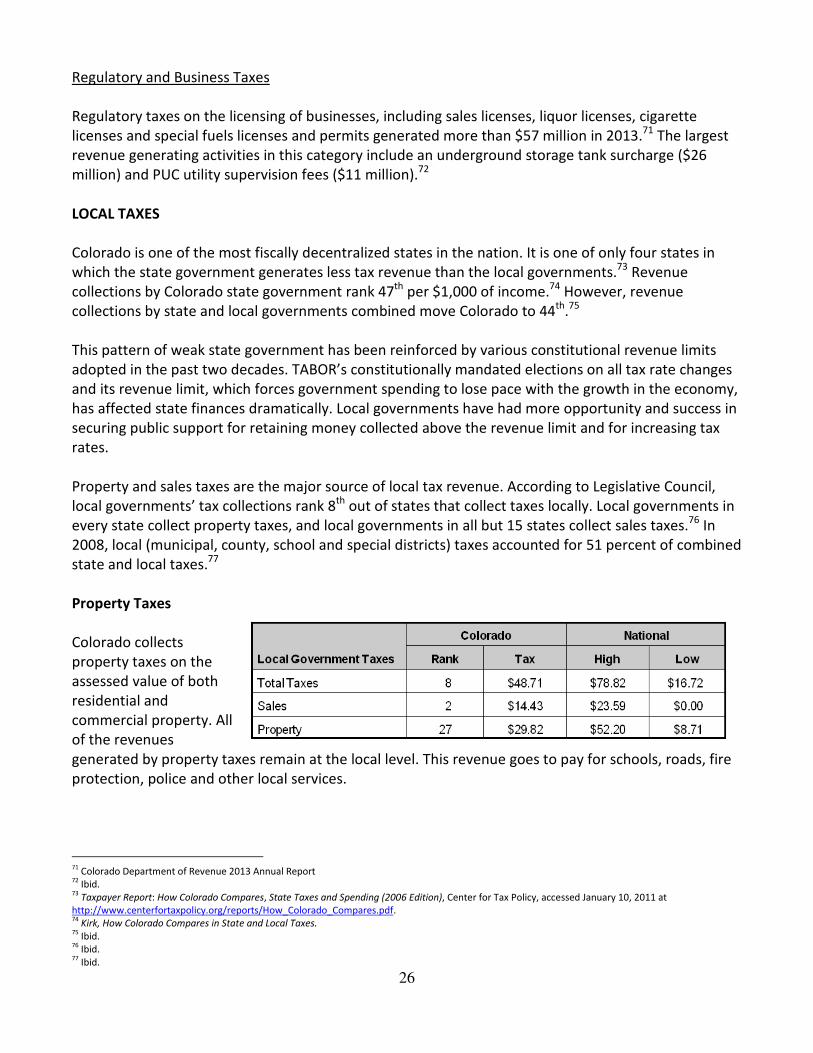
Property Taxes
Colorado collects
property taxes on the
assessed value of both
residential and
commercial property. All
of the revenues
generated by property taxes remain at the local level. This revenue goes to pay for schools, roads, fire
protection, police and other local services.
71
Colorado Department of Revenue 2013 Annual Report 72
Ibid. 73
Taxpayer Report: How Colorado Compares, State Taxes and Spending (2006 Edition), Center for Tax Policy, accessed January 10, 2011 at
http://www.centerfortaxpolicy.org/reports/How_Colorado_Compares.pdf. 74
Kirk, How Colorado Compares in State and Local Taxes. 75
Ibid. 76
Ibid. 77
Ibid.

27
Property tax is collected on the taxable value of a property. In Colorado, the value of property that is
taxed is not the market or the actual value; it is the “assessed value.” The assessed value is a
percentage of the actual value that is determined by applying the “assessment rate.” The assessment
rate in Colorado is 29 percent for commercial property and the residential rate is set by the legislature
during odd-numbered years. The current residential rate is 7.96 percent.
Once the assessed value is determined, a “mill levy” rate is applied to calculate taxes owed. Each local
entity determines what revenue is required to operate their budget. They then divide the total amount
needed by the assessed value to determine their mill levies for the year. A property owner’s total mill
levy is the total of their county, city, school district and any other special districts’ mill levies. The total
mill levy is multiplied by assessed value to determine the total amount of property tax that is due.
History of Colorado Property Tax
When Colorado entered into the union in 1876, state government tax sources were limited to
property taxes and some forms of excise taxes. Local governments were heavily dependent
upon property taxes for revenue. Yet Colorado’s constitution limited the amount the state
government could levy to four mills for general purposes and an additional one mill for
buildings at state educational institutions.
The state of Colorado levied a property tax until 1964, when HB 64-1005 repealed all statutes dealing
with state levied property taxation. Since that time, property tax revenues have been levied exclusively
at the local level for school districts, cities, counties, special and other districts and junior college
districts. TABOR precludes the ability for the state to levy a property tax. It states, “No new state real
property tax or local district income tax shall be imposed.”78
In a memo to the Joint Finance Committee on Jan. 13, 2000, the Colorado Division of Property Taxation
outlined the history of property assessments from the time of statehood to the present. The memo
presented the many attempts by the General Assembly to require specified assessment levels by
county assessors in order to provide equity within and among the counties. Those attempts continued
until the 1980’s. According to the memo, in 1941, the total assessed value of the state was 8.6 percent
less than the 1913 valuation despite an estimated 50 percent increase in actual values.
The impacts of the Great Depression along with replacement of some property taxes with income tax
and specific ownership tax on motor vehicles were factors contributing to this decline. For example,
there was a reduction in value due to the repeal of the property tax on intangibles and motor vehicles.
However, there was also a replacement of this revenue with the imposition of income taxes and
specific ownership taxes on vehicles. In addition, various state statutes that increased state aid for
schools from counties with low values also contributed to lower assessments by county assessors.
Thus, assessors were given an incentive to value property low in order to receive increased state aid
for schools. In 1956, a constitutional amendment was adopted that exempted household personal
property from taxation. The ‘60s and ‘70s were marked by further attempts to provide for equalized
values and updating assessments. The General Assembly would delay orders by the State Board of
Equalization out of fear of property tax revolts taking place in various parts of the state.
78
Article X, section 20 of the Colorado Constitution, provision (8) (a)

28
Finally, in 1982, HCR 1005 changed the system of property taxation in the state. This amendment
required, “appropriate consideration of cost, market and income approaches to value, with exceptions
for agricultural, mine and oil and gas, and residential properties.” Agricultural land would be valued
according to the earning or productive capacity of the land. Producing natural resources values would
be based on the value of unprocessed material, and residential values would be determined by a cost
and market approach. The Senate provision, now known as the Gallagher Amendment, required a
constant ratio of property tax collections between residential and non-residential property before and
after reappraisals. The maximum assessment rate for most non-residential property was set at 29
percent. The maximum residential assessment rate was set at 21 percent and the rate would be
allowed to float up or down in order to maintain the ratio. Following the adoption of this amendment,
reassessment of property is now conducted every two years.
Increased oversight of the assessment process, together with a payback provision for under-assessed
property, ultimately brought about equalization in values among the counties. The General Assembly
was required to undertake a study of the assessor’s valuations to ensure compliance with the new
provisions. This is still conducted through an annual statewide property assessment study under the
direction of the Colorado Legislative Council. If any county is found not to be in compliance, the state
Board of Equalization must issue an order of reappraisal and the county must pay back to the state any
excess aid to schools or payments made to school districts, including interest. Beginning in 1983, the
state Board of Equalization began issuing orders to counties to force compliance either through
reappraisals or paybacks. The Gallagher Amendment of 1982 was a significant step in bringing
equalization in property values and assessments up to date.
The following tables show
what has happened in
terms of actual value and
assessed value. The first
table (right) shows that
total actual values rose
from $147 billion in 1987
to $555 billion in 2006.
Residential actual values
jumped from $89 billion to
$432 billion for that
period. Non-residential
actual values jumped from
$58 billion to $123 billion.
Residential values grew at
a much faster rate than
non-residential in terms of
actual values.
Actual Value: Residential and Non-residential, 1987-2006
-
50,000
100,000
150,000
200,000
250,000
300,000
350,000
400,000
450,000
87 88 89 90 91 92 93 94 95 96 97 98 99 00 01 02 03 04 05 06
Residential
Non-Residential
$ Millions
DPT

29
The next table (left) shows
the growth in assessed values
during the past 20 years.
Total assessed values
increased from $33 billion in
1987 to $74.5 billion in 2006.
Residential assessed values
rose from $16 billion to $34
billion and non-residential
assessed values increased
from $17 billion to more than
$40 billion. Non-residential
property is assessed primarily
at 29 percent of actual value,
while residential is assessed
on a floating rate, which
declined from 18 percent to
less than 8 percent by 2006.
The Gallagher Amendment
As mentioned previously, the Gallagher Amendment
established a ratio between residential and non-
residential assessed values. Most non-residential property
assessments were fixed at 29 percent of actual value and
residential properties were set at 21 percent of actual
value. However, the ratio between the two was to remain
roughly 55 percent to 45 percent, respectively, after each
reassessment. Since implementation in 1987, the ratio has
shifted slightly to 53 percent to 47 percent as a result of
new residential construction. The table shows the change
in the residential assessment rate since implementation in
1987, as provided by the Department of Property
Taxation’s 2013 Annual Report79.
The Division of Property Taxation’s Annual Report also provides an estimate of the shift from
residential to non-residential property as a result of the Gallagher Amendment’s continuous lowering
of the residential assessment rate.80 The estimates are based on a fixed residential assessment rate of
21 percent. The estimates show a cumulative total of $15.96 billion in property taxes shifted to non-
residential property during the last two decades.
79
State of Colorado 2013 Forty-Third Annual Report, Department of Local Affairs, Division of Property Taxation, May 15, 2014 at
http://dola.colorado.gov/dpt/publications/docs/2013_Annual_Report/2-Website-EntireManual.pdf. 80
Ibid.
Assessed Values, Residential and Non-Residential, 1987-2006
-
5,000
10,000
15,000
20,000
25,000
30,000
35,000
40,000
45,000
87 88 89 90 91 92 93 94 95 96 97 98 99 00 01 02 03 04 05 06
Residential
Non-Residential
$ Millions
DPT

30
The following charts show how the
Gallagher ratio affected residential
and non-residential property. The
first chart (right) shows residential
and non-residential actual property
values as a percentage of income.
After declining at first, residential
values began a rise from less than
150 percent of income to nearly 250
percent a decade later. Non-
residential values also declined in
the beginning, but remained
constant thereafter. This shows the
tremendous growth in residential
values compared with non-residential values during that last 20 years.
To compare, the next chart (left) shows
assessed value changes as a
percentage of income for both
residential and non-residential
property. Both residential and non-
residential assessed values declined
and then remained fairly constant
throughout the rest of the period. The
impact of the Gallagher Amendment is
clearly illustrated by the difference
between residential actual values and
residential assessed values.
Property Tax Collections
Property taxes are a significant revenue source for funding local public services in Colorado. In 2011,
property tax collections comprised 68 percent of local government tax revenue in Colorado, totaling
$8.32 billion.81 Slightly less than one-half (50 percent) was generated to support public school districts
and the next largest share (20 percent) supports county governments.82
Colorado ranks 27th out of 50 states that collect local property taxes.83 Property taxes in Colorado are
$29.82 per $1,000 of income.84 Colorado’s property taxes are regressive. Colorado families that earn
81
CFI analysis of United States Census Bureau data found here: http://www.census.gov/govs/local/ 82
Ibid. 83
Kirk, How Colorado Compares in State and Local Taxes. 84
Ibid.
Actual Values as a Percent of Income
0%
50%
100%
150%
200%
250%
300%
87 88 89 90 91 92 93 94 95 96 97 98 99 00 01 02 03 04 05 06
Non-Residential Actual Value
Residential Actual Value
Assessed Values as a Percent of Income
0.0%
5.0%
10.0%
15.0%
20.0%
25.0%
30.0%
35.0%
87 88 89 90 91 92 93 94 95 96 97 98 99 00 01 02 03 04 05 06
Non-Residential Property
Residential Property

31
less than $20,000 per year pay 2.6 percent of their income in property taxes, while those in the top 1
percent of all earners pay only 1.2 percent.85
Business Personal Property Taxes
Local governments also collect a business personal property tax. Business personal property is all the
assets owned and used by a business. In Colorado, it includes machinery, furniture, computers and
“state assessed personal property,” which is defined as cable lines, pipelines and utility lines.
Forty-one states tax at least some business personal property, however, it is very difficult to compare
business personal property tax in Colorado to the tax in other states because property is taxed and
valued in a large variety of ways.86
The Colorado business personal property tax is assessed on the actual value (market value) of all the
assets owned and used by a business that are valued at more than $4,000. In 2009, there was $11.7
billion in personal property assessed value statewide, which represents about 11.9 percent of the
state's total assessed property value. This equates to approximately $820 million in business personal
property tax revenue for local governments.87
Roughly 84,000 local business paid business personal property tax in 2003. Of these businesses, 1
percent of these companies paid 74 percent of the tax, and 25 percent of these companies paid 96
percent of the total business personal property tax.88
In an attempt to reduce the business personal property tax on small business, several exemptions have
been adopted. Business personal property with an acquisition cost of less than $250 or a shelf life
under one year is not taxed. Also, agricultural machinery and business inventory is not taxed.
Businesses are not required to pay business personal property tax if the total actual value of the
property is assessed at $7,000 or less (2014). This exemption, based on HB08-1225, will increase over
time as follows:
Year Property Tax Exemption –
Tax not imposed on property valued at less than:
Prior to 2009 $2,500
2009 - 2010 $4,000
2011 – 2012 $5,500
2013 – 2014 $7,000
2015 and later Adjusted biennially to account for inflation
Source: General Assembly House Bill 08-1225
85
Who Pays? A Distributional Analysis of the Tax Systems of all 50 States. 86
Business Personal Property Tax in Other States, Colorado Legislative Council Memorandum, Aug. 19, 2004 at
http://www.colorado.gov/cs/Satellite?blobcol=urldata&blobheader=application/pdf&blobkey=id&blobtable=MungoBlobs&blobwhere=1251599410195&s
sbinary=true. 87
Herreid, Todd, Business Personal Property Tax, Colorado Legislative Council Memorandum, October 13, 2010 at
http://cospl.coalliance.org/fez/eserv/co:8439/ga42b962010internet.pdf. 88
Ibid.

32
In the 2014 session, the General Assembly also added an income tax credit against business personal
property tax paid by businesses that have $15,000 or less in business personal property tax, but are
above the exempted threshold ($7,000 for 2014).
The business personal property tax funds local governments. In 2003, more than half of business
personal property tax revenues went toward funding school districts. The remaining revenues were
distributed between counties, cities and special districts.89
County reliance on the business personal property tax varies dramatically. For example, in Hinsdale
County, the business personal property tax makes up 1.87 percent of total assessed value, while in
Morgan County, the tax makes up 44.16 percent. Since business personal property tax is assessed on
power plants and pipelines, rural counties are generally more dependent than urban counties.90
Sales Taxes
Many cities and counties impose their own local sales/use tax on purchases and transactions within
their boundaries. The Colorado Department of Revenue, in addition to collecting state sales and use
tax, collects sales tax on behalf of many cities and counties. These jurisdictions are referred to as
"state-collected." Most Colorado counties that impose sales tax are state-collected; however,
Broomfield and Denver counties collect their own county sales tax.91
Cities which have enacted a "home-rule" charter, and which have elected to administer their own local
sales and use taxes, are referred to as "self-collected" or "self-administered." Self-administered
jurisdictions have the right to establish their own regulations regarding those goods and services upon
which to impose their local sales and use taxes.92
In 2011, local sales tax revenues totaled more than $3.3 billion.93 This amount equals 27 percent of the
$12 billion in taxes collected at the local level annually. Colorado ranks 2nd out of 35 states that collect
local sales taxes (per $1,000 of income).94
89
Ibid. 90
Ibid. 91
Sales Tax, Colorado Department of Revenue, accessed January 10, 2011 at http://www.colorado.gov/cs/Satellite/Revenue/REVX/1176842266427. 92
Ibid. 93
CFI analysis of United States Census Bureau data found here: http://www.census.gov/govs/local/ 94
Kirk, How Colorado Compares in State and Local Taxes.