colorado air monitoring network assessment 2007
TRANSCRIPT

COLORADO AIR MONITORING
NETWORK ASSESSMENT 2007
Prepared by the Air Pollution Control Division Technical Services Program
May 24, 2007


Table of Contents
INTRODUCTION................................................................................................................................................... 1
PURPOSE OF THE NETWORK ASSESSMENT ............................................................................................................ 1 Overview ............................................................................................................................................................................ 1 APCD Monitoring Locations.............................................................................................................................................. 1
CARBON MONOXIDE MONITORING................................................................................................................ 17 Larimer & Weld Counties ................................................................................................................................................ 17 Metropolitan Denver Counties ......................................................................................................................................... 18 El Paso, Park & Teller Counties....................................................................................................................................... 19 Western Counties ............................................................................................................................................................. 20 Planned Changes in the Carbon Monoxide Monitoring for 2007 ..................................................................................... 20 Quality Assurance Checks for Carbon Monoxide Monitors............................................................................................. 21
OZONE................................................................................................................................................................ 22 Ozone Problem Identification........................................................................................................................................... 22 Larimer & Weld Counties ................................................................................................................................................ 22 Metropolitan Denver Counties ......................................................................................................................................... 23 El Paso, Park & Teller Counties....................................................................................................................................... 25 Quality Assurance Checks for Ozone Monitors ............................................................................................................... 26
NITROGEN DIOXIDE.......................................................................................................................................... 27 Planned Changes in Nitrogen Dioxide Monitoring for 2007-2008................................................................................... 27 Quality Assurance Checks for Oxides of Nitrogen Monitors ........................................................................................... 28
SULFUR DIOXIDE .............................................................................................................................................. 29 Planned Changes in Sulfur Dioxide Monitoring for 2007 ................................................................................................ 29 Quality Assurance Checks for Sulfur Dioxide Monitors .................................................................................................. 30
METEOROLOGICAL MEASUREMENTS .......................................................................................................... 31 Planned Changes in Meteorological Monitoring for 2007................................................................................................ 32
PARTICULATE MONITORING........................................................................................................................... 33 PM10 Monitoring .............................................................................................................................................................. 33 Planned Changes in PM10 Monitoring for 2007 ............................................................................................................... 40 PM2.5 Monitoring.............................................................................................................................................................. 41 Planned Changes in PM2.5 Monitoring for 2007............................................................................................................... 44 Quality Assurance Accuracy Audits for Particulate Monitors.......................................................................................... 45 Quality Assurance Precision Checks for Particulate Monitors ......................................................................................... 47 Total Suspended Particulates and Lead Monitoring ......................................................................................................... 48 Planned Changes in TSP and Lead Monitoring for 2007 ................................................................................................. 48

Table of Tables
Table 1 APCD Sites in Operation for 2006 – 2007..................................................................................................... 3 - 4Table 2 APCD Site Locations for 2006 – 2007 ............................................................................................................ 5 -6Table 3 APCD Monitors in Operation for 2007......................................................................................................... 7 - 9 Table 4 Monitoring Planned for 2007 .............................................................................................................................. 9 Table 5 APCD Carbon Monoxide Monitors in Operation for 2007 .......................................................................... 13 Table 6 APCD Ozone Monitors in Operation for 2007 ............................................................................................... 13 Table 7 APCD Sulfur Dioxide/ Nitrogen Oxides Monitors in Operation for 2007 ................................................. 14 Table 8 APCD Meteorological Monitors in Operation for 2007................................................................................ 14 Table 9 APCD TSP and Lead Monitors in Operation for 2007.................................................................................. 14 Table 10 APCD PM10 Monitors in Operation for 2007 ........................................................................................ 15 - 16 Table 11 APCD PM2.5 Monitors in Operation for 2007 .............................................................................................. 16 Table 12 2006 Number of Precision Checks for Carbon Monoxide.......................................................................... 21 Table 13 2006 Number of Accuracy Audits for Carbon Monoxide........................................................................... 21 Table 14 2006 Number of Precision Checks for Ozone .............................................................................................. 26 Table 15 2006 Number of Accuracy Audits for Ozone ............................................................................................... 26 Table 16 2006 Number of Precision Checks for Oxides of Nitrogen ........................................................................ 28 Table 17 2006 Number of Accuracy Audits for Oxides of Nitrogen......................................................................... 28 Table 18 2006 Number of Precision Checks for Sulfur Dioxide................................................................................ 30 Table 19 2006 Number of Accuracy Audits for Sulfur Dioxide ................................................................................ 30 Table 20 Gross Filter Counts for PM10 for 2005 and 2006: ........................................................................................ 33 Table 21 Annual Number of Particulate Accuracy Audits for 2006.......................................................................... 45 Table 22 Annual Number of Particulate Precision Checks for 2006 ......................................................................... 47

I ntroduction PURPOSE OF THE NETWORK ASSESSMENT
The purpose of the Network Assessment is to provide an overview of the current Air Pollution Control Division’s air quality monitoring network and projected plans for the coming year. This plan shows the general reason for monitoring, the location of the monitor and finally the type and frequency of measurements taken at each location. This is the first year that this review has been released to the general public for comment prior to its submittal to the U. S. Environmental Protection Agency (EPA) for approval. This change was initiated because of a change in Federal Regulations implemented in December 2006. As this is the first year, this document is expected to change and be refined in the upcoming years.
Overview
In 2006 the Colorado Air Pollution Control Division (APCD) operated 129 monitors at 77 locations. In 2007 the Colorado Air Pollution Control Division will operate 115 monitors at 75 separate locations. Particulate monitors (TSP, PM10 and PM2.5) are the most abundant and the widespread of monitoring types across the state. In 2006 there were a total of 42 PM10 monitors at 34 separate locations across the state and 31 PM2.5 monitors at 21 separate locations. There were 17 meteorological sites. These sites monitor wind speed, wind direction, resultant speed, resultant direction, standard deviation of horizontal wind direction and temperature. Two meteorological sites also monitor for relative humidity. Only 7 of the 77 locations in 2006 monitored for 3 or more parameters (with meteorological and PM2.5 measurements counting as only one parameter each). Only 2 locations monitored for more than 7 parameters, both of which are in the Denver Metro Area.
Increasing the amount of automated versus manual monitoring will require modifications to the PM10 and Total Suspended Particulate (TSP) network since in the current network these are primarily manually operated monitors. The APCD currently operates one TSP monitor and it is used for lead analysis. Only 5 of the 45 PM10 monitors are continuous “hourly”, while 8 of the 31 PM2.5 monitors are continuous. This difference reflects the age of the technology more than anything else.
Forty of the 77 current monitoring sites have been in operation for 10 or more years and 23 of these have been in operation for 20 or more years. Nine monitoring sites have been in operation for more than 30 years. These sites are: Denver CAMP (42 years), Greeley-Hospital (40 years), Alamosa Adams State College (37 years), Welby and Arvada (34 years), Pagosa Springs, Lamar Power Plant and Steamboat Springs (32 years). Conversely, 24 of the 75 monitoring sites have begun operation since the start of the year 2000 and one began operation in the year 2006. APCD Monitoring Locations
The “APCD Sites in Operation Table 1” and the “APCD Site Location Table 2” show
key information that is used through out the remainder of this document. The “County” gives the county name and county number for each monitoring location. The “Site #” refers to the specific site within each county. These two numbers and the “State Code” number, which for Colorado is “08”, can be used to identify each site in the state within the Air Quality System operated by the EPA. The “Started” date and the “Ended” date are the dates that the site was established and the date that the site was removed. In Table 3 the dates are for the start of monitoring for each parameter at the site. These dates may or may not be the same.
Table 4 lists the population in Colorado by Census Regions and Counties for the April 2000 Census and the July 2005 Population Estimates by the Colorado State Demography Office.
2007 Colorado Air Monitoring Network Assessment
1

This table also includes the “percent change” in population from 2000 to 2005 and the parameters monitored in each Region and County.
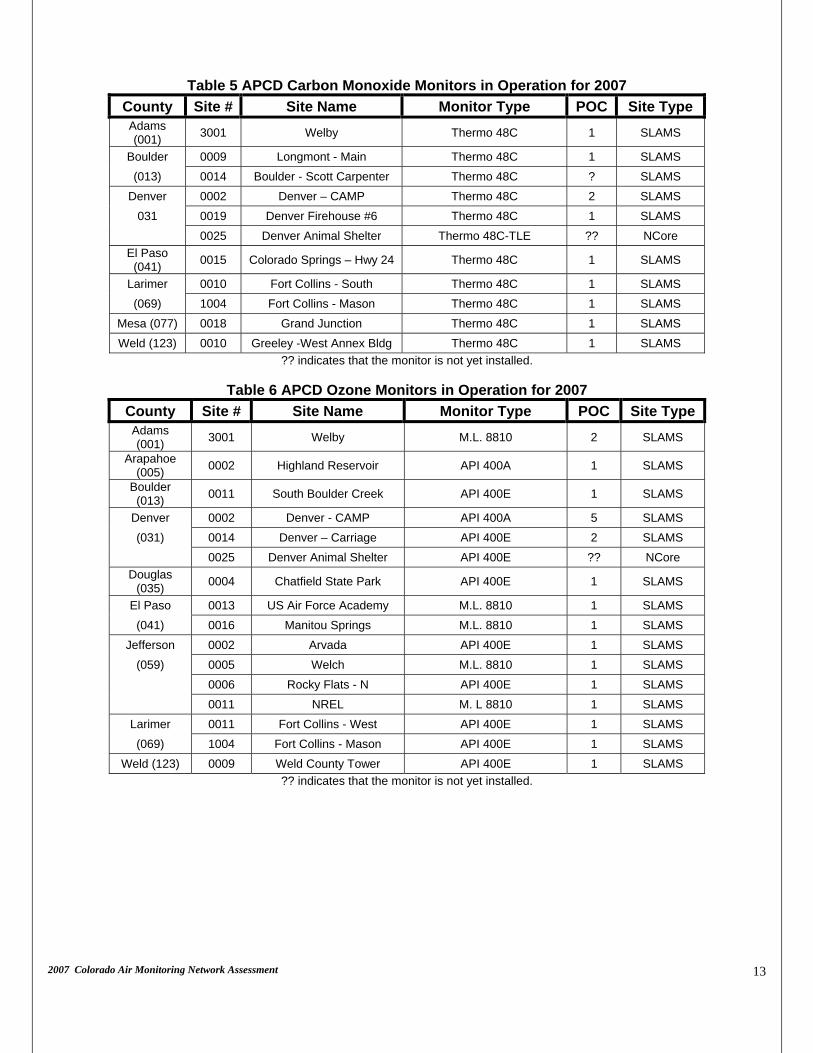
Table 5 through Table 11 list the make and model of each monitor, its occurrence code (POC), the monitor type usually “SLAMS”, State and Local Air Monitoring Site or SPM, Special Purpose Monitor and the frequency of monitoring. The frequency is shown as “Hourly”, “1/6”, “1/3” or “1/1”. These indicate that the monitor operates on an every sixth day, every third day or every day schedule.
2007 Colorado Air Monitoring Network Assessment
2

Table 1 APCD Sites in Operation for 2006 – 2007 County Site # Site Name Address Started Ended Adams 0005 Globeville 5400 Washington St. 11/1989 12/2006 (001) 0006 Commerce City 7101 Birch St. 01/2001
2002 Brighton 22 S. 4th St. 10/1988 12/2006 3001 Welby 78th Ave & Steele St. 07/1973
Alamosa 0001 359 Poncha Ave. 01/1970 (003) 0003
Alamosa 425 4th St. 04/2002
Arapahoe 0002 Highland Reservoir 8100 S. University Blvd 06/1978 (005) 0005 Arapahoe Community Coll. 6190 S. Santa Fe Blvd. 12/1998
Archuleta (007) 0001 Pagosa Springs Intermediate School 08/1975
Boulder 0003 Longmont - Municipal 3rd Ave. & Kimbark St. 06/1985 (013) 0009 Longmont - Main 440 Main St. 11/1989
0011 South Boulder Creek 1405½ S. Foothills Hwy 06/1994 0012 Boulder Chamber 2440 Pearl St. 12/1994 0014 Boulder Scott Carpenter (to be determined) ??/2007 1001 Boulder - CU/Athens 2120 Athens St. 12/1980
Delta (029) 0004 Delta 560 Dodge St. 08/1993 Denver 0002 Denver - CAMP 2105 Broadway 01/1965 (031) 0013 Denver - NJH 14th Ave. & Albion St. 01/1983
0014 Denver - Carriage 23rd Ave. & Julian St. 06/1982 0016 DESCI Building 1901 13th Ave. 01/1990 0017 Denver Visitor Center 225 W. Colfax Ave. 12/1992 0019 Denver Firehouse #6 1300 Blake St. 11/1993 0021 Auraria Campus Met. Auraria Parking Lot R 03/1999 0022 Denver - LARS 8100 Lowry Blvd. 09/2000 12/2006 0023 Denver - Swansea 4650 Columbine St. 07/2002 0025 Denver - Animal Shelter 678 S. Jason St. 07/2005
Douglas (035) 0004 Chatfield State Park 11500 N. Roxborough
Pk. Rd. 04/2004
Elbert (039) 0001 Elbert County Wright-Inghram Institute 12/1998 El Paso 0006 Colorado Springs - Glen I-25 & Uintah St. 01/1980 12/2006
(041) 0008 Colorado Springs - Meadowlands 3730 Meadowlands 01/1981 12/2006
0011 Colorado Springs - RBD 101 Costilla St. 02/1987 0015 Colorado Springs - Hwy 24 690 W. Hwy 24 11/1998 0013 US Air Force Academy USAF Rd 640 05/1996 0016 Manitou Springs 101 Banks Pl. 04/2004
Fremont (043) 0003 Canon City - City Hall 128 Main St. 10/2004
Garfield 0005 Parachute 100 E. 2nd St. 01/1982 (045) 0007 Rifle - Henry Building 144 3rd. St. 05/2005
0008 New Castle - Library 402 W. Main St. 05/2005
2007 Colorado Air Monitoring Network Assessment
3

Table 1 APCD Sites in Operation for 2006 – 2007 (Continued) County Site # Site Name Address Started Ended
Garfield 0009 Silt - Bell Ranch 512 Owens Dr. 05/2005 (045) 0010 Silt - Daley Ranch 884 County Road 327 05/2005 0011 Silt - Cox Ranch 5933 County Road 233 05/2005 05/2007 Gunnison 0004 Crested Butte Colorado 135 & Whiterock 09/1982 (051) 0006 Gunnison 221 N. Wisconsin St. 09/2000 12/2006 0007 Mt Crested Butte 19 Emmons Rd. 07/2005 Jefferson 0002 Arvada 9101 W. 57th Ave. 01/1973 (059) 0005 Welch 12400 W. Hwy 285 08/1991 0006 Rocky Flats - N 16600 W. Hwy 128 06/1992 0008 Rocky Flats - SE 9901 Indiana St. 06/1992 0011 NREL 2054 Quaker St. 06/1994 Lake (065) 0001 Leadville 510 Harrison St. 09/1981 12/2006 La Plata 0004 Durango - RCH 1235 Camino del Rio 05/1985 (067) 0010 Durango - Cutler 177 Cutler Dr. 10/2003 04/2006 0011 Durango - Grandview 56 Davidson Creek Rd. 07/2004 12/2006 1001 Durango - Courthouse 1060 2nd Ave. 03/1987 12/2006 Larimer 0009 Fort Collins - CSU 251 Edison St. 12/1998 (069) 0010 Fort Collins - South 4407 S. College Ave. 11/2002 0011 Fort Collins - West 3416 W. LaPorte Ave. 05/2006 1004 Fort Collins - Mason 708 S. Mason St. 12/1980 Mesa 0017 Grand Junction - Powell 650 South Ave. 02/2002 (077) 0018 Grand Junction 645 ¼ Pitkin Ave. 01/2004 0019 Clifton (to be determined) ??/2007 Pitkin (097) 0006 Aspen - Library 120 Mill St. 05/2002 Powers 0001 Lamar – Power Plant 100 2nd St. 08/1975 (099) 0002 Lamar - Municipal 104 Parmenter St. 12/1976 0003 Lamar - Port of Entry 7100 US Hwy 50 03/2005 Pueblo (101) 0012 Pueblo - Public Works 211 S. D St. 07/1998 Routt (107) 0003 Steamboat Springs 136 6th St. 09/1975 San Miguel (113) 0004 Telluride 333 W. Colorado Ave. 03/1990
Summit (117) 0002 Breckenridge County Justice Center 04/1992 Teller 0001 Cripple Creek Bennett Ave. & 2nd St. 10/1994 12/2006 (119) 0002 Cripple Creek - Met Warren Ave. & 2nd St. 01/1998 12/2006 Weld 0006 Greeley - Hospital 1516 Hospital Rd. 04/1967 (123) 0009 Weld County Tower 3101 35th Ave. 06/2002 0010 Greeley -West Annex 905 10th Ave. 12/2003 0008 Platteville 1004 Main St. 12/1998
?? indicates that the site is not yet installed.
2007 Colorado Air Monitoring Network Assessment
4
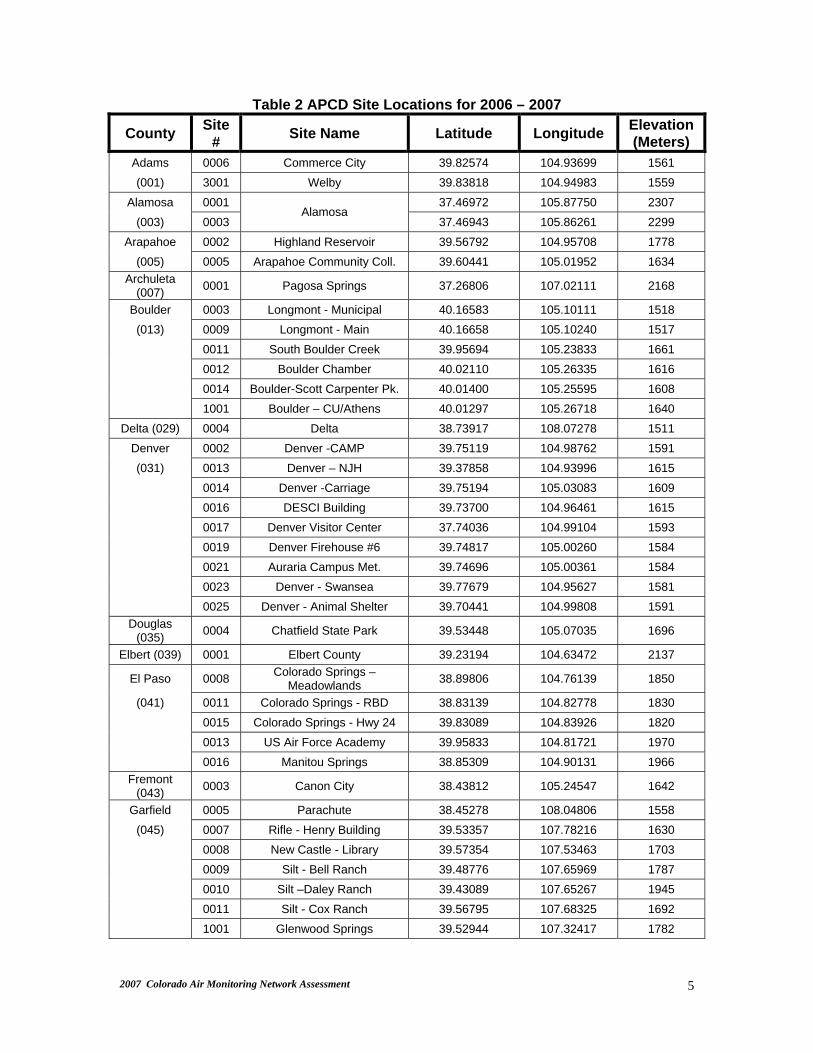
Table 2 APCD Site Locations for 2006 – 2007
County Site # Site Name Latitude Longitude Elevation
(Meters) Adams 0006 Commerce City 39.82574 104.93699 1561 (001) 3001 Welby 39.83818 104.94983 1559
Alamosa 0001 37.46972 105.87750 2307 (003) 0003
Alamosa 37.46943 105.86261 2299
Arapahoe 0002 Highland Reservoir 39.56792 104.95708 1778 (005) 0005 Arapahoe Community Coll. 39.60441 105.01952 1634
Archuleta (007) 0001 Pagosa Springs 37.26806 107.02111 2168
Boulder 0003 Longmont - Municipal 40.16583 105.10111 1518 (013) 0009 Longmont - Main 40.16658 105.10240 1517
0011 South Boulder Creek 39.95694 105.23833 1661 0012 Boulder Chamber 40.02110 105.26335 1616 0014 Boulder-Scott Carpenter Pk. 40.01400 105.25595 1608 1001 Boulder – CU/Athens 40.01297 105.26718 1640
Delta (029) 0004 Delta 38.73917 108.07278 1511 Denver 0002 Denver -CAMP 39.75119 104.98762 1591 (031) 0013 Denver – NJH 39.37858 104.93996 1615
0014 Denver -Carriage 39.75194 105.03083 1609 0016 DESCI Building 39.73700 104.96461 1615 0017 Denver Visitor Center 37.74036 104.99104 1593 0019 Denver Firehouse #6 39.74817 105.00260 1584 0021 Auraria Campus Met. 39.74696 105.00361 1584 0023 Denver - Swansea 39.77679 104.95627 1581 0025 Denver - Animal Shelter 39.70441 104.99808 1591
Douglas (035) 0004 Chatfield State Park 39.53448 105.07035 1696
Elbert (039) 0001 Elbert County 39.23194 104.63472 2137
El Paso 0008 Colorado Springs – Meadowlands 38.89806 104.76139 1850
(041) 0011 Colorado Springs - RBD 38.83139 104.82778 1830 0015 Colorado Springs - Hwy 24 39.83089 104.83926 1820 0013 US Air Force Academy 39.95833 104.81721 1970 0016 Manitou Springs 38.85309 104.90131 1966
Fremont (043) 0003 Canon City 38.43812 105.24547 1642
Garfield 0005 Parachute 38.45278 108.04806 1558 (045) 0007 Rifle - Henry Building 39.53357 107.78216 1630
0008 New Castle - Library 39.57354 107.53463 1703 0009 Silt - Bell Ranch 39.48776 107.65969 1787 0010 Silt –Daley Ranch 39.43089 107.65267 1945 0011 Silt - Cox Ranch 39.56795 107.68325 1692 1001 Glenwood Springs 39.52944 107.32417 1782
2007 Colorado Air Monitoring Network Assessment
5

Table 2 APCD Site Locations for 2006 – 2007 (Continued)
County Site # Site Name Latitude Longitude Elevation (Meters)
Gunnison 0004 Crested Butte 38.87083 106.98083 2708 (051) 0007 Mt. Crested Butte 38.90054 106.96555 2863
Jefferson 0002 Arvada 39.80035 105.10002 1641 (059) 0005 Welch 39.63878 105.13948 1738
0006 Rocky Flats - N 39.91285 105.18855 1793 0008 Rocky Flats - SE 39.87692 105.16613 1716 0011 NREL 39.74371 105.17798 1826
La Plata (067) 0004 Durango - RCH 37.30565 107.84801 1985
Larimer 0009 Fort Collins - CSU 40.57124 105.08012 1526 (069) 0010 Fort Collins - South 40.52645 105.07719 1533
0011 Fort Collins - West 40.59257 105.14110 1575 1004 Fort Collins - Mason 40.57747 105.07892 1517
Mesa 0017 Grand Junction - Powell 39.06363 105.56102 1395 (077) 0018 Grand Junction 39.06620 108.56166 1396
0019 Clifton 39.06268 108.45728 1412 Pitkin (097) 0006 Aspen - Library 39.19065 106.81806 2410
Powers 0001 Lamar - Power Plant 38.09139 102.61361 1118 (099) 0002 Lamar - Municipal 38.07833 102.61528 1107
0003 Lamar - Port of Entry 38.11414 102.62779 1105 Pueblo (101) 0012 Pueblo - Public Works 38.26361 104.61222 1426
Routt (107) 0003 Steamboat Springs 40.48528 106.83083 2050 San Miguel
(113) 0004 Telluride 37.93750 107.81167 2694
Summit (117) 0002 Breckenridge 39.48500 106.04667 3120
Teller (119) 0001 Cripple Creek 38.74444 105.17833 2869 Weld 0006 Greeley - Hospital 40.41472 104.70611 1447 (123) 0009 Weld County Tower 40.38637 104.73721 1475
0010 Greeley West Annex 40.42346 104.69540 1419 0008 Platteville 40.20917 104.82306 1468
The following abbreviations are used in the next tables: Orientation refers to the reason why the monitor placed in that location. Scale refers to the size of the area that concentrations from the monitor represent. Orientation Scale P.O. - Population oriented Micro - Microscale Back - Background orientation Neigh – Neighborhood Scale SPM - Special Projects Monitor Middle - Middle Scale Urban – Urban Scale Regional – Regional Scale PM10H and PM2.5H – refer to monitors that operate continuously and record their data as hourly samples.
2007 Colorado Air Monitoring Network Assessment
6
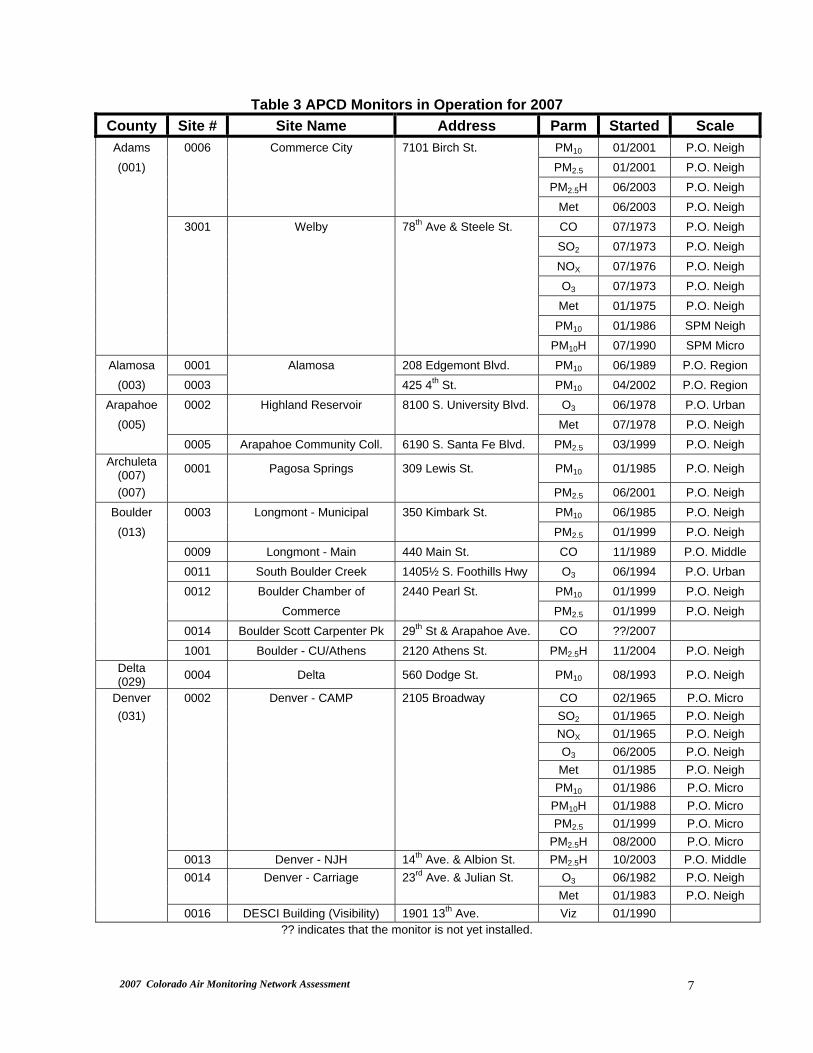
Table 3 APCD Monitors in Operation for 2007 County Site # Site Name Address Parm Started Scale Adams 0006 Commerce City 7101 Birch St. PM10 01/2001 P.O. Neigh (001) PM2.5 01/2001 P.O. Neigh
PM2.5H 06/2003 P.O. Neigh Met 06/2003 P.O. Neigh 3001 Welby 78th Ave & Steele St. CO 07/1973 P.O. Neigh SO2 07/1973 P.O. Neigh NOX 07/1976 P.O. Neigh O3 07/1973 P.O. Neigh Met 01/1975 P.O. Neigh PM10 01/1986 SPM Neigh PM10H 07/1990 SPM Micro
Alamosa 0001 Alamosa 208 Edgemont Blvd. PM10 06/1989 P.O. Region (003) 0003 425 4th St. PM10 04/2002 P.O. Region
Arapahoe 0002 Highland Reservoir 8100 S. University Blvd. O3 06/1978 P.O. Urban (005) Met 07/1978 P.O. Neigh
0005 Arapahoe Community Coll. 6190 S. Santa Fe Blvd. PM2.5 03/1999 P.O. Neigh Archuleta
(007) 0001 Pagosa Springs 309 Lewis St. PM10 01/1985 P.O. Neigh
(007) PM2.5 06/2001 P.O. Neigh Boulder 0003 Longmont - Municipal 350 Kimbark St. PM10 06/1985 P.O. Neigh (013) PM2.5 01/1999 P.O. Neigh
0009 Longmont - Main 440 Main St. CO 11/1989 P.O. Middle 0011 South Boulder Creek 1405½ S. Foothills Hwy O3 06/1994 P.O. Urban 0012 Boulder Chamber of 2440 Pearl St. PM10 01/1999 P.O. Neigh Commerce PM2.5 01/1999 P.O. Neigh 0014 Boulder Scott Carpenter Pk 29th St & Arapahoe Ave. CO ??/2007 1001 Boulder - CU/Athens 2120 Athens St. PM2.5H 11/2004 P.O. Neigh
Delta (029) 0004 Delta 560 Dodge St. PM10 08/1993 P.O. Neigh
Denver 0002 Denver - CAMP 2105 Broadway CO 02/1965 P.O. Micro (031) SO2 01/1965 P.O. Neigh
NOX 01/1965 P.O. Neigh O3 06/2005 P.O. Neigh Met 01/1985 P.O. Neigh PM10 01/1986 P.O. Micro PM10H 01/1988 P.O. Micro PM2.5 01/1999 P.O. Micro PM2.5H 08/2000 P.O. Micro 0013 Denver - NJH 14th Ave. & Albion St. PM2.5H 10/2003 P.O. Middle 0014 Denver - Carriage 23rd Ave. & Julian St. O3 06/1982 P.O. Neigh Met 01/1983 P.O. Neigh 0016 DESCI Building (Visibility) 1901 13th Ave. Viz 01/1990
?? indicates that the monitor is not yet installed.
2007 Colorado Air Monitoring Network Assessment
7

Table 3 APCD Monitors in Operation for 2007 (Continued) County Site # Site Name Address Parm Started Scale Denver 0017 Denver Visitor Center 225 W. Colfax Ave. PM10 12/1992 P.O. Middle (031) 0019 Denver Firehouse #6 1300 Blake St. CO 11/1993 P.O. Micro
0021 Auraria Campus Met. Auraria Parking Lot R Met 03/1999 P.O. Middle 0023 Denver – Swansea 4650 Columbine St. PM2.5 07/2002 SPM Neigh 0025 Denver - Animal Shelter 678 S. Jason St. TSP 07/2005 P.O. Middle Pb 07/2005 P.O. Middle PM10 07/2005 P.O. Middle PM10H 08/2005 P.O. Middle CO ??/2007 O3 ??/2007 NOX ??/2007 SO2 ??/2007 Met ??/2007
Douglas 0004 Chatfield State Park 11500 N. O3 04/2004 P.O. Neigh (035) Roxborough Pk. Rd. PM2.5 07/2005 P.O. Neigh
PM2.5H 05/2004 P.O. Neigh Met 04/2004 SPM Neigh
Elbert (039) 0001 Elbert County Wright-Inghram Institute PM2.5 05/1999 Back Region
El Paso 0011 Colorado Springs - RBD 101 Costilla St. PM10 03/1987 P.O. Neigh (041) PM2.5 01/1999 P.O. Neigh
0015 Colorado Springs - Hwy 24 690 W. Hwy 24 CO 11/1998 P.O. Micro Met ??/2007 P.O. Micro 0013 US Air Force Academy USAF Rd 640 O3 06/1996 P.O. Urban Met 06/1966 P.O. Urban 0016 Manitou Springs 101 Banks Pl. O3 04/2004 P.O. Neigh
Fremont (043) 0003 Canon City - City Hall 128 Main St. PM10 10/2004 P.O. Middle
Garfield 0005 Parachute 100 E. 2nd St. PM10 05/2000 P.O. Neigh (045) 0007 Rifle - Henry Building 144 3rd. St. PM10 05/2005 SPM Neigh
0008 New Castle - Library 402 W. Main St. PM10 05/2005 SPM Neigh 0009 Silt - Bell Ranch 512 Owens Dr. PM10 05/2005 SPM Neigh 0010 Silt - Daley Ranch 884 County Road 327 PM10 05/2005 SPM Neigh 0011 Silt - Cox Ranch 5933 County Road 233 PM10 05/2005 SPM Neigh 1001 Glenwood Springs 109 8th St. PM10 05/2005 SPM Neigh
Gunnison 0004 Crested Butte Colorado 135 & Whiterock PM10 06/1985 P.O. Neigh
(051) 0007 Mt. Crested Butte 19 Emmons Rd. PM10 07/2005 P.O. Neigh PM2.5 07/2005 P.O. Neigh
Jefferson 0002 Arvada 9101 W. 57th Ave. O3 08/1973 P.O. Neigh (059) Met 01/1975 P.O. Neigh
?? indicates that the monitor is not yet installed.
2007 Colorado Air Monitoring Network Assessment
8

Table 3 APCD Monitors in Operation for 2007 (Continued) County Site # Site Name Address Parm Started Scale Jefferson 0005 Welch 12400 W. Hwy 285 O3 08/1991 P.O. Urban
(059) Met 10/1991 SPM Neigh 0006 Rocky Flats - N 16600 W. Hwy 128 O3 09/1992 S.P. Neigh Met 06/1992 SMP Neigh 0008 Rocky Flats - SE 9901 Indiana St. Met 06/1992 SPM Neigh 0011 NREL 2054 Quaker St. O3 06/1994 P.O. Urban
La Plata (067) 0004 Durango - RCH 1235 Camino del Rio PM10 05/1985 Back Urban Larimer 0009 Fort Collins - CSU 251 Edison St. PM10 07/1999 P.O. Neigh
(069 PM2.5 07/1999 P.O. Neigh 0010 Fort Collins - South 4407 S. College Ave. CO 11/2002 P.O. Micro 0011 Fort Collins - West 3416 La Porte Ave. O3 05/2006 P.O. Neigh 1004 Fort Collins - Mason 708 S. Mason St. CO 12/1980 P.O. Neigh O3 12/1980 P.O. Neigh Met 01/1981 P.O. Neigh
Mesa 0017 Grand Junction - Powell 650 South Ave. PM10 02/2002 P.O. Neigh (077) PM2.5 11/2002 P.O. Neigh
PM2.5H 08/2005 P.O. Neigh 0018 Grand Junction 645 ¼ Pitkin Ave. CO 01/2004 P.O. Micro PM10H 08/2005 P.O. Micro Met 01/2004 SPM Neigh 0019 Clifton 32nd Rd & D Rd PM10 ??/2007 P.O. Neigh
Pitkin 0006 Aspen - Library 120 Mill St. PM10 05/2003 P.O. Middle (097) PM10H 05/2002 P.O. Middle
Powers 0001 Lamar – Power Plant 100 2nd St. PM10 06/1985 P.O. Neigh (099) 0002 Lamar - Municipal 104 Parmenter St. PM10 08/1986 P.O. Neigh
0003 Lamar – Port of Entry 7100 US Hwy 50 Met 03/2005 SPM Neigh Pueblo 0012 Pueblo – Public Works 211 S. D St. PM10 07/1998 P.O. Middle (101) PM2.5 02/1999 P.O. Neigh
Routt (107) 0003 Steamboat Springs 136 6th St. PM10 03/1987 P.O. Neigh San Miguel
(113) 0004 Telluride 333 W. Colorado Ave. PM10 03/1990 P.O. Neigh
Summit (117) 0002 Breckenridge County Justice Center PM10 10/1992 P.O. Neigh Weld 0006 Greeley - Hospital 1516 Hospital Rd. PM10 10/1986 P.O. Neigh
(123) PM2.5 02/1999 P.O. Neigh
PM2.5H 10/2003 P.O. Neigh 0009 Weld County Tower 3101 35th Ave. O3 06/2002 P.O. Neigh Met ??/2007 0010 Greeley -West Annex Bldg 905 10th Ave. CO 12/2003 P.O. Middle 0008 Platteville 1004 Main St. PM2.5 08/1999 P.O. Region
?? indicates that the monitor is not yet installed.
2007 Colorado Air Monitoring Network Assessment
9

2007 Colorado Air Monitoring Network Assessment 9
Table 4 Monitoring Planned for 2007 April, 2000 July, 2005 Percent REGIONS Census Estimate Change
CO SO2 NOX O3 Met PM10H PM2.5H TSP PB PM10 PM2.5
COLORADO 4,301,261 4,722,755 9.80 11 3 3 16 17 5 5 1 1 31 14 FRONT RANGE 3,511,956 3,866,854 10.11 10 3 3 16 14 3 5 1 1 8 13
DNVR-BLDR REGION 2,400,570 2,627,322 9.45 6 3 3 11 11 3 4 1 1 5 4DENVER PMSA 2,109,282 2,341,442 11.01
Adams 363,857 405,561 11.46 1 1 1 1 2 1 1 2 1Arapahoe 487,967 534,252 9.49 1 1 1
Broomfield 45,755 Denver 554,636 571,848 3.10 3 2 2 3 3 2 2 1 1 3 2Douglas 175,766 251,418 43.04 1 1 1
Jefferson 527,056 532,608 1.05 4 4BOULDER PMSA/Co 291,288 285,880 -1.86 2 1
NORTH FRONT RANGE 432,430 500,732 15.79 3 3 2 1 2 3
FORT COLLINS MSA 251,494 271,951 8.13 2 2 1 1 1GREELEY MSA 180,936 228,781 26.44 1 1 1 1 1 2
COLO. SPRINGS MSA 537,484 587,696 9.34 1 2 2 1 1
El Paso 516,929 565,350 9.37 1 2 2 1 1 Teller 20,555 22,346 8.71
PUEBLO MSA 141,472 151,104 6.81 1 1
WESTERN SLOPE 459,423 513,332 11.73 1 1 2 21 1
REGION 9 80,071 87,019 8.68 2 Archuleta 9,898 11,716 18.37 1
Dolores 1,844 1,846 0.11 La Plata 43,941 48,019 9.28 1
Montezuma 23,830 24,862 4.33 San Juan 558 576 3.23

2007 Colorado Air Monitoring Network Assessment 10
Table 4 Monitoring Planned for 2007 (Continued) April, 2000 July, 2005 Percent REGIONS Census Estimate Change
CO SO2 NOX O3 Met PM10H PM2.5H TSP PB PM10 PM2.5
REGION 10 86,348 94,835 9.83 4 Delta 27,834 30,257 8.71 1
Gunnison 13,956 14,264 2.21 2 Hinsdale 790 821 3.92
Montrose 33,432 37,880 13.30 Ouray 3,742 4,303 14.99
San Miguel 6,594 7,310 10.86 1
REGION 11 198,906 222,739 11.98 1 1 1 10 1 Garfield 43,791 50,673 15.72 7
Mesa 116,255 130,662 12.39 1 1 1 2 1 Moffat 13,184 13,426 1.84
Rio Blanco 5,986 6,073 1.45 Routt 19,690 21,905 11.25 1
REGION 12 94,098 108,739 15.56 1 2
Eagle 41,659 49,375 18.52 Grand 12,442 13,906 11.77
Jackson 1,577 1,531 -2.92 Pitkin 14,872 16,420 10.41 1 1
Summit 23,548 27,507 16.81 1
CENTRAL MTNS. 125,373 131,813 5.14 3
CLR CRK. & GILPIN 14,079 14,486 2.89 Clear Creek 9,322 9,510 2.02
Gilpin 4,757 4,976 4.60
PARK COUNTY 14,523 16,595 14.27
REGION 13 73,702 76,529 3.84 1 Chaffee 16,242 16,889 3.98 Custer 3,503 3,964 13.16
Fremont 46,145 47,727 3.43 1 Lake 7,812 7,949 1.75

2007 Colorado Air Monitoring Network Assessment 11
Table 4 Monitoring Planned for 2007 (Continued) April, 2000 July, 2005 Percent REGIONS Census Estimate Change
CO SO2 NOX O3 Met PM10H PM2.5H TSP PB PM10 PM2.5
REGION 14 23,069 24,203 4.92 Huerfano 7,862 7,932 0.89
Las Animas 15,207 16,271 7.00
SAN LUIS VALLEY 46,190 48,506 5.01 2 Alamosa 14,966 15,765 5.34 2 Conejos 8,400 8,586 2.21 Costilla 3,663 3,628 -0.96 Mineral 831 946 13.84
Rio Grande 12,413 13,043 5.08 Saguache 5,917 6,538 10.50
EASTERN PLAINS 158,319 162,250 2.48 1 2 1
REGION 1 69,669 72,165 3.58
Logan 20,504 21,605 5.37 Morgan 27,171 28,348 4.33 Phillips 4,480 4,631 3.37
Sedgwick 2,747 2,667 -2.91 Washington 4,926 4,936 0.20
Yuma 9,841 9,978 1.39
REGION 5 36,201 38,693 6.88 1 Cheyenne 2,231 2,120 -4.98
Elbert 19,872 22,786 14.66 1 Kit Carson 8,011 7,882 -1.61
Lincoln 6,087 5,905 -2.99 REGION 6 52,449 51,392 -2.02 1 2
Baca 4,517 4,263 -5.62 Bent 5,998 6,314 5.27
Crowley 5,518 5,740 4.02 Kiowa 1,622 1,533 -5.49 Otero 20,311 19,569 -3.65
Prowers 14,483 13,973 -3.52 1 2
2007 Colorado Air Monitoring Network Assessment 13
Table 5 APCD Carbon Monoxide Monitors in Operation for 2007 County Site # Site Name Monitor Type POC Site Type Adams (001) 3001 Welby Thermo 48C 1 SLAMS
Boulder 0009 Longmont - Main Thermo 48C 1 SLAMS (013) 0014 Boulder - Scott Carpenter Thermo 48C ? SLAMS
Denver 0002 Denver – CAMP Thermo 48C 2 SLAMS 031 0019 Denver Firehouse #6 Thermo 48C 1 SLAMS
0025 Denver Animal Shelter Thermo 48C-TLE ?? NCore El Paso
(041) 0015 Colorado Springs – Hwy 24 Thermo 48C 1 SLAMS
Larimer 0010 Fort Collins - South Thermo 48C 1 SLAMS (069) 1004 Fort Collins - Mason Thermo 48C 1 SLAMS
Mesa (077) 0018 Grand Junction Thermo 48C 1 SLAMS Weld (123) 0010 Greeley -West Annex Bldg Thermo 48C 1 SLAMS
?? indicates that the monitor is not yet installed.
Table 6 APCD Ozone Monitors in Operation for 2007 County Site # Site Name Monitor Type POC Site TypeAdams (001) 3001 Welby M.L. 8810 2 SLAMS
Arapahoe (005) 0002 Highland Reservoir API 400A 1 SLAMS
Boulder (013) 0011 South Boulder Creek API 400E 1 SLAMS
Denver 0002 Denver - CAMP API 400A 5 SLAMS (031) 0014 Denver – Carriage API 400E 2 SLAMS
0025 Denver Animal Shelter API 400E ?? NCore Douglas
(035) 0004 Chatfield State Park API 400E 1 SLAMS
El Paso 0013 US Air Force Academy M.L. 8810 1 SLAMS (041) 0016 Manitou Springs M.L. 8810 1 SLAMS
Jefferson 0002 Arvada API 400E 1 SLAMS (059) 0005 Welch M.L. 8810 1 SLAMS
0006 Rocky Flats - N API 400E 1 SLAMS 0011 NREL M. L 8810 1 SLAMS
Larimer 0011 Fort Collins - West API 400E 1 SLAMS (069) 1004 Fort Collins - Mason API 400E 1 SLAMS
Weld (123) 0009 Weld County Tower API 400E 1 SLAMS ?? indicates that the monitor is not yet installed.

2007 Colorado Air Monitoring Network Assessment 14
Table 7 APCD Sulfur Dioxide/ Nitrogen Oxides Monitors in Operation for 2007 County Site # Site Name Monitor Type POC Site Type
Adams 3001 Welby SO2 API 100E 2 SLAMS (001) NO API 200E 2 SPM NO2 API 200E 1 SLAMS Denver 0002 Denver – CAMP SO2 API 100E 1 SLAMS (031) NO API 200E 1 SPM NO2 API 200E 1 SLAMS Denver Municipal Animal SO2 Ecotech 9850T ?? NCore Shelter
?? indicates that the monitor is not yet installed.
Table 8 APCD Meteorological Monitors in Operation for 2007 County Site # Site Name Monitor Type POC Site TypeAdams 0006 Commerce City Met - One 1 SPM (001) 3001 Welby Met - One 1 SPM
Arapahoe (005) 0002 Highland Reservoir Met - One 1 SPM
Denver 0002 Denver - CAMP Met - One 1 SPM (031) 0014 Denver - Carriage Met - One 1 SPM
0021 Auraria Campus Met. Met - One 1 SPM 0025 Denver Animal Shelter Met -ONE ?? SPM
Douglas (035) 0004 Chatfield State Park Met – One 1 SPM
El Paso (041) 0015 Colorado Springs Hwy 24 Met – One 1 SPM
Jefferson 0002 Arvada Met – One 1 SPM (059) 0005 Welch Met – One 1 SPM
0006 Rocky Flats – N Met – One 1 SPM 0008 Rocky Flats – SE Met – One 1 SPM
Larimer (069) 1004 Fort Collins – Mason Met – One 1 SPM
Mesa (077) 0018 Grand Junction – Powell Met – One 1 SPM Powers (099) 0003 Lamar – Port of Entry Met – One 1 SPM
Weld (123) 0009 Weld County Tower Met – One 1 SPM ?? indicates that the monitor is not yet installed.
Table 9 APCD TSP and Lead Monitors in Operation for 2007
County Site # Site Name Monitor Type POC Site Type Sample Denver (031) 0025 Denver - Animal Shelter TSP 1 NCore 1/6

2007 Colorado Air Monitoring Network Assessment 15
Table 10 APCD PM10 Monitors in Operation for 2007 County Site # Site Name Monitor Type POC Site Type Sample Adams 0006 Commerce City R&P Partisol 2025 1 SLAMS 1/1
SA/GMW-1200 2 SLAMS 1/6 (001) 3001 Welby
TEOM - 1400ab 3 SLAMS Hourly Alamosa 0001 SA/GMW-1200 1 SLAMS 1/1
(003) 0003 Alamosa
SA/GMW-1200 1 SLAMS 1/1 Archuleta
(007) 0001 Pagosa Springs SA/GMW-1200 3 SLAMS 1/1
Boulder 0003 Longmont - Municipal SA/GMW-1200 2 SLAMS 1/6
(013) 0012 Boulder Chamber of Commerce SA/GMW-1200 1 SLAMS 1/6
Delta (029) 0004 Delta SA/GMW-1200 1 SLAMS 1/3
Denver 0002 Denver - CAMP SA/GMW-1200 1 SLAMS 1/6 (031) SA/GMW-1200 2 SLAMS 1/6
TEOM - 1400ab 3 SLAMS Hourly 0017 Denver Visitor Center SA/GMW-1200 1 SLAMS 1/1 SA/GMW-1200 1 NCore 1/6
0025 Denver - Animal Shelter SA/GMW-1200 2 NCore 1/6
TEOM - 1400ab 3 NCore Hourly El Paso SA/GMW-1200 2 SLAMS 1/6 (041)
0011 Colorado Springs - RBD SA/GMW-1200 3 SLAMS 1/6
Fremont (043) 0003 Canon City - City Hall SA/GMW-1200 1 SLAMS 1/6
Garfield 0005 Parachute SA/GMW-1200 1 SLAMS 1/3 (045) 0007 Rifle - Henry Building SA/GMW-1200 1 SLAMS 1/3
0008 New Castle - Library SA/GMW-1200 1 SLAMS 1/3 0009 Silt - Bell Ranch SA/GMW-1200 1 SLAMS 1/3 0010 Silt - Daley Ranch SA/GMW-1200 1 SLAMS 1/3 0011 Silt - Cox Ranch SA/GMW-1200 1 SLAMS 1/3 1001 Glenwood Springs SA/GMW-1200 1 SLAMS 1/3
Gunnison 0004 Crested Butte SA/GMW-1200 2 SLAMS 1/3 (051) 0007 Mt Crested Butte SA/GMW-1200 1 SLAMS 1/1
La Plata (067) 0004 Durango -RCH SA/GMW-1200 1 SLAMS 1/3
Larimer (069) 0009 Fort Collins - CSU SA/GMW-1200 1 SLAMS 1/3
Mesa 0017 Grand Junction - Powell R&P Partisol 2025 3 SLAMS 1/3 (077) R&P Partisol 2000 4 SLAMS 1/6
0018 Grand Junction Met-One BAM 1 SLAMS Hourly Pitkin SA/GMW-1200 1 SLAMS 1/3 (097)
0006 Aspen - Library TEOM - 1400ab 3 SLAMS Hourly
Powers 0001 Lamar - Power Plant SA/GMW-1200 2 SLAMS 1/1 (099) 0002 Lamar - Municipal SA/GMW-1200 2 SLAMS 1/1

2007 Colorado Air Monitoring Network Assessment 16
Table 10 APCD PM10 Monitors in Operation for 2007 (Continued) County Site # Site Name Monitor Type POC Site Type Sample
Pueblo (101) 0012 Pueblo - Public Works SA/GMW-1200 1 SLAMS 1/3 Routt (107) 0003 Steamboat Springs SA/GMW-1200 2 SLAMS 1/1 San Miguel
(113) 0004 Telluride SA/GMW-1200 1 SLAMS 1/3
Summit (117) 0002 Breckenridge SA/GMW-1200 1 SLAMS 1/1
Weld (123) 0006 Greeley - Hospital SA/GMW-1200 2 SLAMS 1/3
Table 11 APCD PM2.5 Monitors in Operation for 2007 County Site # Site Name Monitor Type POC Site Type Sample Adams 0006 Commerce City R&P 2025 Sequential 1 SLAMS 1/3 (001) R&P 2025 Sequential 2 SLAMS 1/6
TEOM - 1400ab 3 SLAMS Hourly SASS 5 SLAMS 1/3
Arapahoe (005) 0005 Arapahoe Community
College R&P 2025 Sequential 1 SLAMS 1/3
Archuleta (007) 0001 Pagosa Springs R&P 2000 w/WINS 1 SLAMS 1/6
Boulder 0003 Longmont - Municipal R&P 2025 Sequential 1 SLAMS 1/3 (013) TEOM - 1400ab 3 SLAMS Hourly
0012 Boulder Chamber of Commerce R&P 2025 Sequential 1 SLAMS 1/3
1001 Boulder – CU/Athens TEOM FDMS 3 SLAMS Hourly Denver 0002 Denver - CAMP R&P 2025 Sequential 1 SLAMS 1/1 (031) R&P 2025 Sequential 2 SLAMS 1/6
TEOM FDMS 3 SLAMS Hourly 0013 Denver - NJH TEOM FDMS 3 SLAMS Hourly 0023 Denver - Swansea R&P 2025 Sequential 1 SPM 1/1 0025 Denver Animal Shelter R&P 2025 Sequential 1 NCore 1/3 TEOM FDMS 3 NCore Hourly
Douglas 0004 Chatfield State Park R&P 2025 Sequential 1 SLAMS 1/3 (035) TEOM FDMS 3 SLAMS Hourly
Elbert (039) 0001 Elbert County R&P 2000 w/VSCC 1 SLAMS 1/3 El Paso
(041) 0011 Colorado Springs - RBD R&P 2025 Sequential 1 SLAMS 1/3
Larimer (069) 0009 Fort Collins - CSU R&P 2025 Sequential 1 SLAMS 1/3
Mesa R&P 2025 Sequential 1 SLAMS 1/3 (077)
0017 Grand Junction - Powell R&P 2025 Sequential 2 SLAMS 1/6
0018 Grand Junction – Powell TEOM - 1400ab 3 SLAMS Hourly Pueblo (101) 0012 Pueblo - Public Works R&P 2025 Sequential 1 SLAMS 1/3
Weld 0006 Greeley - Hospital R&P 2025 Sequential 1 SLAMS 1/3 (123) TEOM - 1400ab 3 SLAMS Hourly
0008 Platteville R&P 2025 Sequential 1 SLAMS 1/3 Met One 5 SLAMS 1/6

2007 Colorado Air Monitoring Network Assessment 17
Carbon Monoxide Monitoring In 2006 there were 13 monitors in operation. In 2007 the Division will operate 10 monitors. Four monitors have been discontinued they are the Arvada, National Jewish Hospital, Carriage and Colorado Springs I-25 monitors. The reason for this reduction in monitoring is the improvement in measured carbon monoxide levels. The levels have declined from a statewide maximum 1-hour value of 79 ppm in 1968 to a value of 3.9 ppm in 2006. The level of the standard has not been reached since 1999. One monitor will be added in Boulder to meet SIP requirements. Larimer & Weld Counties
Larimer and Weld counties have a population of 500732 (July 2005 estimated census), an increase of 12.2 percent since the 2000 Census. The two major urban centers are Fort Collins in Larimer County and Greeley in Weld County. Larimer County has irrigated farmland in the eastern half while the western half is mountainous. Weld County is predominantly grassland and irrigated farmland. Motor vehicle activity is a major source of pollutants. However, there are several small industries and manufacturing processes located within the two counties. These industries include a brewery, power plants, cement plants, mining, electronics and film manufacturing facilities, and rock quarries.
Fort Collins, 708 S. Mason Street (069 1004)
The population of Fort Collins is 127,686 (July 2005 estimated census). This is an increase of 7.6 percent from the 2000 census. Fort Collins does not have the population to require a carbon monoxide monitor under Federal regulation. However, it is one of the largest cities along the Front Range and was declared in nonattainment for carbon monoxide in the mid-1970s after exceeding the 8-hour standard in both 1974 and 1975. The current level of monitoring is in part a function of the resulting carbon monoxide SIP for the area.
The 708 S. Mason Street site began operation in December 1980 and is located one block west of College Avenue in the Central Business District. The 1-hour carbon monoxide standard of 35 ppm as a 1-hour average has only been exceeded on December 1, 1983, at 4:00 P.M. and again at 5:00 P.M. The values reported were 43.9 ppm and 43.2 ppm respectively. The 8-hour standard of 9 ppm, as an 8-hour average, was exceeded one or more times a year from 1980 through 1989. The last exceedances were in 1991 on January 31 and December 6 when values of 9.8 ppm and 10.0 ppm respectively were recorded. Fort Collins South, 4407 S. College Avenue (069 0010)
The second carbon monoxide monitor in Fort Collins was established in 2002. It is located at 4407 South College Avenue. This site was chosen in conjunction with the City of Fort Collins due to heavy traffic and population growth in the area. The readings at the Fort Collins –South site have been lower than those recorded at the 708 Mason Street monitor.
Greeley Annex, 905 10th Avenue (123 0010)
The population of Greeley is 88,249 (July 2005 estimated census). This is an increase of 14.7 percent from the 2000 census. Greeley does not have the population to require a carbon monoxide monitor under Federal regulation. However, it is one of the larger cities along the Front Range and was declared in nonattainment for carbon monoxide in the late-1970s after exceeding the 8-hour standard in 1976 and 1977. The first Greeley monitor operated from December 1976 to December 1980. It was located at 15th Street and 16th Avenue and exceeded the 8-hour standard numerous times from 1976 through 1980.
The 811 15th Street location began operation in November 1981 and was terminated in 2002. The current monitor is located in the Weld County Health Department Annex. This location is in the Greeley Central Business District. The levels recorded at this site are comparable to those at the former 811 15th Street site but still only about a third of the 8-hour standard.

2007 Colorado Air Monitoring Network Assessment 18
Metropolitan Denver Counties This area includes the Front Range Counties of Adams, Arapahoe, Boulder, Broomfield, Clear Creek, Douglas,
Gilpin, Jefferson, and Denver. The population of the area is 2,614,808 (July 2005 estimated census). This is an increase of 8.5 percent from the 2000 census. The Denver metropolitan area consists of all of Denver County, the western half of Adams and Arapahoe counties, most of Boulder and Jefferson counties, the northern portion of Douglas County, and none of Clear Creek and Gilpin counties.
Carbon monoxide monitoring in the area began in 1965 when Denver was selected as one of the cities to take part in the Continuous Air Monitoring Project (CAMP) developed by the U.S. Department of Health Education and Welfare. This first carbon monoxide site was established at the corner of 21st Street and Broadway on land designated as a city park. By 1973 other monitoring sites were established at 2095 Julian in west Denver, at Colfax Avenue and Colorado Boulevard, at 2005 S. Huron Street, at 78th Avenue and Steele Street and in Arvada at 57th Avenue and Garrison Street. All of these sites recorded exceedances of the 8-hour standard in the early years of operation and most of them recorded exceedances of the 1-hour standard. These exceedances were the reason that the EPA declared the Denver metropolitan area as “nonattainment” for carbon monoxide in the early 1970s.
Vehicle exhaust was determined to be the largest contributor (roughly 80 percent) to the carbon monoxide problem. As a result, most of the carbon monoxide monitors are located near residential areas with high traffic volumes or in areas downwind of those locations.
Longmont, 440 Main Street - (013 0009)
The town of Longmont is a growing, medium sized, Front Range community with a population of 81,678 (July 2005 estimated census). This is an increase of 14.9 percent from the 2000 census. Longmont is located between the Denver/Boulder Metro-area and Fort Collins. Longmont is both suburban and rural in nature. There are no major carbon monoxide sources within 12 miles of the monitor.
In January and February of 1988 and again in the winter of 1988/89 the APCD conducted a study at a site near 11th Avenue and Main Street, a few blocks north of the downtown area. Because two exceedances of the standard were recorded during the study, the Division felt that a permanent carbon monoxide site should be established closer to the downtown area. These exceedances resulted in Longmont being designated as a carbon monoxide nonattainment area and required a SIP for carbon monoxide be developed showing attainment by December 31, 1995. The Air Quality Control Commission accepted the Longmont SIP on June 16, 1995. In 1999, Longmont was redesignated as an attainment area.
Longmont has contended that its carbon monoxide problems are generally the result of transport from the Denver metropolitan area north to the Longmont area. The review of the time series plots for Longmont, Denver CAMP, Greeley and Boulder show that the carbon monoxide maximum at all four locations generally coincide. In addition these peaks are bimodal at 7 to 9 A.M. and 4 to 6 P.M. at all four locations. This pattern is associated with locally generated emissions from traffic, not transport from another area. The carbon monoxide emissions inventories developed for the SIP show that 78 percent of the carbon monoxide comes from on-road mobile sources. These findings are consistent with the observed distribution of the data.
Carbon monoxide monitoring is expected to continue for the next several years at the current location. Although the trend of 8-hour values has shown a decline in the past three years, the hourly values generally exceed those of both Boulder and Greeley. The elevated values are a concern since Longmont is much smaller than both these cities. There is no local meteorological monitoring associated with the carbon monoxide measurements. Boulder, 29th Street & Arapahoe Avenue - (013 0014)
The city of Boulder is located about 30 miles to the northwest of Denver. The population estimate of the 2005 census is 94,673. This is an increase of 2.9 percent from the 2000 census. The 2150 28th Street site began operation in December 1993 it was terminated in May 2005 when the Division was told that the land was going to be renovated.
The Scott Carpenter Park in located on the eastside of the city of Boulder. The park is located at the southwest corner of 29th Street and Arapahoe Avenue. Monitoring will commence at this location in 2007. Welby, 3174 E. 74th Avenue - (001 3001)
Located 8 miles north-northeast of the Denver central Business District (CBD) on the bank of the South Platte River, this site is ideally located to measure nighttime drainage of the air mass from the Denver metropolitan area and the thermally driven, daytime upriver flows. The monitoring shows that high carbon monoxide levels are associated with

2007 Colorado Air Monitoring Network Assessment 19
winds from the south-southwest. While this is the direction of five of the six major sources in the area, it is also the direction of the primary drainage winds along the South Platte River.
Carbon monoxide monitoring began in 1973 and continued through the spring of 1980. Monitoring was stopped from the spring of 1980 until November 1986 when it began again as a special study. Welby has not recorded an exceedance of either the 1-hour or 8-hour carbon monoxide standard since January 1988. In the last few years its primary value has been as an indicator of changes in the pollution standard index (PSI). Denver CAMP - 2105 Broadway - (031 0002)
The Denver CAMP site is located in the north-central part of the Denver CBD. Denver is the largest city in Colorado with a population of 571,848 according to the 2005 estimate. Carbon monoxide monitoring began in February 1965 as a part of the Federal Continuous Air Monitoring Project. It was established as a maximum concentration, population-oriented monitor. The CAMP site measures the exposure of the people who work or reside in the CBD. Its location in a high traffic street canyon causes this site to record most of the high pollution episodes in the metro area. The street canyon effect at CAMP results in variable wind directions for high carbon monoxide levels and as a result wind direction is less relevant to high concentrations than wind speed. Wind speeds less than 1 mph, especially up-valley, combined with temperature inversions trap the pollution in the area.
Historically the CAMP monitor has recorded some of the highest carbon monoxide levels in the state. It has not recorded an 8-hour concentration over the standard since 1995 and since 2001 the second maximum 8-hour concentrations have been less than one-half of the standard. Denver, Firehouse #6, 1300 Blake Street - (031 0019)
The Denver Firehouse #6 is located on the block between Auraria Parkway and Blake Street where they intersect with Speer Boulevard. This is one of the busiest intersections in downtown Denver and computer modeling indicated that it would have high levels of carbon monoxide.
In the winter of 1995 the monitor was converted from a special purpose monitor to a seasonal SLAMS monitor. Denver Municipal Animal Shelter, 678 S. Jason Street (031 0025) The Denver Municipal Animal Shelter (DMAS) was established as a replacement for the Denver Gates particulate monitor that was located at 1050 S. Broadway about one half mile south-southeast and on the other side of the South Platte River and I-25 South. The DMAS location represents the core area of the South Platte drainage in Denver. It has a good mixture of light industrial, residential areas and is strongly affected by the mobile sources along I-25 as well as South Santa Fe Dr. The openness of the area also permits the meteorological data to be representative of the larger core Denver area. Finally the site is on City owned property and will presumably be available for long-term trend analysis. When fully developed the site will be established as the NCore site for the Denver Metropolitan area and will include a trace/precursor-level carbon monoxide analyzer.
El Paso, Park & Teller Counties
This area has a population of 604,291 according to the July 2005 estimate. It is a very popular tourist area with rapid urban growth. The land usage varies from prairie in eastern El Paso County to very mountainous in Teller and Park Counties. Only El Paso County has a large urbanized area, Colorado Springs, with a population of 384,876 according to the July 2005 estimate. This is an increase of 6.3 percent since the 2000 census. The City of Colorado Springs and El Paso County both operate separate monitoring networks that are not included as a part of this report.
Colorado Springs has not had an exceedance of the 1-hour NAAQS since 1979 and has not had an exceedance of the 8-hour NAAQS since 1989. The city was redesignated to an attainment area in 1999. Colorado Springs, 690 W. Hwy 24 (041 0015)
The 690 W. Highway 24 site is located just to the west of I-25 and just to the east of the intersection of U.S. Highway 24 and 8th Street, approximately 0.8 miles to the west of the Colorado Springs CBD. Commencing operation in November 1998, this site is a replacement for the Tejon Street (041 0004) carbon monoxide monitor. The site is located in the Fountain Creek drainage and is in one of the busiest traffic areas of Colorado Springs. Additionally, traffic is prone to back-up along Highway 24 due to a traffic light at 8th Street. Thus, this site is well suited to monitor maximum

2007 Colorado Air Monitoring Network Assessment 20
concentrations of carbon monoxide in the area both from automotive sources and also from nearby industry which includes a power plant. It also provides a micro-scale setting for the Colorado Springs area, which has not been possible in the past. Western Counties
The Western Slope consists of the 21 counties west of the Continental Divide. The population of the area is 575,929 (July 2005 estimate). This is an increase if 11.2 percent over the 2000 census. However, the population is not evenly distributed among the counties and ranges from Mesa County with 130,662 to Hinsdale County with only 821 according to the July 2005 estimate1. Short-term special purpose monitoring for carbon monoxide has been done in Summit County at Vail and near the oil shale projects of Rio Blanco County. However, only Grand Junction has a sufficient population base to require monitoring for carbon monoxide. Grand Junction, 645 ¼ Pitkin Avenue (077 0018)
The Grand Junction monitor began operation in January 2004. This monitor replaced the monitor at the Stocker Stadium. The Stocker stadium location had become less than ideal with the growth of the trees surrounding the park and the Division felt that a location nearer to the CDB would provide a better representation of carbon monoxide concentration values for the city. The carbon monoxide concentrations at the Stocker Stadium site had been declining from an 8-hour maximum in 1991 of 7.8 ppm to a 3.3 ppm in 2003. The Powell monitor has shown a continuing decline in values to a 1.9 ppm in 2006.
Grand Junction is the largest city on the western slope with a population of 49,422 (July 2005 estimate) This is an increase of 17.7 percent from the 2000 census. Planned Changes in the Carbon Monoxide Monitoring for 2007
1) Installation of a site in Boulder at the Scott Carpenter Park. 2) Removal of Fort Collins –South site. 3) Installation of trace/precursor-level analyzer at the Denver Municipal Animal Shelter

2007 Colorado Air Monitoring Network Assessment 21
Quality Assurance Checks for Carbon Monoxide Monitors The APCD staff performs two types of gaseous analyzer performance audits, assessment audits and accuracy audits. These audits challenge the analyzer with pollutant gases of known concentration within the range of the analyzer. The following table shows the number of these audits conducted on the carbon monoxide analyzers for 2006. The APCD Quality Assurance staff conducts audits on all of the carbon monoxide instruments at least twice per year. The APCD Field staff conducts precision checks nominally once every two weeks. The details and minimum standards for this program are set out in the Code of Federal Regulations (Part 58 Ambient Air Quality Surveillance). A complete description of the procedures and the results are available from the APCD.
Table 12 2006 Number of Precision Checks for Carbon Monoxide
Site 1st Quarter 2nd Quarter 3rd Quarter 4th Quarter Welby 6 6 7 7 Longmont 6 7 6 7 CAMP 6 6 6 7 NJH 6 7 6 7 Carriage 7 6 6 7 Firehouse 7 7 6 7 Glenn 7 6 7 7 Highway 24 5 6 6 7 Arvada 7 7 6 7 Ft Collins South 7 6 7 7 Ft. Collins 7 6 6 6 Grand Junction 6 7 6 7 Greeley 7 5 7 7
Table 13 2006 Number of Accuracy Audits for Carbon Monoxide
Site 1st Quarter 2nd Quarter 3rd Quarter 4th Quarter Welby 1 1 1 Longmont 1 1 CAMP 1 1 NJH 1 1 1 Carriage 1 1 1 Firehouse 1 1 Glenn 1 1 Highway 24 1 1 Arvada 1 1 1 Ft Collins South 1 1 Ft. Collins 1 1 Grand Junction 1 1 Greeley 1 1

O
2007 Colorado Air Monitoring Network Assessment 22
ZONE Ozone Problem Identification
Ozone monitoring in the State has been reduced to counties along the front range of the Rocky Mountains. In addition non-state operated ozone monitors have operated in other locations on the western slope and Front Range. However, only the Front Range monitors have ever recorded exceedances of the 1-hour NAAQS for ozone. Since 1990, there have been seven sites that have exceeded the 1-hour standard. They are: Highlands Reservoir (2003), South Boulder (1993), Denver Carriage (2003), Chatfield Reservoir (1998, 2003), U.S. Air Force Academy (2004), NREL(1995, 2003) and Rocky Mountain National Park (1993).
The changes in the ozone NAAQS should not affect monitoring locations in Colorado. Although several monitoring sites exceeded the level of the standard one or more times per year The values recorded during the last three years show that none of the currently operating ozone monitors have recorded a fourth maximum 8hr average greater than the level of the standard. Therefore, Denver and the Front Range should remain in attainment for ozone. Larimer & Weld Counties
Larimer and Weld counties have a population of 500732 (July 2005 estimated census), an increase of 12.2 percent since the 2000 Census. The two major urban centers are Fort Collins in Larimer County and Greeley in Weld County. Larimer County has irrigated farmland in the eastern half while the western half is mountainous. Weld County is predominantly grassland and irrigated farmland. Motor vehicle activity is a major source of pollutants. However, there are several small industries and manufacturing processes located within the two counties. These industries include a brewery, power plants, cement plants, mining, electronics and film manufacturing facilities, and rock quarries. Fort Collins
Larimer and Weld Counties have a population of 500732 (July 2005 estimate). This is an increase of 15.8 percent since 2000census. The two major urban centers are Fort Collins in Larimer County and Greeley in Weld County. Ozone levels at the monitors operated in and around the Greeley and Fort Collins areas have exceeded the level of the 1-hour ozone NAAQS of 0.12 ppm only once since monitoring began in 1981. A review of the data shows that they are unlikely to exceed the level of the new 8-hour NAAQS of 0.08 ppm. However, the site operated by the National Park Service located in Rocky Mountain National Park in Western Larimer County has exceeded the previous 1-hour standard in 1993 but would not have reached the level of the 8-hour standard. Fort Collins – West, 3416 W. LaPorte Avenue (069 0011) The Fort Collins West monitor began operation in May of 2006. The location was established based on modeling and to satisfy permit conditions for a major source in Fort Collins area. The levels recorded for the first season of operation have shown consistently higher concentrations than the 708 Mason Street monitor. For 2006 the 8-hour average, 4th maximum was 0.087 ppm. The 4th maximum, 8-hour average at the Mason Street monitor was 0.078 ppm for the same period. Fort Collins, 708 S. Mason Street (069 1004)
The population of Fort Collins is 127,686 (July 2005 population estimate). This is an increase of 7.6 percent from the 2000 census and a 0.6 percent increase over the 2004 population estimate. The Fort Collins ozone site has been in operation since 1981 and has recorded only one exceedance of the standard since it began operation. Monitoring in this area will likely continue so that changes in the Fort Collins area may be examined, although violations are not expected. At this time there have not been any changes in the area that would require adjustment in the current monitoring level. Due to the size of the community, elevated ozone readings in Fort Collins probably result from second day transport/reactions from the Denver area. Greeley, Weld County Communication Tower (123 0009)
The population of Greeley is 88,249 (July 2005 population estimate). This is an increase of 14.7 percent from the 2000 census and a 2.8 percent increase over the 2004 population estimate.
The Weld County Tower monitor began operation in June 2002. The site was established after the 811 15th Street

2007 Colorado Air Monitoring Network Assessment 23
building was sold and was scheduled for demolition. The Weld County Tower site has generally recorded levels greater than the old site. Its location along a green belt and beside the communications complex reduces any influence from traffic along 35th Avenue.
Metropolitan Denver Counties
This area includes the Front Range Counties of Adams, Arapahoe, Boulder, Broomfield, Clear Creek, Douglas, Gilpin, Jefferson, and Denver. The population of the area is 2,614,808 (July 2005 estimated census). This is an increase of 8.5 percent from the 2000 census. The Denver metropolitan area consists of all of Denver County, the western half of Adams and Arapahoe counties, most of Boulder and Jefferson counties, the northern portion of Douglas County, and none of Clear Creek and Gilpin counties. Only Adams, Arapahoe, Boulder, Douglas, Jefferson and Denver Counties have ozone monitors. The counties of Gilpin and Clear Creek generally lack the appropriate combination of meteorology and geography for ozone formation. Welby, 3174 78th Avenue (001 3001)
The Welby ozone site began operation in July 1973. In the mid-1970s, Welby recorded the highest levels of ozone seen in the State. Since then it has experienced a declining trend of ozone and now records some of the lowest levels in the area. It is unclear if declining levels are due to controls on precursors, increases in nitric oxide levels, high levels of precursors present in the area of the site, or a shift in the path of the ozone “cloud.” Its location in the up and down river drainage path of the Denver air mass that has been “cooking” gives either a warning of the events to come or the results of the day's exposure. The site serves as a good drainage location but it may be a target for deletion or relocation farther down the South Platte River valley from Denver. Highland Reservoir, 8100 S. University Blvd. (005 0002)
The Highlands site began operation in 1978. It was intended to be a background location. However, with urban growth and the construction of C-470, it has become a long-term trend site that monitors changes in the air quality of the area. It is currently believed to be near the southern edge of the ozone “cloud,” although it may not be in the area of maximum concentrations. Operation will continue since the site regularly records levels between 80 and 90 percent of the NAAQS and has a good non-traffic orientation downwind from the Denver CBD. Boulder, 1405½ S. Foothills Parkway (013 0011)
The city of Boulder is located about 30 miles to the northwest of Denver. The Boulder population from the July 2005 population estimate was 97,422 an increase of 2.9 percent from the 2000 census. The Boulder Foothills, South Boulder Creek site was established as a special purpose ozone monitor as a part of the Summer 1993 Denver Ozone Study. During that summer a 1-hour level of 0.128 ppm was recorded on July 2, 1993. In 1994 the monitor was converted from an SPM to a seasonal SLAMS and in 1995 to a year-round ozone monitor when the instruments were moved into a new shelter. The South Boulder Creek monitor has not recorded an exceedance of the 1-hour NAAQS since the summer of 1993. It has not even recorded the maximum level for the Boulder area. The review of the historic ozone data did not indicate that the South Boulder Creek monitor would exceed the 8-hour standard. Denver, Carriage, 23rd Avenue & Julian Street (031 0014)
Carriage is located 2.5 miles west of the CBD. The site represents an ideal neighborhood exposure setting due to its unique location in an old carriage lot in the center of the block surrounded by houses. The Carriage ozone site began operation in 1981. It represents a good neighborhood site for ozone exposure since it is isolated enough to be unaffected by local traffic. Ozone levels at this site have not exceeded the 1-hour NAAQS since 1987 and currently have relatively stable levels well below the 1-hour and 8-hour NAAQS.
Denver Municipal Animal Shelter, 678 S. Jason Street (031 0025) The Denver Municipal Animal Shelter (DMAS) was established as a replacement for the Denver Gates particulate monitor that was located at 1050 S. Broadway about one half mile south-southeast and on the other side of the South Platte River and I-25 South. The DMAS location represents the core area of the South Platte drainage in Denver. It has a good mixture of light industrial, residential areas and is strongly affected by the mobile sources along I-25 as well as

2007 Colorado Air Monitoring Network Assessment 24
South Santa Fe Dr. The openness of the area also permits the meteorological data to be representative of the larger core Denver area. Finally the site is on City owned property and will presumably be available for long-term trend analysis. When fully developed the site will be established as the NCore site for the Denver Metropolitan area.
Arvada, 57th Avenue & Garrison Street (059 0002)
The city of Arvada is located 15 miles west-northwest of the Denver CBD. It has a population of 103,704 according to the July 2005 population estimate. This is an increase of 1.5 percent from the 2000 census.
The Arvada site began operation before 1973. It is located to the northwest of the Denver CBD near the western end of the diurnal midday wind flow of the ozone “cloud.” As a result, when conditions are proper for daylong ozone production, this site has received some of the highest levels in the city. In the early and mid 1970s, these wind patterns caused Arvada to have the most violations in the metro area. Arvada has not had an exceedance of the NAAQS since 1988, but it still records some of the highest levels in the metro area, therefore, it will continue operation. Welch, 12400 W. Hwy 285 (059 0005)
The Division conducted a short-term ozone study on the grounds of Chatfield High School from June 14, 1989 until September 28, 1989. The Chatfield location was chosen because it sits on a ridge southwest of the Denver CBD. Wind pattern studies showed a potential for elevated ozone levels in the area on mid to late afternoon summer days. There were no exceedances of the NAAQS recorded at the Chatfield site but the levels were frequently higher than those recorded at the other monitoring sites south of the metro area.
One finding of the study was the need for a new, permanent site further north of the Chatfield High School location. As with most Denver locations, the predominant wind pattern is north/south. The southern flow occurs during the upslope, daytime warming period. The northern flow occurs during late afternoon and nighttime when drainage is caused by cooling and settling. The major drainages of Bear Creek and Turkey Creek were selected as target downwind transport corridors. These are the first major topographical features north of the Chatfield site. A point midway between the valley floor (Englewood site) and the foothill’s hogback ridge was modeled to be the best estimate of the maximum downwind daytime transport area. These criteria were used to evaluate available locations. The Welch site best met these conditions. This site is located off State Highway 285 between Kipling Street and C-470.
Monitoring so far has indicated that some levels at this location are lower than at other locations along the western edge of the Denver metropolitan area. As a result, this site will be reviewed after the 2007 ozone season to determine if it needs to be relocated for maximum concentration in the area. Rocky Flats - N 16600 W. Hwy 128 (059 0006)
The Rocky Flats-N site is located north-north east of the plant on the south side of Colorado Highway 128, approximately 1¼ miles to the west of Indiana Street. The site began operation in June 1992 as a part of the first phase of the APCD’s monitoring effort around the Rocky Flats Environmental Technology Site.
Ozone monitoring began as a part of the “Summer 1993 Ozone Study”. The monitor recorded some of the highest ozone levels of any of the sites during that study. Therefore, it was included as a regular part of the APCD ozone-monitoring network. Since that initial ozone study the Rocky Flats –N site has continued to record elevated 1-hour and 8-hour ozone levels.
N. R. E. L. Solar Radiation Research Laboratory (059 0011)
The National Renewable Energy Laboratory (NREL) site is located on the south rim of South Table Mountain, near Golden, and was part of the 1993 Summer Ozone Study. Based on the elevated concentrations found at this location, it was made a permanent monitoring site in 1994. Since then, this site has recorded the highest ozone levels in the metro area for every year. An exceedance of the 1-hour NAAQS was recorded in 1995 and thus there are no plans to change this monitoring location. This site typically records some of the highest 8-hour ozone concentrations in the Denver area. Chatfield Reservoir, Roxborough Park Rd. SLAMS (035 0002)
The Chatfield Reservoir location was established as the result of the 1993 Summer Ozone Study. The site is located on the south side of Chatfield Reservoir at the park offices. This location was selected over the Corps of Engineers Visitor Center across the reservoir because it was more removed from the influence of traffic along C-470. Located in the

2007 Colorado Air Monitoring Network Assessment 25
South Platte River drainage, this location is well suited for monitoring southwesterly ozone formation in the Denver metro area. No exceedances of the 1-hour NAAQS have been recorded.
El Paso, Park & Teller Counties
This area has a population of 604,291 (July 2005 population estimate). This is an increase of 9.5 percent from the 2000 census. It is a very popular tourist area with rapid urban growth. The topography varies from prairie in eastern El Paso County to very mountainous in Teller and Park Counties. Only El Paso County has a large urbanized area, Colorado Springs, with a population of 384,876 (July 2005 population estimate). This is an increase of 7.6 percent since the 2000 census. In addition, the City of Colorado Springs and El Paso County both operate separate monitoring networks that are not included as a part of this report.
The Colorado Springs area has many of the conditions that give the Denver metropolitan area its ozone problem: geography, stagnant summer air, bright sunlight and sufficient precursor chemical production. Ozone monitoring in the area began in 1975 and only one value of 0.125 ppm or greater has ever been reported. The area is classified as attainment for ozone. Monitoring in the Colorado Springs metro area is required due to its population and will be continued for the future. Colorado Springs, USAF Rd. 640 (041 0013)
The United States Air Force Academy site was installed as a replacement maximum concentration ozone monitor for the Chestnut Street (041 0012) site. Modeling in the Colorado Springs area indicates that high ozone concentrations should generally be found along either the Monument Creek drainage to the north of the Colorado Springs CBD or to a lesser extent along the Fountain Creek drainage to the west of the CBD. The decision was made to locate this site near the Monument Creek drainage, approximately 9 miles north of the CBD. This location is near the south entrance of the Academy but away from any roads.
Manitou Springs, 101 Banks Place, (041 0016) The Manitou Springs monitor began operations in April 2004. It is located in the foothills above Colorado Springs in the back of the maintenance area. It was established because of concern that the “ozone cloud” was traveling farther up the canyon and the current monitoring network was not adequate. In its three seasons of operation it has not recorded any levels greater than the standard but in 2005 the levels have been as high as 0.082 ppm as an 8-hour average concentration. Planned Changes in Ozone Monitoring for 2007-2008
1) Installation of an analyzer at the Denver Municipal Animal Shelter. 2) Shut down the analyzer at the Denver CAMP site after the ozone season. 3) Possible relocation of the Rocky Flats –N site at the end of the 2007 season due to power issues.

2007 Colorado Air Monitoring Network Assessment 26
Quality Assurance Checks for Ozone Monitors The APCD staff performs two types of gaseous analyzer performance audits, assessment audits and accuracy audits. These audits challenge the analyzer with pollutant gases of known concentration within the range of the analyzer. The following table shows the number of these audits conducted on the ozone analyzers for 2006. The APCD Quality Assurance staff conducts audits on all of the ozone instruments at least twice per year. The APCD Field staff conducts precision checks nominally once every two weeks. The details and minimum standards for this program are set out in the Code of Federal Regulations (Part 58 Ambient Air Quality Surveillance). A complete description of the procedures and the results are available from the APCD.
Table 14 2006 Number of Precision Checks for Ozone
Site 1st Quarter 2nd Quarter 3rd Quarter 4th Quarter Welby 6 6 7 7 Highlands 7 7 7 6 S. Boulder Cr. 6 7 6 7 CAMP 5 7 6 7 Carriage 7 7 6 7 Chatfield 6 7 6 6 Academy 6 6 7 6 Manitu 7 6 7 7 Arvada 7 7 6 7 Welch 7 5 9 7 Rocky Flats N. 6 6 7 7 NREL 6 6 6 7 Ft. Collins West n/a 1 9 7 Ft. Collins CSU 7 6 7 7 Greeley 7 6 7 7
Table 15 2006 Number of Accuracy Audits for Ozone
Site 1st Quarter 2nd Quarter 3rd Quarter 4th Quarter Welby 1 1 1 Highlands 1 1 S. Boulder Cr. 1 1 CAMP 1 Carriage 1 1 1 Chatfield 1 1 1 Academy 1 1 Manitu 1 1 Arvada 1 1 1 Welch 1 1 Rocky Flats N. 1 1 NREL 1 1 Ft. Collins West n/a 1 1 Ft. Collins CSU 1 1 Greeley 1 1

2007 Colorado Air Monitoring Network Assessment 27
NITROGEN DIOXIDE
The Air Pollution Control Division has monitored nitrogen dioxide at eight locations in Colorado. All but two of these locations are no longer operating. Only the CAMP monitor has ever approached the standard of 0.053 ppm. It recorded 0.052 in 1975, 1976 1979 and in 1983. In the past 20 years the levels have been declining and in the past three years the levels have been reduced to nearly one half of the standard. Welby, 3174 78th Avenue (001 3001) The Welby nitrogen dioxide site began operation in July 1976. Its location in the up and down river drainage path of the Denver air mass that has been “cooking” gives either a warning of the events to come or the results of the day's exposure. The site serves as a good drainage location but it may be a target for deletion or relocation farther down the South Platte River valley from Denver. Denver CAMP - 2105 Broadway - (031 0002)
The City and County of Denver is located approximately 30 miles east of the foothills of the Rocky Mountains. Denver sits in a basin and the terrain of the city is characterized as gently rolling hills with the Platte River running from southwest to northeast just west of the downtown area.
Meteorological data gathered at the CAMP monitoring station is inconclusive for evaluation of the location as a PM2.5 neighborhood scale site. The winds are strongly affected by the street canyon effect of the downtown buildings. Meteorological data shows that winds are predominately from the south, south-southwest, north, and north-northwest.4 However, due to the downtown location of this site, winds are shown to flow from almost all directions at similar frequencies. Modeling of the emissions, traffic volume and history show that the CAMP monitor is well situated to be a maximum concentration, micro scale site. However, this site represents a location typical of most of the downtown Denver area. This area has similar land uses, AADT, VMT (vehicle miles traveled), and PM2.5 sources. The Division has shown that the downtown Denver area and the fringe area surrounding the downtown area is homogeneous and indicates that the CAMP station is representative of a wider area than just its own micro scale area. Thus, the CAMP nitrogen dioxide site is representative of a neighborhood scale area.
Planned Changes in Nitrogen Dioxide Monitoring for 2007-2008 There are no planned changes for nitrogen dioxide monitoring in 2007.

2007 Colorado Air Monitoring Network Assessment 28
Quality Assurance Checks for Oxides of Nitrogen Monitors The APCD staff performs two types of gaseous analyzer performance audits, assessment audits and accuracy audits. These audits challenge the analyzer with pollutant gases of known concentration within the range of the analyzer. The following table shows the number of these audits conducted on the oxides of nitrogen analyzers for 2006. The APCD Quality Assurance staff conducts audits on all of the oxides of nitrogen instruments at least twice per year. The APCD Field staff conducts precision checks nominally once every two weeks. The details and minimum standards for this program are set out in the Code of Federal Regulations (Part 58 Ambient Air Quality Surveillance). A complete description of the procedures and the results are available from the APCD.
Table 16 2006 Number of Precision Checks for Oxides of Nitrogen
Site 1st Quarter 2nd Quarter 3rd Quarter 4th Quarter CAMP 6 7 6 7 Welby 6 5 7 7
Table 17 2006 Number of Accuracy Audits for Oxides of Nitrogen
Site 1st Quarter 2nd Quarter 3rd Quarter 4th Quarter CAMP 1 1 Welby 1 1 1

2007 Colorado Air Monitoring Network Assessment 29
SULFUR DIOXIDE
The Air Pollution Control Division has monitored sulfur dioxide at eight locations in Colorado. All but two of these locations are no longer operating. Sulfur dioxide has never approached the level of any of the sulfur dioxide standards even in the mid-1970’s, when the levels were at their highest, they were generally less than one half of the level of the standard. The primary reason for these low levels is that what coal fired industry there is in Colorado uses low sulfur coal for combustion. In 2007 a new trace /precursor-level sulfur dioxide monitor will be established as a part of the NCORE monitoring at the Denver Animal Shelter. Welby, 3174 78th Avenue (001 3001)
The Welby sulfur dioxide site began operation in July 1975. Its location in the up and down river drainage path of the Denver air mass that has been “cooking” gives either a warning of the events to come or the results of the day's exposure. The site serves as a good drainage location but it may be a target for deletion or relocation farther down the South Platte River valley from Denver. Denver CAMP - 2105 Broadway - (031 0002)
The City and County of Denver is located approximately 30 miles east of the foothills of the Rocky Mountains. Denver sits in a basin and the terrain of the city is characterized as gently rolling hills with the Platte River running from southwest to northeast just west of the downtown area.
Meteorological data gathered at the CAMP monitoring station is inconclusive for evaluation of the location as a PM2.5 neighborhood scale site. The winds are strongly affected by the street canyon effect of the downtown buildings. Meteorological data shows that winds are predominately from the south, south-southwest, north, and north-northwest.4 However, due to the downtown location of this site, winds are shown to flow from almost all directions at similar frequencies. Modeling of the emissions, traffic volume and history show that the CAMP monitor is well situated to be a maximum concentration, micro scale site. However, this site represents a location typical of most of the downtown Denver area. This area has similar land uses, VMT (vehicle miles traveled), and sulfur dioxide sources. The Division has shown that the downtown Denver area and the fringe area surrounding the downtown area is homogeneous and indicates that the CAMP station is representative of a wider area than just its own micro scale area. Thus, the CAMP sulfur dioxide site is representative of a neighborhood scale area. Denver Municipal Animal Shelter, 678 S. Jason Street (031 0025) The Denver Municipal Animal Shelter (DMAS) was established as a replacement for the Denver Gates particulate monitor that was located at 1050 S. Broadway about one half mile south-southeast and on the other side of the South Platte River and I-25 South. The DMAS location represents the core area of the South Platte drainage in Denver. It has a good mixture of light industrial, residential areas and is strongly affected by the mobile sources along I-25 as well as South Santa Fe Dr. The openness of the area also permits the meteorological data to be representative of the larger core Denver area. Finally the site is on City owned property and will presumably be available for long-term trend analysis. When fully developed the site will be established as the NCore site for the Denver Metropolitan area. Planned Changes in Sulfur Dioxide Monitoring for 2007 1) Installation of a trace/precursor level analyzer at the Denver Municipal Animal Shelter.

2007 Colorado Air Monitoring Network Assessment 30
Quality Assurance Checks for Sulfur Dioxide Monitors The APCD staff performs two types of gaseous analyzer performance audits, assessment audits and accuracy audits. These audits challenge the analyzer with pollutant gases of known concentration within the range of the analyzer. The following table shows the number of these audits conducted on the sulfur dioxide analyzers for 2006. The APCD Quality Assurance staff conducts audits on all of the sulfur dioxide instruments at least twice per year. The APCD Field staff conducts precision checks nominally once every two weeks. The details and minimum standards for this program are set out in the Code of Federal Regulations (Part 58 Ambient Air Quality Surveillance). A complete description of the procedures and the results are available from the APCD.
Table 18 2006 Number of Precision Checks for Sulfur Dioxide
Site 1st Quarter 2nd Quarter 3rd Quarter 4th Quarter CAMP 6 7 3 5 Welby 6 5 7 7
Table 19 2006 Number of Accuracy Audits for Sulfur Dioxide
Site 1st Quarter 2nd Quarter 3rd Quarter 4th Quarter CAMP 1 1 Welby 1 1 1
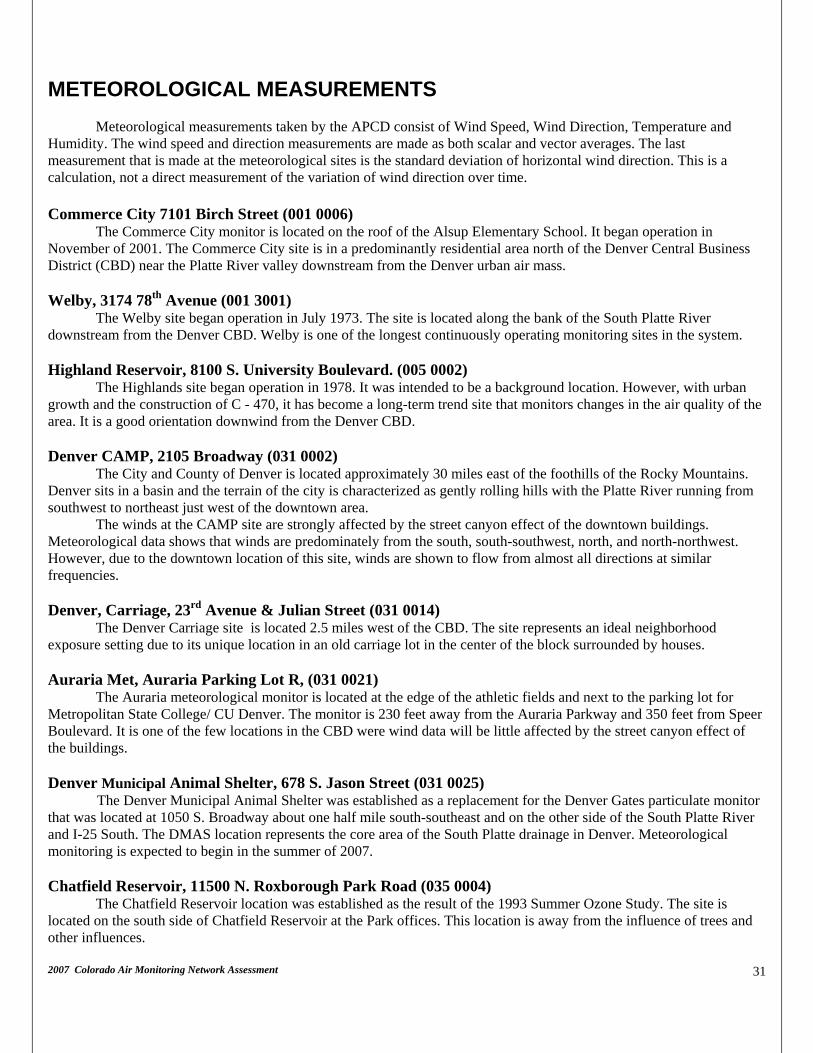
2007 Colorado Air Monitoring Network Assessment 31
METEOROLOGICAL MEASUREMENTS Meteorological measurements taken by the APCD consist of Wind Speed, Wind Direction, Temperature and Humidity. The wind speed and direction measurements are made as both scalar and vector averages. The last measurement that is made at the meteorological sites is the standard deviation of horizontal wind direction. This is a calculation, not a direct measurement of the variation of wind direction over time. Commerce City 7101 Birch Street (001 0006)
The Commerce City monitor is located on the roof of the Alsup Elementary School. It began operation in November of 2001. The Commerce City site is in a predominantly residential area north of the Denver Central Business District (CBD) near the Platte River valley downstream from the Denver urban air mass. Welby, 3174 78th Avenue (001 3001)
The Welby site began operation in July 1973. The site is located along the bank of the South Platte River downstream from the Denver CBD. Welby is one of the longest continuously operating monitoring sites in the system. Highland Reservoir, 8100 S. University Boulevard. (005 0002)
The Highlands site began operation in 1978. It was intended to be a background location. However, with urban growth and the construction of C - 470, it has become a long-term trend site that monitors changes in the air quality of the area. It is a good orientation downwind from the Denver CBD. Denver CAMP, 2105 Broadway (031 0002)
The City and County of Denver is located approximately 30 miles east of the foothills of the Rocky Mountains. Denver sits in a basin and the terrain of the city is characterized as gently rolling hills with the Platte River running from southwest to northeast just west of the downtown area.
The winds at the CAMP site are strongly affected by the street canyon effect of the downtown buildings. Meteorological data shows that winds are predominately from the south, south-southwest, north, and north-northwest. However, due to the downtown location of this site, winds are shown to flow from almost all directions at similar frequencies. Denver, Carriage, 23rd Avenue & Julian Street (031 0014)
The Denver Carriage site is located 2.5 miles west of the CBD. The site represents an ideal neighborhood exposure setting due to its unique location in an old carriage lot in the center of the block surrounded by houses.
Auraria Met, Auraria Parking Lot R, (031 0021)
The Auraria meteorological monitor is located at the edge of the athletic fields and next to the parking lot for Metropolitan State College/ CU Denver. The monitor is 230 feet away from the Auraria Parkway and 350 feet from Speer Boulevard. It is one of the few locations in the CBD were wind data will be little affected by the street canyon effect of the buildings.
Denver Municipal Animal Shelter, 678 S. Jason Street (031 0025) The Denver Municipal Animal Shelter was established as a replacement for the Denver Gates particulate monitor that was located at 1050 S. Broadway about one half mile south-southeast and on the other side of the South Platte River and I-25 South. The DMAS location represents the core area of the South Platte drainage in Denver. Meteorological monitoring is expected to begin in the summer of 2007. Chatfield Reservoir, 11500 N. Roxborough Park Road (035 0004)
The Chatfield Reservoir location was established as the result of the 1993 Summer Ozone Study. The site is located on the south side of Chatfield Reservoir at the Park offices. This location is away from the influence of trees and other influences.
2007 Colorado Air Monitoring Network Assessment 32
Arvada, 57th Avenue & Garrison Street (059 0002) The city of Arvada is located 15 miles west-northwest of the Denver CBD. The Arvada site began operation
before 1973. It’s location to the northwest of the Denver CBD near the western end of the diurnal midday wind flow of the ozone “cloud” and development in the area make this a good population oriented site. Welch, 12400 W. Hwy 285 (059 0005)
The Welch site is located off State Highway 285 between Kipling Street and C-470. It is approximately 11 miles southwest of the Denver CBD and located between the drainages of Bear Creek and Turkey Creek. It is in position to monitor the southern flow that occurs during the upslope, daytime warming period and the northern flow which occurs during late afternoon and nighttime when drainage is caused by cooling and settling. Rocky Flats – N, 16600 W. Hwy 128 (059 0006)
The Rocky Flats - N site is located north-northeast of the plant on the south side of Colorado Highway 128, approximately 1¼ miles to the west of Indiana Street. The site began operation in June 1992 as a part of the first phase of the APCD’s monitoring effort around the Rocky Flats Environmental Technology Site. It has continued after the closing of Rocky Flats because it is one of the highest concentration ozone monitors in the state. Rocky Flats – SE, 9901 Indiana Street (059 0008) This site is located along Indiana Street southeast of Rocky Flats. The winds at this location are appreciably different from either the Rocky Flats North site or the Arvada site. However it will be removed after the 2007 ozone season. Fort Collins, 708 S. Mason Street (069 1004)
The Mason Street site is the only meteorological site operated by the APCD in the Fort Collins area. Grand Junction, 645 ¼ Pitkin Avenue (077 0018)
This location monitors carbon monoxide, wind speed, wind direction, temperature and hourly PM10. It is located at the northern edge of a low usage parking lot near the Powell monitor. Lamar Port of Entry, 7100 US Hwy 50, (099 0003) The particulate monitors in Lamar have recorded some of the highest readings in the state. These readings are primarily associated with east winds in excess of 20 MPH. The Division first established a meteorological monitor in Lamar at the Municipal Building but this location was too protected and the monitor was moved to the Port of Entry location in March of 2005. Planned Changes in Meteorological Monitoring for 2007
1) Elimination of the Rocky Flats SE site at the end of 2007. 2) Installation of sensors at the Greeley-Weld County Tower site. 3) Installation of sensors at the Colorado Springs – Hwy24 site.
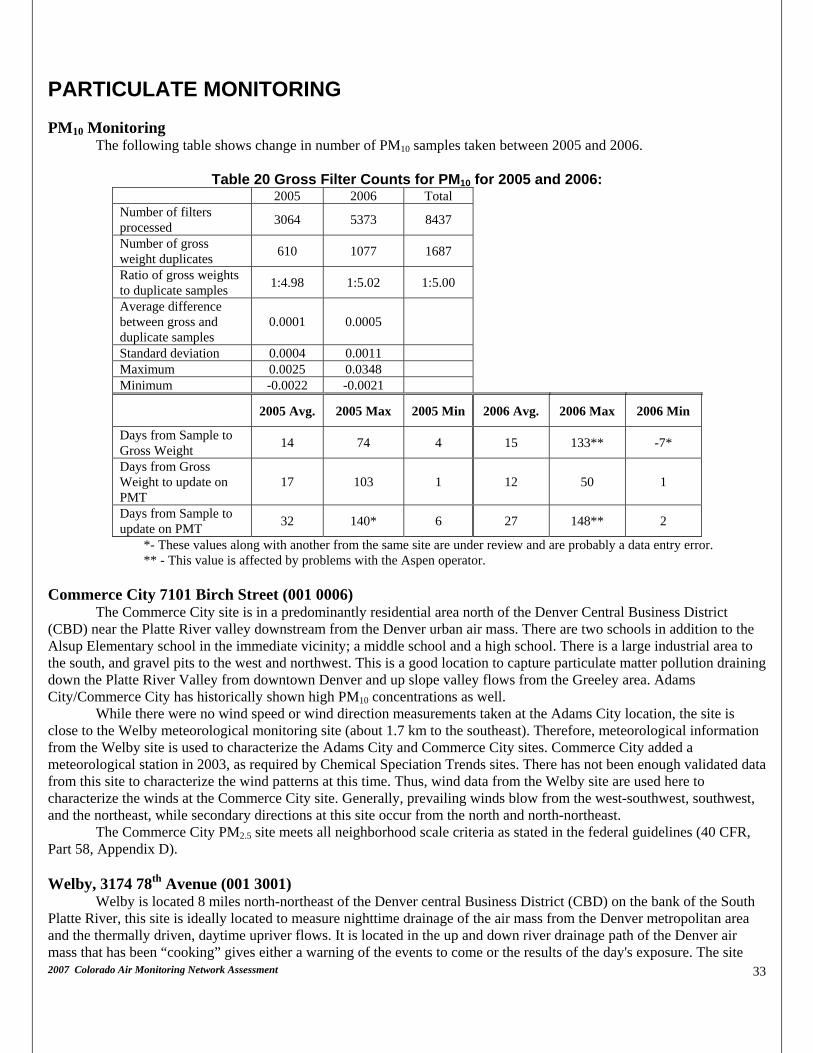
2007 Colorado Air Monitoring Network Assessment 33
PARTICULATE MONITORING PM10 Monitoring The following table shows change in number of PM10 samples taken between 2005 and 2006.
Table 20 Gross Filter Counts for PM10 for 2005 and 2006: 2005 2006 Total Number of filters processed 3064 5373 8437
Number of gross weight duplicates 610 1077 1687
Ratio of gross weights to duplicate samples 1:4.98 1:5.02 1:5.00
Average difference between gross and duplicate samples
0.0001 0.0005
Standard deviation 0.0004 0.0011 Maximum 0.0025 0.0348 Minimum -0.0022 -0.0021
2005 Avg. 2005 Max 2005 Min 2006 Avg. 2006 Max 2006 Min
Days from Sample to Gross Weight 14 74 4 15 133** -7*
Days from Gross Weight to update on PMT
17 103 1 12 50 1
Days from Sample to update on PMT 32 140* 6 27 148** 2
*- These values along with another from the same site are under review and are probably a data entry error. ** - This value is affected by problems with the Aspen operator.
Commerce City 7101 Birch Street (001 0006)
The Commerce City site is in a predominantly residential area north of the Denver Central Business District (CBD) near the Platte River valley downstream from the Denver urban air mass. There are two schools in addition to the Alsup Elementary school in the immediate vicinity; a middle school and a high school. There is a large industrial area to the south, and gravel pits to the west and northwest. This is a good location to capture particulate matter pollution draining down the Platte River Valley from downtown Denver and up slope valley flows from the Greeley area. Adams City/Commerce City has historically shown high PM10 concentrations as well.
While there were no wind speed or wind direction measurements taken at the Adams City location, the site is close to the Welby meteorological monitoring site (about 1.7 km to the southeast). Therefore, meteorological information from the Welby site is used to characterize the Adams City and Commerce City sites. Commerce City added a meteorological station in 2003, as required by Chemical Speciation Trends sites. There has not been enough validated data from this site to characterize the wind patterns at this time. Thus, wind data from the Welby site are used here to characterize the winds at the Commerce City site. Generally, prevailing winds blow from the west-southwest, southwest, and the northeast, while secondary directions at this site occur from the north and north-northeast.
The Commerce City PM2.5 site meets all neighborhood scale criteria as stated in the federal guidelines (40 CFR, Part 58, Appendix D).
Welby, 3174 78th Avenue (001 3001)
Welby is located 8 miles north-northeast of the Denver central Business District (CBD) on the bank of the South Platte River, this site is ideally located to measure nighttime drainage of the air mass from the Denver metropolitan area and the thermally driven, daytime upriver flows. It is located in the up and down river drainage path of the Denver air mass that has been “cooking” gives either a warning of the events to come or the results of the day's exposure. The site

2007 Colorado Air Monitoring Network Assessment 34
serves as a good drainage location but it may be a target for deletion or relocation farther down the South Platte River valley from Denver. Alamosa, 208 Edgemont Boluvard (003 0001)
This Alamosa site is located on the science building of Adams State College in a principally residential area. The only significant traffic is on US 160 through the center of town. The site is along this highway but far enough away to reduce impacts on the levels. Meteorological data are not available from the area. The city has a population of 8,488 (Julu 2005 population estimate). This is an increase of 6.6 percent from the 2000 census. The major particulate source is wind-blown dust. This site began operation in 1973 as a TSP monitor and was changed to a PM10 monitor in June 1990. Alamosa, 425 4th Street (003 0003) The Alamosa 425 4th Street was started in May 2002.The site was established closer to the center of the city to be more representative of the population exposure in the area. Pagosa Springs, 309 Lewis Street (007 0001)
Pagosa Springs has a population of 1,640 (July 2005 population estimate). This is an increase of 1.2 percent from the 2000 census.
The Pagosa Springs site was located on the roof of the Town Hall from April 24, 2000 through May 2001. When the Town Hall building was planned to be demolished, the PM10 monitor was relocated to the Pagosa Springs Middle School and the first sample was collected on June 7, 2001. The Pagosa Springs Middle School is located 275 meters (inlet to inlet) to the northeast. The samplers were located near the middle of the first story roof. They were moved closer to the edge of the roof in September 2003, to remain collocated with the PM10 samplers, which were moved to better capture street emissions. The old location on the Middle school roof may have prevented ambient PM10 from reaching the sampler due to the roof configuration.
The Pagosa Springs Middle School site is located next to Highway 160 near the center of town. Pagosa Springs is a small town spread over a large area. The San Juan River runs through the south side of town. The town sits in a small bowl like setting with hills all around. A small commercial strip area along Highway 160 and single-family homes surrounds this location. It is representative of residential neighborhood exposure. Pagosa Springs was a PM10 nonattainment area and a SIP was implemented for this area. PM10 concentrations were exceeded a few times in the late 1980’s. However, the PM10 pollution was cleaned up through the SIP control measures and the area has only exceeded the PM10 standard once since 1994 and that was a regional bowing dust event in March of 1999.
Winds for this area predominantly blow from the north, with secondary winds from the north-northwest and the south. The predominant wind directions closely follow the valley topography in this rugged terrain. McCabe Creek, which is very near the meteorological station that was on the Town Hall building, runs north south through this area. Longmont, 3rd Avenue and Kimbark Street (013 0003)
The town of Longmont is a growing, medium sized, Front Range community with a population of 81,678 (July 2005 estimated census). This is an increase of 14.9 percent from the 2000 census. Longmont is located between the Denver/Boulder Metro-area and Fort Collins. Longmont is both suburban and rural in nature. The town of Longmont, located in Boulder County, is a growing, medium sized, Front Range community. It is located approximately 30 miles north of Denver along the St. Vrain Creek and is about six miles east of the foothills. Longmont is partly a bedroom community for the Denver-Boulder area. The elevation is 4978 feet. The Front Range peaks rise to an elevation of 14,000 feet just to the west of Longmont. In general, the area experiences low relative humidity, light precipitation, and abundant sunshine5
Longmont’s predominant wind direction is from the north through the west due to winds draining from the St. Vrain Creek Canyon. The PM10 site is near the center of the city near both commercial and residential areas. This location provides the best available monitoring for population exposure to particulate matter. The distance and traffic estimate for the AADT controlling street easily falls into the neighborhood scale in accordance with federal guidelines found in 40 CFR, Part 58, Appendix D.

2007 Colorado Air Monitoring Network Assessment 35
Delta, 560 Dodge Street (029 0004) Delta has a population of 7,659 (July 2005 population estimate). This is an increase of 0.2 percent from the 200
census. Delta is a small agricultural community midway between Grand Junction and Montrose. There is only one major point source air pollution source of particulate matter in the vicinity, Louisiana Pacific's plywood manufacturing facility. The topography in and around Delta is relatively flat as it sits in the broad flat Uncompaghre River Valley. There are high mesas and mountains surrounding this high valley. So, Delta sits in a large bowl shaped basin that can effectively trap air pollution especially during persistent temperature inversions.
The location of the Delta County Health Department was chosen because it sits in a large basin with the potential for high PM10 due to agricultural burning, automobile traffic and the Louisiana Pacific plant. Delta also had an existing PM10 site and it had been determined to be representative of residential impacts of PM10. Denver CAMP, 2105 Broadway (031 0002)
The City and County of Denver is located approximately 30 miles east of the foothills of the Rocky Mountains. Denver sits in a basin and the terrain of the city is characterized as gently rolling hills with the Platte River running from southwest to northeast just west of the downtown area.
Meteorological data gathered at the CAMP monitoring station is inconclusive for evaluation of the location as a PM10 neighborhood scale site, The winds are strongly affected by the street canyon effect of the downtown buildings. Meteorological data shows that winds are predominately from the south, south-southwest, north, and north-northwest.4 However, due to the downtown location of this site, winds are shown to flow from almost all directions at similar frequencies. Modeling of the emissions, traffic volume and history show that the CAMP monitor is well situated to be a maximum concentration, micro scale site. However, this site represents a location typical of most of the downtown Denver area. This area has similar land uses, AADT, VMT (vehicle miles traveled), and PM10 sources. The Division has shown that the downtown Denver area and the fringe area surrounding the downtown area is homogeneous and indicates that the CAMP station is representative of a wider area than just its own micro scale area. Thus, the CAMP PM10 site is representative of a neighborhood scale area. The given distance and traffic estimate easily falls into the micro scale in accordance with federal guidelines found in the 40 CFR, Part 58, Appendix D. Denver Visitor Center, 225 W. Colfax Avenue (031 0017)
The Denver Visitor Center site is located near the corner of Colfax Avenue and Tremont Street. It began operation on December 28, 1992. In 1993, this site along with the Denver CAMP and Gates monitors recorded the first exceedances of the 24-hour PM10 standard in the Denver metropolitan area since 1987. The Visitor Center recorded a PM10 level of 161 µg/m3 on January 14, 1993. Since then the maximum value recorded at the site was 91 µg/m3 in 1995. In the past ten years the PM10 levels at the Denver Visitor site have been increasing. The Annual average has increased from 21.0 µg/m3 in 1997 to 26.9 µg/m3 in 2006. Denver Municipal Animal Shelter, 678 S. Jason Street (031 0025) The Denver Municipal Animal Shelter was established as a replacement for the Denver Gates particulate monitor that was located at 1050 S. Broadway about one half mile south-southeast and on the other side of the South Platte River and I-25 South. The DMAS location represents the core area of the South Platte drainage in Denver. It has a good mixture of light industrial, residential areas and is strongly affected by the mobile sources along I-25 as well as South Santa Fe Dr. The openness of the area also permits the meteorological data to be representative of the larger core Denver area. Finally the site is on City owned property and will presumably be available for long-term trend analysis. When fully developed the site will be established as the NCore site for the Denver Metropolitan area. Colorado Springs, 101 Costilla Street (041 0011)
Colorado Springs is characterized as a relatively hilly area. The terrain within a two- mile radius of the site is relatively smooth, but there are 600 ft. high hills located four miles to the west and Pike Peak is over 14,000 ft. (4267 m) high. The peak is located about 15 miles due west. All demographic data and climatological and meteorological summaries are the same as listed above for the Colorado Springs, Meadowland site. For this site, however, the Colorado Springs Airport meteorological station is located about 12 km southeast of the monitor. Wind flows in the RBD area are highly dominated by the topography. It is likely that down draft winds off the mountains to the west flush the air pollution

2007 Colorado Air Monitoring Network Assessment 36
Cañon City – City Hall, 128 Main Street (043 0003)
out of this area on a regular basis. The Costilla Street PM10 monitoring site is within the Colorado Springs CBD and the area is primarily commercial
and residential. However, there is a large power plant (Martin Drake Power plant) about one mile to the southwest. The RBD monitor is the second SLAMS location in the Colorado Springs Area and as such it is a valuable location for PM10 assessment. The distance and traffic estimate for Cimarron Street and Sawatch Street easily falls into the neighborhood scale in accordance with federal guidelines found in 40 CFR, Part 58, Appendix D.
Cañon City is located 39 miles west of Pueblo. It has a population of 15,760 (July 2005 population estimate). This is an increase of 2.1 percent from the 2000 census. Particulate monitoring began on January 2, 1969 with the operation of a TSP monitor located on the roof of the courthouse building at 7th Avenue and Macon Street.
The Cañon City PM10 site began operation in December 1987. On May 6, 1988, the Macon Street monitor recorded a PM10 concentration of 172 µg/m3. This is the only exceedance of either the 24-hour or annual NAAQS since PM10 monitoring was established at Cañon City. The current monitor began operation in October 2004. Garfield County Sites
Garfield County has been subject to a significant amount of natural gas exploration and extraction in recent years. As a result, public concern has been raised in regard to the potentially degraded air quality. This study does not focus on industry-related air quality itself, but rather, characterizes the air quality concerns throughout the county of all types (particulates, and volatiles). The overlying purpose of the study described within this proposal, is to evaluate the air quality characteristics within Garfield County.
This proposed program is a collaborative effort designed to meet the concerns of the Garfield County public, overlap with the Colorado Department of Public Health and the Environment (CDPHE) as well as local industry air quality sampling efforts. It does not replace existing agency or industry programs, but rather provides supplemental information characterizing the county air quality as a whole.
The following seven sites are involved with this study:
Parachute, 100 E. 2nd Street (045 0005) Parachute has a population of 1,360 (July 2005 population estimate). This is an increase of 1.6 percent from the
2000 census. The Parachute PM10 monitor has been in operation since may of 2000. The annual average has been trending upward but is still just over one half of the annual standard for PM10 of 50µg/m3.
Rifle – Henry Building, 144 3rd Street (045 0007) Rifle has a population of 8,118 (July 2005 population estimate). This is an increase of 4.6 percent from the 2000
census. The first Rifle site began operation in June 1985 and ended operation in May 1986. The next site began operation in December 1987 and continued until 2001. The levels at that site, with the exception of the March 31, 1999 high wind event were always less than one half of both the annual and the 24-hour standards. The current location on the Henry Building began operation in May of 2005 as a part of the Garfield County study. New Castle, 402 W. Main Street (045 0008) New Castle has a population of 3,148 (July 2005 population estimate). This is an increase of 6.7 percent from the 2000 census. The New Castle monitor began operation in May 2005 as a part of the Garfield County study. The site is located on the roof of the library. Silt – Bell Ranch, 512 Owens Dr. (045 0009) The Bell Ranch site is approximately 4 miles south of the town of Silt. This site and the other sites were established as a part of the study and the locations were chosen by Garfield County with citizen involvement. Silt – Daley Ranch, 884 County Road 327 (045 0010) The Daily Ranch is approximately 8.5 miles south of the town of Silt. This site and the other sites were established as a part of the study and the locations were chosen by Garfield County with citizen involvement.
2007 Colorado Air Monitoring Network Assessment 37
Mount Crested Butte has a population of 752 (July 2005 population estimate). This is an increase of 1.2 percent from the 2000 census.
Silt – Cox Ranch, 5933 County Road 233 (045 0011) The Cox Ranch is approximately 1 mile northwest of the town of Silt. This site and the other sites were established as a part of the study and the locations were chosen by Garfield County with citizen involvement.
Glenwood Springs, 109 8th Street (045 1001) Glenwood Springs has a population of 8,603 (July 2005 population estimate). This is an increase of 1.0 percent
from the 2000 census. The Glenwood Springs site began operation in October 1986. The site was terminated in 2001. However it resumed operation as a part of the Garfield study in May of 2005. There are no industrial sources of PM10 in the area but concern about the heavy traffic from I-70 and local wood burning prompted the State to install a monitor.
The site is located on the Fire Station south of the Colorado River Valley and I-70. The areas to the north, east and south are residential while the west is primarily commercial. This setting makes it representative of a large portion of the city's population exposure from wood burning and traffic emissions. Crested Butte, Colorado 135 & Whiterock (051 0004)
The Crested Butte PM10 site began operation in June 1985. Crested Butte is a high mountain ski town with a population of 1,572 (July 2005 population estimate). This is an increase of 1.9 percent from the 2000 census. The monitor is at the east end of town near the highway and in the CBD. Any wood burning from the residential area to the west directly affects this location. The physical setting of the town, near the end of a steep mountain valley, makes wood burning and wintertime inversions a major concern. The town is attempting to regulate the number of wood burning appliances, since this is a major source of wintertime PM10.Crested Butte has not recorded an exceedance of the NAAQS since it began monitoring. Mt. Crested Butte, 19 Emmons Rd. (051 0007)
Mount Crested Butte is located at an elevation of 8940 feet (2725 m) at the base of the Crested Butte Mountain Resort ski area. Mount Crested Butte is a unique location for high particulate matter concentrations because it is located on the side of a mountain (Crested Butte 12,162 ft. or 3707 m); not in a bowl, valley, or other topographic feature that would normally trap air pollutants. There is not a representative meteorological station in or near Mt. Crested Butte.
The location for the Mt. Crested Butte site was selected because it had an existing PM10 site that had several high PM10 concentrations including five exceedances of the 24-hour standard in 1997 and one in 1998. Mt. Crested Butte also exceeded the PM10 annual average standard in 1997. A CMB source apportionment from 10 PM10 filters identified crustal material as the mostly likely source (91 percent) of PM10. Carbon, which is most likely from residential woodsmoke, made up 8 percent of the statistically composite sample and secondary species made up the remaining 1 percent. The Mt Crested Butte site was also selected because it is an area representative of the residential impact of PM2.5. Durango – River City Hall, 1235 Camino Del Rio (067 0004)
Durango has a population of 15,878 (July 2005 population estimate). This is an increase of 1.6 percent from the 2000 census.
Durango is the second largest city on the western slope. The town is situated in the Animas River Valley in southwestern Colorado. Its elevation is approximately 6500 feet (1981 meters) above mean sea level. The Animas valley through Durango is steep and narrow. Even though little meteorological information is available for the area, the microclimate of Colorado mountain communities is characterized by cold air subsidence, or drainage flows during the evening and early morning hours and up valley flows during afternoon and early evening hours when solar heating is highest. Temperature inversions that trap air pollutants near the surface are common during night and early morning hours. Fort Collins, 251 Edison St (069 0009
The population of Fort Collins is 127,686 (July 2005 estimated census). This is an increase of 7.6 percent from the 2000 census Fort Collins does not have the population to require a particulate monitor under Federal regulation. However, it is one of the largest cities along the Front Range.

2007 Colorado Air Monitoring Network Assessment 38
Pueblo – Public Works, 211 S. D Street (101 0012)
Grand Junction – Powell, 650 South Avenue (077 0017)
Grand Junction is the largest city on the western slope, with a population of 49,422 (July 2005 population estimate). This is an increase of 2.3 percent from the 2000 census.
This site monitors both 24-hour and hourly PM10. In addition, the Powell location also monitors carbon monoxide, wind speed, wind direction, and temperature. Grand Junction – Pitkin, 645 ¼ Pitkin Avenue (077 0018)
This location monitors carbon monoxide, wind speed, wind direction, temperature and hourly PM10. It is located at the northern edge of a low usage parking lot near the Powell monitor. Aspen – Library, 120 Mill Street (097 0006)
Aspen is at the upper end of a steep mountain valley. The major difference is that Aspen does not have an interstate running through it. Aspen is classified as nonattainment for PM10. The valley is more restricted at the lower end and thus forms a tighter trap for pollutants in the valley. The population of Aspen is 6,399 (July 2005 population estimate). This is an increase of 8.2 percent from the 2000 census.1
There have been several particulate monitors in the Aspen area. Only three have not been short-term special studies. The first PM10 monitor began operation in June 1985. The next, the Sport Stalker, was chosen after an intense effort involving EPA, State, and local agency personnel. The need was to find an acceptable middle or micro scale location.
Lamar – Power Plant, 100 2nd Street (099 0001) Lamar is one of the largest cities on the Eastern Plains with a population of 8,605 (2005 population estimate).
This is an decrease of 3.0 percent from the 2000 census. Particulate monitoring in Lamar began in August 1975 with the installation of a TSP site at the Lamar power plant at 100 2nd Avenue. It operated as a TSP site until August of 1986. The first Lamar PM10 site began operation in June 1985 at the power plant. In August 1986, the monitoring site was moved to the Municipal Complex (099 0002).
On March 19, 1976, the Lamar power plant monitor recorded a TSP of 1033 µg/m3. This is the fourth highest particulate concentration ever reported in Colorado. Lamar has regularly recorded its highest TSP and PM10 levels in March. Between 1975 and 1986 the power plant monitor reported 25 concentrations greater than the 24-hour TSP NAAQS of 260 µg/m3, twelve of these occurred in March, no other month had more than three. Three of the seven exceedances of the 24-hour PM10 NAAQS have also occurred in March. The primary reason for this relationship is due to the combination of low humidity and high winds that are common during the month of March. Lamar is the only Colorado city east of Denver to be designated as a PM10 nonattainment area. In 1992, the Division reinstated the power plant location as well. This was done after a review showed that levels at the power plant were generally higher than those at the City Complex. As a part of the SIP for Lamar, a meteorological site was established in 1992 at the city complex location. Analysis of these data was included as a part of the SIP process. Lamar – Municipal Building, 104 Parmenter Street (099 0002) The Lamar Municipal site was established in January of 1996 as a more population oriented location than the Power Plant. The Power Plant site is located on the northern edge of town while the Municipal site is near the center of the town. Both sites have recorded exceedances of the 24-hour standard of 150 µg/m3 and both sites regularly record values above 100µg/m3 as a 24-hour average.
The population of Pueblo is 104,169 (July 2005 estimated census). This is an increase of 0.1 percent from the 2000 census.
Pueblo is the third largest city in the state, not counting communities that are part of Metropolitan Denver. Pueblo is principally characterized by rolling plains and moderate slopes with elevations ranging from 4,474 ft to 4,814 ft (1364 – 1467 m). The Rocky Mountain Front Range is about 25 miles (40 km) west and the sight of Pikes Peak is easily visible on a clear day.

2007 Colorado Air Monitoring Network Assessment 39
Steamboat Springs, 136 6th Street (107 0003)
Meteorologically, Pueblo can be described as having mild weather with an average of about 300 days of sunshine per year. Generally, wind blows up valley from the southeast during the day and down valley from the west at night. Pueblo experiences average wind speed ranges from 7 miles per hour in the fall and early winter to 11 miles per hour in the spring.
The site is located on the roof of the Public Works Building at 211 E. D St., in a relatively flat area found two blocks northeast of the Arkansas River. It is also located near Fountain Creek. The distance and traffic estimate for Main Street and surrounding streets easily falls into the neighborhood scale in accordance with federal guidelines found in 40 CFR, Part 58, Appendix D.
The population of Steamboat Springs is 10,846 (July 2005 estimated census). This is an increase of 1.0 percent from the 2000 census. Like other ski towns, Steamboat Springs has problems with wintertime inversions, high traffic density, wood smoke and street sand. These problems are exacerbated by temperature inversions that trap the pollution in the valleys.
The first site began operation in Steamboat Springs in June 1985 at 929 Lincoln Avenue. It was moved to the current location in October 1986. The 136 6th Street location not only provides a good indication of population exposure, since it is more centrally located, but it has better accessibility than the previous location. Telluride, 333 W. Colorado Avenue (117 0002)
The population of Telluride is 2,339 (July 2005 estimated census). This is an increase of 0.2 percent from the 2000 census
Telluride is a high mountain ski town in a narrow box end valley. The San Miguel River runs through the south end of town and the town is only about ½ mile wide from north to south. The topography of this mountain valley regime creates temperature inversions that can last for several days during the winter. Temperature inversions can trap air pollution close to the ground. Telluride sits in a valley that trends mainly east to west, which can trap air pollutants more effectively since the prevailing winds in this latitude are the westerly and the San Miguel River Valley is closed off on the east end. Breckenridge – 501 N. Park Ave. (119 0002)
Breckenridge is a community with a population of 3359 (July 2005 population estimate). This is an increase of 39.5 percent from the 2000 census. However, these numbers reflect only the permanent population, not the number of tourists that arrive for skiing. For example according to the Chamber of Commerce, there were an estimated 20,000 people in the town during the Christmas week of 1992. Temporary population increases along with the associated increases in traffic and wood burning caused sufficient concern that the city of Breckenridge requested that the Division establish PM10 monitoring in the area. The Breckenridge site began operation in April 1992. Greeley – Hospital, 1516 Hospital Road (123 0006)
The population of Greeley is 88249(July 2005 population estimate) . This is an increase of 14.7 percent from the 2000 census.
Winds in this area are primarily out of the northwest, with dominant wind speeds less than 3.1 m/s. Secondary winds are from the north, north-northwest, and east-southeast, with the most frequent wind speeds also being less than 3.1, m/s. The most recent available wind data for this station is for the period December 1986 to November 1987. Predominat residential growth patterns are to the west and north with large industrial growth expected to the west. There are two feedlots located about 11 miles east of the town. There was a closer feedlot on the east edge of town, but it was moved at the first of 1999, after the town of Greeley purchased the land in 1997.
The Greeley PM10 monitor is on the roof of a hospital office building at 1516 Hospital Road. Greeley Central High School is located immediately to the east of the monitoring site. Overall, this is in an area of mixed residential and commercial development that makes it a good population exposure, neighborhood scale monitor. The distance and traffic estimate for the most controlling street easily falls into the neighborhood scale in accordance with federal guidelines found in 40 CFR, Part 58.

2007 Colorado Air Monitoring Network Assessment 40
3)
Planned Changes in PM10 Monitoring for 2007
1) The Cox Ranch site will be removed in May 2007 when the owner sells the property. 2) The Lamar Power Plant monitor will be removed in 2007 or 2008 due to conversion of the plant to coal
burning. Establishing a replacement for the Lamar Power Plant site in 2007 or 2008.

2007 Colorado Air Monitoring Network Assessment 41
PM2.5 Monitoring Commerce City 7101 Birch Street (001 0006)
The Commerce City site is in a predominantly residential area north of the Denver Central Business District (CBD) near the Platte River valley downstream from the Denver urban air mass. There are two schools in addition to the Alsup Elementary school in the immediate vicinity, a middle school and a high school. There is a large industrial area to the south, and gravel pits to the west and northwest. This is a good location to capture particulate matter pollution draining down the Platte River Valley from downtown Denver and up slope valley flows from the Greeley area. Adams City/Commerce City has historically shown high PM10 concentrations as well. Arapahoe Community College, 6190 S. Santa Fe Blvd, (005 0005)
The ACC site is located in south suburban metropolitan Denver. It is located on the south side of the Arapahoe Community College in a distant parking lot. The site is near the bottom of the Platte River Valley along Santa Fe Drive (Hwy. 85) in the city of Littleton. It is also near the city of Englewood. There is a large residential area located to the east across the Light Rail tracks. The PM2.5 monitor is located on a mobile shelter in the rarely used South parking lot. Located at 6190 S. Santa Fe Drive, this small one story building is close to the Platte River and the monitor has excellent 3600 exposure. Based on the topography and meteorology of the area ACC is in an area where PM2.5 emissions may collect. This location may capture high concentrations during periods of upslope flow and temperature inversion in the valley. However, since it is further south in a more sparsely populated area than the Broadway-CAMP site, the concentrations may not be as high as other Denver locations.
Meteorological data for this area is obtained from the nearest APCD site located in nearby Englewood, about 6.1 km northeast of the ACC site. Winds are predominately out of the south-southwest and south, with secondary winds out of the north and north-northeast (upslope). Observed distances and traffic estimates easily fall into the neighborhood scale in accordance with federal guidelines found in the 40 CFR, Part 58, Appendix D. The site meets all other neighborhood scale criteria.
Longmont, 3rd Avenue and Kimbark Street (013 0003) The town of Longmont, located in Boulder County, is a growing, medium sized, Front Range community. It is
located approximately 30 miles north of Denver along the St. Vrain Creek and is about six miles east of the foothills. Longmont is partly a bedroom community for the Denver-Boulder area. The elevation is 4978 feet. The Front Range peaks rise to an elevation of 14,000 feet just to the west of Longmont. In general, the area experiences low relative humidity, light precipitation, and abundant sunshine
Longmont’s predominant wind direction is from the north through the west due to winds draining from the St. Vrain Creek Canyon. The PM2.5 site is near the center of the city near both commercial and residential areas. This location provides the best available monitoring for population exposure to particulate matter. The distance and traffic estimate for the AADT controlling street easily falls into the neighborhood scale in accordance with federal guidelines found in 40 CFR, Part 58, Appendix D. Boulder Chamber of Commerce, 2440 Pearl Street (013 0012)
The city of Boulder is located on the eastern edge of the Rocky Mountain foothills. Most of the city sits on rolling plains. The Boulder PM2.5 site is approximately 7,000 feet (2.13 km) east of the base of the Front Range foothills and about 27.4 feet (8.35 m) south of a small branch of Boulder Creek, the major creek that runs through Boulder.
The predominant wind direction is from the west with secondary maximum frequencies from the west-northwest and west-southwest. The distance and traffic estimate for Pearl Street and Folsom Street falls into the middle scale in accordance with federal guidelines found in 40 CFR, Part 58, Appendix D. However, the Division has determined that this middle scale site is representative of many similar middle scale sites in this area of Boulder due to similar site characteristics. Thus, the Boulder Chamber of Commerce PM2.5 site is representative of a neighborhood scale area. The site meets all other neighborhood scale criteria.

2007 Colorado Air Monitoring Network Assessment 42
Meteorological data gathered at the CAMP monitoring station is inconclusive for evaluation of the location as a PM2.5 neighborhood scale site, The winds are strongly affected by the street canyon effect of the downtown buildings. Meteorological data shows that winds are predominately from the south, south-southwest, north, and north-northwest.4 However, due to the downtown location of this site, winds are shown to flow from almost all directions at similar frequencies. Modeling of the emissions, traffic volume and history show that the CAMP monitor is well situated to be a maximum concentration, micro scale site. However, this site represents a location typical of most of the downtown Denver area. This area has similar land uses, AADT, VMT (vehicle miles traveled), and PM2.5 sources. The Division has shown that the downtown Denver area and the fringe area surrounding the downtown area is homogeneous and indicates that the CAMP station is representative of a wider area than just its own micro scale area. Thus, the CAMP PM2.5 site is representative of a neighborhood scale area. The given distance and traffic estimate easily falls into the micro scale in accordance with federal guidelines found in the 40 CFR, Part 58, Appendix D.
Elbert County, Wright-Inghram Institute (039 0001) The Elbert County site is believed to be a good location to measure urban background concentrations of PM2.5.
Winter winds at Elbert are from the southwest to southeast at 4-5 m/s during the morning hours. During the afternoon hours, brisk winds are generally from the south-southwest to the southeast. This shows that the winds moving across the monitoring site are not influenced by the Denver Metropolitan Area. A July 1981 analyses of surface streamline was done
Boulder CU-Athens, 2120 Athens Street (013 1001) The Boulder –CU site is located at the edge of a low usage parking lot to the north and the football practice field to the south. This location provides a good neighborhood representation for particulates. Denver CAMP, 2105 Broadway (031 0002)
The city and county of Denver is located approximately 30 miles east of the foothills of the Rocky Mountains. Denver sits in a basin and the terrain of the city is characterized as gently rolling hills with the Platte River running from southwest to northeast just west of the downtown area.
Denver NJH-E, 14th Avenue & Albion Street (031 0013) This site is located three miles east of the Denver CBD, close to one of the busiest intersections in Denver
(Colorado Boulevard and Colfax Avenue). The current site began operations in 1982. Two previous sites were located just west of the current location. The first operated for only a few months before it was moved to a new and “temporary” site in the corner of the laboratory building at the corner of Colorado Boulevard and Colfax Avenue. Denver – Swansea, 4650 Columbine St. (031 0023)
The Swansea Elementary school site was established as a part of the toxicological study associated with the ASARCO Study conducted by the Colorado Department of Public Health and Environment. Denver Municipal Animal Shelter, 678 S. Jason Street (031 0025) The Denver Municipal Animal Shelter was established as a replacement for the Denver Gates monitor that was located at 1050 S. Broadway about one half mile south-southeast and on the other side of the South Platte River and I-25 South. The DMAS location represents the core area of the South Platte drainage in Denver. It has a good mixture of light industrial, residential areas and is strongly affected by the mobile sources along I-25 as well as South Santa Fe Dr. The openness of the area also permits the meteorological data to be representative of the larger core Denver area. Finally the site is on City owned property and will presumably be available for long-term trend analysis. When fully developed the site will be established as the NCore site for the Denver Metropolitan area. Chatfield Reservoir, 11500 N. Roxborough Park Road (035 0004)
The Chatfield Reservoir location was established as the result of the 1993 Summer Ozone Study. The site is located on the south side of Chatfield Reservoir at the campground registration building. This location was selected over the Corps of Engineers Visitor Center across the reservoir because it was more removed from the influence of traffic along C-470. Located in the South Platte River drainage, this location is well suited for monitoring southwesterly PM2.5 particulates in the Denver metro area.

2007 Colorado Air Monitoring Network Assessment 43
to study summer wind patterns in this same area. The study shows that in the later morning hours (0800), winds predominately blow from the north and northeast, placing the Denver Metro-Area upwind of the site. Although, during the early morning hours, wind flows off the Cheyenne Ridge and Palmer Lake Divide into the river basins to the north and south, away from the Elbert County monitoring site. By early afternoon (1100) and continuing through later afternoon (1400), up slope flow occurs over nearly the entire region, bringing clean air from the east and northeast to the site. By the evening hours, winds again predominately flow from the mountain region, with these westerly winds again flowing off the Palmer Lake Divide, away from the monitoring site. This would suggest that the Elbert County site is a very clean location for winter months and for early morning, afternoon, and evening hours during the summer months.
The location of this Elbert County site classifies it as an urban background site, in accordance with federal guidelines found in 40 CFR, Part 58, Appendix D. The site meets all guidelines for the urban background site. Colorado Springs, 101 Costilla Street (041 0011)
Colorado Springs is characterized as a relatively hilly area. The terrain within a two- mile radius of the site is relatively smooth, but there are 600 ft. high hills located four miles to the west and Pike Peak is over 14,000 ft. (4267 m) high. The peak is located about 15 miles due west. All demographic data and climatological and meteorological summaries are the same as listed above for the Colorado Springs, Meadowland site. For this site, however, the Colorado Springs Airport meteorological station is located about 12 km southeast of the monitor. Wind flows in the RBD area are highly dominated by the topography. It is likely that down draft winds off the mountains to the west flush the air pollution out of this area on a regular basis.
The Costilla Street PM2.5 monitoring site is within the Colorado Springs CBD and the area is primarily commercial and residential. However, there is a large power plant (Martin Drake Power plant) about one mile to the southwest. The RBD monitor is the second SLAMS location in the Colorado Springs Area and as such it is a valuable location for PM2.5 assessment. The distance and traffic estimate for Cimarron Street and Sawatch Street easily falls into the neighborhood scale in accordance with federal guidelines found in 40 CFR, Part 58, Appendix D. Fort Collins, 251 Edison St (069 0009
The population of Fort Collins is 127,686 (July 2005 estimated census). This is an increase of 7.6 percent from the 2000 census. Fort Collins does not have the population to require a carbon monoxide monitor under Federal regulation. However, it is one of the largest cities along the Front Range. Grand Junction – Powell, 650 South Avenue (077 0017)
The Division operates the weather station at the Powell PM2.5 sites. Winds in Grand Junction are predominately out of the southeast, east-southeast, and south-southeast, with secondary winds mostly out of the northwest and east.
The PM2.5 site located at 650 South Avenue. The distance and traffic estimate for the site streets easily fall into the neighborhood scale in accordance with federal guidelines found in 40 CFR, Part 58, Appendix D. The site meets all other neighborhood scale criteria.
Pueblo – Public Works, 211 S. D Street (101 0012)
Not counting communities that are part of Metropolitan Denver, Pueblo is the third largest city in the state. Pueblo is principally characterized by rolling plains and moderate slopes with elevations ranging from 4,474 ft to 4,814 ft (1364 – 1467 m). The Rocky Mountain Front Range is about 25 miles (40 km) west and the sight of Pikes Peak is easily visible on a clear day.
Meteorologically, Pueblo can be described as having mild weather with an average of about 300 days of sunshine per year. Generally, wind blows up valley from the southeast during the day and down valley from the west at night. Pueblo experiences average wind speed ranges from 7 miles per hour in the fall and early winter to 11 miles per hour in the spring.
The site is located on the roof of the Public Works Building at 211 E. D St., in a relatively flat area found two blocks northeast of the Arkansas River. It is also located near Fountain Creek. The distance and traffic estimate for Main Street and surrounding streets easily falls into the neighborhood scale in accordance with federal guidelines found in 40 CFR, Part 58, Appendix D.

2007 Colorado Air Monitoring Network Assessment 44
Greeley – Hospital, 1516 Hospital Road (123 0006) The population of Greeley is 88,249 (July 2005 estimated census). This is an increase of 14.7 percent from the
2000 census. The current Greeley site has been in operation since 1982. Winds in this area are primarily out of the northwest; with dominant wind speeds less than 3.1 m/s. Secondary
winds are from the north, north-northwest, and east-southeast, with the most frequent wind speeds also being less than 3.1 m/s. The most recent available wind data for this station is for the period December 1986 to November 1987. Predominate residential growth patterns are to the west and north with large industrial growth expected to the west. There are two feedlots located about 11 miles east of the town. There was a closer feedlot on the east edge of town, but it was moved at the first of 1999, after the town of Greeley purchased the land in 1997.
The Greeley PM2.5 monitor is on the roof of a hospital office building at 1516 Hospital Road. Greeley Central High School is located immediately to the east of the monitoring site. Overall, this is in an area of mixed residential and commercial development that makes it a good population exposure, neighborhood scale monitor. The distance and traffic estimate for the most controlling street easily falls into the neighborhood scale in accordance with federal guidelines found in 40 CFR, Part 58, Appendix D. Platteville, 1004 Main Street (123 0008)
The population of Platteville is 2,616 (July 2005 estimated census). This is an increase of 1.6 percent from the 2000 census.
Platteville is located immediately west of Highway 85 along the Platte River valley bottom four miles east of I 25, at an elevation of 4825 feet. The area is characterized by relatively flat terrain and is located about one mile east of the South Platte. The National Oceanic and Atmospheric Administration operated the PROFS (Prototype Regional Observational Forecasting System) Mesonet network of meteorological monitors from the early 1980's through the mid 1990's in the northern Colorado Front Range area. Based on this data, the area around Platteville is one of the last places in the wintertime that the cold pool of air that is formed by temperature inversions burns off. This is due to solar heating. The upslope/downslope Platte River Valley drainage and wind flows between Denver and Greeley, make Platteville a good place to monitor PM2.5. These characteristics also make it an ideal location for chemical speciation sampling, which began at the end of 2001.
The Platteville site is located at 1004 Main Street at the South Valley Middle School, located on the south side of town on Main Street. The school is a one-story building and it has a roof hatch from a locked interior room providing easy access to its large flat roof. There is a 2-story gym attached to the building approximately 28 meters to the Northwest of the monitor. The location of the Platteville monitor easily falls into the regional transport scale in accordance with federal guidelines found in 40 CFR, Part 58, Appendix D.
Planned Changes in PM2.5 Monitoring for 2007
1) Addition of PM2.5 TEOM in 2007 for hourly reporting in Colorado Springs.

2007 Colorado Air Monitoring Network Assessment 45
High-Vol
Quality Assurance Accuracy Audits for Particulate Monitors The audit checks preformed on the particulate monitors consist of calibrated flow checks.
Table 21 Annual Number of Particulate Accuracy Audits for 2006
Site / Station Name PM2.5PEP
PM2.5 FRM/FEM
PM10 Low-Vol
PM10 TSP TEOM(2.5) TEOM(10)
Commerce City 4 4 1 16 4 4 Commerce City (collocated) 4 Welby 4 4 Globeville Clinicare 8
Chatfield Reservoir 4 4 Brighton 4 Alamosa - ASC 16 Alamosa - Municipal Bldg 16 Arapahoe Community College 4 Pagosa Springs. Middle School 4 16 Longmont 4 4 5 Boulder Chamber of Commerce 4 4 Boulder Marine Street 4 Delta 4 8 Denver - CAMP 4 4 4 4 4 4
Denver - CAMP (collocated) 4 4 Denver Municipal Animal Shelter (primary) 4 4
Denver Municipal Animal Shelter (collocated) 4
Denver - Swansea 4 Denver Visitor Center 15 Denver - NJH 4 Denver - LARS 8 Elbert 4 Colorado Springs - Meadowlands 4 8 Colorado Springs - RBD 4 4 4 Co. Springs - RBD (collocated) 4 Canon City 4 Parachute 7 Glenwood Springs 8 New Castle 8 Rifle 8 Silt-Bell 8 Silt - Cox 8 Silt - Daley 8 Crested Butte 8 Mt. Crested Butte 4 16 Gunnison 8 Leadville 4

2007 Colorado Air Monitoring Network Assessment 46
PEP PM
Site / Station Name PM2.5 2.5
FRM/FEM PM10
Low-Vol PM10
High-Vol TSP TEOM(2.5) TEOM(10)
Durango - Courthouse 8 Durango - Cutler 1 Durango River City Hall 8 Durango - Grandview 8 Ft. Collins - CSU 4 8 Grand Junction Powell 4 4 4 Grand Junction Powell (collocated) 4 4 Aspen Library 8 Lamar Power Plant 16 Lamar Municipal Bldg 16 Pueblo Public Works 4 8 Steamboat Springs 16 Telluride 4 8 Breckenridge 16 Cripple Creek 16 Greeley 4 4 8 4 Platteville 4
Total Particulate Audits 12 88 9 379 24 33 12
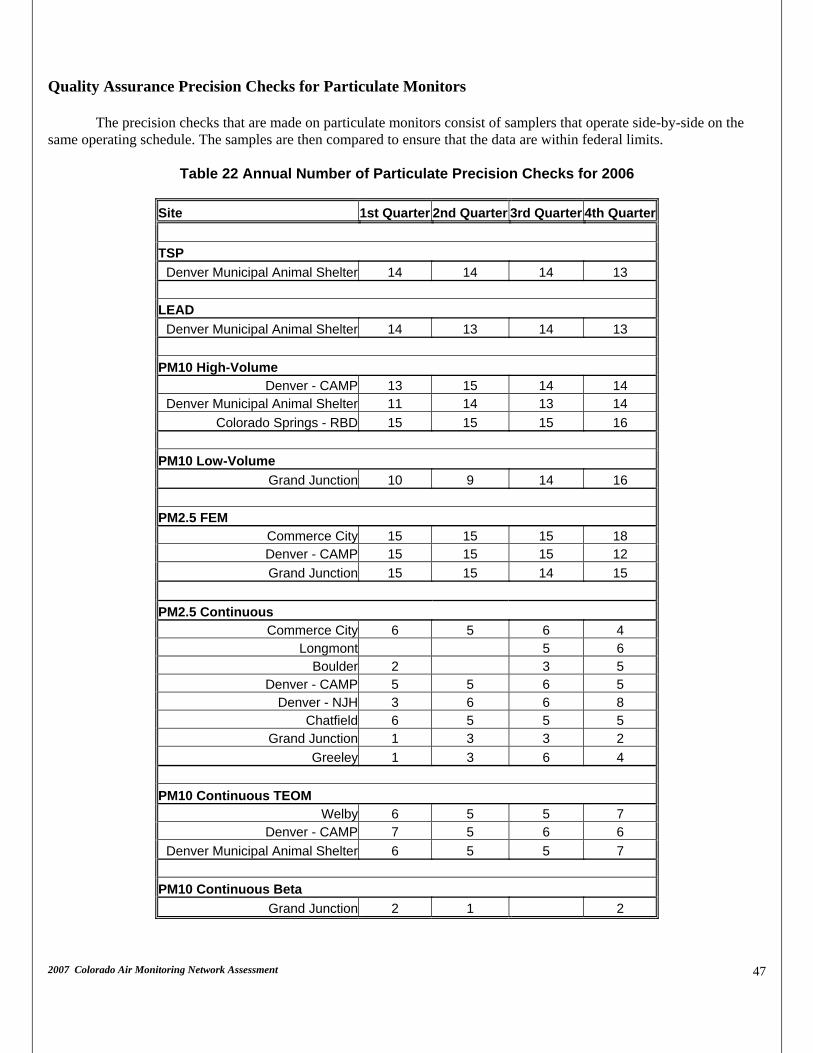
2007 Colorado Air Monitoring Network Assessment 47
Quality Assurance Precision Checks for Particulate Monitors The precision checks that are made on particulate monitors consist of samplers that operate side-by-side on the same operating schedule. The samples are then compared to ensure that the data are within federal limits.
Table 22 Annual Number of Particulate Precision Checks for 2006
Site 1st Quarter 2nd Quarter 3rd Quarter 4th Quarter TSP
Denver Municipal Animal Shelter 14 14 14 13 LEAD
Denver Municipal Animal Shelter 14 13 14 13 PM10 High-Volume
Denver - CAMP 13 15 14 14 Denver Municipal Animal Shelter 11 14 13 14
Colorado Springs - RBD 15 15 15 16
PM10 Low-Volume Grand Junction 10 9 14 16
PM2.5 FEM
Commerce City 15 15 15 18 Denver - CAMP 15 15 15 12 Grand Junction 15 15 14 15
PM2.5 Continuous
Commerce City 6 5 6 4 Longmont 5 6
Boulder 2 3 5 Denver - CAMP 5 5 6 5
Denver - NJH 3 6 6 8 Chatfield 6 5 5 5
Grand Junction 1 3 3 2 Greeley 1 3 6 4
PM10 Continuous TEOM
Welby 6 5 5 7 Denver - CAMP 7 5 6 6
Denver Municipal Animal Shelter 6 5 5 7 PM10 Continuous Beta
Grand Junction 2 1 2

2007 Colorado Air Monitoring Network Assessment 48
Total Suspended Particulates and Lead Monitoring In December 2006 Total Suspended Particulate (TSP) monitoring by the Air Pollution Control Division was reduced from six monitors to a single monitor at the Denver Municipal Animal Shelter. TSP is monitored only as a first step in ambient lead analysis. In the past ten years the maximum quarter statewide has generally been less than a tenth of the standard. In addition, Colorado has not recorded an exceedance of the lead standard since the first quarter of 1980. Denver Municipal Animal Shelter, 678 S. Jason Street (031 0025)
The Denver Municipal Animal Shelter was established as a replacement for the Denver Gates particulate monitor that was located at 1050 S. Broadway about one half mile south-southeast and on the other side of the South Platte River and I-25 South. The DMAS location represents the core area of the South Platte drainage in Denver. It has a good mixture of light industrial, residential areas and is strongly affected by the mobile sources along I-25 as well as South Santa Fe Dr. The openness of the area also permits the meteorological data to be representative of the larger core Denver area. Finally the site is on City owned property and will presumably be available for long-term trend analysis. When fully developed the site will be established as the NCore site for the Denver Metropolitan area. Planned Changes in TSP and Lead Monitoring for 2007 There are no planned changes to the TSP/Lead monitoring for 2007.