color values and spectra of the principal emitters in … · color values and spectra of the...
TRANSCRIPT

Page 710 Selected Pyrotechnic Publications of K. L. and B. J. Kosanke
An earlier version appeared in Journal of Pyrotechnics, No. 18, 2003.
Color Values and Spectra of the Principal Emitters in Colored Flames
W. Meyerriecks* and K. L. Kosanke† *702 Leisure Avenue, Tampa, FL 33613, USA
†PyroLabs, Inc., 1775 Blair Rd, Whitewater, CO 81527, USA
ABSTRACT
The emission spectra of many of the more im-portant emitters in pyrotechnic flames were col-lected. For this purpose solutions and suspensions of sodium, potassium, calcium, strontium, barium and copper salts were aspirated into a propane gas flame as the excitation source. Performing instrument corrections and using appropriate da-ta reduction strategies allowed the isolation of the individual spectra. Among these are the mono-chlorides and monohydroxides of strontium, cal-cium, barium and copper. The CIE color coordi-nates of the principal emitters were calculated from the isolated spectra. In addition, a table of normalized band and line intensities was pro-duced for each of the successfully isolated emit-ting species.
Keywords: flame spectra, flame color, color emit-ter, color coordinate, monochloride, monohydrox-ide, barium, calcium, copper, strontium
Introduction
The desire to produce improved flame color has been an enduring goal of pyrotechnists. How-ever, over the last century, much of the effort in that quest has not been guided by accurate spectral information. Two pioneers in quantifying this work were T. Shimizu[1] and B. E. Douda.[2–4] Most recently, with the introduction of relatively inexpensive computer-based spectrometers,[5] hard-data—rather than subjective impressions—are being more widely used to guide develop-ments. However, to date, the lack of relatively complete and reliable information on the spectra and CIE color coordinates of the individual col-ored flame emitters remains as an impediment.
Shimizu, in his textbook,[6] was probably the first to address the assignment of a series of the
principal colored flame emitters to their position in the chromaticity diagram. Nevertheless he made essentially no attempt to determine the composite chromaticity values (color coordinates) for emitters having more than one narrow spectral line such as sodium. Instead he made a series of somewhat expressionistic intensity assignments for the respective lines, such as for potassium, and assignment of the bands of the monochlorides and monohalides of the alkaline earth metals and cop-per.
Several reference texts are available with ta-bles of wavelengths and peak intensities for atom-ic and molecular visible-light emitters.[7–11] Unfor-tunately they are somewhat incomplete and even contradictory. The intended use of these tables seems to be primarily geared towards analytical chemistry—for identifying the probable emitting atom or molecule for a given line or band present in a spectrum. (An extensive table, compiled from some of these sources, and including the authors’ current work, has been appended to this paper.) Further, very few of the reference texts include actual spectra for the various emitters, and when they do, instrumentation effects have not been removed. What is generally presented are the “raw readings” directly from the instrument, which of-ten includes many different emitting species.
No reference text that the authors have seen has presented isolated spectra for the various indi-vidual colored flame emitters. Having such data would allow the investigator to more accurately determine the emitting species present in the spec-tra of test compositions, and thus be better able to rapidly advance one’s research goals. Also, hav-ing spectra, where instrumentation effects have been removed, allows for the computation of standard CIE chromaticity coordinates, which col-lectively quantify the gamut of all practical colors that may be obtained in fireworks and related py-

Selected Pyrotechnic Publications of K. L. and B. J. Kosanke Page 711
rotechnics. The authors conducted a series of spectroscopic experiments, isolated the spectra, and produced chromaticity coordinates for some of the most abundant emitters in common pyro-technic flames.
Visible Light Flame Spectrometer
The energy source used to produce the spectra was a gas burner of the type typically used in an atomic absorption spectrometer. This type burner was well suited to the needs of a flame spectrome-ter for this project. Its aspirator provided a ready mechanism to introduce solutions (and fine sus-pensions) into the flame. The burner produced a fairly narrow, but 4-inch (100-mm) long flame. This provided a long optical path for the spec-trometer, thereby increasing its efficiency. The burner and a specially fabricated gas handling sys-tem facilitated the use of various and mixed gas sources. At the heart of the system was an Ocean Optics[5] CHEM2000 spectrometer installed into a slot in a computer. The spectrometer was connect-ed to a chimney and ambient light shield using a large (400 micron) diameter optical fiber that ter-minated in an adjustable light-collecting lens. Figure 1 is an illustration of the overall flame spectrometer as configured for this project.
Computerwith OOI
SpectrometerCard
Liquid Waste Drain
Flame
Optical FiberLens
Chimney andLight Shield
CalibrationLight Source
AspiratedLiquid Line
Gas SupplyLines
Figure 1. An illustration of the flame spectrome-ter as configured for this project.
Figure 2 is a diagram of the gas handling sys-tem for the spectrometer burner. In producing the spectra for this project, propane was the only fuel gas used. The supply of air (or air plus oxygen) to the flame was adjusted while aspirating pure wa-ter [or a mixture of carbon tetrachloride (CCl4) and perchloroethylene (C2Cl4) for some of the measurements]. The relative proportion of oxidant supplied was only the amount sufficient to pro-duce clean blue flame tips with a small distinct
inner blue cone at the base of the flame. Figure 3 presents the spectrum of the flame and the classic C2 (Swan) and CN band groups with perchloro-ethylene being aspirated into the flame. In each case, it is estimated that the temperature of the flame was approximately 1900 °C. This flame temperature is a little less than that of typical non-metal fueled pyrotechnic flames.[6] However, that is not thought to significantly alter the character of the isolated spectra reported in this article.
Figure 2. The diagram of the gas handling system for the spectrometer burner.
Instrument Calibration
The spectrometer was calibrated for wave-length by refining slightly the instrument calibra-tion provided by the manufacturer. This was ac-complished by fitting a simple linear equation to the actual and measured wavelengths for 15 sharp and clearly defined atomic peaks of the elements strontium, calcium, barium, potassium, sodium, mercury, and neon. This set of peaks ranged from 404.66 to 769.90 nm, which adequately covered the visible light range. (See Figure 4.) The good-ness-of-fit parameter, r2 (where unity is a perfect fit) was greater than 0.9999. The standard error was approximately 0.3 nm, which is less than the spectrometer’s measured wavelength interval of approximately 0.4 nm. Note that the resolution of the spectrometer is 1.5 nm full width half maxi-mum (FWHM).[5]

Page 712 Selected Pyrotechnic Publications of K. L. and B. J. Kosanke
Figure 4. The wavelength calibration curve for the OOI spectrometer.
The optical path that a light ray follows into and through the spectrometer includes the colli-mating lens, optical fiber, a mirror, and a diffrac-tion grating before it is dispersed onto a linear CCD (charge-coupled device) sensor that converts the light into an instrument-measurable electronic signal. Each of these components attenuates the incoming light by differing degrees at different wavelengths. The CHEM2000 spectrometer’s dif-fraction grating exerts the greatest effect. It is de-signed with a blaze centered on approximately 555 nm[5]—the region of the spectrum where it is most efficient.
To calibrate for intensity, the spectrum of the supplied CHEM2000 tungsten-halogen bulb was taken, which is stated by the manufacturer to have a color temperature of 3100 K. A software appli-cation was developed to calculate the color tem-perature of tungsten at specified filament tempera-
tures using Planck’s Equation, and taking into account the temperature- and wavelength-dependent emissivity of tungsten. It was found that a filament temperature of 3035 K produced the closest match of chromaticity coordinates to those calculated for the stated color temperature of 3100 K. Both spectra—emissivity and meas-ured—were normalized to unity at 555 nm, corre-sponding roughly with the blaze of the spectrome-ter. The corrected spectrum was then divided by the measured spectrum to obtain the required in-strument intensity correction factors as a function of wavelength. Figure 5 presents the calibration curve that was required to remove the optical-path effects from the measured spectral data.
Figure 5. The intensity calibration curve for the OOI CHEM2000 spectrometer.
The CHEM2000 spectrometer is hardware programmable for sample integration time, rang-ing from as short as a few milliseconds to as long as two seconds per sample. The software acquisi-tion mode used in this project is referred to as “Scope Mode”—a real-time function that is simi-lar to watching an oscilloscope. The output of this mode is raw spectrometer data, with intensities ranging from 0 to 4095. The CCD and 12-bit ana-log-to-digital converter both introduce noise into the measurements. It was found that integration times of less than approximately 250 ms resulted in a very good signal-to-noise ratio. For example, the spectrum of the blank (distilled water with no test emitter species present), integrated for 100 ms, accounted for an average intensity read-ing of 18 parts in 4096, or less than one-half of one percent of the full instrument range. Figure 6 shows the spectrum of a distilled water blank, where the peak at 589 nm is from a trace amount
Figure 3. The spectrum of the blue flame with perchloroethylene aspirated into the flame.

Selected Pyrotechnic Publications of K. L. and B. J. Kosanke Page 713
of sodium impurity. The spike at 502 nm is a sin-gle channel wide, and there is a lack of any identi-fiable source. It was concluded that it is probably a slightly noisy CCD detector well. The control software allows for samples to be repeatedly taken and averaged together, to effect additional noise reduction. This feature was utilized whenever the experimental setup permitted its usage.
Figure 6. Spectrum produced using a blank sam-ple (i.e., distilled water). (Intensity is in “scope units”.)
Sample Preparation
The solutions for the production of the atomic spectra of sodium and potassium, and the molecu-lar spectra of the monohydroxides of strontium, calcium, barium and copper were all prepared in the same way. These simply consisted of a set of fairly dilute aqueous solutions that were made using analytic reagent grade chemicals. The pri-mary criteria used in selecting the chemicals were their availability in the chemical stocks of the la-boratory and for their ability to produce the mon-ohydroxide spectra, while avoiding halides or oth-er species that might produce interferences. The nature of the aqueous solutions and their concen-trations are reported in Table 1. These solutions were then aspirated into the propane-air flame of the spectrometer to produce the raw spectral data.
Table 1. Nature and Concentrations for Aque-ous Solutions.
Chemical Name Concentration (M)
Sodium hydroxide 0.10 Potassium nitrate 0.10 Strontium nitrate 0.20 Calcium nitrate 0.20 Barium hydroxide 0.10 Copper(II) nitrate 0.20
Samples for the production of the raw spectra for the monochlorides of strontium, calcium, bari-um and copper as the principal emitters were all made as suspensions. In each case, the appropriate metal chloride was thoroughly dried at 120 °C. While the sample was still hot, it was thoroughly crushed with a preheated mortar and pestle and transferred to a sealed flask for ball milling. The milling was accomplished using steel shot approx-imately 0.1 inch (2.5 mm) in diameter and using a sufficient amount of carbon tetrachloride (CCl4) to cover the steel shot. The milling proceeded for 6 to 12 hours during which time the particle size was reduced to an average of approximately 1 micron (as determined using a scanning electron microscope). A magnet was used to remove any trace amount of iron that was worn from the steel shot during milling. To allow for successful aspi-ration of the suspensions into the spectrometer flame, they were diluted using perchloroethylene (C2Cl4) with a slight addition of the surfactant Neodol 23–5 (an alcohol ethoxylate, C22H46O6). Further, during the time the suspensions were be-ing aspirated into the flame, they were mechani-cally stirred. To produce a reasonably clean burn-ing flame in the presence of the vaporized carbon tetrachloride and perchloroethylene, and to main-tain a flame temperature estimated to be approxi-mately 1900 °C, the propane-air supply was aug-mented by supplying additional oxygen.
Data Reduction
After all of the spectra were taken and saved to the computer, they were initially processed to re-move instrumentation effects. The method used was the same for all of the gathered spectra, and proceeded in the following order:
• The slight wavelength correction was ap-plied.

Page 714 Selected Pyrotechnic Publications of K. L. and B. J. Kosanke
• The spectrum was visually inspected:
– For spectra where there were extensive regions that had no apparent features—flat and near-zero intensity (instrumenta-tion noise only), such as that for potassi-um and sodium—an average value was taken of the background regions. This av-erage value was then subtracted from the spectrum.
– For spectra where most of the visible range included features of interest, the removal of the background was more complicated. The intensity values were divided by the integration time of the par-ticular sample, thus converting the inten-sity from “scope units” into “scope-second units”. A blank with a similar in-tegration time was processed in the same manner, and the resulting spectrum was then subtracted from the spectrum being processed.
• The spectrum was rescaled using the instru-ment intensity correction factor.
• Any negative intensity values were set to ze-ro.
Having removed instrumentation effects, peak identification and isolation was then performed. While the method varied as to the emitter, it was essentially a peak-by-peak subtraction of the indi-vidual species emissions from the composite spec-trum, until only the sought-for emitter spectrum remained.
The various reference texts with tabulated wavelengths and emitting species materially helped in the identification of the individual peaks from the various emitting species, as did the few spectrographs found in some of the reference texts. Alkemade and Herrmann’s work[12] proved valuable in identifying features in the spectra for calcium, barium, and the Swan series of the flame’s blue cone. Another text,[13] edited by Mavrodineanu, proved very valuable for identify-ing copper and copper chloride spectra. Mavrodineanu and Boiteux’s work[14] was useful for calcium, strontium, and barium. The work of Li et al.[15] helped in isolating gaseous barium ox-ide.
For complex spectra with numerous overlap-ping peaks of different emitters, the PeakFit soft-ware application[16] was utilized for peak isolation. Asymmetric peaks were placed at the correct
wavelengths that correspond to the tabulated loca-tions of the respective lines and bands for each probable emitter identified in the spectra. The in-dividual peaks were interactively and iteratively adjusted for amplitude and asymmetry until the original spectrum was very closely approximated. In a few cases, an individual peak required a mi-nor shift in wavelength from the tabulated value—on the order of 0.5 to 1.5 nm—to afford the best possible fit. The resulting sets of individual peaks were exported from the peak fitting application to a spreadsheet. The spreadsheet was used to isolate the approximated individual emitters.
Figure 7 illustrates this process: a small region of the measured spectrum of aqueous barium hy-droxide is shown. Portions of four fitted peaks [three BaO peaks (centered at 481, 485, and 497 nm) and BaOH centered at 488 nm] and a linear baseline are shown. Figure 8 presents the same portion of the spectrum, where the original spectrum has been plotted along with the fitted spectrum (offset by 100 intensity units for clarity). The close approximation of the peak fitting to the original spectrum is evident. Centered about the zero-point of the intensity axis is the residual spectrum, which has been scaled-up by a factor of five to improve its visibility in the graph.
Figure 7. An example of the peak fitting method used to isolate the various contributions to a small portion of the raw barium monohydroxide spec-trum.

Selected Pyrotechnic Publications of K. L. and B. J. Kosanke Page 715
Figure 8. The result of peak isolation for the same spectral region shown in Figure 7. (Note that the fitted spectrum has been slightly offset from the raw spectrum, and the residual spectrum has been multiplied by 5.)
After the individual emitter spectra were iso-lated, a final “cleanup” was made to remove very minor amounts of unwanted, residual noise from the featureless regions of the graphs. This was followed by the calculation of 1931 CIE xyz chromaticity coordinates using the standard 2-degree, nanometer-increment, color matching functions.[17]
Each of the following spectra has been normal-ized such that the most intense peak equals 100 intensity units. Thus reported peak intensities can be compared within the same spectrum, but not between different spectra (emitter species).
The composite spectra and those of the various isolated components are presented and discussed below. (Table 2 later in this paper presents the normalized band and line intensities for the vari-ous emitting species.) Most of the spectra use a wavelength range of 380–730 nm, which repre-sents the visible light range for most people. There are a few spectra that use the range 380–780 nm to allow inclusion of features in the near infrared. In the discussion of spectral features in the remainder of this text, wavelengths have been rounded to the nearest nanometer.
Sodium
The raw spectrum of the sodium hydroxide so-lution (NaOH in H2O) had no measurable impuri-ties. It is not shown, because it appeared funda-mentally the same as the isolated spectrum of atomic sodium (Na), shown in Figure 9.
Figure 9. Spectrum of the isolated atomic sodium doublet peak.
Potassium
The spectrum of the potassium nitrate solution (KNO3 in H2O) included a small amount of sodi-um as an impurity, as is evidenced by the small peak at 589 nm in Figure 10a. (To make it easier to see, the region of the sodium impurity peak was multiplied by a factor of 10.) Also shown in this figure is the very small potassium peak at 404 nm, which has an intensity of 0.058. (To make it pos-sible to see, the region of this peak has been mul-tiplied by a factor of 100.) The sodium peak was removed to produce the pure atomic potassium (K) spectrum in Figure 10b. The peak at 767 nm is about 1700 times more intense than the one at 404 nm. This combination of peaks has a subtle but important effect on the perceived color of po-tassium flames, as described later. Note that these two graphs use a range of 380–780 nm.

Page 716 Selected Pyrotechnic Publications of K. L. and B. J. Kosanke
Strontium
The spectrum for the strontium nitrate solution (Sr(NO3) in H2O) is presented in Figure 11a. (Note: the region of the atomic strontium peak was multiplied by a factor of 5 to make it easier to see.) After subtracting the minor sodium peak, isolating the individual spectra was straightfor-ward since very few of the observed peaks of atomic strontium (Sr), strontium oxide (SrO), and strontium monohydroxide (SrOH) overlap. The isolated atomic strontium (Sr) peak is shown in Figure 11b. The two main strontium oxide peaks at 595 and 597 nm are barely visible, and the weaker ones—reported to be less than 1/20 the amplitude of the two main peaks—are lost in the intense strontium monohydroxide peaks. For this reason, the graph for strontium oxide (Figure 11c) is necessarily incomplete, but it does provide a useful reference for the two most prominent peaks. The isolated strontium monohydroxide spectrum is presented in Figure 11d.
Figure 11 [below]. a) The spectrum of strontium nitrate dissolved in water. b) The isolated spec-trum of atomic strontium. c) The spectrum of the two strontium oxide peaks that could be cleanly isolated. d) The isolated spectrum of strontium monohydroxide.
Figure 10. a) The spectrum of potassium nitrate dissolved in water. b) The isolated spectrum of atomic potassium.

Selected Pyrotechnic Publications of K. L. and B. J. Kosanke Page 717
The spectrum for the strontium chloride sus-pension (SrCl2 in CCl4) is presented in Figure 12a. Subtracted from this spectrum were rescaled atomic strontium, strontium oxide and strontium monohydroxide spectra, resulting in an isolated strontium monochloride (SrCl) spectrum as seen in Figure 12b. It is interesting to note that none of the references in the Table in the appendix men-tion the two low-intensity peaks centered at about 687 and 700 nm. The character of the peaks—their spacing and width—suggest that they are a continuation of the strontium monochloride spec-trum and are included as such.
Figure 12. a) The spectrum of strontium chloride suspended in carbon tetrachloride. b) The isolated spectrum of strontium monochloride.
Calcium
The spectrum for the calcium nitrate solution (Ca(NO3)2 in H2O) is presented in Figure 13a. The range for this figure extends from 380 to 780 nm so that the intense atomic potassium peaks, pre-sent as an impurity, may be clearly seen. After subtracting the potassium and sodium peaks, the isolation of the atomic calcium (Ca) peak (see Figure 13b) and the calcium monohydroxide
(CaOH) peaks (see Figure 13c), were readily made. Unfortunately, calcium oxide (CaO) was not detected, and it cannot be reported in this work.
Figure 13. a) The spectrum of calcium nitrate dissolved in water. b) The isolated spectrum of atomic calcium. c) The isolated spectrum of calci-um monohydroxide.
The spectrum for the calcium chloride suspen-sion (CaCl2 in C2Cl4) is presented in Figure 14a. Calcium monohydroxide was rescaled and sub-tracted from this spectrum, resulting in the isola-tion of the calcium monochloride (CaCl) spectrum as seen in Figure 14b.

Page 718 Selected Pyrotechnic Publications of K. L. and B. J. Kosanke
Figure 14. a) The spectrum of calcium chloride suspended in perchloroethylene. b) The isolated spectrum of calcium monochloride.
Barium
The spectrum for the barium hydroxide solu-tion (Ba(OH)2 in H2O) is presented in Figure 15a. The range for this figure extends from 380 to 780 nm so that the prominent feature centered about 750 nm can be seen. Underlying this com-plex spectrum is a continuum that is produced by condensed-phase barium oxide (BaO).[6] The pro-file of this continuum (see Figure 15b) was ap-proximated by fitting a curve to the local minima present in the raw spectrum. This continuum was then subtracted from the original spectrum, yield-ing an intermediate spectrum that represented the gas-phase emitters. Asymmetric peaks were then placed at the wavelengths corresponding to the tabulated locations for atomic barium (Ba), bari-um oxide (BaO), and barium monohydroxide (BaOH). The approximated barium monohydrox-ide peaks were thus isolated and are presented in Figure 15c. Likewise, the peak for atomic bari-um (Ba) was also isolated and appears in Fig-ure 15d. Finally, the barium monohydroxide and atomic barium peaks were then subtracted from
the intermediate spectrum, leaving gaseous bari-um oxide (see Figure 15e).
Figure 15. a) The spectrum of barium hydroxide dissolved in water. b) The spectrum of the con-densed phase of barium oxide. c) The isolated spectrum of barium monohydroxide. [Continued on next page]

Selected Pyrotechnic Publications of K. L. and B. J. Kosanke Page 719
Figure 15. [Continued] d) The isolated spectrum of atomic barium. e) The spectrum of vaporized barium oxide.
The spectrum for the barium chloride suspen-sion (BaCl2 in C2Cl4) is presented in Figure 16a. The range for this figure extends from 380 to 780 nm so that the peaks for atomic potassium impurities may be seen, as well as the low-intensity barium oxide continuum. Rescaled atom-ic sodium, potassium and barium, as well as bari-um oxide and barium monohydroxide spectra were subtracted, leaving an isolated barium mon-ochloride (BaCl) spectrum, as seen in Figure 16b.
Copper
An attempt was made to acquire copper spectra by using copper nitrate dissolved in water, but the intensity of the peaks was so weak that it required an integration time of 2000 ms. This lead to ex-cessive noise in the spectrum, making it impracti-cal to resolve the individual and complex peaks for atomic copper (Cu), copper hydride (CuH), copper oxide (CuO), and copper monohydroxide (CuOH).
Copper(II) chloride in an aqueous solution (CuCl2 in H2O) was then tried, and this resulted in
a reasonably intense and useful spectrum, as seen in Figure 17. Note that this figure is scaled from 380 to 780 nm, clearly showing the atomic potas-sium peaks, and also the atomic sodium peak at 589 nm that was so intense it was clipped by the spectrometer at the integration time used. This spectrum also includes low-intensity copper mon-ochloride (CuCl) peaks, which further complicat-ed peak identification and isolation. For this rea-son, a copper chloride suspension in perchloro-ethylene (discussed later) was processed first so that an isolated copper monochloride spectrum could be obtained, which was then rescaled and subtracted from the aqueous spectrum. This left an intermediate spectrum including peaks for atomic copper, copper oxide, copper monohydroxide, copper hydride, and impurities.
Figure 16. a) The spectrum of barium chloride suspended in perchloroethylene. b) The isolated spectrum of barium monochloride.

Page 720 Selected Pyrotechnic Publications of K. L. and B. J. Kosanke
Figure 17. The spectrum of copper(II) chloride dissolved in water.
The copper monohydroxide peaks, located from approximately 490 to 540 nm, are the most prominent features seen in this figure. Copper hy-dride predominates towards the blue end of the spectrum, even riding up onto the shoulder of the first copper monohydroxide peak. Towards the red end of the spectrum copper oxide predomi-nates, riding on the shoulder of the last copper monohydroxide peak. In a manner similar to that described above for barium hydroxide in water, the peaks for atomic sodium and potassium, cop-per hydride, copper monohydroxide, and copper oxide were manually placed and shaped using software, and then exported to a spreadsheet.
Interestingly, atomic copper peaks could not be positively identified despite there being a reported 18 peaks in the wavelength range from 380 to 750 nm. It is assumed that conditions were unfa-vorable for their formation in significant concen-trations in the flame.
The atomic sodium and potassium peaks were subtracted from the intermediate spectrum. The individual copper monohydroxide peaks were summed, and this sum subtracted too, thereby eliminating the effect of the pronounced impact of the copper monohydroxide shoulders on copper hydride and copper oxide. The individual peaks for copper hydride and copper oxide were then isolated and cleaned up. Copper hydride and cop-per oxide are reported to overlap at 445, 446, and 464 nm, but none of these features could be posi-tively discerned. Likewise, the reported (and low intensity) peaks of copper oxide at 583–584 nm could not be positively identified. Copper hydride and copper oxide spectra are presented in Fig-ures 18a and b. The resulting clean copper hydride
and copper oxide spectra were then subtracted from the intermediate spectrum, leaving the cop-per monohydroxide spectrum, which was then cleaned up and is presented in Figure 18c.
Figure 18. a) The isolated copper hydride spec-trum. b) The isolated copper oxide spectrum. c) The isolated copper monohydroxide spectrum.
The spectrum for the copper chloride suspen-sion (CuCl2 in C2Cl4) is presented in Figure 19a. Virtually all of the features are associated with copper monochloride, which made isolation of the spectrum straightforward. This was rather fortu-nate in that it made the isolation of the other cop-per emitters present in an aqueous-based solution (discussed earlier) much easier. The isolated spec-trum for copper monochloride is illustrated in Figure 19b.

Selected Pyrotechnic Publications of K. L. and B. J. Kosanke Page 721
Figure 19. a) The spectrum of copper(II) chloride in perchloroethylene. b) The isolated spectrum of copper monochloride.
Results
The normalized (to 100 for the most intense peak) line and band intensities for the collection of principal colored flame emitters are presented in Table 2. (A presentation of some of the intensi-ty data collected by others is included as a data table in the Appendix.) Table 3 presents the chromaticity coordinates for the principal emitters investigated in this study.
Table 2. Normalized Line and Band Intensities for the Principal Color Flame Emitters.
W. L.(a) R. I.(b) W. L.(a) R. I.(b)
SrCl BaOH 624 11 488 72 636 55 502 30 648 21 513 100 661 90 524 86 674 100 745 47
687 11 CuCl 700 1 412 6
SrOH 415 12 606 59 419 12 620 2 421 22 626 2 426 27 649 13 428 35 659 33 431 61 671 70 435 41 682 100 436 100 707 9 443 46 722 1 446 82
CaCl 449 31 581 3 452 35 593 45 460 16 605 11 465 9 608 14 469 7 619 99 476 5 621 100 479 7 633 9 482 11 635 8 485 13
CaOH 489 21 555 45 496 12 572 1 498 17 594 7 509 6 600 11 512 6 604 14 515 3 625 100 526 4 645 10 538 5 665 1 552 4
BaCl CuOH 507 8 505 46 514 100 512 44 517 21 524 75 521 14 533 84 524 99 546 100 532 34 605 10
a) W.L. = wavelength.
b) R.I. = relative intensity.

Page 722 Selected Pyrotechnic Publications of K. L. and B. J. Kosanke
A normalized graph of the luminous sensitivity of the human visual system[17] is presented in Fig-ure 20. The wavelength range corresponding to 1% or more of the maximum and extends from approximately 410 to 650 nm, with sensitivity approaching zero beyond this range. The intense potassium peaks at 767 nm (See Figure 10) are at what may be considered the edge of human visual perception and very near the infrared. However, due to its substantial intensity, the peaks at 767 nm produce a measurable shift in the per-ceived color of any flame that has potassium pre-sent in significant amounts. Chromaticity coordi-nates for the atomic potassium peaks at both 404 and 767 nm, for just the atomic potassium peak at 404 nm, and for just the pair of atomic potassium peaks at 767 nm have been included in Table 3 to demonstrate this effect. The influence of the near-infrared but intense 767 nm peaks is evident.
Figure 20. The luminous sensitivity of the human visual system, normalized to 1 at 555 nm.
The solutions produced for this work used rea-gent grade chemicals; even then the potassium peaks at 767 nm and the ubiquitous atomic sodi-um peak at 589 nm were very often intense. One may conclude that commercial grades of chemi-cals used in pyrotechnic applications will likely
Table 3. Chromaticity Color Coordinates for the Color Emitters Characterized in this Study.
CIE 1931 Color Coordinates Emitter x y z
K (with both 404 & 767 nm peaks) 0.676 0.238 0.087 K (404 nm peak only) 0.173 0.005 0.822 K (767 nm peak only) 0.735 0.265 0.000 Na 0.576 0.423 0.001 Ba 0.344 0.653 0.003 BaO (Condensed) 0.380 0.520 0.101 BaO (Gas) 0.406 0.507 0.087 BaOH (approximated) 0.066 0.606 0.328 BaCl 0.094 0.811 0.094 Ca 0.171 0.006 0.824 CaO NA NA NA CaOH 0.630 0.369 0.001 CaCl 0.661 0.338 0.000 Sr 0.141 0.033 0.826 SrO (Incomplete) 0.593 0.406 0.001 SrOH 0.679 0.321 0.000 SrCl 0.720 0.280 0.000 Cu NA NA NA CuH 0.167 0.009 0.824 CuO 0.315 0.187 0.499 CuOH 0.290 0.666 0.044 CuCl 0.156 0.073 0.771 Blue Flame (with perchloroeth-ylene)
0.218 0.395 0.387

Selected Pyrotechnic Publications of K. L. and B. J. Kosanke Page 723
have greater concentrations of impurities such as these, with correspondingly greater interferences and perceived color shifts.
As an aid in interpreting the color point data in Table 3, Figure 21 has been included. This is a black and white rendition of the CIE 1931 2° Chromaticity Diagram. The color points deter-mined in this work are plotted in Figure 22 on simplified versions of the chromaticity diagram of Figure 21. There are two chromaticity diagrams: the first (Figure 22a) displays the location of the color points for the principal colored flame emit-ters, and the second (Figure 22b) displays the lo-cation of the other color emitters studied.
In Figure 22b, some clarification is needed re-garding the identification of some of the color points. The color point for potassium (K) is that
including both the 404 and 767 peaks. Only a por-tion of the strontium oxide spectrum could be iso-lated from the more intense emitters and thus has not been included in Figure 22b. There are two color points for barium oxide, one corresponding to its emissions when vaporized, designated with the subscript (g), and one for its emissions when condensed, designated with the subscript (cond.).
Figure 21. 1931 2° chromaticity diagram.

Page 724 Selected Pyrotechnic Publications of K. L. and B. J. Kosanke
Conclusions
With more complete and more detailed infor-mation regarding the spectral nature of the emit-ting species in pyrotechnic flames, work to im-prove flame color should be facilitated. For the most part, this project has been successful in pro-ducing that data (with another project anticipated to carry the work further). Upon considering the spectral data for the principal colored flame emit-ters, it does not appear that progress toward im-proved flame color will be easy.
Figure 23 summarizes the state of the art with respect to colored flame production, as well as identifying the probable limits of future improve-ments. The range of colors within the smallest of the quadrangles (shaded) represents the approxi-mate limits of common high quality color formu-lations.[18,19] This covers a relatively small portion of the chromaticity diagram, and much of that consists of what would normally be described as shades of white. It is perhaps fortunate, that ob-servers of fireworks displays do not have light sources producing bright and highly pure color available to them to compare with the colors of the fireworks, many of which would pale by com-parison. The small size and central location of this color quadrangle for typical compositions proba-bly also goes a long way toward explaining why photographs and video records of displays seem to reproduce the colors of the displays so poorly,
unless the recorded colors are artificially en-hanced.
Figure 23. The state of the art for colored flame production. The smallest shaded quadrangle rep-resents the limits of common high quality formula-tions. The mid-size un-shaded quadrangle demon-strates the very best color formulations reported to date. The largest shaded quadrangle is for the pure color species reported in this paper.
The next larger quadrangle (not shaded) demonstrates the approximate limits of the best color formulations reported to date.[18,20] These colors are quite impressive when viewed and are
Figure 22a) chromaticity diagram showing the location of the color points for the principal col-ored flame emitters.
Figure 22b) chromaticity diagram showing the location of the other colored flame emitters studied.

Selected Pyrotechnic Publications of K. L. and B. J. Kosanke Page 725
readily discernable as significantly better than even the best of the commonly produced colors. (Unfortunately, there are some limitations associ-ated with the use of these formulations in terms of cost, non-color related performance, and conven-ience of manufacture.) Using any of the color mixing schemes to produce blended colors,[21–23] and even assuming the color formulations are per-fectly compatible, one is constrained to produce colors no better than those inside this quadrangle.
Finally there is the outer quadrangle (shaded) formed by the color points of the most desirable color species (the monochlorides of strontium, barium and copper, plus atomic sodium). Unless other, even better color species can be found (and researchers have looked without significant suc-cess[2,24–27]), this is the ultimate limit of what is possible. In fact, given that flames generally con-sist of very many chemical species, of which many emit in the visible region, even reaching these limits will probably be impossible to achieve.
Acknowledgments
The authors gratefully acknowledge the work of all those who have added to the understanding of the chemistry of colored flame, most especially the pioneering work of T. Shimizu and B. Douda. The authors are also grateful to K. Hudson and especially to E.-C. Koch for their comments and suggestions on a draft of this paper.
References
1) T. Shimizu, Selected Pyrotechnic Publica-tions of Dr. Takeo Shimizu, Part 3, Studies on Fireworks Colored-Flame Compositions, Journal of Pyrotechnics, 1999.
2) B. E. Douda, Theory of Colored Flame Pro-duction, RDTN No. 71, U.S. Naval Ammuni-tion Depot Crane, IN, USA, 1964.
3) B. E. Douda, Relationships Observed in Col-ored Flames, RDTR No. 45, U.S. Naval Ammunition Depot Crane, In, USA, 1964.
4) B. E. Douda, “Emission Studies of Selected Pyrotechnic Flames”, J. Optical Soc. Ameri-ca, Vol. 55, 1965, pp 787–793.
5) Ocean Optics, Inc., Dunedin, FL 34698, USA
6) T. Shimizu, Feuerwerk vom physikalischen Standpunkt aus, Hower Verlag, Hamburg, 1976. Reprinted and translated in four parts by Pyrotechnica Publications (1981 to 1989).
7) R. Herrmann and C. T. J. Alkemade, Chemi-cal Analysis by Flame Photometry, Translat-ed by Paul T. Gilbert, Interscience Publish-ers, 1963.
8) R. C. Weast, Ed. in Chief, CRC Handbook of Chemistry and Physics, 46th ed., Chemical Rubber Co., 1965.
9) M. L. Parsons and P. M. McElfresh, Flame Spectroscopy: Atlas of Spectral Lines, IFI/Plenum, 1971.
10) R. W. B. Pearse and A. G. Gaydon, The Iden-tification of Molecular Spectra, 3rd ed., Chapman and Hall Ltd, 1963.
11) A. G. Gaydon, The Spectroscopy of Flames, 2nd ed., Chapman and Hall, John Wiley & Sons, 1974.
12) C. Th. J. Alkemade and R. Herrmann, Fun-damentals of Analytical Flame Spectroscopy, translated from German by R. Auerbach and Paul T. Gilbert Jr., John Wiley & Sons, New York, 1979.
13) R. Mavrodineanu, Ed., Phillips Technical Library, Analytical Flame Spectroscopy, Se-lected Topics, Macmillan, 1970.
14) R. Mavrodineanu and H. Boiteux, Flame Spectroscopy, John Wiley & Sons, New York, 1965.
15) H. Li, C. Focsa, B. Pinchemel, R. J. Le Roy, P. F. Bernath, “Fourier Transform Spectros-copy of BaO: New Ground-State Constants from the A1Σ+-X1Σ+ Chemiluminescence, Journal of Chemical Physics, Vol. 113, No. 8, 2000, p 3030.
16) PeakFit Version 4.11, Systat, Richmond, CA, USA.
17) Color and Vision Research Laboratories, In-stitute of Ophthalmology, University Col-lege, London, and Visual PsychoPhysics, Tübingen Forschungsstelle für Experimentel-le Ophthalmologie, University of Tübingen - http://cvrl.ioo.ucl.ac.uk/cvrl.htm
18) D. E. Chavez, M. A. Hiskey, and D. L. Naud, “High-Nitrogen Fuels for Low-Smoke Pyro-
Page 726 Selected Pyrotechnic Publications of K. L. and B. J. Kosanke
technics”, Journal of Pyrotechnics, No. 10, 1999.
19) B. V. Ingram, “Color Purity Measurements of Traditional Star Formulas”, Journal of Py-rotechnics, No. 17, 2003.
20) S. Anderson, “Composite Color Stars”, Jour-nal of Pyrotechnics, No. 8, 1998.
21) R. Veline, A Compatible Star Formula Sys-tem for Color Mixing, Self Published, 1989.
22) J. H. Baechle, Pyrocolor Harmony – A De-signer’s Guide, Self Published, 1989.
23) B. J. and K. L. Kosanke, “Lancework—Pictures in Fire”, Pyrotechnica XV, 1993; al-so in Selected Pyrotechnic Publications of K. L. and B. J. Kosanke, Part 3 (1993 and 1994), Journal of Pyrotechnics, 1996.
24) C. Jennings-White, “Some Esoteric Firework Materials”, Pyrotechnica XIII, 1990.
25) B. T. Sturman, “The Rare Earths as Possible Flame Color Agents”, Journal of Pyrotech-nics, No. 9, 1999.
26) E.-C. Koch, “Evaluation of Lithium Com-pounds as Color Agents for Pyrotechnic Flames”, Journal of Pyrotechnics, No. 13, 2001.
27) E.-C. Koch, “Special Materials in Pyrotech-nics Part 2 – Application of Cesium and Ru-bidium Compounds in Pyrotechnics”, Jour-nal of Pyrotechnics, No. 15, 2002.
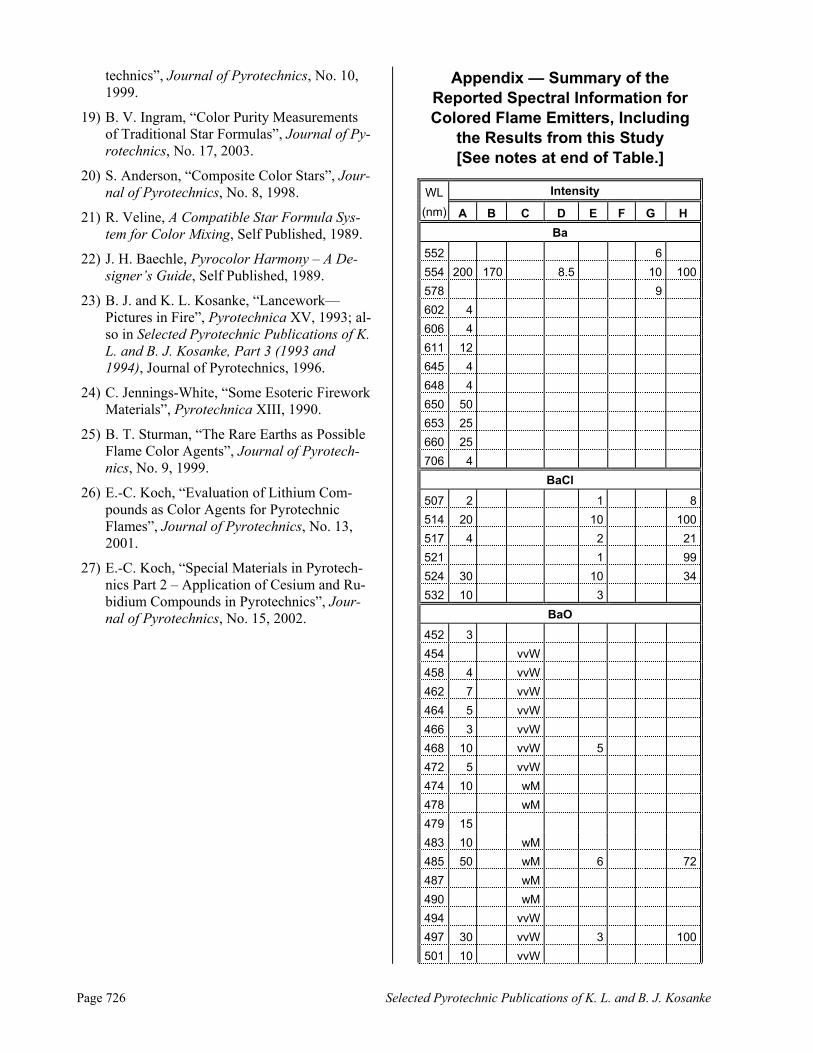
Appendix — Summary of the Reported Spectral Information for Colored Flame Emitters, Including
the Results from this Study [See notes at end of Table.]
WL Intensity
(nm) A B C D E F G H
Ba
552 6
554 200 170 8.5 10 100
578 9
602 4
606 4
611 12
645 4
648 4
650 50
653 25
660 25
706 4
BaCl
507 2 1 8
514 20 10 100
517 4 2 21
521 1 99
524 30 10 34
532 10 3
BaO
452 3
454 vvW
458 4 vvW
462 7 vvW
464 5 vvW
466 3 vvW
468 10 vvW 5
472 5 vvW
474 10 wM
478 wM
479 15
483 10 wM
485 50 wM 6 72
487 wM
490 wM
494 vvW
497 30 vvW 3 100
501 10 vvW

Selected Pyrotechnic Publications of K. L. and B. J. Kosanke Page 727
WL Intensity
(nm) A B C D E F G H
BaO (cont.)
509 100 W 6
514 87
521 70 vW 7
526 97
533 100
535 90 80 vW 4 8 s 90
537 vW
540 vvW
542 5 vvW
546 20 16
549 70 80 vvW 4 10 vs
551 10 vvW 68
560 10
564 40 80 vvW 4 9 vs
566 5 vvW
567 10 vvW 51
570 40 80 4 8 s
571 vvW
574 36
576 15 vvW
577 vvW
581 20 vvW 6 m
582 vvW
583 vvW 32
586 40 W 3.5 10 vs
587 80
588 W
589 10 W 93
598 10 vvW 3 w
604 50 70 W 3.5 9 vs
608 88
610 20 W 5
611 10 W
612 W 59
616 10
617 vvW 6 34
622 vW 6 m
623 15 32
626 29
629 25 W 8 s
632 79
636 vvW
642 15 vW 26
653 71
WL Intensity
(nm) A B C D E F G H
656 10 vW 57
663 vW 39
666
670 vvW
678 50 wM 8 s
682 56
686 40 vW 33
693 60 vW 26
701 vW 10
710 80 vW 5 50
718 vW 46
725 vW 14
734 vW 32
744 vW 16
752 vW 26
755
761 vW 41
BaOH
487 wM
488 120 100 5 72
497 80 4
502 30 80 4 30
512 W
513 140 150 7.5 100
524 80 80 4 86
745 45 50 2.5 47
Ca
423 10k 250 vS 5 100
428 4
430 15
432 3
444 10
446 15
459 8
CaCl
383 12
388 13
581 250 3
593 500 45
605 2 11
608 2 14
618 10
619 500 5 99
621 500 10 100
622 5

Page 728 Selected Pyrotechnic Publications of K. L. and B. J. Kosanke
WL Intensity
(nm) A B C D E F G H
CaCl (cont.)
633 2 9
635 2 8
CaO
385 vW
386 vW
387 2
389 vvW
392 vvW
397 3
408 5
410 4
413 3
421 6
422 5
424 3
435 5
437 5
438 6
440 6
443 3
451 4
452 3
598 8
600 8
601 8
604 3
606 5
607 7
608 5
609 6
610 10
618 6
626 9
628 4
632 2
634 4
636 4
731 vvW
732 vvW
733 vvW
771 vW
772 vW 6
WL Intensity
(nm) A B C D E F G H
CaOH
539 vW
543 100 W
546 100
551 100
552 200
553 600
554 1.2k 500 5 45
555 1k vS 10 5
556 400 2
565 100
570 100
572 100 25 0.5 1
578 W
581 100
583 W
594 100 7
597 200
599 400
600 400 11
601 600
602 400 100
603 400 [a]
604 M 2 14
605 300
607 200
608 200
609 200
610 400
612 200
622 500 10
623 vS
625 100
644 70
645 M 1.4 10
665 W 1
683 vW
698 vvW
Cu [b]
450 4
455 7
460 10
461 8
465 10
471 5

Selected Pyrotechnic Publications of K. L. and B. J. Kosanke Page 729
WL Intensity
(nm) A B C D E F G H
Cu (cont.) [b]
486 4
487 4
490 10
492 8
497 4
498 8
500 7
511 50 vvW 4
515 4
522 5
570 5
578 10
CuCl
412 5 6
415 12
419 2 6 w 12
421 2 4 w 22
426 5 8 s 27
428 10 7 vs 9 35
433 10 10 vs 35
435 20 9 vs 10 41
436 5 100
441 7 6 s
443 15 6 vs 9 46
446 82
449 4 4 m 31
452 5 1 m 5 35
460 16
465 9
469 7
476 5 vw 1 5
479 5 vw 2 7
482 11
485 8 w 3 13
488 3 8 w 4
489 6 21
495 4 vw 1
496 5 12
498 4 vw 2 17
509 6
512 6
515 2 m 3 3
526 4 w 6 4
538 2 5
WL Intensity
(nm) A B C D E F G H
552 4
CuH
401 5 18
407 12
413 10
416 7
428 30 vvW vs 100
433 11 m 55
435 10
436 9
437 7
438 9
439 9
440 9
441 9 38
442 7
443 8
444 7 24
445 10
446 11
465 8
CuO
445 8
446 7
450 25
452 5
453 5 27
458 6 33
464 6
467 52
469 5
470 5
471 7 53
472 7
477 6 57
480 66
483 4
485 5
486 5 69
488 5 83
492 5 100
583 2
584 3
605 10 9
606 50 10 42

Page 730 Selected Pyrotechnic Publications of K. L. and B. J. Kosanke
WL Intensity
(nm) A B C D E F G H
CuO (cont.)
615 50 8
616 50 9 59
628 1
629 5
632 47
638 2
640 5
643 3
649 1
CuOH
493 60
505 70 50 5 46
512 44
524 110 70 vvW 7 75
530 110 vvW
512 84
537 120 100 vvW 10
533 100
605 10
615-625
vvW
[c] K
404 500 0.03 5 0.06
405 250 30 4
580 25
694 40
766 40k 10k 10 10 100
770 200k 10k 10 9 78
[d] Na
568 40
569 80
589 800k 30k 10 10 100
590 400k 10 9 100
[e] Sr
461 10k 500 1 10 100
483 5
487 2
496 3
SrCl
389 4
392 4
394 4
396 4
398 4
WL Intensity
(nm) A B C D E F G H
401 4
624 2 11
636 20 10 55
648 4 21
661 20 10 90
662 5
674 5 100
675 10 5
676 3
687 11
700 1
SrO [f] [g] [h]
390 vvW
392 vvW
593 100
595 500 W 1
597 500 1 88
608 25
609 20
610 10
611 7
750 5 vvW
752 7 vvW
754 10 vvW
756 10
787 20
788 25
SrOH
604 3k
605 5k 10 Str.
606 7k vs 59
608 10
609 6
610 4
611 1
620 vw 2
624 150
626 vw 2
645 250 0.5
646 700 M m
649 13
659 1.5k 500 W 1 w 13
666 5k 500 1
671 vS vs 70
672 4k

Selected Pyrotechnic Publications of K. L. and B. J. Kosanke Page 731
WL Intensity
(nm) A B C D E F G H
SrOH (cont.)
680 250
682 7k vS 0.5 vs 100
704 500
707 wM m 9
722 W w 1
Sources of Spectral Data in Table
A) R. Herrmann and C. T. J. Alkemade, Chemical Analysis by Flame Photometry, Translated by Paul T. Gilbert, Interscience Publishers, 1963. [Note: Does not include peaks with an intensi-ty of one.]
B) CRC Handbook of Chemistry and Physics, 46th ed., Robert C. Weast, Ed., Chemical Rub-ber Co., 1965. [Note: Only air-hydrogen flame values using aqueous solutions reported.]
C) R. Mavrodineanu and H. Boiteux, Flame Spectroscopy, John Wiley & Sons, Inc., 1965 [Note: Only acetylene-air, outer cone values reported.]
D) M. L. Parsons and P. M. McElfresh, Flame Spectroscopy: Atlas of Spectral Lines, IFI/Plenum, 1971. [Note: Only air-hydrogen values reported.]
E) R. W. B. Pearse and A. G. Gaydon, The Iden-tification of Molecular Spectra, 3rd ed., Chap-man and Hall LTD, 1963. [Note: Variety of sources, flame types, furnaces, and arcs re-ported.] NOTE: Looking at the more recent (4th) edition from 1975, there are obviously some deviations between the transitions listed in this Table under E. At the time of writing,
the authors did not have this edition available. In all probability – knowing the types of budgets that university libraries face – the old-er edition may be more readily found.
F) A. G. Gaydon, The Spectroscopy of Flames 2nd ed., Chapman and Hall, John Wiley & Sons, 1974.
G) B. E. Douda, Theory of Colored Flame Pro-duction, U.S. Naval Ammunition Depot, RDTN No. 71, 1964. [Note: Values from Gaydon are not reproduced for this column.]
H) This work.
Table Notes
Note: Some researchers used a non-numerical scale, such as vvW for Very Very Weak, vs. for Very Strong, etc. No attempt was made to convert these to a numerical scale. In addition, there are discrepancies in wavelength assignments between the various sources. No attempt was made to reas-sign wavelengths.
a) 604–698 nm designated as “CaOH (?)” in the original text.
b) Designated as Cu2, not Cu, in the original text.
c) Only values ≥ 25 are listed.
d) Only values ≥ 25 are listed.
e) Only values ≥ 25 are listed.
f) 595 and 597 nm are designated as possibly being Sr2O2 in the original text.
g) 595 nm is designated as Sr2O2 in the original text.
h) 595and 597 nm are designated as Sr2O2 in the original text.