color quality scale (cqs): measuring the colormeasuring ... · measuring the colormeasuring the...
TRANSCRIPT
Color Quality Scale (CQS): Measuring the colorMeasuring the color
quality of light sourcesq y g
W d D iWendy [email protected]
O ti l T h l Di i iOptical Technology DivisionNational Institute of Standards and Technology

Copyright Materials
This work was prepared by an officer or employee of the U it d St t t t f th t ' ffi i lUnited States government as part of that person's official duties.
It is not subject to copyright in the United States and there are no copyright restrictions on reproduction, derivative works distribution performance or display of the workworks, distribution, performance, or display of the work. Anyone may, without restriction under U.S. copyright laws:
F i f tiFor more information see: http://www.usa.gov/copyright.shtml

Learning Objectives
•History of the Color Rendering Index (CRI)•what CRI actually measures•what CRI actually measures •how CRI is calculated
Problems & limitations of the CRI•Problems & limitations of the CRI•why there is strong motivation to replace it
f•Dimensions of color quality•various approaches to evaluating color quality
•Color Quality Scale (CQS)•international standardization work

Color Rendering
Blue & Yellow LEDEqual Energy

Importance of Measuring Color Rendering
Daylight Low pressure sodium lampWhite LED
520 lm/W~ 400 lm/W~250 lm/W
Theoretical maximum
Excellent color rendering
??color rendering
No color renderingcolor rendering g rendering
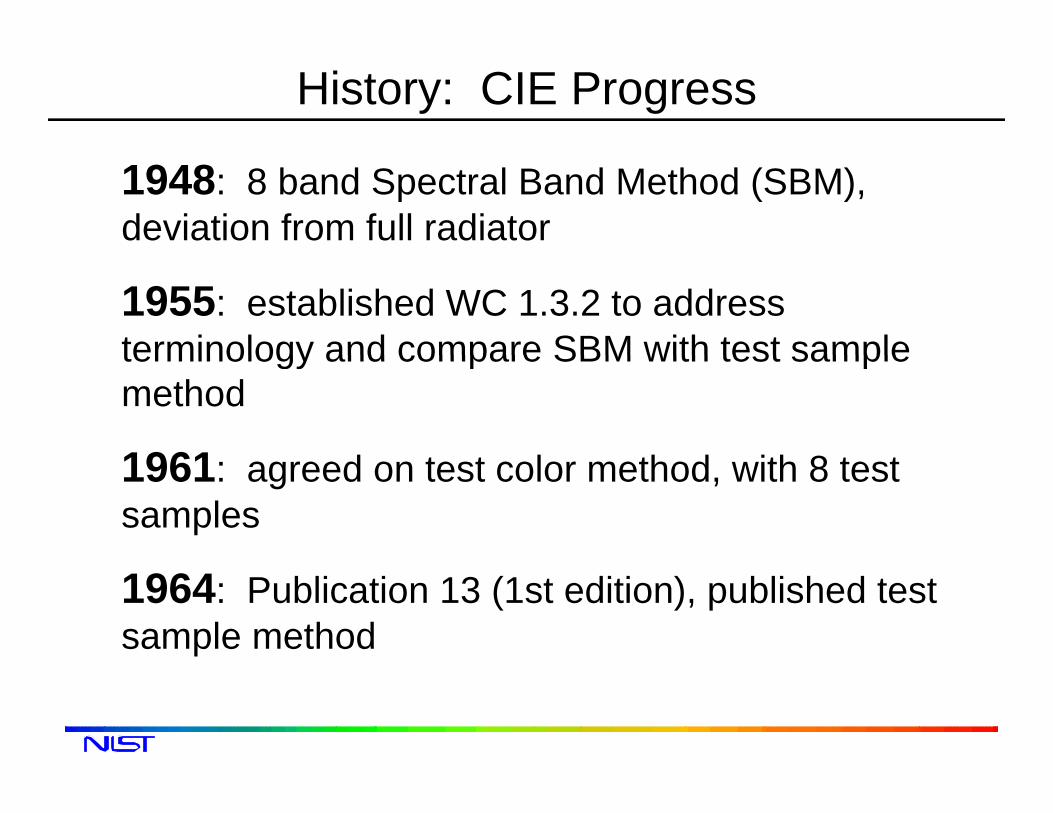
History: CIE Progress
1948: 8 band Spectral Band Method (SBM), deviation from full radiator
1955: established WC 1.3.2 to address terminology and compare SBM with test sampleterminology and compare SBM with test sample method
1961 d t t l th d ith 8 t t1961: agreed on test color method, with 8 test samples
1964: Publication 13 (1st edition), published test sample method

History: CIE Progress
1974: Publication 13 (2nd edition)
Defined reference illuminantsDefined reference illuminants
Test samples: 8 + 6
Von Kries chromatic adaptation transform
Use the CIE 1964 UCSUse the CIE 1964 UCS
Scaling: Warm white halophosphate lamp to Ra=50Ra=50
Developed the CRI as we know it todaye e oped t e C as e o t today

Color Rendering Index (CRI)
Reference sourceTest source
CIE
Planckian(CCT<5000 K)
Dxx
Standard Daylight
Same CCT [K]400 500 600 700
(CCT<5000 K) (CCT > 5000 K)400 500 600 700
0 5
0.6
0.7
0.8 TCS01 TCS02TCS03 TCS04TCS05 TCS06TCS07 TCS08
#1 #2 #3 #4 #5 #6 #7 #8
TCS09 TCS10
0
0.1
0.2
0.3
0.4
0.5
350 450 550 650 750
Ra
0 1
0.2
0.3
0.4
0.5
0.6
0.7
0.8
0.9 TCS11 TCS12TCS13 TCS14TCS15#9 #10 #11 #12 #13 #14
0
0.1
350 450 550 650 750

Aside: Measuring Color Differences
Two-dimensional diagrams
Only for light color
No black, grey, or brown
Ligh
tnes
s whiteThree attributes of color are hue,
chroma (saturation), and
H
Chroma
chroma (saturation), and lightness, and are expressed in a three dimensional space.
Hue
black
To allow accurate specification of object colors and color differences CIE recommendeddifferences, CIE recommended CIELAB and CIELUV in 1976.

Color Rendering Index (CRI)
Keep perspective:•The CRI was designed to evaluate fluorescent lamps
•The CRI was intended to measure the “naturalness” of objects’ colorsnaturalness of objects colors
•Reflective samples (1st eight) chosen to represent “average” saturation of objects
•Has had no substantive changes in 35 years•Has had no substantive changes in 35 years
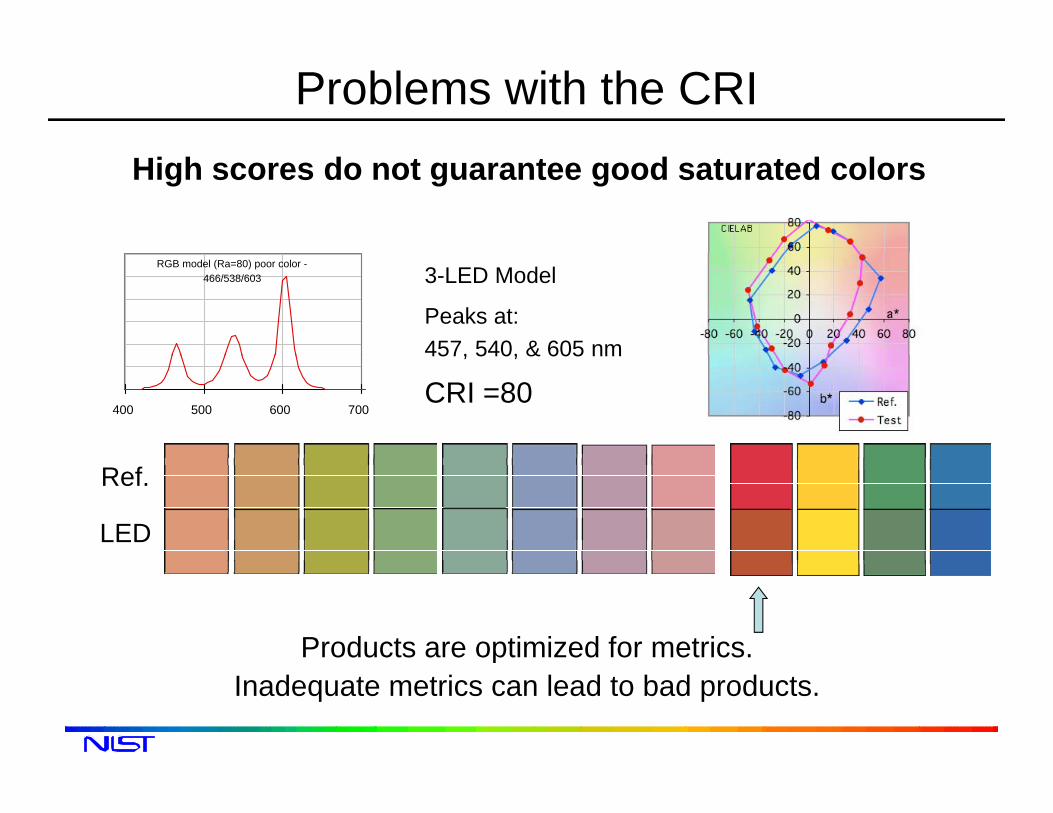
Problems with the CRIHigh scores do not guarantee good saturated colors
3-LED Model
Peaks at:457, 540, & 605 nm
RGB model (Ra=80) poor color -466/538/603
457, 540, & 605 nm
CRI =80400 500 600 700
Ref.
LED
Products are optimized for metrics.Inadequate metrics can lead to bad products.

Problems with the CRICRI penalizes light sources having enhanced color contrast
Neodymium incandescent lamp
CRI = 77CRI = 77(Normal incandescent lamp CRI=100)
Ref.
LED

Problems with the CRIRGB white LEDs can have the same effects
3-LED ModelPeaks at: 464, 538, 620 nm
CRI = 63
Ref
LED
Products are optimized for metrics.Products are optimized for metrics.Outdated metrics can impede development of new technologies.

Saturation & Naturalness
Hunt EffectColorfulness / saturation i ith l iincreases with luminance
If we want objects to appear most natural in perceived color, we may want artificial sources to enhance their saturationenhance their saturation.

Color Saturation – Color Preference
Deane Judd FlatteryDeane Judd, Flattery Index for Artificial Illumination (1967)

Approaches to Measuring Preference
Use method very similar to CRI, but penalties for color
Other metrics
y , pdifferences are based on deviations from “preferred shifts.”
Fl tt I d (J dd 1967)Flattery Index (Judd, 1967)
Color Preference Index (Thornton, 1974)
Examples of preferred shifts:
Skin tones (Caucasian) more reddish
Foliage (green) less yellowishFoliage (green) less yellowish

Other Color Quality Approaches
Two main presumptions:
Gamut-based metrics
Increased gamut increases discriminability between colors
Increased gamut leads to increased object chromaIncreased gamut leads to increased object chroma
Color Discrimination Index (Thornton, 1972)
Cone Surface Area (Fotios, 1997)
Color Rendering Capacity (Xu, 1993)g p y ( , )
Feeling of Contrast Index (Hashimoto, Yano, & Nayatani, 2000)

History: CIE Progress
1980s: new Technical Committee worked on subject, but closed without recommendations due to member disagreements
1995: Publication 13 (3rd edition) no1995: Publication 13 (3 edition), no substantive changes from 2nd edition, just fixed some errors
1999: Another Technical Committee (TC 1-33) closed without reaching consensus Industryclosed without reaching consensus. Industry opposed proposed new procedures due to lack of visual experimentsvisual experiments

Color Quality Scale (CQS)
To replace the CRI• Fix the problems of the CRIp• Replace outdated formulae in CRI• Works for all light sourcesg• Considers not only color fidelity but
also color preference and other t f l litaspects of color quality
• Initially developed with colorimetric simulationssimulations
• Being tested with vision science experiments

Color Quality Scale (CQS)
Primary deviations from CRI
•Name
Inspiration taken from CRI
•Uniform object color •Different reflective samples•Updated object color space
jspace to calculate color differencesT t l th d
p j p& chromatic adaptation transformS t ti f t
•Test sample method •Reference source, matched in CCT •Saturation factor
•CCT factorRMS combining of color
matched in CCT •Single number output
•RMS combining of color differences•0-100 scale0 100 scale•New scaling factor

Reflective Sample Setb*
40
60
80b*
CIELAB
New set of 15 saturated color samples 20
0
20
-80 -60 -40 -20 0 20 40 60 80a*
samples
-60
-40
-20
15 newsamplesCIE 13 3
-80CIE 13.38 samples

Root Mean Square
The CRI makes it possible for a lamp to score quite well even
Case A Case BΔE ΔE
TS1 3 1
Example
lamp to score quite well, even when it renders one or two samples very poorly. This situation is more likely with SPDs having
TS1 3 1TS2 3 1TS3 3 1TS4 3 1TS5 3 1likely with SPDs having
narrowband peaks, such as LEDs.
RMS (Root Mean Square)
TS5 3 1TS6 3 1TS7 3 1TS8 3 1TS9 3 1RMS (Root Mean Square)
color difference of 15 samples:TS9 3 1
TS10 3 1TS11 3 1TS12 3 1TS13 3 1
ΔERMS =
115
ΔEi2
i=1
15
∑TS13 3 1TS14 3 16TS15 3 16
Ra(mean) 91 91( )
Ra(RMS) 91 82

Saturation Factor
RefRefTest
RefTest
Score is decreased for Score is not penalized for fthe full color difference. increase of chroma.
(Score is decreased for hue & lightness shifts)

CCT Factor
The reference source at extremely low or high CCTs should not have
CCT (K) Gamut Area MultiplicationFactor
1000 1579 0.19
1500 5293 0.64perfect color rendering (score=100).
1500 5293 0.64
2000 7148 0.87
2500 7856 0.96
2856 8085 0.98
40
60
80
CIELAB3000 8144 0.99
3500 8267 1.00
4000 8322 1.00
5000 8354 1 00
0
20
-80 -60 -40 -20 0 20 40 60 80
b*
5000 8354 1.00
6000 8220 1.00
6500 8210 1.00
7000 8202 1.00
60
-40
-20
1500 K2000 K
8000 8191 1.00
9000 8185 1.00
10000 8181 1.00
-80
-603000 K6500 K
a*
15000 8180 1.00
20000 8183 1.00

Some Results of the CQS
Neodymium Incandescent
RGB (enhanced)(464/538/620 nm)
RGB (poor red)(457/540/605 nm)
Cool WhiteFluorescent ( )
RGB model (Ra=80) poor color -466/538/603
400 500 600 700
CRI =77CQS=88
CRI =63CQS=80
CRI =80CQS=74
CRI =63CQS=64
Consistency of scores is maintained for fluorescent lamps

Spectrally Tunable Lighting Facility (STLF)

STLF Specifications
• 22 color channels using 1800 high power LEDs/unit (to be expanded)• Each color channel: 5 to 10 W optical power.• Full power total optical power ~200 W, luminous flux ~50,000 lm.• 500 lx illumination for most simulated spectra.• Built by contract with Philips Color Kinetics.• Built with NIST Director’s funding.

Small Experiment
8 Subjects: 4 Caucasians, 3 Asians, 1 Hispanic 5 females, 3 males
Tasks: 1) Judge color appearance of objects in the room2) Judge color appearance of skin (hands and face)

Experimental Spectra
CCT: 4000 K (800 lx), Duv=0.000
Lights tested
3000 K (300 lx), Duv=0.000
4000 K 3000 KR f b db d R 98 R 97Reference: broadband Ra=98 Ra=974 peak (RGBA) Desaturating-4 Ra=70 Ra=704 peak (RGBA) Desaturating-3 Ra=77 Ra=764 peak (RGBA) Desaturating 2 Ra=84 Ra=844 peak (RGBA) Desaturating-2 Ra=84 Ra=844 peak (RGBA) Desaturating-1 Ra=90 Ra=904 peak (RGBA) Neutral Ra=92 Ra=954 peak (RGBA) Saturating-1 Ra=87 Ra=884 peak (RGBA) Saturating 1 Ra 87 Ra 884 peak (RGBA) Saturating-2 Ra=82 Ra=814 peak (RGBA) Saturating-3 Ra=74 Ra=744 peak (RGBA) Saturating-4 Ra=69 Ra=69p ( ) g

4000 K Broadband Reference

4000 K Desaturating-4

4000 K Desaturating-3

4000 K Desaturating-2

4000 K Desaturating-1
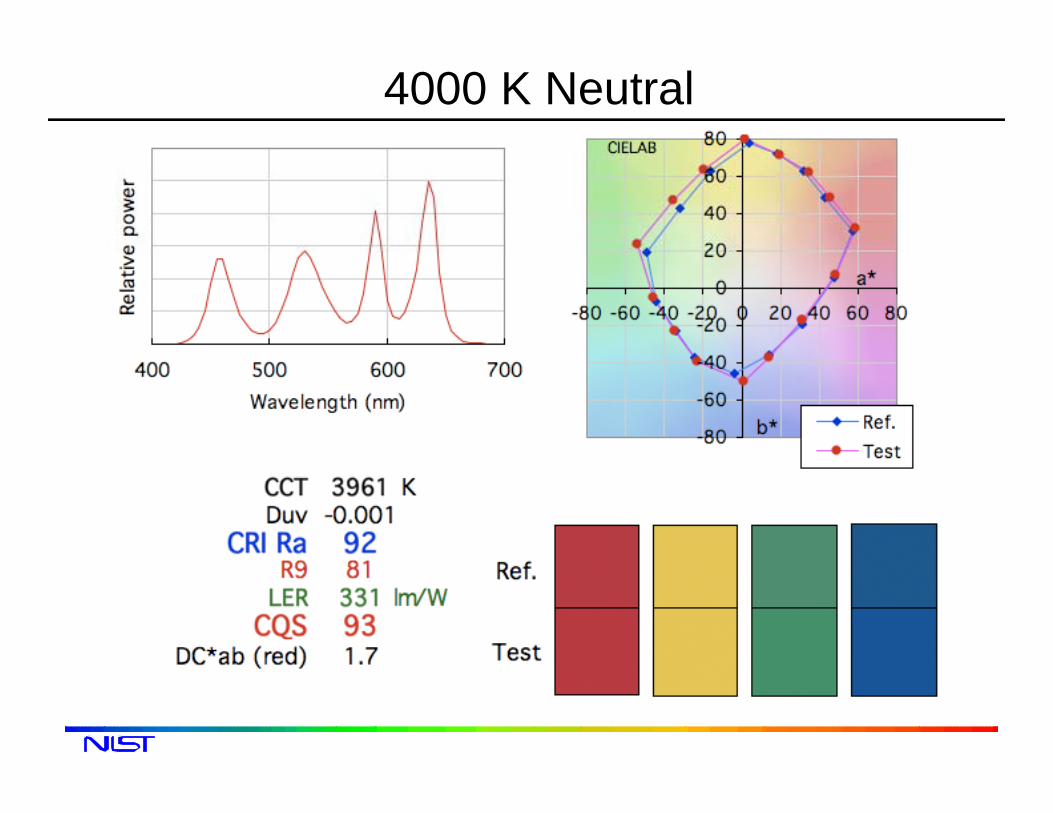
4000 K Neutral

4000 K Saturating-1

4000 K Saturating-2

4000 K Saturating-3

4000 K Saturating-4

Results: Room Evaluation

Results: Skin Evaluation

Results: Correlation Coefficients
CRI Ra CQS Qa
Room 4000 K 0.47 0.88
R 3000 K 0 28 0 72Room 3000 K 0.28 0.72
Skin tone 4000 K 0.21 0.73
Skin tone 3000 K 0 43 0 80Skin tone 3000 K 0.43 0.80
Room (both CCTs) 0 37 0 79Room (both CCTs) 0.37 0.79
Skin tone (both CCTs) 0.31 0.75

Current Standardization WorkRecent CIE Activity
20072007: TC 1-62 published CIE 177
Studied color rendering of white LED sourcesg
Recommended the development of a new color rendering metric (or set of metrics)rendering metric (or set of metrics)
Recommended concurrent use of CRI and new metric at least at firstmetric, at least at first
The new metric should be applicable to all types f li htof light sources

Current Standardization WorkTC 1-69: Colour Rendition by White Light Sources
Started in late 2006
Chair: Wendy Davis USChair: Wendy Davis, US
Terms of Reference: To investigate new methodsTerms of Reference: To investigate new methods for assessing the colour rendition properties of white-light sources used for illumination includingwhite light sources used for illumination, including solid-state light sources, with the goal of recommending new assessment procedures.g p

TC 1-69Membership:
38 active members from 13 countries38 active members from 13 countries
+ a handful of interested observers
Meetings:Physical meetings held annuallyy g yElectronic communications critical:
web site for sharing papers data etcweb site for sharing papers, data, etc.e-mail list with accessible archiveweb meeting in 2010web meeting in 2010
TC Research17 (+/-) research reports10 labs/groups10 labs/groups
seven countriesTopics included:Topics included: •rendering of human skinchromatic discriminationchromatic discrimination•color memory for real objects•attractiveness & naturalness of fruits & vegetables g•estimations of color differences•color harmony•more….

Current Standardization WorkSeven metric proposals:R k d b d l d i i d (RCRI)Rank-order based color rendering index (RCRI)
Feel of contrast index (FCI)
CRI-CAM02UCS
Color quality scale (CQS)Color quality scale (CQS)
Harmony rendering index (HRI)
Categorical color rendering index (CCRI)
Memory CRI (MCRI)Memory CRI (MCRI)

Metric ProposalsRank-order based color rendering index (RCRI)Bodrogi, Bruckner, & Khanh
Premise An inde ith discrete increments are easierPremise: An index with discrete increments are easier for users to understand17 test color samples17 test color samplesCAM02-UCS
Feel of contrast index (FCI)Feel of contrast index (FCI)Hashimoto, Yano, & Nayatani
Premise: High chroma of colored objects = high visualPremise: High chroma of colored objects high visual clarityDerived by a simple transformation of gamut areaIntended to supplement CRI

Metric ProposalsCRI-CAM02UCSLi, Luo, & Li
Premise CRI like method ith pdated colorimetrPremise: CRI-like method with updated colorimetry (UCS, CAT)Same test color samples as CRISame test color samples as CRICAM02-UCS
Color quality scale (CQS)Color quality scale (CQS)Davis & Ohno
Premise: One metric can integrate differentPremise: One metric can integrate different dimensions of color qualityDoes not treat all object color shifts equally15 test color samples

Metric ProposalsHarmony rendering index (HRI)Szabo, Bodrogi, & Schanda
Premise: To quantify the distortion of color harmony caused by light sourcesStudied harmony with two- and three-color combinations under different illumination conditionsCAM02 UCSCAM02-UCS
Categorical color rendering index (CCRI)Y hi E d h M i & Shi i iYaguchi, Endoh, Moriyama, & Shioiri
Premise: Errors in color rendering will shift the categorical color names of some object colorscategorical color names of some object colors

Metric ProposalsMemory CRI (MCRI)Smet, Forment, Hertog, Deconinck, & Hanselaer
Premise: Memory colors of familiar objects used as reference to evaluate color renderingB d i t ith l bj tBased on experiments with real objectsRatings of similarity between apparent object color to memory color of the objectmemory color of the object

Current Standardization WorkFinal decision making/voting should happen very soon.yIdeally, it would have already happened.
Honestly building consensus is proving challengingHonestly, building consensus is proving challenging.

Thank your for your time!
QUESTIONS??
This concludes The American Institute ofThis concludes The American Institute of Architects Continuing Education Systems
Program
Wendy Davis: wendy davis@nist govWendy Davis: [email protected]