color i meter
TRANSCRIPT
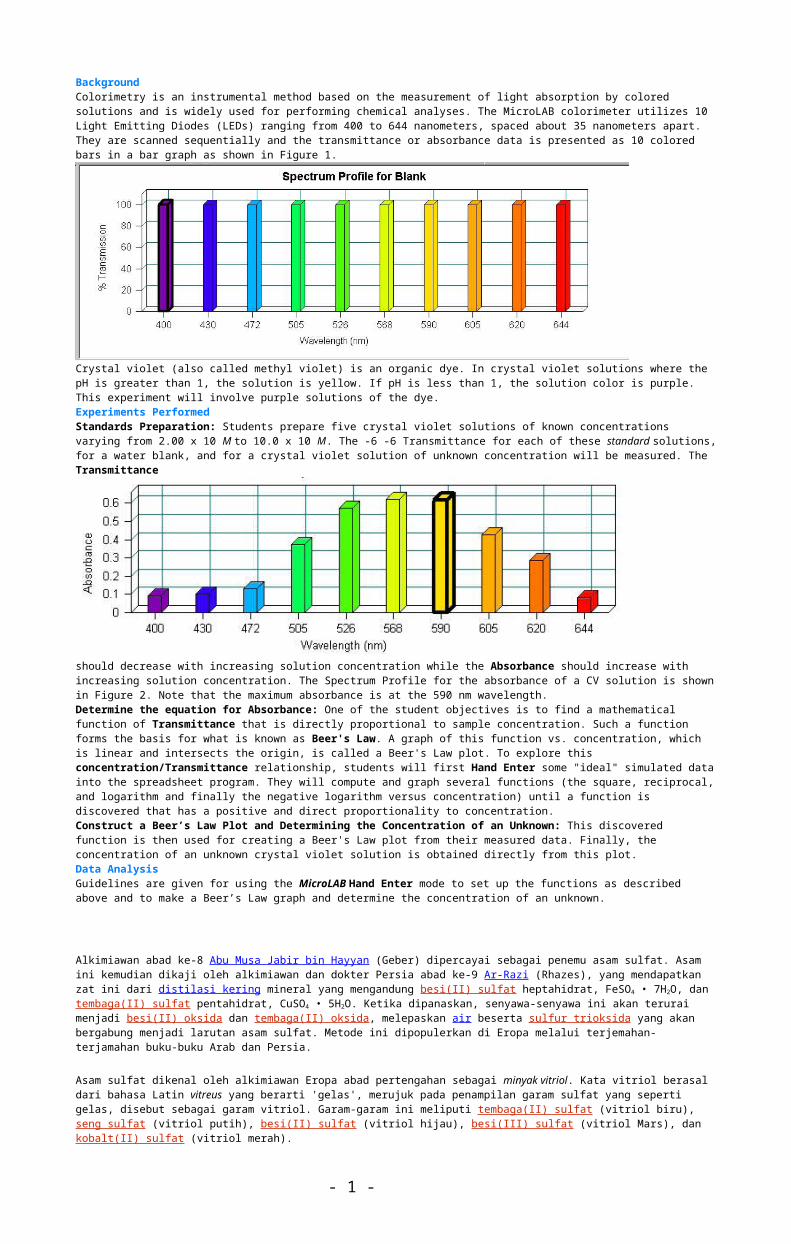
BackgroundColorimetry is an instrumental method based on the measurement of light absorption by colored solutions and is widely used for performing chemical analyses. The MicroLAB colorimeter utilizes 10 Light Emitting Diodes (LEDs) ranging from 400 to 644 nanometers, spaced about 35 nanometers apart. They are scanned sequentially and the transmittance or absorbance data is presented as 10 colored bars in a bar graph as shown in Figure 1.
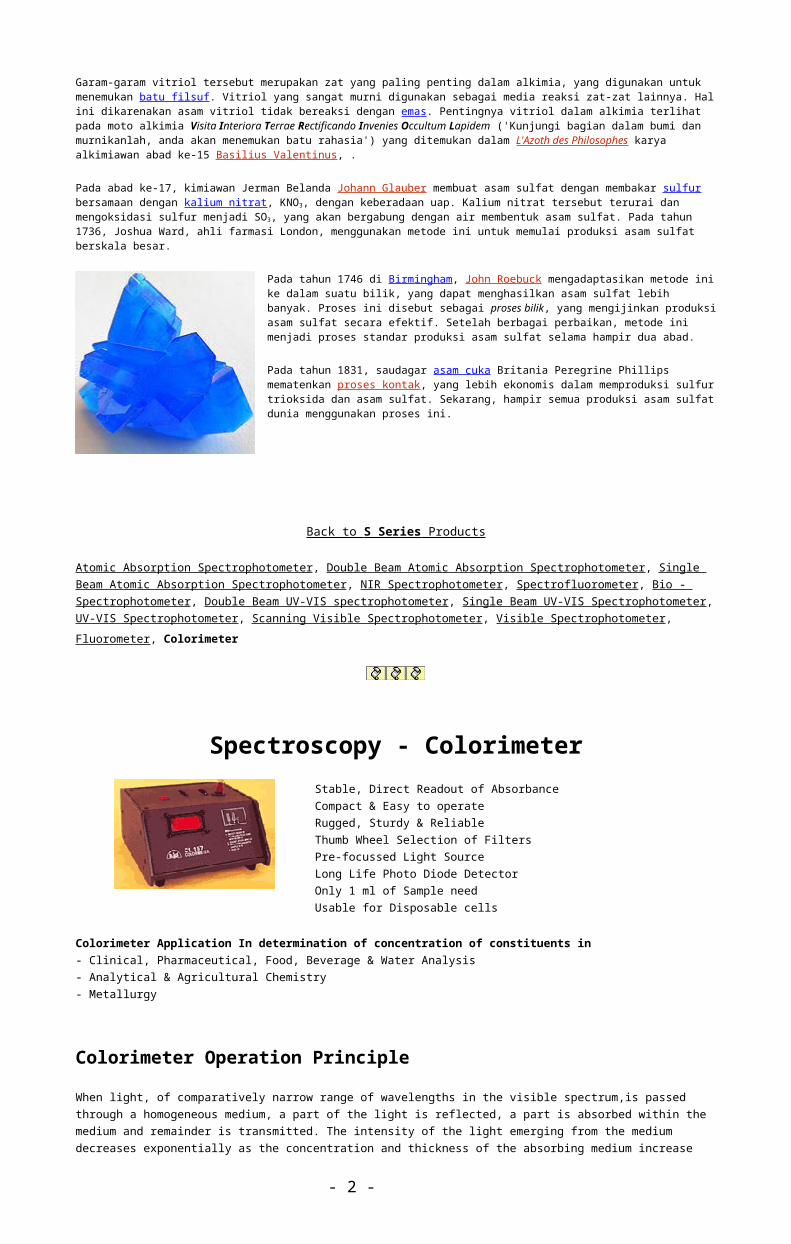
Crystal violet (also called methyl violet) is an organic dye. In crystal violet solutions where the pH is greater than 1, the solution is yellow. If pH is less than 1, the solution color is purple. This experiment will involve purple solutions of the dye.Experiments PerformedStandards Preparation: Students prepare five crystal violet solutions of known concentrations varying from 2.00 x 10 M to 10.0 x 10 M. The -6 -6 Transmittance for each of these standard solutions, for a water blank, and for a crystal violet solution of unknown concentration will be measured. The Transmittance
should decrease with increasing solution concentration while the Absorbance should increase with increasing solution concentration. The Spectrum Profile for the absorbance of a CV solution is shown in Figure 2. Note that the maximum absorbance is at the 590 nm wavelength.Determine the equation for Absorbance: One of the student objectives is to find a mathematical function of Transmittance that is directly proportional to sample concentration. Such a function forms the basis for what is known as Beer's Law. A graph of this function vs. concentration, which is linear and intersects the origin, is called a Beer's Law plot. To explore this concentration/Transmittance relationship, students will first Hand Enter some "ideal" simulated data into the spreadsheet program. They will compute and graph several functions (the square, reciprocal, and logarithm and finally the negative logarithm versus concentration) until a function is discovered that has a positive and direct proportionality to concentration.Construct a Beer’s Law Plot and Determining the Concentration of an Unknown: This discovered function is then used for creating a Beer's Law plot from their measured data. Finally, the concentration of an unknown crystal violet solution is obtained directly from this plot.Data AnalysisGuidelines are given for using the MicroLAB Hand Enter mode to set up the functions as described above and to make a Beer’s Law graph and determine the concentration of an unknown.
Alkimiawan abad ke-8 Abu Musa Jabir bin Hayyan (Geber) dipercayai sebagai penemu asam sulfat. Asam ini kemudian dikaji oleh alkimiawan dan dokter Persia abad ke-9 Ar-Razi (Rhazes), yang mendapatkan zat ini dari distilasi kering mineral yang mengandung besi(II) sulfat heptahidrat, FeSO4 • 7H2O, dan tembaga(II) sulfat pentahidrat, CuSO4 • 5H2O. Ketika dipanaskan, senyawa-senyawa ini akan terurai menjadi besi(II) oksida dan tembaga(II) oksida, melepaskan air beserta sulfur trioksida yang akan bergabung menjadi larutan asam sulfat. Metode ini dipopulerkan di Eropa melalui terjemahan-terjamahan buku-buku Arab dan Persia.
Asam sulfat dikenal oleh alkimiawan Eropa abad pertengahan sebagai minyak vitriol. Kata vitriol berasal dari bahasa Latin vitreus yang berarti 'gelas', merujuk pada penampilan garam sulfat yang seperti gelas, disebut sebagai garam vitriol. Garam-garam ini meliputi tembaga(II) sulfat (vitriol biru), seng sulfat (vitriol putih), besi(II) sulfat (vitriol hijau), besi(III) sulfat (vitriol Mars), dan kobalt(II) sulfat (vitriol merah).
Garam-garam vitriol tersebut merupakan zat yang paling penting dalam alkimia, yang digunakan untuk menemukan batu filsuf. Vitriol yang sangat murni digunakan sebagai media reaksi zat-zat lainnya. Hal ini dikarenakan asam vitriol tidak bereaksi dengan emas. Pentingnya vitriol dalam alkimia terlihat pada moto alkimia Visita Interiora Terrae Rectificando Invenies Occultum Lapidem ('Kunjungi bagian dalam bumi dan murnikanlah, anda akan menemukan batu rahasia') yang ditemukan dalam L'Azoth des Philosophes karya alkimiawan abad ke-15 Basilius Valentinus, .
Pada abad ke-17, kimiawan Jerman Belanda Johann Glauber membuat asam sulfat dengan membakar sulfur bersamaan dengan kalium nitrat, KNO3, dengan keberadaan uap. Kalium nitrat tersebut terurai dan mengoksidasi sulfur menjadi SO3, yang akan bergabung dengan air membentuk asam sulfat. Pada tahun 1736, Joshua Ward, ahli farmasi London, menggunakan metode ini untuk memulai produksi asam sulfat berskala besar.
- 1 -
Pada tahun 1746 di Birmingham, John Roebuck mengadaptasikan metode ini ke dalam suatu bilik, yang dapat menghasilkan asam sulfat lebih banyak. Proses ini disebut sebagai proses bilik, yang mengijinkan produksi asam sulfat secara efektif. Setelah berbagai perbaikan, metode ini menjadi proses standar produksi asam sulfat selama hampir dua abad.
Pada tahun 1831, saudagar asam cuka Britania Peregrine Phillips mematenkan proses kontak, yang lebih ekonomis dalam memproduksi sulfur trioksida dan asam sulfat. Sekarang, hampir semua produksi asam sulfat dunia menggunakan proses ini.
Back to S Series Products
Atomic Absorption Spectrophotometer, Double Beam Atomic Absorption Spectrophotometer, Single Beam Atomic Absorption Spectrophotometer, NIR Spectrophotometer, Spectrofluorometer, Bio - Spectrophotometer, Double Beam UV-VIS spectrophotometer, Single Beam UV-VIS Spectrophotometer, UV-VIS Spectrophotometer, Scanning Visible Spectrophotometer, Visible Spectrophotometer, Fluorometer, Colorimeter
Spectroscopy - ColorimeterStable, Direct Readout of AbsorbanceCompact & Easy to operateRugged, Sturdy & ReliableThumb Wheel Selection of FiltersPre-focussed Light SourceLong Life Photo Diode DetectorOnly 1 ml of Sample needUsable for Disposable cells
Colorimeter Application In determination of concentration of constituents in- Clinical, Pharmaceutical, Food, Beverage & Water Analysis- Analytical & Agricultural Chemistry- Metallurgy
Colorimeter Operation Principle
When light, of comparatively narrow range of wavelengths in the visible spectrum,is passed through a homogeneous medium, a part of the light is reflected, a part is absorbed within the medium and remainder is transmitted. The intensity of the light emerging from the medium decreases exponentially as the concentration and thickness of the absorbing medium increase arithmetically, as per laws of Beer & Lambert. If the container and the thickness of the medium is kept constant, the intensity of light emerging out of the medium, with respect to the incident light, is directly proportional to the concentration of the medium.
With this principle, in colorimetry, the concentration of a coloured solution is determined by measurement of relative absorption of light with respect to a solution of known concentration
This COLORIMETER CL 157 is a table top, ergonomically engineered instrument with its components and modules inside and controls, readouts, etc., on the panels outside laid out for ease of operation and maintainability
Light from pre-focussed tungsten filament lamp is focussed by a lens system on to a photocell through filters, of discrete bands of overlapping wavelengths covering the visible spectrum, selectable by a filter wheel, and a test tube/cell containing solution under investigation. The electrical output of a photo diode is processed and the value of absorbance displayed on the readout
- 2 -

The instrument is incorporated with facilities to adjust the intensity of light, appropriate for the expected concentration of the sample, by aperture control and prevention of exposure of photocell to the light, when measurement is not being carried out, by use of a shutter.
Why Use Colourimetry?
Colourimetry can yield a wealth of information on coloured solutions. It is a quick and non-destructive method that can identify solutes in a solution and very accurately determine their concentrations. Computer technology has automated the somewhat tedious calculations required for colorimetric analysis and now allows colourimetry experiments to be performed within the span of a few minutes from start to finish. In short, a colorimetric analysis is straightforward, relatively foolproof, and highly informative.
How Does Colourimetry Work?
Colourimetry is a form of spectroscopy, an analysis that measures how atoms or molecules respond when exposed to electromagnetic radiation of a certain wavelength, and therefore, of a certain energy. In a way, colourimetry is the most familiar kind of spectroscopy, because the wavelengths used are from the visible light region of the electromagnetic spectrum.
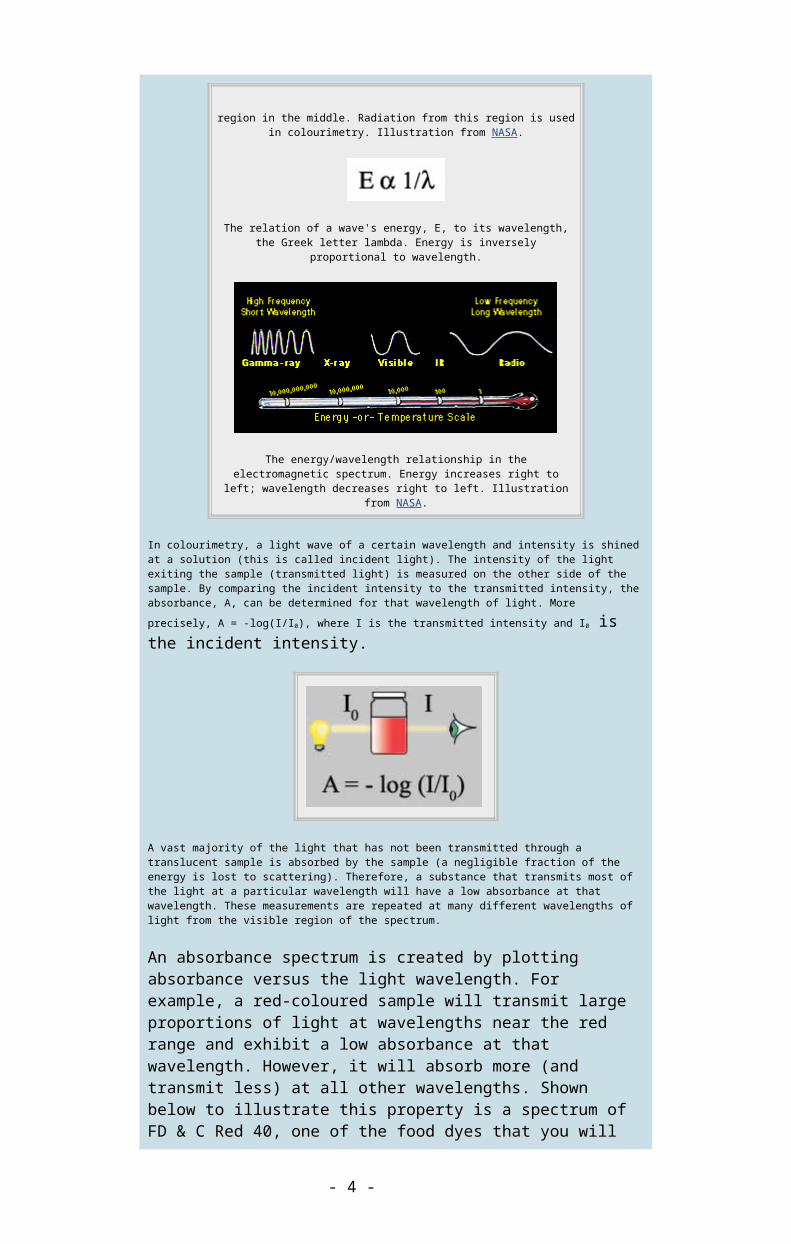
The electromagnetic spectrum; note the visible light region in the middle. Radiation from this region is used in colourimetry.
Illustration from NASA.
The relation of a wave's energy, E, to its wavelength, the Greek letter lambda. Energy is inversely proportional to wavelength.
The energy/wavelength relationship in the electromagnetic spectrum. Energy increases right to left; wavelength decreases
right to left. Illustration from NASA.
In colourimetry, a light wave of a certain wavelength and intensity is shined at a solution (this is called incident light). The intensity of the light exiting the sample (transmitted light) is measured on the other side of the sample. By comparing the incident intensity to the transmitted intensity, the absorbance, A, can be determined for that wavelength of light. More precisely, A = -log(I/I0), where I is the transmitted intensity and I0 is the incident intensity.
- 3 -
A vast majority of the light that has not been transmitted through a translucent sample is absorbed by the sample (a negligible fraction of the energy is lost to scattering). Therefore, a substance that transmits most of the light at a particular wavelength will have a low absorbance at that wavelength. These measurements are repeated at many different wavelengths of light from the visible region of the spectrum.
An absorbance spectrum is created by plotting absorbance versus the light wavelength. For example, a red-coloured sample will transmit large proportions of light at wavelengths near the red range and exhibit a low absorbance at that wavelength. However, it will absorb more (and transmit less) at all other wavelengths. Shown below to illustrate this property is a spectrum of FD & C Red 40, one of the food dyes that you will be analyzing during the experiment. Note the markedly low absorbance at the higher, red-coloured wavelengths on the right.
These spectra are characteristic of a particular chemical substance, and can be used to identify unknown solutions by comparison to the spectra of known solutions.
Question 1
At the top of the table displayed below is an absorbance spectrum of an unknown substance. Below the unknown spectrum are the absorbance spectra of four candidate substances that may be the unknown. Identify the unknown using the shape of its absorbance spectrum.
- 4 -

Unknown Sample
FD & C Blue #2 FD & C Red #2
FD & C Yellow #5 FD & C Yellow #6
The colour of a dye molecule depends on its structure, particularly on the grouping of certain atoms called "chromophores". Different chromophores absorb light at different wavelengths, giving rise to a variety of colours. Sometimes two dyes may contain the same chromophore and differ only in groups of atoms attached to that chromophore. The colours of these dyes are very much alike and difficult to tell apart visually. However, the minor structural differences are sufficient to produce subtle differences in the absorbance spectra of these dyes. Consider the structures of two dyes, Blue #1 and Green #3, provided below. Can you tell what the only difference is in the structure of these two dyes?
Blue #1 Green #3
Since similar dyes have similar spectra, you have to carefully compare the spectrum of your unknown to the spectra of known dyes with similar colour. In the laboratory, the program called ColourMixer displays spectra of three dyes on the computer screen at the same time, making the identification process quick and accurate.
In the spectrum below, is the Unknown dye Blue #1 or Green #3?
- 5 -

Notice that the highest bar appears at 620nm in the spectra of both Blue #1 and Green #3. Therefore, the identification is best achieved by comparing the relative heights of bars on both sides of that bar. This would be the bars at 605 and 644 nm in the spectra of the Blue #1 and Green #3.
Once an absorbance spectrum of a particular substance is available, and the identity of the substance has been established, its concentration in solution can also be measured by colourimetry. This analysis is based on Beer’s Law, which in simple terms relates the colour intensity of a solution to its concentration. More precisely, Beer’s Law states that A = l c, where A is the absorbance of the sample, is a substance- and wavelength-specific coefficient, l is the length the light travels through the sample, and c is the sample’s concentration. The box below summarizes the relationship of incident and transmitted light intensities, absorbance, and the concentration of a substance in solution.
First, the wavelength of maximal absorbance is chosen from the substance’s absorbance spectrum. This is called the analytical wavelength and is the wavelength at which Beer’s Law analysis is done.
Question 2
- 6 -

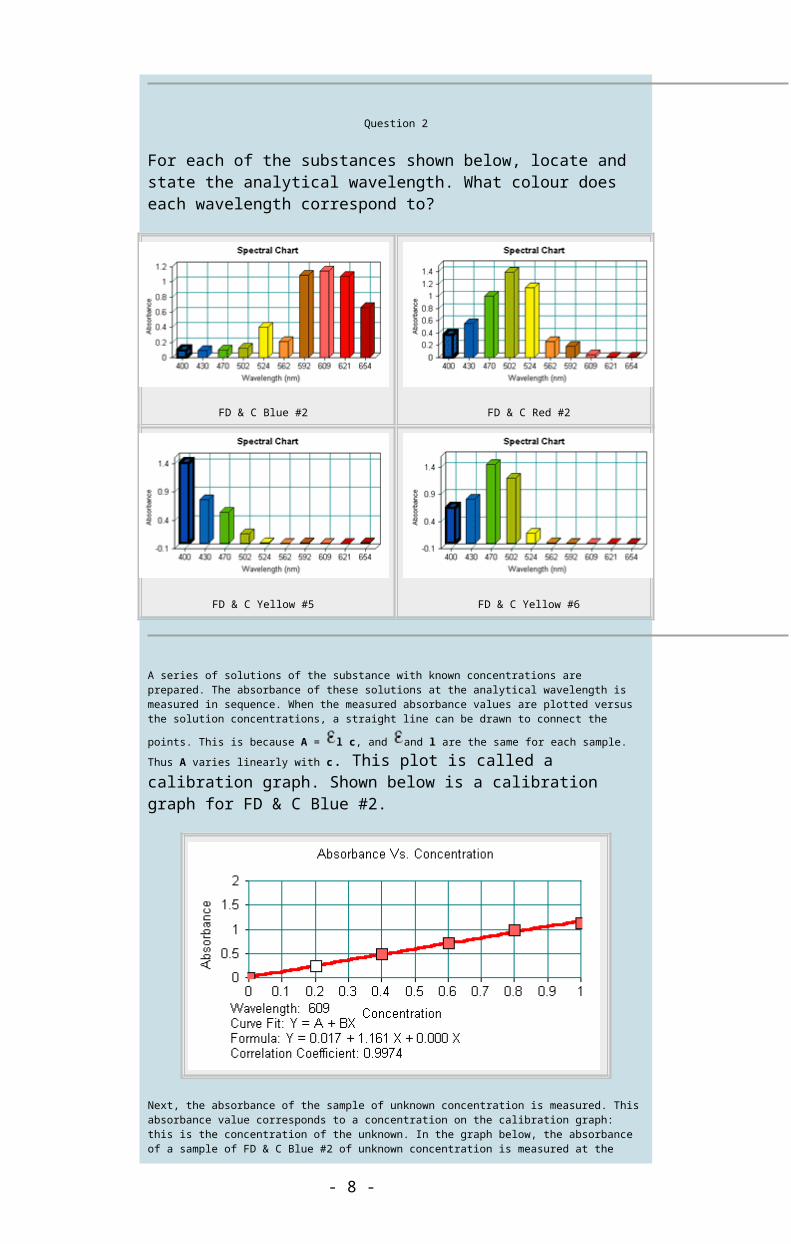
For each of the substances shown below, locate and state the analytical wavelength. What colour does each wavelength correspond to?
FD & C Blue #2 FD & C Red #2
FD & C Yellow #5 FD & C Yellow #6
A series of solutions of the substance with known concentrations are prepared. The absorbance of these solutions at the analytical wavelength is measured in sequence. When the measured absorbance values are plotted versus the solution concentrations, a straight line can be drawn to connect the points. This is because A = l c, and and l are the same for each sample. Thus A varies linearly with c. This plot is called a calibration graph. Shown below is a calibration graph for FD & C Blue #2.
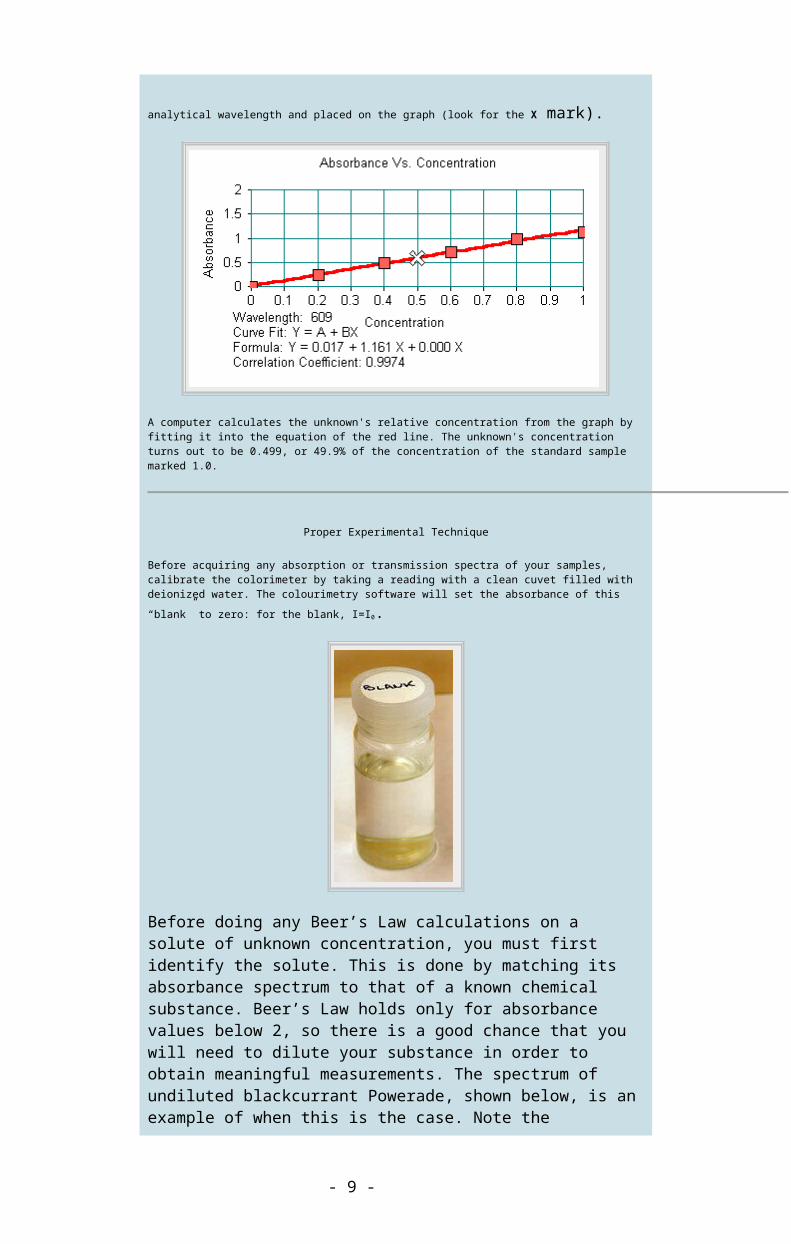
Next, the absorbance of the sample of unknown concentration is measured. This absorbance value corresponds to a concentration on the calibration graph: this is the concentration of the unknown. In the graph below, the absorbance of a sample of FD & C Blue #2 of unknown concentration is measured at the analytical wavelength and placed on the graph (look for the X mark).
- 7 -
A computer calculates the unknown's relative concentration from the graph by fitting it into the equation of the red line. The unknown's concentration turns out to be 0.499, or 49.9% of the concentration of the standard sample marked 1.0.
Proper Experimental Technique
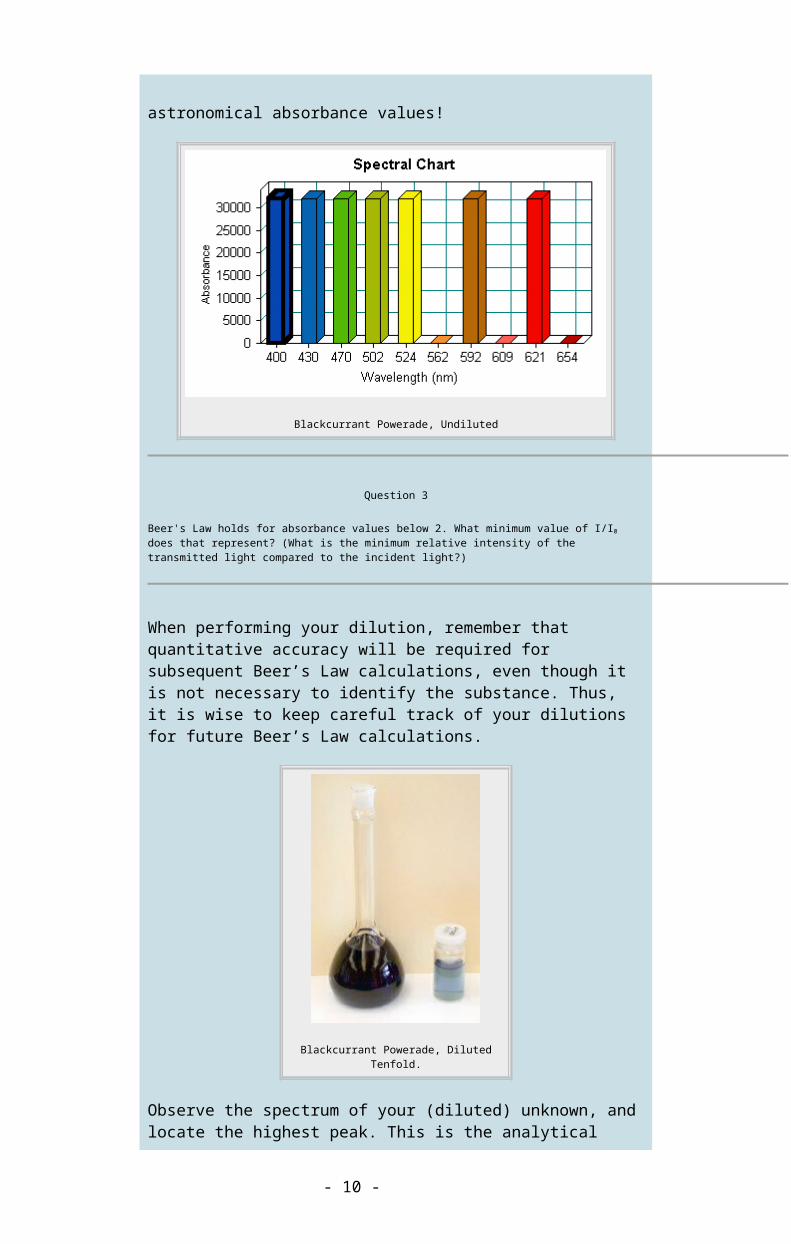
Before acquiring any absorption or transmission spectra of your samples, calibrate the colorimeter by taking a reading with a clean cuvet filled with deionized water. The colourimetry software will set the absorbance of this “blank” to zero: for the blank, I=I0.
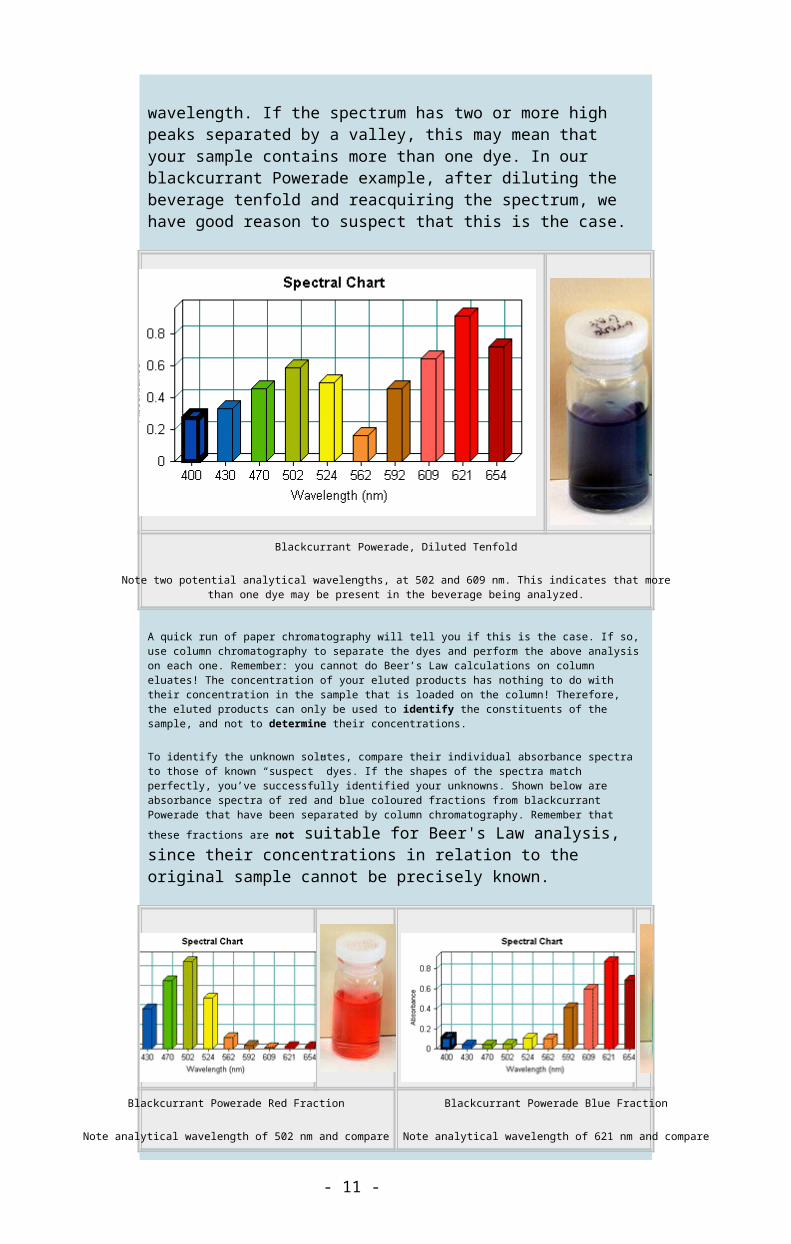
Before doing any Beer’s Law calculations on a solute of unknown concentration, you must first identify the solute. This is done by matching its absorbance spectrum to that of a known chemical substance. Beer’s Law holds only for absorbance values below 2, so there is a good chance that you will need to dilute your substance in order to obtain meaningful measurements. The spectrum of undiluted blackcurrant Powerade, shown below, is an example of when this is the case. Note the astronomical absorbance values!
- 8 -
Blackcurrant Powerade, Undiluted
Question 3
Beer's Law holds for absorbance values below 2. What minimum value of I/I0 does that represent? (What is the minimum relative intensity of the transmitted light compared to the incident light?)
When performing your dilution, remember that quantitative accuracy will be required for subsequent Beer’s Law calculations, even though it is not necessary to identify the substance. Thus, it is wise to keep careful track of your dilutions for future Beer’s Law calculations.
Blackcurrant Powerade, Diluted Tenfold.
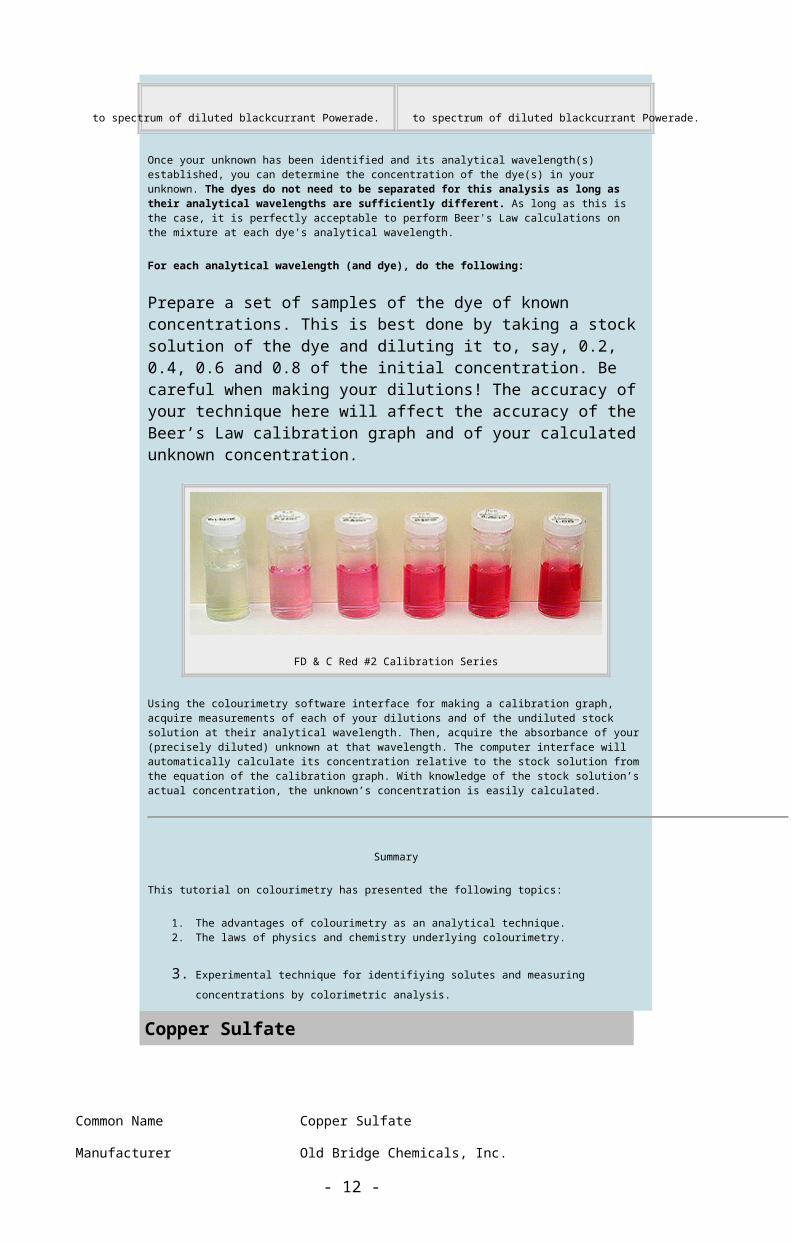
Observe the spectrum of your (diluted) unknown, and locate the highest peak. This is the analytical wavelength. If the spectrum has two or more high peaks separated by a valley, this may mean that your sample contains more than one dye. In our blackcurrant Powerade example, after diluting the beverage tenfold and reacquiring the spectrum, we have good reason to suspect that this is the case.
- 9 -
Blackcurrant Powerade, Diluted Tenfold
Note two potential analytical wavelengths, at 502 and 609 nm. This indicates that more than one dye may be present in the beverage being analyzed.
A quick run of paper chromatography will tell you if this is the case. If so, use column chromatography to separate the dyes and perform the above analysis on each one. Remember: you cannot do Beer’s Law calculations on column eluates! The concentration of your eluted products has nothing to do with their concentration in the sample that is loaded on the column! Therefore, the eluted products can only be used to identify the constituents of the sample, and not to determine their concentrations.
To identify the unknown solutes, compare their individual absorbance spectra to those of known “suspect” dyes. If the shapes of the spectra match perfectly, you’ve successfully identified your unknowns. Shown below are absorbance spectra of red and blue coloured fractions from blackcurrant Powerade that have been separated by column chromatography. Remember that these fractions are not suitable for Beer's Law analysis, since their concentrations in relation to the original sample cannot be precisely known.
Blackcurrant Powerade Red Fraction
Note analytical wavelength of 502 nm and compare to spectrum of diluted blackcurrant Powerade.
Blackcurrant Powerade Blue Fraction
Note analytical wavelength of 621 nm and compare to spectrum of diluted blackcurrant Powerade.
Once your unknown has been identified and its analytical wavelength(s) established, you can determine the concentration of the dye(s) in your unknown. The dyes do not need to be separated for this analysis as long as their analytical wavelengths are sufficiently different. As long as this is the case, it is perfectly acceptable to perform Beer's Law calculations on the mixture at each dye's analytical wavelength.
For each analytical wavelength (and dye), do the following:
Prepare a set of samples of the dye of known concentrations. This is best done by taking a stock solution of the dye and diluting it to, say, 0.2, 0.4, 0.6 and 0.8 of the initial concentration. Be careful when making your dilutions! The accuracy of your technique here will affect the accuracy of the Beer’s Law calibration graph and of your calculated unknown concentration.
- 10 -
FD & C Red #2 Calibration Series
Using the colourimetry software interface for making a calibration graph, acquire measurements of each of your dilutions and of the undiluted stock solution at their analytical wavelength. Then, acquire the absorbance of your (precisely diluted) unknown at that wavelength. The computer interface will automatically calculate its concentration relative to the stock solution from the equation of the calibration graph. With knowledge of the stock solution’s actual concentration, the unknown’s concentration is easily calculated.
Summary
This tutorial on colourimetry has presented the following topics:
1. The advantages of colourimetry as an analytical technique. 2. The laws of physics and chemistry underlying colourimetry.
3. Experimental technique for identifiying solutes and measuring concentrations by colorimetric analysis.
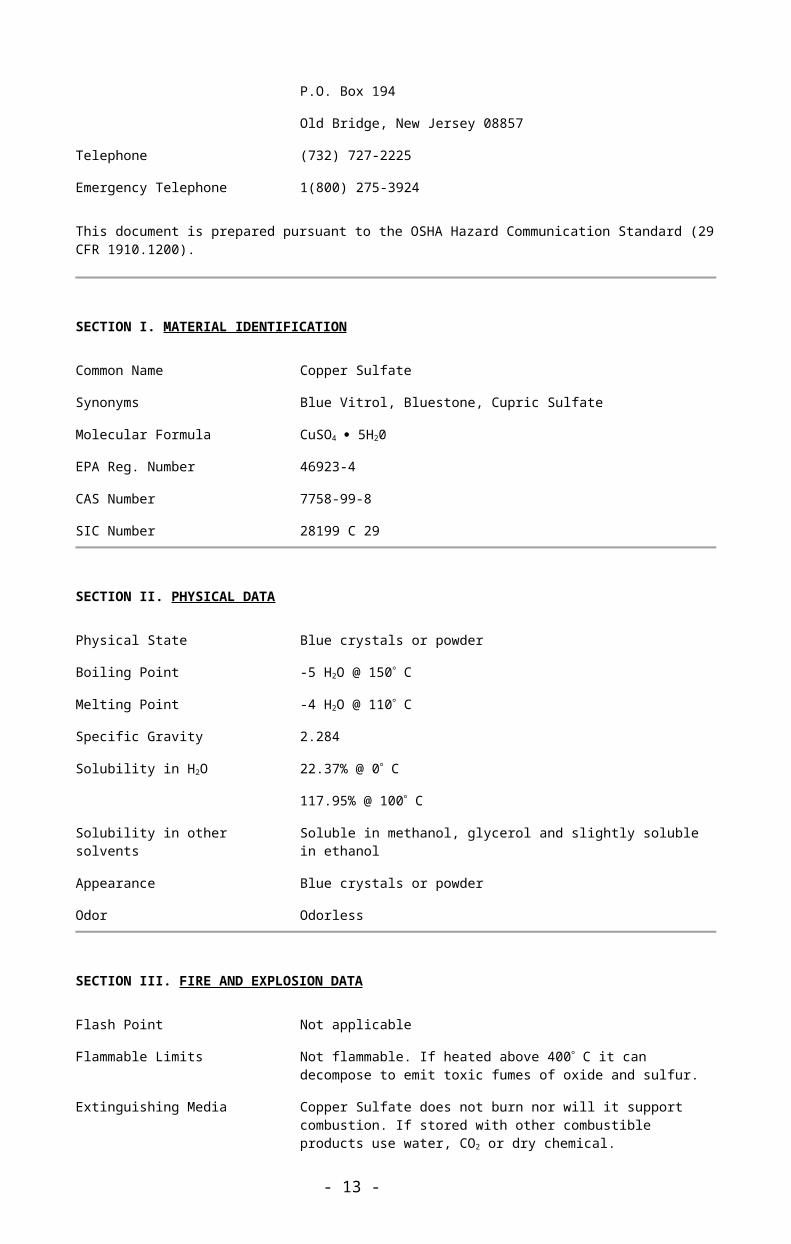
Copper Sulfate
Common Name Copper Sulfate
Manufacturer Old Bridge Chemicals, Inc.
P.O. Box 194
Old Bridge, New Jersey 08857
Telephone (732) 727-2225
Emergency Telephone 1(800) 275-3924
This document is prepared pursuant to the OSHA Hazard Communication Standard (29 CFR 1910.1200).
SECTION I. MATERIAL IDENTIFICATION
Common Name Copper Sulfate
Synonyms Blue Vitrol, Bluestone, Cupric Sulfate
Molecular Formula CuSO4 5H20
EPA Reg. Number 46923-4
CAS Number 7758-99-8
SIC Number 28199 C 29
- 11 -
SECTION II. PHYSICAL DATA
Physical State Blue crystals or powder
Boiling Point -5 H2O @ 150 C
Melting Point -4 H2O @ 110 C
Specific Gravity 2.284
Solubility in H2O 22.37% @ 0 C
117.95% @ 100 C
Solubility in other solvents Soluble in methanol, glycerol and slightly soluble in ethanol
Appearance Blue crystals or powder
Odor Odorless
SECTION III. FIRE AND EXPLOSION DATA
Flash Point Not applicable
Flammable Limits Not flammable. If heated above 400 C it can decompose to emit toxic fumes of oxide and sulfur.
Extinguishing Media Copper Sulfate does not burn nor will it support combustion. If stored with other combustible products use water, CO2 or dry chemical.
Special Fire Fighting Instructions If dry heated above 600 C, SO2 is evolved. If water is used it will solubalize the Copper Sulfate and care should be taken to keep such water out of streams or other water bodies.
Fire and Explosion Hazards None
SECTION IV. REACTIVITY DATA
Stability Stable
Conditions to Avoid Product is highly soluble, but does not react with water.
Incompatibility None know when product remains dry. Product readily dissolves in water. Solutions are mildly corrosive to steel. Store solutions in plastic or rubber or 304, 347 or 316 stainless steel. Iron and moisture should be avoided. Store in a dry area. With exposure to air it will oxidize and turn whitish.
Hazardous Decomposition Products
None at normal production temperatures and pressures. If dry heated above 600 C toxic sulfur may evolve.
Polymerization Will not occur.
SECTION V. HEALTH AND HAZARD INFORMATION
Swallowing Toxic orally in accordance with FHSLA regulations. Acute oral LD50 (male rats) = 472 mg/kg.
Skin Non-toxic. Skin irritation index is zero in accordance with FHSLA regulations.
Eyes Corrosive in accordance with FHSLA regulations. Eye irritation score: 24 hours = 41.67; 48 hours = corrosive
- 12 -
Inhalation Inhalation of dust may cause irritation to the upper respiration tract.
Carcinogenicity None as per NTP, OSHA, and IARC.
This product contains Copper Sulfate subject to the reporting requirements of Section 13 of the Emergency Planning and Community-right-to-Know-Act of 1986 (40 CFR 372).
SECTION VI. FIRST AID PROCEDURES
Swallowing Give large amounts of milk or water. Induce vomiting. Call Poison Control Center or a physician.
Skin Wash thoroughly with soap and water. Remove and wash contaminated clothing before reuse.
Eyes Immediately flush eyes with plenty of water for 15 minutes. Hold eyelids apart during irrigation. Call a physician.
Inhalation Remove person to fresh air and call a physician.
Carcinogenicity None
SECTION VII. HANDLING PRECAUTIONS
Personal Protective Equipment Chemical safety goggles. Rubber gloves and rubber apron may be worn.
Ventilation TWA = 1 mg/l for Copper Sulfate. When TWA exceeds this limit in the workplace, provide appropriate ventilation. Wear an approved respirator for dusts or mists: MSHA/NIOSH approved number prefix TC-21C, or a NIOSH approved respirator with any R, P or HE filter.
Alternatively, provide respiratory protection equipment in accordance with Paragraph 1910.134 of Title 29 of the Code of Federal Regulations.
SECTION VIII. ENVIRONMENTAL AND DISPOSAL INFORMATION
Aquatic Toxicity LC50, 24 hours, Daphnia magna equals 0.182 mg/l. Rainbow Trout equals 0.17 mg/l. Blue Gill equals 1.5 mg/l. All values are expressed as Copper Sulfate Pentahydrate. Test water was soft.
Spills and Leaks Comply with Federal, State and local regulations on reporting spills. Do not wash away crystals or powder. Recover dry if possible. If product is in a confined solution, react with soda ash to form an insoluble Copper Carbonate solid that can be scooped up.
Waste Disposal Do not reuse container. Comply with Federal, State and local regulations. Sweep up crystals, powder or insoluble Copper Carbonate and dispose of in an approved landfill.
Environmental Effects May be dangerous if it enters the public water systems. Follow local regulation. Toxic to fish and plants. Fish toxicity critical concentration is 235 mg/l and plant toxicity is 25 mg/l.
SECTION IX. SPECIAL PRECAUTIONS
Storage Store in a dry place.
- 13 -

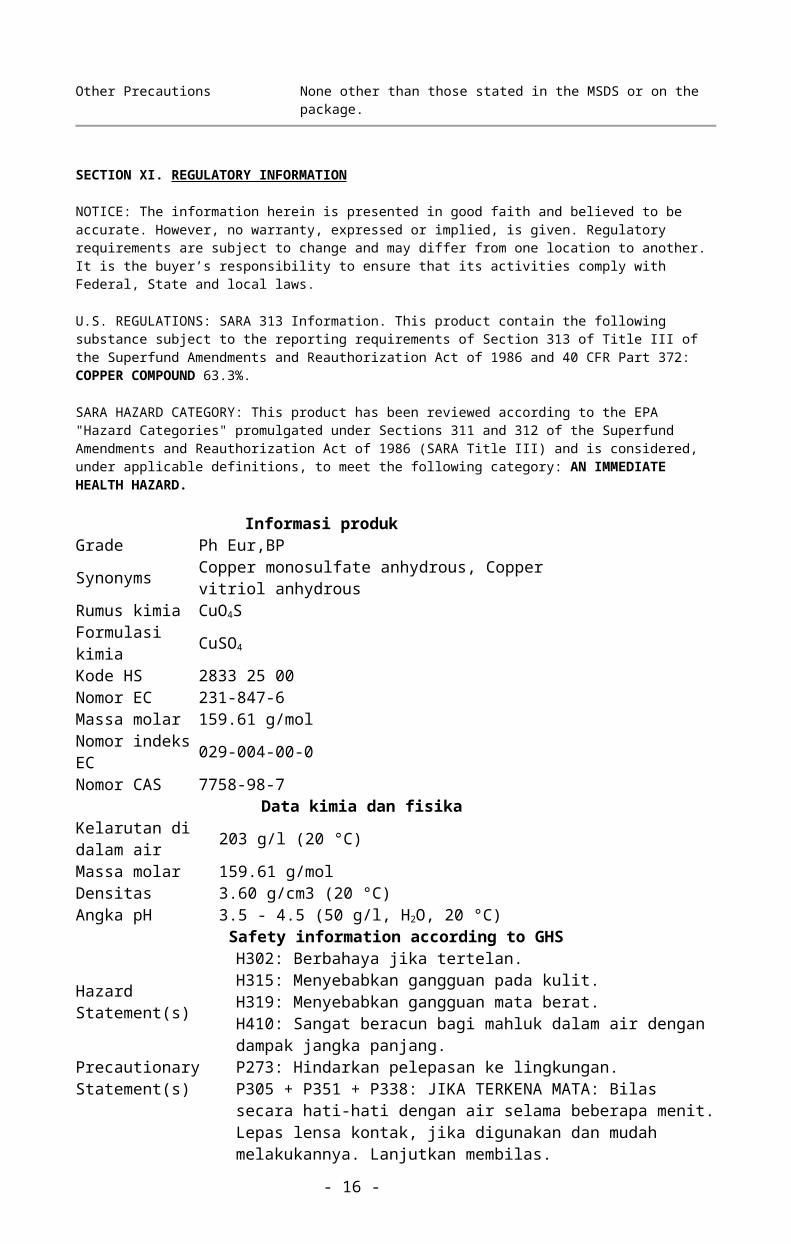
Other Precautions None other than those stated in the MSDS or on the package.
SECTION XI. REGULATORY INFORMATION
NOTICE: The information herein is presented in good faith and believed to be accurate. However, no warranty, expressed or implied, is given. Regulatory requirements are subject to change and may differ from one location to another. It is the buyer’s responsibility to ensure that its activities comply with Federal, State and local laws.
U.S. REGULATIONS: SARA 313 Information. This product contain the following substance subject to the reporting requirements of Section 313 of Title III of the Superfund Amendments and Reauthorization Act of 1986 and 40 CFR Part 372: COPPER COMPOUND 63.3%.
SARA HAZARD CATEGORY: This product has been reviewed according to the EPA "Hazard Categories" promulgated under Sections 311 and 312 of the Superfund Amendments and Reauthorization Act of 1986 (SARA Title III) and is considered, under applicable definitions, to meet the following category: AN IMMEDIATE HEALTH HAZARD.
Informasi produk Grade Ph Eur,BP Synonyms Copper monosulfate anhydrous, Copper vitriol anhydrous Rumus kimia CuO4S Formulasi kimia CuSO4 Kode HS 2833 25 00 Nomor EC 231-847-6 Massa molar 159.61 g/mol Nomor indeks EC 029-004-00-0 Nomor CAS 7758-98-7
Data kimia dan fisika Kelarutan di dalam air 203 g/l (20 °C) Massa molar 159.61 g/mol Densitas 3.60 g/cm3 (20 °C) Angka pH 3.5 - 4.5 (50 g/l, H2O, 20 °C)
Safety information according to GHS
Hazard Statement(s)
H302: Berbahaya jika tertelan.H315: Menyebabkan gangguan pada kulit.H319: Menyebabkan gangguan mata berat.H410: Sangat beracun bagi mahluk dalam air dengan dampak jangka panjang.
Precautionary Statement(s)
P273: Hindarkan pelepasan ke lingkungan.P305 + P351 + P338: JIKA TERKENA MATA: Bilas secara hati-hati dengan air selama beberapa menit. Lepas lensa kontak, jika digunakan dan mudah melakukannya. Lanjutkan membilas. P302 + P352: JIKA TERKENA KULIT: Cuci dengan banyak sabun dan air.
Signal Word Peringatan
Hazard Pictogram(s)
RTECS GL8800000 Kelas penyimpanan 10 - 13 Cairan dan padatan lain WGK WGK 3 sangat berbahaya untuk air Disposal 15
Larutan dan padatan yangmengandung logam berat : Wadah E. Aduk nikel Raney (juga: nikel Urushibara) di dalam bentuk larutan suspensi ke dalam asam klorida (Item No. 100312) sampai larut (Wadah E). Baik nikel Raney maupun filter residunya tidak boleh dibiarkan mengering, jika terjadi dapat
- 14 -

menyala secara spontan di udara terbuka. Di dalam konteks ini, logam berat yang dimaksud adalah segala senyawa dari antimoni, arsenik, kadmium, chromium(VI), tembaga, timbal, nikel dan timah, termasuk zat-zat/senyawa-senyawa di dalam bentuk metal, jika mereka diklasifikasikan ke dalam kategori bahaya (menurut AbfallverzeichnisV - Peraturan Kalatog Limbah, Appendiks 3). Logam berat lainnya harus dikumpulkan secara terpisah.
Informasi keselamatan kerja
Frase R
R 22-36/38-50/53Berbahaya jika tertelan.Mengiritasi mata dan kulit.Sangat beracun untuk organisme air, dapat menyebabkan efek merugikan jangka-panjang dalam lingkungan air.
Frase S
S 22-60-61Jangan menghirup debu.Bahan ini dan/atau wadah harus dibuang sebagai limbah berbahaya.Hindari pelepasan/tumpah ke lingkungan. Rujuklah petunjuk khusus/lembar data keselamatan.
Jenis-jenis bahaya berbahaya, mengiritasi, berbahaya bagi lingkungan
Hazard Symbol Harmful
Dangerous for the environment Informasi Transportasi
Pernyataan (jalur kereta api dan jalan raya) ADR, RRID
UN 3288 Giftiger anorganischer fester Stoff, n.a.g.(KUPFER(II)-SULFAT), 6.1, III
Pernyataan (transportasi melalui laut) Kode-IMDG
UN 3288 TOXIC SOLID, INORGANIC, N.O.S.(COPPER(II)-SULPHATE), 6.1, III, Segregation Group: 7 (Heavy metals and their salts (including their organometallic compounds))
Pernyataan (transportasi melalui udara) IATA-DGR
UN 3288 TOXIC SOLID, INORGANIC, N.O.S.(COPPER(II)-SULPHATE), 6.1, III
Data toksikologis LD 50 tertelan LD50 tikus 300 mg/kg
Spesifikasi-spesifikasi Assay (iodometric, calc. on dried substance) 99.0 - 101.0 %
Identity passes testAppearance of solution passes testChloride (Cl) ≤ 0.015 %Ca (Calcium) ≤ 0.005 %Fe (Iron) ≤ 0.003 %K (Potassium) ≤ 0.01 %Na (Sodium) ≤ 0.02 %Ni (Nickel) ≤ 0.005 %Pb (Lead) ≤ 0.00800 %Zn (Zinc) ≤ 0.03 %Residual solvents (Ph.Eur./ICH) excluded by manufacturing process
Loss on drying (250 °C) ≤ 1.0 %
- 15 -
- 16 -

- 17 -