colonial first state investments listening?
TRANSCRIPT


Colonial First State Investments
Resources – Should I still be listening?
Dr Joanne Warner Senior Portfolio Manager, Global ResourcesMatthew Webb National Manager, Investments
This presentation is given by a representative of Colonial First State Investments Limited AFS Licence 232468, ABN 98 002 348 352 (Colonial First State). The presenter does not receive specific payments or commissions for any advice given in this presentation. The presenter, other employees and directors of Colonial First State receive salaries, bonuses and other benefits from it. Colonial First State receives fees for investments in its products. For further detail please read our Financial Services Guide (FSG) available at colonialfirststate.com.au or by contacting our Investor Service Centre on 13 13 36.
All products are issued by Colonial First State. Product Disclosure Statements (PDSs) describing the products are available from Colonial First State. The relevant PDS should be considered before making a decision about any product.
This presentation is intended for adviser use only and does not take into account a client’s individual objectives, financial situation or needs. You should assess whether the information is appropriate for your clients and make sure they consider talking to a financial adviser before making an investment decision. Stocks mentioned should not be considered as recommendations.
The information is taken from sources which are believed to be accurate but Colonial First State accepts no liability of any kind to any person who relies on the information contained in the presentation.
Past performance is no indication of future performance.
This presentation cannot be used or copied in whole or part without our express written consent.
© Colonial First State Investments Limited 2006.
Disclaimer

Agenda
g Market update
g What does China mean for resources?
g Our solution
g Our process
g How resources fit in a portfolio

+5 year bull market in Resources
Compound annual returns
Source: Colonial First State Investments Ltd, RimesAll returns in AUD before fees for Wholesale Global Resources Fund
31 July 2006Before fees 3 6 1 2 3 5 7AUD Mths Mths Year Years Years Years YearsWholesale Global Resources Fund -7.0% 0.8% 42.6% 35.6% 34.6% 23.8% 24.0%
HSBC Global Mining Accumulation index -6.1% 6.0% 60.6% 40.8% 35.3% 20.9% 19.7%
S&P/ASX 300 Resources Accumulation index -5.3% 4.6% 41.0% 43.2% 40.5% 26.5% 22.0%
MSCI World Energy index (Net) 0.1% 1.4% 21.1% 24.7% 25.2% 7.3% 9.6%
Performance - before fees (AUD)

On the back of increased commodity prices stock prices have risen strongly…
0
50
100
150
200
250
300
350
400
May-03 Aug-03 Nov-03 Feb-04 May-04 Aug-04 Nov-04 Feb-05 May-05 Aug-05 Nov-05 Feb-06 May-06
MSCI All Countries World Information Technology Index (lagged 6 years)
HSBC Global Mining Index
Source: Bloomberg, HSBC, MSCI. 3 Years ending 31 May 2006, All data in USD.
Technology Index (lagged 6 years)
Global Mining Index

Is this a bubble?
Rio Tinto - Price vs Consensus Earnings

5 year move in base metal prices
copper
zincnickellead
aluminium
400
300
200
100
Index

ABN-AMRO Base Metal Price Index 34 years (nominal)
34 YEAR ABN-AMRO BASE METAL PRICE INDEX (Nominal - Money of the Day) ABN AMRO Base Metal Price Index now at all time high up 340% since October 2001 price low
0
25
50
75
100
125
150
175
200
225
250
275
300
72 73 74 75 76 77 78 79 80 81 82 83 84 85 86 87 88 89 90 91 92 93 94 95 96 97 98 99 00 01 02 03 04 05 06 07 08
Low Nov. 1993(Index = 67)
Low Dec. 1982(Index = 56)
Low Nov. 1977(Index = 54)
Low Nov. 1972 (Index value = 41)
Low Dec. 1986(Index = 60)
Peak April 1974(Index = 83)
Peak Feb. 1980(Index = 110)
Peak Aug. 1983Up 50%; Down 29%
(Index 84)
Peak Jan. 1995(Index = 127)
Low Dec. 1998(Index = 66)
Peak March 2000(Index = 105)
Trough October 2001(Index = 68)
ABN-AMRO Base Metal Price Index Consumption Value Weightings
January 2000 =100Al 43%, Cu 30%, Ni 11%, Zn 11%, Pb 3%, Sn 2%
"First Oil Shock" Boom duration 17 mths. Trough to peak 102%. Peak to trough 40%
"Second Oil Shock" Boom duration 27 mths.
Up 103%; Down 49%
Stock Market Crash of Oct.1987 Twin Peaks June 88 & Jan. 89
Duration 18mths Up 195%; Down 62%(Index value = 178)
Dissolution of Soviet Union. Massive Inventory Build, MOU Duration 14
mths.Up 89%; Down 48%
Asian Crisis Boom duration 15 mths.
Up 59%; Down 35%
Not a super cycle a VESUVIAN cycle!Liquidity driven boom. Acute fund attention on back of low inventory, tardy supply response and China syndrome Duration 56 mths, up 340% (Index value = 300)
Source: Nick Moore, Commodity Analyst, ABN-AMRO, June 2006

Outlook for the sector
g Economic growth drives demand
g Production growth continues to disappoint – expect disruptions and shortages to continue for some time yet
g Low inventories make prices vulnerable to spikes – also likely to stimulate further substitution
g Speculators are pushing prices higher introducing added volatility and risk
g Consolidation should improve shareholder returns and enhance corporate discipline
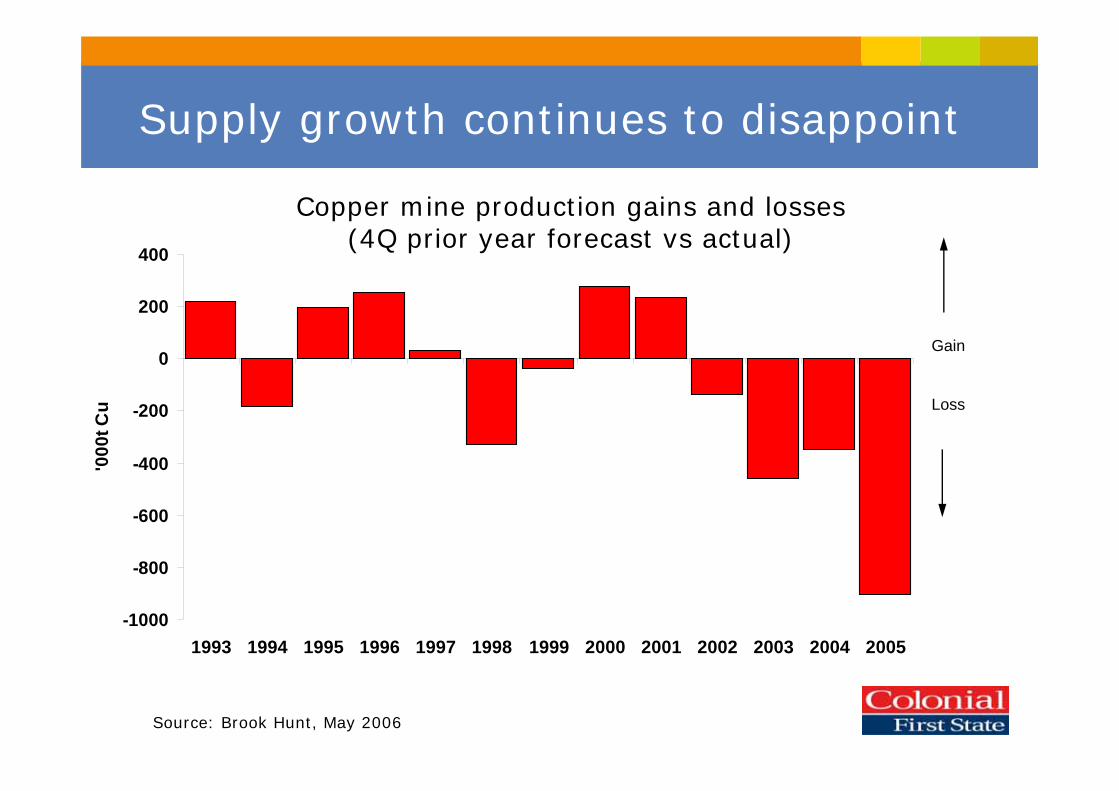
Supply growth continues to disappoint
-1000
-800
-600
-400
-200
0
200
400
1993 1994 1995 1996 1997 1998 1999 2000 2001 2002 2003 2004 2005
'000
t Cu
Gain
Loss
Copper mine production gains and losses (4Q prior year forecast vs actual)
Source: Brook Hunt, May 2006

Investment fund inflows into commodities have lowered inventories and added to price rises
Total Commodity Index Funds
0
10
20
30
40
50
60
70
80
1990
1991
1992
1993
1994
1995
1996
1997
1998
1999
2000
2001
2002
2003
2004
2005
$USb
n
Index funds - share of cash-three month open interest on LME
0%
5%
10%
15%
20%
25%
30%
35%
40%
copper Aluminium Zinc Nickel Lead
% o
f tot
al
2001 2002 2003 2004 2005
Source: Macquarie Research estimates, May 2006Source: Macquarie Research estimates, May 2006
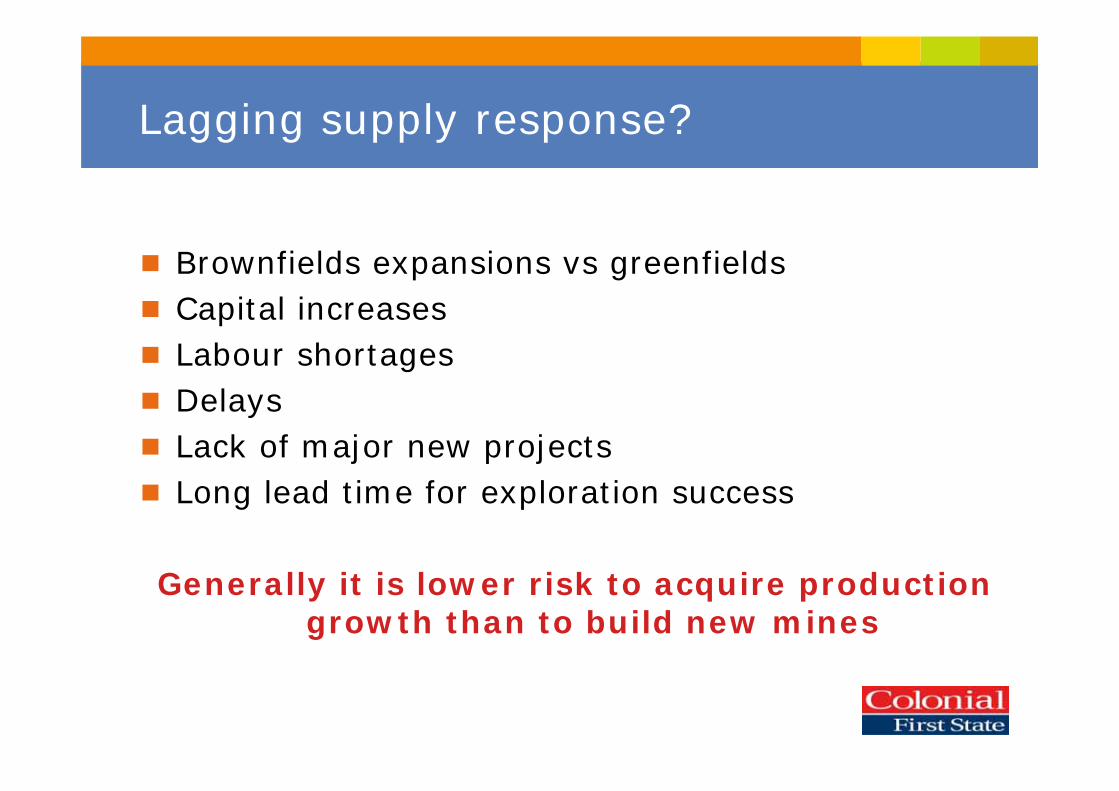
Lagging supply response?
g Brownfields expansions vs greenfieldsg Capital increasesg Labour shortagesg Delaysg Lack of major new projectsg Long lead time for exploration success
Generally it is lower risk to acquire production growth than to build new mines

Greater consolidation –> more supply side discipline?
1996 28 companies
US$132bn
2005 15 companies
US$423bn
Source: Falconbridge
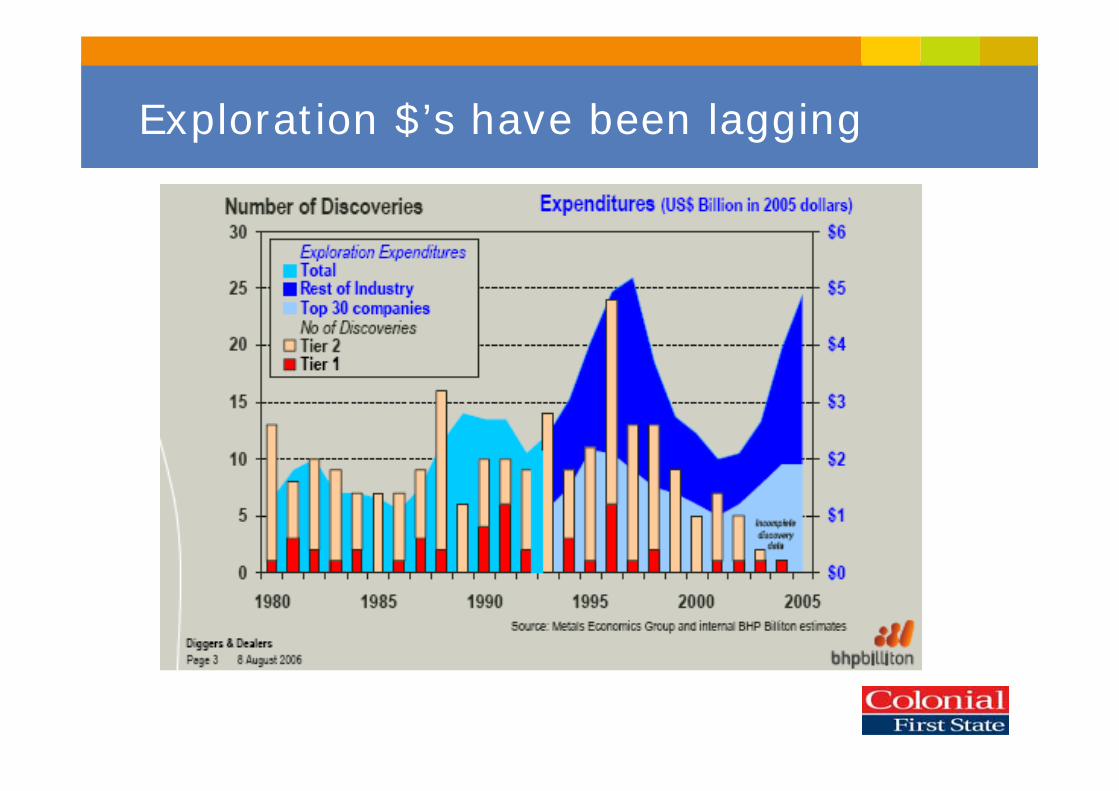
Exploration $’s have been lagging

Why are the miners so serious about China?
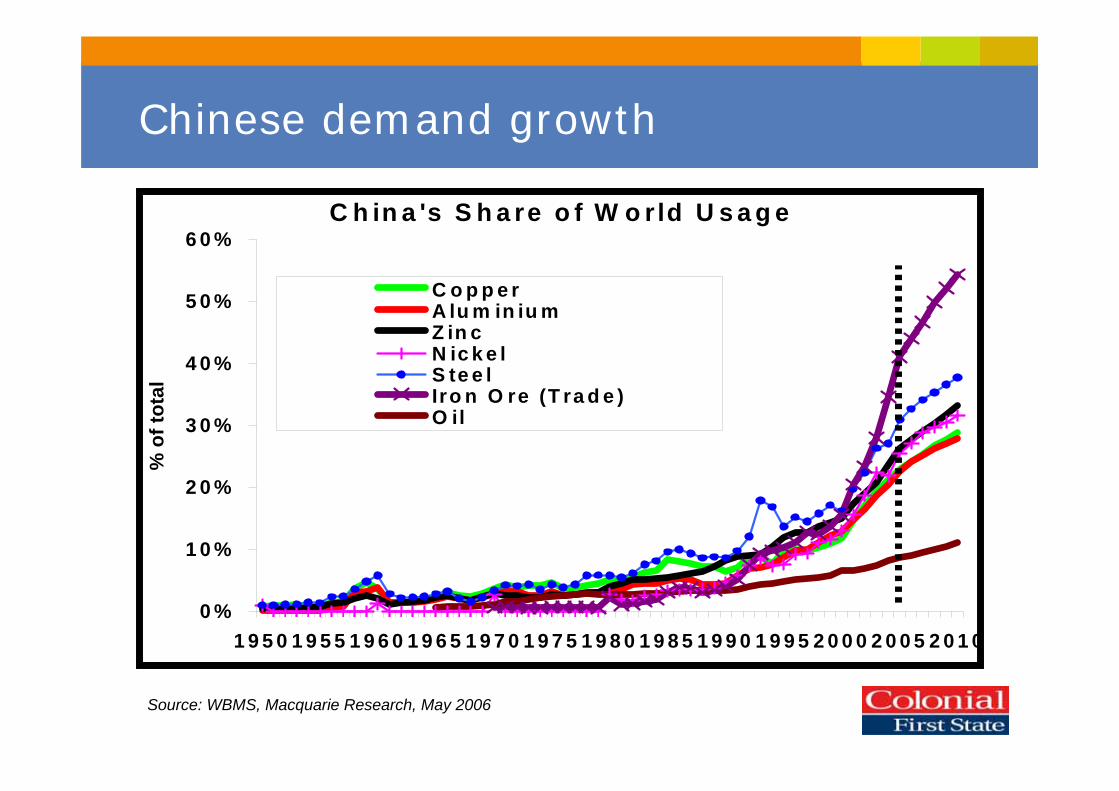
Chinese demand growth
Source: WBMS, Macquarie Research, May 2006
C h in a 's S h a re o f W o r ld U s a g e
0 %
1 0 %
2 0 %
3 0 %
4 0 %
5 0 %
6 0 %
1 9 5 0 1 9 5 5 1 9 6 0 1 9 6 5 1 9 7 0 1 9 7 5 1 9 8 0 1 9 8 5 1 9 9 0 1 9 9 5 2 0 0 0 2 0 0 5 2 0 1 0
% o
f tot
al
C o p p e rA lu m in iu mZ in cN ic k e lS te e lIro n O re (T ra d e )O il

China’s metal intensity is growing…
CHINA
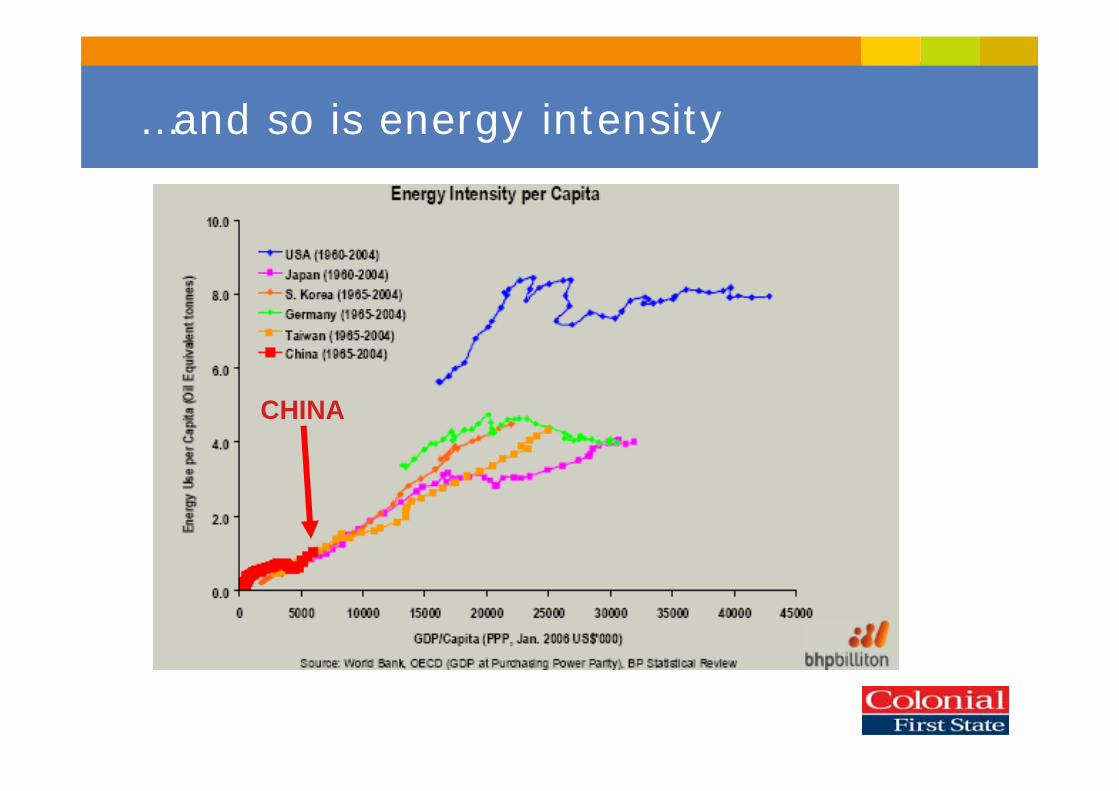
…and so is energy intensity
CHINA

Urbanisation, China 2005 - 2010
About 100 million new urban dwellers in five years. . . and another 300 million by 2020
g Housing
g Road & Rail
g Power
g Water
Source: Research Works, May 06

Chinese urbanisation
* Tier 1 city defined as registered population >4.5m and GDP/capita > US$3,000, Tier 2 city defined as either registered population >4.5m or GDP/capita > US$3,000, Tier 3 city defined as registered population 1.5-4.5m and GDP/capita US$1,500 – US$3,000. Source: WEFA-WMM; China macro model; Mckireey analysis; BHP Billiton.

Colonial First State Investments
Our approach

Things we get excited about
g World class assets
g Low cost producers
g Organic EPS growth
g Strong financials
g Strong management
Quality companies + growth = superior returns with lower risk

Investing in the lower half of the cost curve
0
50
100
150
200
250
300
0 500 1000 1500Cumulative Production (Au t)
US$/oz
Barrick (4.9%) Harmony
AVOID
BUY
GOLD COST CURVE

The tyres we’ve kicked
As at 31/12/05
Since inception 650+ mine and site visits to 48 countries
Average - 71 per year

Long Only Fund - Portfolio breakdown
Metals, 21.2%
Diversif ied, 29.6%
Other, 8.5%Coal, 7.3%
Gold, 17.7%
Energy, 16.2%
Wholesale Global Resources Fund As at 30 June 2006
Canada, 23%
USA, 13%
Brazil, 11%Australia,
22%
UK, 20%
Hong Kong, 7%
Peru, 1%South Africa, 5%
Long tail of 40-45 smaller growth stocks
-2.0%
0.0%
2.0%
4.0%
6.0%
8.0%
10.0%
12.0%
0 20 40 60
= $A 20 billion
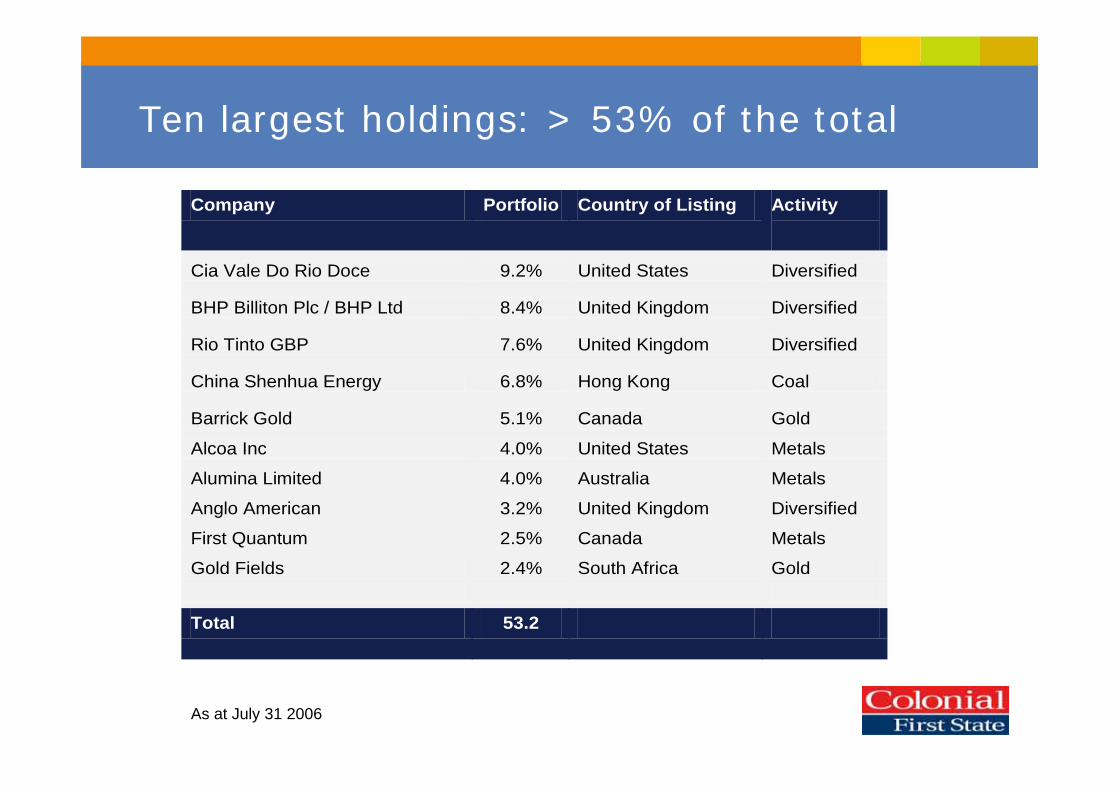
Company Portfolio Country of Listing Activity
Cia Vale Do Rio Doce 9.2% United States Diversified
BHP Billiton Plc / BHP Ltd 8.4% United Kingdom Diversified
Rio Tinto GBP 7.6% United Kingdom Diversified
China Shenhua Energy 6.8% Hong Kong Coal
Barrick Gold 5.1% Canada Gold
Alcoa Inc 4.0% United States Metals
Alumina Limited 4.0% Australia Metals
Anglo American 3.2% United Kingdom Diversified
First Quantum 2.5% Canada Metals
Gold Fields 2.4% South Africa Gold Total 53.2
Ten largest holdings: > 53% of the total
As at July 31 2006
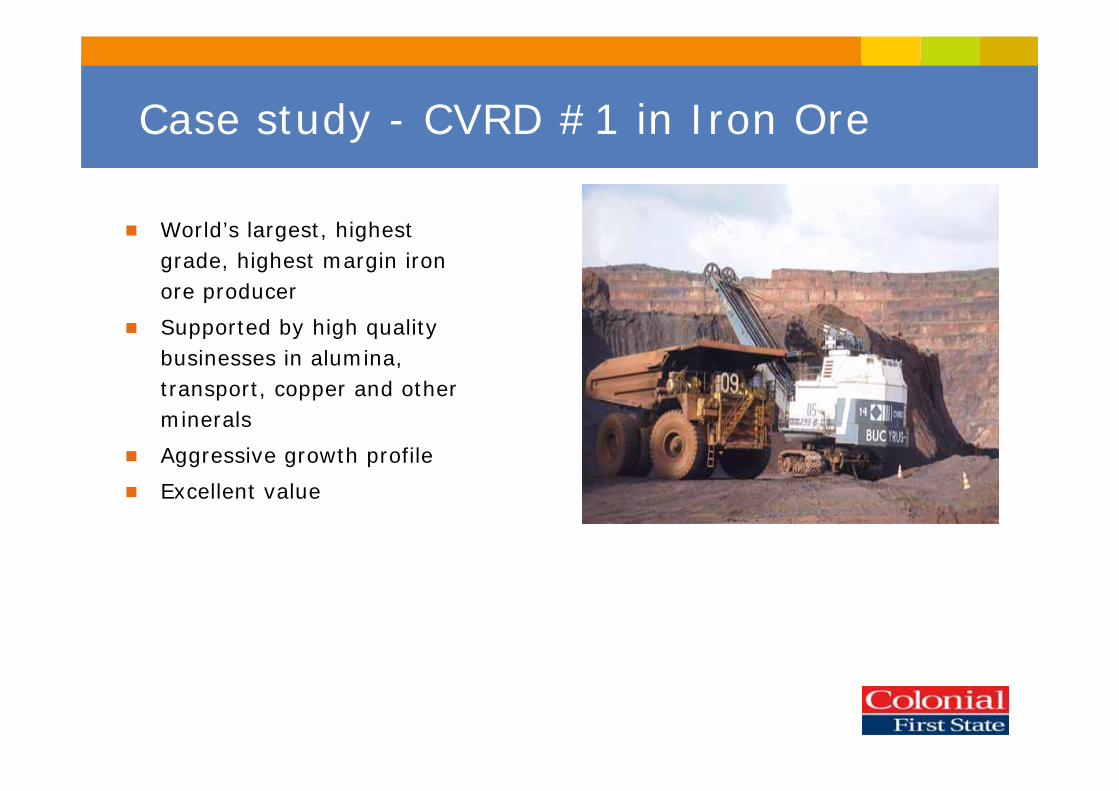
Case study - CVRD #1 in Iron Ore
g World’s largest, highest grade, highest margin iron ore producer
g Supported by high quality businesses in alumina, transport, copper and other minerals
g Aggressive growth profile
g Excellent value

Low cost expansions
Source: CVRD

An outstanding pipeline of future projects
Source: CVRD
?
?

Quality stocks have generated strong returns in falling markets
Source: Colonial First State, HSBC. Data is before fees for life of fund to 30 June 2006. Fund Inception: June 1997
M onths of Outperformance (%)
0%
10%
20%
30%
40%
50%
60%
70%
80%
Al l Mar kets Rising Mar kets Fal l ing Mar kets
1.19%- Falling Markets
-0.35%- Rising Markets
0.26%Monthly Average Excess Return
0.85Beta
0.55%Information Ratio
7.56%Tracking Error
4.18%Annual Excess Return

Resources offer low correlation with other sectors
Source: Datastream, Colonial First State. 10 Years ending 31 May 2006, all data in USD. Correlation co-efficients: HSBC Global Mining Index vs MSCI Sub Indices
0.0
0.1
0.2
0.3
0.4
0.5
0.6
0.7
0.8
0.9
1.0M
SCI W
orld
Nas
daq
Ener
gy
Mat
eria
ls
Indu
stria
ls
Con
sD
iscr
etio
nary
Con
s St
aple
s
Hea
lth C
are
Fina
ncia
ls IT
Tele
com
Serv
ices
Util
ities

Efficient frontier
Source: Bloomberg, HSBC, MSCI. Data in AUD, 15 Years ending 30 June 2006.
6.00%
7.00%
8.00%
9.00%
10.00%
11.00%
12.00%
13.00%
10.00% 11.00% 12.00% 13.00% 14.00% 15.00% 16.00% 17.00% 18.00% 19.00% 20.00%
Annual Volatility (% pa)
Ann
ual R
etur
n (%
pa)
100% MSCI AC World Free Index
100% HSBC Global Mining Index
20% HSBC/80% MSCI

Outlook
g Global commodity supply has tightened
g Few greenfield projects in the wings
g Chinese demand likely to continue
g US and European demand?
Compound annual returns
31 July 2006 Oct-04 Oct-03 Oct-02 Oct-00 Oct-98
After fees 1 2 3 5 7AUD Year Years Years Years YearsWholesale Global Resources Fund 42.6% 35.6% 34.6% 23.8% 24%

Focus on Quality

Which session are you in?1. PIMCO2. Principal Global Investors3. Colonial First State4. Deutsche Asset Management5. Challenger Financial Services
Gizmo time
Please rate the overall quality of this session…1. awful2. Poor3. Mediocre4. Good5. Very good6. Great!
Gizmo time