colloids and surfaces b: biointerfaces - city university of … · · 2012-01-17colloids and...
TRANSCRIPT
Colloids and Surfaces B: Biointerfaces 89 (2012) 79– 85
Contents lists available at SciVerse ScienceDirect
Colloids and Surfaces B: Biointerfaces
jou rn al h om epage: www.elsev ier .com/ locate /co lsur fb
Synthesis, dispersion, and cytocompatibility of graphene oxide and reduced
graphene oxide
Malgorzata Wojtoniszaka,∗ , Xuecheng Chena , Ryszard J. Kalenczuka , Anna Wajdab , Joanna Łapczukb ,Mateusz Kurzewskib, Marek Drozdzikb, Pual K. Chuc, Ewa Borowiak-Palena
a Westpomeranian University of Technology in Szczecin, Department of Environmental and Chemical Engineering, Pulaskiego 10, 70-322 Szczecin, Polandb Pomeranian Medical University, Department of Pharmacokinetics and Therapeutic Drug Monitoring, Powstanców Wlkp. 72 Av., 70-111 Szczecin, Polandc Department of Physics and Materials Science, City University of Hong Kong, Tat Chee Avenue, Kowloon, Hong Kong, China
a r t i c l e i n f o
Article history:
Received 30 June 2011
Received in revised form 30 August 2011
Accepted 30 August 2011
Available online 7 September 2011
Keywords:
Graphene oxide
Graphene
In vitro toxicology
a b s t r a c t
The synthesis, characterization, and toxicity of graphene oxide and reduced graphene oxide are reported.
Prior to the cytocompatibility tests the stability of the suspensions in a wide range of concentrations
(3.125-100 �g/mL) of three different dispersants is studied. Polyethylene glycol (PEG), polyethylene
glycol–polypropylene glycol–polyethylene glycol (Pluronic P123), and sodium deoxycholate (DOC) are
investigated as the dispersants. The toxicity depends on the type of dispersant and concentration of the
nanomaterials in the suspensions. Detailed analysis suggests that graphene oxide functionalized with
PEG in the concentration range between 3125 �g/mL and 25 �g/mL exhibits the best biocompatibility
with mice fibroblast cells (line L929).
© 2011 Elsevier B.V. All rights reserved.
1. Introduction
Recently, graphene and its derivatives have been investigated
extensively. This is due its exceptional mechanical, electrical,
thermal and optical properties, high surface area-to-volume
ratio, and unique atomic structure. Therefore, many applica-
tions are expected, for instance, electronic devices, composites
and nanomedicine [1–5]. Although carbon nanotubes have been
widely investigated in the biomedical field such as drug delivery,
biosensing, and molecular imaging [6–8], biomedical properties
like pharmacokinetics, toxicity, and cytocompatibility of graphene
and graphene oxide have not been systematically explored. Yang
et al. [9] have reported pharmacokinetics and biodistribution of
graphene functionalized with PEG (polyethylene glycol) and exam-
ined the toxicity in mice. Their results reveal that graphene/PEG
does not induce appreciable toxicity at an administered dose of
20 mg/kg for 3 months. PEGylated graphene oxide in a physiolog-
ical solution has been employed in cell imaging and drug delivery
[10,11]. Wang et al. [12] have suggested dose- and time-dependent
cytotoxicity of graphene oxide, which can enter the cytoplasm and
nucleus, decrease cell adhesion, and induce apoptosis. In spite of
previous studies, the systematic investigation on the preparation
and monitoring of the stability of graphene or graphene oxide sus-
∗ Corresponding author. Tel.: +48 914494772.
E-mail address: [email protected] (M. Wojtoniszak).
pensions in different dispersants are still required. Therefore, in
this paper we report the synthesis of graphene oxide and reduced
graphene oxide as well as stable suspension formation in differ-
ent dispersants. The concentration effects on mice fibroblast cells
(L929) are also investigated. As a result of this study the most bio-
compatible system based on graphene derivative is proposed.
2. Materials and methods
Graphene oxide (GO) was synthesized by oxidation of natural
graphite flakes (Aesar, 325 mesh) according to the modified Hum-
mers method [13]. Concentrated sulfuric acid and orthophosphoric
acid (120:15 mL) were added to a mixture of KMnO4 (6 g) and
graphite (1 g). It was heated to 50 ◦C and stirred for 24 h. The result-
ing mixture was poured into ice (150 mL) and H2O2 (30%, 1 mL) and
then filtered using a polycarbonate membrane. The solid product
was washed with water, 30% HCl, and ethanol two times before
vacuum drying for 12 h.
Before the reduced graphene oxide was synthesized, the GO was
exfoliated in water by ultrasonication to produce a homogeneous
graphene oxide water based suspension (0.1 mg/mL). The GO was
then reduced using glucose as the reducing agent at 95 ◦C for 2 h
[14]. Afterwards, the mixture was filtered by a polycarbonate mem-
brane and washed several times with water and ethanol to obtain
reduced graphene oxide (RGO).
Before the cytocompatibility tests, the stability of the disper-
sions in phosphate buffered saline (PBS) containing three types of
0927-7765/$ – see front matter © 2011 Elsevier B.V. All rights reserved.doi:10.1016/j.colsurfb.2011.08.026
80 M. Wojtoniszak et al. / Colloids and Surfaces B: Biointerfaces 89 (2012) 79– 85
dispersants, PEG, DOC and Pluronic P123, was studied. Aqueous
solutions of PEG, DOC and Pluronic P123 (1 mg/mL) were prepared.
Afterwards, GO and RGO were added to the solutions (1 mg/mL).
Next, the GO and RGO suspensions were diluted with PBS and son-
icated to reach the following concentrations: 100 �g/mL, 50 �g/mL,
25 �g/mL, 12.5 �g/mL, 6.25 �g/mL, and 3.125 �g/mL. The concen-
tration of the surfactants in the suspensions was also adjusted
to 100 �g/mL, 50 �g/mL, 25 �g/mL, 12.5 �g/mL, 6.25 �g/mL, and
3.125 �g/mL. In order to assess the suspensions homogeneity, the
UV/vis intensity at 325 nm was plotted against the sonication time.
Finally, the stability of the homogeneous dispersions was examined
by monitoring the change of UV/vis absorbance (at 325 nm) after
4 h, 24 h and 48 h.
The cytocompatibility of the graphene oxide and reduced
graphene oxide biofunctionalized with PEG, DOC or Pluronic
P123 was assessed using the WST-1 test (Roche Applied Science,
Mannheim, Germany). The cell proliferation WST-1 test is based on
the reduction of the tetrazolium salt WST-1 to a soluble red-colored
formazan by mitochondrial dehydrogenase of metabolically active
cells. The amount of formazan dye is directly correlated to the num-
ber of metabolically active cells. In our experiments, the mouse
fibroblast cells (L929) were seeded into a 96-well plate at a density
of 7.4 × 10³/well and then cultured in a humidified incubator with
5% CO2 at 37 ◦C. The cell culture medium (DMEM, Sigma–Aldrich)
was supplemented with 10% of fetal bovine serum (FBS, Gibco) and
0.4% streptomycin/penicillin. After an incubation period of 24 h, the
L929 cells were treated with graphene oxide and reduced graphene
oxide suspensions of PEG, DOC, Pluronic P123 with different con-
centrations (0 (only medium with added dispersant – reference
suspension), 3.125, 6.25, 12.5, 25.0, 50.0, and 100.0 �g/mL) for
48 h. In this way the toxicity dependence on the type of disper-
sant and nanomaterials concentration were investigated. After this
incubation period, WST-1 reagent was added for 30 min and the
absorbance was measured on a microplate spectrophotometer at
450 nm. The blank absorbance (medium without cells) was sub-
tracted from each value. All the experiments were conducted in
triplicate.
High-resolution transmission electron microscopy (HR-TEM)
(FEI Tecnai F30) was employed to examine the morphology of the
graphene oxide and reduced form. Thermogravimetric analysis was
performed on the SDT Q600 Simultaneous TGA/DSC under an air
flow of 100 mL min−1 and at a heating rate of 5 ◦C min−1. Raman
spectra were acquired on the inVia Raman Microscope (Renishaw)
at an excitation wavelength of 514 nm. Before the analysis, the sam-
ples were deposited on a SiO2/Si wafer (300 nm SiO2). The UV/vis
absorption spectra were recorded using a Helios Gamma UV–vis
spectrometer and IR absorption spectra were acquired on the Nico-
let 6700 FT-IR spectrometer. XRD was performed using the X’Pert
Philips Diffractometer with a Cu anode (K�1 = 1.54056 A) to deter-
mine the structure.
3. Results
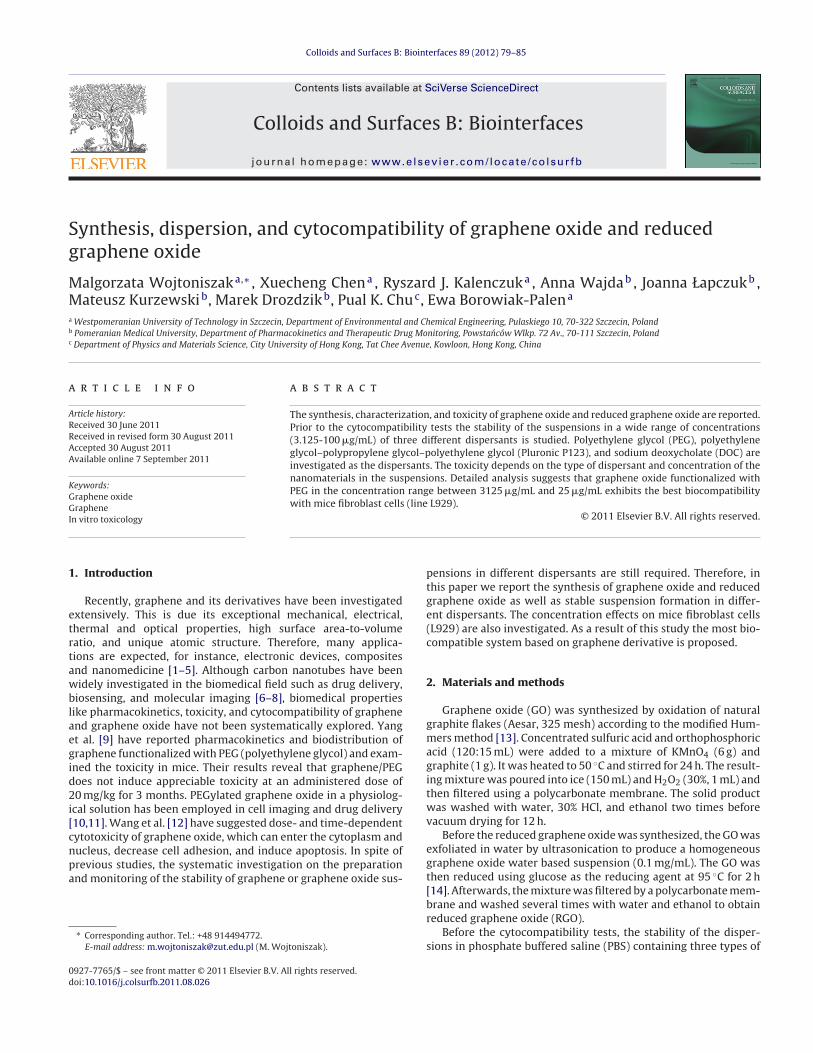
To investigate the oxidation and reduction processes, IR spec-
tra were obtained from the starting graphite, graphene oxide, and
reduced graphene oxide. Fig. 1A depicts the IR spectrum of the
starting graphite and only peaks attributable to C C (graphitic car-
bon atoms vibrations) and C–O (CO2 in environment) are detected.
Fig. 1B shows the IR spectrum of the GO and the following absorp-
tion modes are detected: 1620 nm due to the aromatic C C bond,
1060 nm attributed to the C–O stretching vibration mode in the
alkoxy group, at 1170 nm assigned to the epoxy C–O stretching
peak, at 1400 nm arising from the C–OH carboxyl group, at 1740 nm
corresponding to the C O stretch mode in the carboxyl group,
2930 nm originating from C–H, and 3420 nm from O–H groups
Fig. 1. IR spectra of graphite (A), graphene oxide (B) and reduced graphene oxide
(C).
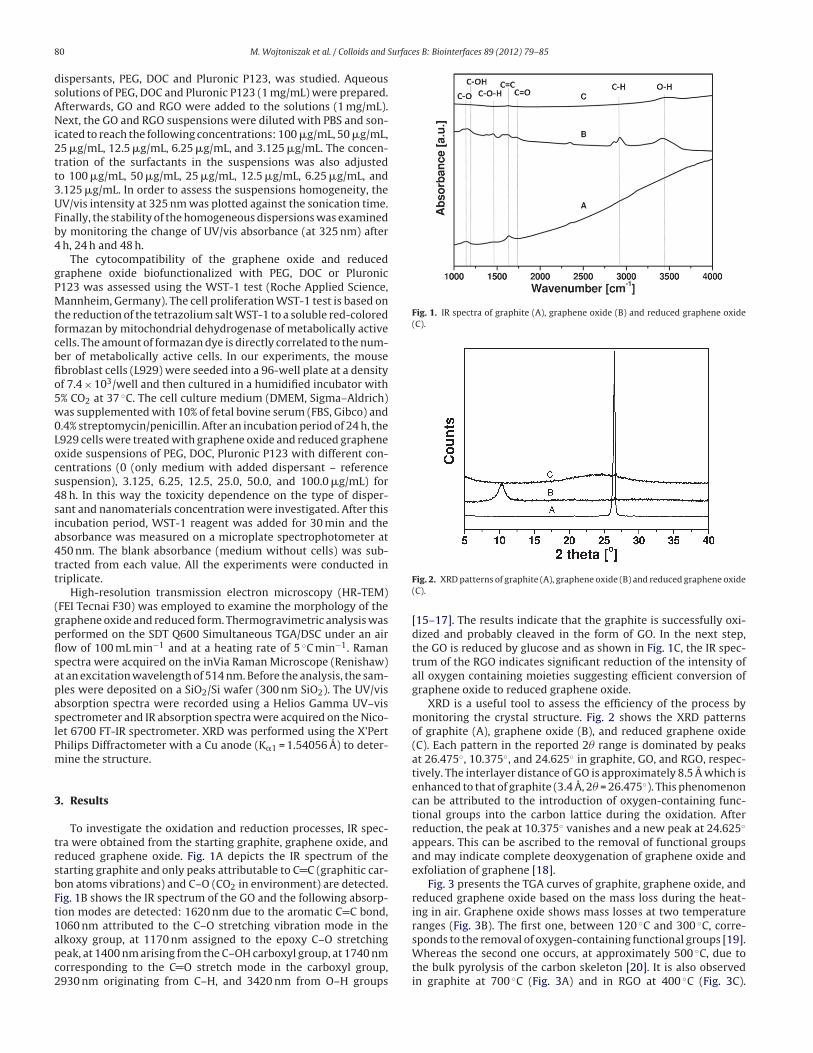
Fig. 2. XRD patterns of graphite (A), graphene oxide (B) and reduced graphene oxide
(C).
[15–17]. The results indicate that the graphite is successfully oxi-
dized and probably cleaved in the form of GO. In the next step,
the GO is reduced by glucose and as shown in Fig. 1C, the IR spec-
trum of the RGO indicates significant reduction of the intensity of
all oxygen containing moieties suggesting efficient conversion of
graphene oxide to reduced graphene oxide.
XRD is a useful tool to assess the efficiency of the process by
monitoring the crystal structure. Fig. 2 shows the XRD patterns
of graphite (A), graphene oxide (B), and reduced graphene oxide
(C). Each pattern in the reported 2� range is dominated by peaks
at 26.475◦, 10.375◦, and 24.625◦ in graphite, GO, and RGO, respec-
tively. The interlayer distance of GO is approximately 8.5 A which is
enhanced to that of graphite (3.4 A, 2� = 26.475◦). This phenomenon
can be attributed to the introduction of oxygen-containing func-
tional groups into the carbon lattice during the oxidation. After
reduction, the peak at 10.375◦ vanishes and a new peak at 24.625◦
appears. This can be ascribed to the removal of functional groups
and may indicate complete deoxygenation of graphene oxide and
exfoliation of graphene [18].
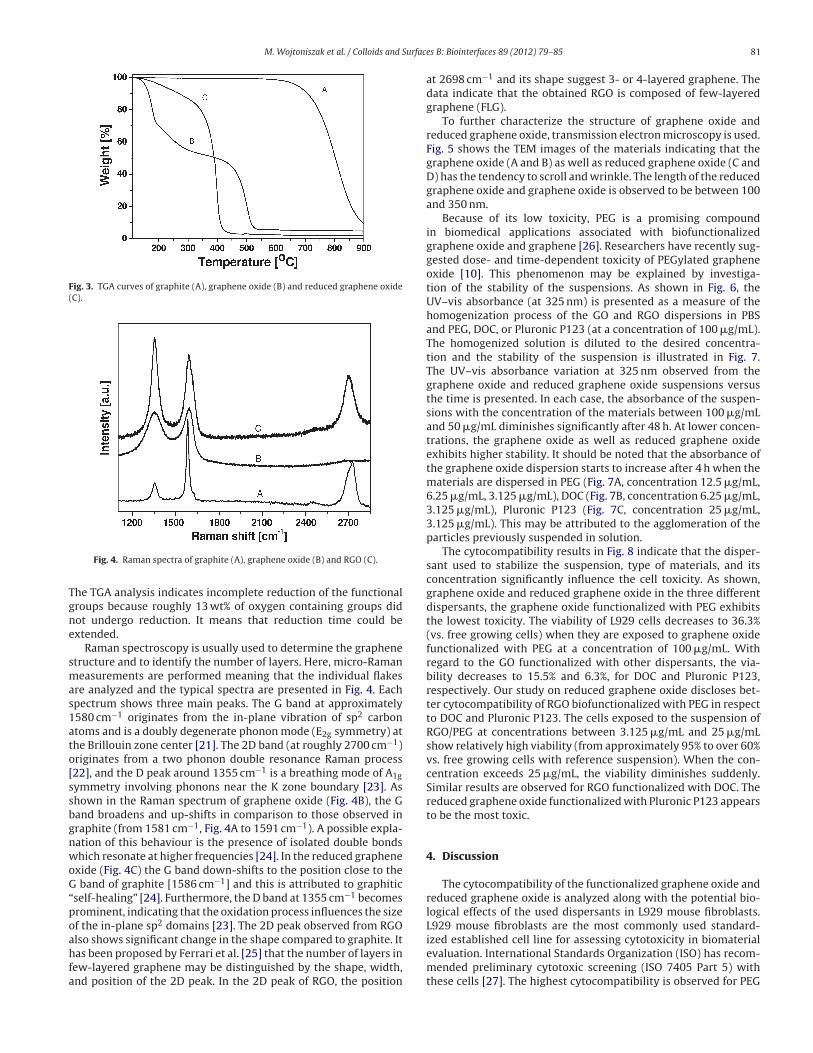
Fig. 3 presents the TGA curves of graphite, graphene oxide, and
reduced graphene oxide based on the mass loss during the heat-
ing in air. Graphene oxide shows mass losses at two temperature
ranges (Fig. 3B). The first one, between 120 ◦C and 300 ◦C, corre-
sponds to the removal of oxygen-containing functional groups [19].
Whereas the second one occurs, at approximately 500 ◦C, due to
the bulk pyrolysis of the carbon skeleton [20]. It is also observed
in graphite at 700 ◦C (Fig. 3A) and in RGO at 400 ◦C (Fig. 3C).
M. Wojtoniszak et al. / Colloids and Surfaces B: Biointerfaces 89 (2012) 79– 85 81
Fig. 3. TGA curves of graphite (A), graphene oxide (B) and reduced graphene oxide
(C).
Fig. 4. Raman spectra of graphite (A), graphene oxide (B) and RGO (C).
The TGA analysis indicates incomplete reduction of the functional
groups because roughly 13 wt% of oxygen containing groups did
not undergo reduction. It means that reduction time could be
extended.
Raman spectroscopy is usually used to determine the graphene
structure and to identify the number of layers. Here, micro-Raman
measurements are performed meaning that the individual flakes
are analyzed and the typical spectra are presented in Fig. 4. Each
spectrum shows three main peaks. The G band at approximately
1580 cm−1 originates from the in-plane vibration of sp2 carbon
atoms and is a doubly degenerate phonon mode (E2g symmetry) at
the Brillouin zone center [21]. The 2D band (at roughly 2700 cm−1)
originates from a two phonon double resonance Raman process
[22], and the D peak around 1355 cm−1 is a breathing mode of A1g
symmetry involving phonons near the K zone boundary [23]. As
shown in the Raman spectrum of graphene oxide (Fig. 4B), the G
band broadens and up-shifts in comparison to those observed in
graphite (from 1581 cm−1, Fig. 4A to 1591 cm−1). A possible expla-
nation of this behaviour is the presence of isolated double bonds
which resonate at higher frequencies [24]. In the reduced graphene
oxide (Fig. 4C) the G band down-shifts to the position close to the
G band of graphite [1586 cm−1] and this is attributed to graphitic
“self-healing” [24]. Furthermore, the D band at 1355 cm−1 becomes
prominent, indicating that the oxidation process influences the size
of the in-plane sp2 domains [23]. The 2D peak observed from RGO
also shows significant change in the shape compared to graphite. It
has been proposed by Ferrari et al. [25] that the number of layers in
few-layered graphene may be distinguished by the shape, width,
and position of the 2D peak. In the 2D peak of RGO, the position
at 2698 cm−1 and its shape suggest 3- or 4-layered graphene. The
data indicate that the obtained RGO is composed of few-layered
graphene (FLG).
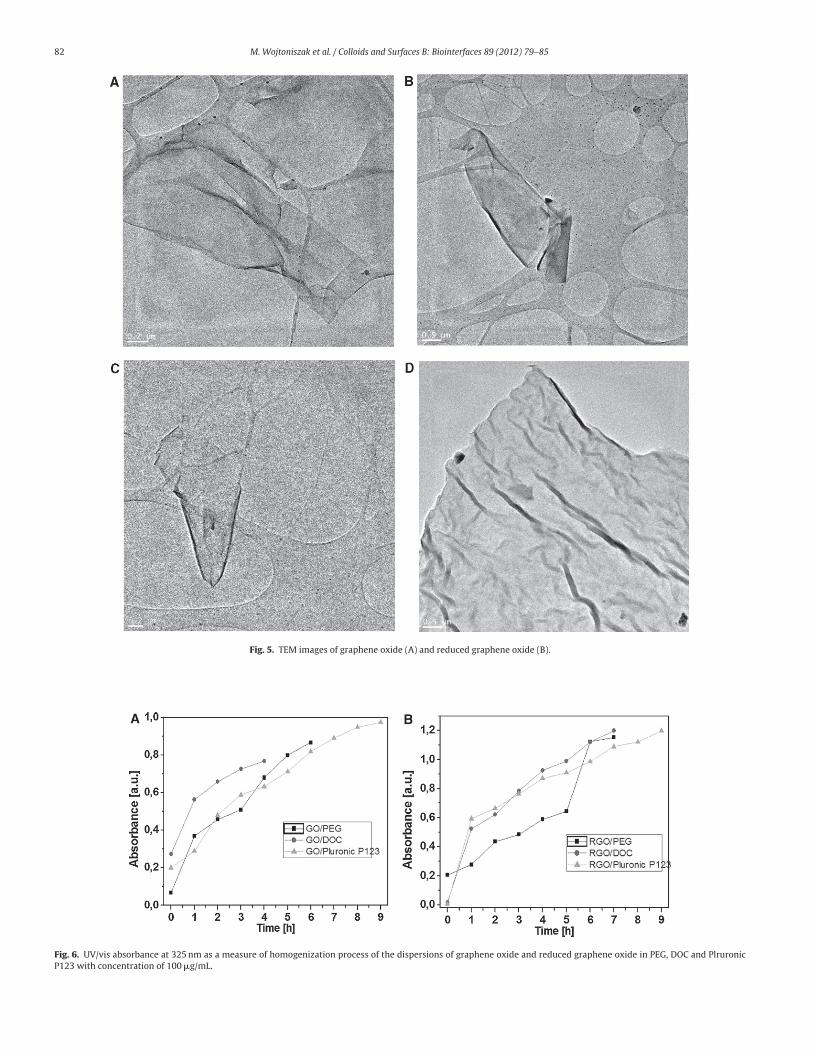
To further characterize the structure of graphene oxide and
reduced graphene oxide, transmission electron microscopy is used.
Fig. 5 shows the TEM images of the materials indicating that the
graphene oxide (A and B) as well as reduced graphene oxide (C and
D) has the tendency to scroll and wrinkle. The length of the reduced
graphene oxide and graphene oxide is observed to be between 100
and 350 nm.
Because of its low toxicity, PEG is a promising compound
in biomedical applications associated with biofunctionalized
graphene oxide and graphene [26]. Researchers have recently sug-
gested dose- and time-dependent toxicity of PEGylated graphene
oxide [10]. This phenomenon may be explained by investiga-
tion of the stability of the suspensions. As shown in Fig. 6, the
UV–vis absorbance (at 325 nm) is presented as a measure of the
homogenization process of the GO and RGO dispersions in PBS
and PEG, DOC, or Pluronic P123 (at a concentration of 100 �g/mL).
The homogenized solution is diluted to the desired concentra-
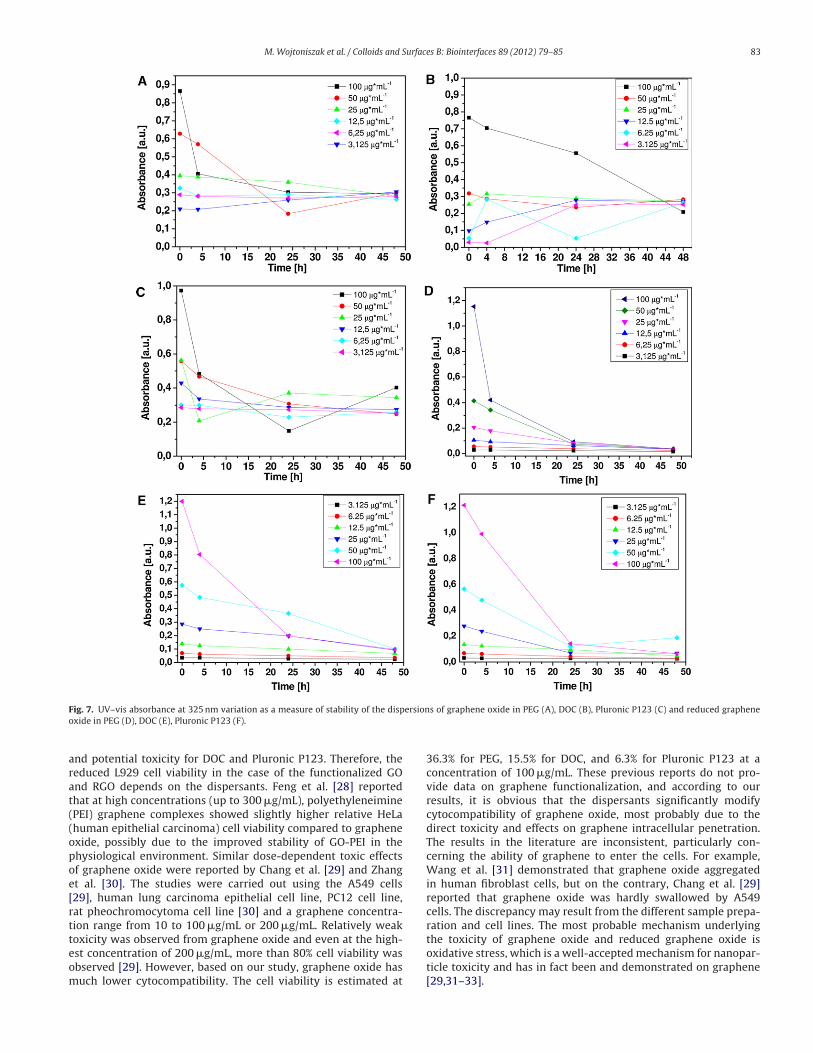
tion and the stability of the suspension is illustrated in Fig. 7.
The UV–vis absorbance variation at 325 nm observed from the
graphene oxide and reduced graphene oxide suspensions versus
the time is presented. In each case, the absorbance of the suspen-
sions with the concentration of the materials between 100 �g/mL
and 50 �g/mL diminishes significantly after 48 h. At lower concen-
trations, the graphene oxide as well as reduced graphene oxide
exhibits higher stability. It should be noted that the absorbance of
the graphene oxide dispersion starts to increase after 4 h when the
materials are dispersed in PEG (Fig. 7A, concentration 12.5 �g/mL,
6.25 �g/mL, 3.125 �g/mL), DOC (Fig. 7B, concentration 6.25 �g/mL,
3.125 �g/mL), Pluronic P123 (Fig. 7C, concentration 25 �g/mL,
3.125 �g/mL). This may be attributed to the agglomeration of the
particles previously suspended in solution.
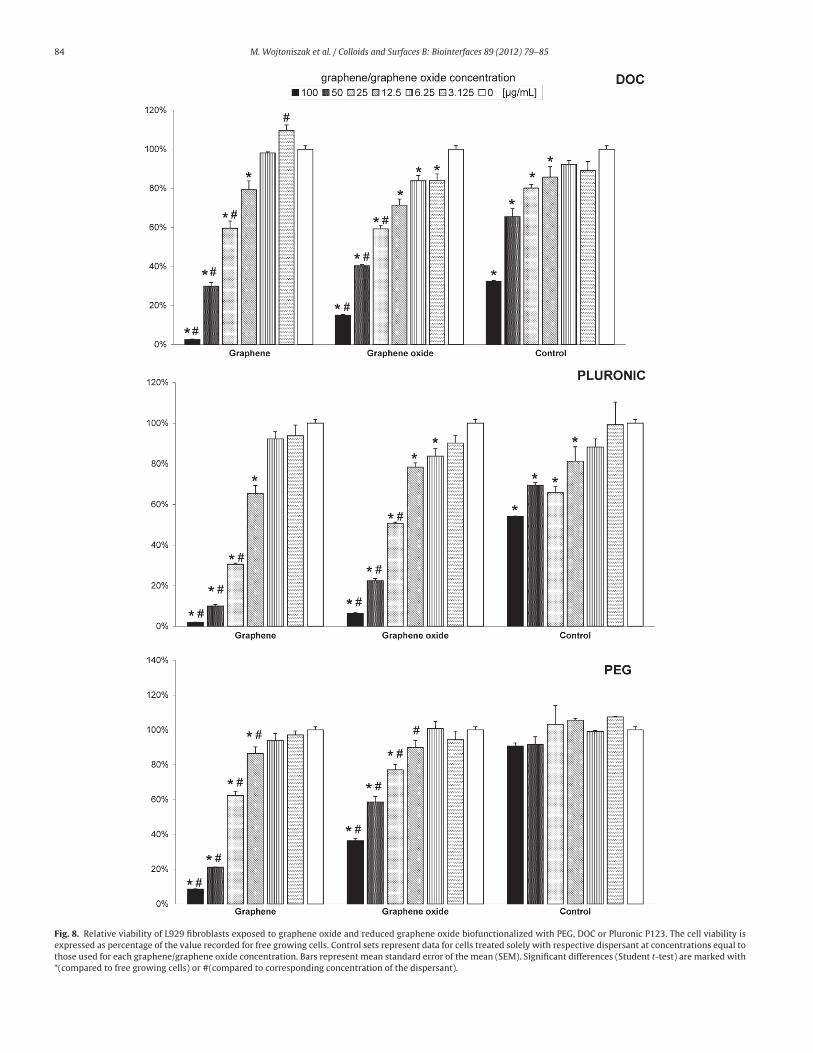
The cytocompatibility results in Fig. 8 indicate that the disper-
sant used to stabilize the suspension, type of materials, and its
concentration significantly influence the cell toxicity. As shown,
graphene oxide and reduced graphene oxide in the three different
dispersants, the graphene oxide functionalized with PEG exhibits
the lowest toxicity. The viability of L929 cells decreases to 36.3%
(vs. free growing cells) when they are exposed to graphene oxide
functionalized with PEG at a concentration of 100 �g/mL. With
regard to the GO functionalized with other dispersants, the via-
bility decreases to 15.5% and 6.3%, for DOC and Pluronic P123,
respectively. Our study on reduced graphene oxide discloses bet-
ter cytocompatibility of RGO biofunctionalized with PEG in respect
to DOC and Pluronic P123. The cells exposed to the suspension of
RGO/PEG at concentrations between 3.125 �g/mL and 25 �g/mL
show relatively high viability (from approximately 95% to over 60%
vs. free growing cells with reference suspension). When the con-
centration exceeds 25 �g/mL, the viability diminishes suddenly.
Similar results are observed for RGO functionalized with DOC. The
reduced graphene oxide functionalized with Pluronic P123 appears
to be the most toxic.
4. Discussion
The cytocompatibility of the functionalized graphene oxide and
reduced graphene oxide is analyzed along with the potential bio-
logical effects of the used dispersants in L929 mouse fibroblasts.
L929 mouse fibroblasts are the most commonly used standard-
ized established cell line for assessing cytotoxicity in biomaterial
evaluation. International Standards Organization (ISO) has recom-
mended preliminary cytotoxic screening (ISO 7405 Part 5) with
these cells [27]. The highest cytocompatibility is observed for PEG
82 M. Wojtoniszak et al. / Colloids and Surfaces B: Biointerfaces 89 (2012) 79– 85
Fig. 5. TEM images of graphene oxide (A) and reduced graphene oxide (B).
Fig. 6. UV/vis absorbance at 325 nm as a measure of homogenization process of the dispersions of graphene oxide and reduced graphene oxide in PEG, DOC and Plruronic
P123 with concentration of 100 �g/mL.
M. Wojtoniszak et al. / Colloids and Surfaces B: Biointerfaces 89 (2012) 79– 85 83
Fig. 7. UV–vis absorbance at 325 nm variation as a measure of stability of the dispersions of graphene oxide in PEG (A), DOC (B), Pluronic P123 (C) and reduced graphene
oxide in PEG (D), DOC (E), Pluronic P123 (F).
and potential toxicity for DOC and Pluronic P123. Therefore, the
reduced L929 cell viability in the case of the functionalized GO
and RGO depends on the dispersants. Feng et al. [28] reported
that at high concentrations (up to 300 �g/mL), polyethyleneimine
(PEI) graphene complexes showed slightly higher relative HeLa
(human epithelial carcinoma) cell viability compared to graphene
oxide, possibly due to the improved stability of GO-PEI in the
physiological environment. Similar dose-dependent toxic effects
of graphene oxide were reported by Chang et al. [29] and Zhang
et al. [30]. The studies were carried out using the A549 cells
[29], human lung carcinoma epithelial cell line, PC12 cell line,
rat pheochromocytoma cell line [30] and a graphene concentra-
tion range from 10 to 100 �g/mL or 200 �g/mL. Relatively weak
toxicity was observed from graphene oxide and even at the high-
est concentration of 200 �g/mL, more than 80% cell viability was
observed [29]. However, based on our study, graphene oxide has
much lower cytocompatibility. The cell viability is estimated at
36.3% for PEG, 15.5% for DOC, and 6.3% for Pluronic P123 at a
concentration of 100 �g/mL. These previous reports do not pro-
vide data on graphene functionalization, and according to our
results, it is obvious that the dispersants significantly modify
cytocompatibility of graphene oxide, most probably due to the
direct toxicity and effects on graphene intracellular penetration.
The results in the literature are inconsistent, particularly con-
cerning the ability of graphene to enter the cells. For example,
Wang et al. [31] demonstrated that graphene oxide aggregated
in human fibroblast cells, but on the contrary, Chang et al. [29]
reported that graphene oxide was hardly swallowed by A549
cells. The discrepancy may result from the different sample prepa-
ration and cell lines. The most probable mechanism underlying
the toxicity of graphene oxide and reduced graphene oxide is
oxidative stress, which is a well-accepted mechanism for nanopar-
ticle toxicity and has in fact been and demonstrated on graphene
[29,31–33].
84 M. Wojtoniszak et al. / Colloids and Surfaces B: Biointerfaces 89 (2012) 79– 85
Fig. 8. Relative viability of L929 fibroblasts exposed to graphene oxide and reduced graphene oxide biofunctionalized with PEG, DOC or Pluronic P123. The cell viability is
expressed as percentage of the value recorded for free growing cells. Control sets represent data for cells treated solely with respective dispersant at concentrations equal to
those used for each graphene/graphene oxide concentration. Bars represent mean standard error of the mean (SEM). Significant differences (Student t-test) are marked with
*(compared to free growing cells) or #(compared to corresponding concentration of the dispersant).
M. Wojtoniszak et al. / Colloids and Surfaces B: Biointerfaces 89 (2012) 79– 85 85
Previous data on carbon nanotubes (CNTs), which are most sim-
ilar to graphene, show that its toxicity depends on the degree of
functionalization [34]. For example, carboxylation of CNTs makes
oxygen atoms abundant in oxygen atoms and decreases the toxi-
city. Graphene oxide contains many oxygen atoms in the carboxyl
groups, epoxy groups, and hydroxyl groups [35] and so altered
cytocompatibility is expected in case of reduced graphene oxide.
Our results demonstrate that similar to graphene oxide, reduced
graphene oxide in PEG is the most cytocompatible. Comparison
between reduced graphene oxide and graphene oxide shows that
the latter has better cytocompatibility, especially at higher concen-
trations like 50 and 100 �g/mL. The best biological properties are
observed for graphene oxide functionalized with PEG whereas the
other dispersants, Pluronic 123 and DOC, produce less favorable
results.
5. Conclusion
We report the synthesis, dispersion, and toxicity of graphene
oxide and reduced graphene oxide. The materials exhibit toxicity
to mice fibroblast cells (line L929) and the degree depends on the
concentration and type of dispersant. Both materials show rela-
tively good cytocompatibility when the concentration is between
3.125 �g/mL and 12.5 �g/mL. Increasing the concentration of the
nanomaterial in the dispersant reduces the cell viability and the
lowest toxicity is detected from graphene oxide suspended in PEG.
Acknowledgements
The authors are grateful for the financial support of Foundation
for Polish Science within FOCUS2010 Program, Hong Kong Research
Grants Council (RGC) General Research Funds No. CityU 112510,
City University of Hong Kong Applied Research Grant (ARG) No.
9667038.
References
[1] V.Y. Aristov, G. Urbanik, K. Kummer, D.V. Vyalikh, O.V. Molodtsova, A.B. Preo-brajenski, et al., Nano Lett. 10 (2010) 992.
[2] H. Zhao, K. Min, N.R. Aluru, Nano Lett. 9 (2009) 3012.
[3] N.V. Medhekar, A. Ramasubramaniam, R.S. Ruoff, V.B. Shenoy, ACS Nano 4(2010) 2300.
[4] S. Wang, M. Tambraparni, J. Qiu, J. Tipton, D. Dean, Macromolecules 42 (2009)5251.
[5] Y. Chang, S.T. Yang, J.H. Liu, E. Dong, Y. Wang, A. Cao, et al., Toxicol. Lett. 200(2010) 201.
[6] K. Kostarelos, A. Bianco, M. Prato, Nat. Nanotechnol. 4 (2009) 627.[7] Z. Liu, S. Tabakman, K. Welsher, H. Dai, Nano Res. 2 (2009) 85.[8] Y.X. Huang, P.V. Palkar, L.J. Li, H. Zhang, P. Chen, Biosens. Bioelectron. 25 (2010)
1834.[9] K. Yang, J. Wan, S. Zhang, Y. Zhang, S.T. Lee, Z. Liu, ACS Nano 5 (2010) 516.
[10] X. Sun, Z. Liu, K. Welsher, J.T. Robinson, A. Goodwin, S. Zaric, H. Dai, Nano Res.1 (2008) 203.
[11] Z. Liu, J.T. Robinson, X.M. Sun, H.J. Dai, J. Am. Chem. Soc. 130 (2008) 10876.[12] K. Wang, J. Ruan, H. Song, J. Zhang, Y. Wo, S. Guo, et al., Nanoscale Res. Lett. 10
(2010) 1303.[13] D.C. Marcano, D.V. Kosynkin, J.M. Berlin, A. Sinitskii, Z. Sun, A. Slesarev, et al.,
ACS Nano 4 (2010) 4806.[14] C. Zhu, S. Guo, Y. Fang, S. Dong, ACS Nano 4 (2010) 2429.[15] G. Wang, B. Wang, J. Park, J. Yang, X. Shen, J. Yao, Carbon 47 (2009) 68.[16] G. Lazar, K. Zellamaa, I. Vascan, M. Stamate, I. Lazar, I. Rusu, J. Optoelectr. Adv.
Mater. 7 (2005) 647.[17] S. Wang, S.P. Jiang, X. Wang, Electrochem. Acta 56 (2011) 3338.[18] Z.J. Fan, W. Kai, J. Yan, T. Wei, L.J. Zhi, J. Feng, et al., ACS Nano 5 (2011) 191.[19] H.K. Jeong, Y.P. Lee, R.J.W.E. Lahaye, M.H. Park, K.H. An, I.J. Kim, et al., J. Am.
Chem. Soc. 130 (2008) 1362.[20] N.R. Wilson, P.A. Pandey, R. Beanland, R.J. Young, I.A. Kinloch, L. Gong, et al.,
ACS Nano 3 (2009) 2547.[21] Z. Ni, Y. Wang, T. Yu, Z. Shen, Nano Res. 1 (2008) 273.[22] A.C. Ferrari, Solid State Commun. 143 (2007) 47.[23] A.C. Ferrari, J. Robertson Phys. Rev. B 61 (2000) 14095.[24] K.N. Kudin, B. Ozbas, H.C. Schniepp, R.K. Prud’homme, I.A. Aksay, R. Car, Nano
Lett. 8 (2007) 36.[25] A.C. Ferrari, J.C. Meyer, V. Scardaci, C. Casiraghi, M. Lazzeri, F. Mauri, et al., PRL
97 (2006) 187401.[26] S. Zhang, P. Xiong, X. Yang, X. Wang, Nanoscale 3 (2011) 2169.[27] Biological evaluation of medical devices. Part 5: Tests for in vitro cytotoxicity.
ISO 10993-5, 2009.[28] L. Feng, S. Zhang, Z. Liu, Nanoscale 3 (2011) 1252.[29] Y. Chang, S.T. Yang, J.H. Liu, E. Dong, Y. Wang, A. Cao, et al., Toxicol. Lett. 200
(2011) 201.[30] Y. Zhang, S.F. Ali, E. Dervishi, Y. Xu, Z. Li, D. Casciano, et al., ACS Nano 4 (2010)
3181.[31] K. Wang, J. Ruan, H. Song, J. Zhang, Y. Wo, S. Guo, et al., Nanoscale Res. Lett. 5
(2010) 1.[32] N. Lewinski, V. Colvin, R. Drezek, Small 4 (2008) 26.[33] N. Li, T. Xia, A.E. Nel, Free Radic. Biol. Med. 44 (2008) 1689.[34] C.M. Sayes, F. Liang, J.L. Hudson, J. Mendez, W. Guo, J.M. Beach, et al., Toxicol.
Lett. 161 (2006) 135.[35] D.R. Dreyer, S. Park, C.W. Bielawski, R.S. Ruoff, Chem. Soc. Rev. 39 (2010)
228.