college of engineering fact book of engineering fact book our stories. ... increase research...
TRANSCRIPT

Fact BookCollege of Engineering

As dean of engineering, I am proud to present the 2015 Fact Book. This collection of data portrays who we are as a college and illustrates our role as part of the land grant university. Organized according to the objectives of our strategic plan, it presents the metrics we use to track our progress toward our goals. Not only does this document allow us to be transparent and accountable to our stakeholders, it tells our story. You can see where we have been, what progress we have made and how we are working to prepare our students, faculty, staff and alumni for tomorrow.
John R. English, Ph.D., P.E.Dean, College of Engineering
Professor of Industrial EngineeringIrma F. and Raymond F. Giffels Endowed Chair in Engineering

College of Engineering Fact Book
Our stories. Our progress. Our future.A guide to our vision for Arkansas engineering education
2 University of Arkansas Highlights
4 College of Engineering Highlights
8 Strategic Plan
10 Top 50 Balanced Growth
14 Objective One: Increase student quality and diversity
20 Objective Two: Provide student centered education
22 Objective Three: Recruit and retain high quality faculty and staff
24 Objective Four: Increase research productivity
28 Objective Five: Increase economic development
30 Objective Six: Increase alumni and corporate partnerships
32 Objective Seven: Provide high quality infrastructure
35 Appendix
40 Contact Information

2 Our stories. Our progress. Our future.
Our stories.
Fall 2015 Total Enrollment
Undergraduate 22,158
Graduate 4,221
Law 375
Total Enrollment 26,754
University of Arkansas Fall 2015 Enrollment (Degree Seeking Only)
Total Students
0 1000 2000 3000 4000 5000 6000 7000 8000
Graduate School**
Honors College*
Sam M. Walton College of Business
College of Engineering
College of Education and Health Professions
J. William Fulbright College of Arts and Sciences
Fay Jones School of Architecture
Dale Bumpers College of Agricultural Food and Life Sciences 2,130
473
7,692
5,138
4,186
5,810
3,053
253

College of Engineering 2015 Fact Book 3
Our future. Our progress.
University of Arkansas Rankings
0
30
60
90
120
150
UA Rank
National University Rank
2013 2014 2015 2016
Public University Rank
67 63 69 62
134 128 135 129
University of Arkansas Fall 2015 Enrollment (Degree Seeking Only)
Total Students
Dale Bumpers College of Agricultural Food and Life Sciences
Fay Jones School of Architecture
J. William Fulbright College of Arts and Sciences
College of Education and Health Professions
College of Engineering
Sam M. Walton College of Business
Honors College*
Graduate Interdisciplinary Programs
* All Honors College students are enrolled in an academic college and are also counted as part of that college.

4 Our stories. Our progress. Our future.
Our stories.
* Includes engineering students enrolled in interdisciplinary programs.
Total undergraduate enrollment
is up 8 percent over 2014.
Since 2007, undergraduate enrollment has
more than doubled.
We have 803 new freshmen —a new record, up 13 percent over 2014.
Our 2015 freshman class is
26 percent female,the largest percentage of women in the college’s history.
The total percentage of female undergraduates is also at a record high at 23 percent.
Underrepresented students—female, minority and first generation college students—make up 50 percent of the freshman class.
2015 Enrollment Highlights
Undergraduate 3,265
Graduate* 970
College of Engineering Total Enrollment 4,235

College of Engineering 2015 Fact Book 5
Our future. Our progress.
* Includes engineering students enrolled in interdisciplinary programs.
0 100 200 300 400 500 600
Fall 2015 Enrollment by Department
* Students in the Freshman Engineering Program and students enrolled in distance learning are not included.
Biological and Agricultural Engineering111
Biomedical Engineering
204
Civil Engineering305
Electrical Engineering327
Industrial Engineering*299
Chemical Engineering315
Mechanical Engineering596
Computer Science and Computer Engineering509
Total Students
For information on Operations Management enrollment, see Appendix page 38.

6 Our stories. Our progress. Our future.
College of Engineering
Budget Faculty
Board of Trustees
University of Arkansas System President – Donald Bobbitt, Ph.D.
Interim Chancellor – Dan Ferritor, Ph.D.
Provost – Ashok Saxena, Ph.D.
Dean – John English, Ph.D., P.E.
Academics
Student Services
Diversity
Facilities
Research
Alumni Relations
Communications
Development
Salary and Bene�ts
Operating Expenditures
Dept Restricted Fees/Misc
Student Equipment Fees
Scholarships
Research*
State Appropriations & Tuition
Distance Learning Revenues, Ft Smith, Service Centers, Conferences
Research Incentive Funds
Biological Engineering Teaching and Agricultural Experiment Station**
Sponsored Research (actual expenditures) *
Sponsored Activities and Scholarships (actual expenditures)
Student Equipment Fee Revenues (TELE-net)
2015 Expenditures (excluding gifts)2015 Revenue (excluding gifts)
■ State Appropriations & Tuition $21,712,044
■ Distance Learning Revenues, Ft Smith, Service Centers, Conferences $3,140,177
■ Research Incentive Funds $942,325
■ Biological Engineering Teaching and Agricultural Experiment Station* $1,851,719
■ Sponsored Research ** $15,907,692
■ Sponsored Activities and Scholarships $1,537,123
■ Student Equipment Fee Revenues (TELE-net) $2,302,119
Senior Director of Development
and External Relations
Kelly Sartorius, Ph.D.
Associate Dean for Research
Heather Nachtmann,
Ph.D.
Senior Associate
Dean
Norman Dennis,
Ph.D., P.E.
Department Heads
Assistant Dean for Financial
Affairs
Larry Esch, M.Acc.
■ Salary and Benefits $18,744,220
■ Operating Expenditures $1,301,172
■ Dept Restricted Fees/Misc $1,239,293
■ Student Equipment Fees $2,241,529
■ Scholarships $758,241
■ Research*** $22,476,266
*** Reported and complied by the U of A Research Accounting Office and submitted to the NSF.
For complete financial information, see Appendix page 36
* Cooperative Extension Service not included. ** As reported to ASEE and USNWR.
Total Revenue: $47,393,199Total Expenditures: $46,760,722
Organization & Finances*

College of Engineering 2015 Fact Book 7
College of Engineering
Departments and CentersCollege of Engineering
Institute for Nanoscience and Engineering
Biomedical Engineering
Electrical Engineering
Center for Power Optimization of Electro-Thermal Systems
Center for Secure Electric Energy Delivery Systems
Generating Renewable Energy Efficient Nanoplasmonic Solar Cells
Grid-Connected Advanced Power Electronic Systems
High Density Electronics Center
National Center for Reliable Power Transmission
Vertically Integrated Center for Transformative Energy Research
Industrial Engineering
Center for Excellence in Logistics and Distribution
Center for Innovation in Healthcare Logistics
Mechanical Engineering
Center for Advanced Surface Engineering
Computer Science and Computer Engineering
Center for Information Security and Reliability
Arkansas Security Research and Education Institute
Civil Engineering
Mack-Blackwell Transportation Center
Maritime Transportation Research and Education Center
Southern Plains Transportation Center
Biological and Agricultural Engineering
Arkansas Water Resources Center
Departments and CentersOrganization & Finances*
Ralph E. Martin Department of Chemical Engineering
Chemical Hazards Research Center
Membrane Science, Engineering and Technology Center

8 Our stories. Our progress. Our future.
Strategic Plan

College of Engineering 2015 Fact Book 9
College of Engineering
Strategic Plan
Top 50 Balanced Growth• Top 50 ranking among public universities• 3,500 undergraduate students• 1,000 master’s students• 350 doctoral students• 135 tenure-track faculty members• 65 clinical and research faculty members• 240 staff members • $300,000 in research expenditures per faculty member

10 Our stories. Our progress. Our future.
Our stories.
Top 50 Bala nced Growth
BS MS PhD BS MS PhD BS MS PhD BS MS PhD BS MS PhD
Fall 2011 Fall 2012 Fall 2013 Fall 2014 Fall 2015
0
500
1000
1500
2000
2500
3000
3500
Overall Enrollment by Department*
0
500
1000
1500
2000
2500
3000
3500test
Biological and Agricultural Engineering
Biomedical Engineering
R.E. Martin Dept. of Chemical Eng.
Civil Engineering
Computer Science and Computer Engineering
Electrical Engineering
Industrial Engineering
Mechanical Engineering
Engineering (online)
Operations Management
Freshman Engineering
Undeclared
BS MS PhD BS MS PhD BS MS PhD BS MS PhD BS MS PhD
Fall 2011 Fall 2012 Fall 2013 Fall 2014 Fall 2015
0
500
1000
1500
2000
2500
3000
3500test
Biological and Agricultural Engineering
Biomedical Engineering
R.E. Martin Dept. of Chemical Eng.
Civil Engineering
Computer Science and Computer Engineering
Electrical Engineering
Industrial Engineering
Mechanical Engineering
Engineering (online)
Operations Management
Freshman Engineering
Undeclared
BS MS PhD BS MS PhD BS MS PhD BS MS PhD BS MS PhD
Fall 2011 Fall 2012 Fall 2013 Fall 2014 Fall 2015
“Students at the U of A have the opportunity to be instructed on crucial engineering principles from some of the best in our field. We learn valuable life lessons from all faculty, staff and peers we see every day. However, it wasn’t until my last semester here that I realized that the jokes we made as sophmores about saving the world weren’t just about distant opportunities anymore. I realized that if anyone can change the world, engineers can.”
Shelby Paschal SpenceB.S.B.E. ’15
2015 Outstanding Senior
* Interdisciplinary students are included in the department of their faculty advisor.

College of Engineering 2015 Fact Book 11
Our future. Our progress.
Top 50 Bala nced Growth
Top 50 Balanced Growth• 3,500 undergraduate students
• 1,000 master’s students
• 350 doctoral students
• 135 tenure-track faculty members
• 65 clinical and research faculty members
• 240 staff members
• $300,000 in research activity per faculty member
Total Staff
Research Expenditures per Faculty
Faculty by Rank
0
20
40
60
80
100
120Assistant Professor
Associate Professor
Professor
Fall 2011 Fall 2012 Fall 2013 Fall 2014 Fall 2015
102 105 104 104108
0
20
40
60
80
100
120
Non-Tenure Track- Non-teaching
Non-Tenure Track Teaching Faculty
Fall 2011 Fall 2012 Fall 2013 Fall 2014 Fall 2015
22 2030 30
19
0
30
60
90
120
150Non-Tenure Track- Non-teaching
Non-Tenure Track Teaching Faculty
Assistant Professor
Associate Professor
Professor
Fall 2011 Fall 2012 Fall 2013 Fall 2014 Fall 2015
0
30
60
90
120
150Non-Tenure Track- Non-teaching
Non-Tenure Track Teaching Faculty
Assistant Professor
Associate Professor
Professor
Fall 2011 Fall 2012 Fall 2013 Fall 2014 Fall 2015
Research Faculty
Clinical Faculty
0
$50,000
$100,000
$150,000
$200,000
$250,000
Research Expenditures per Faculty
FY 2011 FY 2012 FY 2013 FY 2014 FY 2015
209k 149k 207k213k230k
0
500
1000
1500
2000
2500
3000
3500test
Biological and Agricultural Engineering
Biomedical Engineering
R.E. Martin Dept. of Chemical Eng.
Civil Engineering
Computer Science and Computer Engineering
Electrical Engineering
Industrial Engineering
Mechanical Engineering
Engineering (online)
Operations Management
Freshman Engineering
Undeclared
BS MS PhD BS MS PhD BS MS PhD BS MS PhD BS MS PhD
Fall 2011 Fall 2012 Fall 2013 Fall 2014 Fall 2015
0
20
40
60
80
100
120
Total Sta�
Fall 2011 Fall 2012 Fall 2013 Fall 2014 Fall 2015
104 113 114107107

12 Our stories. Our progress. Our future.
Our stories.
Top 50 Bala nced Growth
2012 2013 2014 2015 20160
1
2
3
4
5
2.3 2.3 2.42.4 2.4
0
20
40
60
80
100
120
100115115 109 98
Peer Assessment Rank
Peer Assessment Rank
20162012 2013 2014 2015
Peer Assessment Rank (Public Institutions)
7677 70 6264
U.S. News & World Report Undergraduate Ranking
U.S. News & World Report Undergraduate Peer Assessment Score
“One of the biggest draws at the University of Arkansas was the level of research coupled with the opportunity to develop project management experience. My research adviser always encouraged me to present at conferences, collaborate with other researchers, and take new risks to further develop as an individual. Because of this, I was able to travel the world, present at several nationally recognized conferences and start a company because of my research. Not only did I learn analytical and project management skills, but I was also able to learn how to drive business results. The quality of my degree is first class.”
James Phillip TurnerB.S.Ch.E. ’10, Ph.D. ’15
Project Specialist, Sam’s Club

College of Engineering 2015 Fact Book 13
Our future. Our progress.
Top 50 Bala nced Growth
Graduate Rankings Metrics:
Quality assessment: Peer assessment 25% Corporate recruiter assessment 15%Student Selectivity: Mean GRE quantitative score 6.75% Graduate acceptance rate 3.25%Faculty resources: Student-to-faculty ratio - Ph.D. 7.50% Student-to-faculty ratio - M.S. 3.75% Percent of faculty in the National Academy of Engineering 7.50% Doctoral degrees awarded 6.25%Research activity: Total research expenditures 15% Average research expenditures 10% per faculty member
The University of Arkansas aspires to be listed in the top 50 of public universities, as ranked by U.S. News & World Report. This publication, a popular source of university rankings, ranks both undergraduate and graduate programs. For Ph.D. programs, it considers metrics related to the quality of students the college attracts and metrics related to graduates’ achievements. U.S. News also surveys deans, program directors, senior faculty and professionals who hire engineering graduates to establish peer and corporate recruiter assessment data. For its college undergraduate rankings, U.S. News uses only peer assessment data. The 2016 rankings are based on a two year average of data from 2013 and 2014.
U.S. News & World Report How Rankings Are Measured
0
20
40
60
80
100
120
107102109 105107
Graduate Rankings
Overall Rank Overall Public Rank
2012 2013 2014 2015 2016
6672 69 6971
U.S. News & World Report Graduate Ranking
U.S. News & World Report Graduate Reputation Score
Look for this icon throughout the book. It indicates metrics that directly affect our U.S. News ranking.2012 2013 2014 2015 2016
Corporate RecruiterAssessment
Peer Assessment
0
1
2
3
4
5
2.32.32.32.32.22.8 2.7 2.7 2.6 2.6

14 Our stories. Our progress. Our future.
Our stories.
Strategic Plan Objective One: Incr ease student quality and diversity
360Foreign Countries
CT
MA
DE
NJ
MD
DC
ME
2000 + 400-1999200-399 100-199 50-99 20-49 1-19 0
RINumber of students:
0
5
10
15
20
25
30
36
27.828.127.827.627.6
ACT Average
Fall2011
Fall2012
Fall2013
Fall2014
Fall2015
New Freshman ACT Average
Our Students’ Home StatesOur Students’ Home States
AR
AK
CACO
CT
VT
HI
NH
MA
DE
NJ
MD
DC
NV
FL
GAALMS
LATX
OKNM
AZ
UT
OR
ID
WY
NE
KS MO
IL
TN
SC
NC
VAWV
KY
INOH
WIMI
NY
PA
MEWA
IA
SD
MT ND
MN
RI
“The College of Engineering provides the personalized attention of a small college along with the advantages and excitement of a large university. In recent years, our student population has grown dramatically. We’ve managed to expand our student population while maintaining our high standards, as you can see by our students’ impressive ACT scores and grade point averages.”
Norman Dennis, Ph.D. , P.E.Senior Associate Dean
University Professor of Civil Engineering

College of Engineering 2015 Fact Book 15
Our future. Our progress.
Strategic Plan Objective One: Incr ease student quality and diversity
Preparing for Tomorrow:• We will continue our outreach to
Arkansas K-12 schools with increasingly excellent STEM programming to interest young people in engineering careers and to enhance the number of students pursuing STEM disciplines.
• We are working to create more endowed scholarships to support engineering undergraduates who have financial need.
• We hope to establish more doctoral fellowship endowments to recruit graduate students and provide our faculty with excellent assistants in their research.
• We plan to increase scholarships for juniors and seniors who display exceptional leadership and academic qualities.
0.0
0.5
1.0
1.5
2.0
2.5
3.0
3.5
4.0
3.67 3.70 3.72 3.74 3.72
Mean Undergraduate GPA
Fall2011
Fall2012
Fall2013
Fall2014
Fall2015
Mean Undergraduate GPA
0
5
10
15
20
25
30
35
40
34.233.5 33.734.938.5
Graduate Acceptance Rate*
Fall2011
Fall2012
Fall2013
Fall2014
Fall2015
Graduate Acceptance Rate
0
50
100
150
200
Fall2013
Fall2011
Fall2012
Fall2014
Fall2015
159 161 162 161 158
Mean GRE Quantitative Score*
* Does not include distance students.

16 Our stories. Our progress. Our future.
Our stories.
Strategic Plan Objective One: Incr ease student quality and diversity
0
$10,000
$20,000
$30,000
$40,000
$50,000
$60,000
$70,000
$80,000
Average Vs. National Salary
Average salary of U of A engineering graduatesNational average*
2013-2014 2014-2015
* source: National Average of Colleges and Employers
Engineering Graduate Starting Salaries: U of A and National Averages
“I chose the U of A because of the available scholarships and the chance to conduct research as an undergraduate. Once I got here, I joined the Honors College, and this led to even more opportunities. I was able to study abroad and present my research at an international conference. In addition to that, I participated in internships, which helped me develop a passion for construction and the energy industry. The combination of international experience, critical thinking skills and real world experience I received at the U of A set me up for a successful career.”
Sydney (Dickson) WaddleB.S.C.E. ’15
Construction Engineer, Bechtel0
20
40
60
80
100
Placement Rate
2012-2013 2014-20152013-2014
86% 85% 85%
Placement Rate (percentage of engineering graduates employed or attending graduate school)

College of Engineering 2015 Fact Book 17
Our future. Our progress.
Strategic Plan Objective One: Incr ease student quality and diversity
Preparing for Tomorrow:• Every semester, our STEM Career Fair
attracts over 100 employers and over 1,000 students. We also offer networking events and workshops around the event, so that students receive many opportunities to work on their resumes, practice their interview skills and connect with potential employers.
• With endowed funds for colloquia, we invite speakers to campus and create programs for visiting scholars and executives in residence at the university. This exposes our students and faculty to the emerging trends in engineering excellence.
An engineering student is excited about the opportunities at our career fair. Approximately 800 students interviewed with potential employers at the U of A’s Fall 2015 STEM fair.
0
10
20
30
40
50
60
70
80
Number of Honors Graduates
2011 2012 2013 2014 2015
39 62 624048
Number of Engineering Honors College Graduates
2011 2012 2013 2014 2015National Science
Foundation Graduate Research Fellowship
8 4 1 8 1
National Science Foundation Graduate
Research Fellowship Honorable Mention
2 2 1 3 3
Goldwater Scholarship 1 1
Goldwater Honorable Mention
2
Whitaker Fellowship 1
NSF CyberCorps Scholarship for Service
1
Udall Scholarship 1
Fall 2015 Incoming Student Awards
Bodenhamer Fellows ...................................................... 1Honors College Fellows ................................................34National Merit Scholars ................................................15
Recipients of Nationally Competitive Awards and Scholarships

18 Our stories. Our progress. Our future.
Our stories.
Strategic Plan Objective One: Incr ease student quality and diversity
0
5
10
15
20
25
Gender Diversity
Fall 2011 Fall 2012 Fall 2013 Fall 2014 Fall 2015
Undergraduate StudentsGraduate Students*Faculty
* Does not include distance education.Pe
rcen
t Fem
ale
0
5
10
15
20
25
Ethnic Diversity
Fall 2011 Fall 2012 Fall 2013 Fall 2014 Fall 2015
Undergraduate StudentsGraduate Students*Faculty
* Does not include distance or international students.
Perc
ent M
inor
ity
Gender Diversity
Ethnic Diversity
“I came to the U of A because it is the highest ranked school in Arkansas. The Engineering Career Awareness Program (ECAP) has been my home away from home. It’s a group of like-minded people who share the same goals and help each other. Through ECAP, I’ve had many exciting opportunities. I’ve studied abroad in Belize and conducted research at the Massachusetts Institute of Technology. I’ve discovered that there are many different ways I can use my chemical engineering degree.”
Britney WashingtonB.S.Ch.E. ’17
Engineering Career Awareness Program
College of Engineering 2015 Fact Book 19
Our future. Our progress.
Strategic Plan Objective One: Incr ease student quality and diversity
STEM Preparation Program
0
20%
40%
60%
80%
100
Received any degree from the U of A
Received an engineering degree
cohort year2008 2009
79% 79%
Freshman 2008 Freshman 20090
10
20
30
40
50
60
70
80Received a degree from the U of A
Received an engineering degree
before FEP
cohort yearFreshman 2008 Freshman 20090
10
20
30
40
50
60
70
80Received a degree from the U of A
Received an engineering degree
before FEP
cohort year
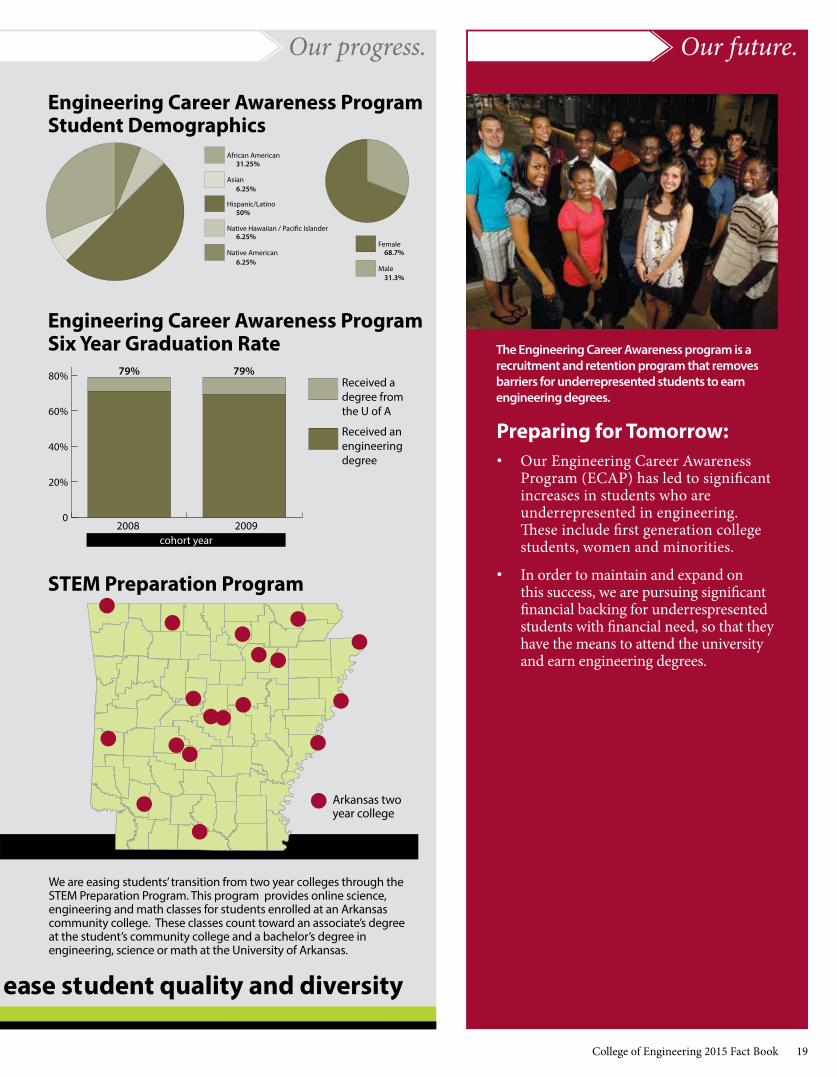
Engineering Career Awareness Program Six Year Graduation Rate
Engineering Career Awareness Program Student Demographics
Received a degree from the U of A
Received an engineering degree
African American
Asian
Hispanic/Latino
Native Hawaiian / Paci�c Islander
Native American
31.25%
6.25%
50%
6.25%
6.25%
Female
Male
68.7%
31.3%
Female
Male
68.7%
31.3%
Arkansas two year college
We are easing students’ transition from two year colleges through the STEM Preparation Program. This program provides online science, engineering and math classes for students enrolled at an Arkansas community college. These classes count toward an associate’s degree at the student’s community college and a bachelor’s degree in engineering, science or math at the University of Arkansas.
Preparing for Tomorrow:• Our Engineering Career Awareness
Program (ECAP) has led to significant increases in students who are underrepresented in engineering. These include first generation college students, women and minorities.
• In order to maintain and expand on this success, we are pursuing significant financial backing for underrespresented students with financial need, so that they have the means to attend the university and earn engineering degrees.
The Engineering Career Awareness program is a recruitment and retention program that removes barriers for underrepresented students to earn engineering degrees.
11

20 Our stories. Our progress. Our future.
Our stories.
Strategic Plan Objective Two: Pro vide student centered education
0
20
40
60
80
100Remained at the U of A
Remained in engineering
2010 2011 2012 2013 2014
First Year Retention
freshmen cohort year
82%86% 83% 85% 85% 84%
61%
71% 69% 70% 70% 71%
before FEP
2008 20090
10
20
30
40
50
60
70
80Received any degree from the U of A
Received an engineering degree
before FEP
freshmen cohort year
58%65%
60%
38%
49% 46%
Freshman 2008 Freshman 20090
10
20
30
40
50
60
70
80Received a degree from the U of A
Received an engineering degree
before FEP
cohort year
0
20
40
60
80
100Remained at the U of A
Remained in engineering
2010 2011 2012 2013 2014
First Year Retention
freshmen cohort year
82%86% 83% 85% 85% 84%
61%
71% 69% 70% 70% 71%
before FEP
First Year Retention Rate
Six Year Graduation Rate
20152014201320122011
316 316 330 419 467
400
200100
500
300
0
Bachelor’s Degrees Awarded
“The Freshman Engineering Program helped me adjust to college by providing me with an exceptional peer mentor who is not just my mentor, but my friend. Our class projects helped me develop teamwork, analytical thinking and communication skills. The Freshman Engineering Program helped shape my future plans by providing me with the resources and experience I needed to choose the engineering discipline that I would enjoy most.”
Anthony WoodsB.S.I.E. ’18
2015 Freshman of the Year

College of Engineering 2015 Fact Book 21
Our future. Our progress.
Strategic Plan Objective Two: Pro vide student centered education
2014-20152013-20142012-20132011-20122010-2011
236 275 295 337 342
350
250
150
50
2014-20152013-20142012-20132011-20122010-2011
341 352 409 408 440
500
400
300
200
100
0
Experiential Learning (students who participated in cooperative education, undergraduate research or study abroad)
Student Semester Credit Hours per Faculty Full Time Equivalence
Preparing for Tomorrow:• In order to cement our success in
retaining and graduating engineers, we are seeking to endow the Freshman Engineering Program so that it is assured support in perpetuity.
• We plan to continue to connect successful alumni with our students through classroom presentations, mock interviews, industry visits and other activities.
0
5
10
15
20
25
30
Student-Faculty-Ratio
Fall 2011 Fall 2012 Fall 2013 Fall 2014 Fall 2015
Undergraduate StudentsMaster’s StudentsPh.D. Students
23.4
1.91.9
2.01.9
2.3 2.2 2.32.1 2.3 2.4
26.128.3 27.1 28.3
0
5
10
15
20
25
30
Student-Faculty-Ratio
Fall 2011 Fall 2012 Fall 2013 Fall 2014 Fall 2015
Undergraduate StudentsMaster’s StudentsPh.D. Students
23.4
1.91.9
2.01.9
2.3 2.2 2.32.1 2.3 2.4
26.128.3 27.1 28.3
Student-Faculty Ratio Our students characterize their professors as knowledgable, approachable and always ready to help. Chancellor Emeritus and respected industrial engineer John A. White Jr., Ph.D., instructs students on leadership in engineering.

22 Our stories. Our progress. Our future.
Our stories.
Strategic Plan Objective Three: Recruit and retain high quality faculty and staff
0
$50,000
$100,000
$150,000
$200,000
Fall 13Fall 12Fall 11Fall 10 Fall 14
UA and ASEE Average Faculty Salary Comparisons
ASEE Aspirant ProfessorASEE Aspirant Associate ProfessorASEE Aspirant Assistant Professor
U of A ProfessorU of A Associate ProfessorU of A Assistant Professor
U of A and American Society for Engineering Education (ASEE) Average Faculty Salary Comparisons*
* ASEE salary survey data for fall 2015 is not available until January. Instructor salaries are not benchmarked in the ASEE salary survey.
“In my eight years of teaching computer science at the U of A, I have had an opportunity to instruct amazing students from many different degree programs and backgrounds. One thing that is particularly rewarding is how enthusiastic and hardworking these students are. It is a joy to teach students who really want to learn. I know that when I shake their hands on graduation day, these students will make me and the university proud in all they do.”
John Gauch, Ph.D.Professor of Computer Science and
Computer Engineering2015 John L. Imhoff
Award for Teaching Recipient
Sta� to Faculty Ratio
2011 2012 2013 2014 2015
0.86 0.89 0.860.880.89
0.0
1.0
0
20
40
60
80
100
Faculty Retention
2011 2012 2013 2014 2015
98% 98% 99%98%97%
Staff-Faculty Ratio
Faculty Retention

College of Engineering 2015 Fact Book 23
Our future. Our progress.
Strategic Plan Objective Three: Recruit and retain high quality faculty and staff
Professional Service Leadership (number of faculty serving in external leadership positions*)
Preparing for Tomorrow:• We plan to add endowed department
head chairs in order to recruit and retain faculty in these vital positions and continue our tradition of exceptional leadership for our departments.
• One of the hallmarks of faculty success is attaining an endowed professorship or chair. The prestige and resources that come with this honor are an important tool in our mission to attract, support and retain talented faculty members.
Membership in National ....
2011 2012 2013 2014 2015
2 2 222
0
2
1
0
5
10
15
20
25
30
National Awards
2011 2012 2013 2014 2015
22 21 242615
Membership in the National Academy of Engineering
National Faculty Awards
Jing Yang, Ph.D., assistant professor of electrical engineering, and Kartik Balachandran, Ph.D., assistant professor of biomedical engineering, are recipients of the National Science Foundation’s prestigious CAREER award.
Conference
6030
33
Journal
Society
Society Fellows
2014: 62 2015: 59For a complete list of fellows, see Appendix page 39
* Faculty members may be counted in more than one category.

24 Our stories. Our progress. Our future.
Our stories.
Strategic Plan Objective Four: Increase research productivity
Research Activity/ Expenditures by Department
0 100000020000003000000400000050000006000000
Uteach
Mechanical Engineering
Industrial Engineering*
Electrical Engineering
Computer Science and Computer Engineering
Civil Engineering
Ralph E. Martin Dept. of Chemical Engineering
Biomedical Engineering
Biological Engineering Biological and Agricultural Engineering
Biomedical Engineering
Civil Engineering
Electrical Engineering
$1M $2M $3M $4M $5M
Industrial Engineering
Chemical Engineering
Mechanical Engineering
Engineering
Computer Science and Computer Engineering
“As a land grant institution, the University of Arkansas has a mission to provide innovative solutions to the challenges Arkansans face now and in the future. Engineering research holds the key to many of the environmental and economic issues in our state, nation and world, and at the U of A, the College of Engineering faculty have much to contribute from their labs. By nurturing our established research strengths, the college can ensure that our research program will remain robust and will help create solutions for the next generation.”
Heather Nachtmann, Ph.D.Associate Dean for Research
Professor of Industrial Engineering
213 279 306232260
FY 2011 FY 2012 FY 2013 FY 2014 FY 20150
100
200
300
0
50
100
150
200
250
300
350
400
Peer reviewed publications
20112010 2012 2013 2014
290 336 397312321
Research Proposals Submitted
Peer-reviewed Publications

College of Engineering 2015 Fact Book 25
Our future. Our progress.
Strategic Plan Objective Four: Increase research productivity
0
$5,000,000
$10,000,000
$15,000,000
$20,000,000
Research Grants Awarded
FY 2015FY 2014FY 2013FY 2012FY 2011
17.3M16.4M
10M10.5M
15.5M
0
$5,000,000
$10,000,000
$15,000,000
$20,000,000
$25,000,000
Research Expenditures
FY 2015FY 2014FY 2013FY 2012FY 2011
20.9M 20.9M
17.7M
13.3M15.9M
0
50
100
150
200
250
300
350
400
Ph.D.
Master's
2011 2012 2013 2014 2015
380
329356365360
Doctoral Master's
New Research Grants Received
Total Research Activity/Expenditures*
Advanced Degrees Awarded
Research Activity/ Expenditures by Department
Civil Engineering
Electrical Engineering
$1M $2M $3M $4M $5M
Preparing for Tomorrow:• We plan to recruit innovative faculty
through endowed chairs in the top five areas of research strength and the 10 emerging research areas.
• We would also like to establish incentive funds for faculty who pursue innovative research.
Alan Mantooth, Ph.D., Distinguished Professor of electrical engineering, holder of The Twenty-First Century Research Leadership Chair and Arkansas Research Alliance fellow. Mantooth received the 2015 College of Engineering Most Engaging Research Faculty Award for his work in power electronics.
Julie Carrier, Ph.D., professor of biological and agricultural engineering, earned the 2015 John L. Imhoff Award for Research for her work in biochemicals.
* As reported to ASEE.

26 Our stories. Our progress. Our future.
RE
SE
AR
CH
ST
RE
NG
TH
S
In January 2014, a research task force appointed by
dean John English identified existing and emerging
strengths in the college. Existing strengths are
those areas where the college is already nationally recognized. Emerging areas are fields where the college
has some key presence, expertise and momentum.
These are expected to emerge into strengths with additional investment. The full report can be found at
http://engineering.uark.edu/about-us/strategic-
plan/research-strategy.php
ElectronicsThe College of Engineering has been producing graduates focused on electronics for over 30 years. Researchers in this area are developing new materials for circuits and photovoltaic cells, designing and modeling circuits, creating packages that protect and integrate electronic devices, and creating and testing new technologies to improve our power grid.
EnergyThe broad area of energy has a foundation in electronics, but has expanded to include power systems, energy storage, smart grid innovation, biofuels, and oil and gas research. As the world struggles to find and integrate safer and more sustainable sources of energy, research in this field is more important than ever.
Healthcare Systems EngineeringThis research area focuses on reducing costs and improving quality in the healthcare industry by optimizing the way supplies and therapies are administered. Researchers look at many different aspects of the healthcare industry, including supply chain costs, medical decision making, therapy scheduling, statistical monitoring and detection of epidemics.
Nanomaterials Science and EngineeringThe nanotechnology area has existed for about 15 years. Researchers in this area use computational modeling to design and model novel nanoscale materials, synthesize them, integrate them into devices and device packaging, create advanced nanomaterial coatings, use nanoscience to improve photovoltaic and thermoelectric technologies and study biological materials on the nanoscale in order to create new bio-inspired surfaces and materials.
Transportation and LogisticsThe College of Engineering has been a national leader in transportation and logistics for more than twenty years. Researchers are looking at distribution, transportation, information technology and software solutions, and maritime and multimodal transportation.
E X I S T I N Gstrengths
•CentersinthisareaincludeHighDensityElectronics Center, the Institute for Nanoscience and Engineering, Grid-Connected Advanced Power Electronics Systems and the National Center for Reliable Electronic Power Transmission
•Over$5millionperyearinresearchexpenditures•Severalstartupcompanieshaveemergedfrom
this area
•TheGRAPESandNCREPTcentersarefocusedonenergy research, with research expenditures of $2millionperyear
•Biofuelresearchinchemicalandbiologicalengineering is supported by the National Science Foundation,theDepartmentofEnergyandtheDepartmentofTransportation
•Combiningelectronicsandnon-electronicsenergyresearch could lead to the development of future research centers
•Muchoftheresearchinthisareaisconductedthrough the Center for Innovation in Healthcare Logistics (CIHL)
•CIHLhashad$3millioninresearchexpendituresover the past 5 years
•Researchersinthisareacollaboratewithindustryand share findings with the healthcare community
•Nanomaterialsresearchisconductedatthe Institute for Nanoscience and Engineering and supportedbymicro-fabricationfacilitiesatHiDECand in labs throughout the college
•Annualresearchexpendituresforthecollegein thisareaareapproximately$2millionperyear
•Companiessuchastheaward-winningNanoMech,co-founded by a faculty member in mechanical engineering, are demonstrating successful tech transfer in this area
•CentersincludetheCenterforExcellenceinLogisticsandDistributionandtheMack-BlackwellRuralTransportation Center
•Researchexpenditurestotalapproximately $2millionperyear
•ThecollegeworkscloselywiththeArkansasStateHighwayandTransportationDepartmentandmanyother transportation stakeholders across the nation
Technology has increased the amount of data we produce, leading to an increased need to analyze this data.
Researchers are looking at increasing security, especially in the areas of ports, transportation and the power grid.
With the new biomedical engineering department, the college is poised to marry technical and biological research in this area.
As a land-grant institution, the U of A has a responsibility to maintain the nation’s water and electric resources, communications and transportation.
Keeping manufacturing jobs in America and maintaining our competitiveness in this area is key for economic growth.
This field is emerging from the broader field of electronics. It involves new semiconductor materials, biophotonics and photovoltaics.
Faculty across the college are engaged in some form of research involving sustainable practices, design or technologies.
This area encompasses research in automation, robotics and systems and process control, and inspires keen interest in our students.
MaterialsandManufacturingEMERGING
areasAerospace BigDataAnalytics Cybersecurity Healthcare Infrastructure The U of A is moving to respond to this area, which is the single largest export market from the state of Arkansas.
Optoelectronics Sustainability Water Research in this area includes water quality, wastewater treatment and watershed management.
Systems Integration
FAC
ULT
YFA
CU
LTY
FAC
ULT
YFA
CU
LTY
FAC
ULT
Y
DEPA
RTMENTS
DEPA
RTMENTS
DEPA
RTMENTS
DEPA
RTMENTS
DEPA
RTMENTS
CE
NT
ER
SC
EN
TE
RS
CE
NT
ER
S
CE
NT
ER
S
CE
NT
ER
S
univ
ersi
ty o
f ark
ansa
s co
llege
of e
ngin
eerin
g

College of Engineering 2015 Fact Book 27
RE
SE
AR
CH
ST
RE
NG
TH
S
In January 2014, a research task force appointed by
dean John English identified existing and emerging
strengths in the college. Existing strengths are
those areas where the college is already nationally recognized. Emerging areas are fields where the college
has some key presence, expertise and momentum.
These are expected to emerge into strengths with additional investment. The full report can be found at
http://engineering.uark.edu/about-us/strategic-
plan/research-strategy.php
ElectronicsThe College of Engineering has been producing graduates focused on electronics for over 30 years. Researchers in this area are developing new materials for circuits and photovoltaic cells, designing and modeling circuits, creating packages that protect and integrate electronic devices, and creating and testing new technologies to improve our power grid.
EnergyThe broad area of energy has a foundation in electronics, but has expanded to include power systems, energy storage, smart grid innovation, biofuels, and oil and gas research. As the world struggles to find and integrate safer and more sustainable sources of energy, research in this field is more important than ever.
Healthcare Systems EngineeringThis research area focuses on reducing costs and improving quality in the healthcare industry by optimizing the way supplies and therapies are administered. Researchers look at many different aspects of the healthcare industry, including supply chain costs, medical decision making, therapy scheduling, statistical monitoring and detection of epidemics.
Nanomaterials Science and EngineeringThe nanotechnology area has existed for about 15 years. Researchers in this area use computational modeling to design and model novel nanoscale materials, synthesize them, integrate them into devices and device packaging, create advanced nanomaterial coatings, use nanoscience to improve photovoltaic and thermoelectric technologies and study biological materials on the nanoscale in order to create new bio-inspired surfaces and materials.
Transportation and LogisticsThe College of Engineering has been a national leader in transportation and logistics for more than twenty years. Researchers are looking at distribution, transportation, information technology and software solutions, and maritime and multimodal transportation.
E X I S T I N Gstrengths
•CentersinthisareaincludeHighDensityElectronics Center, the Institute for Nanoscience and Engineering, Grid-Connected Advanced Power Electronics Systems and the National Center for Reliable Electronic Power Transmission
•Over$5millionperyearinresearchexpenditures•Severalstartupcompanieshaveemergedfrom
this area
•TheGRAPESandNCREPTcentersarefocusedonenergy research, with research expenditures of $2millionperyear
•Biofuelresearchinchemicalandbiologicalengineering is supported by the National Science Foundation,theDepartmentofEnergyandtheDepartmentofTransportation
•Combiningelectronicsandnon-electronicsenergyresearch could lead to the development of future research centers
•Muchoftheresearchinthisareaisconductedthrough the Center for Innovation in Healthcare Logistics (CIHL)
•CIHLhashad$3millioninresearchexpendituresover the past 5 years
•Researchersinthisareacollaboratewithindustryand share findings with the healthcare community
•Nanomaterialsresearchisconductedatthe Institute for Nanoscience and Engineering and supportedbymicro-fabricationfacilitiesatHiDECand in labs throughout the college
•Annualresearchexpendituresforthecollegein thisareaareapproximately$2millionperyear
•Companiessuchastheaward-winningNanoMech,co-founded by a faculty member in mechanical engineering, are demonstrating successful tech transfer in this area
•CentersincludetheCenterforExcellenceinLogisticsandDistributionandtheMack-BlackwellRuralTransportation Center
•Researchexpenditurestotalapproximately $2millionperyear
•ThecollegeworkscloselywiththeArkansasStateHighwayandTransportationDepartmentandmanyother transportation stakeholders across the nation
Technology has increased the amount of data we produce, leading to an increased need to analyze this data.
Researchers are looking at increasing security, especially in the areas of ports, transportation and the power grid.
With the new biomedical engineering department, the college is poised to marry technical and biological research in this area.
As a land-grant institution, the U of A has a responsibility to maintain the nation’s water and electric resources, communications and transportation.
Keeping manufacturing jobs in America and maintaining our competitiveness in this area is key for economic growth.
This field is emerging from the broader field of electronics. It involves new semiconductor materials, biophotonics and photovoltaics.
Faculty across the college are engaged in some form of research involving sustainable practices, design or technologies.
This area encompasses research in automation, robotics and systems and process control, and inspires keen interest in our students.
MaterialsandManufacturingEMERGING
areasAerospace BigDataAnalytics Cybersecurity Healthcare Infrastructure The U of A is moving to respond to this area, which is the single largest export market from the state of Arkansas.
Optoelectronics Sustainability Water Research in this area includes water quality, wastewater treatment and watershed management.
Systems Integration
FAC
ULT
YFA
CU
LTY
FAC
ULT
YFA
CU
LTY
FAC
ULT
Y
DEPA
RTMENTS
DEPA
RTMENTS
DEPA
RTMENTS
DEPA
RTMENTS
DEPA
RTMENTS
CE
NT
ER
SC
EN
TE
RS
CE
NT
ER
S
CE
NT
ER
S
CE
NT
ER
S
univ
ersi
ty o
f ark
ansa
s co
llege
of e
ngin
eerin
g

28 Our stories. Our progress. Our future.
Our stories.
Strategic Plan Objective Five: Increase economic development
College of Engineering Startup CompaniesSince 1990, 23 companies ( ■ ) have been created based on engineering research at the U of A.
1990■
1999■
2003■
2004■
2005■ ■ ■ ■ ■ ■ ■ ■
2007■ ■
2008■
2009 ■ ■ ■ ■
2010■
2011■
2014■ ■
“The University of Arkansas and the College of Engineering have always been a great support to my education and exploration as a scientist and entrepreneur. From starting as an Honors College Fellow all the way through grad school as a Doctoral Academy Fellow, the school has been there providing support, resources and opportunities for me to be successful.”
Ellen Brune, Ph.D.B.S.Ch.E ’09, M.S.Ch.E. ’13, Ph.D. ’13
Founder and CEOBoston Mountain Biotech, LLC

College of Engineering 2015 Fact Book 29
Our future. Our progress.
Strategic Plan Objective Five: Increase economic development
0
$5,000,000
$10,000,000
$15,000,000
$20,000,000
$25,000,000Industry
State
Federal
Other**
FY 2011
20.9M 20.9M
17.7M
13.3M
15.9M
FY 2012 FY 2013 FY 2014 FY 2015
* As reported to ASEE.
** Other category includes: foreign governments, foundations, other non-governments
Research Expenditures by Source
0
5
10
15
20
Invention Disclosures
FY 2015FY 2014FY 2013FY 2012FY 2011
12 11 121811
Research Expenditures by Source*
Invention Disclosures
0
1
2
3
4
5
6
Patents Awarded
FY 2011 FY 2012 FY 2013 FY 2014 FY 2015
3 6 532
Patents Awarded
Douglas Hutchings, Ph.D. ’13, and Seth Shumate, Ph.D. ’15, are the founders of Silicon Solar Solutions and Picasolar. These two companies, which have office and lab space at the Arkansas Research and Technology Park, are creating more efficient solar cells.
Preparing for Tomorrow:• We plan to encourage faculty
development in entrepreneurship, by providing opportunities such as commercial concept testing, academics in residence positions in industry, economic development initiatives and community service.

30 Our stories. Our progress. Our future.
Our stories.
Strategic Plan Objective Six: Increase alumni and corporate partnerships
“I believe a steady exchange of ideas between university leadership and its alumni is vital to both the economic and educational success of the university. Alumni are a resource for advice and political and financial support for the college. They also play an important role as future employers of the engineers who graduate from the university.
“I owe a large part of my success to my engineering degree from the U of A. I was able to earn my degree due to the support provided by my family and the scholarship aid furnished by College of Engineering alumni. This has motivated me to support the College of Engineering so I can return the kindness and support that was afforded me early in life.”
Grady HarvellB.S.C.E ’72
President of AFCO SteelChairman of the College of Engineering
Advisory Council
Percent of alumni who give
FY 2015FY 2014FY 2013FY 2012FY 2011
20% 19% 18%19%20%
0
20
10
Percentage of Alumni Who Give
Alumni By State
Alumni By Country
3000 + 1000 -2999600-999 500-599 400-499 200-399 100-199 1-99
Our Students’ Home States
AR
AK
CACO
CT
VT
HI
NH
MA
DE
NJ
MD
DC
NV
FL
GAALMS
LATX
OKNM
AZ
UT
OR
ID
WY
NE
KS MO
IL
TN
SC
NC
VAWV
KY
INOH
WIMI
NY
PA
MEWA
IA
SD
MT ND
MN
RI
1,000 +125-99940-124 20-3911-191-10

College of Engineering 2015 Fact Book 31
Our future. Our progress.
Strategic Plan Objective Six: Increase alumni and corporate partnerships
Endowed Faculty
FY 2015FY 2014FY 2013FY 2012FY 2011
31 32 323231
0
15
5
25
35
0
$3,000,000
$6,000,000
$9,000,000
$12,000,000
$15,000,000
Alumni Giving
FY 2011 FY 2012 FY 2013 FY 2014 FY 2015
ReceiptsProduction
Endowed Scholarships and Fellowships
Endowed Faculty Positions
Philanthropic Giving
2015 Hall of Fame Award• Hugh H. Brewer, B.S.E.E. ’59, retired owner and
president, Upchurch Electrical Supply• Jim M. Hefley, B.S.I.E ’61, retired executive vice
president, Gemini Consulting
2015 Distinguished Alumni Award• Sam K. Alley, B.S.C.E. ’79, chairman and chief
executive officer, VCC• Melinda Pettet Faubel, B.S.I.E. ’80, director of
external affairs, AT&T Arkansas• William Brock Johnson, B.S.C.E. ’72, M.S.C.E.
’80, president and chief executive officer, Garver Engineers (posthumous award)
• Jeffrey D. Madden, B.S.Ag.E. ’88, director of engineering and construction services, Riceland Foods Inc.
• George Eugene “Gene” Mann, B.S.M.E. ’63, B.S.C.E. ’65, retired directorate of public works, Red River Army Depot
• Adam Monroe, B.S.Ch.E. ’88, president, Americas, Novozymes
• Rebecca Wilson, B.S.C.S.E. ’92, service delivery manager, Microsoft Corp.
2015 Early Career Award• Shawn Brewer, B.S.B.A.E. ’95, M.S.B.A.E. ’98,
hydraulic engineer, USDA Natural Resources Conservation Service
• Jesse Buffington, B.S.M.E. ’07, B.S. ’12, lead, exploration EVA strategy and architecture integration, NASA’s Johnson Space Center
• Edgar Cilio, B.S.E.E. ’04, M.S.E.E. ’08, engineering manager, APEI
• Timothy Doolittle, B.S.Ch.E. ’97, global process technology associate, The Dow Chemical Co.
• Jaysson Funkhouser, B.S.C.E. ’98, M.S.C.E. ’00, assistant director, U.S. Geological Survey
• William Richardson, B.S.B.E. ’07, postdoctoral research fellow, University of Virginia Health System
• Ami Spivey, B.S.I.E. ’95, senior vice president, Walmart International
• Jeremy W. Stobaugh, B.S.C.S.E. ’00, M.B.A. ’10, director of information services, J.B. Hunt Transport Services Inc.
For more information, see Gifts and Endowments chart on Appendix page 37.
FY 2011 FY 2012 FY 2013 FY 2014 FY 20150
200
400
600
800
1,000
1,200Non Endowed
Future Planned Endowment
Future Endowment
Permanent Endowment
Quasi Endowment
■ Quasi Endowment ■ Permanent Endowment■ Future Endowment
■ Future Planned Endowment■ Non Endowed

32 Our stories. Our progress. Our future.
Our stories.
Strategic Plan Objective Seven: Provide high quality infrastructure
“Not only do we need increasing classroom space for our burgeoning enrollment, our laboratory space will determine our research growth.”
John R. English, Ph.D., P.E.Dean
Academic Space
$546,000Research Space
$304,000
2015
Ren
ovat
ions
2015
Ren
ovat
ions Academic Space
5,236 square feet
Research Space
8,200 square feet

College of Engineering 2015 Fact Book 33
Our future. Our progress.
Strategic Plan Objective Seven: Provide high quality infrastructure
Preparing for Tomorrow:• Construction of the CEREC will provide
research space for structures analyses and allow the Department of Civil Engineering to remain regionally competitive.
• The college plans major renovations to John A. White, Jr. Engineering Hall. This historic building has housed engineering classes and labs since 1927. We plan to upgrade the space and create a classic interior that pays homage to the building’s rich history.
A rendering of what the inside of the Civil Engineering Research and Education Center (CEREC), a facility for the study of structures, might look like.
2015
Tot
al Academic Space
77,416 square feetResearch Space
92,272 square feet

34 Our stories. Our progress. Our future.

College of Engineering 2015 Fact Book 35

36 Our stories. Our progress. Our future.
FY 2011 FY2012 FY 2013 FY 2014 FY 2015
Salary and Benefits $14,192,862 29.64% $16,248,982 30.71% $16,572,659 31.95% $17,363,641 34.19% $18,744,220 36.95%
Operating Expenditures 1,588,827 3.32% 1,828,291 3.46% $2,751,265 5.30% $2,615,636 5.15% $1,301,172 2.56%
Dept Restricted Fees/Misc 2,209,167 4.61% 2,385,329 4.51% $2,466,727 4.76% $2,773,673 5.46% $1,239,293 2.44%
Student Equipment Fees 1,101,442 2.30% 1,786,399 3.38% $1,606,694 3.10% $2,122,512 4.18% $2,241,529 4.42%
Scholarships 289,681 0.60% 369,645 0.70% $302,547 0.58% $1,193,379 2.35% $758,241 1.49%
Research* 23,653,834 49.39% 25,116,772 47.48% $23,972,316 46.22% $20,729,821 40.81% $22,476,266 44.30%
Total 43,035,813 89.86% 47,735,418 90.23% $47,672,208 91.91% $46,798,662 92.14% $46,760,722 92.17%
* Reported and compiled by the U of A Research Accounting Office and submitted to NSF.
Expenditures (excluding gifts)
Revenues (excluding gifts)FY 2011 FY 2012 FY 2013 FY 2014 FY 2015
State Appropriations & Tuition $17,434,865 38.91% $18,231,900 40.16% $20,117,970 46.86% $20,787,672 48.42% $21,712,044 45.81%
Distance Learning Revenues, Ft Smith, Service Centers, Conferences
$3,429,109 7.65% $3,606,851 7.95% $3,335,980 7.77% $3,103,014 7.23% $3,140,177 6.63%
Research Incentive Funds $1,789,723 3.99% $1,714,543 3.78% $1,635,454 3.81% $1,643,657 3.83% $942,325 1.99%
Biological Engineering Teaching and Agricultural Experiment Station*
$1,651,146 3.69% $1,758,085 3.87% $1,947,726 4.54% $1,787,000 4.16% $1,851,719 3.91%
Sponsored Research** $15,029,997 33.55% $16,005,505 35.26% $14,930,781 34.78% $11,805,030 27.49% $15,907,692 33.57%
Sponsored Activities and Scholarships
$1,346,405 3.01% $1,718,175 3.78% $1,336,218 3.11% $1,518,160 3.54% $1,537,123 3.24%
Student Equipment Fee Revenues (TELE-net)
$1,429,442 3.19% $1,767,505 3.89% $2,092,715 4.87% $2,286,709 5.33% $2,302,119 4.86%
Total $42,110,687 $44,802,564 $45,396,844 $42,931,241 $47,393,199
Revenues $47,393,199
- Expenditures -$46,760,722
+ Gifts (net) $3,354,798 2015 Financial Position $3,987,275
Financial Position
* Cooperative Extension Service not included.** As reported to ASEE and USNWR.

College of Engineering 2015 Fact Book 37
Revenue FY 2011 FY 2012 FY 2013 FY 2014 FY 2015Contributions - Expendable $1,961,124 $1,222,770 $2,709,746 $1,126,807 $871,121 Contributions - Endowed & Restricted Gifts $2,797,204 $956,115 $1,072,257 $5,238,427 $3,620,544 Investment Income: Expendable $2,132,333 $2,133,632 $2,322,307 $2,577,659 $2,617,325 Endowed (reinvestment) $3,680 $1,090 $1,042 $0 $0 Endowed Market Value Adjustment $6,618,498 ($1,170,897) $4,133,111 $6,979,898 ($298,852)Net Transfers and Allocations $244,658 $33,732 $13,743 ($1,224,342) $0 Total Revenue $13,757,497 $3,176,442 $10,252,206 $14,698,448 $6,810,138
Expenditures FY 2011 FY 2012 FY 2013 FY 2014 FY 2015Scholarships and Student Support $904,468 $1,017,287 $1,119,101 $1,154,870 $836,285 Other College Support $3,364,245 $3,576,456 $2,574,873 $2,272,358 $2,154,828 Capital Outlays $97,135 $108,988 $152,525 $218,170 $72,484 Development costs** $486,472 $466,370 $350,435 $347,631 $391,743 Total Expenditures $4,852,320 $5,169,101 $4,196,934 $3,993,030 $3,455,340 Revenues less Expenditures $8,905,177 ($1,992,659) $6,055,272 $10,705,419 $3,354,798
Gifts and Endowments*
* Planned and Charitable Remainder Trust Accounts are not reported.** Development costs budgeted from U of A Foundation funds and includes administrative overhead charges to gift revenues.
FY 2011 FY 2012 FY 2013 FY 2014 FY 2015Cash and Cash Equivalents - Expendable $9,757,844 $8,245,875 $9,411,703 $8,219,552 $11,335,354 Pooled Investment Funds - Endowments $43,327,810 $42,994,532 $46,329,354 $55,042,921 $52,222,964 Scholarship Endowments $8,388,097 $8,284,086 $9,643,672 $12,348,260 $14,376,759 Fellowship Endowments $3,066,491 $2,983,974 $3,305,901 $3,785,316 $3,991,624 Total Fund Balances $64,540,242 $62,508,467 $68,690,630 $79,396,049 $81,926,701
Gifts and Endowments Financial Position* Endowment Funds Held with the University of Arkansas Foundation, University of Arkansas, and Agricultural Development Council
* Planned / Charitable Remainder Trust Accounts are not reported. Biological Engineering accounts retroactively reported with Engineering.

38 Our stories. Our progress. Our future.
Master of Science in Operations ManagementYear Number of Courses Offered Student Credit Hours2011 28 10,2602012 28 9,6692013 28 8,9432014 29 8,9942015 30 9,537
Master of Science in EngineeringYear Number of Courses Offered Student Credit Hours2010 38 1082011 55 3632012 59 6092013 61 9572014 62 1,1162015 65 1,182
Distance Education
The Master of Science in Engineering program has been offering online degrees since 2009. It is a fully-accredited program taught by graduate faculty from the College of Engineering. This program is designed for students who want to further their education in a variety of engineering topics, and its graduates are well-prepared for a career in engineering and management of engineering systems, processes and organizations.
This program is consistently ranked in the top 30 for best online graduate engineering programs and best online graduate engineering programs for veterans by U.S. News & World Report.
The Master of Science in Operations Management program was established in 1974 and since that time it has become the largest graduate degree program offered by the University. The purpose of the program is to create value through efficiency by applying the strategic, tactical and operational activities of operations management. The program offers classes at several graduate resident centers across the region. Students may complete all the requirements for the program at one of these centers, at the Fayetteville campus, or online.

College of Engineering 2015 Fact Book 39
Distance Education Faculty Elected as Fellows of Professional Societies
National Academy of EngineeringMike Johnson
John White
ASM InternationalAshok SaxenaAjay Malshe
ASHRAEDarin Nutter
American Concrete InstituteFrances GriffithMicah Hale
American Institute for Medical and Biological EngineeringD. Keith RoperLalit Verma
American Society for Engineering EducationNorman DennisKim NeedyJohn White
American Society for Engineering ManagementHeather NachtmannKim Needy
American Society for Testing and MaterialsAshok Saxena
American Institute of Aeronautics and AstronauticsJim Rankin
American Society of Agricultural and Biological EngineersLalit VermaYanbin LiOtto Loewer
American Institute of Chemical EngineersRobert BabcockTom SpicerRanil Wickramasinghe
American Society of Civil EngineersNorman DennisFindlay EdwardsErnie HeymsfieldMike JohnsonR. Panneer Selvam
American Society for Engineering ManagementHeather Nachtmann
American Society of Mechanical EngineersRick CouvillionAjay Malshe
Arkansas Research AllianceAlan Mantooth
City and Guilds of London Institute (UK)Simon Ang
Electrochemical SocietySimon Ang
Indian Society of Agricultural EngineersLalit Verma
Institute for Operations Research and Management SciencesGreg ParnellJohn White
Institute of Biological EngineeringLalit Verma
Institute of Electrical and Electronics EngineersSimon AngSamir El-GhazalyAlan Mantooth
Institute of Engineering and Technology (UK)Simon AngOmar Manasreh
Institute of Industrial EngineersRichard CassadyJohn EnglishKim NeedyEdward PohlManuel RossettiJohn White
International Academy of Production EngineeringAjay Malshe
International Congress on FractureAshok Saxena
International Council on Systems EngineeringGreg Parnell
Lean Systems SocietyGreg Parnell
Military Operations Research SocietyGreg Parnell
National Academy of ConstructionMike Johnson
National Academy of InventorsHameed Naseem
Society of American Military EngineersMike Johnson
Society for Decision ProfessionalsGreg Parnell
Society of Reliability EngineersRichard Cassady
Society of Tribologists and Lubrication EngineersMin Zou

40 Our stories. Our progress. Our future.
College of Engineering Contacts
John English Dean of the College of Engineering Irma F. and Raymond F. Giffels Endowed Chair in Engineering [email protected] Assistant to the Dean: Kristy Fink (479) 575-7455
Senior Administrative Team
Norman Dennis Senior Associate Dean [email protected]
Heather Nachtmann Associate Dean for Research [email protected]
Assistant to the Associate Deans: Rifati Raindriati (479) 575-6010
Kelly Sartorius Senior Director of Development and External Relations [email protected] Development Manager: Stella Clark (479) 575-4092
Senior Staff
Kim Bullard Director of Student Records [email protected] (479) 575-3053
Thomas Carter III Assistant Dean for Student Services and Student Affairs [email protected] (479) 575-5009
Richard Cassady Director of the Freshman Engineering Program [email protected] (479) 575-6735
Shannon Davis Assistant Dean for Research [email protected] (479) 575-8412
Larry Esch Assistant Dean for Finance [email protected] (479) 575-5699
Brian Henderson Director of Employer Relations [email protected] (479) 575-6265
Bryan Hill Assistant Dean for Student Recruitment, Honors and International Programs [email protected] (479) 575-7236
Camilla Shumaker Director of Communication [email protected] (479) 575-5697
Eric Specking Director of Recruitment [email protected] (479) 575-7780

College of Engineering Advisory Council
Grady E. Harvell, Council Chair President
AFCO Steel
Troy AlleyExecutive Vice President and COOCon-Real, Inc.
Bami BastaniSenior Vice President Radio Frequency Business Unit Global Foundries
Sherman L. BlackCEOQUMU Corporation
Kevin W. BrownExecutive Vice President, Manufacturing and RefiningLyondell Basell Industries
G. Kent Burnett Senior Vice President of IT and e-commerce Dillard’s Department Stores, Inc.
Ansel L. Condray Chairman and Production Director (retired) ExxonMobil International, Ltd.
William L. Cravens Chairman (retired) Alltel Information Services, Inc.
Robert A. Davidson President and CEO (retired) Arkansas Best Corporation
Melinda Faubel Director of External Affairs AT&T Arkansas
Alan D. FortenberryCEOBeaver Water District
David D. Foust President and CEO (retired) Seneca Wire & Manufacturing Company
Jack A. Giles General Partner and Consultant Urban Spaces, LLC
Bob HarrisonVice President/PrincipalECCI
Kendall T. HarrisDeanRoy G. Perry College of Engineering, Prairie View A&M University
David HumphreyVice President, Investor Relations and Corporate CommunicationsArcBest Corporation
Prakash Jalihal Senior Advisor (retired)Global Technology Deployment Initiative Fidelity National Information Services
James S. “Jon” Keel Founder and CEO Improved Results, LLC
Jack King President and CEO (retired) Oglethorpe Power Corporation
Rodger S. Kline COO (retired) Acxiom Corporation
Vincent S. LyonsVice President, Machinery and Technology GroupPresident, Product DevelopmentLeggett and Platt, Inc.
John R. Marshall President and CEO Coastal Partners, Inc.
Charles F. “Micky” Mayfield Sales Vice President Coriant
James E. McClelland Jr. Chairman Emeritus McClelland Consulting Engineers, Inc.
Marji McNeill Vice President and Director, Compliance and Ethics Flint Hills Resources
Adam Monroe President - Americas Novozymes
Tom L. Pierson Founder and Chief Technology Officer TAS Energy
Kirk Pond Chairman, CEO and President (retired) Fairchild Semiconductor International, Inc.
Karl D. SchubertVice President and Global Head ofDevelopment and CTOHardware OmniCo Group
Ami Spivey Senior Vice PresidentInternational Business Processes, Walmart Stores, Inc.
Larry Stephens Chairman of the Board Mid-South Engineering Company
Julian Stewart Sales and Marketing (retired) IBM Corporation
W. Robert Storey Principal Director, The MVR CompanyManging Directory, VIC Technology Venture Development
Dan WilliamsPresident and CEO/Chairman of the BoardGarver Engineers
Charles Zimmerman Vice President, International Design and Construction Walmart Stores, Inc.

engineering.uark.edu
Preparing You For Your Tomorrow
College of Engineering4183 Bell Engineering Center
University of ArkansasFayetteville, AR 72701