college choice, consumer behavior, and gender enrollment
TRANSCRIPT

Rowan University Rowan University
Rowan Digital Works Rowan Digital Works
Theses and Dissertations
4-1-2020
College choice, consumer behavior, and gender enrollment College choice, consumer behavior, and gender enrollment
patterns: A mixed methods case study of Marathon University patterns: A mixed methods case study of Marathon University
Jessica I. Syed Rowan University
Follow this and additional works at: https://rdw.rowan.edu/etd
Part of the Higher Education Commons
Recommended Citation Recommended Citation Syed, Jessica I., "College choice, consumer behavior, and gender enrollment patterns: A mixed methods case study of Marathon University" (2020). Theses and Dissertations. 2767. https://rdw.rowan.edu/etd/2767
This Dissertation is brought to you for free and open access by Rowan Digital Works. It has been accepted for inclusion in Theses and Dissertations by an authorized administrator of Rowan Digital Works. For more information, please contact [email protected].
COLLEGE CHOICE, CONSUMER BEHAVIOR, AND GENDER ENROLLMENT
PATTERNS: A MIXED METHODS CASE STUDY OF MARATHON
UNIVERSITY
by
Jessica I. Syed
A Dissertation
Submitted to the
Department of Educational Services and Leadership
College of Education
In partial fulfillment of the requirement
For the degree of
Doctor of Education
at
Rowan University
March 10, 2020
Dissertation Advisor: Ane Johnson, Ph.D

© 2020 Jessica I. Syed
Dedication
This dissertation is dedicated to my husband, Farid. Without you, I never would
have had the courage to start this program, let alone finish it. Thank you for the constant
support, encouragement, and motivation you have provided me throughout this process.
You have taught me that I am capable of doing anything I set my mind to, given me the
confidence to persevere throughout the highs and lows of this program, and helped me to
discover my own strength. Together as a team, we made this degree a top priority for our
family and arranged our lives around my education for the past four years. I am thrilled to
share this achievement with you and could not be more excited to embark on our next
adventure together.
iv
Acknowledgments
I would like to express my sincerest gratitude to my dissertation chairperson, Dr.
Ane Johnson. I cannot thank you enough for your unwavering support throughout this
process and for always encouraging me to strive for excellence. I am grateful for your
continuous guidance, constant feedback, and your ability to push me beyond where I
thought I was capable of going. Since the start of my journey into higher education, you
have always challenged, supported, and believed in me, and this accomplishment would
not have been possible without you.
I am truly fortunate to have had the best dissertation committee in Dr. Ane
Johnson, Dr. Sarah Ferguson, and Dr. Rory McElwee. I look up to all of you as strong,
professional women in higher education and you have each taught me invaluable lessons
during my time at Rowan. Dr. Ferguson, your wisdom about my research and your ability
to make the most overwhelming situations seem manageable was invaluable. Thank you
for giving me the confidence to pursue quantitative analysis, and for teaching me to
believe in myself. Dr. McElwee, I have looked up to you for many years and am honored
that you were part of my committee. Thank you for always being a role model and
mentor to me, both personally and professionally.
I would not have succeeded in this journey without my incredible cohort. We
have had our share of challenges and successes, and I’m privileged to call you my friends
and classmates. I am forever grateful to have shared this experience with each of you.
To my family, friends, colleagues, and husband, thank you for your
encouragement, patience, and interest in my studies over the past four years – your love
and support helped me cross this finish line!

v
Abstract
Jessica Syed
COLLEGE CHOICE, CONSUMER BEHAVIOR, AND GENDER ENROLLMENT
PATTERNS: A MIXED METHODS CASE STUDY OF MARATHON UNIVERSITY
2019-2020
Ane Johnson, Ph.D.
Doctor of Education
Gender and enrollment patterns in higher education have changed over the past 40
years, where women are now the majority of students enrolling in colleges and
universities nationally each year compared to men (U.S. Department of Education,
2018b). Despite enrollment trends indicating a dramatic increase of female students at
colleges and universities, Marathon University has experienced the opposite. The purpose
of this concurrent, mixed methods case studies was to identify why female students are
choosing not to enroll at Marathon University, despite relatively even rates of application
and admission compared to male students. The intent of this study was to use college
choice and consumer decision-making models to determine how women make decisions
about enrollment at Marathon University, noting the marketized and privatized landscape
of higher education today. Secondary institutional data of admitted students were
analyzed through a multinomial logistic regression, while secondary open-ended accepted
student survey results were analyzed through content analysis. After each initial analysis,
the findings were compared and contrasted to determine the ways that qualitative survey
results helped to explain quantitative institutional data about college choice between male
and female students.

vi
Table of Contents
Abstract ............................................................................................................................... v
List of Figures .................................................................................................................... xi
List of Tables .................................................................................................................... xii
Chapter 1: Introduction ..................................................................................................... 13
Social Construct of Gender ......................................................................................... 14
Gender Equality in Education ..................................................................................... 17
Historical Context of Gender in Higher Education ............................................. 19
Gender and Enrollment ............................................................................................... 20
Enrollment Trends in New Jersey. ........................................................................ 21
Problem Statement ...................................................................................................... 23
Purpose Statement ....................................................................................................... 25
Research Questions. .............................................................................................. 26
Definitions of Terms ................................................................................................... 27
Theoretical Framework ............................................................................................... 30
College Choice Model .......................................................................................... 30
Consumer Behavior Model . ................................................................................. 32
Delimitations ............................................................................................................... 33
Scope of the Study ................................................................................................ 33
Research Design ................................................................................................... 35
Gender & College Choice Decision-Making ........................................................ 38
Role as the Insider Researcher .............................................................................. 39
Significance of Study .................................................................................................. 41
Policy .................................................................................................................... 41
Practice .................................................................................................................. 42
vii
Table of Contents (Continued)
Research ................................................................................................................ 44
Overview ..................................................................................................................... 45
Chapter 2: Literature Review and Context of the Study ................................................... 47
College Choice Models ............................................................................................... 49
Economic Model ................................................................................................... 50
Sociological Model . ............................................................................................. 52
Information Processing Model .............................................................................. 54
Combined Models ................................................................................................. 55
Variables Involved in College Choice ........................................................................ 64
Personal Attributes Involved in College Choice ................................................... 65
Institutional Attributes Involved in College Choice. ............................................ 84
Decision-Making Conceptual Framework .................................................................. 90
Student as Consumer ............................................................................................ 92
Student Decision-Making & College Choice ....................................................... 95
Gender Implications of Consumer Decision-Making ........................................... 96
Decision-Making Models ..................................................................................... 98
Context of Study ....................................................................................................... 104
Chapter 3: Methodology ................................................................................................. 107
Research Questions ................................................................................................... 107
Rationale for and Assumptions of Mixed Methods Case Study Research ............... 108
Research Design ....................................................................................................... 110
Context ...................................................................................................................... 113
Scope ................................................................................................................... 113
Quantitative Secondary Data .................................................................................... 115
viii
Table of Contents (Continued)
Secondary Quantitative Dataset .......................................................................... 118
Data Cleaning Procedures ................................................................................... 121
Qualitative Data Collection ...................................................................................... 122
Participants .......................................................................................................... 123
Secondary Qualitative Dataset ............................................................................ 124
Instrumentation ................................................................................................... 125
Data Analysis ............................................................................................................ 126
Quantitative Secondary Data Analysis ............................................................... 126
Qualitative Survey Analysis ............................................................................... 128
Mixing and Interpretations ........................................................................................ 130
Mixed Methods Research Validity Measures ........................................................... 131
Roles of the Researcher ............................................................................................ 133
Ethical Considerations .............................................................................................. 135
Chapter 4: Findings ......................................................................................................... 137
Methodological Changes .......................................................................................... 138
Quantitative Analysis .......................................................................................... 138
Qualitative Analysis ............................................................................................ 140
Discussion of Findings .............................................................................................. 141
Quantitative Findings .......................................................................................... 142
Qualitative Findings ............................................................................................ 149
Integration of Findings .............................................................................................. 161
Conclusion ................................................................................................................ 166
Chapter 5: Finding the Fit: Gender, College Choice, and Consumer Behavior in
University Enrollment ..................................................................................................... 168
Abstract ........................................................................................................................... 168
ix
Tables of Contents (Continued)
Background of the Study .......................................................................................... 170
Theoretical Framework ............................................................................................. 171
College Choice Model ........................................................................................ 172
Consumer Behavior Model ................................................................................. 172
Gender Implications of Consumer Decision-Making ......................................... 174
Methods .................................................................................................................... 175
Secondary Qualitative Dataset ............................................................................ 177
Participants .......................................................................................................... 177
Data Analysis ...................................................................................................... 177
Findings .................................................................................................................... 179
Fit as Familiarity ................................................................................................. 180
Fit as Family ....................................................................................................... 182
Discussion & Recommendations .............................................................................. 183
Recommendations ............................................................................................... 184
Conclusion ................................................................................................................ 186
Chapter 6: Students as Consumers: The Impact of Gender on College Choice Decision-
Making ............................................................................................................................ 187
Abstract ........................................................................................................................... 187
Introduction ............................................................................................................... 187
College Choice & Consumer Decision-Making ....................................................... 189
Strategic Enrollment Management’s Understanding of the Student as
Consumer ............................................................................................................ 191
Gender and Consumer Decision-Making ........................................................... 193
Theoretical Framework ............................................................................................. 195
College Choice .................................................................................................... 195

x
Table of Contents (Continued)
Consumer Decision-Making. .............................................................................. 196
Methodology ............................................................................................................. 198
Quantitative Analysis .......................................................................................... 198
Qualitative Analysis ............................................................................................ 200
Mixing and Interpretations .................................................................................. 201
Results and Discussion ............................................................................................. 202
Findings from the Quantitative, Secondary Institutional Data ........................... 202
Findings from the Qualitative, Secondary Accepted Student Surveys ............... 207
Integration of Quantitative & Qualitative Analyses: Discussion ........................ 212
Conclusion ................................................................................................................ 217
References ....................................................................................................................... 219

xi
List of Figures
Figure Page
Figure 1. Case Study, Concurrent Mixed Methods Design: Single-Case Design (Yin,
2014) ................................................................................................................... 111
Figure 2. Independent Variables Related to College Choice Model Approaches (Park &
Hossler, 2014). .................................................................................................... 121
Figure 3. Weighted Word Cloud for Females Enrolled Second-Cycle Pattern Codes. .. 153
Figure 4. Weighted Word Cloud for Females Not Enrolled Second-Cycle Pattern
Codes................................................................................................................... 155
Figure 5. Weighted Word Cloud for Males Enrolled Second-Cycle Pattern Codes. ...... 155
Figure 6. Weighted Word Cloud for Males Not Enrolled Second-Cycle Pattern
Codes................................................................................................................... 156
Figure 7. Connection between Hossler & Gallagher’s (1987) Three-Stage College Choice
Model and Blackwell, Miniard, & Engel’s (2001) Consumer Behavior
Model .................................................................................................................. 173
Figure 7A: Connection between Hossler & Gallagher’s (1987) Three-Stage College
Choice Model and Blackwell, Miniard, & Engel’s (2001) Consumer Behavior
Model .................................................................................................................. 197
xii
List of Tables
Table Page
Table 1. Descriptive Statistics of Continuous Variables ................................................ 142
Table 2. Frequencies of Categorical Variables ............................................................... 142
Table 3. Mean and Standard Deviation of Continuous Variables Within Each
Population ....................................................................................................................... 143
Table 4. Pearson Correlations Between Predictors ......................................................... 144
Table 5. Classification .................................................................................................... 145
Table 6. Parameter Estimates from Multinomial Logistic Regression ........................... 146
Table 7. Code Map of Qualitative Accepted Student Survey Results ............................ 150
Table 8. Comparison of Populations and Frequency of College Choice Decision-Making
Factors Derived from Second Cycle Pattern Codes. ....................................................... 152
Table 8A. Comparison of Populations and Frequency of College Choice Decision-
Making Factors Derived from Second Cycle Pattern Codes. ......................................... 180
Table 4A. Pearson Correlations Between Predictors ...................................................... 200
Table 1A. Descriptive Statistics of Continous Variables ................................................ 203
Table 2A. Frequencies of Categorical Variables ............................................................ 203
Table 3A. Mean and Standard Deviation of ContinuousVariables Within Each
Population ....................................................................................................................... 204
Table 5A. Classification.................................................................................................. 204
Table 6A. Parameter Estimates from Multinomial Logistic Regression ........................ 205
Table 8B. Comparison of Populations and Frequency of College Choice Decision-
Making Factors Derived from Second Cycle Pattern Codes. ......................................... 209

13
Chapter 1
Introduction
Equality between genders1 has been a pervasive issue throughout history and
although great strides have been made, inequities for women still exist today (Tembon &
Fort, 2008). Social, economic, and educational consequences occur when women do not
have equal rights as men (Duflo, 2012; Grown, Gupta & Pande, 2005; International
Center for Research on Women, 2005; Morrison, Raju & Sinha, 2007; Tembon & Fort,
2008). As a result, it is especially crucial for women to have the same opportunities as
men in terms of education. In higher education, women historically were not granted the
same access as men, but in the past 40 years, the gender gap in higher education
enrollment has reversed and more female than male students are entering college
annually (Goldin, Katz, & Kuziemko, 2006; Peter & Horn, 2005).
Today, 56% of incoming undergraduate students in higher education nationwide
are female (U.S. Department of Education, 2018a; 2018b). Prior to this shift in the
enrollment gap, issues of gender inequality, access to education, and post-collegiate
outcomes for female students were pervasive in the literature regarding gender in higher
education. Instead, the conversation has now changed to focus on increasing
opportunities in higher education for male students as a result of current female
advantages (DiPrete & Buchmann, 2013; Jacobs, 1996). Although the current trend
indicates that the majority of enrolled students nationwide are women, this phenomenon
1 The terms “gender” and “sex” will both be used throughout this study. Scholars often use the words
interchangeably in research, not only in terms of labels, but also in terms of how each label is then defined.
For the purpose of this study, a sharp distinction between the terms “gender” and “sex” will not be drawn,
though this distinction may be considered important by some scholars (Lorber, 1994). Generally, the term
“gender” will be used when referring to social implications, the phenomenon of decision-making, and
discussion of differences between men and women. Discussion on data collection and analysis will use the
term “sex” when referring to male and female data.
14
does not occur at all institutions. Fewer first-time, full-time, undergraduate female
students than male students enroll each year at Marathon University, a four-year, public
institution in the northeastern region of the United States. This enrollment pattern creates
an issue in that the gender disparities among students yielding at Marathon University
may have educational, economic, and social justice implications in a time of
marketization and privatization of higher education (Kwong, 2000; Marginson, 2010).
Social Construct of Gender
Gender is a social construct that has societal implications for both men and
women. Gender differs from sex, which is a biological differentiation based on a person’s
physical anatomy (Pelletier et al., 2016). Gender norms for both male and females are
often defined at birth, including appropriate behavior, suggested personalities and
characteristics, and different roles and responsibilities based on the gender category that
the baby is assigned (Lorber, 2011). Lorber (2011) notes that all societies use gender
classifications to categorize people as either a boy or a girl, and gendering is used
throughout society and “legitimized by religion, law, science, and the society’s entire set
of values” (p. 319). These categories omit any individual talents, preferences,
personalities, interest areas, and relationships that may exist and instead categorize an
individual on the basis of their gender (Budgeon, 2014). Risman (2004) argues that men
and women comply with these categories and continue to conform to gender norms and
expectations. By placing themselves into gender categories, men and women will
continue to see themselves differently and ultimately make different choices, have
varying perspectives, and consider diverse options (Risman, 2004). These categories and
the social construct of gender are oppressive when women do not see themselves as the

15
same and equal to their male counterparts (Risman, 2004). Gender as a social construct
impacts people at an individual level as they personally develop, at a societal level with
differing expectations for men and women, and at an institutional level when men and
women have varying access to resources (Risman, 2004).
West and Zimmerman (1987) coined the term “doing gender,” where men and
women’s behavior and actions are influenced by their gender on a daily basis. People are
not born into a certain gender, but rather become that gender through societal influences
and expectations of being masculine or feminine (de Beauvoir, 1949). Being masculine or
feminine are ways in which gender is often displayed, however, this goes beyond just the
physical look of a person to include gender confirming mannerisms, interactions,
attitudes, and behaviors (West & Zimmerman, 1987). If an individual were to act in a
way that is perceived to be opposite of their gender, this is seen as causing a break in the
social routine of how gender should be displayed (West & Zimmerman, 1987). West &
Zimmerman (1987) also argue that “doing gender” cannot be undone, since it is apparent
in every social thread of society and relevant in all situations.
Lorber (1994) notes that “in a gender-stratified society, what men do is usually
valued more highly than what women do because men do it, even when their activities
are very similar or the same” (p. 33). This notion has many social implications. Beliefs in
gender roles will cause judgements and attitudes that strongly favor men compared to
women, which will continue gender inequalities in our society (Ridgeway, 2009). As a
result, women may lack the opportunity and resources to have the same social chances
and choices as men, including access to education and the economic opportunities that
result from further education (Lorber, 1994).

16
Castro Martin (1995) states that although “substantial progress has been made
worldwide… insufficient education still stands as a major obstacle to women's welfare,
perpetuating unequal gender roles within the family, the workplace, and public life” (p.
188). Increasing divorce rates in the modern day also impact women’s role in society, as
“economic autonomy becomes not only a possibility but increasingly also a necessity in a
world where divorce is an ever-present concern, caring parents will teach their daughters
the value of education, careers, and independence” (Iversen & Rosebluth, 2010, p. 4;
Rowland, 2004). Although women today do have increased access to higher education
and make up the majority of students enrolling in higher education each year (U.S.
Department of Education, 2018a; 2018b), the majors that men and women are choosing
to study are very different and have substantial implications for their future earnings as a
result (Iceland, 2014; Jacobs, 1996). Academic majors in engineering, computers,
mathematics, and statistics are comprised of mostly men, compared to women making up
the majority of students in academic programs like education, psychology, literature, and
languages (Iceland, 2014). As a result, median earnings for professions based on the
majors where men gravitate is about $80,000 annually, compared to $50,000 a year for
women in the majors that they overwhelmingly populate (Iceland, 2014). The pay gap
between men and women has decreased in recent years, however, women still lag behind
men in terms of salary and earnings (Blau & Kahn, 2007).
Although gender imbalance and inequities certainly still exist today, as
demonstrated in the aforementioned paragraphs, gender norms are changing. One
hundred years ago before the initial women’s and civil rights movements, women were
unable to vote and denied the right of citizenship across many areas of the world, but

17
now, women have made considerable strides to close the gap in gender inequality (Dorius
& Firebaugh, 2010). These more recent changes can be attributed to the second wave of
the women’s rights movement that was seen during the 1960s and 1970s, which included
the creation of Title VII which prohibited employer discrimination on the basis of sex,
race, religion, and nationality and the Title IX Act of 1972, which granted equal access to
education for men and women (Eisenberg & Ruthsdotter, 1998). More recently, women
are still fighting for equal rights in what is considered the third women’s movement
(Rowland, 2004). This third movement, also referred to as third wave feminism, differs
from other women’s rights movements of the past in that it focuses on the individual
identity rather than the collective identity of women, rejects binary categories related to
gender and sexuality (Mann & Huffman, 2005), and considers race, class, sexual
orientation, and ideology to be central issues of the movement (Bronstein, 2005; Iannello,
2010). Today in the third movement, women are still pushing for equal rights, including
reproductive rights and equal pay; however, equality for women has come a considerable
way throughout history (Rowland, 2004). Despite the significant advances that have been
made which created a profound impact for women’s rights, the pursuit for complete
equality between genders still remains (Rowland, 2004).
Gender Equality in Education
Gender equality does not just benefit women. Gender equality impacts the overall
development of society (Tembon & Fort, 2008). Although great strides have been made
towards greater gender equality in recent years, issues of gender inequality still exist
around the world, including the United States (Tembon & Fort, 2008). When gender
equality does exist, societies see benefits in their overall education, economic
18
development, financial earnings, poverty reduction, and health (Tembon & Fort, 2008). It
is widely recognized that educating women positively impacts health, reduces gender
inequalities, and empowers women by increasing their decision-making power,
autonomy, and social movement and mobility (Grown et al., 2005; International Center
for Research on Women, 2003). Education overall also increases literacy, cognitive
development, and informational processing (Castro Martin, 1995). Education is seen as
the most impactful way to increase women’s empowerment and reduce societal gender
inequality, and empowering women has a multiplier effect that impacts the greater
society including the economy and development (UN Millennium Project, 2005; United
Nations, 2014).
Societal gender inequalities not only impact the social structure, but also
development and the economy. Empowerment of women can accelerate economic
development and reduce inequities between men and women (Duflo, 2012). When
women are educated and able to do skilled labor, the labor market increases (International
Center for Research on Women, 2003). Additionally, equality for women can lead to
more women obtaining an education, which impacts the economy through “increased
income-earning potential, ability to bargain for resources within the household, decision-
making autonomy, control over their own fertility, and participation in public life” (UN
Millennium Project, 2005). Morrison et al. (2007) note that “increases in opportunities
for women lead to improvements in human development outcomes, poverty reduction,
and …potentially accelerated rates of economic growth” (p. 1). An increase in female
earnings and control over resources reduces poverty rates and increases children’s
educational attainment and overall wellbeing (Morrison et al., 2007).
19
Historical context of gender in higher education. The shift in gender in higher
education enrollment began in 1965, but prior to then, women struggled to have access to
higher education at an equal rate as their men counterparts and higher education was
originally not inclusive of women (Mortenson, 1992; Rudolph & Thelin, 1991). As
previously noted, gender equality in education and enrollment in higher education is
important for both the field of education and the larger society. However, throughout
history and today, gender gaps in education exist. In order to gain an understanding of the
context of the gender gap in enrollment in higher education, it is important to note the
historical context in which it exists. In the past 40 years, the gender gap relating to
enrollment in higher education has reversed (Peter & Horn, 2005). Colleges and
universities in this country were originally created in colonial times with the purpose of
educating men for the pastorate, as it was thought that women were intellectually inferior
and they did not need education for their vocation, which at the time was often working
in the home (Rudolph & Thelin, 1991). From the start of the 20th century until the early
1970s, men were the dominant gender enrolled in American colleges and universities,
with male students outnumbering female students 2.3 to 1 in 1947 at the end of World
War II (Goldin et al., 2006). However, between 1970 and 1997, the number of
traditional-aged female students attending higher education institutions increased from
2.5 million to 4.2 million, resulting in a 68% increase (U.S. Department of Education,
1999). By the late 1980s, male and females were equally represented in enrollment to
college at a 1 to 1 ratio and continuing to climb each year (U.S. Department of Education,
1995).
20
By the early 1990s, more women than men had attained bachelor’s degrees
(Mortenson, 1995). In fact, the amount of undergraduate students in higher education in
1980 was a female majority of 52%, with that rate continuing to grow to 56% in 2001
(Peter & Horn, 2005). This trend still continues today, with 11.2 million females enrolled
at college in Fall 2018 compared to 8.7 million males, making up 56% of the total
incoming undergraduate students at colleges and universities nationwide (U.S.
Department of Education, 2018a). The number of females enrolled in higher education is
also expected to continuously increase by 2026 to 13 million students compared to 9.7
million male students (Hussar & Bailey, 2018). This shift in enrollment has created the
new gender gap seen today, where women outnumber men in higher education
enrollment nationwide.
Gender and Enrollment
Many academic studies about college choice consider the changing gender gap in
higher education enrollment, and the vast majority refer to the gender gap where women
comprise the majority of students in higher education, whereas this study seeks to fill the
gap around instances where males are the majority of students enrolling (Barone, 2011;
Baum & Goodstein, 2005; Bergerson, Heiselt, & Aiken-Wisniewski, 2013; Bishop, 1992;
Conger, 2015; Conger & Dickson, 2017; DiPrete & Buchmann, 2013; Evers, Livernois,
& Mancuso, 2006; Goldin et al., 2006). The enrollment shift in the past 40 years can be
attributed to high school girls improving in their standardized test scores and math and
science courses compared to boys (Goldin et al., 2006), an increase in labor market
opportunities for women (Conger & Dickson, 2017; Goldin et al., 2006), and women
earning higher grades in high school than men (Conger, 2015; Conger & Dickson, 2017).
21
Additionally, changing admission policies such as test optional admission (Conger &
Dickson, 2017), varying state policies (Perna & Titus, 2004), and family culture
regarding education impact women students more than men, which contributes to an
increased number of women enrolling in higher education (Bergerson et al., 2013).
As a result, a new achievement gap for men is often referred to in both the
scholarly literature and popular media, often suggesting that affirmative action is needed
to combat the changing enrollment gap for men (Baum & Goodstein, 2005). The national
phenomenon of the gender gap occurring in the United States can also be seen
internationally as well, including in Canada, Australia, France, the United Kingdom, and
Italy (Evers et al., 2006).
Enrollment trends in New Jersey. In addition to changes in enrollment seen in
the last 40 years, the overall landscape of higher education today is also changing. No
longer are four-year, private liberal arts institutions considered to be the premiere option
for students, as almost 46% of undergraduates attended a two-year community college as
of 2008 (Staley & Trinkle, 2011). Public, state-funded institutions nationwide have seen a
decrease in federal and state funding, causing many public colleges and universities to
think of innovative ways to generate revenue, which often leads to the conception of
academic capitalism where institutions operate as corporate entities that provide a service
rather than a public good (Kwong, 2000; Slaughter & Rhodes, 2003). Public institutions
in particular have been impacted by decreased state funds, which increases the
competition for students with private institutions (Dill, 1997). In the state of New Jersey,
state support for four-year public colleges and universities even decreased by $63 million
in 2008 (Di Ionno, 2009).

22
New Jersey is comprised of 11 four-year public institutions, 15 four-year private
institutions, and 19 two-year community colleges. In terms of enrollment, gender trends
at four-year public institutions are consistent with national trends across all institutions,
indicating that 55% of students enrolled are female (National Student Clearinghouse,
2016). Within the state of New Jersey, enrollment data is mirrors national trends
regarding women enrolling in higher education. In 2017, almost 52% of students
enrolling in higher education institutions, including four-year public and privates, two-
year community college, and proprietary institutions, were female (IPEDS, 2017).
Consistent with the state-wide and national data, 53% of first-time, full-time,
undergraduate students enrolling in four-year, public institutions in New Jersey were also
female (IPEDS, 2017).
The state of New Jersey, however, is the top exporter of students in the country
with almost 28,000 students leaving New Jersey to pursue higher education in another
state each year (U.S. Department of Education, 2018c). Lawmakers are hoping to combat
the issue of outmigration by surveying high school seniors in the state to determine why
they do not choose to pursue their education at a college or university in New Jersey
(Monaghan, 2018). Sandlier (2016) notes “56% of first-year undergraduates going on to a
four-year degree-granting postsecondary institution did so outside of New Jersey,” (p. 2)
resulting in a “brain drain” that is costing the state billions of dollars each year (New
Jersey Business & Industry Association, 2016). Contributing factors of the outmigration
of students can be attributed to the high cost of four-year public colleges and universities
in the state, which has the fourth highest price of tuition and room and board in the nation
(New Jersey Business & Industry Association, 2016). Other factors could include the
23
branding, promotion, and education of colleges and universities in the state to attract and
retain its students (Sandlier, 2016).
While there has been a national increase of women in higher education including
the overall state of New Jersey, a troubling trend within the state shows that at some
institutions, the gains for women in enrollment have been reversed. Within the state of
New Jersey, males account for 47% enrolled first-time, full-time, undergraduate students
at four-year, public institutions, while 53% are women (IPEDS, 2017). This is
comparable to nationwide enrollment trends, where 56% of first-time, full time
undergraduate students are female and 44% are male (U.S. Department of Education,
2018b). Only two public four-year institutions within New Jersey have gender trends for
enrollment that are majority male, which is opposite of what is being seen both in New
Jersey and nationwide today (IPEDS, 2017). The purpose of this study is to explore this
reversal at one public, comprehensive, four-year institution, Marathon University.
Marathon University is one of the few institutions in the state where female enrollment is
less than that of male students (IPEDS, 2017).
Problem Statement
In the past forty years, the gender gap relating to enrollment in higher education
has reversed. Colleges and universities were originally created with the intention of
solely educating men and through the early 1970s, men were the dominant gender
enrolling in higher education each year (Goldin et al., 2006; Rudolph & Thelin, 1991). In
1965, the gender gap began to shrink until the early 1990s when more women than men
had earned bachelor’s degrees (Mortenson, 1992). In fact, the number of undergraduate
students in higher education in 1980 was a female majority of 52%, with that rate

24
continuing to grow to 56% in 2001 (Peter & Horn, 2005). Today, women still outpace
their male counterparts enrolling in higher education each year, with 56% of incoming
students at colleges and universities nationwide being female (U.S. Department of
Education, 2018b). Despite enrollment trends indicating a dramatic increase of female
students at colleges and universities in recent years, Marathon University has experienced
the opposite. At Marathon, first-time, full-time male and female students apply and are
admitted at relatively even rates, yet the amount of female students yielding and enrolling
are dramatically lower than that of their male counterparts. In the last five years alone,
about 40% of total first-time, full-time students enrolled at Marathon were female,
compared to the national average of 56% (U.S. Department of Education, 2018b).
While extensive literature exists surrounding the topic of women outnumbering
men in college enrollment, limited research has been conducted when men are the
majority of students enrolling on a college campus (Barone, 2011; Baum & Goodstein,
2005; Bergerson et al., 2013; Bishop, 1992; Conger, 2015; Conger & Dickson, 2017;
DiPrete & Buchmann, 2013; Evers et al., 2006; Goldin et al., 2006). Research regarding
college decision-making and choice models also exists, including the way in which
students make decisions about where to attend college, the variables that impact
admission, and the student decision-making process. Standardized test scores, such as the
SAT and ACT, serve as predictors of college performance and are evaluated in the
admissions process (Baron & Norman, 1992; Bielby, Posselt, Jaquette, & Bastedo, 2014).
GPA and high school grades (Bielby et al., 2014; Conger, 2015; Goldin et al., 2006),
merit scholarship awards and financial aid (Avery & Hoxby, 2004), and income and
socioeconomic status (Hossler & Bontrager, 2014) are other variables that are often
25
considered in regards to college choice. Additionally, social and cultural capital (Klevan,
Weinberg, & Middleton, 2016; Perna, 2006), the impact of STEM (Bielby et al., 2014),
and proximity to home (Chen & Zerquera, 2018) have been analyzed. Despite extensive
research on college choice, gaps in the literature about the influence of gender on the
college decision-making process exist, and research is limited on if certain variables
influence men and women differently when deciding where to attend college.
Understanding the college decision-making process is crucial for strategic
enrollment managers, admissions counselors, higher education leadership, and policy
makers. The lack of research on enrollment trends that do not favor a female enrollment
majority and an understanding of the college-decision making variables that impact male
and female students may continue gender inequities that are prevalent in society today.
Without a true understanding of the process in regards to gender, gender inequities may
continue to exist in the field of higher education, and specifically within the state of New
Jersey. A better understanding of women’s college choice decision-making as it impacts
enrollment may help combat the outmigration of students from the state and, in turn,
increase enrollment at New Jersey institutions.
Purpose Statement
The purpose of this concurrent, mixed methods case study was to identify factors
impacting female enrollment at Marathon University by investigating quantitative data
generated from institutional research and qualitative open-ended admitted student surveys
of enrolled and non-enrolled students to explore these results in more detail. The case
study design provided for an in-depth analysis of the social phenomenon of how women
makes decisions about college choice (Yin, 2014). This methodology has an explorative

26
nature that allowed for immersion into the particular case (Meyer, 2016). The mixed
methods approach was used within the case study analysis to provide multiple ways of
seeing the study through both quantitative and qualitative analysis and then integrated the
findings of both (Creswell & Plano Clark, 2018). In the quantitative phase of the study, a
multinomial logistic regression was performed on institutional data about enrolling first-
time, full-time students at Marathon University to test college choice decision-making
theories and to assess whether certain individual characteristics predict the choice to
attend Marathon University. The qualitative phase was conducted to help explain the
quantitative results by exploring admitted students choice qualitatively. Although many
studies examine the increase of female enrollment in higher education, this study explains
why females are enrolling at a lower rate than males at Marathon University (Baum &
Goldstein, 2005; Bergerson et al., 2013; Conger, 2015; Conger & Dickson, 2017; Goldin
et al., 2006).
Research questions. To guide this study, the following mixed methods research
questions were used:
1. What predicts the differences between females who enroll compared to
females who do not enroll, and males who enroll and males who do not enroll
at Marathon University?
a. Academic program
b. GPA
c. Standardized test scores
d. Ethnicity
e. Net cost

27
f. Distance from home
2. How do female students make decisions about attending or not attending
Marathon University compared to male students attending and not attending
Marathon University?
3. In what ways do qualitative survey results help to explain the quantitative
institutional data about college choice between male and female students?
Definitions of Terms
For the purpose of this study, the terms listed below are defined as the following:
Admit: a student whose application was accepted for admission by an
institution is considered to be admitted. The term “admit” will be used
synonymously with “accept” in this study.
Applicant: a student who has submitted an application to be considered for
admission at a college or university.
College choice decision-making process: the process by which a student
makes a decision about where they want to attend college (Kim, 2004).
May also be referred to as “college choice” in this study. College choice is
also the third stage of Hossler & Gallagher’s (1987) model which includes
predisposition, search, and choice.
Deposit: confirmation of the student’s enrollment at an institution is
required with a financial deposit. A student who deposits at an institution
signifies that they will attending.

28
Enrolled: matriculation of a student in college, often demonstrated by a
deposit confirmation and course registration. This term will be used
synonymously with “matriculated” throughout this study.
FAFSA: acronym for the Free Application for Federal Student Aid, which
is the application students use to apply for need-based financial aid,
including grants, work-study, and loans.
Female: a binary term used to identify the biological and physiological
differences in genitalia and reproductive organs that determine sex
(Lorber, 1994). For the purpose of this study, the term “female” will be
used when referring to data, analysis, and collection.
Financial Aid: financial aid is based on financial need and may include
government grants, loans, scholarships, and work-study opportunities.
Students must submit a FAFSA, the Free Application for Federal Student
Aid, and be enrolled full-time to be considered for financial aid.
First-time student: a student who has never attended college before and is
entering college immediately following high school. Students who attend
college over the summer directly after high school and begin college in the
fall semester will also be considered first-time students.
Full-time student: a student considered to be enrolled full-time at
Marathon University has more than 12 credit hours a semester. Full-time
students at Marathon University pay a flat semester rate up to 17 credit
hours and are eligible for financial aid.
29
Male: a binary term used to identify the biological and physiological
differences in genitalia and reproductive organs that determine sex
(Lorber, 1994). For the purpose of this study, the term “male” will be used
when referring to data, analysis, and collection.
Man: a binary, social construction of gender that is learned through
“teaching, learning, emulating, and enforcement” (Lorber, 1994, p. 17).
For the purpose of this study, the term “man” will be used when referring
to gender and social implications.
Matriculated: a matriculated student is enrolled in an institutional degree
program after acceptance and is eligible for financial aid. This term will be
used synonymously with “enrolled” throughout this study.
Melt: phenomenon when incoming students at an institution ultimately do
not attend, despite having submitted a deposit and confirmed enrollment.
This often occurs over the summer months before the fall semester begins,
and can also be referred to as “summer melt.”
Non-matriculated: non-matriculated students, often called non-matrics, are
not enrolled in an academic program at the institution but may still take
classes. The classes the student takes when they are non-matric will not
count towards a degree, however, if the student later enrolled at the
institution, those credits would count towards their degree. Non-matric
students are not eligible for financial aid.
Woman: a binary, social construction of gender that is learned through
“teaching, learning, emulating, and enforcement” (Lorber, 1994, p. 17).
30
For the purpose of this study, the term “woman” will be used when
referring to gender and social implications.
Yield: the number of admitted students who decide to enroll at an
institution. This value is often displayed as a percentage.
Theoretical Framework
Social science theories related to college choice were used to inform the research
design and overall study (Creswell, 2014). Hossler & Gallagher’s (1987) three stage
model of college choice provided a framework for the college choice decision-making
process and Blackwell, Miniard, & Engel’s (2001) consumer decision process model was
used to determine how female students as consumers think, evaluate, and act on their
college choice decisions.
College choice model. Although many theories and models about college choice
exist, Hossler & Gallagher’s (1987) seminal model of college choice, which is a three-
step process that includes predisposition, search, and ultimately choice, served as the
primary college choice model of this study. The main focus of this model is on the final
stage of choice.
Having knowledge of the college decision-making process of a student is crucial
in order to gain understanding on why fewer female students than male students are
yielding at a particular institution. Hills (1964) first discussed college choice as it relates
to decision making, noting that students have different courses of action where different
events occur, and each event also has a different value. Students ultimately choose their
institution based on the expected value that they attribute with each interaction they have
with the institution, ultimately creating a college choice decision-making process (Hills,
31
1964). Kotler’s (1976) seven-step model relates college choice to market research,
including decision to attend, information seeking and receiving, specific college
inquiries, application, admission, choice, and registration. One of the first explicit models
on college choice was developed by Chapman (1981) and it posits that a student’s college
choice is dependent on their own individual characteristics and external factors, including
significant people, institutional characteristics, and the college’s effort and outreach to
the student. Since Chapman’s initial model, other college choice models have been
created that expand on the foundational model, including Hossler & Gallagher’s (1987)
three-phase model of predisposition, search, and choice, Hanson & Litten’s (1982) model
of predisposition, exploration, and application, and Jackson’s (1982) three-phase model
of preference, exclusion, and evaluation.
Today, Hossler & Gallagher’s (1987) model is most widely used in regards to
college choice and each step of the model has been extensively expanded upon and
evaluated. The predisposition phase includes a student’s decision to continue onto college
after high school and is often influenced by the student’s socioeconomic status, parental
influence, and peers (Adams, 2009, Bers & Galowich, 2002; Hossler & Gallagher, 1987;
Hossler & Maple, 1993). In the search phase, students work to find information about
colleges and universities that will ultimately lead them to make a choice on where to
attend, which is the final stage of the model (Hossler & Gallagher, 1987; Schmit, 1991;
Smith & Fleming, 2006). The final stage of the college choice process consists of the
student ranking different institutions and evaluating their choices, eventually making a
decision on which college or university they will attend (Hossler & Gallagher, 1987;
Kim, 2004). Hossler & Bontrager (2014) also note that there are three different

32
approaches to the college choice theory, including economic, sociological, and
information processing approaches. These approaches were considered when analyzing
college choice models and the college decision-making process.
Consumer behavior model. The current landscape of higher education includes
globalization, privatization, and marketization of our country’s colleges and universities.
Institutions of higher learning are forced to operate as businesses, where students are the
consumers and the ultimate goal is to graduate as many students as possible at the lowest
cost (Kwong, 2000; Marginson, 2010). As a result, colleges and universities need to see
their students as consumers. While many models on consumer behavior exist, the
Blackwell et al. (2001) model for consumer behavior was used for this study as it relates
to the student as a consumer during their college choice decision-making.
Blackwell et al.’s (2001) consumer behavior model is comprised of a seven step
process and takes into consideration internal and external factors that influence the
decision-making process (Wiese, Van Heerden, & Jordaan, 2010). Students who make
decisions about where to attend college will engage in all seven stages of the process,
including problem and need recognition, search for information, evaluation of different
alternatives, selection, consumption, post-selection evaluation, and divestment
(Blackwell et al., 2001; Wiese et al., 2010). Considering each stage of this model and
comparing it against the different variables that students consider when choosing a
college will lend insight to the overall college decision-making process from the
perspective of the student as a consumer. Comparing consumer behavior of men and
women will also be fundamental to this study. Shank & Beasley (1998) found that men
and women do make decisions differently when it comes to deciding where to attend
33
college, and gender differences were evident when exploring different attributes and
characteristics related to the college choice-decision making process. Additionally, as
consumers, men and women have different decision-making styles (Bakewell & Mitchell,
2006). The model of consumer behavior, in comparison to the differences noted in gender
and college decision-making variables, are further explored in Chapter 2, along with
Hossler & Gallagher’s (1987) model of college choice.
Delimitations
All research studies, including this one, have certain delimitations and limitations.
The following address how scope, role of the researcher, and methodology all impacted
the study and suggest alternatives to mitigate these challenges.
Scope of the study. Although the topic of college choice is very broad, the scope
of this study was delimited by researching enrollment trends at one particular institution,
Marathon University, using one seminal model of college choice, and focusing on full-
time, first-time, undergraduate female students from the Fall 2018 cohort. Specific
variables that related to college choice, which emerged from the literature review and my
own experiential knowledge, were focused on.
National trends for the past 40 years indicate that female students make up close
to 60% of the undergraduate student population enrolling in higher education each year,
demonstrating a shift in enrollment where women now outnumber men (U.S. Department
of Education, 2018b). This trend, however, is not occurring at Marathon University, as
female students make up about 40% of first-time, full-time students enrolling each year.
Rather than considering national trends or multiple institutions nationwide, this study was
limited by considering enrollment at one institution, in line with a case study design that

34
explores a case of an intrinsic nature. Limiting the scope of the study in this way had
limitations, as this study did include other institutions with similar enrollment profiles
and has implications for transferability and generalizability. However, if the scope of this
research were to be expanded, disadvantages in obtaining enrollment data from other
institutions and potentially conflicting findings based on the institutional profile itself
would exist. An advantage to looking at one institution was the ability to obtain
institutional data and obtain a deeper understanding of this issue.
Next, the focus of this study was narrowed by using Hossler & Gallagher’s (1987)
seminal model on college choice, which served as the college choice theoretical
foundation that guided the research. Though many models and findings about college
choice exist, Hossler & Gallagher’s (1987) three phase model of predisposition, search,
and choice is the most widely regarded and utilized today. For the purpose of this study,
the last phase of the model was of particular interest and elements of the student being
predisposed to attend college or what their search process entailed were not considered.
By delimiting the scope of this study to only look at the choice phase, an in-depth
understanding as to why women’s actual decision-making process and why more women
choose not to attend Marathon than men was obtained. Limiting the study to focus on the
this perspective of the theory was important, because female and male students apply to
Marathon at relatively even rates of about 50% male and 50% female applications each
year, but female students inevitably do not choose to enroll at the same rate. The
predisposition and search phases of Hossler & Gallagher’s (1987) model did not provide
the information needed about the actual decision-making of women, which is why the
final choice phase served the main focus.

35
Use of the literature and reflection of my experiential knowledge determined the
variables that were used to examine the impact of college-choice decision making in full-
time, first-time, undergraduate female students. By not looking at every variable that
exists as it relates to the college decision-making process for the quantitative analysis, the
scope of the study was able to be narrowed. Standardized test scores, such as the SAT
and ACT, serve as predictors of college performance and are evaluated in the admissions
process (Baron & Norman, 1992; Bielby et al., 2014). GPA and high school grades
(Bielby et al., 2014; Conger, 2015; Goldin et al., 2006), receiving merit scholarship
awards and other financial aid (Avery & Hoxby, 2004, U.S. Department of Education,
2018a), and net cost are other variables that were analyzed. Additionally, the impact of
STEM (Bielby et al., 2014) and proximity to home (Chen & Zerquera, 2018) were also
considered. Although many variables exist related to college-choice, limiting the number
of variables helped in not overwhelming the study with too many options that were not
relevant. For example, literature exists on father absence and the nonmarital birth rate
contributing to the growing gender gap in enrollment, attributing the lack of a father
figure to why less male students are enrolling in college each year (Doherty, Willoughby,
& Wilde, 2016). While social capital and influences are important to college choice, this
variable did not apply directly to the study and was excluded from the research. Use of a
comprehensive list of variables instead of an exhaustive list of every variable that exists
in relation to college choice does provide limitations to the findings.
Research design. While mixed methodology has many strengths, including the
ability to conduct multiple types of studies to provide different types of results, this
methodology also has its challenges (Creswell & Plano Clark, 2018). Researchers using a

36
mixed methods approach need to be familiar with both qualitative and quantitative
research methods, including data collection, instrumentation, and analysis, and often need
extensive resources and time for both studies (Creswell & Plano Clark, 2018). To combat
this limitation, the scope of this study was limited in order to keep the research
manageable in terms of time and resources available. Limitations of mixed methods
research can also include difficulties in connecting the individual quantitative and
qualitative studies in a meaningful way (Creswell & Plano Clark, 2018). Yin (2006) notes
that if each quantitative and qualitative method is conducted in isolation, the results will
be separate and may complement each other, however, they will not truly be mixed
methods. It was imperative to triangulate data through various collection strategies,
which was done by using quantitative institutional data, qualitative survey results, and a
combined mixed methods analysis (McNiff & Whitehead, 2011; Stringer, 2014). Having
multiple data sources also allowed the findings to have validity and authenticity (McNiff
& Whitehead, 2011).
Mixed methods researchers need to consider threats to credibility and validity
when conducting their studies, as various threats can exist in research (Creswell & Plano
Clark, 2018; Teddlie & Tashakkori, 2009). Validity in mixed methods research refers to
how the researcher understands the participants’ views and if their views are represented
accurately in quantitative data analysis (Creswell & Plano Clark, 2018; Teddlie &
Tashakkori, 2009). For this study, institutional data analysis does not represent the actual
views and decision-making of the students enrolling at the institution. Although the
qualitative approach of analyzing accepted student surveys helped give voice to the

37
quantitative data, it is possible that the data analysis still misunderstood a student’s actual
views and perspectives.
Teddlie & Tashakkori (2009) state that a qualitative inference is credible when
“there is a correspondence between the way the respondents actually perceive social
constructs and the way the researcher portrays their viewpoints” (p. 295). Researchers
can increase their credibility in qualitative research by being transparent about all steps of
their study, including the theory, methodology, data collection, sample, interpretation of
findings, and future implications (Teddlie & Tashakkori, 2009). To avoid issues of
credibility, it would be beneficial for the researcher to incorporate member checking to
determine if the themes and representations in the data are accurate (Teddlie &
Tashakkori, 2009). Additionally, sharing the research and findings with a colleague who
is not involved in the study allows for peer debriefing, which helps the researcher identify
bias that may have occurred (Teddlie & Tashakkori, 2009). For this study, the research
and findings were shared with a colleague who was not familiar with the study of college
choice and they identified biases or misrepresentations that existed in the work.
Although using a case study approach for this research study was suitable, as it
allows the researcher to study a specific and complex phenomenon in-depth, the
researcher needs to be mindful that the case should not be considered in isolation, but
within the larger, real-word context (Yin, 2013). Case studies can also have issues of
generalization, since the study was conducted in a single instance and the small sample
cannot be generalized to a larger population (Yin, 2013). Although this limitation is
legitimate, the purpose of this study was to analyze the female enrollment issue at
Marathon University in-depth, which would be sacrificed if a case study model was not
38
used. Additionally, analytic generalization should be used where the findings from this
case study can be applied to future case studies, rather than abstract theories (Yin, 2013).
As the researcher, I was mindful that the findings serve as a working hypothesis for
future research and imply that other case studies should be done in the future to further
evaluate the phenomenon (Yin, 2013). To mitigate any challenges in the evaluation of
findings at the end of this study, I ensured that the research questions that drive the early
part of my study were “why” and “how” questions that related to the events and actions
that took place over time, which also coincides with the concurrent mixed methods
approach that was used (Yin, 2013).
Gender & college choice decision-making. Inconclusive research and literature
regarding gender as it relates to college-choice decision-making is another limitation of
this study. This study focused on the enrollment trends related to gender at Marathon
University, yet previous research does not agree on how gender relates to the overall
college decision-making process, since some studies report that gender does not have an
impact on college choice (Avery & Hoxby, 2004; Cho, Hudley, Lee, Barry, & Kelly,
2008; DesJardin, Dundar, & Hendel, 1999; Hossler et al., 1989; Hossler & Stage, 1992;
Perna, 2000), while others indicate that women are more inclined to apply to college than
men (Perna & Titus, 2004; Weiler, 1994). Although there does not seem to be a
consistent understanding between men and women and their overall college choice
process, this study assumed that gender may have an impact on the variables that men
and women each consider important when engaging in the final stage of choice and
ultimately choosing a college or university to attend, which was a potential limitation
(Chapman, 1981; Hanson & Litten, 1982; Hao & Bonstead-Bruns, 1998; Hemsley-Brown
39
& Oplatka, 2015; Hossler, Schmit, & Vesper, 1999; Iceland, 2014; Lockheed, 1982;
Paulsen & St. John, 2002; Peter & Horn, 2005; Rosenfeld & Hearn, 1982; Stricker, Rock,
& Burton, 1991; Wiese et al., 2010). Additionally, much of the literature that discusses
gender in relation to college choice is not recent, which provided a limitation since
modern day implications of higher education were not considered in previous studies
relating gender to college choice.
Role as the insider researcher. This study could not be conducted without
considering my role as the researcher, including my experiential knowledge and
worldview. Without framing this study with my own experiences and perspectives, I
would have been unable to thoroughly review the literature and design a study to explore
the enrollment issue at Marathon University. The overall research problem and statement
guided the entire dissertation study, which was developed from my direct experiences,
knowledge, and worldview. By considering my own biases, assumptions, and worldview,
this dissertation study is uniquely my own. Additionally, I would not have the
background and first-hand knowledge that I do when analyzing my topic if I did not
consider my individual perspectives.
I first became interested in admissions, enrollment, and access while working as a
student tour guide at my undergraduate institution. As I learned more about strategic
enrollment management, I became passionate about issues surrounding access and equity
in higher education, which continued during my graduate work at the University of
Pennsylvania (Penn). While at Penn, I took a class called Access & Choice with Dr.
Laura Perna that increased my interest in issues surrounding the college choice decision-
making process and access in higher education. After graduation, I obtained my first job

40
as an Admissions Counselor and began volunteering at a non-profit organization working
with underserved high school students to help provide opportunities for higher education.
I still currently work in admissions and strategic enrollment management, which
enabled me to discover that the enrollment problem at Marathon University exists, and
allowed me to be knowledgeable about the trends and process that occur regarding
admissions. The assumptions I have regarding this topic originated from my work in
strategic enrollment management, and I was mindful of my perspectives, experiences,
and biases when I reviewed the literature, conducted research, and analyzed the findings
for this study. I was also able to identify potential independent variables that could
impact female enrollment at Marathon University due to my own experiences in higher
education, in addition to the literature review.
Although my current work in strategic enrollment management has provided me
insight on issues pertaining to enrollment, I was also mindful of my position as an insider
researcher throughout this study (Coghlan, 2003). Insider researchers are members of the
organization who work to research from within, as they understand how the organization
works but intend to change certain aspects of it (Coghlan, 2003). Insider researchers are
permanent members rather than temporary constituents and need to be mindful of their
lived experience and how they relate to the organization, the duality of their role as a
participant and facilitator, and political nature of the organization (Coghlan, 2003). Since
insider researchers possess knowledge of the organization already, they need to avoid
making assumptions rather than conducting investigations and being open-minded to
different findings (Coghlan, 2003). It is also challenging for insider researchers to
maintain relationships with other participants while still holding the role as a facilitator.
41
Finally, insider researchers can face challenges with politics in their organization in
regards to ethics and power, but successful researchers always remember they are
conducting research with people, rather than on people (Coghlan, 2003). As an insider
researcher within my organization and study, it was imperative to be mindful of the
characteristics and challenges that were presented as a result.
After much reflection and considering the different worldviews and perspectives
as described by Creswell (2014) and Guba & Lincoln (1994), I determined that I am a
constructivist researcher. As a constructivist, I develop an understanding of the world
through social and historical constructions where I rely on the realities of different
phenomena to learn (Creswell, 2014; Guba & Lincoln, 1994). For this research, I took on
an active role as a learner and researcher and considered my own experiences when I
analyzed the literature and findings (Creswell, 2014). I considered my own personal
experiences as a female undergraduate student, my current professional role in enrollment
management, and literature and research that I found regarding enrollment data and
strategies that related to the research problem (Creswell, 2014).
Significance of Study
This study explored female enrollment patterns and decision-making processes at
Marathon University using the theoretical framework of Hossler & Gallagher’s (1987)
model of college choice and consumer decision-making models (Blackwell et al., 2001).
The following explored how the research from this study impacted policy, practice, and
research in the field of higher education.
Policy. There are many policy implications of this study that should be
considered. It is crucial for strategic enrollment managers and recruitment professionals

42
in higher education to have an understanding of prospective students’ decision-making
processes, especially if there are implications regarding gender. Leaders in strategic
enrollment management should use this research to consider their own institutional
policies and any repercussions that they may create. Having knowledge of the college
choice process, decision-making, and factors that influence college choice will allow
leaders in the field to better shape their policies to permit access and equity for both men
and women, and ensure that existing policies do not compromise that. For example,
policies on the distribution of merit scholarships based solely on academic success in
high school with a strong emphasis on standardized test scores may inadvertently
discourage women from attending an institution if awards for women are not comparable
to men. Current literature is limited on gender differences in the college decision-making
process, however, strategic enrollment policies could and should be created to achieve
more equal and equitable undergraduate student populations in terms of gender.
Perna & Titus (2004) indicate that four different types of state public policy effect
a student’s college choice, including direct appropriations from the state to higher
education institutions, financial aid, tuition costs, and elementary and secondary school
level academic preparation policies. Additionally, the Title IX Act of 1972 policy for
equal rights in education regardless of sex should also be considered when scrutinizing
policies related to this study (Title IX, n.d.). Using Title IX as a guideline when
considering policy implications for gender in admissions practices is crucial to providing
equity to all students regardless of gender.
Practice. In practice, it is important for both men and women to have the
opportunity to attend institutions of higher education. This study and its results can have
43
a positive impact on both colleges and universities, as well as the students they serve.
Although the problem of gender imbalance in enrollment in this study does not
necessarily relate to access to higher education in this instance, since male and female
students applied at the same rate, have gender equity and balance in the institution’s
undergraduate population is crucial. In this case of Marathon University, fewer female
students than male students attend the institution, however, nation-wide gender
imbalances in enrollment still exist at a larger scale, but are more often skewed the
opposite way. Ensuring that institutions are creating opportunities and environments that
benefit both men and women is both important and morally just. Leaders within higher
education institutions should consider their funding practices and consider any
implications that may result in unfair funding for either gender. In practice, extensive
amounts of funds are allocated for recruitment and marketing of prospective students, and
considering the ways in which students make decisions about college choice is crucial.
Reallocation of funds to provide a more equitable experience for women may be a
consideration that a leader in higher education would also make as a result of this study.
Locally, implications from this study can impact practice at Marathon University.
In order to increase yield of female students, leaders in strategic enrollment management
may incorporate different marketing or communication plans for prospective men and
women (Shank & Beasley, 1998). Admissions recruiters may consider implications of the
college choice-decision making process in relation to gender, and adjust their practice
accordingly. Different scholarship programs could be enacted and updates to the physical
campus itself may also benefit the overall enrollment and undergraduate student
population. It is beneficial for students to have diversity, including different genders,

44
races, ethnicities, and class, in their classrooms and schools, social interactions, and
professional spaces, as this will allows students to develop the skills, thought processes,
and interpersonal communication needed to be successful in an increasingly becoming
diverse world (Hurtado, 2001). Hurtado (2001) notes that “a diverse student body
provides students with important opportunities to build the skills necessary for bridging
cultural differences and may cultivate their capacity for other important learning” (p.
188). As a result, increasing the number of female students yielding at Marathon
University will enhance the overall institution and students that attend. It is important to
gain an understanding of what is happening at Marathon University as diversity in higher
education is crucial in order to provide rich educational experiences, strengthen
communities, and increase the global perspective of society (ACE Board of Directors,
2012).
Research. Since the shifting gender gap in higher education in the last 40 years,
research on male students outnumbering females is sparse, aside from studies about
gender differences in elite colleges (Bielby et al., 2014). Many academic studies about
college choice consider the changing gender gap in higher education enrollment, but the
vast majority refer to the gender gap where women comprise the majority of students in
higher education, whereas this study seeks to fill the gap in the research when males are
the majority of students enrolling (Barone, 2011; Baum & Goodstein, 2005; Bergerson et
al., 2013; Bishop, 1992; Conger, 2015; Conger & Dickson, 2017; DiPrete & Buchmann,
2013; Evers et al., 2006; Goldin et al., 2006).
In addition to limited research on the enrollment trends studied in this
dissertation, limited literature exists surrounding the college-choice decision making
45
process and how it differs for male and female students (Shank & Beasley, 1998).
Additional research should be conducted to determine how decision-making differences
between genders impact college choice. Since this study is a mixed methods case study, it
would be beneficial for future studies to include a larger sample beyond just one
institution. Changing the setting of the study in future research would also allow
researchers to determine whether location and demographics of students played a role in
the decision-making process. Conducting a quantitative study looking at institutional data
compared to national data could also be done, as well as a qualitative study where women
could be interviewed or participate in a focus group to share their experiences when
making a decision about college.
Overview
Chapter One of this research study provided an introduction of the study,
including background information about college choice and decision-making, the purpose
and significance of the problem, and research questions that guided the study. This first
chapter includes a list of commonly used terms and the theoretical framework that served
as the foundation of this study. Delimitations and scope of the study are also explored.
Chapter Two presents an abridged literature review related to the historical context of
gender and enrollment in higher education, the college-choice decision making process,
and the related theoretical frameworks. Chapter Three explores the methodology used for
this study, including the mixed methods approach, research questions, setting, sampling
and participants, scope, data collection and instrumentation, and data analysis. Chapter
Four includes an overview of the findings from this study. Chapter Five and Chapter Six
present articles designed for publication in peer-reviewed journals about strategic

46
enrollment management, college choice, and consumer decision-making in higher
education. The articles address the findings from the review of the literature, data
collection and analysis, discussion, and implications of the results.
47
Chapter 2
Literature Review and Context of the Study
This chapter provides a discussion of the literature related to college choice and
decision-making, using theoretical frameworks on college choice, consumer behavior,
and decision-making. Literature reviews provide the foundation of a study and allow the
researcher to advance their understanding of a topic by examining studies that have been
done before, investigating their strengths and weaknesses, and understanding how the
research fits together (Boote & Beile, 2005). The literature review “… sets the broad
context of the study, clearly demarcates what is and what is not within the scope of the
investigation, and justifies those decisions. It also situates the existing literature in a
broader scholarly and historical context” (Boote & Beile, 2005, p. 4). Additionally, the
literature review enables the researcher to delimit the research problem, find new
methods of inquiry, gain insight about appropriate methodology, and determine the gaps
that still need to be researched (Randolph, 2009). Within the literature review of this
study, research on college choice is analyzed and synthesized, including personal and
institutional factors related to college choice such as academic aptitude, socioeconomic
status, ethnicity, influence of others, financial aid, and proximity to home (Boote & Beile,
2005). Additionally, the conceptual framework of consumer decision-making will be
discussed, focusing on how both men and women make decisions. Finally, the context of
Marathon University will be explored.
This literature review also identified key themes across different points of views
and topical areas as they relate to college choice and consumer decision-making (Wentz,
2014). This chapter provides background information, insight, and seeks to provide
understanding of the female enrollment trends at Marathon University. National
48
enrollment trends demonstrate a majority female population entering college each year,
however, this dramatic increase of female students is not represented at Marathon
University. In fact, the opposite is occurring where less women than men yield at the
institution each year, despite relatively equal levels of application and acceptance. In the
last five years, approximately 40% of the total first-time, full-time, undergraduate
students who enrolled at Marathon University were female, compared to the national
average of 56% (U.S. Department of Education, 2018b). This enrollment trend is not
evident in transfer or graduate populations at Marathon University, and this study focused
on first-time, full-time, undergraduate students as a result. Additionally, part-time and
international student populations at Marathon University were too small to have
significance in the enrollment problem and were excluded. This case study sought to
identify why the first-time, full-time, undergraduate enrollment at this institution does not
mirror national enrollment trends that demonstrate more women pursuing higher
education than men. The research study also identified why first-time, full-time female
students apply and are accepted at similar rates, but fail to yield at the same proportion as
incoming male students. At a larger scale, this study is applicable to other institutions and
the overall field because it seeks to provide an increased understanding of the inequities
of gender in education that still exist and the societal implications that may result, an area
which current research lacks to adequately address (Jacobs, 1996).
Since the gender demographics in higher education enrollment have changed in
the last 40 years, there has been limited literature that explores the gender gap where
male students outnumber female students enrolling in colleges and universities, aside
from the gender differences in elite institutions (Bielby et al., 2014). Baum & Goodstein

49
(2004) note specific instances exist where male students receive preference over their
female counterparts; however, this finding is only significant when male students are
underrepresented in the applicant pool at an institution where the enrollment is
predominantly female. Stereotypes about gender norms are also pervasive in the literature
in regards to college choice and gender, such as females being more nurturing and
predisposed to academic areas and occupations that are centered on care and less
concerned with potential earnings than male students (Barone, 2011). This study serves
as an opportunity to provide information for institutions whose enrollment does not
reflect national gender trends of more women being enrolled, thus providing useful
insight for strategic enrollment managers about admission policies, procedures, and
marketing. Additionally, this study sought to contribute to gaps in the literature about
college decision-making processes in regards to gender and socially embedded processes
and beliefs (Jacobs, 1996).
College Choice Models
Understanding a student’s college decision-making process is crucial when
considering higher education enrollment, especially in relation to this study in order to
determine why less female students than male students yield at Marathon University each
year. “Effective strategic enrollment management depends on a better understanding of
the timing and nature of students’ search processes and knowledge about which student
and institutional characteristics are most important in the student college choice process”
(DesJardins et al., 1999, p. 118). Various models on college choice exist that seek to
explain how individual student attributes and institutional characteristics impact a
student’s decision-making about where to continue their postsecondary education

50
(Hossler, Braxton, & Coopersmith, 1989). It is important to have a sound understanding
of the specific needs and behaviors of students as they engage in college choice and
consider their consumer behavior, as it will influence marketing, recruitment, and
decision-making of strategic enrollment management professionals (Litten, 1982).
Various types of models exist that analyze college choice, including economic,
sociological, and information processing approaches, and a combined model of all
approaches is often used to explain college choice (Hamrick & Hossler, 1996; Hanson &
Litten, 1982; Hossler & Bontrager, 2014; Hossler et al., 1989; Iloh, 2018; McDonough,
1997; Park & Hossler, 2014; Paulsen, 1990; Perna, 2000; Vrontis, Thrassou, &
Melanthiou, 2007). Each type of approach emphasizes different factors and variables that
relate to the college decision-making process (Park & Hossler, 2014).
Economic model. The economic approach of the college decision-making
process is considered by economists to include a human capital based decision that
weighs the economic benefits against the cost of higher education (Hossler et al., 1989;
Jackson, 1982; Manski & Wise, 1983; Park & Hossler, 2014; Vrontis et al., 2000). Two
branches of this model exist, with one emphasizing institutional, statewide, and national
enrollment analysis, and the other focusing on the individual student’s characteristics in
conjunction with their enrollment decision (Fuller, Manski, & Wise, 1982; Hossler et al.,
1989). Focusing on the individual students’ decision-making process, students consider
maximizing their benefits by ensuring that attending a specific college will be worth the
cost (Hossler et al., 1989; Jackson, 1982; Perna, 2006). This approach also equates the
student’s decision-making process to that of an investment, where a student may consider
earning potential after graduation with a college degree compared to their potential if

51
they did not pursue higher education (Paulsen, 1990). Using a cost-benefit analysis
allows students to make a decision that considers both the direct and indirect costs,
including tuition, fees, books, and even losing friendships as a result of leaving home
(Hossler etl al., 1999; Kohn, Mansk, & Mundel, 1976). Factors such as opportunity cost
of a student’s study time and the anticipated career earnings post-graduation all impact a
student’s college decision-making process (Bishop, 1977). Although this approach is
seminal and college decision-making models have evolved more recently to consider
additional factors, the economic model is still relevant today (Perna, 2006). It is
important for students to consider the economic approach when engaged in the college
choice process, since earnings for college graduates are higher, on average, than those of
earners who only finished high school (Perna, 2000; Perna, 2006). Many studies within
the economic approach attribute financial aid and cost to be a determining factor for
students making a decision about college choice (Avery & Hoxby, 2004; Fuller et al.,
1982).
The economic model of college choice also considers human capital and the
investments that individuals make to enhance their own abilities in order to increase
productivity (Becker, 1993; Paulsen, 1990; Perna, 2006). As students consider different
characteristics of the college, they will create value judgements for each and ultimately
decide if the institution will increase their human capital after assessing the cost and
benefits (Long, 2004; Rubin, 2011). Avery & Hoxby (2004) note that students should
evaluate their college choice through the human capital model by maximizing their
benefits by choosing the lowest cost institution. To do so, students should consider the
expenses of tuition, fees, and room and board, then determine the amount of scholarship
52
and aid against the value of consumption (Avery & Hoxby, 2004). The values could
include the human capital earned from their on-campus experience, education, faculty
interactions, library, and resources, among other benefits obtained at college (Avery &
Hoxby, 2004). Students will “invest in education up to the point that the marginal cost of
an additional year of schooling (foregone earnings plus tuition) is equal to its marginal
benefit (the discounted stream of earnings attributable to another year of school)” (Rubin,
2011, p. 677). In the economic approach, the college decision is straightforward since it
primarily considers the opportunity costs, noting that students should attend the college
where their benefits exceed the overall cost (Avery & Hoxby, 2004).
This model has limitations, however, in that it solely considers cost and economic
benefits in the decision-making process without taking other elements into consideration
(Bishop, 1977; Perna, 2006). This approach assumes “that the relevant choice is between
the cheapest of those feasible colleges and not attending college at all” (Bishop, 1977, p.
287). The economic model also indicates that not enrolling in higher education is a
considered option for students in the decision-making process, however this is an
assumption (Kohn et al., 1976). This approach is also more aligned with the third stage of
Hossler & Gallagher’s (1987) college choice model, choice, and does not take into
consideration the first two steps of predisposition and search (Park & Hossler, 2014).
Sociological model. The sociological approach also focuses on educational
aspirations that students have to pursue higher education, however unlike the economic
approach, this model considers cultural and social capital more than the cost-benefit
analysis of the aforementioned economic model (Jackson, 1982; Park & Hossler, 2014;
Perna, 2006; Terenzini, Cabrera, & Bernal, 2001). Social and individual factors relating
53
to educational and occupational aspirations are considered within the sociological
approach (Cosser & du Toit, 2002; Jackson, 1982; McDonough, 1997; Mustafa, Sellami,
Elmaghraby, & Al-Qassass, 2018; Vrontis et al., 2007). These models are often
considered status-attainment models, as students consider their socioeconomic status
when making decisions about their future careers that could lead to increased social status
attainment (Hossler et al., 1999; McDonough, 1997; Perna, 2006; Perna & Titus, 2004).
Unlike the economic model, the sociological approach tends to focus more on the
predisposition and search phases, while the economic approach is more aligned with the
final phase of choice (Hossler & Gallagher, 1987; Park & Hossler, 2014).
Terenzini et al. (2001) state that “the sociological approach examines the extent to
which high school graduates’ socioeconomic characteristics and academic preparation
predispose them to enroll at a particular type of college and to aspire to a particular level
of postsecondary educational attainment” (p. 10). Social capital refers to the networks
and connections that a student has, ultimately impacting their knowledge of educational
opportunities and resources (Bergerson et al., 2013; Morrow, 1999). A student’s social
capital may have influenced their educational opportunities and aspirations from a young
age, as variables like socialization, parental expectations, involvement, and education,
family background, influences of others, and achievement can impact education
attainment, aspirations, and college choice (Hearn, 1984; Park & Hossler, 2014; Perna,
2000; Perna, 2006; Sewell & Shah, 1968). Not only may sociological variables impact if
a student is attending college and the institution they choose, but these factors may
impact the type of institution, as students who are African-American, female, have
parents who are low-income and have low education levels, and have a large number of
54
siblings, are less likely to attend highly selective institutions and can result in
undermatching (Hearn, 1984; Hossler et al., 1989; Hoxby & Avery, 2013).
In regards to gender, “the stronger relationships of socioeconomic status and
parental encouragement to the college plans of females than to those of males seem to
reflect the differential pattern of role expectations from adult males and females in our
society,” as societal expectations for different students may have various college choice
implications (Sewell & Shah, 1968, p. 564). When considering college choice from the
sociological perspective, female students are often influenced by social influences more
than males and consider the college choice suggestions of their family and friends
(Bhayani, 2015; Hossler et al., 1989).
Although considering this approach has many benefits, limitations to the
sociological model also exist. This approach considers the earlier stages of college choice
models, predisposition and search, but is not as well suited to describe the final stage of
choice, which is especially important in this study (Hossler et al., 1999; Park & Hossler,
2014). The sociological model alone is also limiting because it does not consider
elements of the economic approach, such as cost, financial aid, and scholarships, which
have a major impact on the college choice decision-making of a student (Hossler et al.,
1999). To combat these limitations, using a combined approach that considers both
economic and sociological models will allow researchers to incorporate attributes of each
model that will allow for a more comprehensive analysis of college choice (Hossler et al.,
1999; Perna, 2006).
Information processing model. Information processing approaches to college
choice consider the way in which students obtain, process, and continuously make
55
decisions (Park & Hossler, 2014). This approach has not been fully developed, but does
discuss how influence of others, social, and cultural capital impact college choice
decision-making (Hossler et al., 1999). This approach can also relate to a student’s
habitus, which is considered to be a student’s values and beliefs that are shaped by other
members of the same group who hold similar interpretations (Bourdieu & Passeron,
1977; McDonough, 1997; Perna, 2006). The information processing perspective relates to
the way in which students access information about colleges and universities, or lack
access and resources (Park & Hossler, 2014). Although there are many implications for
future research, especially related to the search phase of the college choice process, this
approach will not be the focus of this study as its research and contributions are currently
very limited (Park & Hossler, 2014).
Combined models. Combined models of college choice include economic and
sociological approaches, and can be considered the fourth type of college choice
approaches that exist (Cosser & du Toit, 2002; Hossler et al., 1989; Hossler et al., 1999;
Park & Hossler, 2014; Perna, 2006; Vrontis et al., 2000). Considering strengths and
weaknesses of the other college choice approaches allows the combined model of college
choice to reflect the combination of different perspectives and complex factors (Cabrera
& La Nasa, 2000; Perna, 2006). Significant benefits of the “…combined models is that
the researcher can choose variables from either domain and concentrate on the
sociological aspect of college choice as a process while maintaining the decision-making
perspective of economics” (Hamrick & Hossler, 1996, p. 182). Rather than limiting the
decision-making to one particular context, such as economic or sociological, the
combined models allow those concepts to be integrated and consider various

56
constituents’ perspectives and social, economic, and policy implications to the college
choice process (Perna, 2006).
The five most popular combined models in relation to college choice include
Chapman’s (1981) model that considers both student and external characteristics,
Jackson’s (1982) three-stage model, Hanson & Litten’s (1982) five-step process, Hossler
& Gallagher’s (1987) three-stage process that has been most widely cited in the literature
and will be the focus of this study, and Perna’s (2000) proposed combined conceptual
model (Hossler et al., 1999; Park & Hossler, 2014). Prior to the emergence of these most
notable models, Hills (1964) discussed college choice in relation to decision-making,
noting that students will assign value to different institutions based on how well they
believe they will do academically at each college. Kotler’s (1976) seven-step model
related college choice to market research, including decision to attend, information
seeking and receiving, specific college inquiries, application, admission, choice, and
registration. Today, the most widely used and cited model is Hossler & Gallagher’s
(1987) three-step model, though Iloh (2018) suggests that updating the college choice
models for the modern day is necessary and required in order to best understand college
choice and should include opportunity, time, and information (Bergerson, 2009; Iloh,
2018).
Chapman’s model (1981). Chapman’s (1981) model is unlike other college
choice models in that it is not comprised of stages or steps, but instead focuses on the
relationship between student characteristics and external factors like the influence of
others, characteristics of the actual institution, and the institution’s communication with
students. Student characteristics consider socioeconomic status, aptitude on standardized

57
tests, and high school performance (Chapman, 1981; Hossler et al., 1999; Park &
Hossler, 1989). External characteristics to be taken into consideration with student
characteristics include the influence of others, especially parents, fixed college
characteristics like cost, location, and campus environment that create an institutional
image, and marketing communications from the institution (Chapman, 1981; Hossler et
al., 1999; Park & Hossler, 1989). This model should not be confused with R. Chapman’s
(1985) model, which includes a five-stage theory of college choice, including pre-search
behavior, search behavior, application decision, choice decision, and matriculation
decision.
Although this model is seminal in terms of the many college choice models that
exist, it lacks the ability to show a process of college choice that would be important in
understanding how students make decisions, but does provide insight into variables that
affect the process (Hossler et al., 1989). This model also fails to describe how students
actually make a decision about where to attend college, though it does highlight the many
variables that impact a student when making that choice. As a result, this model will not
be the focus of this study, however, it did provide a foundation for future college choice
decision-making combined models.
Jackson’s three-stage model (1982). Jackson’s (1982) combined model of
college choice is comprised of three stages, including preference, exclusion, and
evaluation (Hossler et al., 1999; Vrontis et al., 2000). The first stage of preference
focuses on the sociological approach, in that a student’s academic achievement and
educational aspirations allow them to develop a preference to attend college (Hossler et
al., 1999; Jackson 1982; Park & Hossler, 2014). This stage also includes family

58
background, although it is not ranked as important as academic achievement or the
student’s personal aspirations (Jackson, 1982). The second stage of exclusion
incorporates the economic approach because students eliminate institutions from
consideration due to location, cost, requirements, and offerings (Jackson, 1982). Jackson
(1982) notes that in this stage, students may irrationally and incorrectly exclude an
institution from their choice set based only on partial information, and if they had a more
comprehensive understanding, may not have excluded that institution. Nonetheless,
colleges and universities that a student excludes impact the choice set of institutions that
the student will then consider (Hossler et al., 1999; Jackson, 1982). The final stage of
Jackson’s (1982) theory is evaluation, where a student considers the list of institutions
that they are favoring and ultimately makes a choice about where to attend college by
rating the options and characteristics (Hossler et al., 1999).
Jackson’s (1982) model will not serve as the focus of this study, though it does
have elements of both the economic and sociological approaches of college choice
(Hossler et al., 1999). This model served as a foundation for other college choice models
in the future, however, this model does not discuss the way in which students create their
initial set of institutional choices (Hossler et al., 1999). This gap does not allow for an
understanding of the entire college choice process, including where a student begins to
search for institutions and how they form their list of potential choices. Additionally, this
model lacks consideration for students who may not be predisposed to attend college and
the impact that has on their college decision-making process.
Hanson & Litten’s (1982) three phase model. Hanson & Litten (1982) created a
three-phase model comprised of five steps to explain a student’s college decision-making
59
process. This model, unlike others, considers how a student’s gender impacts their
decision-making process (Hanson & Litten, 1982; Hossler et al., 1989). Hanson & Litten
(1982) do note that there is limited research on gender implications for college choice and
that specific theories regarding gender and college decision-making do not exist.
The five steps within this model include having college aspirations, starting the
search process, gathering information, sending applications, and enrolling (Hanson &
Litten, 1982; Hossler et al., 1989; Hossler et al., 1999). These steps can be categorized
into three stages, the first being the decision to go to college, the second stage including
the search for colleges and creation of a criteria set, and the last stage is the process of
applying and enrolling (Hanson & Litten, 1982; Hossler et al., 1999). The first stage
considers variables like self-esteem and confidence where gender difference between
men and women can be observed, as men were found to be more self-confident than
women (Hanson & Litten, 1982; Hossler et al., 1989). The second stage of this model
describes how students obtain information about college and engage in the search
process, including influence of others, location, cost, and environment (Hanson & Litten,
1982; Hossler et al., 1989). Again in this stage, gender differences can be noted as
women are more likely than men to apply earlier and be concerned with the environment
of the institution (Hanson & Litten, 1982; Hossler et al., 1989). The final stage of this
model includes application, admissions, and matriculation into a higher education
institution and considers processes and policies of the given institution (Hanson & Litten,
1982).
While this model does incorporate elements of student characteristics and
institutional features, combining elements from Jackson’s (1982) and Chapman’s (1981)
60
models, this model does not adequately consider the predisposition phase. It is, however,
one of the first models to indicate that college choice is a continuous process, however, it
does not consider the different variables within the model to be interrelated (Hossler et
al., 1999). A benefit of this model in relation to this study is that it considers student
characteristics, specifically gender (Hanson & Litten, 1982). Additionally, this model
may need to be updated for today’s students, as aspects of the search process have
dramatically changed since the introduction of technology.
Perna’s proposed combined conceptual model (2006). The newest combined
model to be analyzed is the most recent construct of economic and sociological
approaches, Perna’s (2006) proposed conceptual model, which also draws upon a
student’s habitus. Habitus is considered to be a student’s “system of values and beliefs
that shapes an individual’s views and interpretations” that is a set of subjective
perceptions held by all members of the same group (Bourdieu & Passeron, 1977;
McDonough, 1997; Perna, 2006, p. 115). By considering habitus, this college choice
model also takes into consideration the way in which college choice decision-making
may vary across race, ethnicity, and socioeconomic status, among other groups (Perna,
2006). Perna (2006) “found that measures of social and cultural capital improved the
explanatory power of a traditional econometric model of college enrollment that included
only measures of gender, race, financial resources, and academic preparation and
achievement” (p. 116). Additionally, cultural and social capital impacted the decisions of
African-American and Hispanic students more than their White counterparts (Perna,
2000; Perna, 2006). As a result, it is important to consider the habitus, social capital,
cultural capital, and organizational context when analyzing college choice models (Perna,
61
2006). This proposed conceptual model suggests that a student’s college choice is
impacted by the individual’s habitus, the school and community context, the higher
education context, and the social, economic, and policy context (Perna, 2006).
This model seeks to fill the gap in the previous models on college choice that
pertain mostly to traditional students and do not consider the modern day diversity of
students enrolling in higher education (Paulsen & St. John, 2002). However, despite
incorporating a model that aligns more with today’s student, this updated model does not
explain how factors of habitus, social, or cultural capital actually impact or influence a
student’s college decision-making process (Ra, 2011).
Hossler & Gallagher’s (1987) three-phase model. Today, Hossler & Gallagher’s
(1987) model is most widely used in regards to college choice and each step of the theory
has been expanded upon and evaluated in the literature (Bergerson, 2009; Iloh, 2018;
Park & Hossler, 2014). As a result, this model will be used exclusively to guide this
study.
Hossler & Gallagher’s (1987) model is the most popular of any college choice
model because it simplified the steps seen in previous work from Chapman (1981),
Jackson (1982), and Hanson & Litten (1982) and focused on the student rather than the
institution throughout the college decision-making process (Hossler et al., 1989; Hossler
et al., 1999; Hossler & Gallagher, 1987; Park & Hossler, 2014). This model condensed
previous research into three stages, consisting of predisposition, search, and choice, and
is seen as the foundation of all college choice models (Hossler & Gallagher, 1987;
Hossler et al., 1989; Hossler et al., 1999; Park & Hossler, 2014).
62
The predisposition phase includes a student’s decision to continue onto college
after high school and is often influenced by the student’s socioeconomic status, parental
influence, and peers (Adams, 2009; Bers & Galowich, 2002; Hossler & Gallagher, 1987;
Hossler & Maple, 1993). In this phase, the student makes the decision to attend a college
or university rather than the alternative of not going to college and instead pursuing work
or the military (Hossler et al., 1989; Hossler et al., 1999; Hossler & Gallagher, 1987).
Characteristics of the student impact the predisposition stage, including socioeconomic
status, ability and achievement, attitudes of parents and peers, parental encouragement,
and involvement in extracurricular activities (Hossler & Gallagher, 1987). At the
institutional level, attendance in high school, high school curriculum, status of high
school, and proximity to a college campus also impact if a student is predisposed to
pursue postsecondary education (Hossler & Gallagher, 1987).
In the search phase, students work to find information about colleges and
universities that will ultimately lead them to make a choice on where to attend, which is
the final stage of the model (Hossler et al., 1989; Hossler et al., 1999; Hossler &
Gallagher, 1987; Park & Hossler, 2014; Paulsen, 1990; Schmit, 1991; Smith & Fleming,
2006). In the search phase, students seek to find information about colleges and
universities (Hossler & Gallagher, 1987). During this phase, students begin to engage
more with the institutions and develop their choice set, or a group of institutions that a
student is interested in applying to and learning more information about (Hossler &
Gallagher, 1987). All students engage in the search process differently, yet most high
school students are irrational about their choices within the search phase when creating
their choice set (Hossler & Gallagher, 1987; Jackson, 1982). Choice sets may include

63
attributes like selectivity, cost, distance from home, public or private, two-year or four-
year, and size (Paulsen, 1990). When creating choice sets, students still may ultimately
decide to pursue a non-college option (Hossler & Gallagher, 1987). It can be problematic
for students to have a choice set that “mistakenly eliminate an institution which is
potentially a good choice due to a lack of awareness of the range of institutions as well as
the accurate information about the institutions. This may lead to a lack of satisfaction and
non-persistence” (Hossler & Gallagher, 1987, p. 215). Although the search phase is often
connected primarily to the student, it also has implications for institutions including
timing for marketing and communicating with potential students throughout their search
phase (Paulsen, 1990).
The search phase continues until the final stage of college choice occurs, which
consists of the student ranking different institutions and evaluating their choices,
ultimately making a decision about which institution to attend (Hossler & Gallagher,
1987; Kim, 2004; Paulsen, 1990). “During the choice stage, students compare the
academic and social attributes of each college they have applied to and seek the best
value with the greatest benefits” (Hossler et al., 1999, p. 150). College courtship
procedures, or strategies that colleges use to attract students including their marketing,
communication plans, and scholarship, culminate within the choice phase (Hossler &
Gallagher, 1987). However, colleges and universities have limited control over this final
phase, as the decision is ultimately up to the student (Hossler & Gallagher, 1987).
The focus of this study is on the final phase of choice, however, research is
limited to explain choice in regards to variables like “gender, peer encouragement, high
school quality, or labor market considerations” (Hossler et al., 1989, p. 265). This study

64
seeks to provide a better understanding of college choice and decision-making, especially
among female students at Marathon University.
Variables Involved in College Choice
In addition to understanding college choice models and the way in which students
make decisions about where to attend college, the variables that impact admission and the
student decision-making process in the final choice phase also need to be considered for
this study (DesJardins et al., 1999; Hossler et al., 1989; Hossler & Gallagher, 1987; Park
& Hossler, 2014). Two types of variables relating to college choice exist, including
characteristics of the student and characteristics of the institution (Hossler et al., 1989).
Personal factors and student characteristics, such as socioeconomic status, academic
aptitude, gender, ethnicity, proximity to home, and parent’s education level,
encouragement, and support, can be attributed to college choice (Cosser & du Toit, 2002;
Hossler et al., 1989). Standardized test scores, such as the SAT and ACT, serve as
predictors of college performance and are evaluated in the admissions process (Bielby et
al., 2014; Baron & Norman, 1992). GPA and high school grades (Bielby et al., 2014;
Conger, 2015; Goldin et al., 2006), merit scholarship awards and financial aid (Avery &
Hoxby, 2004, U.S. Department of Education, 2018a), proximity to home (Chen &
Zerquera, 2018), and income and socioeconomic status (Hossler & Bontrager, 2014) are
other variables that should also be considered. These variables begin to be evaluated by
students in the search phase of their college choice process, but are realized and used
explicitly in decision-making in the final stage of choice (Hossler & Gallagher, 1987;
Hossler et al., 1989).
65
Institutional characteristics can be both financial and nonfinancial (Hossler et al.,
1989). Nonfinancial attributes can include location, reputation, quality of academic
programs, and marketing techniques (Hossler et al., 1989). Financial attributes of college
choice include the cost of attendance, scholarships, and financial aid opportunities for
students (Hossler et al., 1989). These types of institutional characteristics are considered
fixed, in that they are unlikely to change (Chapman, 1984; Hossler et al., 1989).
Additionally, fluid institutional characteristics that include marketing initiatives,
recruitment strategy, and changes to academic programs also contribute to and can
influence a student’s college choice (Hossler et al., 1989). This literature review will first
consider personal characteristics of the student and then institutional attributes that
impact a student’s college choice decision-making process, while maintaining the
primary focus on individual characteristics for the purpose of this study.
Personal attributes involved in college choice. Individual student characteristics
contribute to how students decide where to attend college during the final phase of choice
within the college search process (Hossler & Gallagher, 1987). Many studies have been
done that look at college choice related to student attributes, however, few studies have
been done that look at the combination of variables and the influence they have on
college choice (Hossler et al., 1989). For the purpose of this study, individual student
characteristics such as gender, academic aptitude, socioeconomic status, ethnicity,
parental level of education and encouragement, proximity to home, and the timing of the
college application process will be reviewed.
Gender. Since gender is the focus of this study, the first student characteristic to
be discussed in this review will be the way in which gender impacts college choice
66
decision-making. Despite increased research regarding gender in relation to college
choice, research findings are inconclusive and often contradictory (Hanson & Litten,
1982; Park & Hossler, 2014; Perna, 2006). As previously noted, more women than men
are entering higher education each year as the gender gap in enrollment has reversed over
the past 40 years, yielding extensive research about this phenomenon (Barone, 2011;
Baum & Goodstein, 2005; Bergerson et al., 2013; Bielby et al., 2014; Bishop, 1992;
Conger, 2015; Conger & Dickson, 2017; DiPrete & Buchmann, 2013; Evers et al., 2006;
Goldin et al., 2006; Peter & Horn, 2005; U.S. Department of Education, 2018a; 2018b).
Despite changes in enrollment patterns, some studies report that gender does not have an
impact on college choice (Avery & Hoxby, 2004; DesJardin et al., 1999; Hossler et al.,
1989; Hossler & Stage, 1992; Perna, 2000), while others indicate that women are more
inclined to apply to college than men (Cho et al., 2008; Perna & Titus, 2004; Weiler,
1994).
Although there does not seem to be a consistent understanding between men and
women and their overall college choice process, gender may have an impact on the
variables that men and women each consider important when engaging in the final stage
of choice and ultimately choosing a college or university to attend (Chapman, 1981;
Hanson & Litten, 1982; Hao & Bonstead-Bruns, 1998; Hemsley-Brown & Oplatka, 2015;
Hossler et al., 1999; Iceland, 2014; Lockheed, 1982; Paulsen & St. John, 2002; Peter &
Horn, 2005; Rosenfeld & Hearn, 1982; Stricker et al., 1991; Wiese et al., 2010). The
following personal and institutional characteristics will be discussed in greater detail later
within this review, but it is important to note how gender as a variable can interact with
other characteristics during the college choice decision-making process.

67
Academic aptitude and expectations. Gender differences in academic ability,
including high school performance and standardized test scores, are often noted within
the literature. Men tend to have significantly lower academic expectations than women,
which may result from increased behavioral issues in the classroom and lower GPAs than
women (Hao & Bonstead-Bruns, 1998). Compared to women, men also tend to have
higher grades and scores in math specifically but lower scores in reading than women,
and women are found to generally have higher class ranks than men (Hanson & Litten,
1982; Hao & Bonnstead-Bruns, 1998). Overall, women show higher grades academically
in high school but lower standardized test scores than men (Peter & Horn, 2005; Stricker
et al., 1991). It should also be noted that women are more likely to take the SAT, ACT,
and GRE, which coincides with the enrollment trend of more women entering college
each year nationally (Stricker et al., 1991). However, women also tend to lack the
college-preparation courses that would allow them to be more successful on their
standardized tests compared to men, have lower confidence in their math abilities, and
higher test anxiety than men that can impact their standardized test scores (Stricker et al.,
1991). While gender bias in standardized tests and testing in general have been found to
be decreasing, instances where bias within the actual test that could favor either men or
women can still exist, which may have an impact on the overall success of a student’s test
result (Lockheed, 1982; Stricker et al., 1991). Lockheed (1982) also notes that there are
fewer differences between men and women’s test scores when both genders have been
adequately prepared academically, which is especially true in the instance of math.
Men may choose to attend college with the expectation that they will make more
money if they attend, which also may influence the majors that men are more likely to

68
choose than women (Hanson & Litten, 1982). Women are considered to have more
intrinsic motivation and goals when considering pursuing higher education, such as
gaining an education and enhancing their skills, to become more cultured, and further
develop their interests (Hanson & Litten, 1982). Women may also be motivated to
continue to postsecondary education because obtaining a bachelor’s degree has more
economic and non-economic benefits for women than men, which may attribute to higher
rates of female enrollment nationally (Perna, 2005; Perna, 2006).
There are also gender differences in the academic programs that men and women
seek to pursue. Academic majors in engineering, computers, mathematics, and statistics
are comprised of mostly men, compared to women making up the majority of students in
academic programs like education, psychology, literature, humanities, and languages
(Iceland, 2014; Stricker et al., 1991). As a result, median earnings for professions based
on the majors where men gravitate is about $80,000 annually, compared to $50,000 a
year for women in the majors that they overwhelmingly populate (Iceland, 2014).
Women do enter college with more of a definitive idea of what they wish to study, but are
more open to general education programs than their male counterparts (Iceland, 2014).
Socioeconomic status. Socioeconomic status as it relates to gender for the purpose
of this study will not serve as a variable for consideration during the quantitative analysis
of the research findings, as socioeconomic status is difficult to define and quantify. As an
alternate, net cost will be examined. To put the interaction of socioeconomic status and
gender into national context, women make up 60% of students within the lowest
socioeconomic quartile, providing them with more barriers to higher education than
students from higher socioeconomic backgrounds (Peter & Horn, 2005). Implications of
69
socioeconomic status as it relates to college choice overall will be discussed in greater
detail later in this chapter.
Ethnicity. Ethnicity as it relates to gender for the purpose of this study will serve
as a variable for consideration during the quantitative analysis of the research findings. It
should be noted that nationally, the percentages of women from all ethnic and racial
backgrounds are increasing in both enrollment and degree attainment in higher education
(Peter & Horn, 2005). The relationship between different ethnic groups and college
choice decision-making will be explored in greater detail later in this chapter.
Influence of others. Parents, peers, and counselors impact both men and women
when making decisions about where to attend college (Hanson & Litten, 1982; Hossler et
al., 1999). However, female students may be more dependent on their parents and more
influenced by them when making a college decision (Hanson & Litten, 1982; Hossler et
al., 1999; Lockheed, 1982; Rosenfeld & Hearn, 1982; Shank & Beasley, 1998).
Additionally, female students generally talk more to their parents than male students and
also consult more with friends about their plans for college than men (Hossler et al.,
1999). Women do have more financial reliance on their parents than men do, which may
also contribute to them being more influenced by their parents when making a college
choice decision (Rosenfeld & Hearn, 1982). On the contrary, men are found to consult
more with their teachers and counselors than women (Hanson & Litten, 1982).
College choice process timing. Research is also conflicted in regards to the timing
of the college choice process. Some findings indicate that women begin and end the
college choice decision-making process earlier than men (Hossler et al., 1989), yet other
research finds that both genders start the process at the same start time but women

70
complete the application process earlier and apply for more early decision opportunities
at selective institutions than men do (Hanson & Litten, 1982; Litten, 1982). If women do,
in fact, make decisions about their college choice earlier than men, the implications of
financial aid awards are especially important in the timing of their college choice process
and institutions should consider releasing financial aid packages earlier in the process if
they are interested in entering the final choice set for women (Rosenfeld & Hearn, 1982).
However, additional and more current research should be conducted to explore gender
differences in regards to the timing of the college choice process, as well as the
information that men and women seek when engaged in the college search process
(Hanson & Litten, 1982).
Institutional characteristics. The importance of different institutional
characteristics, such as size, location, and academic programs offered, can also differ
between men and women (Shank & Beasley, 1998; Wiese et al., 2010). Although all
institutional characteristics that exist will not be discussed for the purpose of this study,
with the exception of academic program, it should be noted that:
Women are more likely to believe that a safe campus, a diverse student
population, a favorable student-to-teacher ratio, a wide variety of course
offerings, and a college that is located close to home are important characteristics.
Men … are more likely to view a prominent athletic program as an important
characteristic of a college. (Shank & Beasley, 1998, p. 66)
Men and women equally consider other institutional variables like campus life activities
including quality of social life, aesthetics of the campus, on-campus housing
opportunities, and extracurricular activities, though women are more concerned with the

71
academic quality of an institution (Cho et al., 2007; Dolinsky, 2010; Hemsley-Brown &
Oplatka, 2015; Shank & Beasley, 1998; Wiese et al., 2010).
Proximity to home. Conflicting evidence between the genders regarding location
of the institution and proximity to home also exists (Hanson & Litten, 1982), though it is
most recognized that women desire to stay closer to home than men when choosing a
college (Chen & Zequera, 2018; Hanson & Litten, 1982; Shank & Beasley, 1998).
Students who tend to have a strong connection to home and their families, especially
Hispanic students and women, prefer to attend a college closer to home as a result (Chen
& Zequera, 2018; Shank & Beasley, 1998). The desire to be closer to home may also be
related to the variables of parental influence and financial aid, which are more important
to women during the college choice decision (Hanson & Litten, 1982; Hossler et al.,
1999; Lockheed, 1982; Rosenfeld & Hearn, 1982; Shank & Beasley, 1998).
Financial aid. Current research is also inconclusive about the impact of financial
aid on the different genders, however, there may be implications for scholarship awards
and their effects on men and women. Paulsen & St. John (2002) recommend that
additional research be conducted about how financial aid and cost impact gender
differences, especially among higher income women during the choice phase, though
other researchers determine that financial considerations impact women more than men
when making their college choice decision (Rosenfeld & Hearn, 1982).
It is also suggested that higher income women have a different set of choice
factors than higher-income men, and thus make different decisions that are most likely
not financially motivated (Paulsen & St. John, 2002). Additionally, it is unclear to what
extent financial aid impacts the likelihood of enrollment of female students, though

72
increased federal aid does increase male enrollment at private institutions (Chapman,
1981). It is thought that women have more of a financial reliance on their families than
men and receive more financial support from their parents, and as a result, may be more
impacted by influence of parents, educational expectations, and financial aid
opportunities (Hanson & Litten, 1982; Lockheed, 1982). It can also be determined that
women receive less overall financial aid than men, including grants, loans, and work-
study opportunities, which makes their reliance on family support and financial aid when
making a decision about college that much more important (Rosenfeld & Hearn, 1982).
When isolated from gender, the following variables have an impact on the student college
choice decision-making process.
Academic aptitude. Academic aptitude, including high school academic
performance and standardized test scores, are often variables that are attributed to college
choice decision-making (Anderson, Bowman, & Tinto, 1972; Chapman, 1981; DesJardin
et al., 1999; Hearn, 1984; Hossler et al., 1989; Park & Hossler, 2014). Students use their
academic aptitude to evaluate institutions in the search phase and ultimately make a
decision about where to attend college based on an institution that will serve as the best
academic fit (Chapman, 1981). Research posits that students choose an institution to
attend where other students will have a similar aptitude, often choosing an institution
with an average SAT scores about 100 points higher than their own (Chapman, 1981;
Manski & Wise, 1983). Although academically prepared students are likely to choose to
attend college, they do not necessarily choose an institution that is the highest-quality
from their choice set, but instead consider other institutional characteristics (Manski &
Wise, 1983). High ability students are more likely to attend selective institutions and

73
college and universities that are out-of-state (Hossler & Bean, 1990). As a result, higher
achieving students may also consider the perceived quality of an institution when making
a decision (Hossler & Bean, 1990). Conversely, students who are lower performing
academically are more inclined to choose less competitive, in-state institutions (Hossler
& Bean, 1990). It should also be noted that admissions processes favor students who
perform well on standardized tests and have high academic achievement in their high
schools, which often presents barriers for underrepresented students to achieve access to
highly selective institutions (Astin & Oseguera, 2004).
High school performance. A student’s performance in high school has many
implications for the college choice decision-making process (Alexander & Eckland,
1977; Hossler et al., 1989; Leslie, Johnson, & Carlson, 1977; Park & Hossler, 2014). A
student who performs well in high school may be encouraged more than their
counterparts who are not succeeding in high school to attend college (Chapman, 1981).
As a result, they may be more inclined to attend and move through the college choice
process (Chapman, 1981; DesJardins et al., 1999). High achieving students in high school
may also be more likely to enroll in college preparatory courses, take advanced-
placement classes, and earn higher grades and GPAs (Alexander & Eckland, 1977; Leslie
et al., 1977; Park & Hossler, 2014). The quality of a student’s high school can also
impact their performance and college choice process, as teacher qualification, availability
of advanced courses, college counseling, access to technology, and increased budgets are
closely related to college choice decisions (Park & Hossler, 2014). It is also undisputed
that higher ability groups in high school applied to and considered more institutions than
students who had lower academic ability (Hossler et al., 1989; Litten, 1982).
74
Additionally, students with high academic performance in high school valued the overall
campus appearance and career outcomes less than lower achieving students, but both
high achieving and lower achieving students regarded the importance of the college’s
cost the same (Litten, 1982).
Standardized test scores. Standardized test scores have historically been seen as
an indicator of a student’s future college success, however, these tests have recently come
under scrutiny and been de-emphasized in many institutions’ college admissions
processes (Kobrin & Michel, 2006; Rothstein, 2004; Zwick, 2002). Standardized test
scores do help to explain a student’s enrollment behavior in their college choice decision-
making process, however, standardized tests may not be the best predicator of a student’s
success once they get to college (ACT, 2015). Students who took the ACT and had their
scores sent to an institution in their choice set tend to enroll at one of the institutions in
that initial choice set, and 83% of students who meet all four ACT college readiness
benchmarks, including English composition, social sciences, college algebra, and
biology, enrolled at a 4-year public institution within their initial choice set that they sent
a score report to (ACT, 2015). Additionally, “as the score level of the student increases,
the incidence of strong interest decrease slightly in career outcomes and campus
appearance” (Litten, 1982, p. 393).
Academic expectations. Academic expectations refer to a student’s aspirations,
judgement of their future performance in college, and provides an estimate of what the
student will accomplish in the future (Chapman, 1981). Their academic expectations may
be formed as a result of their parents’ expectations and their own educational attainment,
which often work in conjunction with each other (Conklin & Dailey, 1981; Stage &
75
Hossler, 1989). Additionally, students who are involved in high school with athletics and
extracurricular activities have higher aspirations for their education than students who are
not (Hossler et al., 1999; Stage & Hossler, 1989). This attribute also relates to the earlier
stage, predisposition, in the college choice model (Hossler & Gallagher, 1987).
Socioeconomic status. Many studies have been conducted that include the impact
of a student’s socioeconomic status as it relates to their college choice decision-making
process (Alexander & Eckland, 1977; Astin & Oseguera, 2004; Berkner & Chavez, 1997;
Cabrera & La Nasa; Hearn, 1991; Hearn & Ochs Rosinger, 2014; Kim, 2004; Leslie et
al., 1997; McDonough, 1997; Perna & Titus, 2004). In higher education today, economic
stratification between high and low income students continues to increase, as a
decreasing number of students from low socioeconomic backgrounds attend two-year
public institutions and more students from higher socioeconomic statuses are enrolling in
public and private four-year institutions (An, 2010; Chapman, 1981; Kim, 2004; Perna &
Titus, 2004). Additionally, only 40% of low income students enroll in a college or
university immediately after high school, compared to 84% of those students with family
incomes over $100,000 (Engberg & Allen, 2011).
When analyzing socioeconomic status and college choice, it is important to be
mindful of the way that socioeconomic status is defined and considered within individual
studies. Frequently attributed to socioeconomic status is the composite that includes cost
of the institution, financial aid and awards, and parental income and education level,
though not all researchers measure socioeconomic status in the same way (Perna & Titus,
2004). Other studies may relate socioeconomic status to a student’s habitus, social, and
cultural capital (McDonough, 1997).

76
Despite extensive research being doing on socioeconomic status of students and
how that impacts their college choice, research has not shown a consistent understanding
of the way in which the socioeconomic status impacts their decision-making (Hossler et
al., 1989). Some research has found that socioeconomic status is not strongly correlated
to choice, while others indicate that socioeconomic status is a strong predictor of a
student’s decision to attend college and which college they ultimately choose (Berkner &
Chavez, 1997; Leslie et al., 1977; McDonough, 1997; Park & Hossler, 2014). However,
research has found that students from high socioeconomic backgrounds are more likely to
apply to and attend more selective and competitive institutions than students from lower
socio-economic backgrounds (Avery & Hoxby, 2004; Berkner & Chavez, 1997; Braxton,
1990; DesJardins et al., 1999; Hearn 1984; Hearn & Ochs Rosinger, 2014; Maguire &
Lay, 1981; Weiler, 1994).
Additionally, research findings are inconclusive regarding the cost of attendance
and financial aid’s impact on college choice based on socioeconomic status. Some
findings indicate that the cost of the institution that a student ultimately chooses to attend
does not appear to be related to socioeconomic status (Braxton, 1990; Hossler et al.,
1989; Paulsen, 1990), however, other findings note that the increasing cost of college
does impact student decisions, especially those from lower socioeconomic backgrounds
(Cabrera & La Nasa, 2000). There is consensus that financial aid has an impact on
college choice, especially for students from disadvantaged backgrounds (Cabrera & La
Nasa, 2000; Manski & Wise, 1983; Tierney, 1980).
Ethnicity. A student’s ethnicity is also considered a characteristic impacting
college choice decision-making. It has been found that the actual college decision-making

77
process is different for students depending on their ethnicity (Kim, 2004; Perna, 2000).
When considering ethnicity and race, it is important to be mindful of how these variables
coincide with and have implications when combined with other variables, such as
socioeconomic status (Kim, 2004). Although increasing numbers of underrepresented
students are entering into higher education each year, African American and Hispanic
students are still underrepresented in colleges and universities today (Kim, 2004; Perna,
2000). Additionally, White students are more likely to attend their first choice college
than students who are African American, Hispanic, and Asian American (Hossler et al.,
1989; Kim, 2004).
Underrepresented students often have high educational aspirations to continue
into college (Hurtado, Inkelas, Briggs, & Rhee, 1997; Park & Hossler, 2014), however,
other research suggests that African American students “hold unrealistic goals and
aspirations that are not supported by college behavior and academic achievement” and
their ability is often not consistent with the number of applications they submit (Park &
Hossler, 2014, p. 57; Perna, 2000). African American female students are more likely to
enroll in college than males, which could also be attributed to parental expectations and
encouragement, and African American students overall are more likely to attend a four-
year institution than a two-year institution compared to their counterparts (Manski &
Wise, 1983; Park & Hossler, 2014; Perna, 2000). Additionally, African American
students may be more concerned with the cost of college and their ability to pay than
students from other racial and ethnic backgrounds (Hemsley-Brown & Oplatka, 2013;
Park & Hossler, 2015; Perna, 2000).

78
Hispanic students are more likely to be first generation than other students, which
may impact their college choice decision-making process in regards to lower college
aspirations, expectations, and academic achievement (Ceja, 2006; Park & Hossler, 2014).
Hispanic students are also more likely to attend community college, and are
overrepresented at two-year schools compared to White and African American students
(O'Connor, Hammack, & Scott, 2010; Park & Hossler, 2014). They also tend to have
lower parental involvement than White or African American students, which impacts
their college decision-making process and decreases their level of financial understanding
and information (Ceja, 2006; O'Connor et al., 2010; Perna, 2000; Santiago, 2007).
Because parental involvement is lower than for other students, Hispanic students tend to
rely on advice and suggestions from their peers and siblings (Ceja, 2006; Park & Hossler,
2014; Sokatch, 2006). They also are “attracted to less-selective institutions that are most
likely 2-year institutions, public, less costly, have high dropout rates and are close to
home” (Pérez & Ceja, 2015, p. 3; Santiago, 2007).
Asian American students tend to have higher academic expectations and influence
from parents, although there is diversity within the Asian student population regarding
college choice (Park & Hossler, 2014). Asian American students often tend to be
categorized as one group, however, ethnic subgroups within the population have different
social and institutional experiences that are often misrepresented with the designation of
one, uniform racial group (Teranishi, Ceja, Antonio, Allen, & McDonough, 2004).
Generally and often stereotypically, Asian American students’ parents tend to have high
academic expectations, aspirations, and involvement with their students (Kim & Gasman,
2011; Park & Hossler, 2014; Teranishi et al., 2004). Asian students also apply to college

79
at twice the rate of White students and have the highest expectations for degree
attainment compared to students from any other background (DesJardins et al., 1999;
Hurtado et al., 1997). They also apply to their first-choice institutions more and complete
standardized tests earlier than other students, and financial aid is a strong influencer in
their choice to attend their top choice college (Kim & Gasman, 2011; Park & Hossler,
2014).
Influence of others. Research is pervasive on the significant people in a student’s
life, such as parents, friends, and counselors, and their impact on the student’s college
choice decision-making process (An, 2010; Ceja, 2006; Chapman, 1981; Conklin &
Dailey, 1981; Hossler & Stage, 1992; Hossler et al., 1989; Hossler et al., 1999; Litten,
1982; Manski & Wise, 1983; McDonough, 1997; Park & Hossler, 2014; Perna, 2000;
Perna & Titus, 2004; Stage & Hossler, 1989). Education, involvement, and
encouragement from parents and the influence of peers and counselors is one of the
primary influencers found in the literature that impacts college choice (An, 2010; Ceja,
2006; Chapman, 1981; Conklin & Dailey, 1981; Hossler & Stage, 1992; Hossler et al.,
1989; Hossler et al., 1999; Litten, 1982; Manski & Wise, 1983; McDonough, 1997; Park
& Hossler, 2014; Perna, 2000; Perna & Titus, 2004; Stage & Hossler, 1989).
Parents. Parents remain the strongest influencer of college choice for students and
attributes such as the parental level of education, involvement, expectations, and
encouragement have significant effects on college choice (An, 2010; Conklin & Dailey,
1981; Hanson & Litten, 1982; Hossler et al., 1989; Hossler et al., 1999; Hossler & Stage,
1992; Litten, 1982; Manski & Wise, 1983; Perna & Titus, 2004; Stage & Hossler, 1989).
Research uniformly determines that as levels of parental education increase, the rate at
80
which students apply and enroll in college also increases (An, 2010; Hossler et al., 1989;
Hosslet et al., 1999; Hossler & Stage, 1992; Manski & Wise, 1983; Stage & Hossler,
1989). College-educated parents have a better understanding of the college process than
parents who did not attend college since they have experience going through it
themselves, and as a result, are more likely to value education and pass those beliefs
along to their children (An, 2010; Hossler et al., 1999). Parents who went to college are
also familiar with how the college system works and are able to better help their students
prepare (Hossler et al., 1999). Additionally, students whose parents went to college begin
working on their college applications earlier than students whose parents did not attend
college (Litten, 1982). Although parental education overall is a strong indicator of a
student’s college decision-making, the father’s educational level is the strongest
influencer for both male and female students (Stage & Hossler, 1989). Additionally,
students whose parents had lower levels of education, lower incomes, and more siblings
were less likely to go to highly selective institutions (Hearn, 1984).
Parental involvement, expectations and encouragement are undisputed factors that
are significant in college choice decision-making for students and these variables are
often used interchangeably throughout the literature (Conklin & Dailey, 1981; Perna &
Titus, 2004). It is universally determined that a student is more likely to attend a college
that is a selective, four-year institution when their parents are involved, expect them to
attend college, and encourage them throughout the college process (Conklin & Dailey,
1981; Hossler et al., 1989). Though parental encouragement and expectations may have
more of an impact on the earlier stage of predisposition, parental influence nonetheless
has an impact on the student’s ultimate decision on where to attend college (Hossler et

81
al., 1989). Conversely, students who are low-income, have low academic achievements,
and whose parents have lower levels of education saw parental expectations begin to
decline throughout their time in high school, even when the parents had high expectations
at the start of their student’s freshman year (Hossler et al., 1999).
Peers & siblings. Although students in the college decision-making process may
consult their peers and friend groups, this factor is not as significant on the overall
college choice decision as parents, especially within the final choice stage (Bhayani,
2015; Hossler & Gallagher, 1987; Hossler et al., 1989; Hossler & Stage, 1992). It has
been found that the college choices of a student’s friends may have an impact on their
college choice process, however, parental influence is still much greater throughout the
college choice decision-making process (Chapman, 1981; Fletcher, 2012; Park &
Hossler, 2014). Students whose friends are also applying to colleges are more likely to
enroll themselves, and students whose classmates aspire to attend college are also more
likely to attend (Fletcher, 2012; Hossler & Gallagher, 1987; Manski & Wise, 1983). It
should be noted that peers can influence a student’s choice set, in that students may feel
influenced by social norms of acceptable choices when determining where to attend
college (Fletcher, 2012). Female students may also be more susceptible to influence by
peer groups and social influence than their male counterparts (Bhayani, 2015).
Research is limited on the impact that siblings have on a student’s college
decision-making process and ultimate choice (Goodman, Hurwitz, Smith, & Fox, 2015).
Despite limited research, it can be concluded that younger siblings are more likely to
follow their older siblings decisions about college and choice of institution, as one-fifth
of younger siblings will enroll in the same institution as their older sibling (Goodman et

82
al., 2015). Additionally, a younger sibling’s decision about college is more likely to
mirror their older sibling’s choices when the two siblings have similar academic
achievements, gender, and age (Goodman et al., 2015).
Counselors. High ability students view their high school counselors as a source of
information throughout the college decision-making process more so than lower ability
students (Litten, 1982). High school counselors had a positive impact on students to
attend more selective institutions than those students who did not have the opportunity to
work with a college counselor (Avery, 2010). Parents still impact students more than any
other constituent group and are the predominant influencer on students making a college
choice decision, as one-third of students who receive college counseling did not follow
the advice from their counselors (Avery, 2010).
College choice process timing. Within the college choice decision-making
process, it is often difficult to know when students are making decisions about where to
attend college (Park & Hossler, 2014). Research is limited on the timing in which
students engage in the choice process aside from attributes of gender and ethnicity in
relation to timing (Park & Hossler, 2014; Perna, 2006). An estimated timeline of the
college choice decision-making process considers predisposition to occur between the
seventh and tenth grade, search stage to happen during the tenth through twelfth grades,
and the final stage of choice being made in the eleventh and twelfth grades (Hossler et al.,
1999; Perna, 2006).
However, it can be determined that if students start to consider the choice process
later in their high school career, they are more inclined to attend a two-year institution
rather than a four-year college or university (Hossler et al., 1999; Park & Hossler, 2014).
83
Additionally, students can decide on their first-choice college as early as ninth grade,
however, their decision is often not followed through and is subject to change (Litten,
1982; Park & Hossler, 2014; Stage & Hossler, 1992). Higher ability students with
increased standardized test scores begin the application and college choice process earlier
than students who have lower academic ability (Litten, 1982). Additionally, higher
achieving students decide where they want to apply in the fall semester of their senior
year of high school, whereas lower achieving students create their choice sets later in
their high school career (Litten, 1982). By senior year, college-bound students do
decrease the initial number of institutions from their choice sets as they begin to develop
more realistic lists for consideration on where to attend (Hossler et al., 1999).
Conflicting research exists regarding gender differences and the timing of the
college choice process. Hossler et al. (1989) note that women begin and end the college
choice process earlier than men, yet other research finds that women and men engage in
the process at the same start time but women do complete the application process earlier
than men and apply for more early decision opportunities at selective institutions than
men do (Litten, 1982). Additional and more current research should be conducted to
explore gender differences in regards to the timing of the college choice process.
College visits. Though not necessarily considered an individual characteristic of a
student, the decision to visit a college campus and the impact of that visit can influence a
student’s college choice decision. Throughout the college recruitment process conducted
by institutions, including college fairs, high school visits, campus visits, Open House
events, communication plans, and marketing campaigns, the campus tour remains one of
the most important factors when students make a college choice (Chapman, 1981; Hesel,

84
2004; Secore, 2018). In fact, 65% of students indicate that the visit to campus is very
influential in their decision-making process, and African American students indicated
that a campus visit or tour ranked higher as a source of information than their White
counterparts (Hesel, 2004; Litten, 1982).
Students from both high and low socioeconomic backgrounds note the importance
of visiting a campus before making a decision about their college choice (McDonough,
1997). Higher socioeconomic students, however, are often able to make multiple college
visits or see the same campus numerous times, whereas students from lower
socioeconomic backgrounds may face barriers when visiting a campus (McDonough,
1997). While on a visit, higher socioeconomic students often ask more specific and
different questions than their lower socioeconomic counterparts, in part because they may
have parents with a college education and experience, different expectations, and know
the value and understand the importance of considering habitus when selecting an
institution to attend (Litten, 1982; McDonough, 1997). Campus visits allow students to
know how it feels to be a current student at that institution and see what their life as a
student would be like (Okerson, 2016; Secore, 2018). Therefore, a student’s visit to
campus and the outcome of that visit can also be considered in relation to college choice.
Institutional attributes involved in college choice. Research finds that
institutional attributes, such as tuition, financial aid availability, special academic
programs, academic reputation, size, and social atmosphere are important aspects that
students consider when making a decision about college choice (Hossler et al., 1989).
Initiatives like marketing, communication, and off-campus programming can also be
considered as fluid institutional characteristics (DesJardins et al., 1991; Hossler et al.,

85
1989; Kwong, 2000). While these characteristics are important in college choice, as
students who base their college choice on perceived status and prestige consider the
brand of the institution rather than the actual quality, they are especially important to
consider in higher education today with the increase of marketization and privatization
(Brennan & Patel, 2012). Overall, institutional characteristics are considered to be fixed
and static, though it is possible for changes to be made over a long period of time, and are
elements that are within in the institution’s control (Litten, 1982). As a student progresses
through the predisposition, search, and choice phases of the college choice model,
institutional factors become increasingly important (Hossler et al., 1989).
For the purpose of this study, student characteristics will serve as the focus and
institutional characteristics will be considered secondarily. Since this study is designed to
determine why female students are choosing not to enroll at Marathon University, despite
relatively even rates of application and acceptance, the emphasis of this study will be on
the student. However, it is important to consider how student and institutional
characteristics interact since student characteristics can have an impact on how
institutional characteristics are interpreted, which can help to better understand a
student’s overall college choice decision-making process (Paulsen, 1990). For example, it
can be determined that an institution becomes less attractive to students when tuition,
room and board, and distance from home increase (Paulsen, 1990). When considering
this finding against student characteristics, it should be noted that the impact of those
institutional characteristics becomes greater when the student is low income and has a
lower academic aptitude (Paulsen, 1990). Conversely, the importance of these

86
characteristics lessens when the student is from a higher socioeconomic background and
has higher academic ability (Paulsen, 1990).
Because male and female students at Marathon University apply and are admitted
at even rates, it will be assumed that both genders already considered institutional
characteristics like academic programs, reputation, size, and social atmosphere of the
institution when engaged in the predisposition and search phase. Additionally, the size of
an institution is considered to be an inconclusive variable when impacting college choice
and will not be considered in this study (Weiler, 1994). When in the final phase of
college choice, students may consider the institution’s proximity to home and financial
implications, which will vary in importance based on the student’s attributes and the way
in which institutional and student characteristics interact (Paulsen, 1990).
Proximity to home. Because the focus of this study centers on female student
choice and decision-making, the notion of proximity to home is appropriate to consider
rather than location because it combines the institutional characteristic of location to the
student characteristics. Although some research has found distance and proximity to
home to be inconclusive when considering college choice variables, especially in how
they relate to socioeconomic status (Chapman, 1981; Terenzini et al., 2001), more
substantial amounts of research do find this variable to be important to students in the
college choice decision-making process (Chen & Zerquera, 2018; DesJardins et al., 1999;
Goodman et al., 2015; Hemsley-Brown & Oplatka, 2015; Hossler et al., 1989; Turley,
2009).
A student’s proximity to an institution also has implications on their application
and college choice process, as the farther away a student is from an institution, the less

87
likely they are to have information about that college or university (DesJardins et al.,
1999). Additionally, the cost of attendance tends to increase as institutions get farther
away from the student’s home, which has a substantial impact on lower income students
(Chapman, 1981; DesJardins et al., 1999; Paulsen, 1990). Attending a college close to
home has many benefits for a student, including opportunity to commute, saving money
on food and rent, and attending either a community college or public institution that
offers in-state costs to reduce the financial burden of higher education (Turley, 2009).
Additionally, students who have a strong connection to home and their families,
especially Hispanic students and women, prefer to attend a college closer to home (Chen
& Zequera, 2018; Shank & Beasley, 1998). Proximity to a college campus will also
increase the likelihood that a student from a lower socioeconomic background will pursue
higher education (Goodman et al., 2015).
Financial considerations. Similar to considering proximity to home instead of
location, rather than considering just the cost of the institution, financial aid and
scholarship will instead be the focus of this institutional attribute as it combines both
institutional characteristics of tuition, fees, and room and board but also considers the
student characteristics and their financial needs (Hossler et al., 1989). This relationship,
however, is complex (Hossler et al., 1989). Cost is often considered a factor earlier in the
college search process within the predisposition and search phases, as students create a
choice list based on institutions with a cost that is appropriate to them (Chapman, 1981).
As a result, students focus less on the actual cost when choosing a college to enroll in
during the choice phase (Hossler et al., 1989). High income students may find cost to not
be a barrier and apply to institutions irrelevant of cost, while lower income students

88
consider cost when creating their choice set (Chapman, 1981). However, student
characteristics of financial need combine with cost to result in financial aid and
scholarship, which does have implications for students based on their socioeconomic
background (Avery & Hoxby, 2004; Chapman, 1981; St. John, Paulsen, & Starkey,
1996). Additionally, the privatization of higher education today has resulted in increased
tuition and cost-sharing of students to create high tuition and high aid with an emphasis
on student loans environment that makes it difficult for many students and their families
to afford higher education (Heller, 1997; Johnstone, 2003; Kwong, 2000; Paulsen & St.
John, 2002).
The amount and type of financial aid impacts whether a student will ultimately
choose to attend a higher education institution based on their ability to pay, though often
understanding the concepts of financial aid can be complicated and confusing for a
student (Maski & Wise, 1983; Park & Hossler, 2014). Although all students are sensitive
to tuition costs and as tuition increases, enrollment decreases (Heller, 1997; Leslie &
Brinkman, 1988; Tierney & Venegas, 2009), low income students are most affected by
financial aid and are found to apply to institutions that offer them assistance financially
(Manski & Wise, 1983; Park & Hossler, 2014). As a result, low income students are more
likely to respond to grant and financial aid opportunities and, in turn, choose an
institution that is providing them with financial assistance to gain access (Hossler et al.,
1989; Park & Hossler, 2014; Tierney, 1980). Terenzini et al. (2001) note that
… Private institutions do level the playing field for lowest-SES students by
proactively meeting their college-related financial needs. Finances, perceived to
be an insurmountable barrier for lowest-SES students aspiring to private college
89
attendance, are actually the point of access when private institution financial aid
packages can overcome students’ inability to pay. (p. 17)
As private institutions begin to offer students more financial aid, a student’s likelihood to
attend a private college or university also increases (Hossler et al., 1989; Tierney, 1980).
It should be noted that increases in financial aid can be attributed to a student’s choice of
attending a particular college rather than just access to college overall (Tierney &
Venegas, 2009). Financial aid can also be a deciding factor when students are making a
choice between multiple schools within their choice set (Hossler et al., 1989).
Although it is widely recognized that as financial aid increases for students, their
choice in enrolling in college will also increase, the relationship between financial aid
and student characteristics is complex (Heller, 1997; Hossler et al., 1989; Tierney &
Venegas, 2009). For example, students from low socioeconomic backgrounds and
African American students are the most impacted by changes in financial aid and cost,
financial aid grants have greater sensitivity than loans or work-study when compared to
enrollment, and community college students are more sensitive to tuition and aid than
students at four-year colleges and universities (Cabrera & La Nasa, 2000; Heller, 1997).
Today, there are low-income students who could qualify for aid but do not have the
resources to know how to apply, are not academically prepared, or do not realize that
they have the opportunity to attend based on financial aid (Hossler et al., 1989; Tierney &
Venegas, 2009). Perna (2006) notes that:
Inadequate knowledge and information about student financial aid may be a
primary explanation for differences between students in their behavioral
responses to what might objectively be viewed as similar dollar amount changes

90
in costs and benefits of college attendance. (Avery and Hoxby, 2004; Heller,
1997)
Therefore, lack of information regarding financial aid opportunities can impact a
student’s college choice process and access to attend college, especially for students from
underrepresented backgrounds (Perna, 2006).
When considering financial aid in relation to student characteristics and
institutional cost, it can be concluded that as the cost of higher education increases,
enrollment and college choice of students decreases. However, it is important to be
mindful of the ways in which student characteristics, such as socioeconomic status and
academic achievement, impact the way in which financial aid can influence student
college choice.
Decision-Making Conceptual Framework
In today’s landscape of higher education, college choice cannot be understood
without also taking into consideration consumer decision-making theories. Higher
education, though not a product, is considered a service that is offered to students as
customers (Moogan, Baron, & Harris, 1999). To understand college choice and decision-
making, it is imperative to consider how marketization, privatization, and globalization
impact colleges, universities, and their students (Geiger, 2012; Kwong, 2000). The
impact of globalization in higher education, where economies are integrated worldwide,
is also coupled with marketization, including the “adoption of customer-oriented attitudes
and inter-institutional diversity, and emphasizes the importance of external relations,
systems of quality assurance, inter-organizational competition, and marketing-led
management” (Oplatka & Hemsley-Brown, 2012, p. 65). Colleges and universities are
91
forced to operate as businesses, where students are consumers and the ultimate goal is to
graduate as many students as possible at the lowest cost (Kwong, 2000; Marginson,
2010). Decreasing federal and state resources force institutions to think of innovative
ways to generate revenue, which often leads to the conception of academic capitalism
where institutions work as corporate entities that provide a service rather than a public
good (Hayes, 2018; Moogan et al., 1999; Slaughter & Rhodes, 2003). It should be noted
that state government plays a primary role in higher education, especially with public
schools like Marathon University, while the federal government historically maintains a
secondary role (McGuinness, 2016; Mumper, Gladieuz, King, & Corrigan, 2016).
In the current times of globalization, Marginson (2010) posits that although higher
education institutions are more political than in previous history, they are weaker overall
and have increasing financial challenges. As a result of globalization and heightening
competition at a global scale, institutions operate more like corporations where
privatization and marketization have become commonplace (Kwong, 2000). Kwong
(2000) notes that in these times of decreasing state resources, “school administrators have
to look for financial resources; the marketplace with its money-making philosophy offers
the best ideas” (p. 89). In the last two decades, federal and state funding across the
country has declined for higher education institutions, and this trend is expected to
continue (Kwong, 2000). In fact, Mitchell, Leachman, & Masterson (2016) note that
“after adjusting for inflation, funding for public two- and four-year colleges is nearly $10
billion below what it was just prior to the recession” (para. 2). To combat declining
financial support, institutions are finding ways to generate external revenue through
innovative ideas like distance and online education, increasing recruitment and
92
enrollment of international students, and hiring of part-time faculty (Berman & Paradeise,
2016; Slaughter & Rhoades, 2003). Institutions are also responding to the market by
increasing the competitiveness of student recruitment, conducting marketing activities,
and catering to prospective students as consumers (Paulsen, 1990; Shank & Beasley,
1998).
Student as consumer. The trends of privatization, marketization, and
globalization within higher education do not just affect institutions, but students as well.
Unlikely earlier eras in higher education, the past 40 years have marked a new age in
higher education where it is common for a student to be considered as a consumer
(Bowden & Wood, 2011; Slaughter & Rhoades, 2005; Tight, 2013; Woodall, Hiller, &
Resnick, 2014). Research indicates that “each year’s students become more like academic
shoppers or consumers (Riesman, 1980), preferring vocational, occupational, or
professional courses over courses in the traditional arts and sciences” (Paulsen, 1990, p.
iii). Factors contributing to this new consideration include cost-sharing between the
student and the institution, massification of higher education with more people having
experiences in colleges and universities throughout the course of their life, overall
enhancement of academics and student life experiences, multiculturalism, and increasing
competition amongst institutions to enroll students (Johnstone, 2003; Levin, 2001; Tight,
2013). This notion that students are consumers aligns with the economic approach to
college choice, in that students are rational individuals who are making cost-benefit
analyses of higher education and consider their own self-interest and investments to
maximize the benefits of their education (Bowden & Wood, 2011; Hossler et al., 1989;
Jackson, 1982; Kwong, 2000; Manski & Wise, 1983; Marginson, 2010; Nokkala, Heller-

93
Schuh, & Paier, 2012; Park & Hossler, 2014; Perna, 2006; Teixeira & Dill, 2011; Vrontis
et al., 2000). Students as consumers want to receive the best value for their money and
invest their resources in an institution that provides more benefits than cost and
maximizes their utility (Nokkala et al., 2012, Teixeira & Dill, 2012; Woodall et al.,
2014).
Institutions should be aware that students as consumers may fall within one of the
eight different seminal consumer decision-making styles (Bakewell & Mitchell, 2003;
Sproles & Kendall, 1986). Perfectionistic consumers look for the highest quality products
and devote careful consideration and comparison to their decision-making (Bakewell &
Mitchell, 2003; Sproles & Kendall, 1986). Brand conscious consumers are especially
concerned with the expense of a product and often equate a higher price tag to the quality
of an item and are focused on brand recognition (Bakewell & Mitchell, 2003; Sproles &
Kendall, 1986). Novelty and fashion conscious consumers like innovative products that
are trendy and enjoy trying new experiences, while recreational shoppers enjoy the search
phase of decision-making and the activity of exploring their options (Bakewell &
Mitchell, 2003; Sproles & Kendall, 1986). Price conscious consumers are concerned
about cost and work to find the best value, while impulsive consumers are not concerned
with the expense and do not plan ahead accordingly (Bakewell & Mitchell, 2003; Sproles
& Kendall, 1986). Students who are overwhelmed by the amount of institutional options
during the choice phase would be considered over-choice consumers, and often have a
difficult time getting to the final stage of the college choice decision-making process
where they ultimately need to make a decision about a college to attend (Bakewell &
Mitchell, 2003; Sproles & Kendall, 1986). Finally, habitual and brand loyal consumers

94
favor a particular brand, or in the case of college choice, an institution, and express their
loyalty by continuing to return to that product or service (Bakewell & Mitchell, 2003;
Sproles & Kendall, 1986).
Strategic enrollment management professionals are also encouraged to consider
prospective students as consumers and pay attention to what students actually want,
rather than what the university is able to provide (Cardoso, Rosa, Tavares, & Amaral,
2012). If an institution considers their students to be clients and consumers, then the
institution will need to incorporate marketing strategies to recruit students (Bowden &
Wood, 2011; Cardoso et al., 2012; Shank & Beasley, 1998). In higher education today, it
is not uncommon for colleges and universities to engage in market research to identify
their student markets and competition, the image and brand of the institution, and relative
market position compared to like colleges and universities to identify which qualities of
the institution lead a student to enroll (Guilbalt; 2018; Hayes, 2018; Paulsen, 1990).
Additionally, “an institution that has knowledge about the factors that influence students’
application and enrollment decisions can increase the fit between the student and the
institution” (Wiese et al., 2010, p. 151). Institutions can use student selection process
information to develop marketing strategies designed to attract sufficient numbers of
students with the desired academic, as well as non-academic, characteristics such as
gender and ethnic orientation (Wiese et al., 2010). Hayes (2018) notes that institutions are
“challenged to provide a service to its customers – students – in exchange for something
of value – a college education and the experiences that accompany the education” and
that marketing can help the institution determine what students are looking for and gauge
their satisfaction (p. 104). If considering colleges and universities as service institutions,
95
then the satisfaction of the customer is crucial and institutions must constantly consider
their students to be customers and strive to provide an excellent experience for them
(Guilbault, 2018; Hayes, 2018).
For the purpose of this study, students engaged in college choice decision-making
are be seen as consumers. This perspective allowed the study to consider the foundational
models of college choice while remaining up-to-date with the current landscape of higher
education. This unique perspective will also contribute to the research beyond just social
cognitive and self-efficacy models, which are often seen in the literature, but by
proposing the use of consumer behavior models and decision-making theories to better
explain college choice for today’s students (Hanson & Litten, 1982).
Student decision-making and college choice. In addition to college choice
models, decision-making theories will guide the theoretical framework throughout this
study. When considering the student as a consumer in an era of higher education where
marketization, privatization, and globalization are prevalent, consumer behavior models
and social cognitive theory will guide the research of this study, including decision-
making and self-efficacy theories (Bandura, 1977; 1991; 2012; Bandura, Barbaranelli,
Caprara & Pastorelli, 2001; Wiese et al., 2010; Wood & Bandura, 1989). Since the focus
of this study is on Hossler & Gallagher’s (1987) final phase in their college choice model,
the stage of choice, decision-making theories are relevant and directly relate. Although
Hossler & Gallagher (1987) discuss the method that students use to make an overall
college decision, including predisposition, search, and choice, and the variables that a
student considers, the research fails to consider how students actually make a decision.
Johnson, Stewart, & Eberly’s (1991) quantitative study of college freshmen at a

96
Midwestern university regarding their college decision-making process found that “only
10% of the students had made their choice of a college before their senior year in high
school… Approximately 70% made their final choice during their senior year, and fewer
than 20% waited until after high school graduation” to make their final decision on where
to attend college (p. 85-86).
Students use college websites, catalogs and brochures, campus visits and college
fairs, guidance counselors, parents, and their peers to learn about college options and
build their choice set and then select one institution to attend (Avery, 2010; Dolinsky,
2010; Hossler & Gallagher, 1987; Hossler et al., 1999; Park & Hossler, 1989). Dolinsky
(2010) found that the information that a student gathers during the search phase was
overall sufficient to make a choice, however, information from colleges could be tailored
to specific student’s needs and characteristics. The way in which a student perceives the
quality of the institution ultimately impacts the selection they make, and students select
an institution that has attributes that the student prefers (Hossler & Gallagher, 1987). The
actual decision-making process that a student uses to make their final selection is often
not discussed in the current literature with the exception of a few studies (Wiese et al.,
2010), and as a result, decision-making theories will be helpful in understanding the way
in which students choose their institution in the last phase of the college choice model.
Gender implications of consumer decision-making. Comparing consumer
behavior of men and women is fundamental to this study. Gender implications and
consumer decision-making has been researched over the past 50 years, however, little
research on consumer decision-making refers to college choice explicitly (Palan, 2001).
Though often inconclusive, research finds that men and women do make decisions
97
differently, including when deciding where to attend college, and gender differences were
evident when exploring different attributes and characteristics related to the college
choice decision-making process (Bakewell & Mitchell, 2006; Chapman, 1981; Hanson &
Litten, 1982; Hao & Burnstead-Bruns, 1998; Hemsley-Brown & Oplatka, 2015; Hossler
et al., 1999; Iceland, 2014; Lockheed, 1982; Palan, 2001; Paulsen & St. John, 2002; Peter
& Horn, 2005; Rosenfeld & Hearn, 1982; Stricker et al., 1991; Wiese et al., 2010).
Although higher education is seen as a service for purchase rather than as a
product, women as consumers tend to spend more time enjoying the process of shopping
and researching options, compared to men who tend to make shopping decisions more
quickly (Bakewell & Mitchell, 2003; Hayes, 2018; Moogan et al., 1999). Men are often
seen as more agentic and goal oriented, while women are socially oriented and communal
(Bakewell & Mitchell, 2006; Iacobucci & Ostrom, 1993). As a result, women are
believed to favor relationship formation and are more susceptible to the relationship
marketing approach where a relationship between the consumer and the organizational
brand occurs (Bowden & Wood, 2011; Iacobucci & Ostrom, 1993). This attribute
coincides with the tendencies that women are more influenced by their parents, value the
location, safety, and diversity of a campus, and prefer quality academic programs more
than men (Bowden & Wood, 2011; Hanson & Litten, 1982; Shank & Beasley, 1998;
Wiese et al., 2010).
When considering loyalty, trust, satisfaction, and commitment, which are all
elements of successful marketing and brand recognition of an institution when viewing
the student as a consumer, these aspects are especially important to women who gauge
their relationships with the brand and institution when making a college choice decision
98
(Bowden & Wood, 2011). As a result, women tend to focus more on the relationship
formation and connection to a university than men, though men and women both value
loyalty (Bowden & Wood, 2011). Increased student satisfaction, trust, loyalty, and
commitment to the institution can result in a student choosing the institution from their
final choice set to attend (Bowden & Wood, 2011). Additional research indicates that
despite women being more inclined to value relationship formation with an institution,
both men and women do value creating an emotional bond, association, and brand
consciousness prior to making a decision about where to attend college, which has
implications for institutional marketing and communication styles (Bakewell & Mitchell,
2006; Bowden & Wood, 2011).
Decision-making models. Using decision-making models to frame this study is
applicable as it allows college choice, gender implications, and the notion of the student
as a consumer to all intersect. Many decision-making models exist, however, Blackwell,
Miniard, and Engel’s (2001) consumer behavior model will remain the focus of this study
and be supported by social cognitive theory and self-efficacy (Bandura, 1977; Bandura,
1991; Bandura et al., 2001).
Blackwell, Miniard, & Engel’s Consumer Behavior Model (2001). To truly
understand the college choice process of a student, especially the student as a consumer,
it is important to consider consumer behavior. Put simply, consumer behavior refers to
the “activities that people undertake when obtaining, consuming, and disposing of
products and service” and seeks to find understanding of why people purchase what they
do (Blackwell et al., 2001). As noted previously in this study, students are consumers of
higher education, which is a service and often comes with a large price tag (Johnstone,
99
2003; Slaughter & Rhoades, 2005; St. John, Paulsen, & Carter, 2005; Tight, 2013;
Woodall et al., 2014). Consumer behavior can be categorized into four types, including
information-processing, stochastic, experimental and linear, and large-system models
(Bettman & Jones, 1972). Many theoretical models about consumer behavior exist,
including consumer value theories that consider gratification, motivation, and values,
behavioral theories that consider planned behavior, reasoned action, and technology
acceptance models, and social commerce theories that include social capital, social
cognitive theory, and other sociological models (Zhang & Beyoucef, 2016). Three classic
decision making models include the utility theory based on expected outcomes, the
satisfying model, and prospect theory which considers both value and endowment
(Richarme, 2005). This study will focus solely on Blackwell et al.’s (2001) model of
consumer behavior, as this foundational model captures how different internal and
external variables impact the way in which a consumer thinks, evaluates decisions, and
then acts (Blackwell et al., 2001).
Blackwell et al.’s (2001) consumer behavior model is comprised of a seven step
process and takes into consideration internal and external factors that influence the
decision-making process (Wiese et al., 2010). Students who make decisions about where
to attend college will undertake all seven stages of the process, including problem and
need recognition, search for information, evaluation of different alternatives, selection,
consumption, post-selection evaluation, and divestment (Blackwell et al., 2001; Wiese et
al., 2010). Considering each stage of this model and comparing it against the different
variables that students consider when choosing a college will lend insight to the overall
college decision-making process from the perspective of the student as a consumer.

100
The first stage of this model is need recognition (Blackwell et al., 2001). In this
stage, the student would recognize their need to pursue higher education, which aligns
with Hossler & Gallagher’s (1987) initial stage of the college choice process,
predisposition. Blackwell et al. (2001) posit that consumers are even willing to sacrifice
in order to obtain their needs, which reflects the economic approach of cost-benefit
analysis when considering college choice (Hossler et al., 1989; Jackson, 1982, Perna,
2006). The second stage of this model refers to the search for information where the
consumer begins to actively seek out more information through various avenues. This
stage directly relates to Hossler & Gallagher’s (1987) second phase of search in their
college choice model, where a student gathers information from market dominated
sources like college websites, brochures, campus visits and college fairs and non-
marketer sources, including the perspectives of others, such as parents, peers, and
guidance counselors (Avery, 2010; Blackwell et al., 2001; Dolinsky, 2010; Hossler &
Gallagher, 1987; Hossler et al., 1999; Park & Hossler, 1989).
The third phase of this model includes pre-purchase evaluation of alternatives
(Blackwell et al., 2001). In this phase, the customer considers various options from the
previous search stage, which would include considering the choice set that the student
had created and evaluating the options of each institution (Blackwell et al., 2001; Hossler
& Gallagher, 1987). Students would create criteria to evaluate their choices, however, as
previously mentioned, students may lack the knowledge to adequately evaluate
institutions and may irrationally exclude institutions from their choice set based only on
partial information (Jackson, 1982). The fourth phase of Blackwell et al.’s (2001) model
is purchase, where the consumer chooses one option over another. A student in this phase
101
ultimately picks one institution from the choice set they created, engaging in the final
stage of Hossler & Gallagher’s (1987) college choice model. When this occurs, the
search phase is concluded.
The following stages of the Blackwell et al. (1987) model of consumer decision-
making fall outside of Hossler & Gallagher’s (1987) model, however, these next phases
could impact enrollment, melt, and matriculation of a student depending on how the
student engages in these next steps. The fifth step in the consumer decision-making
model is consumption, where the consumer takes possession and ownership of the
product if they are satisfied with it (Blackwell et al., 2001). The student as a consumer
may show pride in their decision to attend the institution of their choice, actively enroll in
orientation, schedule classes, and fully matriculate into that institution. If a student were
to change their mind in the sixth stage of the consumer decision-making theory, post-
consumption evaluation, than the student would end up not enrolling in the institution and
instead “melt” (Blackwell et al., 2001). The post-consumption evaluation is important
when considering enrollment, as choosing to attend a college and actually attending are
very different behaviors. The final stage of this model is divestment, where the consumer
needs to ultimately decide what to do with a product once they are finished with it
(Blackwell et al., 2001). In terms of higher education and student college choice, this
could be when a student graduates from the institution and chooses to be an active alum,
donate to the institution, and stay involved as a graduate student.
Social cognitive theory. In addition to consumer decision-making behavior, social
cognitive theory that includes self-efficacy is often attributed to college choice decision-
making (Caprara, Fida, et al., 2008; Cook, 2017; Diaz McKechnie, 2012; Endres,
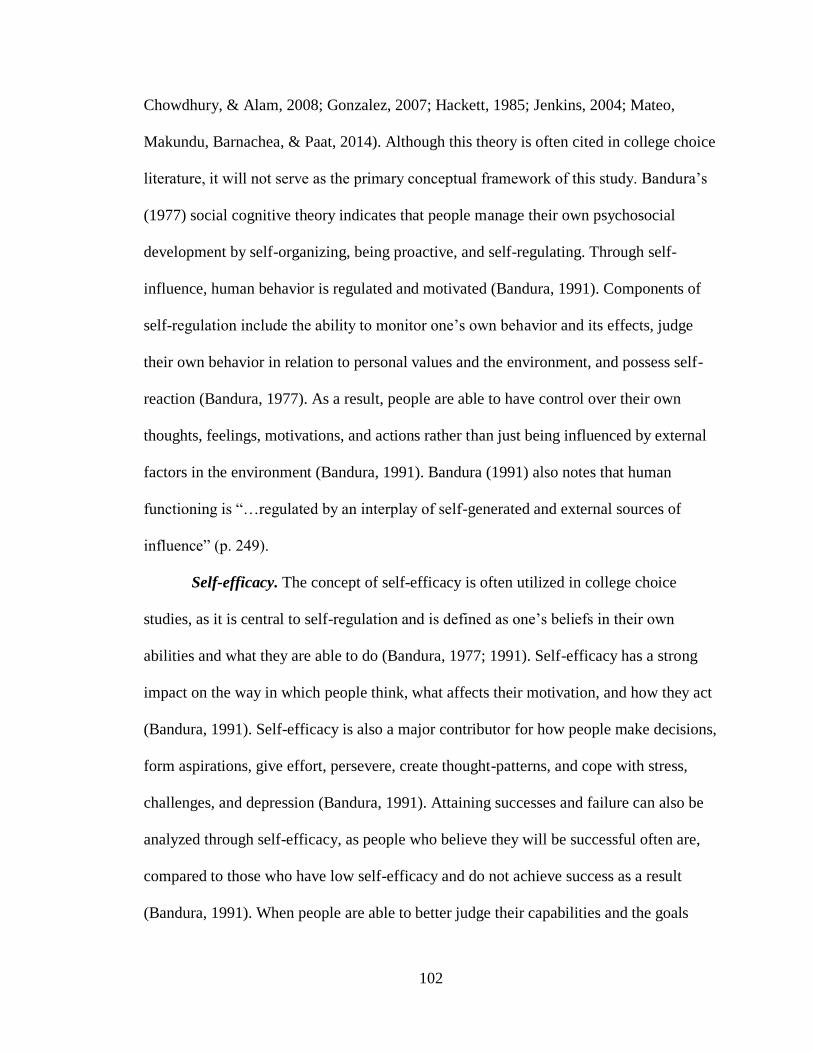
102
Chowdhury, & Alam, 2008; Gonzalez, 2007; Hackett, 1985; Jenkins, 2004; Mateo,
Makundu, Barnachea, & Paat, 2014). Although this theory is often cited in college choice
literature, it will not serve as the primary conceptual framework of this study. Bandura’s
(1977) social cognitive theory indicates that people manage their own psychosocial
development by self-organizing, being proactive, and self-regulating. Through self-
influence, human behavior is regulated and motivated (Bandura, 1991). Components of
self-regulation include the ability to monitor one’s own behavior and its effects, judge
their own behavior in relation to personal values and the environment, and possess self-
reaction (Bandura, 1977). As a result, people are able to have control over their own
thoughts, feelings, motivations, and actions rather than just being influenced by external
factors in the environment (Bandura, 1991). Bandura (1991) also notes that human
functioning is “…regulated by an interplay of self-generated and external sources of
influence” (p. 249).
Self-efficacy. The concept of self-efficacy is often utilized in college choice
studies, as it is central to self-regulation and is defined as one’s beliefs in their own
abilities and what they are able to do (Bandura, 1977; 1991). Self-efficacy has a strong
impact on the way in which people think, what affects their motivation, and how they act
(Bandura, 1991). Self-efficacy is also a major contributor for how people make decisions,
form aspirations, give effort, persevere, create thought-patterns, and cope with stress,
challenges, and depression (Bandura, 1991). Attaining successes and failure can also be
analyzed through self-efficacy, as people who believe they will be successful often are,
compared to those who have low self-efficacy and do not achieve success as a result
(Bandura, 1991). When people are able to better judge their capabilities and the goals
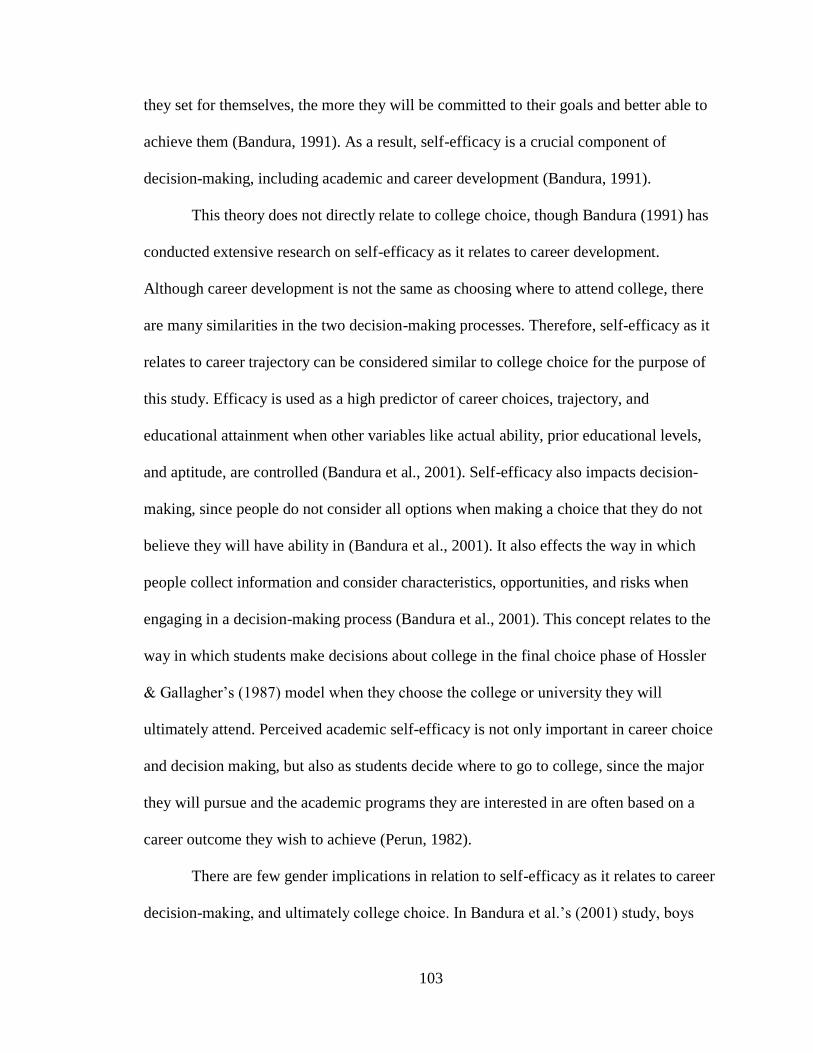
103
they set for themselves, the more they will be committed to their goals and better able to
achieve them (Bandura, 1991). As a result, self-efficacy is a crucial component of
decision-making, including academic and career development (Bandura, 1991).
This theory does not directly relate to college choice, though Bandura (1991) has
conducted extensive research on self-efficacy as it relates to career development.
Although career development is not the same as choosing where to attend college, there
are many similarities in the two decision-making processes. Therefore, self-efficacy as it
relates to career trajectory can be considered similar to college choice for the purpose of
this study. Efficacy is used as a high predictor of career choices, trajectory, and
educational attainment when other variables like actual ability, prior educational levels,
and aptitude, are controlled (Bandura et al., 2001). Self-efficacy also impacts decision-
making, since people do not consider all options when making a choice that they do not
believe they will have ability in (Bandura et al., 2001). It also effects the way in which
people collect information and consider characteristics, opportunities, and risks when
engaging in a decision-making process (Bandura et al., 2001). This concept relates to the
way in which students make decisions about college in the final choice phase of Hossler
& Gallagher’s (1987) model when they choose the college or university they will
ultimately attend. Perceived academic self-efficacy is not only important in career choice
and decision making, but also as students decide where to go to college, since the major
they will pursue and the academic programs they are interested in are often based on a
career outcome they wish to achieve (Perun, 1982).
There are few gender implications in relation to self-efficacy as it relates to career
decision-making, and ultimately college choice. In Bandura et al.’s (2001) study, boys

104
were found to have significantly higher self-efficacy towards mathematics, geographic
science, and careers in science, technology, engineering, and math (STEM) fields than
girls. Conversely, girls had more self-efficacy towards academic motivation and
scholastic aptitude, socializing and creating friendships, and careers in education and
health-related industries (Bandura et al., 2001; Pastorelli et al., 2001). While there is no
clear explanation as to these differences in self-efficacy by gender, the stereotypes and
societal and psychological differences between males and females have implications that
may explain differences in self-efficacy (Endres et al., 2008).
Context of Study
Marathon University is a mid-size, four-year, public institution in the northeastern
region of the United States that is a predominantly White institution. Its main
undergraduate campus is suburban and sits in a college town whose economy revolves
around the institution. In recent years, Marathon University opened two medical schools
and increased their focus on science, technology, engineering, and math (STEM) fields at
the undergraduate and graduate levels. Additionally, the institution has been enhancing
its relationships with other institutions to develop partnerships that work to recruit
evolving student populations, including transfer and non-traditional students. Marathon
University’s mission focuses on student learning, research excellence, and service, which
is complemented by the institution’s foundation, including access, affordability, quality,
and being an economic driver in the local community and state. The university offers
robust athletics and student life programming, including clubs and organizations,
leadership opportunities, various resource centers, and academic, social, and professional
initiatives for its students.

105
Marathon University currently enrolls close to 20,000 total students, including
15,000 undergraduate and over 3,000 graduate and professional students. Each year, the
institution receives about 15,000 applications for undergraduate admission for an
incoming class of about 2,500 students. Men and women apply to Marathon University at
equal rates, and are similarly admitted to the institution. Interestingly, for the past few
years at Marathon University, first-time, full-time, undergraduate female enrollment and
matriculation lags behind their male counterparts, as 40% of the incoming first-time, full-
time, undergraduate class are female compared to 60% male, which is opposite of trends
seen nationwide in the last 40 years (Peter & Horn, 2005; U.S. Department of Education,
2018b). As a result, the first-time, full-time undergraduate student population is 40%
female and 60% male. The same enrollment trends in regards to gender are not seen in
transfer or graduate students, and these populations will be excluded from the study.
Additionally, part-time and international student populations at Marathon University will
be excluded, as the size of this population is too small to be significant for the purpose of
this study. The enrollment trend in regards to gender is uniquely a problem in first-time,
full-time, undergraduate students and will be the focus of this study.
The university offers 100 different undergraduate academic programs and is
continuing to increase its master’s, doctoral, and professional degrees in addition to
various undergraduate and graduate certificate programs. Applications to Marathon
University have nearly tripled in the past 10 years alone. Popular academic programs
include engineering, education, communications, business, and STEM-related fields.
Marathon University’s rankings have been climbing in both the region and nation,
demonstrating their increasing enrollment, competitiveness, academic programs, and
106
outcomes. The university also recently became a designated research institution,
emphasizing an increased interest in the STEM field and gaining national recognition.
Despite the increasing growth of the institution, Marathon University has
maintained nominal tuition increases, allowing the public institution to stay affordable
and provide access without cost-sharing at the expense of its students, which aligns with
the overall mission of the institution (Johnstone, 2003). Campus infrastructure has grown
dramatically in the past 10 years at Marathon University, as well, with the development
of new academic buildings, residential living opportunities, and retail and entertainment
space through public-private partnerships. Despite growing infrastructure and
competitiveness academically, the university lacks a true brand that would help students
to develop an image of the institution, whether or not it is an accurate assessment on the
true identity of the school, which can have a lasting impact on the final phase of choice in
their college decision-making process (Hossler et al., 1989).

107
Chapter 3
Methodology
The purpose of this concurrent mixed methods case study was to identify factors
impacting female enrollment at Marathon University by investigating quantitative data
generated from secondary, institutional research, and analyzing qualitative, open-ended
survey results from accepted students. Using a pragmatic worldview and a mixed
methods approach within the case study, I was able to explore student experiences with
enrollment at Marathon University within the qualitative data that complemented
quantitative findings and gave human voice to the secondary data analyzed. Using a case
study research design provided an in-depth analysis of the social phenomenon of how
women make decisions about college choice at one particular institution (Yin, 2014). The
approach and variables used within this mixed methods case study were also derived
from the college choice model (Hossler & Gallagher, 1987) and consumer decision-
making model previously discussed (Blackwell et al., 2001).
Research Questions
The following three research questions guided the study of female enrollment
trends at Marathon University:
1. What predicts the differences between females who enroll compared to
females who do not enroll, and males who enroll and males who do not enroll
at Marathon University?
a. Academic program
b. GPA
c. Standardized test scores
d. Ethnicity
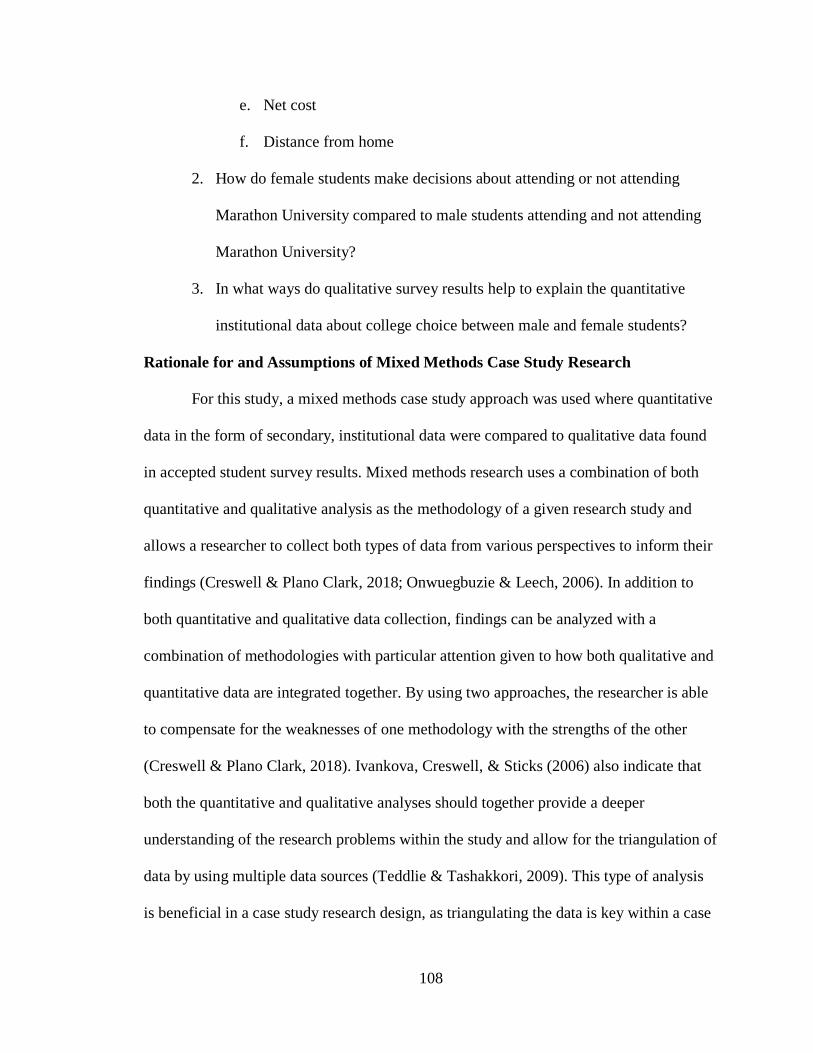
108
e. Net cost
f. Distance from home
2. How do female students make decisions about attending or not attending
Marathon University compared to male students attending and not attending
Marathon University?
3. In what ways do qualitative survey results help to explain the quantitative
institutional data about college choice between male and female students?
Rationale for and Assumptions of Mixed Methods Case Study Research
For this study, a mixed methods case study approach was used where quantitative
data in the form of secondary, institutional data were compared to qualitative data found
in accepted student survey results. Mixed methods research uses a combination of both
quantitative and qualitative analysis as the methodology of a given research study and
allows a researcher to collect both types of data from various perspectives to inform their
findings (Creswell & Plano Clark, 2018; Onwuegbuzie & Leech, 2006). In addition to
both quantitative and qualitative data collection, findings can be analyzed with a
combination of methodologies with particular attention given to how both qualitative and
quantitative data are integrated together. By using two approaches, the researcher is able
to compensate for the weaknesses of one methodology with the strengths of the other
(Creswell & Plano Clark, 2018). Ivankova, Creswell, & Sticks (2006) also indicate that
both the quantitative and qualitative analyses should together provide a deeper
understanding of the research problems within the study and allow for the triangulation of
data by using multiple data sources (Teddlie & Tashakkori, 2009). This type of analysis
is beneficial in a case study research design, as triangulating the data is key within a case
109
study to provide a deeper understanding of a complex issue (Baxter & Jack, 2008; Yin,
2014).
A mixed methods research approach was selected for this study for several
reasons. First, mixed methods research allows for “multiple ways of seeing and hearing”
and enabled this study to include varying perspectives about college choice decision-
making (Greene, 2007, p. 20). Secondary institutional data alone would not provide the
entire story of why female students are not yielding at the same rates as their male
counterparts, yet incorporating qualitative survey results allowed the student’s voice to be
given to the data. Using just quantitative or qualitative methods would not sufficiently
capture the complex social issue at the heart of female enrollment at Marathon
University. “Triangulation of data sources, data types, or researchers is a primary strategy
that can be used and would support the principle in case study research that the
phenomena be viewed and explored from multiple perspectives,” which allows the mixed
methods approach to be both suitable and necessary when conducting this case study
(Baxter & Jack, 2008, p. 556).
Secondly, mixed methods research was chosen for this study because it allowed
for the integration of numbers and text (Tashakkori & Teddlie, 2010a). For this study, it
was appropriate to consider quantitative data analysis because this methodology seeks to
understand the views of an entire population, while using qualitative analysis was also
important since it allowed the research to consider specific perspectives of individual
students regarding college choice (Creswell & Plano Clark, 2018). Only using a single
methodology would not provide a complete understanding of the college choice decision-
making process at Marathon University, as using multiple data sources within a case
110
study. This aspect of mixed methods aligns with my pragmatic worldview, as the
pragmatic epistemology is well suited for mixed methods research because merging both
qualitative and quantitative data allows for a larger understanding of a specific issue for
the researcher (Creswell & Plano Clark, 2018).
Third, a mixed methods approach was appropriate for analyzing this case study,
as it allowed for an in-depth understanding of a specific human phenomenon (Creswell &
Plano Clark, 2011). Case studies are often used to provide an in-depth and holistic
investigation into an individual or organization, and a mixed methods approach enabled
triangulation of data that provided a better understanding of female enrollment trends at
Marathon University (Tellis, 1997). Because humans are complex, mixed methods
research questions enabled the study to provide an understanding of what and how a
social phenomenon is occurring, rather than just considering one aspect of the problem
(Tashakkori & Teddlie, 2010b). College choice decision-making includes many different
factors, and thus, a mixed methods approach was best suited. Looking at variables related
to college choice, as derived from the literature on college choice and consumer decision
making models, in addition to the student voice was imperative for a full understanding
of female enrollment trends at Marathon University, including the consideration of
individual student characteristics in addition to institutional attributes from a mixed
methods approach (Blackwell et al., 2001; Hossler & Gallagher, 1987).
Research Design
In addition to the mixed methods research design, I used a case study approach to
study the enrollment issue at Marathon University. A mixed methods case study design
allows for the use of a core design, such as concurrent mixed methods, within the
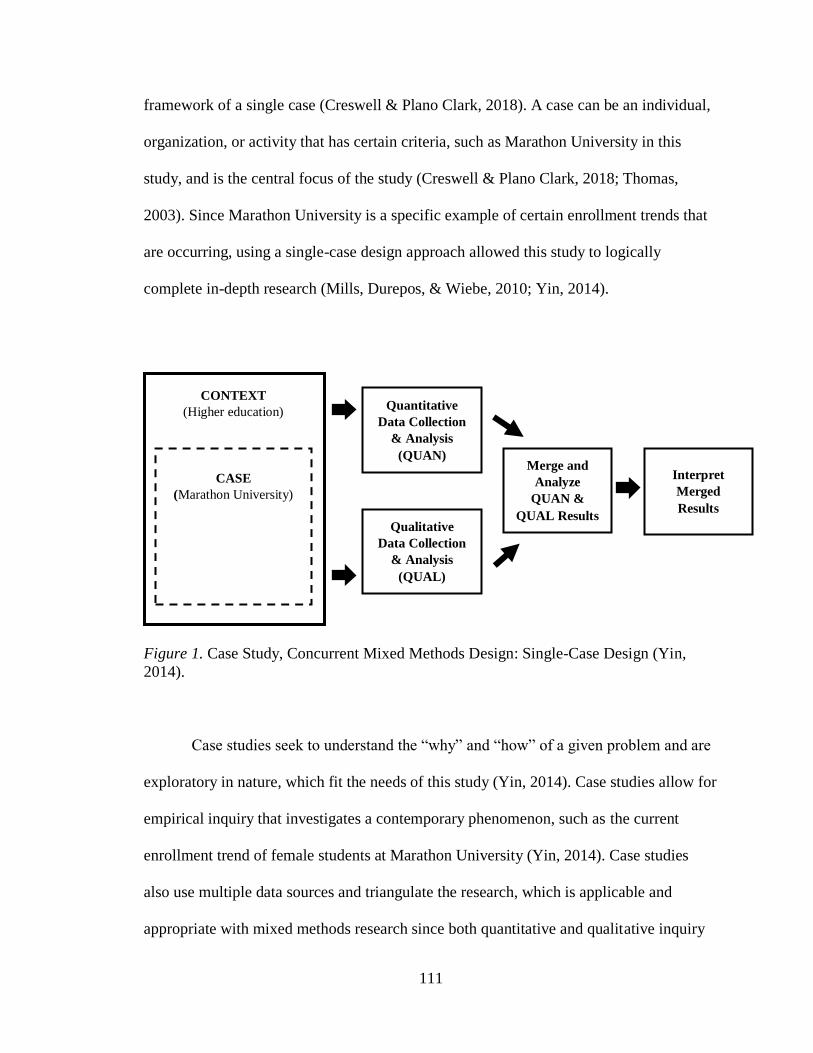
111
framework of a single case (Creswell & Plano Clark, 2018). A case can be an individual,
organization, or activity that has certain criteria, such as Marathon University in this
study, and is the central focus of the study (Creswell & Plano Clark, 2018; Thomas,
2003). Since Marathon University is a specific example of certain enrollment trends that
are occurring, using a single-case design approach allowed this study to logically
complete in-depth research (Mills, Durepos, & Wiebe, 2010; Yin, 2014).
Figure 1. Case Study, Concurrent Mixed Methods Design: Single-Case Design (Yin,
2014).
Case studies seek to understand the “why” and “how” of a given problem and are
exploratory in nature, which fit the needs of this study (Yin, 2014). Case studies allow for
empirical inquiry that investigates a contemporary phenomenon, such as the current
enrollment trend of female students at Marathon University (Yin, 2014). Case studies
also use multiple data sources and triangulate the research, which is applicable and
appropriate with mixed methods research since both quantitative and qualitative inquiry
CONTEXT
(Higher education)
CASE
(Marathon University)
Qualitative
Data Collection
& Analysis
(QUAL)
Interpret
Merged
Results
Quantitative
Data Collection
& Analysis
(QUAN) Merge and
Analyze
QUAN &
QUAL Results
112
are done (Yin, 2014). Since the problem of females enrolling at a lower rate than males at
Marathon University is a complex issue, a case study approach was both suitable and
necessary.
Concurrent mixed methods design was used for this study. In this research design,
quantitative data was collected and analyzed parallel to the collection and analysis of
qualitative data (Creswell & Plano Clark, 2018; Teddlie & Tashakkori, 2009). This
research design is also known as simultaneous triangulation, parallel study, convergence
model, and concurrent triangulation (Creswell & Plano Clark, 2018). Concurrent mixed
methodology is often viewed as one of the first designs that epitomizes mixed methods,
as the nature of this design is to separately collect and analyze both quantitative and
qualitative data and merge the two databases together to compare or combine the findings
(Creswell & Plano Clark, 2018). Mixed methods researchers, especially those engaged in
a concurrent design, often employ a pragmatic worldview, as the design allows the
research to merge their findings and gain a greater sense of understanding (Creswell &
Plano Clark, 2018). This research design allows researchers to use both quantitative and
qualitative analysis simultaneously to help demonstrate quantitative findings with
qualitative findings, and vice versa, examine the relationship between predictive
variables, and gain a complete understanding of their study (Creswell & Plano Clark,
2018).
Within the concurrent mixed methods design, researchers first simultaneously but
separately collect both quantitative and qualitative data, analyze the two datasets, merge
the results of both the quantitative and qualitative datasets, and finally interpret how the
two sets of data compare, converge, or diverge from each other (Creswell & Plano Clark,
113
2018). By comparing both the quantitative and qualitative results, researchers are able to
gain more robust results than they would have if only looking at one dataset alone
(Creswell & Plano Clark, 2018). Although this methodological design can be challenging
in that there may be differences in sample size, different types of databases, and
contradictions of results, ultimately a major strength is that this style allows researchers
to “give voice to participants as well as report statistical trends,” which is especially
important for this case study about female enrollment at Marathon University (Creswell
& Plano Clark, 2018, p. 72).
Context
As noted at the end of Chapter Two, Marathon University is a mid-size, four-year,
public, predominantly White institution in the northeastern region of the United States
that enrolls about 20,000 total students. Marathon University’s enrollment profile has
becoming increasingly competitive, especially in recent years, and applications to the
institution have nearly tripled in the past 10 years. Male and female students apply and
are admitted to Marathon University at relatively equal rates, but female students yield at
a much lower rate than male students. On average, female enrollment at Marathon
University is about 40%, compared to 56% of enrollment for female students nation-
wide.
Scope. National trends for the past 40 years indicate that female students make up
close to 60% of the undergraduate student population enrolling in higher education each
year, demonstrating a shift in enrollment where women now outnumber men (U.S.
Department of Education, 2018b). This trend, however, is not occurring at Marathon
University, as female students make up about 40% of students enrolling each year. Rather

114
than considering national trends or institutions nationwide, the study was limited to
considering enrollment at one institution through a mixed methods case study approach to
allow for a deeper understanding of the complex phenomenon occurring within the
organization.
Next, the focus of this study was narrowed by solely using Hossler & Gallagher’s
(1987) seminal model of college choice to serve as the theoretical foundation that guided
the research. Though many models and findings about college choice exist, Hossler &
Gallagher’s (1987) three phase model of predisposition, search, and choice is the most
widely regarded and used today. For the purpose of this study, I was particularly
interested in the last phase of the model and did not focus on if the student was
predisposed to attend college or what their search process entailed. By delimiting the
scope of this study to only look at the choice phase, I was able to learn more about female
students’ actual decision-making process and why more females choose not to attend
Marathon University than males. I chose to limit my perspective of this model because
female and male students apply and are accepted to Marathon University at relatively
even rates of about 50% male and 50% female each year, but female students inevitably
do not choose to enroll at the same rate. The predisposition and search phases of Hossler
& Gallagher’s (1987) model will not provide the information needed about the actual
decision-making of female students, which is why I focused on the final choice phase.
I used the literature and my own experiential knowledge to determine the
variables I examined that impact college choice decision-making in full-time, first-time,
undergraduate students. By not looking at every variable that exists as it relates to the
college decision-making process, I was able to narrow the scope of my study. Academic

115
program (Hossler et al., 1989), ethnicity (Kim, 2004; Perna, 2000), GPA (Bielby et al.,
2014; Conger, 2015; Goldin et al., 2006), SAT scores (Bielby et al., 2014; Baron &
Norman, 1992), net cost (Hossler et al., 1989), and distance from home (Chen &
Zerquera, 2018; DesJardins et al., 1999; Goodman et al., 2015; Hemsley-Brown &
Oplatka, 2015; Hossler et al., 1989; Turley, 2009) were independent variables used in this
study. Throughout my research and review of the literature on college choice, I found
other variables to be analyzed, but decided to limit the number of variables as to not
overwhelm the study with too many options that were not relevant. For example,
literature exists on father absence and the nonmarital birth rate contributing to the
growing gender gap in enrollment, attributing lack of a father figure to fewer male
students enrolling in college each year (Doherty et al., 2016). While social capital and
influences are important factors in college enrollment, these variables do not apply
directly to this study and were excluded from the research.
Quantitative Secondary Data
The initial quantitative analysis used secondary institutional data focusing on full-
time, first-time undergraduate students at Marathon University. Higher education
institutions typically collect extensive amounts of data, so using data that already exist for
another purpose is often useful (Carter, 2003). Secondary data may be in the form of
survey results or databases that exist at the federal, institution, or single-institution level
(Carter, 2003). Researchers in education may consult data storehouses and academic
archives to find appropriate secondary data to use in their studies (Kiecolt & Nathan,
1985). Glass (1976) notes that researchers using secondary data will be able to discover
different findings within the numbers and tell a new story from the existing data

116
depending on the research questions and analysis approaches. When using secondary
data, a researcher will still engage in the process of research analysis, including
developing the research questions, identifying and obtaining the appropriate dataset,
evaluating the data, and determining the findings from the data that relate to the purpose
of the study (Johnston, 2014).
Secondary data refers to the type of data used rather than an analysis technique,
and secondary data is often useful in research studies, especially within education (Carter,
2003). Secondary data can be reanalyzed for another purpose, and using secondary data
to answer new research questions is useful, resourceful, and allows for increased
comprehension and understanding of existing data sets that have yielded important
findings (Glass, 1976). Using secondary data is just as viable an option in the process of
inquiry as collecting primary data would be, especially when systemic procedures of
analysis are followed (Johnston, 2014).
The secondary single-institution data used in this study were obtained from the
Division of Information Resources and Technology and the Analytics, Systems, and
Applications department at Marathon University. This division and department collect a
wide range of institutional data, including information about student application,
admission, enrollment, retention, satisfaction, and graduation. For this study, data
including enrollment year, gender, admit type, academic program, GPA, SAT score,
ethnicity, net cost, and proximity from home were analyzed.
The population studied in this data set did not include transfer students, part-time
students, and graduate or professional students. The scope of this study was limited to
only full-time, first-time undergraduates because this population represents traditional

117
students entering college directly from high school. Although there is seldom a
“traditional” student in higher education today, most college choice models are based on
“traditional” student populations, representing freshman students entering higher
education directly after graduating from high school (Paulsen & St. John, 2002). Transfer
student populations were also excluded from the study because they apply, are accepted,
and enroll at equal rates by gender at Marathon University, which does not represent the
problem being studied at the undergraduate freshman level. Graduate and professional
students were not the focus of this study because this research was interested in the
undergraduate student college choice decision-making process, so continuing education
students were excluded from the research. Additionally, graduate and professional
student populations enroll at a more traditional rate by gender, with 58% of enrolling
graduate and professional students at Marathon University being female. Additionally,
only full-time applicants and enrolled student statistics were considered, as this aligned
with the college choice theoretical framework that guided the overall study. International
students were also excluded from the data set as they make up less than 1% of the overall
student population at Marathon University; only domestic student data were analyzed.
In addition to managing the student population analyzed in the secondary data set,
I used the literature related to college choice decision-making and my experiential
knowledge to identify certain independent, predictor variables to analyze for the
quantitative inquiry phase. Considering different institutional and individual student
characteristics related to college choice decision-making allowed me to identify various
independent variables to use within this mixed methods case study. As a result,

118
independent variables included in this study focused on the student’s academic program,
GPA, SAT scores, ethnicity, net cost, and proximity to home.
For this study, secondary institutional data was appropriate to use because it
provided extensive data on the student population at Marathon University that would
have been challenging to obtain in any other way. Using secondary data also saved time
and resources throughout this study, since the data already existed and I did not need to
engage in creating data collection procedures and gather the actual data. My experiential
knowledge, access to campus resources, and my position in strategic enrollment
management allowed me minimize the limitations of using secondary data because I
easily accessed the data sets and obtaining information was not a barrier in this study.
Limitations to using secondary data can also include unsuitability of the dataset, however,
that dataset used in this study did have the appropriate information I needed to analyze
the research problems.
Secondary quantitative dataset. For this research study, the dataset used
included Fall 2018 census data of first-time, full-time, undergraduate students. Census
data considers the 21st day of the Fall 2018 semester, which also takes into consideration
any melt that occurs from the time a student were to deposit until they enrolled. Using
census data also allowed this study to consider static, concrete data that is captured
consistently each year that can be later used for comparison in future research, rather than
enrollment data that constantly changes. Student populations included in the data set were
regular admit freshmen, special admit freshmen, and freshmen who applied for various
access programs. Excluded from this dataset were transfer students, international
students, and continuing education students. There were 14,030 freshmen applications for

119
Fall 2018, including 6,733 acceptances and 2,895 deposited students. In this dataset, 50%
of applicants were male and 50% were female, 50% of acceptances were male and 50%
were female, and 58% of deposits were male and 42% were female. Analyzed in this data
set was the student’s academic program, GPA, SAT score, ethnicity, net cost, and
distance from home.
Independent predictor variables related to college choice decision-making used in
this study included:
1. Academic program (Categorical): Academic majors were grouped together by
Classification of Instructional Programs (CIP), as developed by the National
Center for Education Statistics (NCES) for Integrated Postsecondary
Education Data System (IPEDS) (2010). Over 80 majors exist at Marathon
University and were grouped together based on CIP to form categories of
academic programs that were either STEM or non-STEM related.
2. GPA (Continuous): GPA, or grade point average, is a continuous variable
extracted from a student’s high school transcript for admission. All grade
point averages are on a 4.0, unweighted scale. Scores above 4.0 were cleaned
up, as they would display data entry error.
3. Standardized test scores (Continuous): Standardized test scores include the
Scholastic Aptitude Test (SAT). The maximum SAT score between Math and
Critical Reading is 1600 with an optional Writing section for 2400. Students
can submit either the SAT or American College Testing (ACT) for admission,
but all ACT scores were converted to their SAT equivalent through the
ACT/SAT concordance tables provided by ACT (2018).
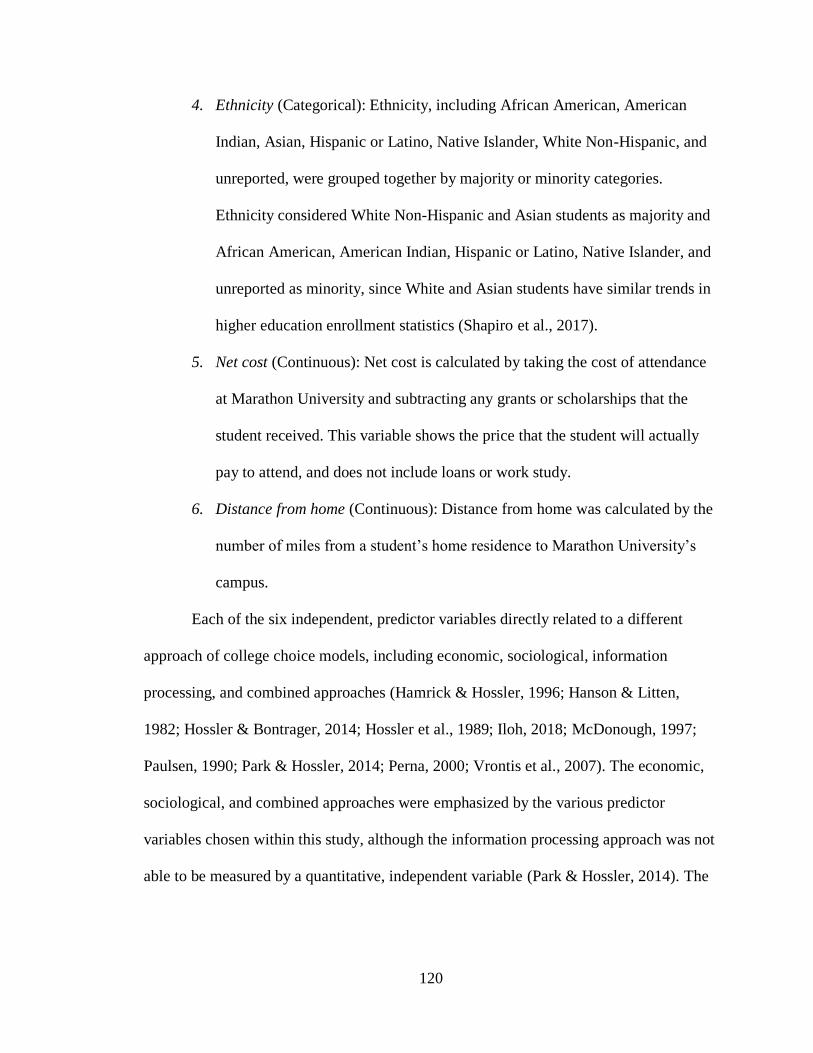
120
4. Ethnicity (Categorical): Ethnicity, including African American, American
Indian, Asian, Hispanic or Latino, Native Islander, White Non-Hispanic, and
unreported, were grouped together by majority or minority categories.
Ethnicity considered White Non-Hispanic and Asian students as majority and
African American, American Indian, Hispanic or Latino, Native Islander, and
unreported as minority, since White and Asian students have similar trends in
higher education enrollment statistics (Shapiro et al., 2017).
5. Net cost (Continuous): Net cost is calculated by taking the cost of attendance
at Marathon University and subtracting any grants or scholarships that the
student received. This variable shows the price that the student will actually
pay to attend, and does not include loans or work study.
6. Distance from home (Continuous): Distance from home was calculated by the
number of miles from a student’s home residence to Marathon University’s
campus.
Each of the six independent, predictor variables directly related to a different
approach of college choice models, including economic, sociological, information
processing, and combined approaches (Hamrick & Hossler, 1996; Hanson & Litten,
1982; Hossler & Bontrager, 2014; Hossler et al., 1989; Iloh, 2018; McDonough, 1997;
Paulsen, 1990; Park & Hossler, 2014; Perna, 2000; Vrontis et al., 2007). The economic,
sociological, and combined approaches were emphasized by the various predictor
variables chosen within this study, although the information processing approach was not
able to be measured by a quantitative, independent variable (Park & Hossler, 2014). The

121
information processing approach was explored through the qualitative analysis of open-
ended accepted student survey results.
Figure 2. Independent Variables Related to College Choice Model Approaches (Park &
Hossler, 2014).
Data cleaning procedures. Researchers must first obtain the data, prepare the
data for analysis, and then explore the data to determine findings and interpret results
(Creswell & Plano Clark, 2018). When using existing secondary data, it is important to
prepare the data for analysis by cleaning the database and checking for any errors in data
entry, recoding variables as necessary, assigning numeric values, and creating a codebook
to organize all numeric codes (Creswell & Plano Clark, 2018). Data cleaning is often
considered to include “detecting and removing errors and inconsistencies from data in
order to improve the quality of data” (Rahm & Hai Do, 2000, p. 3).
Economic
Merit Scholarship
Net Cost
Family Income
Sociological
GPA
SAT
Ethnicity
Information Processing
Combined
Academic Program

122
Errors in datasets can exist due to data entry mistakes, invalid data, misspellings,
integration issues, and duplicate information (Rahm & Hai Do, 2000). If errors exist, they
can affect the validity and credibility of the data, analysis, and findings (Osborne, 2013).
All data sets, whether primary or secondary, contain their own host of challenges and
opportunities, and it is crucial that the researcher is aware of all complexities that the data
presents when cleaning and analyzing the data (Osborne, 2013). Missing data can lead to
skewed or invalid results, and cleaning the data prior to analysis is not only beneficial but
necessary to prevent errors (Osborne, 2013). Data cleaning approaches can include data
analysis to identify improper values, misspellings, missing data, duplicates,
transformation, verification, and backflow of cleaned data to replace dirty data that
previously existed (Rahm & Hai Do, 2000).
Since secondary data was obtained for this study, it is unclear if misspellings, data
entry issues, or errors occurred. To best clean the secondary data set, outliers were
analyzed, variables were recoded appropriately, and data were cleaned to either reflect
categorical or continuous types. Ensuring that the data were clean and rid of errors was
crucial during the quantitative analysis phase of this concurrent mixed methods study
(Rahm & Hai Do, 2000).
Qualitative Data Collection
Simultaneous to the quantitative data analysis and collection, the qualitative
strand of analysis was collected in accordance to the concurrent mixed methods
procedure. Volkwein (2003) notes that new data collection activities should only be
conducted after all existing data has been reviewed and analyzed. Common sources of
existing institutional data can be admissions and student recruitment data, surveys of

123
prospective and incoming students, academic program reviews, student transcripts, and
reviews of different offices, services, and programs (Volkwein, 2003). It is common for
higher education institutions to frequently conduct surveys and assess particular
programs, models, and goals, and existing data is often plentiful at colleges and
universities (Volkwein, 2003). For this study, existing accepted student survey data were
used for the qualitative exploration of the research questions. At Marathon University, an
outside research corporation conducts accepted student surveys each year for the
purposes of collecting information about where students choose to attend or not attend
the university and why. Rather than creating a similar survey and administering it to
accepted students, using existing survey data were more resourceful, accurate, and useful
to the overall study. The accepted student survey is administered annually in June at the
conclusion of each admissions cycle, and survey results are collected and analyzed in
August. The survey is sent electronically to all accepted students at Marathon University,
including both students enrolling and not enrolling at the institution.
Participants. For the qualitative portion of this study, I used purposive sampling
of accepted students at Marathon University for the survey analysis (Teddlie &
Tashakkori, 2009). Purposive sampling is incorporated to achieve representation and
comparability within a population (Teddlie & Tashakkori, 2009). The existing accepted
student survey at Marathon University was delivered electronically by the external
research corporation to all 10,035 students who were admitted to the institution for the
Fall 2018 semester, including students who are attending and those who do not enroll.
Using purposive sampling of all accepted students at Marathon University, I focused on
124
four distinct populations, including males who enroll, males who do not enroll, females
who enroll, and females who do not enroll.
Secondary qualitative dataset. A total of 10,035 surveys were administered and
3,208 responses were collected, for an overall response rate of 32%. The survey results
showed that of the 3,208 responses that were collected, 1,474 of the responses were from
students who decided not to enroll at Marathon University, which is 46% of the survey
results. Of the 3,208 students who responded, 1,455 replied to the open-ended survey
questions asked, meaning that 45% of students who responded to the survey filled out the
open-ended questions. Of the 1,455 students who answered the open-ended questions,
599 responses were from students who did not matriculate into the institution, or 41% of
the total students who answered open-ended questions. Out of the entire number of
accepted students to receive the survey, almost 17% of respondents were non-enrolling
students who submitted the open-ended questions. For comparison, College Board (2015)
conducts comparable accepted student questionnaires to their clients in a similar format
and received an average response rate of 50% for students who are enrolling in the
institutions and 12% of students who are not enrolling in the institution. When looking
only at public institutions’ response rates to the survey, 29% of students enrolling and 7%
of students who are not enrolling responded to the questionnaire (College Board, 2015).
For public universities distributing the survey, the response rate was 27% for enrolling
students and 7% for students who choose not to enroll (College Board, 2015). For the
purpose of this study, the main focus was on non-matriculating students at Marathon
University, who had a comparatively high response rate.

125
Instrumentation. An existing accepted student survey at Marathon University
was used for the qualitative phase of analysis. The survey was electronically sent by the
research corporation to all accepted students for the Fall 2018 semester in June and
collected by August. Surveys were e-mailed to the e-mail address that the student used on
their admission application. Survey results were cleaned so names and other identifiable
questions that could be linked to a specific participant were removed. This sampling
design is single stage, as individual accepted students were contacted directly to complete
the survey (Creswell & Plano Clark, 2018).
Survey questions consisted of categorical and continuous scales where questions
included ranking variables from most to least important, multiple choice questions,
continuous questions, closed-ended questions with both ordered and unordered choices,
and open-ended questions (Salant & Dillman, 1994). The survey included questions
about timing of the decision, information sources used by the student, influence of the
institution and influential people, sense of fit, academics and program of study, and
finances and cost. For the purpose of this study, the open-ended questions were the focus
of the qualitative analysis.
Open-ended survey questions given to all accepted students, including both
enrolling and non-enrolling include:
1. In the final analysis, what ultimately led you to choose Marathon University?
(Enrolling students, Open-ended).
2. In the final analysis, what led you to decide not to attend Marathon
University? (Non-enrolling students, Open-ended).
126
Data Analysis
Data analysis in mixed methods research consists of separately analyzing the
quantitative and qualitative data using the appropriate methods, and then integrating the
results together for the final mixed methods analysis (Creswell & Plano Clark, 2018). It is
crucial for a mixed methods researcher to have an understanding of both quantitative and
qualitative approaches before considering the final mixed methods analysis (Teddlie &
Tashakkori, 2009). Different data analysis procedures allow the researcher to “represent,
interpret, and validate the data and results” (Creswell & Plano Clark, 2018, p. 209).
Quantitative secondary data analysis. Quantitative analysis using secondary
institutional data obtained from Marathon University relating to enrollment was
conducted in accordance to concurrent mixed methods analysis, while qualitative analysis
was done simultaneously but separately. Once the raw data were obtained from the
institution, they were inputted into SPSS to execute descriptive statistics and a
multinomial logistic regression. Variables for analysis included academic program, GPA,
SAT score, ethnicity, net cost, and proximity to home.
Descriptive statistics allow a researcher to organize and describe the data
collected in a given population or sample (Frankfort-Nachmias & Leon-Guerrero, 2018).
For this study, continuous descriptive statistics used include the four moments of data,
including the mean, standard deviation, skew, and kurtosis. Categorical descriptive
statistics used were frequency and counts, such as percentages and numbers.
A multinomial logistic regression produced the odds ratios that exist between
male and female students both enrolling and not enrolling at Marathon University in
relation to the key, independent variables. A logistic regression is a type of multiple
127
regression that estimates how multiple independent variables affect one dependent
variable (Frankfort-Nachmias & Leon-Guerrero, 2018). A traditional, binary logistic
regression predicts the probability of a categorical outcome, however, this study used a
multinomial logistic regression that considers one outcome variable with multiple
categories (Field, 2018). In this mixed methods case study, the multinomial approach to
logistic regression was appropriate as there was one outcome variable, the intersection
between gender and enrollment, that consisted of four categories, including females who
enroll, females who do not enroll, males who enroll, and males who do not enroll (Field,
2018). Within this multinomial logistic regression, females who enroll served as the
reference category (Meyers, Gamst & Guarino, 2017).
The conditional logistic regression model was appropriate to use when
considering the college choice framework of this study, since it “exploits extensive
detailed information on alternatives, can account for match-specific details, and allows
for multiple alternatives” (Long, 2004, p. 277). Logistic regression has become a popular
means of statistical analysis in the social sciences and higher education as it is used to
determine an odds ratio of a relationship between a categorical outcome variable and
other predictor variables; however, it does not suggest that the independent variables
cause a particular outcome (Frey, 2018; Peng, Lee, & Ingersoll, 2010). This type of
analysis is appropriate when describing and testing hypotheses about the relationships
between a categorical outcomes variable, including those with multiple categories, and
multiple predictor variables (Meyer et al., 2017; Peng et al., 2010).
Logistic regressions use categorical levels of measurement for the outcome
variable (Frankfort-Nachmias & Leon-Guerrero, 2018). These categories are both

128
exhaustive and mutually exclusive, such as gender, race, or religion, and are not ranked
(Frankfort-Nachmias & Leon-Guerrero, 2018). The intersection between gender and
enrollment served as the dependent variable with categories of the outcome variable
consisting of females who enroll, females who do not enroll, males who enroll, and males
who do not enroll (Meyers et al., 2017). Variables identified throughout the literature
review and my own experiential knowledge in relation to college choice, including
academic program, GPA, SAT score, ethnicity, net cost, and proximity to home, served
as independent variables. Logistic regression first reveals if there is anything significant
between the outcome and predictor variables, and the effect size. If there is significance
and effect size, statistical significance of each predictor will be displayed as an odds ratio.
In addition to showing the odds ratio between variables, logistic regression is also able to
measure associations and predict outcomes (Stoltzfus, 2011).
Qualitative survey analysis. While separately analyzing the quantitative dataset,
qualitative accepted student survey results were concurrently analyzed in accordance to a
concurrent mixed methods study. The survey results were first obtained from the
electronic accepted student survey distributed at Marathon University, then content
analysis was used to reveal the themes that exist, and finally compared with the
quantitative findings from the secondary institutional data.
Content analysis is a qualitative research approach used to interpret meaning from
text data through coding categories (Hsieh & Shannon, 2005; Zhang & Wildemuth,
2009). Three types of content analysis exist, including conventional, directed, and
summative (Hsieh & Shannon, 2005). For the purpose of this study, a directed approach
was used because this approach uses theory and other research findings to guide the

129
initial codes used in the analysis (Hsieh & Shannon, 2005). In this study, the quantitative,
predictive variables served as the initial codes used in the directed content analysis.
Qualitative content analysis allows researchers to classify large amounts of text data into
like categories (Hsieh & Shannon, 2005). This type of analysis enables the researcher to
find the content and contextual meaning of the text data through systemic classification,
coding, and theming processes (Hsieh & Shannon, 2005).
The purpose of directed content analysis is to validate an existing theoretical
framework and research (Hsieh & Shannon, 2005). This structured approach to analysis
uses existing theories and prior research to create initial codes and categories, and then
new codes can be developed when text cannot be categorized with the existing categories
(Hsieh & Shannon, 2005). Researchers using directed content analysis can look at the
frequency and descriptive statistics of existing and new codes to find meaning behind the
qualitative data (Hseih & Shannon, 2005). A limitation to this data analysis includes bias,
as researchers are using predetermined codes that may already support the given theory
(Hsieh & Shannon, 2005). Despite its limitations, directed content analysis is overall
beneficial because it uses existing theory, such as the college choice model and consumer
decision-making model, to frame the analysis.
Zhang & Wildemuth (2009) note eight different steps of content analysis,
including preparing the data, defining the unit of analysis, developing categories and
coding schemes, testing the coding schemes on sample text, coding all text data,
assessing the coding consistency, drawing conclusions from the coded data, and reporting
the findings. I used descriptive coding throughout the content analysis process, using
codes already derived from the college choice and consumer decision-making models, as

130
well as adding new codes and categories as needed during the analysis (Saldaña, 2013).
Descriptive coding essentially considers a topic and uses a noun as a code to produce
different categories throughout the qualitative analysis (Saldaña, 2013). The descriptive
codes were then interpreted based on frequency and descriptive statistics within the
content analysis (Hsieh & Shannon, 2005).
Mixing and Interpretations
The concurrent mixed methods approach has four common variants that have
implications on the process of mixing and interpreting results, including parallel-
databases, data-transformation, questionnaire, and fully integrated variants (Creswell &
Plano Clark, 2018). For the purpose of this study, the parallel-databases variant approach
was used, which is when two simultaneous strands of data are collected and analyzed
separately and then brought together during the interpretation phase (Creswell & Plano
Clark, 2018). The individual quantitative and qualitative results were brought together to
be synthesized, compared, converged, and diverged (Creswell & Plano Clark, 2018).
In this study, I analyzed the findings from the multinomial logistic regression of
the quantitative data analysis and compared it to the codes and themes obtained from the
qualitative, content analysis of accepted student survey results. Analyzing secondary
institutional data, in addition to reviewing the literature and prior research that has been
done in the field in conjunction with researcher experiential knowledge, allowed different
variables of college choice decision-making to emerge from the analysis that were both
similar and different to the variables used in the quantitative phase. I compared the
accepted student survey results to the quantitative findings from the secondary
institutional datasets. I reviewed the survey findings and then coded the qualitative

131
responses from the accepted student survey and compared the findings with the different
variables in the quantitative analysis (Creswell, 2014). The qualitative findings gave
voice to the quantitative institutional data and supported and refuted different variables as
having an impact on why female students are choosing not to enroll at the institution.
Without using and integrating both quantitative and qualitative research approaches, this
study would have lacked the deeper understanding about college choice decision-making
in regards to gender that it was able to achieve.
Although mixed methods research methods have becoming increasingly well
regarded in educational and social science research, a fundamental issue with mixed
methods research is that true integration and mixing may not always occur (Bryman,
2007; Burke Johnson, Onwuegbuzie, & Turner, 2007). It is crucial for researchers to fully
integrate, mix, and combine each stage of their mixed methods study in accordance to the
approach they take (Bryman, 2007). Often, researchers may treat the quantitative and
qualitative analyses as separate domains which detracts from the data and potential of
additional findings (Bryman, 2007). Practical barriers and difficulties can arise when a
researcher fails to fully integrate a mixed methods study, such as lack of intention, time,
or resources (Bryman, 2007).
Mixed Methods Research Validity Measures
Validity in mixed methods research refers to how the researcher is able to address
potential threats and understand the participants’ views and if their perspectives are
represented accurately in both the quantitative and qualitative data analysis (Creswell &
Plano Clark, 2018; Teddlie & Tashakkori, 2009). Validity in mixed methods research
also refers to the legitimacy, quality, and rigor of the study (Creswell & Plano Clark,

132
2018). Validity can impact the way in which the research was conducted, such as the
design of the study and rigor of the procedures done, consistency across the entire study,
and interpretive rigor (Creswell & Plano Clark, 2018). It is also important for a researcher
to consider validity as it relates to the mixed methods approach that is being done
(Creswell & Plano Clark, 2018). In the instance of this study, validity should be
considered as it relates to the concurrent mixed methods approach.
Threats to validity within an concurrent mixed methods study can include failing
to identify the important quantitative results, not elaborating on results that may be
contradictory between the quantitative and qualitative phases, and not connecting the
quantitative and qualitative approaches together (Creswell & Plano Clark, 2018). To
decrease these threats and increase validity, the researcher should consider the many
explanations for the results that occurred, regardless of if they are significant or non-
significant predictors in the data analysis (Creswell & Plano Clark, 2018). The qualitative
questions that are used should be probing and work to either refute or accept the previous
quantitative findings (Creswell & Plano Clark, 2018).
To establish validity within this study, it was imperative that the quantitative and
qualitative samples were both considered and were truly representative of Marathon
University (Teddlie & Tashakkori, 2009). By using secondary institutional data that
included all accepted students at the institution and then narrowed the focus on the
relevant population allowed for the use of a large sample size of accurate data, and
integration of both approaches. The accepted student survey used for the qualitative
analysis was sent to a sample size of all admitted students, thus increasing validity with a
large sample size. Since the survey responses were self-reported, threats to validity could

133
have occurred if the responses were not honest and accurate. Considering outside factors
and other elements that may also impact the relationship between variables was also
important in obtaining validity in this study (Teddlie & Tashakkori, 2009).
Roles of the Researcher
The role of the researcher, their identity, preferred paradigms, and worldview
have an impact on the way in which research is conducted and analyzed (Burke Johnson
et al., 2007). As a result, this study could not have been conducted without considering
my role as the researcher, including my background, experiential knowledge, and
worldview. Without framing this study with my own experiences and perspectives, I
would have been unable to thoroughly review the literature and design a study to explore
the enrollment issue at Marathon University. My direct experiences, knowledge, biases
and assumptions allowed me to create a unique study that is based on my own
background and individual perspective.
My personal background includes working in admissions as an undergraduate
student, formal study of access, choice, and strategic enrollment management as a
graduate student, and professional roles in multiple Admissions Offices. I currently have
over eight years of professional experience in strategic enrollment management, which
has enabled me to discover and understand the female enrollment issue that exists at
Marathon University. My interest and passion in this study are beneficial, given the
longevity of the research. Additionally, my own assumptions regarding the problem stem
from my background and knowledge of college choice and strategic enrollment
management. While being mindful of my own biases and assumptions, my personal
interest and experience with this topic was beneficial to the overall study.

134
I was also mindful of my position as an insider researcher as a strategic
enrollment management professional during this study (Coghlan, 2003). Insider
researchers are members of the organization who work to research from within, as they
know how the organization works but intend to modify certain aspects of it (Coghlan,
2003). Insider researchers are permanent members of the organization and need to be
mindful of their own experiences and relationship to the organization, the duality of their
role as a participant and facilitator, and the political climate (Coghlan, 2003). Because
insider researchers possess certain knowledge prior to engaging in the study, they need to
avoid making assumptions rather than conducting investigations and be open minded to
all findings (Coghlan, 2003). It can be challenging for insider researchers to uphold
relationships with their participants while still maintaining a role as the facilitator.
Finally, insider researchers may experience challenges with politics in the organization in
regards to ethics and power, but successful researchers always remember they are
conducting research with people, rather than on people (Coghlan, 2003). As an insider
researcher within my organization and study, it was crucial to be mindful of the various
challenges and characteristics of the organization that I was studying.
After engaging in reflection and considering the different worldviews and
perspectives as described by Creswell (2014) and Guba & Lincoln (1994), I determined
that I am a pragmatic researcher. Mixed methods researchers are often pragmatic, in that
they look to triangulate the data to increase their understanding of their findings and
focus on the consequences of “real-world” research (Creswell & Plano Clark, 2018). As a
pragmatic researcher, using quantitative and qualitative methods of inquiry allowed me to
gain a robust understanding of the issue at Marathon University from multiple

135
perspectives and methodologies. Pragmatists focus on the questions and choose the best
methodology to find an answer, which is often mixed methods (Teddlie & Tashakkori,
2009). Selecting a mixed methods methodology was the right fit for me as a researcher,
as it satisfied my desire to consider multiple perspectives and put voice to the data
collected, and suited the needs of this study. Pragmatists also focus on their own values
and belief systems, which also accurately describes me as a researcher as I often
considered my own experiential knowledge as a strategic enrollment management
professional in relation to the literature, previous researching, and the findings from this
study (Teddlie & Tashakkori, 2009). This worldview is also problem-centered, which
accurately describes my view as the researcher focusing on the issue of female
enrollment trends at Marathon University (Creswell & Plano Clark, 2018).
Ethical Considerations
It is crucial that a researcher is ethical when conducting quantitative, qualitative,
or mixed methods research. When conducting research, researchers should be respectful
of their research site, use confidentiality when handling sensitive information, disclose
the purpose of the research to participants, and administer data collection procedures with
as little variation as possible (Creswell & Plano Clark, 2018). Procedures should also be
standardized throughout the study, especially if an instrument is administered multiple
times (Creswell & Plano Clark, 2018). When reporting the data and findings, researchers
must also be ethical in the way that their findings are generalized and how the reports are
being presented (Collins, Onwuebbuzie, & Burke Johnson, 2012). For this study, for
example, institutional data analysis does not represent the actual views and decision-
making of the students enrolling at the institution. Although the qualitative approach of
136
analyzing accepted student surveys helped give voice to the quantitative data, it is
possible that the data analysis still misunderstood a student’s actual views and
perspectives. As an ethical researcher, I was mindful not to equate the institutional
dataset to the views and perspectives of the accepted student population.
In order to maintain confidentiality during the mixed methods data analysis,
including quantitative analysis of secondary institutional data and qualitative analysis of
existing survey results, compliance with the institution’s Institutional Review Board was
maintained (IRB) (Teddlie & Tashakkori, 2009). Although data used throughout this
study was secondary and therefore a minimal risk project, all research practices were still
in agreement with the IRB (Teddlie & Tashakkori, 2009). To do so, I went through the
process of gaining IRB approval and used appropriate means to maintain confidentiality
of all participants throughout the study. This included using pseudonyms to protect the
identity of the institution and participants, eliminating identifying characteristics from the
data set before analysis, assigning numerical categories to survey responses, and never
identifying the actual location, name, or other identifiable characteristics that could be
connected to this study. Knowing that case studies provide an in-depth analysis and
understanding of a particular individual or organization, and in the instances of this study,
Marathon University, I was mindful not to generalize my findings to other institutions
(Yin, 2013). Although generalizability can be used for future research, I did not apply the
findings of this case study to abstract theories or models on college choice, as doing so
would have been unethical and lacked validity.
137
Chapter 4
Findings
The purpose of this concurrent mixed methods case study was to identify factors
impacting female enrollment at Marathon University by investigating quantitative data
generated from institutional research and analyzing qualitative, open-ended admitted
student surveys, including both enrolled and non-enrolled student responses, to explore
these results in more detail. A multinomial logistic regression was performed on the
quantitative institutional data about first-time, full-time students at Marathon University
to test college choice decision-making theories and to assess whether certain individual
characteristics influence the decision to attend Marathon University.
The quantitative data student populations included in the secondary institutional
data set for Fall 2018 were first-time, full-time freshmen applicants. Excluded from this
dataset were transfer students, international students, and continuing education students.
There were 14,030 freshmen applications for Fall 2018, including 6,733 acceptances and
2,895 deposited students. In this dataset, 50% of applicants were male and 50% were
female, 50% of acceptances were male and 50% were female, and 58% of deposits were
male and 42% were female. Analyzed in this data set was the student’s academic
program, GPA, SAT score, ethnicity, net cost, and proximity to home.
The qualitative phase included a directed content analysis of accepted student
open-ended survey questions. After data cleaning was performed, survey responses were
analyzed from 289 enrolled females, 271 not enrolled females, 399 enrolled males, and
234 not enrolled males. Participants in both the quantitative and qualitative analysis were
first-time, full-time accepted students at Marathon University for Fall 2018.
138
This chapter provides an overview of the findings resulting from analysis of
quantitative institutional secondary data and qualitative accepted student survey results.
This overview of findings also serves as a transition to Chapters Five and Six, which are
written as manuscripts to be submitted for publication.
Methodological Changes
Quantitative analysis. Quantitative analysis using secondary institutional data
obtained from Marathon University relating to enrollment was conducted in accordance
to concurrent mixed methods analysis, while qualitative analysis was done
simultaneously but separately. Once the raw data were obtained from the institution, they
were inputted into SPSS to execute descriptive statistics and a multinomial logistic
regression. Variables for analysis included academic program, GPA, SAT score,
ethnicity, net cost, and proximity to home.
Descriptive statistics that allow a researcher to organize and describe the data
collected in a given population or sample were used (Frankfort-Nachmias & Leon-
Guerrero, 2018). For this study, continuous descriptive statistics used include the four
moments of data, including the mean, standard deviation, skew, and kurtosis. Categorical
descriptive statistics were also used, including percentages and numbers.
A multinomial logistic regression produced the odds ratios that exist between
male and female students both enrolling and not enrolling at Marathon University in
relation to the key, independent variables. In this mixed methods case study, the
multinomial approach to logistic regression was appropriate as there was one outcome
variable, the intersection between gender and enrollment, that consisted of four
categories, including females who enroll, females who do not enroll, males who enroll,
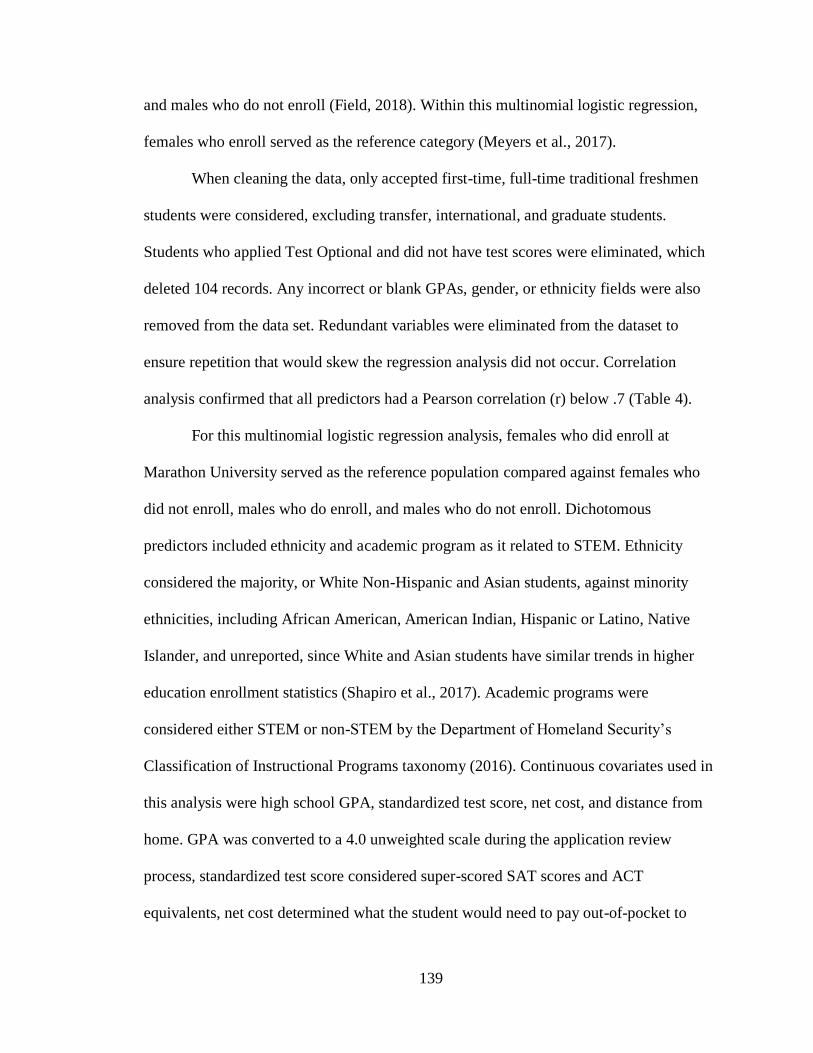
139
and males who do not enroll (Field, 2018). Within this multinomial logistic regression,
females who enroll served as the reference category (Meyers et al., 2017).
When cleaning the data, only accepted first-time, full-time traditional freshmen
students were considered, excluding transfer, international, and graduate students.
Students who applied Test Optional and did not have test scores were eliminated, which
deleted 104 records. Any incorrect or blank GPAs, gender, or ethnicity fields were also
removed from the data set. Redundant variables were eliminated from the dataset to
ensure repetition that would skew the regression analysis did not occur. Correlation
analysis confirmed that all predictors had a Pearson correlation (r) below .7 (Table 4).
For this multinomial logistic regression analysis, females who did enroll at
Marathon University served as the reference population compared against females who
did not enroll, males who do enroll, and males who do not enroll. Dichotomous
predictors included ethnicity and academic program as it related to STEM. Ethnicity
considered the majority, or White Non-Hispanic and Asian students, against minority
ethnicities, including African American, American Indian, Hispanic or Latino, Native
Islander, and unreported, since White and Asian students have similar trends in higher
education enrollment statistics (Shapiro et al., 2017). Academic programs were
considered either STEM or non-STEM by the Department of Homeland Security’s
Classification of Instructional Programs taxonomy (2016). Continuous covariates used in
this analysis were high school GPA, standardized test score, net cost, and distance from
home. GPA was converted to a 4.0 unweighted scale during the application review
process, standardized test score considered super-scored SAT scores and ACT
equivalents, net cost determined what the student would need to pay out-of-pocket to
140
attend the institution after all scholarships and grant were applied, and distance from
home considered how many miles from campus the student resided.
Qualitative analysis. Accepted student survey results were analyzed through
content analysis for the qualitative phase of this study. Open-ended survey responses
were coded with a priori descriptive coding for the first-cycle coding method, and then
additional second cycle coding was implemented through pattern coding. This
methodological change was added during data analysis to create themes and categories
that related to the initial research questions through an a priori coding orientation, since
preexisting categories already existed in the literature (Saldaña, 2016). The second cycle
coding process used pattern coding, as this style is often used to classify and synthesize
first cycle coding and group previous codes together by identifying themes (Saldaña,
2016). Pattern coding condenses large amounts of data into smaller quantities, allows for
clarification of the data, and determines which categories pertained to the research
questions. (Saldaña, 2016). First cycle codes were organized into relevant categories that
were then explained through pattern coding and resulted in theming the data set. These
themes reflected commonalities that were found in the data and helped reduce large
amounts of data into smaller amounts of data (Saldaña, 2016). Commonalities,
differences, and repetitions were found to form these themes in the data (Ryan & Russell
Bernard, 2003).
Additionally, frequencies of second cycle coding were used to analyze the
qualitative accepted student survey results. Frequencies in qualitative analysis can help to
identify repeated words or ideas across participants to help the research develop themes
(Namey, Guest, Thairu, & Johnson, 2008). It should be noted that frequencies are not
141
merely just counting words or themes, and that researchers use frequencies to consider
the amount of times various ideas or themes were considered, rather than just a count of
words (Saldaña, 2016). Using frequencies when looking at the qualitative accepted
student surveys allowed various themes to develop based on specific student population,
including females who enrolled, females who did not enroll, males who enrolled, and
males who did not enroll. In this research analysis, I coded systematically to identify
themes in the survey results, rather than just noting each time a participant mentioned a
variable in their response. As a result, “the number of times a code is applied can be used
as an indication of the salience of a theme or an idea across files, domains, or questions,
depending on the analysis objective” (Namey, Guest, Thairu, & Johnson; p. 143). For this
study, I was able to use the frequencies of the second-cycle codes to determine themes
that existed in the survey results.
Upon completion of both first and second cycle coding, analysis of the data
allowed for the creation of a code map seen in Table 7 (Saldaña, 2016). The code map
presented the categories and themes that existed in the qualitative data after first and
second cycle coding. Anfara, Brown, & Mangione (2002) indicate that code maps allow a
researcher to communicate the findings of their data analysis in a way that is clear and
visually appealing to the reader, and offer an explanation of how the analysis was done.
Code maps also bring “order, structure, and interpretation to the mass of collected data”
(Marshall & Rossman, 1999, p. 150).
Discussion of Findings
After analysis of quantitative institutional data, qualitative accepted student
survey results, and mixed methods analysis of both, the following findings were revealed.
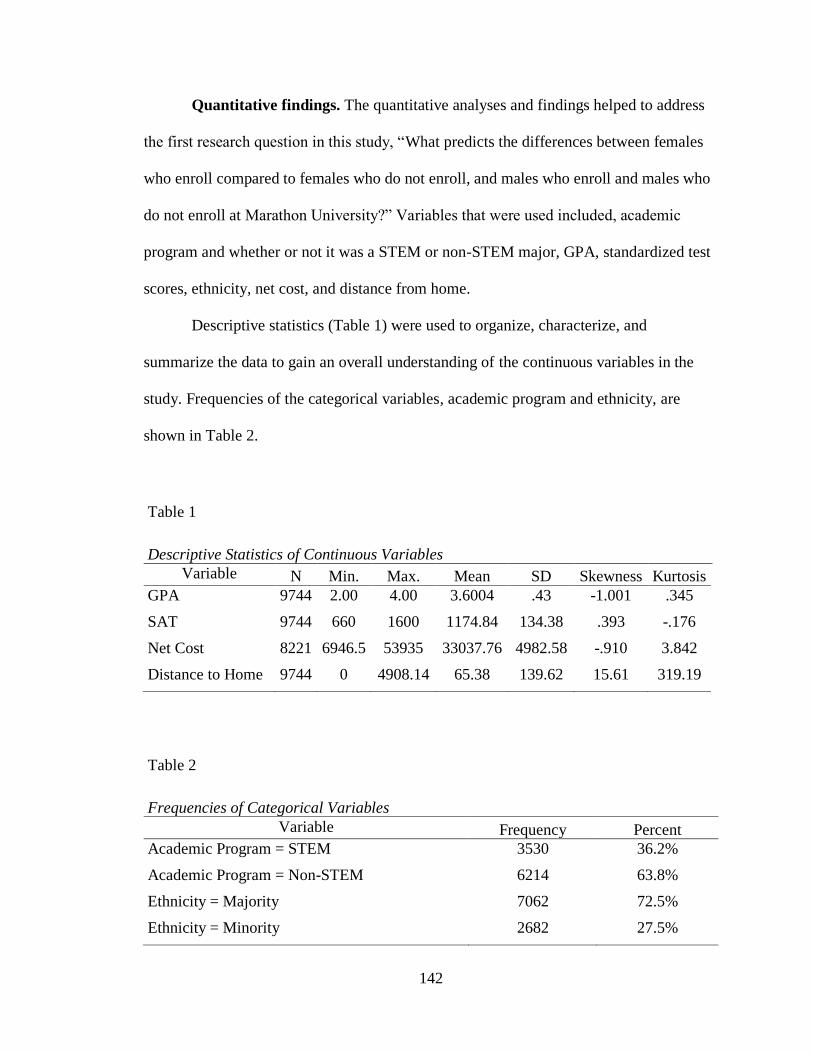
142
Quantitative findings. The quantitative analyses and findings helped to address
the first research question in this study, “What predicts the differences between females
who enroll compared to females who do not enroll, and males who enroll and males who
do not enroll at Marathon University?” Variables that were used included, academic
program and whether or not it was a STEM or non-STEM major, GPA, standardized test
scores, ethnicity, net cost, and distance from home.
Descriptive statistics (Table 1) were used to organize, characterize, and
summarize the data to gain an overall understanding of the continuous variables in the
study. Frequencies of the categorical variables, academic program and ethnicity, are
shown in Table 2.
Table 1
Descriptive Statistics of Continuous Variables
Variable N Min. Max. Mean SD Skewness Kurtosis
GPA 9744 2.00 4.00 3.6004 .43 -1.001 .345
SAT 9744 660 1600 1174.84 134.38 .393 -.176
Net Cost 8221 6946.5 53935 33037.76 4982.58 -.910 3.842
Distance to Home 9744 0 4908.14 65.38 139.62 15.61 319.19
Table 2
Frequencies of Categorical Variables
Variable Frequency Percent
Academic Program = STEM 3530 36.2%
Academic Program = Non-STEM 6214 63.8%
Ethnicity = Majority 7062 72.5%
Ethnicity = Minority 2682 27.5%

143
Mean and standard deviation helped to determine the descriptive statistics as related to
each continuous variable (Table 3). For this multinomial logistic regression, four
populations were represented, females who enrolled, females who did not enroll, makes
who enrolled, and males who did not enroll. Females who enrolled served as the
reference group. Dichotomous variables included the factors academic program and
ethnicity. Continuous variables served as the covariates, which included GPA, SAT, net
cost, and distance to home.
Table 3
Mean and Standard Deviation of Continuous Variables Within Each Population
GPA SAT Net Cost Distance from
Home
Females Enrolled
Mean 3.59 1124.21 30508.39 48.82
SD .43 129.75 7583.26 76.86
Females Not Enrolled
Mean 3.68 1163.33 33817.492 71.41
SD .37 129.28 3336.64 160.25
Males Enrolled
Mean 3.5 1169.78 31297.91 49.61
SD .49 135.17 6730.77 58.053
Males Not Enrolled
Mean 3.56 1202.96 34032.5 70.37
SD .44 134.26 3351.62 152.96
To determine that the predictors being used were not too closely related for the
multinomial logistic regression to run correctly, correlations between predictors were first
considered (Table 4). If the Pearson correlation between two predictors was too closely
related (r > .7), then those variables would essentially discount each other in the analysis.
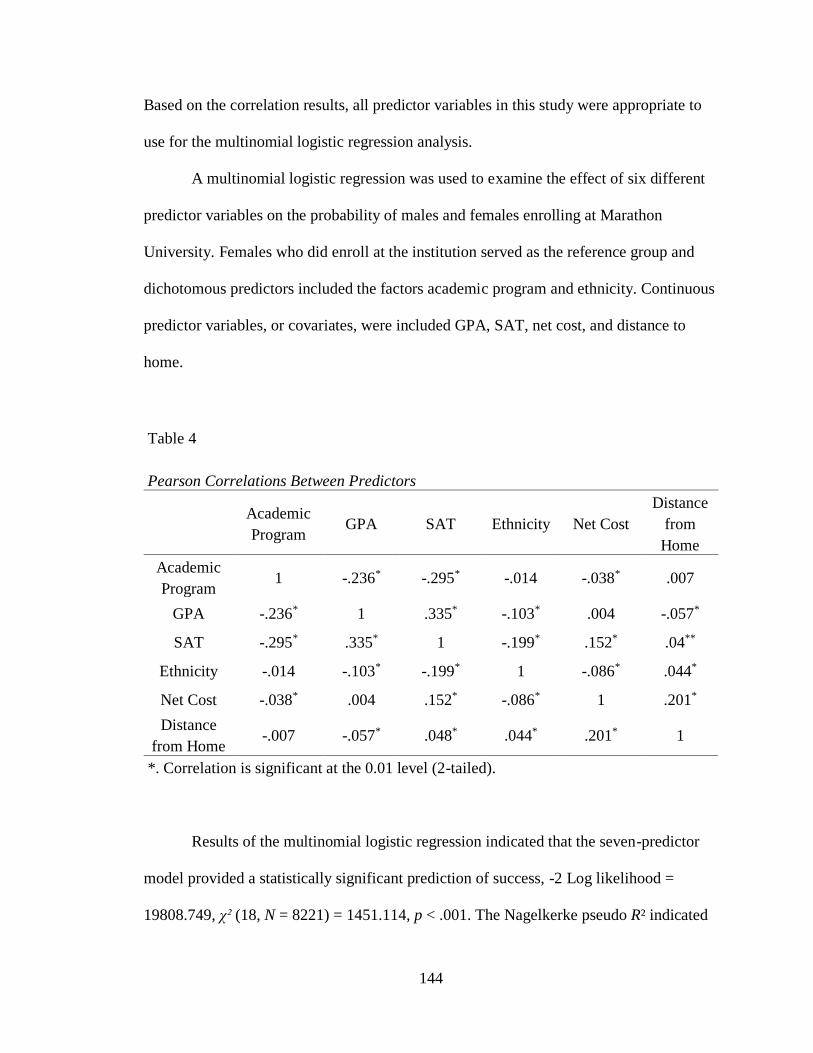
144
Based on the correlation results, all predictor variables in this study were appropriate to
use for the multinomial logistic regression analysis.
A multinomial logistic regression was used to examine the effect of six different
predictor variables on the probability of males and females enrolling at Marathon
University. Females who did enroll at the institution served as the reference group and
dichotomous predictors included the factors academic program and ethnicity. Continuous
predictor variables, or covariates, were included GPA, SAT, net cost, and distance to
home.
Table 4
Pearson Correlations Between Predictors
Academic
Program GPA SAT Ethnicity Net Cost
Distance
from
Home
Academic
Program 1 -.236* -.295* -.014 -.038* .007
GPA -.236* 1 .335* -.103* .004 -.057*
SAT -.295* .335* 1 -.199* .152* .04**
Ethnicity -.014 -.103* -.199* 1 -.086* .044*
Net Cost -.038* .004 .152* -.086* 1 .201*
Distance
from Home -.007 -.057* .048* .044* .201* 1
*. Correlation is significant at the 0.01 level (2-tailed).
Results of the multinomial logistic regression indicated that the seven-predictor
model provided a statistically significant prediction of success, -2 Log likelihood =
19808.749, χ² (18, N = 8221) = 1451.114, p < .001. The Nagelkerke pseudo R² indicated

145
that the model accounted for approximately 49% of the total variance. Prediction success
for the cases used in the development of the model was modest, with an overall
prediction success rate of 46.7% and correct prediction rates of 12.4%, 61.4%, 16.4% and
59.6% for females who enrolled, females who did not enroll, males who enrolled, and
males who did not enroll (Table 5).
Table 5
Classification
Predicted
Observed
1
Females
Enrolled
2
Females Not
Enrolled
3
Males
Enrolled
4
Males Not
Enrolled
Percent
Correct
1 Females Enrolled 127 485 150 262 12.4%
2 Females Not Enrolled 18 1763 54 1038 61.4%
3 Males Enrolled 103 443 237 662 16.4%
4 Males Not Enrolled 8 1099 57 1715 59.6%
Overall Percentage 3.1% 46.1% 6.1% 44.7% 46.7%
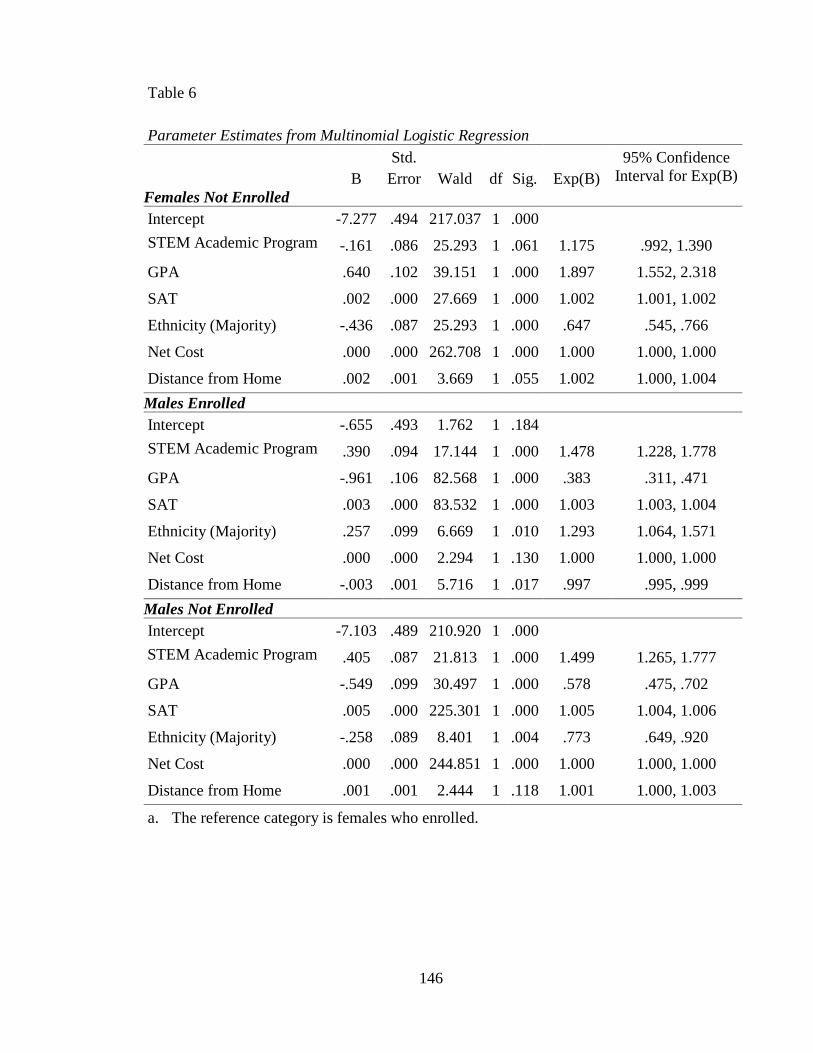
146
Table 6
Parameter Estimates from Multinomial Logistic Regression
B
Std.
Error Wald df Sig. Exp(B)
95% Confidence
Interval for Exp(B)
Females Not Enrolled
Intercept -7.277 .494 217.037 1 .000
STEM Academic Program -.161 .086 25.293 1 .061 1.175 .992, 1.390
GPA .640 .102 39.151 1 .000 1.897 1.552, 2.318
SAT .002 .000 27.669 1 .000 1.002 1.001, 1.002
Ethnicity (Majority) -.436 .087 25.293 1 .000 .647 .545, .766
Net Cost .000 .000 262.708 1 .000 1.000 1.000, 1.000
Distance from Home .002 .001 3.669 1 .055 1.002 1.000, 1.004
Males Enrolled
Intercept -.655 .493 1.762 1 .184
STEM Academic Program .390 .094 17.144 1 .000 1.478 1.228, 1.778
GPA -.961 .106 82.568 1 .000 .383 .311, .471
SAT .003 .000 83.532 1 .000 1.003 1.003, 1.004
Ethnicity (Majority) .257 .099 6.669 1 .010 1.293 1.064, 1.571
Net Cost .000 .000 2.294 1 .130 1.000 1.000, 1.000
Distance from Home -.003 .001 5.716 1 .017 .997 .995, .999
Males Not Enrolled
Intercept -7.103 .489 210.920 1 .000
STEM Academic Program .405 .087 21.813 1 .000 1.499 1.265, 1.777
GPA -.549 .099 30.497 1 .000 .578 .475, .702
SAT .005 .000 225.301 1 .000 1.005 1.004, 1.006
Ethnicity (Majority) -.258 .089 8.401 1 .004 .773 .649, .920
Net Cost .000 .000 244.851 1 .000 1.000 1.000, 1.000
Distance from Home .001 .001 2.444 1 .118 1.001 1.000, 1.003
a. The reference category is females who enrolled.
147
Finding #1: Females who do not enroll are more likely to not enroll based on by
academic program, GPA, and ethnicity compared to females who enroll. The top
portion of Table 6 presents the regression coefficients, the Wald test, the adjusted odds
ratio [Exp(B)], and the 95% confidence intervals (CI) for odds ratios for each predictor
contrasting females who enrolled to females who did not enroll.
Compared to females who enroll, females who do not enroll are 1.9 times as
likely to not enroll at the institution the higher their GPA is. Therefore, as a female
student’s GPA increases, their likelihood of attending Marathon University decreases.
Females who do not enroll at Marathon University are 1.2 times as likely to be enrolled
in a major that is STEM related compared to enrolled females. Females who do not enroll
at Marathon University are also .647 times as likely to not enroll if they are either White
Non-Hispanic or Asian in comparison to females who enroll. Therefore, female students
who do not enroll at Marathon University are more likely to be in the ethnic majority. In
this analysis, the predictor variables SAT, net cost, and distance from home did not
impact the odds of a female who did not enroll compared to females who did enroll at
Marathon University. Therefore, women are more likely to not enroll the higher their
GPA is, if they are in a STEM major, and if they are White Non-Hispanic or Asian.
Finding #2: Applicants who enroll are more likely to be male based on their
academic program, GPA, and ethnicity compared to females who enroll. The middle
portion of Table 6 presents the regression coefficients, the Wald test, the adjusted odds
ratio [Exp(B)], and the 95% confidence intervals (CI) for odds ratios for each predictor
contrasting females who enrolled to males who enrolled.

148
Applicants who enroll are 1.5 times as likely to be male if they have a STEM
related academic major. Additionally, applicants who enroll are .383 times as likely to be
male the higher their GPA is. Those who enroll at Marathon University are 1.3 times
more likely to be male if their ethnicity is in the majority of White Non-Hispanic or
Asian. SAT, net cost, and distance variables did not impact the likelihood of applicants
enrolling at Marathon University, regardless of gender. Therefore, applicants who enroll
at Marathon University are likely to be male if they have a STEM related major, as their
GPA increases, and are White Non-Hispanic or Asian.
Finding #3: Males who do not enroll are more likely to not enroll based on their
academic program, GPA, and ethnicity compared to females who enroll. The bottom
portion of Table 6 presents the regression coefficients, the Wald test, the adjusted odds
ratio [Exp(B)], and the 95% confidence intervals (CI) for odds ratios for each predictor
contrasting females who enrolled to males who did not enroll.
Compared to females who enroll at Marathon University, males who do not enroll
are .578 times are likely to not enroll as their GPA increases. Males who do not enroll are
also 1.5 times as likely to not enroll if their major is STEM related compared to enrolled
females. If a male is applying for a STEM related program, they are more likely not to
attend Marathon University. Males who do not enroll at the institution who are White
Non-Hispanic and Asian are .773 times as likely to not attend the university compared to
females who enroll. Predictor variables of SAT, net cost, and distance do not impact
males who do not enroll at the institution. Therefore, males who do not enroll are more
likely to not attend if they are in a STEM major, have an increased GPA, and are White
Non-Hispanic, compared to females who enroll.

149
Finding #4: Certain variables had similarities across multiple groups, including
academic program, GPA, and ethnicity. Variables that were consistently significant
across all populations included academic program, GPA, and ethnicity. Compared to
females who enrolled, females who did not enroll and males who did not enroll were both
found more likely to not enroll if their major was STEM, as their GPA increased, and if
they were White Non-Hispanic or Asian. Among applicants who did enroll at Marathon
University, they were more likely to be male if their major was STEM, as their GPA
increased, and if they were White Non-Hispanic or Asian.
Variables that were consistently not significant across all populations including
applicants who enrolled and both females and males who did not enroll were SAT score,
net cost, and distance from home. Based on prior research and experiential knowledge of
college choice decision-making, it was surprising to find that there was no significance in
these variables.
Qualitative findings. The qualitative analyses and findings addressed the second
research question, “How do female students make decisions about attending or not
attending Marathon University compared to male students attending and not attending
Marathon University?”
Finding #1: Feelings are most important in college choice decision-making for
women who enroll. Various themes emerged after conducting first and second cycle
coding on the qualitative, accepted student open-ended survey results as seen in the
second iteration of Table 7, including academics, Admissions Office influence, athletics,
campus, campus life, diversity, feeling, future career & goals, influence of others,
location, money, reputation, and visit experience. However, females who enrolled
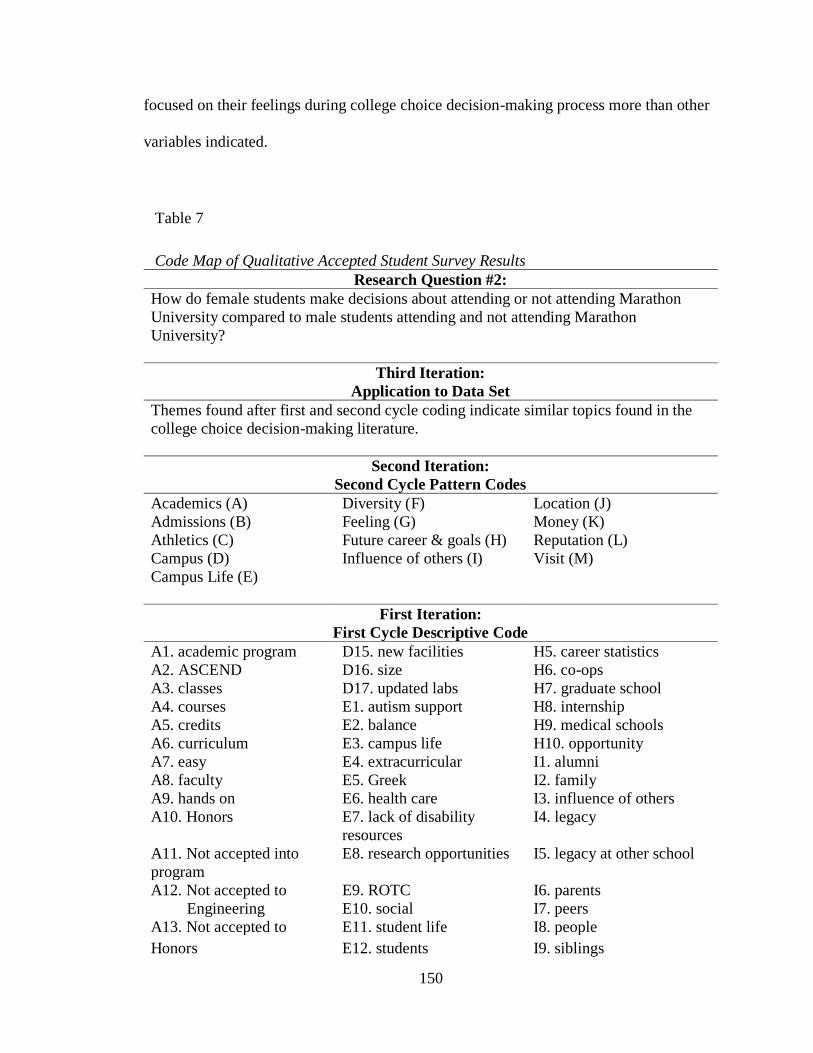
150
focused on their feelings during college choice decision-making process more than other
variables indicated.
Table 7
Code Map of Qualitative Accepted Student Survey Results
Research Question #2:
How do female students make decisions about attending or not attending Marathon
University compared to male students attending and not attending Marathon
University?
Third Iteration:
Application to Data Set
Themes found after first and second cycle coding indicate similar topics found in the
college choice decision-making literature.
Second Iteration:
Second Cycle Pattern Codes
Academics (A)
Admissions (B)
Athletics (C)
Campus (D)
Campus Life (E)
Diversity (F)
Feeling (G)
Future career & goals (H)
Influence of others (I)
Location (J)
Money (K)
Reputation (L)
Visit (M)
First Iteration:
First Cycle Descriptive Code
A1. academic program D15. new facilities H5. career statistics
A2. ASCEND D16. size H6. co-ops
A3. classes D17. updated labs H7. graduate school
A4. courses E1. autism support H8. internship
A5. credits E2. balance H9. medical schools
A6. curriculum E3. campus life H10. opportunity
A7. easy E4. extracurricular I1. alumni
A8. faculty E5. Greek I2. family
A9. hands on E6. health care I3. influence of others
A10. Honors E7. lack of disability
resources
I4. legacy
A11. Not accepted into
program
E8. research opportunities I5. legacy at other school
A12. Not accepted to E9. ROTC I6. parents
Engineering E10. social I7. peers
A13. Not accepted to E11. student life I8. people
Honors E12. students I9. siblings

151
Table 7 (continued)
First Iteration:
First Cycle Descriptive Code
A14. quality education E13. study abroad I10. teachers
A15. research opportunities F1. diversity I11. women in STEM
A16. teaching style F2. inclusive J1. car
A17. Tutoring G1. atmosphere J2. commute
B1. Admissions Counselor G2. better feeling
elsewhere
J3. location
B2. award letter G3. better fit elsewhere J4. proximity to home
B3. communication from
Marathon
G4. comfortable J5. Marathon Boulevard
B4. lack of communication G5. community J6. town
B5. lack of information G6. connection K1. affordable
B6. only acceptance G7. culture K2. cost
B7. Marathon Choice G8. enthusiasm K3. endowments
B8. timing of acceptance G9. environment K4. financial aid
B9. transfer G10. feeling K5. more scholarship
elsewhere
C1. athletics G11. felt cared about K6. price
C2. eSports G12. fit K7. scholarship
C3. not recruited G13. friendly K8. too expensive
D1. atmosphere G14. home K9. value
D2. campus G15. lack of comfort L1. brand
D3. campus G16. lacked personal L2. first choice
D4. campus size connection L3. lack of prestige
D5. campus type G17. not special L4. prestige
D6. class size G18. personalized L5. rankings
D7. clean experience L6. reputation
D8. convenient G19. safe L7. second choice
D9. food G20. sense of belonging M1. camp
D10. growth G21. welcomed M2. Hackathon
D11. housing H1. career goals M3. tour
D12. institutional type H2. career opportunities M4. Visit
D13. lab facility H3. career potential
D14. new buildings H4. career preparation
Note: Based on Anfara et al. (2002) and read from the bottom to the top.
Out of the four student populations analyzed, including females who enrolled,
females who did not enroll, males who enrolled, and males who did not enroll, females
who enrolled uncharacteristically compared to the others favored the feelings they had

152
during the college choice decision-making process to ultimately choose to attend
Marathon University. The second cycle code, feeling, includes first cycle codes like sense
of connection and feeling at home, comfortable, cared about, and special (see Table 8),
and was the most prevalent theme in the population of females who enrolled (Figure 3).
Table 8
Comparison of Populations and Frequency of College Choice Decision-Making Factors
Derived from Second Cycle Pattern Codes.
Females
Enrolled
Frequency
of Code
Females
Not
Enrolled
Frequency
of Code
Males
Enrolled
Frequency
of Code
Males Not
Enrolled
Frequency
of Code
Feeling 174
Money 164
Money 157
Money 110
Academics 151
Academics 100
Academics 153
Academics 68
Money 137
Reputation 71
Location 83
Reputation 53
Influence
of Others
99 Location
62 Influence
of Others
71 Location
50
Location 94
Feeling 33
Campus 64 Influence
of Others
32
Campus 78
Campus 32
Feeling 53
Feeling 31
Reputation 76
Admissions 27
Reputation 50
Admissions 25
Student
Life
69 Influence
of Others
22 Future
Career
Goals
34 Future
Career
Goals
24
Future
Career
Goals
57 Future
Career
Goals
20 Student
Life
25 Campus
20
Visit 29 Student
Life
15 Visit
18 Athletics
16

153
Figure 3. Weighted Word Cloud for Females Enrolled Second-Cycle Pattern Codes.
The other three populations focused on academics and finances as the top two
characteristics that were considered when making their college choice decision (Figures
4, 5, and 6). Women who enrolled valued feeling over academic and financial
considerations as seen in the other student populations, although they were still
considerations when choosing to enroll or not enroll.
Women who enrolled at Marathon University had a strong sense of connection
toward the institution and felt comfortable, safe, and at home, and that their choice was a
good fit. It was important for female applicants to be able to feel a sense of fit and
belonging, as another female who chose to enroll noted, “I felt very comfortable with the
school and could see myself there for the next 4 years at least.”
Female students who enrolled at Marathon University also indicated the feelings
they had while visiting the campus and that it would be home for them. The notion of
being or feeling at home permeated their responses, with a female who enrolled noting, “I
like the feeling of the campus, it’s home. I wanna be successful while being

154
comfortable.” Another woman who chose to enroll stated, “It felt right the first time I
visited, and every time we would come to visit, I would get excited.” Additionally,
female prospective students associated safety with feeling at home. Another female
applicant wrote in the survey:
I choose Marathon University because I feel like I belong. I am very proud to be
accepted by a school that's very high in ratings academically. I also love the
campus and the surrounding town, it is absolutely gorgeous and I would feel very
safe and at home there.
Having a sense of familiarity when walking around campus and associating that feeling
with the notion of being at home was important for women who chose to enroll at
Marathon University.
When discussing these feelings towards the institution, women who enrolled often
expressed their responses more distinctly and earnestly than the other population’s
responses. For example, one female who enrolled responded:
Ultimately I made the decision to attend Marathon University because it was a
perfect fit for me. It is not too far from my home, the programs offered are well
known, and I feel safe and comfortable in Marathon’s environment. Of the
colleges I visited, Marathon easily felt more like home than any of the others, and
it is the only college I did not question feeling like I fit in. I am excited to attend
Marathon and am certain I have made the right decision choosing Marathon
University.
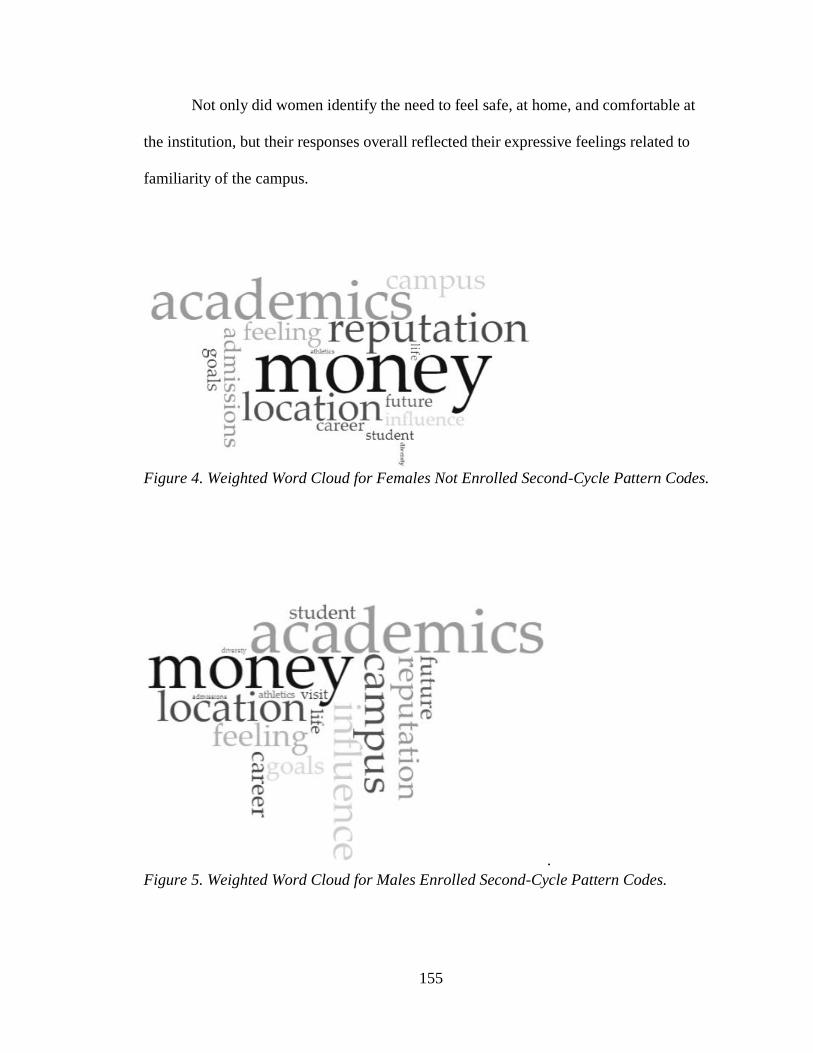
155
Not only did women identify the need to feel safe, at home, and comfortable at
the institution, but their responses overall reflected their expressive feelings related to
familiarity of the campus.
Figure 4. Weighted Word Cloud for Females Not Enrolled Second-Cycle Pattern Codes.
.
Figure 5. Weighted Word Cloud for Males Enrolled Second-Cycle Pattern Codes.
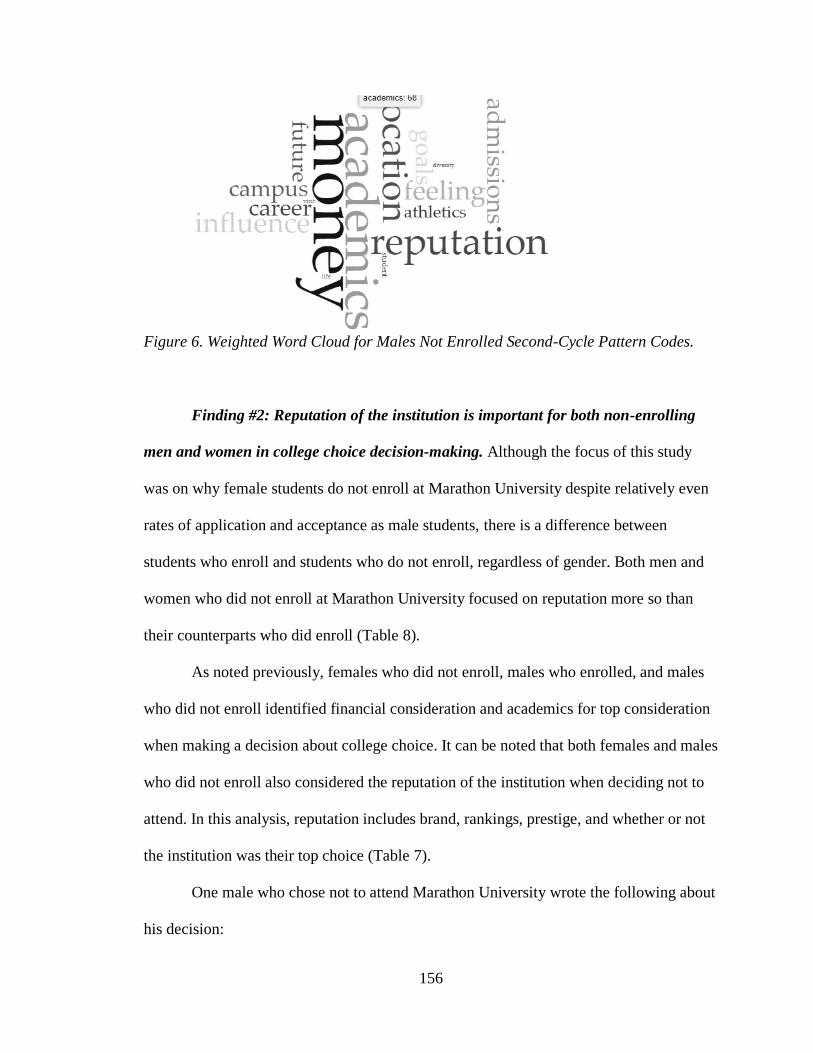
156
Figure 6. Weighted Word Cloud for Males Not Enrolled Second-Cycle Pattern Codes.
Finding #2: Reputation of the institution is important for both non-enrolling
men and women in college choice decision-making. Although the focus of this study
was on why female students do not enroll at Marathon University despite relatively even
rates of application and acceptance as male students, there is a difference between
students who enroll and students who do not enroll, regardless of gender. Both men and
women who did not enroll at Marathon University focused on reputation more so than
their counterparts who did enroll (Table 8).
As noted previously, females who did not enroll, males who enrolled, and males
who did not enroll identified financial consideration and academics for top consideration
when making a decision about college choice. It can be noted that both females and males
who did not enroll also considered the reputation of the institution when deciding not to
attend. In this analysis, reputation includes brand, rankings, prestige, and whether or not
the institution was their top choice (Table 7).
One male who chose not to attend Marathon University wrote the following about
his decision:
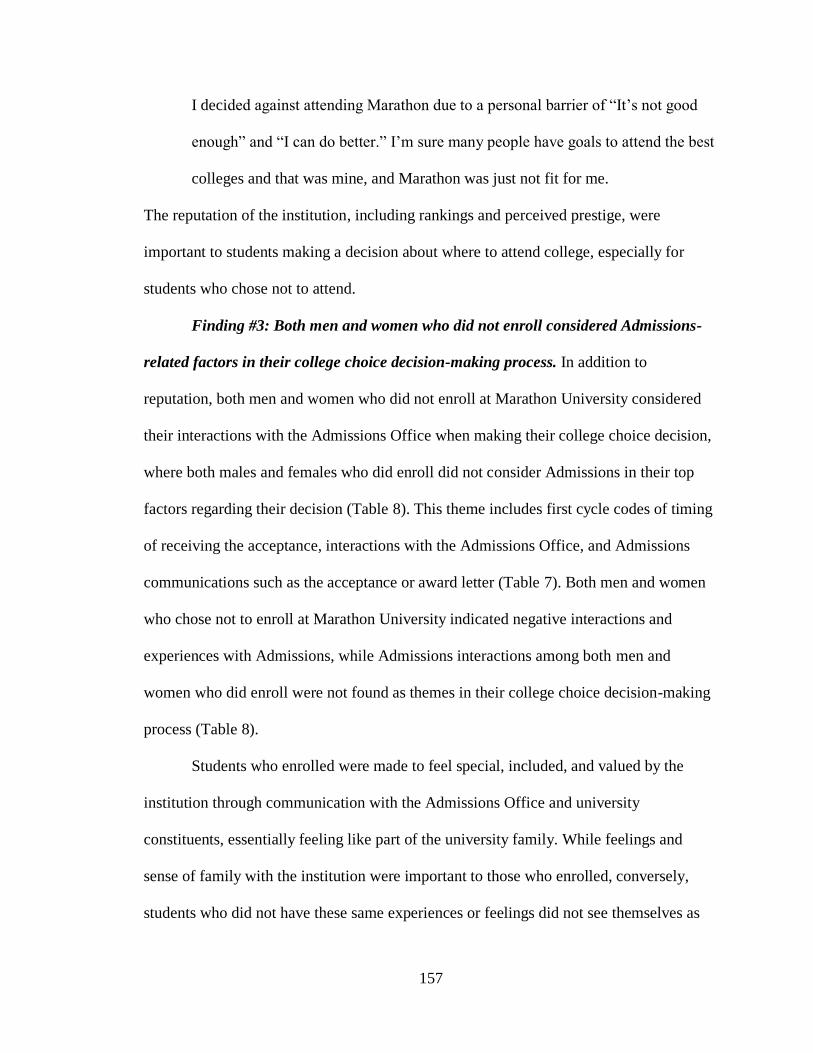
157
I decided against attending Marathon due to a personal barrier of “It’s not good
enough” and “I can do better.” I’m sure many people have goals to attend the best
colleges and that was mine, and Marathon was just not fit for me.
The reputation of the institution, including rankings and perceived prestige, were
important to students making a decision about where to attend college, especially for
students who chose not to attend.
Finding #3: Both men and women who did not enroll considered Admissions-
related factors in their college choice decision-making process. In addition to
reputation, both men and women who did not enroll at Marathon University considered
their interactions with the Admissions Office when making their college choice decision,
where both males and females who did enroll did not consider Admissions in their top
factors regarding their decision (Table 8). This theme includes first cycle codes of timing
of receiving the acceptance, interactions with the Admissions Office, and Admissions
communications such as the acceptance or award letter (Table 7). Both men and women
who chose not to enroll at Marathon University indicated negative interactions and
experiences with Admissions, while Admissions interactions among both men and
women who did enroll were not found as themes in their college choice decision-making
process (Table 8).
Students who enrolled were made to feel special, included, and valued by the
institution through communication with the Admissions Office and university
constituents, essentially feeling like part of the university family. While feelings and
sense of family with the institution were important to those who enrolled, conversely,
students who did not have these same experiences or feelings did not see themselves as
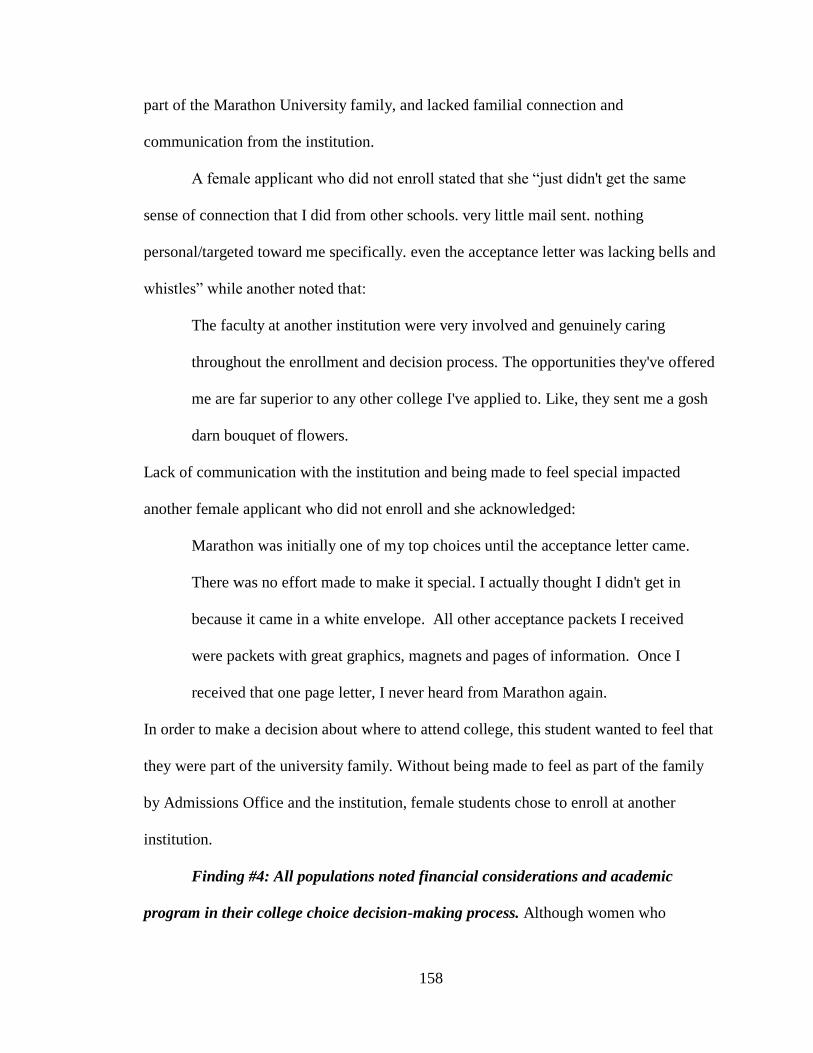
158
part of the Marathon University family, and lacked familial connection and
communication from the institution.
A female applicant who did not enroll stated that she “just didn't get the same
sense of connection that I did from other schools. very little mail sent. nothing
personal/targeted toward me specifically. even the acceptance letter was lacking bells and
whistles” while another noted that:
The faculty at another institution were very involved and genuinely caring
throughout the enrollment and decision process. The opportunities they've offered
me are far superior to any other college I've applied to. Like, they sent me a gosh
darn bouquet of flowers.
Lack of communication with the institution and being made to feel special impacted
another female applicant who did not enroll and she acknowledged:
Marathon was initially one of my top choices until the acceptance letter came.
There was no effort made to make it special. I actually thought I didn't get in
because it came in a white envelope. All other acceptance packets I received
were packets with great graphics, magnets and pages of information. Once I
received that one page letter, I never heard from Marathon again.
In order to make a decision about where to attend college, this student wanted to feel that
they were part of the university family. Without being made to feel as part of the family
by Admissions Office and the institution, female students chose to enroll at another
institution.
Finding #4: All populations noted financial considerations and academic
program in their college choice decision-making process. Although women who
159
enrolled valued their feelings of comfort, home, safety, and sense of belonging the most,
all four populations did indicate that financial considerations, including financial aid,
scholarships, cost, and value, and academic program were important factors when making
a college choice decision about Marathon University (Table 8). Males who enrolled,
females who did not enroll, and males who did not enroll had the most frequency on
academics and finances as important characteristics that were considered when making
their college choice decision (Figures 4, 5, and 6). Women who enrolled valued feelings
over academic and financial considerations as seen in the other student populations,
although they were still considerations when choosing to enroll or not enroll.
Financial consideration and academic program either positively or negatively
impacted student decision-making, respective of if the student enrolled or did not enroll.
Academic program related to the actual major, college, courses, curriculum, classes,
faculty, and research that the institution provided. Financial considerations included any
decision-making that related to the cost of the institution, affordability, financial aid,
scholarships, and value. A female who enrolled noted that the “scholarship awards I have
received from Marathon University make college affordable” and another stated the
university “offered me the most money and were the most affordable out of the other
colleges. The other colleges were too expensive so it came down to just this one.”
Academic considerations were also important in addition to finances, as one female who
enrolled stated, “the major that I wanted was available and attendance is affordable” and
another wrote:
After attending presentations for the Biology department, there were a lot of
things I loved about the program. Particularly, the fact that the professor speaking

160
stressed that there would be more than just studying and trying to pass. Hands-on
learning and field work are very important to the method in which I learn.
Marathon had the perfect fit for this. I was also impressed by the opportunity to
study abroad in the Galapagos Islands.
Females who did not enroll also noted financial and academic variables to be important,
but opposite than how females who did enroll perceived them. Females who did not
enroll found Marathon University to be expensive, not offering competitive scholarships
or financial aid, and unaffordable. Female applicants who did not attend also stated that
their academic program of choice was not offered, was more competitive at another
institution, or not available to them. A female applicant who chose to attend another
institution noted that their school of choice was “more affordable and had the exact
program I wanted” while another stated “Another school had a better program and
Marathon did not offer me enough money.” This notion was seen throughout responses
from females who did not enroll, including:
I loved other schools more. I was offered much more money at higher ranked
schools. The programs at other schools were phenomenal and ranked well. I know
I will be graduating from a school with a great education program and great
reputation with lots of job opportunities and resources to get me hired.
Another female applicant chose not to enroll but stated that Marathon University initially
was her top choice:
I LOVED MARATHON. It was my absolute first choice and I visited and applied
to a lot of schools. It felt like the perfect fit in a way no other school did.
Unfortunately, I didn't receive any financial aid from the university being an out-
161
of-state resident and could not justify incurring that much debt when I had offers
less than half the cost from other schools.
Students who enrolled and did not enroll reported similar responses in regards to
financial consideration and academic program, regardless of gender. Women and men
who enrolled had positive perspectives and experiences with the financial attributes of the
institution and academic program offered, while women and men who did not enroll
noted the opposite.
Integration of Findings
Integrating both the quantitative and qualitative findings helped to address the
third research question in this study, “In what ways do qualitative survey results help to
explain the quantitative institutional data about college choice between male and female
students?” Since this was a mixed methods study, both the qualitative and quantitative
findings supported, complimented, and expanded upon each other.
Quantitative data analysis identified six different variables that impacted college
choice decision-making, including academic program, GPA, SAT score, ethnicity, net
cost, and proximity to home. Most of these variables also emerged in the qualitative
analysis of accepted student survey responses of both female and male students who
enrolled and did not enroll. For example, predictor variables like academic program
impacted the probability to attend or not attend for both men and women during the
quantitative analysis. Qualitative findings supported these quantitative findings, showing
that all four populations valued academics when engaging in a college-choice decision.
Notably, it was also revealed that women who enroll place heavy emphasis on their
feelings throughout the decision-making process, but also still considered academic
162
program heavily in their decision making compared to other variables (Table 8). As a
result, academic program was both a major finding in the quantitative and qualitative
data.
Receiving some type of financial assistance proved to be extremely important in
the decision-making process across all populations in the qualitative analysis, however,
net cost was not significant in the quantitative findings. Research suggests that financial
considerations are paramount to students in making decisions about college, yet the
quantitative findings suggest that other variables are also significant to students in the
college decision-making process in addition to finances. The importance of receiving
financial assistance was noted throughout the open-ended survey results for both men and
women, and the cost and value of attending Marathon University impacted both men and
women who chose to attend or not attend the institution. Although the integration of the
quantitative and qualitative analyses suggest that finances are important, other variables
should also be considered. The finding of the importance of financial considerations is
consistent and supports the notion of marketization in today’s higher education, where
the student is seen as the consumer and often makes a cost-benefit analysis in their
decision-making process.
Academic program was significant in both the quantitative and qualitative
findings as a variable that both men and women considered when choosing to attend or
not attend Marathon University. The prestige, reputation, and availability of the academic
program either influenced students to attend or not attend the institution based on their
perception of the program, either positively or negatively, as seen in the survey results.
When looking at the quantitative findings related to academic program, females were 1.2
163
times as likely and males were 1.5 times as likely to not enroll, compared to females who
enrolled, if their academic program was a STEM related major. Applicants who did
enroll were 1.5 times as likely to be male if their major was STEM. The quantitative
findings support the qualitative data that show how academic program is important in
decision-making, however, the implications of STEM related programs should be
considered. Women and ethnic minorities are still underrepresented in STEM majors and
fields today, and research indicates that being female can serve as a negative predictor
when choosing a STEM major (Moakler & Kim, 2014). Nationwide, women still earn
proportionately less degrees in STEM than men despite receiving the higher percentage
of bachelor degrees overall compared to men (U.S. Department of Education, 2019). In
2015, 58% of bachelor’s degrees were awarded to females and 42% to males, yet only
36% of STEM bachelor’s degrees were awarded to females compared to 64% awarded to
males (U.S. Department of Education, 2019). Blackburn & Heppler (2017) recommend
that higher education institutions focus recruitment efforts on women from STEM
pipeline programs and provide inclusive marketing and recruitment strategies to yield
women in STEM majors. This national data supports the quantitative findings that
students who enroll at Marathon University are 1.5 more likely to be male if they are in a
STEM related major.
Although certain variables like GPA and ethnicity were not mentioned explicitly
by students in their qualitative survey responses and quantitative findings found these to
be significant predictors, it could be argued that a student’s GPA and ethnicity can be
implied to relate to their feelings of home, comfort, and safety on a college campus,
which was extremely significant among females who enrolled at Marathon University.

164
Although ethnicity was not mentioned explicitly by students in the open-ended, accepted
student survey results, it could be argued that ethnicity does closely relate to and impact
the way in which a student feels safe, comfortable, and at home on a college campus.
Students, both men and women, may not have considered their own personal
characteristics and how they impacted their college choice when reflecting on the
elements that led them to choose to attend or not attend Marathon University, but these
underlying characteristics may still factor into their decision-making. The quantitative
data showed that compared to females who do enroll, GPA impacted applicants who
enrolled and females and males who did not enroll, as females are 1.9 times as likely to
not enroll as their GPA increases and males are .58 times as likely to not enroll as their
GPA increases, compared to enrolled females. The GPA variable impacts females who do
not enroll more significantly than males, however, this variable serves as a predictor for
both populations compared to females who do enroll. Sense of belonging on campus and
college choice can relate to a student’s perceived academic self-concept and how they
perceive their academic abilities, which supports the qualitative finding of the feeling of
comfort, belonging, and safety that a student has at the institution (Wilson & Adelson,
2012).
Also within the quantitative findings, ethnicity served as a predictor for both men
and women who chose to attend Marathon University. Again, a limitation to the
qualitative data is that students did not outwardly state how their own identities impacted
their decision-making when articulating what allowed them to choose or not choose to
attend Marathon University, however, research shows that both ethnicity and academic
performance in high school can contribute to a student’s sense of belonging, feeling of

165
home, or safety at an institution (Johnson, 2012). Racial and gender stereotypes can
contribute to a student’s self of belonging, academic self-confidence, and performance,
which could be reflected in the qualitative accepted student survey results about feeling
safe and comfortable on the campus (Johnson, 2012). Not only may sense of belonging
contribute to a student’s decision-making on choosing an institution to attend, but also
impacts their retention and success once they enroll at the institution (Museus, Yi, &
Saelua, 2017). When considering the frequency of college choice decision-making factors
from the pattern codes seen in Table 8 of the qualitative findings, the variable of feeling
is far more significant in applicants who enrolled in the institution than those who did
not. The quantitative findings also indicate that applicants who enrolled are 1.3 more
likely to be male if they are White Non-Hispanic and Asian compared to enrolled
females, which connects the notion that students who are in the ethnic majority felt more
comfortable, safe, and had sense of belonging at Marathon University, a predominantly
White institution, than those who were not.
Based on the literature review about college choice decision-making and personal
and institutional characteristics that impact a student’s decision-making, it was not
surprising that these variables were also present in the qualitative findings. It was notable,
however, that variables that could have been perceived to be more important based on the
qualitative findings did not reflect to be as important based on the quantitative findings.
For example, proximity to home was not a significant predictor of college choice in the
quantitative analysis, but it was recognized by students within the qualitative findings.
Proximity to home had relatively high frequencies of second cycle pattern codes in the
166
qualitative findings compared to other variables, but were not significant in the
quantitative findings (Table 8).
Arguably the most significant finding to this overall study was the impact of
feelings on women who do attend Marathon University. Feelings cannot be quantified,
and feelings of home, safety, and comfort cannot be determined solely by looking at the
quantitative results. The benefit of a mixed methods study is to allow both quantitative
and qualitative data to help explain the social phenomenon that is occurring, and the
qualitative data was able to put voice to the quantitative data that otherwise would have
been missed. This finding is significant because it shows differences between gender and
enrollment, and conveys the importance of sense of feelings when women ultimately
choose the institution they will attend. Their feelings cannot be measured or articulated
through the multinomial logistic regression. The depth of their survey responses and the
description used in their answers cannot be measured through quantitative analysis. This
finding alone shows the importance of the mixed methods survey design, as this major
result would have been lost had this study only focused on quantitative, institutional data.
Conclusion
This chapter presented both quantitative and qualitative findings, and analyzed the
integration of both methodologies together. The quantitative findings determined the
probability of pre-defined variables impacting a student’s college choice decision-
making, while the qualitative findings gave voice to students on why they chose to enroll
or not enroll at Marathon University. Predictor variables like academic program and
ethnicity impacted the probability to attend or not attend for both men and women.
Qualitative findings supported these quantitative findings, showing that all four

167
populations valued academics when engaging in a college-choice decision, but also
revealed that women who enroll place heavy emphasis on their feelings throughout the
decision-making process. Chapters Five and Six will present articles designed for
publication in peer-reviewed journals about strategic enrollment management, access,
and equity in higher education based on the findings from the review of the literature,
data collection and analysis, discussion, and implications of the results.
168
Chapter 5
Finding the Fit: Gender, College Choice, and Consumer Behavior in University
Enrollment
Abstract
While women have generally outpaced men in enrollment in higher education in
the last 40 years, not all institutions reflect this trend. Enrollment strategies rarely take
into consideration factors in the admissions process that could be impacted by gender.
Furthermore, changes in federal and state funding have increasingly led universities to act
in a marketized manner, often leading the institution to position the student as a consumer
in order to sustain operations. When considered in conjunction, the student-consumer and
student gender, new enrollment management practices may emerge that enable the
university to survive and thrive in a new task environment. This qualitative case study
uses secondary data from admitted student surveys to understand how women make
decisions about college-choice at one institution, Marathon University, where men
outnumber women in enrollment despite relatively even rates of application and
acceptance. Findings suggest that women applicants to Marathon University noted
affective factors related to familiarity and family when “finding the fit” during their
undergraduate institution decision-making. They associated these feelings during their
college choice decision-making with the admissions process. By considering these
variables, strategic enrollment management professionals may better understand how
students make decisions about where to attend college, especially women.
More women are going to college, outpacing men in admissions, persistence, and
graduation at institutions across the country. A great deal of research about college choice
has considered the changing gender gap in higher education enrollment, noting shifts in
gender norms, access to higher education, and labor market expectations for women. As a
result, much has been made of a new achievement gap for men, where pundits have
suggested that affirmative action is needed to combat the enrollment gap for men (Mintz,
2019). As of 2018, 56% of first-time, full-time undergraduate students were women and
44% were men (U.S. Department of Education, 2018b). This phenomenon can also be
seen outside of the United States, including Canada, Australia, France, the United
Kingdom, and Italy (Becker, Hubbard, & Murphy, 2010; Evers et al., 2006).
169
The enrollment shift in the past 40 years can be attributed to higher standardized
test scores, higher grades in high school, and increased labor market opportunities for
women (Conger, 2015; 2017; Goldin et al., 2006). Additionally, changing admission
policies (Conger & Dickson, 2017), varying state policies related to appropriations,
tuition costs, and financial aid (Perna & Titus, 2004), and family culture regarding
education have been found to profoundly impact women students, contributing to the rise
in women’s enrollment (Bergerson, Heiselt & Aiken-Wisniewski, 2013) despite historical
barriers that continue to inhibit their access to social, educational, and economic
opportunities (DiPrete & Buchmann, 2013; Jacobs, 1996).
This study sought to understand cases where men are the majority of students
enrolling in higher education, despite equal rates of application and acceptance. The
purpose of this study was to explore the gender reversal at one public, comprehensive,
four-year institution, Marathon University. Understanding the college decision-making
process is crucial for strategic enrollment managers, admissions counselors, higher
education leadership, and policy makers at all institutions, thus the findings reported here
have far-reaching implications for future research, policy, and practice. To this end, we
explored personal student variables and discovered that gender does have implications
when a student is engaged in the college choice decision-making process, impacting the
way in which strategic enrollment management of today should consider consumer and
student decision-making.

170
Background of the Study
In order to gain an understanding of gender2 in enrollment in higher education, it
is important to note the historical context in which it exists. In the past 40 years, the
gender gap relating to enrollment in higher education has reversed, where today more
women than men enroll in higher education each year (Peter & Horn, 2005). From the
start of the 20th century until the early 1970s, men were the dominant gender enrolled in
American colleges and universities, although this changed in the 1980s when women first
outpaced men in enrollment in higher education (U.S. Department of Education, 1995).
This trend still exists today, with women making up 56% of the total incoming
undergraduate students at colleges and universities nationwide (U.S. Department of
Education, 2018b).
To understand how students make decisions about where to attend college,
personal and institutional variables should be considered. Personal factors and student
characteristics include socioeconomic status, academic aptitude, standardized test scores,
gender, ethnicity, proximity to home, and parent’s education level, encouragement, and
support (Baron & Norman, 1992; Bielby et al., 2014; Cosser & du Toit, 2002; Hossler et
al., 1989). Institutional characteristics can be both financial and nonfinancial (Hossler et
al., 1989). Nonfinancial attributes can include location, reputation, quality of academic
programs, and marketing techniques (Hossler et al., 1989). Financial attributes of college
choice include the cost of attendance, scholarships, and financial aid opportunities for
students (Hossler et al., 1989).
2 For the purpose of this study, it should be noted that gender differs from sex in that gender is a social
construction with societal implications while sex is a biological differentiation based on one’s physical
anatomy (Pelletier et al., 2016).
171
Unlike earlier eras in higher education, the past 40 years have marked the
emergence of a new task environment in postsecondary education; one in which it is
common for a student to be considered as a consumer or academic shopper (Bowden &
Wood, 2011; Riesman, 1980; Slaughter & Rhoades, 2005; Tight, 2013; Woodall et al.,
2014). Factors contributing to this evolving consideration include cost-sharing between
the student and the institution, massification of higher education, overall enhancement of
academics and student life experiences, multiculturalism, and increasing competition
amongst institutions to enroll students (Johnstone, 2003; Levin, 2001; Tight, 2013).
Additionally, students as consumers want to receive the best value for their money and
invest their resources in an institution that provides more benefits than cost and
maximizes their utility, therefore contributing to their college choice decision-making
(Nokkala et al., 2012, Teixeira & Dill, 2012; Woodall et al., 2014).
However, current research is inconclusive regarding the impact of gender on
college choice decision-making (Shank & Beasley, 1998). Some studies report that
gender does not have an impact on college choice (Avery & Hoxby, 2004; Cho et al.,
2008; DesJardin et al., 1999; Hossler & Stage, 1992), while others indicate that women
are more inclined to apply to college than men (Weiler, 1994). This study was
specifically designed to explore how gender relates to college choice decision-making
when considering students as consumers.
Theoretical Framework
When investigating how women and men, as consumers, think, evaluate, and act
on their college choice decisions, two frameworks emerged as the most comprehensive:

172
Hossler & Gallagher’s (1987) three stage model of college choice and Blackwell,
Miniard, & Engel’s (2001) consumer decision process model.
College choice model. Although many theories and models about college choice
exist, Hossler & Gallagher’s (1987) is most widely used in regards to college choice, and
each step of the model has been extensively expanded upon and evaluated throughout the
literature. This seminal model of college choice, which includes the stages of
predisposition, search, and choice, serves as the primary college choice model for this
study, with the main focus on the final stage of choice.
The first phase, predisposition, includes a student’s decision to continue onto
college after high school and is often impacted by the student’s socioeconomic status,
parental influence, and peers (Hossler & Gallagher, 1987). In the search phase, students
find information about colleges and universities that will ultimately lead them to make a
choice on where to attend (Hossler & Gallagher, 1987). In this last stage, which served as
the focus of this study, students consider and evaluate their choices, ultimately making a
decision on which college or university to attend (Hossler & Gallagher, 1987; Kim,
2004).
Consumer behavior model. Increasingly, institutions of higher learning are
forced to operate as businesses with the ultimate goal to graduate as many students as
possible at the lowest cost (Kwong, 2000; Marginson, 2010). As a result, it is important
to consider consumer behavior and decision-making in the college choice process. While
many models on consumer behavior exist, the Blackwell et al. (2001) model for
consumer behavior, as it relates to the student as a consumer in the college choice
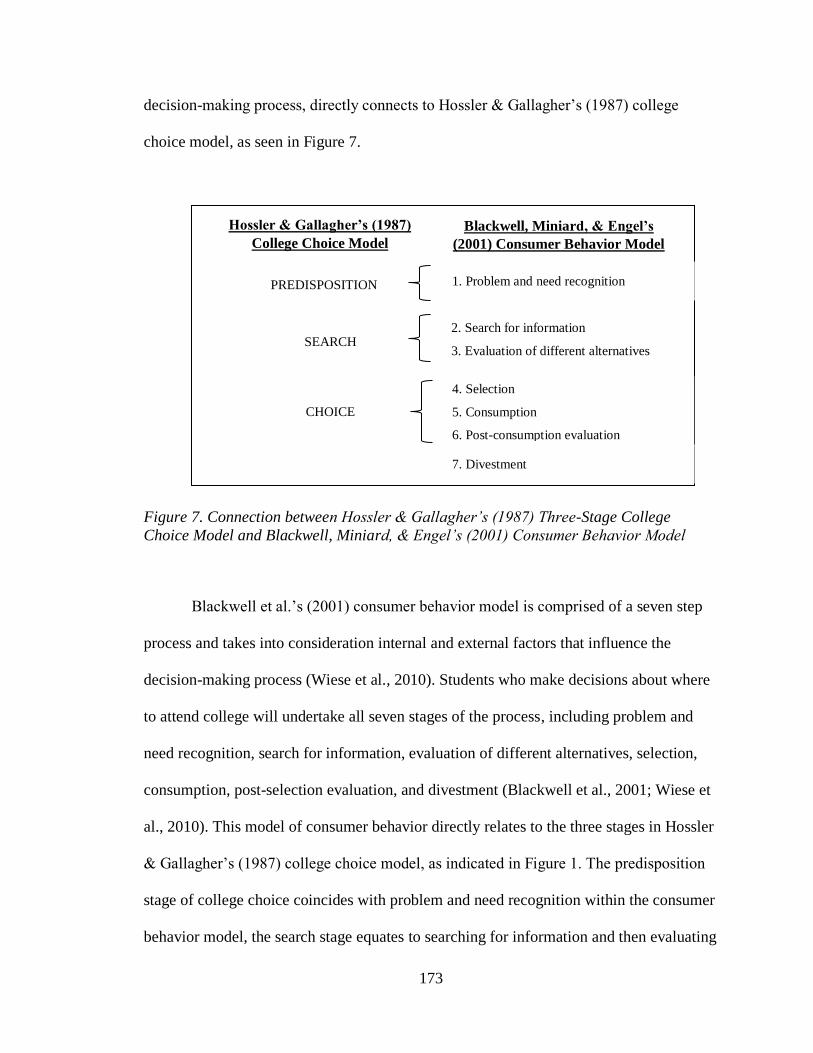
173
decision-making process, directly connects to Hossler & Gallagher’s (1987) college
choice model, as seen in Figure 7.
Figure 7. Connection between Hossler & Gallagher’s (1987) Three-Stage College
Choice Model and Blackwell, Miniard, & Engel’s (2001) Consumer Behavior Model
Blackwell et al.’s (2001) consumer behavior model is comprised of a seven step
process and takes into consideration internal and external factors that influence the
decision-making process (Wiese et al., 2010). Students who make decisions about where
to attend college will undertake all seven stages of the process, including problem and
need recognition, search for information, evaluation of different alternatives, selection,
consumption, post-selection evaluation, and divestment (Blackwell et al., 2001; Wiese et
al., 2010). This model of consumer behavior directly relates to the three stages in Hossler
& Gallagher’s (1987) college choice model, as indicated in Figure 1. The predisposition
stage of college choice coincides with problem and need recognition within the consumer
behavior model, the search stage equates to searching for information and then evaluating
Hossler & Gallagher’s (1987)
College Choice Model
Blackwell, Miniard, & Engel’s
(2001) Consumer Behavior Model
PREDISPOSITION
SEARCH
CHOICE
1. Problem and need recognition
2. Search for information
3. Evaluation of different alternatives
4. Selection
5. Consumption
6. Post-consumption evaluation
7. Divestment

174
their choices, and the final choice stage compares to Blackwell et al.’s (2001) selection,
consumption, and post-consumption evaluation. The only stage in the consumer behavior
model that does not fit directly into the college choice model is divestment, although it
could be argued that divestment occurs when a student graduates from the institution and
chooses to be an active alum, donate to the institution, and stay involved as a graduate
student.
Gender implications of consumer decision-making. Gender implications and
consumer decision-making has long been studied, however, few inquiries on consumer
decision-making refers to college choice explicitly (Palan, 2001). Though often
inconclusive, research finds that men and women do make decisions differently,
including when deciding where to attend college (Wiese et al., 2010).
Although higher education is seen as a service for purchase rather than as a
product, women as consumers tend to spend more time enjoying the process of
“shopping” and researching options, compared to men who tend to make shopping
decisions more quickly (Bakewell & Mitchell, 2003; Hayes, 2018; Moogan et al., 1999).
Men are often seen as more agentic and goal-oriented, while women may be perceived as
socially-oriented and communal (Bakewell & Mitchell, 2006; Iacobucci & Ostrom,
1993). As a result, women are believed to favor relationship formation and are more
susceptible to the relationship marketing approach where a relationship between the
consumer and the organizational brand occurs (Bowden & Wood, 2011; Iacobucci &
Ostrom, 1993). This attribute coincides with research that suggests that women are more
influenced by their parents, value the location, safety, and diversity of a campus, and

175
prefer quality academic programs more than men (Bowden & Wood, 2011; Hanson &
Litten, 1982; Shank & Beasley, 1998; Wiese et al., 2010).
When considering loyalty, trust, satisfaction, and commitment, which are all
elements of successful marketing and brand recognition of an institution, women as
student-consumers gauge their relationships with the brand and institution when making a
college choice decision (Bowden & Wood, 2011). As a result, it can be assumed that
women would tend to focus more on the relationship formation and connection to a
university than men, though men and women both value loyalty (Bowden & Wood,
2011). Increased student satisfaction, trust, loyalty, and commitment to the institution can
result in a student choosing the institution from their final choice set to attend (Bowden &
Wood, 2011). Additional research indicates that, despite women being more inclined to
value relationship formation with an institution, both men and women value creating an
emotional bond, association, and brand consciousness prior to making a decision about
where to attend college, which has implications for institutional marketing and
communication (Bakewell & Mitchell, 2006; Bowden & Wood, 2011).
Methods
This study focused on first-time, full-time students accepted for the Fall 2018
semester at Marathon University, excluding transfer and international students. A case
study approach was used because it allowed for an in-depth analysis of a single
phenomenon that seeks to understand the “why” and “how” of a problem (Yin, 2014). A
qualitative analysis was selected in order to interpret meaning from the open-ended
accepted student survey results, and give voice to the student responses. Using purposive
sampling of all accepted students at Marathon University, four distinct populations were

176
identified: men who enroll, men who do not enroll, women who enroll, and women who
do not enroll. In the findings section, frequency of second-cycle codes are shown that are
critical to understanding the factors that align with gender and enrollment according to
the analysis.
An existing, secondary accepted student survey at Marathon University was used
for this case study’s analysis. This qualitative analysis was part of a larger, concurrent
mixed methods case study that considered the accepted student survey results in addition
to quantitative, secondary institutional data from the same student population of first-
time, full-time admitted students for the Fall 2018 cohort at Marathon University. The
survey was electronically sent to all accepted students for the Fall 2018 semester in June
and collected by August. Surveys were e-mailed to the e-mail address that the student
used on their admission application. Survey results were cleaned so names and other
identifiable questions that could be linked to a specific participant were removed. This
sampling design is single stage, as individual accepted students were contacted directly to
complete the survey (Creswell & Plano Clark, 2018).
The overall survey included questions that consisted of categorical and continuous
scales about timing of the decision, information sources used by the student, influence of
the institution and influential people, sense of fit, academics and program of study, and
finances and cost. For the purpose of this study, the following open-ended questions were
the focus of the qualitative analysis:
1. In the final analysis, what ultimately led you to choose Marathon University?
(Enrolling students).

177
2. In the final analysis, what led you to decide not to attend Marathon
University? (Non-enrolling students).
Secondary qualitative dataset. A total of 10,035 surveys were administered by
an outside firm contracted to the university to accepted first-year freshmen students and
3,208 responses were collected, for an overall response rate of 32%. Of the 3,208
students who responded, 1,455 replied to the open-ended survey questions asked,
meaning that 45% of students who responded to the survey filled out the open-ended
questions. Of the 1,455 students who answered the open-ended questions, 599 responses
were from non-enrolling students and 856 were from enrolling students.
Participants. All accepted first-time, full-time students in Fall 2018 at Marathon
University were included as participants of the accepted student survey. Of this
population, 3,208 accepted students participated in the overall survey with 1,455
answering the open-ended questions being analyzed in this case study.
The scope of this study was limited to only full-time, first-time undergraduates
because this population represents traditional students entering college directly from high
school. Although there is seldom a “traditional” student in higher education today, most
college choice models are based on “traditional” student populations, representing
freshmen students entering higher education directly after graduating from high school
(Paulsen & St. John, 2002).
Data analysis. After survey results were obtained, a content analysis strategy was
employed to uncover findings about college choice decision-making. Content analysis is
a qualitative research approach used to interpret meaning from text data through coding
categories (Hsieh & Shannon, 2005; Zhang & Wildemuth, 2009). Qualitative content

178
analysis allows researchers to classify large amounts of text data into like categories and
to find the contextual meaning of the text data through systemic classification, coding,
and theming processes (Hsieh & Shannon, 2005).
A directed approach was used as theory and other research findings guided the
initial analysis (Hsieh & Shannon, 2005). This structured approach to analysis uses
existing theories and prior research to create a priori codes and categories, and then new
codes can be developed when text cannot be categorized with existing categories (Hsieh
& Shannon, 2005). Researchers using directed content analysis can look at the frequency
and descriptive statistics of codes to find meaning within the qualitative data (Hsieh &
Shannon, 2005).
Open-ended survey responses were coded with a hypothesis coding orientation
using descriptive codes for the first-cycle coding and a second-cycle pattern coding
method based on the theory driving the study. Descriptive coding essentially considers a
topic and uses a noun as a code to produce different categories throughout the qualitative
analysis (Saldaña, 2016). These descriptive codes were derived a priori, since student
variables preexisted from the literature review (Saldaña, 2016). The second cycle coding
process used pattern coding, as this style is often used to classify and synthesize first
cycle coding and group previous codes together by identifying themes (Saldaña, 2016).
Pattern coding condenses large amounts of data into smaller quantities, allows for
clarification of the data, and determines which categories and themes pertained to the
research questions. (Saldaña, 2016). The pattern codes were then interpreted based on
frequency within the content analysis (Hsieh & Shannon, 2005).
179
Findings
Various categories related to college choice emerged after analyzing the accepted
student surveys, including academics, Admissions Office influence, athletics, physical
campus, campus life, diversity, feeling, future career & goals, influence of others,
location, money, reputation, and visit experience. When considering the four populations
that were analyzed, including females who enrolled, females who did not enroll, males
who enrolled, and males who did not enroll, the most important variables to women who
found Marathon University to be the right fit in their college choice decision-making
process were affective in nature (Table 8A). Not only did women who enroll indicate that
their feelings towards the institution were important, but their written survey responses as
they related to their feelings were far more pronounced, robust, and descriptive than
responses related to other factors, or from other populations.
In addition to the feelings that women who attended Marathon University had, it
is also important to note that each population put heavy emphasis on the value of cost and
academic programs that the institution offered. Both men and women who enrolled
indicated that the cost and academics positively influenced their decision, while both
populations that did not enroll demonstrated negative responses to the cost and academic
programs that were available.
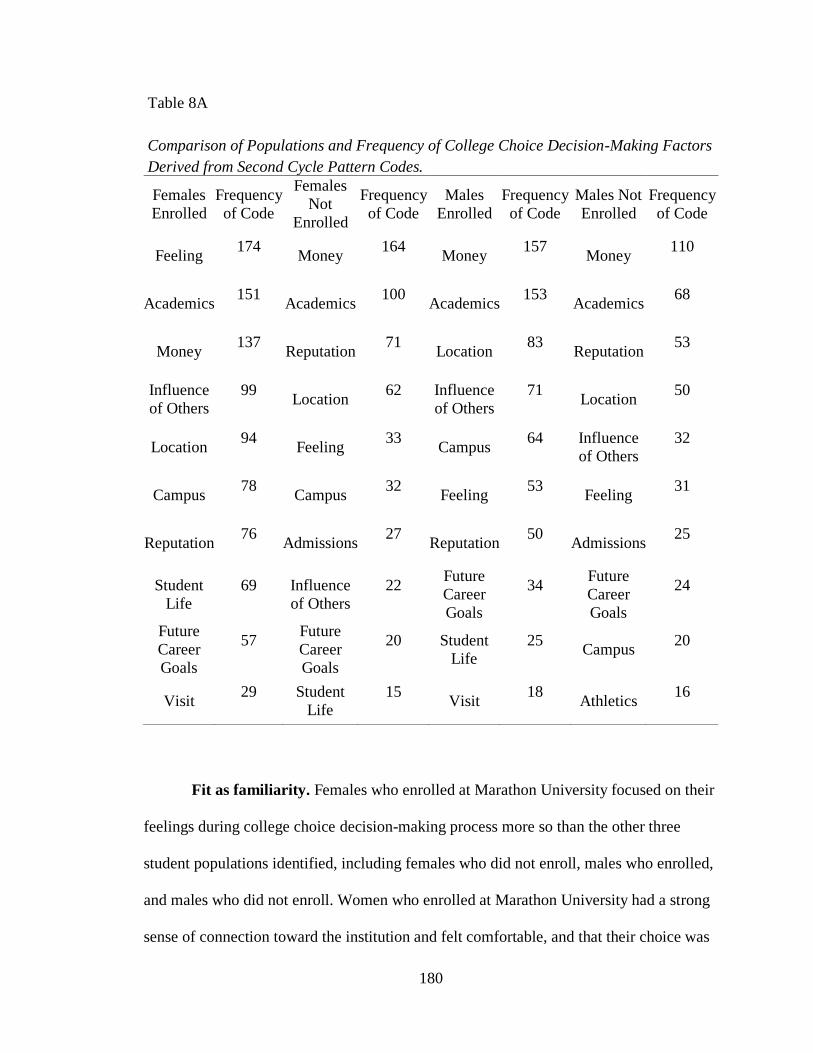
180
Fit as familiarity. Females who enrolled at Marathon University focused on their
feelings during college choice decision-making process more so than the other three
student populations identified, including females who did not enroll, males who enrolled,
and males who did not enroll. Women who enrolled at Marathon University had a strong
sense of connection toward the institution and felt comfortable, and that their choice was
Table 8A
Comparison of Populations and Frequency of College Choice Decision-Making Factors
Derived from Second Cycle Pattern Codes.
Females
Enrolled
Frequency
of Code
Females
Not
Enrolled
Frequency
of Code
Males
Enrolled
Frequency
of Code
Males Not
Enrolled
Frequency
of Code
Feeling 174
Money 164
Money 157
Money 110
Academics 151
Academics 100
Academics 153
Academics 68
Money 137
Reputation 71
Location 83
Reputation 53
Influence
of Others
99 Location
62 Influence
of Others
71 Location
50
Location 94
Feeling 33
Campus 64 Influence
of Others
32
Campus 78
Campus 32
Feeling 53
Feeling 31
Reputation 76
Admissions 27
Reputation 50
Admissions 25
Student
Life
69 Influence
of Others
22 Future
Career
Goals
34 Future
Career
Goals
24
Future
Career
Goals
57 Future
Career
Goals
20 Student
Life
25 Campus
20
Visit 29 Student
Life
15 Visit
18 Athletics
16

181
a good fit. It was important for female applicants to be able to feel a sense of fit and
belonging, as one female who chose to enroll noted, “I felt very comfortable with the
school and could see myself there for the next 4 years at least.” Women who enrolled
valued this feeling over academic and financial considerations as seen in the other student
populations, although they were still considerations when choosing to enroll or not enroll.
Female students who enrolled at Marathon University also indicated the feelings
they had while visiting the campus and that it would be home for them. The notion of
being or feeling at home permeated their responses, with a female who enrolled noting, “I
like the feeling of the campus, it’s home. I wanna be successful while being
comfortable.” Another woman who chose to enroll stated, “It felt right the first time I
visited, and every time we would come to visit, I would get excited.” Additionally,
female prospective students associated safety with feeling at home. One female wrote,
“It’s a safe environment offering many things I am interested in. I am eager to learn here,
make new friends and memories within the next four years!” Another female applicant
wrote in the survey:
I choose Marathon University because I feel like I belong. I am very proud to be
accepted by a school that's very high in ratings academically. I also love the
campus and the surrounding town, it is absolutely gorgeous and I would feel very
safe and at home there. Having a sense of familiarity when walking around
campus and associating that feeling with the notion of being at home was
important for women who chose to enroll at Marathon University.

182
When discussing these feelings towards the institution, women who enrolled often
expressed their responses more descriptively than the other population’s responses. For
example, one female who enrolled responded:
Ultimately I made the decision to attend Marathon University because it was a
perfect fit for me. It is not too far from my home, the programs offered are well
known, and I feel safe and comfortable in Marathon’s environment. Of the
colleges I visited, Marathon easily felt more like home than any of the others, and
it is the only college I did not question feeling like I fit in. I am excited to attend
Marathon and am certain I have made the right decision choosing Marathon
University.
Not only did women identify the need to feel safe, at home, and comfortable at the
institution, but their responses overall reflected their expressive feelings related to
familiarity of the campus.
Fit as family. In addition to their sense of home at the institution, feeling part of
the Marathon University family was crucial for women who decided to attend the
institution. These students were made to feel special, included, and valued by the
institution through communication with the Admissions Office and university
constituents. While feelings and sense of family with the institution were important to
those who enrolled, conversely, students who did not have these same experiences or
feelings did not see themselves as part of the Marathon University family, and lacked
familial connection and communication from the institution.
A female applicant who did not enroll stated that she “just didn't get the same
sense of connection that I did from other schools. very little mail sent. nothing
183
personal/targeted toward me specifically. even the acceptance letter was lacking bells and
whistles.” Similarly, another female applicant noted:
The faculty at another institution were very involved and genuinely caring
throughout the enrollment and decision process. The opportunities they've offered
me are far superior to any other college I've applied to. Like, they sent me a gosh
darn bouquet of flowers.
Lack of communication with the institution and being made to feel special impacted
another female applicant who did not enroll and she acknowledged:
Marathon was initially one of my top choices until the acceptance letter came.
There was no effort made to make it special. I actually thought I didn't get in
because it came in a white envelope. All other acceptance packets I received
were packets with great graphics, magnets and pages of information. Once I
received that one page letter, I never heard from Marathon again.
In order to make a decision about there to attend college, students wanted to feel that they
were part of the university family. Without relationship-building strategies engaged by
the Admissions Office and other institutional stakeholders, female applicants chose to
enroll at other institutions.
Discussion & Recommendations
The findings of this study provide preliminary evidence that college choice
decision-making may be impacted by gender, especially as it relates to the fit, feeling,
sense of home, comfort, and connection to the institution. Not only did applicants who
did and did not enroll at Marathon University indicate different variables that were
important throughout the decision-making process, analysis also showed that female

184
responses tended to be more affective overall compared to males when discussing their
decisions, especially when explaining the sense of connection they had with the
institution.
When considering how students as consumers make decisions in the final stage of
the college choice model (Hossler & Gallagher, 1987), the findings align with Blackwell
et al.’s (2001) stages of selection, consumption, post-consumption evaluation in that
students are finding the need to attend college, searching for information about various
schools, and then considering the different variables and features of each institution
which leads them to their ultimate selection, or choice. The findings also support research
that suggests women are more influenced than men by their parents, location, safety, and
diversity of an academic campus (Bowden & Wood, 2011; Hanson & Litten, 1982;
Shank & Beasley, 1998; Wiese et al., 2010). Most notable, these findings also reinforce
that women value relationship formation when making a decision as a consumer, and
therefore are more susceptible to a make a customer decision when there is a connection
between the themselves and brand (Bowden & Wood, 2011; Iacobucci & Ostrom, 1993).
Recommendations. Professionals in strategic enrollment management should
note the importance of creating personalized communications and forming connections
with incoming students, especially women. This finding is consistent with Bowden &
Wood’s (2011) research on women valuing relationship formation when making
consumer decisions. Admissions counselors, marketing teams, and strategic enrollment
management professionals have the ability to control communication plans and
recruitment efforts with prospective students of both genders. The findings from this
study reinforce how important forming meaningful relationships, being responsive, and

185
making the prospective student feel special is during the college choice process. It is
troublesome to find that a student who considered Marathon University as a top choice
chose not to attend because the institution did not make them feel special, especially
when higher education professionals have the unique opportunity to create a meaningful
and positive college choice decision-making experience for students. Strategic enrollment
mangers need to create personalized and specific communication plans and marketing
efforts that will encourage students, especially women, to form a connection with the
institution.
Strategic enrollment managers and admissions professionals should also consider
the notion of safety as it relates to feelings of comfort, home, and sense of belonging for
female applicants. Female students who are attending Marathon University noted that
feeling at home and comfortable at the campus and surrounding area made them feel safe.
Other research (Mansfield & Warwick, 2006; Shank & Beasley, 1998) has also found
that safety of a college campus is an important variable in college decision-making for
women compared to men, however, strategic enrollment managers often fail to note the
significance when communicating with prospective students, especially women. Strategic
enrollment management and marketing professionals should consider segmenting
populations of students by gender and communicating with them about the variables that
impact their decision-making, such as safety. Providing opportunities for women to feel
at home, comfortable, and safe on-campus before they reach the final stage of the college
choice model may have a significant impact on the decision-making of these students and
should not be ignored by strategic enrollment professionals.
186
Finally, most institutions in higher education conduct accepted student surveys
and collect various types of data on their students. Secondary institutional data and
survey results are typically available at any college and university, and new findings and
conclusions can be made simply by asking different questions of the data. Accepted
student surveys and their methodology could be improved across institutions to provide
students the opportunity to be more specific, subjective, and descriptive when responding
to accepted student surveys. The length of the surveys, the way questions are asked, and
the actual outcome desired should all be considered when creating and distributing
accepted student surveys. Best practices in survey design may assist strategic enrollment
managers to identify why students, both men and women, choose to enroll or not enroll at
their institution.
Conclusion
In conclusion, it is imperative for strategic enrollment managers today to consider
how gender impacts college choice decision-making. Although current research is
limited, this study sought to gain understanding of women as consumers and their
decision-making in higher education. Looking at how students value the notion of
feelings, familiarity, and family with an institution can impact the way in which
institutions make decisions and create strategies around recruitment and marketing
initiatives for both men and women. Whether an institution has majority of female
students enrolling each year, or is an institution that sees the opposite trend, we need to
begin thinking about strategic enrollment management from the perspectives of the
consumer, especially our women students.
187
Chapter 6
Students as Consumers: The Impact of Gender on College Choice Decision-Making
Abstract
As marketization and privatization strategies become commonplace in higher
education, it is essential for institutions to understand how students make decisions about
college choice. Students as consumers of higher education engage in college choice
decision-making that is often impacted by institutional and personal characteristics, such
as cost, location, academic program, ethnicity, and gender. This concurrent, mixed
methods case study investigates college choice and consumer decision-making models to
determine how women make decisions about enrollment at Marathon University, while
considering the current landscape of higher education. Results of the study indicate that
women place significant emphasis on feelings related to fit, safety, and comfort
throughout the college choice process, while academic program, financial considerations
and assistance, and ethnicity influence both men and women. Implications and
recommendations for strategic enrollment management professionals are discussed,
suggesting personalized communication and marketing plans that can be used when
recruiting men and women to their institution.
Keywords
Affective responses, college choice, consumer behavior, decision-making, gender,
marketization
Introduction
Consumerist notions are commonplace in contemporary higher education;
institutions of higher learning operate as businesses where students are the customer and
engage in a cost-benefit analysis to determine the value of the service that the college or
university is providing (Hayes, 2018; Serna & Birnbaum, 2018). Postsecondary
institutions supply this intangible service to their customers, or students, “in exchange for
something of value – a college education and the experiences that accompany that
education (Hayes, 2018, p. 104). The ultimate goal of the institution is then to graduate as

188
many students as possible at the lowest cost, due to decreasing state financing, growing
global competition, and increased spending by institutions to enroll and retain students
(Guilbalt, 2018; Hemsley-Brown & Oplatka, 2014; Hossler, 2018a; Marginson, 2010).
Decreasing federal and state resources force institutions to create means that generate
revenue to help offset the increasing costs of healthcare and salaries for faculty,
improving campus infrastructure, and adjusting enrollment (Hayes, 2018; Hossler, 2018a;
Moogan et al., 1999; Slaughter & Rhodes, 2003). Considering students as consumers is a
“natural consequence” of increasing marketing efforts by higher education institutions
(Cuthbert, 2010, p. 4). This is further exacerbated by “monopsony,” where “there is only
one buyer facing multiple sellers, creating an instance of imperfect competition” (Cooke
& Lang, 2009, p. 626). To condend with this lopsided market, institutions often take a
relationship marketing approach that generates customer loyalty, seeks to provide
excellent customer service experiences, engages in a financial exchange with the student,
and frequently assesses student satisfaction (Cuthbert, 2010; Guilbault, 2018).
Not only are students viewed as consumers by higher education institutions, but
students also make decisions like consumers as it relates to their own college choice
process (Guilbault, 2018; Serna & Birnbaum, 2018; Tight, 2013). If students as
consumers do not receive what they want from an institution, they will simply not enroll
(Hayes, 2018). Students acting as consumers also want to receive the best value for their
money and invest their resources in an institution that provides more benefits than cost
(Nokkala et al., 2012; Teixeira & Dill, 2012; Woodall et al., 2014). As a result, marketing
and advertising efforts are aimed at students to promote a customer relationship

189
management approach during their college choice decision-making process (Guibault,
2018).
When resource dependency and monopsony combine, gone are the days of
viewing the college student as traditional age, White, male (Hittepole, 2015; Paulsen &
St. John, 2002). In the past 40 years, traditional enrollment by gender has reversed and
women now make up 56% of incoming students annually (U.S. Department of Education,
2018a; 2018b). However, not all institutions experience the same enrollment pattern.
Institutions where males are still dominant in enrollment are often military academies,
STEM-related institutions, and faith-based colleges (June & Elias, 2019). Unlike other
institutions that typically see more males enrolling than females, Marathon University is
a four-year, public institution in the northeastern region of the United States where fewer
first-time, full-time, undergraduate female students than male students enroll each year,
despite relatively even rates of application and acceptance. This enrollment pattern
creates an issue in that the gender disparities among students yielding at Marathon
University may have educational, economic, and social justice implications in a time of
marketization. The goal of this mixed methods case study is to understand decision-
making among women at Marathon University and the factors that influence their
enrollment decisions by using secondary, quantitative institutional data and qualitative,
accepted student surveys.
College Choice & Consumer Decision-Making
Both students and institutions alike need to understand how the college choice
decision-making process relates to consumer decision-making. Clearly understanding
how a student makes decisions about where to apply and attend college is crucial for an
190
institution’s success, especially for strategic enrollment professionals in higher education
where there is an increased emphasis on marketization. Considering the gender of a
student may also help to understand their decision-making as a consumer and reveal what
is important to each student and how they make decisions.
The focus of this study is on the final phase of Hossler & Gallagher’s (1987)
college choice model, the stage of choice, and decision-making theories are relevant and
directly relate. Although Hossler & Gallagher (1987) discuss the method that students use
to make an overall college decision, including predisposition, search, and choice, and the
variables that a student considers, previous research fails to consider how students
actually make a decision. Johnson, Stewart, & Eberly’s (1991) quantitative study of
college freshmen at a Midwestern university regarding their college decision-making
process found that “only 10% of the students had made their choice of a college before
their senior year in high school… Approximately 70% made their final choice during
their senior year, and fewer than 20% waited until after high school graduation” to make
their final decision on where to attend college (p. 85-86).
Students use college websites, catalogs and brochures, campus visits and college
fairs, guidance counselors, parents, and their peers to learn about college options and
build their choice set and then select one institution to attend (Avery, 2010; Dolinsky,
2010; Hossler & Gallagher, 1987; Hossler et al., 1999; Park & Hossler, 1989). Dolinsky
(2010) found that the information that a student gathers during the search phase was
overall sufficient to make a choice, however, information from colleges could be tailored
to specific student’s needs and characteristics. The way in which a student perceives the
quality of the institution ultimately impacts the selection they make, and students select
191
an institution that has attributes that the student prefers (Hossler & Gallagher, 1987). The
actual decision-making process that a student uses to make their final selection is often
not discussed in the current literature with the exception of a few studies (Wiese et al.,
2010), and as a result, and understanding of consumer decision-making will be helpful in
understanding the way in which students as customers select their institution in the final
phase of the college choice model.
Strategic enrollment management’s understanding of the student as
consumer. The past 40 years have marked a movement in higher education where it is
common for a student to be considered as a consumer (Bowden & Wood, 2011; Slaughter
& Rhoades, 2005; Tight, 2013; Woodall et al., 2014). College choice cannot be
understood without also taking into consideration how students are considered consumers
and consumer decision-making theories. Finney & Finney (2010) developed the student-
as-customer model in higher education, which posits that institutions use corporate-style
approaches to increase enrollment. Higher education is currently considered a service that
is offered to students as customers (Hayes, 2018; Moogan, Baron, & Harris, 1999;
Ostrom, Bitner, & Burkhard, 2011). From this perspective, “a service lens puts the
customer at the center of improvement and innovation initiatives” and “assumes the
customer is a co-creator of value” (Ostrom et al., 2011, p. 2). In order for the desired
outcome of a service to be achieved, the customer needs to make a commitment to and
contribute to their success, which is true for students in higher education (Guilbault,
2018). Institutions overall, and strategic enrollment professionals in particular, need to
effectively treat students as consumers to order to succeed in the competitive higher
education marketplace.

192
Strategic enrollment managers are encouraged to consider prospective students as
consumers and pay attention to what students actually want, rather than what the
university is able to provide (Cardoso, Rosa, Tavares, & Amaral, 2012). If an institution
considers their students to be clients and consumers, then the institution will need to
incorporate marketing strategies to recruit students during the college choice decision-
making process (Bowden & Wood, 2011; Cardoso et al., 2012; Hayes, 2018; Shank &
Beasley, 1998). These strategies include conducting market research, identifying a target
population and understanding their characteristics, articulating the institution’s brand, and
integrating marketing communications (Hayes, 2018). Although recruitment and
admissions should be the role of the entire institution, viewing students as consumers and
creating marketing and enrollment initiatives on this basis is especially vital for strategic
enrollment managers (Hayes, 2018).
Offices of strategic enrollment management, in addition to postsecondary
institutions overall, are greatly impacted by the privatization and globalization of higher
education (Hossler, 2018b). Strategic enrollment managers are often concerned with
“access, equity, affirmative active, affordability, student debt, and postsecondary
education quality” and use a marketing orientation towards recruitment strategies
(Hossler, 2018b; Hossler & Bontrager, 2018, p. 585). Recruiting and marketing to
students is now used to recover revenue lost from declining state and federal funding, and
strategic enrollment managers are forced to create more creative and strategic ways to
compete for students (Hayes, 2018; Hossler, 2018b). The marketing strategies,
communication plans, and use of market research that universities engage in is similar to
for-profit businesses and corporations (Cooke & Lang, 2008; Hossler, 2018b).

193
It is not uncommon for colleges and universities, specifically strategic enrollment
managers, to engage in market research to identify their student markets and competition,
the image and brand of the institution, and relative market position compared to like
colleges and universities to identify which qualities of the institution lead a student to
enroll (Guilbalt; 2018; Hayes, 2018; Paulsen, 1990). Institutions that understand how a
student makes decisions about their applications and enrollment can enhance the fit
between the students and institution (Wiese et al., 2010). Institutions can use this
information to develop marketing strategies designed to attract sufficient numbers of
students with the desired academic, as well as non-academic, characteristics such as
gender and ethnicity (Wiese et al., 2010). Hayes (2018) notes that institutions are
“challenged to provide a service to its customers – students – in exchange for something
of value – a college education and the experiences that accompany the education” and
that marketing can help the institution determine what students are looking for and gauge
their satisfaction (p. 104). If considering colleges and universities as service institutions,
then the satisfaction of the customer is crucial and institutions must constantly consider
their students as customers and strive to provide an excellent experience for them
(Guilbault, 2018; Hayes, 2018).
Gender and consumer decision-making. Consumer behavior directly relates to
college choice decision-making in this study, and considering the impact of gender3 is
fundamental. Gender implications and consumer decision-making has been researched
3 The terms “gender” and “sex” will both be used throughout this study. Scholars often use the words
interchangeably in research, not only in terms of labels, but also in terms of how each label is then defined.
For the purpose of this study, a distinction between the terms “gender” and “sex” will not be drawn, though
this distinction may be considered important by some scholars (Lorber, 1994). Generally, the term “gender”
will be used when referring to social implications, the phenomenon of decision-making, and discussion of
differences between men and women. Discussion on data collection and analysis will use the term “sex”
when referring to male and female data.
194
over the past 50 years, however, little research on consumer decision-making relates
explicitly to college choice (Palan, 2001). Research that has looked at gender in relation
to college choice is often extremely limited and inconclusive (Broekemier & Seshadri,
1999). Findings suggest that men and women do make decisions differently as
consumers, including college decision-making, and gender differences were evident
when considering personal academic expectations, institutional characteristics that were
important to each gender, and academic program of choice (Broekemier & Seshadri,
1999; Cho et al., 2008; Hao & Burnstead-Bruns, 1998; Hemsley-Brown & Oplatka, 2015;
Stricker et al., 1991; Wiese et al., 2010).
Women as consumers tend to spend more time enjoying the process of shopping
and researching options, compared to men who tend to make shopping decisions more
quickly (Bakewell & Mitchell, 2003; Hayes, 2018; Moogan et al., 1999). Men are often
seen as more agentic and goal oriented, while women are socially oriented and communal
(Bakewell & Mitchell, 2006; Iacobucci & Ostrom, 1993). As a result, women are
believed to favor relationship formation and are more susceptible to the relationship
marketing approach where a relationship between the consumer and the organizational
brand occurs (Bowden & Wood, 2011; Iacobucci & Ostrom, 1993). This attribute
coincides with the tendencies that women are more influenced by their parents, value the
location, safety, and diversity of a campus, and prefer quality academic programs more
than men (Bowden & Wood, 2011; Hanson & Litten, 1982; Shank & Beasley, 1998;
Wiese et al., 2010).
When considering loyalty, trust, satisfaction, and commitment, which are all
elements of successful marketing and brand recognition of an institution, these aspects

195
are especially important to women who gauge their relationships with the brand and
institution when making a college choice decision (Bowden & Wood, 2011). As a result,
women tend to focus more on the relationship formation and connection to a university
than men, though men and women both value loyalty (Bowden & Wood, 2011).
Increased student satisfaction, trust, loyalty, and commitment to the institution can result
in a student choosing the institution from their final choice set to attend (Bowden &
Wood, 2011). Additional research indicates that despite women being more inclined to
value relationship formation with an institution, both men and women do value creating
an emotional bond, association, and brand consciousness prior to making a decision about
where to attend college, which has implications for institutional marketing and
communication styles (Bakewell & Mitchell, 2006; Bowden & Wood, 2011).
Theoretical Framework
When investigating how women and men as consumers, think, evaluate, and act
on their college choice decisions, two frameworks emerged as the most comprehensive:
Hossler & Gallagher’s (1987) three stage model of college choice and Blackwell,
Miniard, & Engel’s (2001) consumer decision process model.
College choice. Although many theories and models about college choice exist,
Hossler & Gallagher’s (1987) is most widely used in regards to college choice, and each
step of the model has been extensively expanded upon and evaluated throughout the
literature. This seminal model of college choice, which includes the stages of
predisposition, search, and choice, serves as the primary college choice model for this
study, with the main focus on the final stage of choice.

196
Hossler & Gallagher’s (1987) Three-Phase Model. Today, Hossler &
Gallagher’s (1987) model is the most popular in regards to college choice (Bergerson,
2009; Iloh, 2018; Park & Hossler, 2014). Hossler & Gallagher’s (1987) model simplified
the steps seen in previous work from Chapman (1981), Jackson (1982), and Hanson &
Litten (1982) and focused on the student rather than the institution throughout the college
decision-making process (Hossler et al., 1999; Hossler et al., 1999; Hossler & Gallagher,
1987; Park & Hossler, 2014).
The first phase, predisposition, includes a student’s decision to continue onto
college after high school and is often impacted by the student’s socioeconomic status,
parental influence, and peers (Hossler & Gallagher, 1987). In the search phase, students
find information about colleges and universities that will ultimately lead them to make a
choice on where to attend (Hossler & Gallagher, 1987). In this last stage, which served as
the focus of this study, students consider and evaluate their choices, ultimately making a
decision on which college or university to attend (Hossler & Gallagher, 1987; Kim,
2004). The strategies that institutions use to attract students including their marketing,
communication plans, and scholarship, culminate within the choice phase (Hossler &
Gallagher, 1987). However, colleges and universities have limited control over this final
phase, as the decision is ultimately up to the student (Hossler & Gallagher, 1987).
Consumer decision-making. Using decision-making models to frame this study
is applicable as it allows college choice, gender implications, and the notion of the
student as a consumer to all intersect. Many decision-making models exist, however,
Blackwell et al.’s (2001) consumer behavior model will remain the focus of this study.

197
Blackwell, Miniard, & Engel’s Consumer Behavior Model (2001). While many
models on consumer behavior exist, the Blackwell et al. (2001) model for consumer
behavior, as it relates to the student as a consumer in the college-making decision
process, directly connects to Hossler & Gallagher’s (1987) college choice model, as seen
in Figure 7A.
Figure 7A: Connection between Hossler & Gallagher’s (1987) Three-Stage College
Choice Model and Blackwell, Miniard, & Engel’s (2001) Consumer Behavior Model
Blackwell et al.’s (2001) consumer behavior model is comprised of a seven step
process and takes into consideration internal and external factors that influence the
decision-making process (Wiese et al., 2010). Students who make decisions about where
to attend college will undertake all seven stages of the process, including problem and
need recognition, search for information, evaluation of different alternatives, selection,
consumption, post-selection evaluation, and divestment (Blackwell et al., 2001; Wiese et
al., 2010). This model of consumer behavior directly relates to the three stages in Hossler
Hossler & Gallagher’s (1987)
College Choice Model
Blackwell, Miniard, & Engel’s
(2001) Consumer Behavior Model
PREDISPOSITION
SEARCH
CHOICE
1. Problem and need recognition
2. Search for information
3. Evaluation of different alternatives
4. Selection
5. Consumption
6. Post-consumption evaluation
7. Divestment

198
& Gallagher’s (1987) college choice model, as indicated in Figure 7A. The predisposition
stage of college choice coincides with problem and need recognition within the consumer
behavior model, the search stage equates to searching for information and then evaluating
their choices, and the final choice stage compares to Blackwell et al.’s (2001) selection,
consumption, and post-consumption evaluation. The only stage in the consumer behavior
model that does not fit directly into the college choice model is divestment, although it
could be argued that divestment occurs when a student graduates from the institution and
chooses to be an active alum, donate to the institution, and stay involved as a graduate
student.
Methodology
This concurrent, mixed methods case study focused on first-time, full-time
students accepted for the Fall 2018 semester at Marathon University, excluding transfer
and international students. This research design included quantitative data analysis of
secondary, institutional data and qualitative data analysis of accepted student survey
results. At the conclusion of both the quantitative and qualitative analyses, interpretations
from both were mixed and analyzed, true to the mixed methods research design.
Quantitative analysis. The following research questions guided the quantitative
analysis of this study: What predicts the differences between females who enroll
compared to females who do not enroll, and males who enroll and males who do not
enroll at Marathon University?
1. Academic program
2. GPA
3. Standardized test scores

199
4. Ethnicity
5. Net cost
6. Distance from home
Secondary institutional data of first-time, full-time applicants to Marathon
University from Fall 2018 was obtained from Marathon University, cleaned, and then
analyzed through a multinomial logistic regression. The multinomial approach to logistic
regression was appropriate as there was one outcome variable, the intersection between
gender and enrollment, that consisted of four categories, including females who enroll,
females who do not enroll, males who enroll, and males who do not enroll (Field, 2018).
Within this multinomial logistic regression, females who enroll served as the reference
category (Meyers et al., 2017). The multinomial logistic regression produced the odds
ratios that exist between male and female students both enrolling and not enrolling at
Marathon University in relation to the key, independent variables. Dichotomous variables
included the factors academic program and ethnicity. Continuous variables served as the
covariates, which included GPA, SAT, net cost, and distance from home.
To determine that the predictors being used were not too closely related for the
multinomial logistic regression to run correctly, correlations between predictors were first
considered (Table 4A). If the Pearson correlation between two predictors was too closely
related (r > .7), then those variables would essentially discount each other in the analysis.
Based on the correlation results, all predictor variables in this study were appropriate to
use for the multinomial logistic regression analysis.
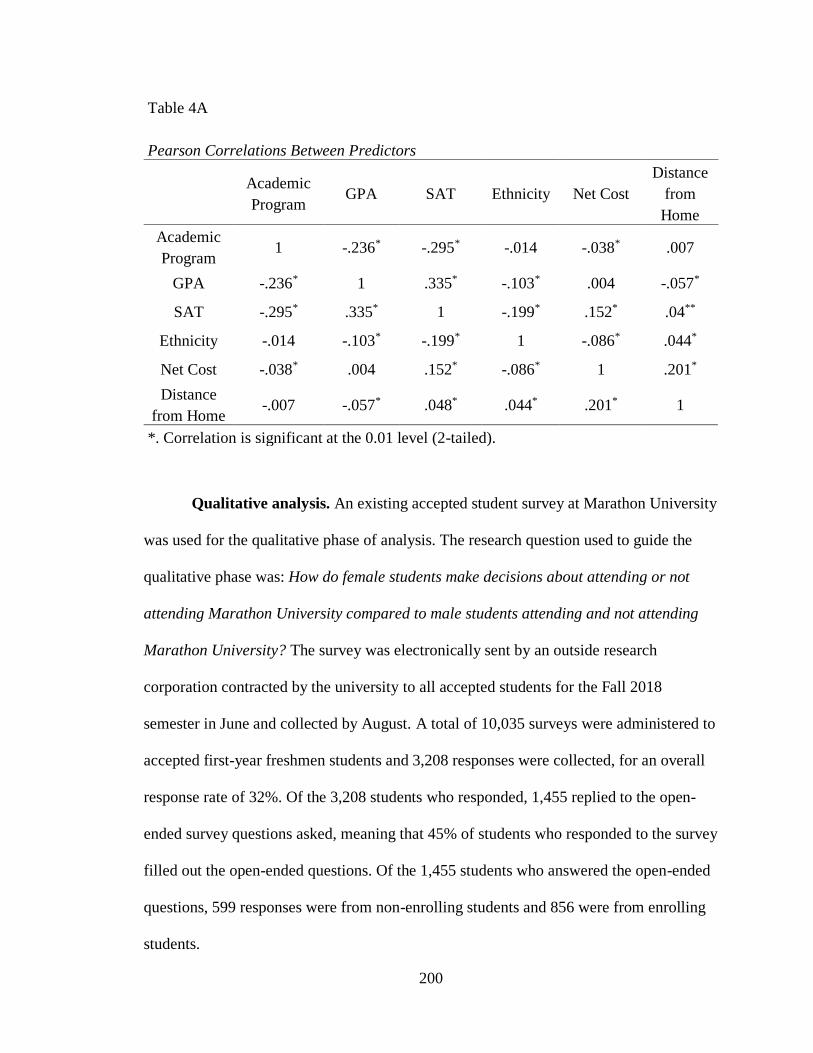
200
Table 4A
Pearson Correlations Between Predictors
Academic
Program GPA SAT Ethnicity Net Cost
Distance
from
Home
Academic
Program 1 -.236* -.295* -.014 -.038* .007
GPA -.236* 1 .335* -.103* .004 -.057*
SAT -.295* .335* 1 -.199* .152* .04**
Ethnicity -.014 -.103* -.199* 1 -.086* .044*
Net Cost -.038* .004 .152* -.086* 1 .201*
Distance
from Home -.007 -.057* .048* .044* .201* 1
*. Correlation is significant at the 0.01 level (2-tailed).
Qualitative analysis. An existing accepted student survey at Marathon University
was used for the qualitative phase of analysis. The research question used to guide the
qualitative phase was: How do female students make decisions about attending or not
attending Marathon University compared to male students attending and not attending
Marathon University? The survey was electronically sent by an outside research
corporation contracted by the university to all accepted students for the Fall 2018
semester in June and collected by August. A total of 10,035 surveys were administered to
accepted first-year freshmen students and 3,208 responses were collected, for an overall
response rate of 32%. Of the 3,208 students who responded, 1,455 replied to the open-
ended survey questions asked, meaning that 45% of students who responded to the survey
filled out the open-ended questions. Of the 1,455 students who answered the open-ended
questions, 599 responses were from non-enrolling students and 856 were from enrolling
students.
201
This study focused on the open-ended survey responses that were given to all
accepted students, including both enrolling and non-enrolling:
1. In the final analysis, what ultimately led you to choose Marathon University?
(Enrolling students, Open-ended).
2. In the final analysis, what led you to decide not to attend Marathon
University? (Non-enrolling students, Open-ended).
The survey results were analyzed through content analysis and coded with a priori
descriptive coding for the first-cycle coding method and pattern coding for the second-
cycle method.
Mixing and interpretations. True to a mixed methods study, the quantitative and
qualitative findings were analyzed together (Creswell & Plano Clark, 2018), guided by
the research question: In what ways do qualitative survey results help to explain the
quantitative institutional data about college choice between male and female students? In
this study, findings from the multinomial logistic regression were analyzed and compared
to the codes obtained from the qualitative, content analysis of accepted student survey
results. Analyzing secondary institutional data, in addition to reviewing previous research
in conjunction with researcher experiential knowledge, allowed different variables of
college choice decision-making to emerge from the analysis that were both similar and
different to the variables used in the quantitative phase. The accepted student survey
results were compared to the quantitative findings from the secondary institutional
datasets. The qualitative findings gave voice to the quantitative institutional data and
offered a more varied perspective on why women are choosing not to enroll at Marathon
University. Without using and integrating both quantitative and qualitative research

202
approaches, this study would have been unable to provide a deep understanding of
college choice decision-making in regards to gender.
Results and Discussion
Results from the mixed methods analysis found both similarities and differences
in how women make decisions about college choice compared to men accepted to
Marathon University. Many predictor variables that were analyzed in the quantitative
phase of analysis were reinforced in the qualitative survey results.
Findings from the quantitative, secondary institutional data. The quantitative
analysis and findings helped to address the first research question in this study, What
predicts the differences between females who enroll compared to females who do not
enroll, and males who enroll and males who do not enroll at Marathon University?
Descriptive statistics of continuous variables (Table 1A) were used to organize,
characterize, and summarize the data to gain an overall understanding of all variables in
the study. Frequencies of the categorical variables, academic program and ethnicity, are
shown in Table 2A. Mean and standard deviation also helped to determine the descriptive
statistics as related to continuous variables (Table 3A).
Results of the multinomial logistic regression indicated that the seven-predictor
model provided a statistically significant prediction of success, -2 Log likelihood =
19808.749, χ² (18, N = 8221) = 1451.114, p < .001. The Nagelkerke pseudo R² indicated
that the model accounted for approximately 49% of the total variance. Prediction success
for the cases used in the development of the model was modest, with an overall
prediction success rate of 46.7% and correct prediction rates of 12.4%, 61.4%, 16.4% and

203
59.6% for females who enrolled, females who did not enroll, males who enrolled, and
males who did not enroll (Table 5A).
Table 1A
Descriptive Statistics of Continuous Variables
Variable N Min. Max. Mean SD Skewness Kurtosis
GPA 9744 2.00 4.00 3.6004 .43 -1.001 .345
SAT 9744 660 1600 1174.84 134.38 .393 -.176
Net Cost 8221 6946.5 53935 33037.76 4982.58 -.910 3.842
Distance to Home 9744 0 4908.14 65.38 139.62 15.61 319.19
Table 2A
Frequencies of Categorical Variables
Variable Frequency Percent
Academic Program = STEM 3530 36.2%
Academic Program = Non-STEM 6214 63.8%
Ethnicity = Majority 7062 72.5%
Ethnicity = Minority 2682 27.5%

204
Table 3A
Mean and Standard Deviation of Continuous Variables Within Each Population
GPA SAT Net Cost Distance from
Home
Females Enrolled
Mean 3.59 1124.21 30508.39 48.82
SD .43 129.75 7583.26 76.86
Females Not Enrolled
Mean 3.68 1163.33 33817.492 71.41
SD .37 129.28 3336.64 160.25
Males Enrolled
Mean 3.5 1169.78 31297.91 49.61
SD .49 135.17 6730.77 58.053
Males Not Enrolled
Mean 3.56 1202.96 34032.5 70.37
SD .44 134.26 3351.62 152.96
Table 5A
Classification
Predicted
Observed
1
Females
Enrolled
2
Females Not
Enrolled
3
Males
Enrolled
4
Males Not
Enrolled
Percent
Correct
1 Females Enrolled 127 485 150 262 12.4%
2 Females Not Enrolled 18 1763 54 1038 61.4%
3 Males Enrolled 103 443 237 662 16.4%
4 Males Not Enrolled 8 1099 57 1715 59.6%
Overall Percentage 3.1% 46.1% 6.1% 44.7% 46.7%

205
Results of predictor variables on each population. Table 6A presents the
regression coefficients, the Wald test, the adjusted odds ratio [Exp(B)], and the 95%
Table 6A
Parameter Estimates from Multinomial Logistic Regression
B
Std.
Error Wald df Sig. Exp(B)
95% Confidence
Interval for Exp(B)
Females Not Enrolled
Intercept -7.277 .494 217.037 1 .000
STEM Academic Program -.161 .086 25.293 1 .061 1.175 .992, 1.390
GPA .640 .102 39.151 1 .000 1.897 1.552, 2.318
SAT .002 .000 27.669 1 .000 1.002 1.001, 1.002
Ethnicity (Majority) -.436 .087 25.293 1 .000 .647 .545, .766
Net Cost .000 .000 262.708 1 .000 1.000 1.000, 1.000
Distance from Home .002 .001 3.669 1 .055 1.002 1.000, 1.004
Males Enrolled
Intercept -.655 .493 1.762 1 .184
STEM Academic Program .390 .094 17.144 1 .000 1.478 1.228, 1.778
GPA -.961 .106 82.568 1 .000 .383 .311, .471
SAT .003 .000 83.532 1 .000 1.003 1.003, 1.004
Ethnicity (Majority) .257 .099 6.669 1 .010 1.293 1.064, 1.571
Net Cost .000 .000 2.294 1 .130 1.000 1.000, 1.000
Distance from Home -.003 .001 5.716 1 .017 .997 .995, .999
Males Not Enrolled
Intercept -7.103 .489 210.920 1 .000
STEM Academic Program .405 .087 21.813 1 .000 1.499 1.265, 1.777
GPA -.549 .099 30.497 1 .000 .578 .475, .702
SAT .005 .000 225.301 1 .000 1.005 1.004, 1.006
Ethnicity (Majority) -.258 .089 8.401 1 .004 .773 .649, .920
Net Cost .000 .000 244.851 1 .000 1.000 1.000, 1.000
Distance from Home .001 .001 2.444 1 .118 1.001 1.000, 1.003
b. The reference category is females who enrolled.
206
confidence intervals (CI) for odds ratios for each predictor contrasting females who
enrolled to females who did not enroll, males who enrolled, and males who did not enroll.
Compared to females who enroll, females who do not enroll are 1.9 times as likely to not
enroll at the institution the higher their GPA is. Therefore, as a female student’s GPA
increases, their likelihood of attending Marathon University decreases. Females who do
not enroll at Marathon University are 1.2 times as likely to be enrolled in a major that is
STEM related, as compared to enrolled females. Females who do not enroll at Marathon
University are also .647 times as likely to not enroll if they are either White Non-
Hispanic or Asian compared to females who enroll. Therefore, female students who do
not enroll at Marathon University are more likely to be in the ethnic majority.
Applicants who enroll are 1.5 times as likely to be male if they have a STEM
related academic major. Additionally, applicants who enroll are .383 times more likely to
be male the higher their GPA is. Those who enroll at Marathon University are 1.3 times
more likely to be male if their ethnicity is in the majority of White Non-Hispanic or
Asian. SAT, net cost, and distance did not impact the likelihood of applicants enrolling at
Marathon University, regardless of gender.
Compared to females who enroll at Marathon University, males who do not enroll
are 1.5 times as likely to not enroll if their major is STEM related. If a male is applying
for a STEM related program, they are more likely not to attend Marathon University.
Males who do not enroll are also .578 times are likely to not enroll as their GPA increases
compared to females who enroll. Males who do not enroll at the institution who are
White Non-Hispanic and Asian are .773 times as likely to not attend the university, in

207
comparison to enrolled female. Predictor variables of SAT, net cost, and distance do not
impact males who do not enroll at the institution.
Results of predictor variables on all populations. Variables that were
consistently significant across all populations included the academic program, GPA, and
ethnicity. Compared to females who enrolled, females who did not enroll and males who
did not enroll were both found more likely to not enroll if their major was STEM, as their
GPA increased, and if they were White Non-Hispanic or Asian. Among applicants who
did enroll at Marathon University, they were more likely to be male if their major was
STEM, as their GPA increased, and if they were White Non-Hispanic or Asian.
Findings from the qualitative, secondary accepted student surveys. The
qualitative analyses and findings helped to address the second research question in this
study: How do female students make decisions about attending or not attending
Marathon University compared to male students attending and not attending Marathon
University? Various factors emerged after conducting first and second cycle coding on
the qualitative, accepted student open-ended survey results, including academics,
Admissions Office influence, athletics, campus, campus life, diversity, feeling, future
career & goals, influence of others, location, money, reputation, and visit experience
(Table 8B).
Feelings. Out of the four student populations analyzed, including females who
enrolled, females who did not enroll, males who enrolled, and males who did not enroll,
females who did not enroll uncharacteristically compared to the other populations
favored the feelings they had during the college choice decision-making process to
ultimately choose to attend Marathon University (Table 8B). Feelings of home, comfort,
208
and safety on a college campus were included, in addition to sense of belonging and
feeling of fit at the institution. One woman who enrolled noted:
I choose Marathon University because I feel like I belong. I am very proud to be
accepted by a school that's very high in ratings academically. I also love the
campus and the surrounding town, it is absolutely gorgeous and I would feel very
safe and at home there.
Another woman stated:
Ultimately I made the decision to attend Marathon University because it was a
perfect fit for me. It is not too far from my home, the programs offered are well
known, and I feel safe and comfortable in Marathon’s environment. Of the
colleges I visited, Marathon easily felt more like home than any of the others, and
it is the only college I did not question feeling like I fit in. I am excited to attend
Marathon and am certain I have made the right decision choosing Marathon
University.
Women who enrolled valued feeling over academic and financial considerations as seen
in the other student populations, although they were still considerations when choosing to
enroll or not enroll.
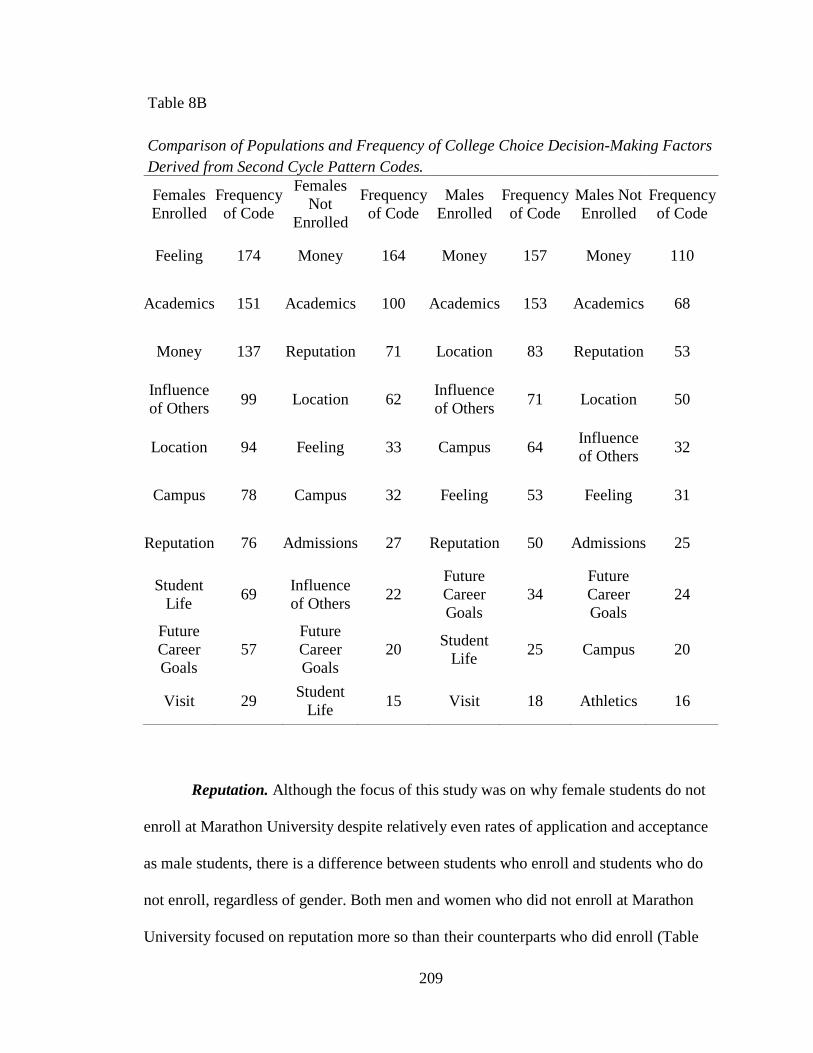
209
Reputation. Although the focus of this study was on why female students do not
enroll at Marathon University despite relatively even rates of application and acceptance
as male students, there is a difference between students who enroll and students who do
not enroll, regardless of gender. Both men and women who did not enroll at Marathon
University focused on reputation more so than their counterparts who did enroll (Table
Table 8B
Comparison of Populations and Frequency of College Choice Decision-Making Factors
Derived from Second Cycle Pattern Codes.
Females
Enrolled
Frequency
of Code
Females
Not
Enrolled
Frequency
of Code
Males
Enrolled
Frequency
of Code
Males Not
Enrolled
Frequency
of Code
Feeling 174 Money 164 Money 157 Money 110
Academics 151 Academics 100 Academics 153 Academics 68
Money 137 Reputation 71 Location 83 Reputation 53
Influence
of Others 99 Location 62
Influence
of Others 71 Location 50
Location 94 Feeling 33 Campus 64 Influence
of Others 32
Campus 78 Campus 32 Feeling 53 Feeling 31
Reputation 76 Admissions 27 Reputation 50 Admissions 25
Student
Life 69
Influence
of Others 22
Future
Career
Goals
34
Future
Career
Goals
24
Future
Career
Goals
57
Future
Career
Goals
20 Student
Life 25 Campus 20
Visit 29 Student
Life 15 Visit 18 Athletics 16

210
8B). One male who chose not to attend Marathon University wrote the following about
his decision:
I decided against attending Marathon due to a personal barrier of “It’s not good
enough” and “I can do better.” I’m sure many people have goals to attend the best
colleges and that was mine, and Marathon was just not fit for me.
The perceived sense of prestige and reputation was notable for both men and women who
chose not to attend Marathon University and students who did not enroll noted this factor
more than those who did enroll when discussion their college choice decision-making.
Interactions with university. In addition to reputation, both men and women who
did not enroll at Marathon University considered their interactions with the Admissions
Office when making their college choice decision, where both men and women who did
enroll did not consider Admissions in their top factors regarding their decision (Table
8B). This characteristic includes first cycle codes of timing of receiving the acceptance,
interactions with the Admissions Office, and Admissions communications such as the
acceptance or award letter. Both men and women who chose not to enroll at Marathon
University indicated negative interactions and experiences with Admissions, while
Admissions interactions among students who enrolled were not found as factors in their
college choice decision-making process (Table 8B). A female applicant who did not
enroll at Marathon University stated that she “just didn't get the same sense of connection
that I did from other schools. very little mail sent. nothing personal/targeted toward me
specifically. even the acceptance letter was lacking bells and whistles.”
Students who enrolled were made to feel special, included, and valued by the
institution through communication with the Admissions Office and university
211
constituents, essentially feeling like part of the university family. While feelings and
sense of family with the institution were important to those who enrolled, conversely,
students who did not have these same experiences or feelings did not see themselves as
part of the Marathon University family, and lacked familial connection and
communication from the institution. In accordance to this characteristic, one female
applicant who did not enroll acknowledged that:
Marathon was initially one of my top choices until the acceptance letter came.
There was no effort made to make it special. I actually thought I didn't get in
because it came in a white envelope. All other acceptance packets I received
were packets with great graphics, magnets and pages of information. Once I
received that one page letter, I never heard from Marathon again.
The feeling of being part of the university family and timely, positive communication
with the university and Admissions Office were notable for students who chose to enroll
at Marathon University, including both men and women.
Academics & financial considerations. Although women who enrolled valued
their feelings of comfort, home, safety, and sense of belonging the most, all four
populations did indicate that financial considerations, including financial aid,
scholarships, cost, and value, and academic program were important factors when making
a college choice decision about Marathon University (Table 8B). A female applicant who
chose to attend another institution noted that their school of choice was “more affordable
and had the exact program I wanted” while another stated “Another school had a better
program and Marathon did not offer me enough money.” Males who enrolled, females
who did not enroll, and males who did not enroll focused on academics and finances as
212
important characteristics that were considered when making their college choice decision.
Women who enrolled valued feelings over academic and financial considerations as seen
in the other student populations, although they were still considerations when choosing to
enroll or not enroll.
Integration of quantitative & qualitative analyses: Discussion. Integrating
both the quantitative and qualitative findings helped to address the third research question
in this study, In what ways do qualitative survey results help to explain the quantitative
institutional data about college choice between male and female students? Since this was
a mixed methods study, both the qualitative and quantitative findings supported,
complimented, and expanded upon each other to provide a deeper understanding of the
findings.
Most of the six predictor variables used in the quantitative analysis also emerged
in the qualitative analysis of accepted student survey responses of both female and male
students who enrolled and did not enroll. For example, academic program was a predictor
variable that impacted the probability to attend or not attend for both men and women
during the quantitative analysis. Qualitative findings supported these quantitative
findings, showing that all four populations valued academics when engaging in a college
choice decision. Gender differences in academic major selected in college are often
evident, as academic majors in engineering, computers, mathematics, and statistics are
comprised of mostly men, compared to women making up the majority of students in
academic programs like education, psychology, literature, humanities, and languages
(Iceland, 2014; Stricker et al., 1991). Academic program selection also impacts the

213
careers and earning potential for both men and women once they graduate (Iceland,
2014).
Academic program. Academic program was significant in both the quantitative
and qualitative findings as a variable that both men and women considered when
choosing to attend or not attend Marathon University. The prestige, reputation, and
availability of the academic program either influenced students to attend or not attend the
institution based on their perception of the program, either positively or negatively, as
seen in the survey results. When looking at the quantitative findings related to academic
program, females were 1.2 times as likely and males were 1.5 times as likely to not enroll
compared to females who enrolled if their academic program was a STEM related major.
Applicants who did enroll were 1.5 times as likely to be male if their major was STEM.
The quantitative findings support the qualitative data that show how academic program is
important in decision-making, however, the implications of STEM related programs
should be considered. Women and ethnic minorities are still underrepresented in STEM
majors and fields today, and research indicates that being female can serve as a negative
predictor when choosing a STEM major (Moakler & Kim, 2014). Nationwide, women
still earn proportionately less degrees in STEM than men despite receiving the higher
percentage of bachelor degrees overall compared to men (U.S. Department of Education,
2019). In 2015, 58% of bachelor’s degrees were awarded to females and 42% to males,
yet only 36% of STEM bachelor’s degrees were awarded to females compared to 64%
awarded to males (U.S. Department of Education, 2019). Blackburn & Heppler (2017)
recommend that higher education institutions focus recruitment efforts on women from
STEM pipeline programs and provide inclusive marketing and recruitment strategies to
214
yield women in STEM majors. This national data supports the quantitative findings that
students who enroll at Marathon University are 1.5 times as likely to be male if they are
in a STEM related major.
Feelings of sense of belonging and home. Although certain variables like GPA
and ethnicity were not mentioned explicitly by students in their qualitative survey
responses, quantitative analysis found these to be significant predictors. It could be
argued that a student’s GPA and ethnicity can directly relate to their feelings of home,
comfort, and safety on a college campus, which was extremely significant among females
who enrolled at Marathon University. Students, both men and women, may not have
considered their own personal characteristics and how that impacted their college choice
when reflecting on the elements that led them to choose to attend or not attend Marathon
University, but these underlying characteristics may still factor into their decision-
making. The quantitative data showed that compared to females who do enroll, GPA
impacted applicants who enrolled and females and males who did not enroll, as females
are 1.9 times as likely to not enroll as their GPA increases and males are .578 times as
likely to not enroll as their GPA increases, compared to enrolled females. The GPA
variable impacts females who do not enroll more significantly than males, however, this
variable serves as a predictor for both populations compared to females who do enroll.
Sense of belonging on campus and college choice can relate to a student’s perceived
academic self-concept and how they perceive their academic abilities, which supports the
qualitative finding of the feeling of comfort, belonging, and safety that a student has at
the institution (Wilson & Adelson, 2012).

215
Also within the quantitative findings, ethnicity served as a predictor for both men
and women who chose to attend Marathon University. Again, a limitation to this
qualitative finding about ethnicity is that students may not have been outwardly stating
how their own identities impacted their decision-making when articulating what allowed
them to choose or not choose to attend Marathon University, but research shows that
ethnicity can contribute to a student’s sense of belonging, feeling of home, or safety at an
institution (Johnson, 2012). Racial and gender stereotypes can contribute to a student’s
self of belonging, academic self-confidence, and performance, which could be reflected
in the qualitative accepted student survey results about feeling safe and comfortable on
the campus (Johnson, 2012). Not only may sense of belonging contribute to a student’s
decision-making on choosing an institution to attend, but also impacts their retention and
success once they enroll at the institution (Museus, Yi, & Saelua, 2017). When
considering the frequency of college choice decision-making factors from the pattern
codes seen in Table 8B of the qualitative findings, the variable of feeling is far more
significant in applicants who enrolled in the institution than those who did not. The
quantitative findings also indicate that applicants who enrolled are 1.3 times as likely to
be male if they are White Non-Hispanic and Asian compared to enrolled females, which
connects the notion that students who are in the ethnic majority felt more comfortable,
safe, and had sense of belonging at Marathon University, a predominantly White
institution, than those who were not.
Discrepancies between analyses. Based on prior research about college choice
decision-making and personal and institutional characteristics that impact a student’s
decision-making, it was not surprising that these variables were also present in the

216
qualitative findings. It was notable, however, that variables that could have been
perceived to be more important based on the qualitative findings did not reflect to be as
important based on the quantitative findings. For example, proximity to home was not a
significant predictor of college choice in the quantitative analysis, but it was recognized
by students within the qualitative findings. Proximity to home had relatively high
frequencies of second cycle pattern codes in the qualitative findings compared to other
variables, but were not significant in the quantitative findings (Table 8B).
Arguably the most significant finding to this overall study was the impact of
feelings on women who do attend Marathon University. Feelings cannot be quantified,
and feelings of home, safety, and comfort cannot be determined solely by looking at the
quantitative results. This is significant because it shows major differences between
gender and enrollment, and indicates the importance of sense of feelings when women
ultimately choose the institution they will attend. This finding is vitally important for
strategic enrollment managers and professionals in higher education today. With
increased marketization, privatization, and competition among institutions for students,
personalized communication and marketing techniques can give colleges an advantage to
enroll students who are connected to the institution and feel a sense of safety, fit, and
belonging to the campus. Ultimately, institutions need to understand how to market what
is important to different segments of their accepted student populations in order to
successfully have students enroll in their college or university (Broekemier & Seshadri,
1999).
217
Conclusion
The impact of gender can no longer be ignored in conversations regarding college
choice decision-making. This study sought to understand how men and women make
decisions as consumers when deciding to attend or not attend Marathon University in a
time of marketization and privatization in higher education. Institutional secondary data
included predictor variables of academic program, GPA, standardized test scores,
ethnicity, net cost, and distance from home that were analyzed to predict the differences
between females who enroll compared to females who do not enroll, males who enroll,
and males who do not enroll at Marathon University. Accepted student survey results
from both men and women who did and did not enroll at the university were also
analyzed, compared, and contrasted to the institutional secondary data. The two analyses
found that women who enrolled focused on their feelings throughout the college choice
decision-making process, and factors like academic program and ethnicity also had an
impact on their consumer decision-making.
Whether or not an institution has a majority of female students enrolling each year
or not, strategic enrollment managers need to be mindful of how students as consumers
are impacted by gender when making decisions. Personalized communication and
marketing plans should become commonplace and showcase how students can feel safe,
comfortable, and have the sense of being at home through relationship development
between the student and institution. Higher education institutions should also focus on
communication and policy regarding cost and affordability, academic programs, and how
ethnicity may impact a student’s decision-making as it relates to their sense of belonging
and safety on-campus. Having segmented marketing and communication plans for

218
different student populations throughout their decision-making process will be crucial for
colleges and universities as competition for enrollment heightens and students
increasingly act as consumers when deciding where to attend college.
219
References
ACE Board of Directors. (2012). On the importance of diversity in higher education.
Retrieved from https://www.acenet.edu/news-room/Documents/Board-Diversity-
Statement-June-2012.pdf
ACT. (2015). College Choice Report. Retrieved from
http://www.act.org/content/act/en/research/reports/act-publications/college-
choice-report.html
Adams, A. (2009). College choice + enrollment management = enrollment choice.
College and university, 84(4), 42-49.
Alexander, K., & Eckland, B. (1977). High school context and college selectivity:
Institutional constraints in educational stratification. Social Forces, 56(1), 166-
188.
An, B. P. (2010). The relations between race, family characteristics, and where students
apply to college. Social Science Research, 39, 310-323.
Anderson, C. A., Bowman, M. J., & Tinto, V. (1972). Where colleges are and who
attends: Effects of accessibility on college attendance. New York, NY: McGraw-
Hill.
Anfara, V.A.., Brown, K.M., & Mangione, T.L. (2002). Qualitative analysis on stage:
Making the research process more public. Educational Researcher, 31(7), 28-36.
Astin, A. W., & Oseguera, L. (2004). The declining "equity" of American higher
education. Review of Higher Education, 27(3), 321-341.
Avery, C. (2010). The effects of college counseling on high-achieving, low-income
students. National Bureau of Economic Research.
Avery, C. & Hoxby, C. M. (2004). Do and should financial aid packages affect students’
college choices? In C. M. Hoxby (Ed.). College Choices: The economics of where
to go, when to go, and how to pay for it (239-301). Chicago, IL: The University of
Chicago Press.
Bakewell, C. & Mitchell, V. M. (2003). Generation Y female consumer decision-making
styles. International Journal of Retail & Distribution Management, 31(2), 95-106.
Bakewell, C. & Mitchell, V. M. (2006). Male versus female consumer decision making
styles. Journal of Business Research, 59(12), 1297-1300.
Bandura, A. (1977). Self-efficacy: Toward a unifying theory of behavioral change.
Psychological Review, 84(2), 191-215.
220
Bandura, A. (1991). Social cognitive theory of self-regulation. Organizational Behavior
and Human Decision Processes, 50(2), 248-287.
Bandura, A. (2012). On the functional properties of perceived self-efficacy revisited.
Journal of Management, 38(1), 9–44.
Bandura, A., Barbaranelli, C., Caprara, G., & Pastorelli, C. (2001). Self-Efficacy Beliefs
as Shapers of Children's Aspirations and Career Trajectories. Child
Development, 72(1), 187-206.
Baron, J., & Norman, M. F. (1992). SATs, achievement tests, and high-school class rank
as predictors of college performance. Educational and Psychological
Measurement, 52(4), 1047-1055.
Barone, C. (2011). Some things never change: Gender segregation in higher education
across eight nations and three decades. Sociology of Education, 84(2), 157-176.
Baum, S., & Goodstein, E. (2005). Gender imbalance in college applications: Does it lead
to a preference for men in the admissions process? Economics of Education
Review, 24(6), 665-675.
Baxter, P., & Jack, S. (2008). Qualitative case study methodology: Study design and
implementation for novice researchers. The Qualitative Report, 13(4), 544-559.
Beattle, I.R. (2002). Are all “adolescent econometricians” created equal? Racial, class,
and gender differences in college enrollment. Sociology of Education, 75, 19-43.
Becker, G. S. (1993). Human capital: A theoretical and empirical analysis with special
reference to education (3rd edition). Chicago: University of Chicago Press.
Becker, G., Hubbard, W., & Murphy, K. (2010). The market for college graduates and
the worldwide boom in higher education of women. The American Economic
Review, 100(2), 229-233. Retrieved from http://www.jstor.org/stable/27804995
Bergerson, A. A., (2009). Special issue: College choice and access to college: Moving
policy, research, and practice to the 21st century. ASHE Higher Education
Report, 35(4), 1.
Bergerson, A. A., Heiselt, A. K., & Aiken-Wisniewski, S. (2013). Refocusing college
choice: Women's reflections on their postsecondary education choices. NASPA
Journal about Women in Higher Education, 6(2), 185-211.
Berkner, L., & Chavez, L. (1997). Access to Postsecondary Education for the 1992 High
School Graduates. Washington, D.C.: National Center for Education Statistics,
U.S. Department of Education, U.S. Government Printing Office.
Berman, E. P., & Paradeise, C. (Eds.). (2016). The university under pressure. Bingley,
BD: Emerald Group Publishing Limited.

221
Bers, T. H., & Galowich, P. M. (2002). Using survey and focus group research to learn
about parents' roles in the community college choice process. Community College
Review, 29(4), 67-82.
Bettman, J., & Jones, J. (1972). Formal models of consumer behavior: A conceptual
overview. The Journal of Business, 45(4), 544-562.
Bhayani, A. (2015). Social and peer influences in college choice. International
Conference on Economics and Business Market Management.
Bielby, R., Posselt, J. R., Jaquette, O., & Bastedo, M. N. (2014). Why are women
underrepresented in elite colleges and universities? A non-linear decomposition
analysis. Research in Higher Education, 55(8), 735-760.
Bishop, J. (1977). The effect of public policies on the demand for higher education. The
Journal of Human Resources, 12(3), 285-307.
Bishop, J. H. (1992). The growth of female college attendance: Causes and prospects.
Center for Advanced Human Resource Studies (CAHRS) Working Paper Series.
Blackburn, H. & Heppler, J. (2019) Women in STEM in higher education: A citation
analysis of the current literature. Science & Technology Libraries, 28(3), 261-271.
Blackwell, R. D., Miniard, P. W., & Engel, J. F. (2001). Consumer behavior (9th ed.). Ft.
Worth, Texas: Harcourt College Publishers.
Blau, F. D. & Kahn, L. M. (2007). The gender pay gap: Have women gone as far as they
can? Academy of Management Perspectives, 21(1), 7-23.
Boote, D. N., & Beile, P. (2005). Scholars before researchers: On the centrality of the
dissertation literature review in research preparation. Educational
Researcher, 34(6), 3-15.
Bourdieu, P., & Passeron, J. C. (1977). Reproduction in Education, Society, and Culture.
Beverly Hills, CA: SAGE Publications.
Bowden, J., & Wood, L. (2011). Sex doesn’t matter: The role of gender in the formation
of student-university relationships. Journal of Marketing for Higher Education,
21(2), 133-156.
Braxton, J. M. (1990). How students choose college. In D. Hossler, J.P. Bean, &
Associates (Eds.). The Strategic Management of College Enrollments (57-67).
San Francisco, CA: Jossey-Bass, Inc.
Brennan, J. & Patel, K. (2012). ‘Up-market’ or ‘down-market’: Shopping for higher
education in the UK. In P. N. Teixeria & D. D. Dill (Eds.). Public Vices, Private
Virtues? Assessing the Effects of Marketization in Higher Education (315-326).
Rotterdam, Netherlands: Sense Publishers.

222
Brinkman, P. T. (2000). The economics of higher education: Focus on cost. New
Directors for Institutional Research, 106, 5-17.
Broekemier, G.M. & Seshadri, S. (1999). Differences in college choice criteria between
deciding students and their parents. The Journal of Marketing for Higher
Education, 9(3), 1-13.
Bronstein, C. (2005). Representing the third wave: Mainstream print media framing of a
new feminist movement. Journalism & Mass Communication Quarterly, 82(4),
783-803.
Bryman, A. (2007). Barriers to integrating quantitative and qualitative research. Journal
of Mixed Methods Research, 1(1), 8-22.
Budgeon, S. (2014). The dynamics of gender hegemony: Femininities, masculinities and
social change. Sociology, 48(2), 317-334.
Burke Johnson, R., Onwuegbuzie, A. J., & Turner, L. A. (2007). Toward a definition of
mixed methods research. Journal of Mixed Methods Research, 1(2), 112–133.
Cabrera, A. F. & La Nasa, S. M. (2000), Understanding the College‐Choice Process. New
Directions for Institutional Research, 2000: 5-22.
Caprara, G. V., Fida, R., Vecchione, M., Del Bove, G., Vecchio, G. M., Barbaranelli, C.,
& Bandura, A. (2008). Longitudinal analysis of the role of perceived self-efficacy
for self-regulated learning in academic continuance and achievement. Journal of
Educational Psychology, 100(3), 525–534.
Cardoso, S., Rosa, M. J., Tavares, D. A., & Amaral. A. (2012). The increasing role of
market forces in HE: Is the EUA Institutional Evaluation Programme playing a
role? In P. N. Teixeria & D. D. Dill (Eds.). Public Vices, Private Virtues?
Assessing the Effects of Marketization in Higher Education (91-110). Rotterdam,
Netherlands: Sense Publishers.
Carter, D. F. (2003). Secondary analysis of data. In F. K. Stage & K. Manning (Eds.).
Research in the college context (153-167). New York, NY: Brunner-Routledge.
Castro Martin, T. (1995). Women's education and fertility: Results from 26 demographic
and health surveys. Studies in Family Planning, 26(4), 187-202.
Ceja, M. (2006). Understanding the role of parents and siblings as information sources in
the college choice process of Chicana students. Journal of College Student
Development, 47(1), 87-104.
Chapman, D. (1981). A model of student college choice. The Journal of Higher
Education, 52(5), 490-505.
223
Chapman, R. G. (1985). Toward a theory of college selection: A model of college search
and choice behavior. Association for Consumer Research, 13, 246-250.
Chen, J., & Zerquera, D. (2018). Leaving or staying home: Predicting where students
attend college. Education and Urban Society, 50(4), 376-399.
Cho, S., Hudley, C., Lee., S., Barry, L., & Kelly, M. (2008). Roles of gender, race, and
SES in the college choice process among first-generation and non-first-generation
students. Journal of Diversity in Higher Education, 1(2), 120-132.
Coghlan, D. (2003). Practitioner research for organizational knowledge: Mechanistic- and
organistic-oriented approaches to insider action research. Management Learning,
34, 451-463.
College Board (2015). Admitted student questionnaire user manual: Understanding ASQ
and ASQ PLUS and planning your study. Retrieved from https://secure-
media.collegeboard.org/digitalServices/pdf/professionals/admitted-student-
questionnaire-user-manual.pdf
Collins, K. M. T., Onwuegbuzie, A. J., & Burke Johnson, R. (2012). Securing a place at
the table: A review and extension of legitimation criteria for the conduct of mixed
research. American Behavioral Scientist, 56(6), 849-865.
Conklin, M. E., & Dailey, A. R. (1981). Does consistency of parental educational
encouragement matter for secondary school students? Sociology of Education,
54(4), 254-262.
Conger, D. (2015). High school grades, admissions policies, and the gender gap in
college enrollment. Economics of Education Review, 46, 144-147.
Conger, D., & Dickson, L. (2017). Gender imbalance in higher education: Insights for
college administrators and researchers. Research in Higher Education, 58(2), 214-
230.
Cook, E. E. F. (2017). The influence of academic self-efficacy and bachelor’s aspirations
on the college choice process (Doctoral dissertation). Retrieved from ProQuest
Dissertations & Theses Global. (10270578).
Cooke, M., & Lang, D. (2009). The effects of monopsony in higher education. Higher
Education, 57(5), 623–639.
Cosser, M., & du Toit, J. (2002). From school to higher education? Factors affecting the
choices of grade 12 learners. Cape Town, South Africa: Human Sciences
Research Council Publishers.
Creswell, J. W. (2014). Research design: Qualitative, quantitative, and mixed methods
approaches (4th ed.). Thousand Oaks, CA: SAGE Publications.

224
Creswell, J. W. & Plano Clark, V. L. (2018). Designing and conducting mixed methods
research (3rd ed.). Thousand Oaks, CA: SAGE Publications, Inc.
Cuthbert, R. (2010). Students as customers? Higher Education Review, 42(3), 3-25.
de Beauvoir, S. (1949). The second sex. New York, NY: Random House.
Department of Homeland Security’s Classification of Instructional Programs (2016).
STEM Designated Degree Program List. Retrieved from
https://www.ice.gov/sites/default/files/documents/Document/2016/stem-list.pdf
DesJardins, S. L., Dundar, H., & Hendel, D. D. (1999). Modeling the college application
decision process in a land-grant university. Economics of Education Review,
18(1), 117-132.
Di Ionno, M. (2009). N.J. losing out on $6B a year when college students flee state.
Retrieved from
http://blog.nj.com/njv_mark_diionno/2009/10/nj_losing_out_on_6b_a_year_whe.
html
Dill, D. D. (1997). Higher education markets and public policy. Higher Education Policy,
10(3/4), 167-185.
DiPrete, T. A., & Buchmann, C. (2013). The rise of women: The growing gender gap in
education and what it means for American schools. New York, NY: Russell Sage
Foundation.
Diaz McKechnie, J. (2012). Factors related to college going self-efficacy among urban
African American high school students (Doctoral dissertation). Retrieved from
ProQuest Dissertations & Theses Global. (3543594).
Doherty, W. J., Willoughby, B. J., & Wilde, J. L. (2016). Is the gender gap in college
enrollment influenced by nonmarital birth rates and father absence? Family
Relations, 65(2), 263-274.
Dolinsky, A. L. (2010). The adequacy of the information that students utilize when
choosing a college: An attribute importance and information sufficiency
approach. College Student Journal, 44(3), 762–776.
Dorius, S. F., & Firebaugh, G. (2010). Trends in global gender inequality. Social Forces,
88(5), 1941-1968.
Duflo, E. (2012). Women empowerment and economic development. Journal of
Economic Literature 2012, 50(4), 1051–1079.
Eisenberg, B., & Ruthsdotter, M. (1998). History of the women’s rights movement.
Retrieved from http://www.nwhp.org/resources/womens-rights-
movement/history-of-the-womens-rights-movement/

225
Endres, M., Chowdhury, S., & Alam, I. (2008). Gender effects on bias in complex
financial decisions. Journal of Managerial Issues, 20(2), 238-254.
Engberg, M. E., & Allen, D. J. (2011). Uncontrolled destinies: Improving opportunity for
low-income students in American higher education. Research in Higher
Education, 52(8), 786-807.
Evers, F. Livernois, J., & Mancuso, M. (2006). Where are the boys? Gender imbalance in
higher education. Higher Education Management and Policy, 18(2), 1-25.
Field, A. (2018). Discovering statistics using IBM SPSS statistics: North American
edition. Thousand Oaks, CA: SAGE Publications Ltd.
Finney, T.G, & Finney, R.Z. (2010). Are students their universities’ customers? An
exploratory study. Education + Training, 52(4), 276–291.
Fletcher, J. M. (2012). Similarity in peer college preferences: New evidence from Texas.
Social Science Research, 41(2), 321-330.
Frankfort-Nachmias, C., & Leon-Guerrero, A. (2018). Social statistics for a diverse
society. (8th ed.). Los Angeles, CA: SAGE Publications, Inc.
Frey, B. (2018). The SAGE encyclopedia of educational research, measurement, and
evaluation (Vols. 1-4). Thousand Oaks,, CA: SAGE Publications, Inc.
Fuller, W. C., Manski, C. F., & Wise, D. A. (1982). New evidence on the economic
determinants of postsecondary schooling choices. The Journal of Human
Resources, 17(4), 477-498.
Geiger, R. L. (2011). Markets and the end of the current era in U.S. higher education. In
P.N. Teixeria & D.D. Dill (Eds.). Public Vices, Private Virtues? Assessing the
Effects of Marketization in Higher Education. (pp. 3-17). Rotterdam, Netherlands:
Sense Publishers.
Glass, G. (1976). Primary, secondary, and meta-analysis of research. Educational
Researcher, 5(10), 3-8.
Goldin, C., Katz, L. F., & Kuziemko, I. (2006). The homecoming of American college
women: The reversal of the college gender gap. The Journal of Economic
Perspectives, 20(4), 1-156.
Gonzalez, L. M. (2007). College choice of Latino high school students: Influence of
demographics, academic preparation, and academic self -efficacy beliefs on
intended level of post -secondary institution. Retrieved from from ProQuest
Dissertations & Theses Global. (304844091).

226
Goodman, J., Hurwitz, M., Smith, J., & Fox, J. (2015). The relationship between siblings’
college choices: Evidence from one million SAT-taking families. Economics of
Education Review, 48, 75-85.
Greene, J. C. (2007). Mixed methods in social inquiry. San Francisco, CA: Jossey-Bass.
Grown, C., Gupta, G. R., & Pande, R. (2005). Taking action to improve women's health
through gender equality and women's empowerment. The Lancet, 365(9458), 541-
543.
Guba, E. G., & Lincoln, Y. S. (1994). Competing paradigms in qualitative research. In N.
K. Denzin & Y. S. Lincoln (Eds.), Handbook of qualitative research (pp. 105-
117). Thousand Oaks, CA: SAGE Publications, Inc.
Guilbault, M. (2018). Students as customers in higher education: The (controversial)
debate needs to end. Journal of Retailing and Consumer Services, 40, 295-298.
Hackett, G. (1985). Role of mathematics self-efficacy in the choice of math-related
majors of college women and men: A path analysis. Journal of Counseling
Psychology, 32(1), 47–56.
Hamrick, F. A., & Hossler, D. (1996). Diverse information-gathering methods in the
postsecondary decision-making process. The Review of Higher Education, 19(2),
179-198.
Hanson, K.H., & Litten, L.H. (1982). Mapping the road to academe: A review of research
on women, men, and the college-selection process. In P.J. Perun (Ed.). The
undergraduate woman: Issues in educational equity (73-97). Lexington,
Massachusetts: LexingtonBooks.
Hao, L., & Bonstead-Bruns, M. (1998). Parent-child differences in educational
expectations and the academic achievement of immigrant and native
students. Sociology of Education, 71(3), 175-198.
Hayes, T. (2018). Admissions and recruitment marketing. In D. Hossler & B. Bontrager.
Handbook of strategic enrollment management (103-123). San Francisco, CA:
Jossey-Bass.
Hearn, J. C. (1984). The relative roles of academic, ascribed, and socioeconomic
characteristics in college destinations. Sociology of Education, 57(1), 22-30.
Hearn, J. C., & Ochs Rosinger, K. (2014). Socioeconomic diversity in selective private
colleges: An organizational analysis. The Review of Higher Education, 38(1), 71-
104.
Heller, D. (1997). Student price response in higher education: An update to Leslie and
Brinkman. The Journal of Higher Education, 68(6), 624-659.

227
Hemsley-Brown, J., & Oplatka, I. (2016). Higher education consumer choice. New York,
NY: Palgrave Macmillan.
Hesel, R.A. (2004). Campus visit drives college choice. Art & Science Group LLC, 5(5).
Hills, J. R. (1964). Decision theory and college choice. Personnel and Guidance Journal,
43, 17-22.
Hittepole, C. (2015). Nontraditional students: Supporting changing student populations.
Washington, D.C. Retrieved from
https://www.naspa.org/images/uploads/main/Hittepole_NASPA_Memo.pdf
Hossler, D. (2018a). Trends in strategic enrollment management. In D. Hossler, B.
Bontrager, & Associates. Handbook of Strategic Enrollment Management. San
Francisco, CA: Jossey-Bass.
Hossler, D. (2018b). Origins of strategic enrollment management. In D. Hossler, B.
Bontrager, & Associates. Handbook of Strategic Enrollment Management. San
Francisco, CA: Jossey-Bass.
Hossler, D., & Bean, J. P. (1990). The strategic management of college enrollments (1st
ed.). San Francisco, CA: Jossey-Bass.
Hossler, D., & Bontrager, B. (2014). Handbook of strategic enrollment management. San
Francisco, CA: Jossey-Bass.
Hossler, D., & Bontrager, B. (2018). Summing up: The present and future tense for SEM.
In D. Hossler, B. Bontrager, & Associates. Handbook of Strategic Enrollment
Management. San Francisco, CA: Jossey-Bass.
Hossler, D., Braxton, J., & Coopersmith, G. (1989). Understanding student college
choice. In J.C. Smart (Ed.). Higher Education: Handbook of Theory and
Research, 5, 231-288.
Hossler, D., & Gallagher, K. S. (1987). Studying student college choice: A three-phase
model and the implications for policymakers. College and university, 62(3), 207-
221.
Hossler, D., & Maple, S. (1993). Being undecided about postsecondary education. The
Review of Higher Education, 16(3), 285-307.
Hossler, D., Schmit, J. L., & Vesper, N. (1999). Going to college: How social, economic,
and educational factors influence the decisions students make. Baltimore, MD:
Johns Hopkins University Press.
Hossler, D., & Stage, F. (1992). Family and high school experience influences on the
postsecondary educational plans of ninth-grade students. American Educational
Research Journal, 29(2), 425-451.

228
Hoxby, C., & Avery, C. (2013). The missing “one-offs”: The hidden supply of high-
achieving, low-income students. Brookings Papers on Economic Activity, 31-65.
Hsieh, H., & Shannon, S.E. (2005). Three approaches to qualitative content analysis.
Qualitative Health Research, 15(9), 1277-1288.
Hurtado, S. (2001). Linking diversity and educational purpose: How diversity affects the
classroom environment and student development. In G. Orfield (Ed.). Diversity
Challenged: Evidence on the Impact of Affirmative Action, 187-203. Cambridge,
MA: Education Publishing Group.
Hurtado, S., Inkelas, K. K., Briggs, C., & Rhee, B. (1997). Differences in college access
and choice among Racial/Ethnic groups: Identifying continuing barriers. Research
in Higher Education, 38(1), 43-75.
Hussar, W. J., & Bailey, T. M. (2018). Projections of education statistics to 2026.
Washington, DC: National Center for Education Statistics.
Ivankova, N. V., Creswell, J. W., & Stick, S. L. (2006). Using mixed-methods sequential
explanatory design: From theory to practice. Field Methods, 18(1), 3-20.
Iacobucci, D., & Ostrom, A. (1993). Gender differences in the impact of core and
relational aspects of services on the evaluation of service encounters. Journal of
Consumer Psychology, 2(3), 257-286.
Iannello, K. (2010) Women's leadership and third-wave feminism." In K. O'Connor (Ed.).
Gender and Women's Leadership: A Reference Handbook. (70-77). Thousand
Oaks, CA: SAGE Publications, Inc.
Iceland, J. (2014). A portrait of America: The demographic perspective. Oakland, CA:
University of California Press.
Iloh, C. (2018). Toward a new model of college "choice" for a twenty-first-century
context. Harvard Educational Review, 88(2), 227-256.
International Center for Research on Women (2003). Impact of investments in female
education on gender equality, Washington, D.C.: Malhotra, A., R. Pande, & C.
Grown.
IPEDS (2017). Fall enrollment survey, part a: Full-time first-time undergraduate
enrollment in N.J. colleges by gender, fall 2017. Retrieved from
https://www.state.nj.us/highereducation/documents/pdf/statistics/bygender/Enr20
17Sex.pdf
Iversen, T., & Rosenbluth, F. (2010). Women, work, and politics: The political economy
of gender inequality. New Haven, CT: Yale University Press.
229
Jacobs, J. A. (1996). Gender inequality and higher education. Annual Review of
Sociology, 22, 153-185.
Jackson, G.A. (1982). Public efficiency and private choice in higher education.
Educational evaluation and policy analysis, 4(2), 237-247.
Jenkins, K.E. (2004). The influence of parental attachment, gender, and academic major
choice on the career decision -making self -efficacy of first-year African
American college students. Retrieved from ProQuest Dissertations & Theses
Global (305149584).
Johnson, D. (2012). Campus racial climate perceptions and overall sense of belonging
among racially diverse women in STEM majors. Journal of College Student
Development, 53(2), 336–346.
Johnson, R., Stewart, N., & Eberly, C. (1991). Counselor impact on college choice. The
School Counselor, 39(2), 84-90.
Johnston, M. (2014). Secondary data analysis: A method of which the time has come.
Qualitative and Quantitative Methods in Libraries, 3, 619-626.
Johnstone, D. B. (2003). The economics and politics of cost sharing in higher education:
comparative perspectives. Economics of Education Review, 23, 403-410.
Kiecolt, K. J., & Nathan, L. E. (1985). Quantitative applications in the social
sciences: Secondary analysis of survey data. Thousand Oaks, CA: SAGE
Publications, Inc.
Kim, D. (2004). The effect of financial aid on students' college choice: Differences by
racial groups. Research in Higher Education, 45(1), 43-70.
Kim, J. K., & Gasman, M. (2011). In search of a "good college": Decisions and
determinations behind Asian American students' college choice. Journal of
College Student Development, 52(6), 706-728.
Klevan, S., Weinberg, S., & Middleton, J. (2016). Why the boys are missing: Using
social capital to explain gender differences in college enrollment for public high
school students. Research in Higher Education, 57(2), 223-257.
Kobrin, J. L., & Michel, R. S. (2006). The SAT as a predictor of different levels of
college performance. College Board Research Report, 3, 1-10.
Kohn, M. G., Mansk, C. F., & Mundel, D. S. (1976). An empirical investigation of
factors which influence college-going behavior. Annals of Economic and Social
Measurement, 5(4), 391-419.

230
Kotler, P. (1976). Applying marketing theory to college admissions. A Role for
Marketing in College Admissions, 54-72. New York, NY: College Entrance
Examination Board.
Kwong, J. (2000). Introduction: Marketization and privatization in higher education.
International Journal of Educational Development, 20, 87-92.
Leslie, L. L., & Brinkman, P. (1988). The economic value of higher education. New
York, NY: American Council on Education.
Leslie, L., Johnson, G., & Carlson, J. (1977). The impact of need-based student aid upon
the college attendance decision. Journal of Education Finance, 2(3), 269-285.
Levin, J. S. (2001). Public policy, community colleges, and the path to globalization.
Higher Education, 42, 237-262.
Litten, L. H. (1982). Different strokes in the applicant pool: some refinements in a model
of student college choice. The Journal of Higher Education, 53(4), 383-402.
Lockheed, M. E. (1982). Sex bias in aptitude and achievement tests used in higher
education. In P.J. Perun (Ed.). The undergraduate woman: Issues in educational
equity (99-126). Lexington, Massachusetts: LexingtonBooks.
Long, B. T. (2004). How have college decisions changed over time? An application of
the conditional logistic choice model. Journal of Econometrics, 121(2), 271-296.
Lorber, J. (1994). Paradoxes of gender. New Haven, CT: Yale University Press.
Lorber, J. (2011). The social construction of gender (2nd ed.). In G.B. Grusky & S.
Szelényi (Eds.). The inequality reader: Contemporary and foundational readings
in race, class, and gender, (318-325). New York, NY: Routledge.
Maguire, J., & Lay, R. (1981). Modeling the college choice process: Image and decision.
College and University, 56(2), 123-139.
Mann, S. A., & Huffman, D. J. (2005). The decentering of second wave feminism and the
rise of the third wave. Science & Society, 69(1), 56-91.
Mansfield, P., & Warwick, J. (2006). Gender differences in students’ and parents’
evaluative criteria when selecting a college. Journal of Marketing for Higher
Education, 15(2).
Manski, C. F., & Wise, D. A. (1983). College choice in America. Cambridge,
Massachusetts: Harvard University Press.
Marginson, S. (2010). After globalization: Emerging politics of education. In M.C.
Brown (Ed.). Organization and governance in higher education (6th ed.). (pp.
703- 736). New York, NY: Pearson Learning Solutions.
231
Maringe, F. (2012). The meanings of globalization and internationalization in HE:
Findings from a world survey. In F. Maringe & N. Foskett (2012). Globalization
and internationalization in higher education: Theoretical, strategic and
management perspectives (17-34). New York, NY: Bloomsbury T&T Clark.
Marshall, C., & Rossman, G. (1999). Designing qualitative research (3rd ed.). Thousand
Oaks, CA: SAGE Publications, Inc.
Mateo, N. J., Makundu, G. N., Barnachea, E. A. R., & Paat, J. N. J. (2014). Enhancing
self-efficacy of college students through choice theory. International Journal of
Choice Theory and Reality Therapy, 33(2), 78-85.
McDonough, P. M. (1997). Choosing colleges: How social class and schools structure
opportunity. Albany, NY: State University of New York Press.
McGuinness, A. C. (2016). The states and higher education. In M. N. Bastedo, P. G.
Altbach, & P. J. Gumport. (Ed.). American higher education in the twenty-first
century. (4th ed.). (pp. 238-280). Baltimore, MD: Johns Hopkins University Press.
McNiff, J., & Whitehead, J. (2011). All you need to know about action research (2nd
ed.). Thousand Oaks, CA: SAGE Publications, Inc.
Meyer, B. (2016). Case studies. In C. V. Angelelli & B. J. Baer. (Eds.). Researching
translation and interpreting (177-184). New York, NY: Routledge.
Meyers, L. S., Gamst, G., & Guarino, A. J. (2017). Applied multivariate research: Design
and interpretation. Thousand Oaks, CA: SAGE Publications Ltd.
Mills, A. J., Durepos, G., & Wiebe, E. (2010). Encyclopedia of case study
research (Vols. 1-0). Thousand Oaks, CA: SAGE Publications, Inc.
Mintz, S. (2019). The other gender gap. Inside Higher Education. Retrieved from
https://www.insidehighered.com/blogs/higher-ed-gamma/other-gender-gap
Mitchell, M., Leachman, M., & Masterson, K. (2016). Funding up, tuition down: State
cuts to higher education threaten quality and affordability at public colleges.
Center on Budget and Policy Priorities.
Moakler, M., & Kim, M. (2014). College major choice in STEM: Revisiting confidence
and demographic factors. Career Development Quarterly, 62(2), 128–142.
Monaghan, P. (2018). New Jersey to its students: Please don’t go. The Chronicle of
Higher Education. Retrieved from https://www.chronicle.com/article/New-
Jersey-to-Its-Students-/244149
Moogan, Y. J., Baron, S., & Harris, K. (1999). Decision-making behavior of potential
higher education students. Higher Education Quarterly, 53(3), 211-228.
232
Morrison, A., Raju, D., & Sinha, N. (2007). Gender equality, poverty and economic
growth. The World Bank.
Morrow, V. (1999). Conceptualizing social capital in relation to the well-being of
children and young people: A critical review. The Sociological Review, 47(4),
744-765.
Mortenson, T. G. (Ed.). (1992). Postsecondary education opportunity. The Mortenson
report on public policy analysis of opportunity for postsecondary education.
Postsecondary Education Opportunity, 1.
Mortenson, T. G. (Ed.). (1995). Postsecondary education opportunity. The Mortenson
report on public policy analysis of opportunity for postsecondary education.
Postsecondary Education Opportunity, 31.
Mumper, M., Gladieuz, L. E., King, J. E., & Corrigan, M. E. (2016). The federal
government and higher education. In M. N. Bastedo, P. G. Altbach, & P. J.
Gumport. (Ed.). American higher education in the twenty-first century. (4th ed.).
(pp. 212-237). Baltimore, MD: Johns Hopkins University Press.
Museus, S. D., Yi, V., & Saelua, N. (2017). The impact of culturally engaging campus
environments on sense of belonging. Review of Higher Education, 40(2), 187-
215.
Mustafa, S. A., Sellami, A. L., Elmaghraby, E. A. A., & Al-Qassass, H. B. (2018).
Determinants of college and university choice for high-school students in Qatar.
International Journal of Higher Education, 7(3), 1-15.
Namey, E., Guest, G., Thairu, L., & Johnson, L. (2008). Data reduction techniques for
large qualitative data sets. In G. Guest & K.M. MacQueen (Eds.)., Handbook for
team-based qualitative research (pp. 137-161). Lanham, MD: AltaMira Press.
National Student Clearinghouse (2016). Current term enrollment estimates: Fall 2016.
Retrieved from https://nscresearchcenter.org/wp-
content/uploads/CurrentTermEnrollment-Fall2016.pdf
New Jersey Business & Industry Association. (2016). Outmigration by the Numbers:
How do we stop the Exodus? Retrieved from https://www.njbia.org/wp-
content/uploads/2016/05/njbiaoutmigrationreport.pdf
Nokkala, T., Heller-Schuh, B., & Paier, M. (2012). Ranking lists and European
framework programmes: Does university status matters for performance in
framework programmes? In P.N. Teixeria & D.D. Dill (Eds.). Public Vices,
Private Virtues? Assessing the Effects of Marketization in Higher Education. (pp.
111-139). Rotterdam, Netherlands: Sense Publishers.
233
O'Connor, N., Hammack, F. M., & Scott, M. A. (2010). Social capital, financial
knowledge, and Hispanic student college choices. Research in Higher
Education, 51(3), 195-219.
Okerson, J.R. (2016). Beyond the campus tour: College choice and the campus visit.
Retrieved from ProQuest Dissertations & Theses Global. (1799038598).
Onwuegbuzie, A. J., & Leech, N. L. (2006). Linking research questions to mixed
methods data analysis procedures. Qualitative Report, 11(3), 474-498.
Oplatka, I., & Hemsley-Brown, J. (2012). The globalization and marketization of higher
education: Some insights from the standpoint of institutional theory. In F.
Maringe & N. Foskett (2012). Globalization and internationalization in higher
education: Theoretical, strategic and management perspectives (65-82). New
York, NY: Bloomsbury T&T Clark.
Osborne, J. W. (2013). Best practices in data cleaning: A complete guide to everything
you need to do before and after collecting your data. Thousand Oaks, CA: SAGE
Publications, Inc.
Ostrom, A.L., Bitner, M.J., & Burkhard, K.A. (2011). Leveraging service blueprinting to
rethink higher education: When students come ‘valued customer,’ everybody
wins. Center for American Progress. Retrieved from
https://files.eric.ed.gov/fulltext/ED535642.pdf
Palan, K. M. (2001). Gender identity in consumer behavior research: A literature review
and research agenda. Academy of Marketing Science Review, 10, 1-24.
Park, E. & Hossler, D. (2014). Understanding student college choice. In D. Hossler, B.
Bontrager, & Associates. Handbook of Strategic Enrollment Management. San
Francisco, CA: Jossey-Bass.
Pastorelli, C., Caprara, G. V., Barbaranelli, C., Rola, J., Rozsa, S., & Bandura, A. (2001).
The structure of children's perceived self-efficacy: A cross-national study.
European Journal of Psychological Assessment, 17(2), 87-97.
Paulsen, M. B. (1990). College choice: Understanding student enrollment behavior.
ASHE- ERIC Higher Education Report No. 6. Washington, DC: The George
Washington University, School of Education and Human Development.
Paulsen, M. B., & St. John, E. P. (2002). Social class and college costs: Examining the
financial nexus between college choice and persistence. The Journal of Higher
Education, 73(2), 189-236.
Peng, C. J. Lee, K. L., & Ingersoll, G. M. (2010). An introduction to logistic regression
analysis and reporting. The Journal of Educational Research, 96(1), 3-14.
234
Pelletier, R., Khan, N. A., Cox, J., Daskalopoulou, S. S., Eisenberg, M. J., Bacon, S. L.,
… Pilote, L. (2016). Sex versus gender-related characteristics. Journal of the
American College of Cardiology, 67(2), 127-135.
Pérez, P., & Ceja, M. (Eds.). (2015). Higher education access and choice for Latino
students: Critical findings and theoretical perspectives. New York, NY:
Routledge.
Perna, L. W. (2000). Racial and ethnic group differences in college enrollment decisions.
New Directions for Institutional Research, 2000: 65-83.
Perna, L. W. (2005). The benefits of higher education: Sex, racial/ethnic, and
socioeconomic group differences. The Review of Higher Education, 29(1), 23-52.
Perna, L. W. (2006). Studying college access and choice: A proposed conceptual model.
In J.C. Smart (Ed.). Higher Education: Handbook of Theory and Research, XXI,
99-157.
Perna, L. W., & Titus, M. A. (2004). Understanding differences in the choice of college
attended: The role of state public policies. The Review of Higher Education,
27(4), 501-525.
Perun, P. J. (1982). The undergraduate woman: Issues in educational equity. Lexington,
MA: Lexington Books.
Peter, K., & Horn, L. (2005). Gender differences in participation and completion of
undergraduate education and how they have changed over time. (NCES 2005-
169). Washington, DC: U.S. Government Printing Office. Retrieved from
https://nces.ed.gov/pubs2005/2005169.pdf.
Ra, E. (2011). Understanding the role of economic, cultural, and social capital and
habitus in student college choice: An investigation of student, family, and school
contexts (Unpublished doctoral dissertation). University of Michigan: Ann Arbor,
MI.
Rahm, E., & Hai Do., H. (2000). Data cleaning: Problems and current approaches.
Bulletin of the Technical Committee on Data Engineering, 23(4), 3-13.
Randolph, J. J. (2009). A guide to writing the dissertation literature review. Practical
assessment, research & evaluation, 14(13), 1-13.
Richarme, M. (2005). Consumer decision-making models, strategies, and theories, oh
my! Retrieved from
https://www.decisionanalyst.com/media/downloads/ConsumerDecisionMaking.pd
f
Ridgeway, C. L. (2009). Framed before we know it: How gender shapes social relations.
Gender and Society, 23(2), 145-160.
235
Riesman, D. (1980). On higher education: The academic enterprise in an era of rising
student consumerism (1st ed.). San Francisco, CA: Jossey-Bass.
Risman, B. J. (2004). Gender as a social structure: Theory wrestling with
activism. Gender and Society, 18(4), 429-450.
Rosenfeld, R. A., & Hearn, J. C. (1982). Sex differences in the significance of economic
resources for choose and attending a college. In P.J. Perun (Ed.). The
undergraduate woman: Issues in educational equity (127-157). Lexington,
Massachusetts: LexingtonBooks.
Rothstein, J. M. (2004). College performance predications and the SAT. Journal of
Econometrics, 121, 297-317.
Rowland, D. (2004). The boundaries of her body: The troubling history of women's rights
in America. Naperville, Ill: Sphinx Pub.
Rubin, R. B. (2011). The Pell and the poor: A regression-discontinuity analysis of on-
time college enrollment. Research in Higher Education, 52(7), 675-692.
Rudolph, F., & Thelin, J. R. (1991). The American college and university: A history.
Athens, GA: University of Georgia Press.
Ryan, G. W., & Russell Bernard, H. (2003). Techniques to identify themes. Field
Methods, 15(1), 85–109.
Salant, P., & Dillman, D. A. (1994). How to conduct your own survey. New York, NY:
Wiley.
Saldaña, J. (2016). The coding manual for qualitative researchers (3rd ed). Thousand
Oaks, CA: SAGE Publications, Inc.
Sandlier, N. M. (2016). The educational equation: Strategies for retaining and attracting
New Jersey’s future workforce. Retrieved from https://www.njbia.org/wp-
content/uploads/2016/05/EducationEquation.pdf
Santiago, D. A. (2007). Choosing Hispanic-serving institutions (HSIs): The basics.
Washington, DC: Exelencia in Education.
Schmit, J. L. (1991). An empirical look at the search stage of the student college choice
model. Retrieved from ProQuest Dissertations Publishing. (9217420).
Secore, S. (2018). The significance of campus visitations to college choice and strategic
enrollment management. Strategic enrollment management quarterly, 5(4), 150-
158.

236
Serna, G.R., & Birnbaum, M. (2018). Economic perspectives on pricing and what it
means for SEM. In D. Hossler & B. Bontrager. Handbook of strategic enrollment
management (177-195). San Francisco, CA: Jossey-Bass.
Sewell, W., & Shah, V. (1968). Social class, parental encouragement, and educational
aspirations. American Journal of Sociology, 73(5), 559-572.
Shank, M. D., & Beasley, F. (1998). Gender effects on the university selection process.
Journal of Marketing for Higher Education, 8(3), 63-71.
Shapiro, D., Dundar, A., Huie, F., Wakhungu, P., Yuan, X., Nathan, A & Hwang, Y., A.
(2017). A National View of Student Attainment Rates by Race and Ethnicity – Fall
2010 Cohort (Signature Report No. 12b). Herndon, VA: National Student
Clearinghouse Research Center.
Slaughter, S., & Rhoades, G. (2003). Academic capitalism and the new economy:
Markets, state, and higher education. Baltimore, MD: The Johns Hopkins
University Press.
Smith, M. J., & Fleming, M. K. (2006). African American parents in the search stage of
college choice: Unintentional contributions to the female to male college
enrollment gap. Urban Education, 41(1), 71-100.
Sokatch, A. (2006). Peer influences on the college-going decisions of low socioeconomic
status urban youth. Education and Urban Society, 39(1), 128-146.
Sproles, G.B., & Kendall, E.L. (1986). A methodology for profiling consumer’s decision-
making styles. The Journal of Consumer Affairs, 20(20), 267-279.
St. John, E. P., Paulsen, M. B., & Carter, D. F. (2005). Diversity, college costs, and
postsecondary opportunity: An examination of the financial nexus between
college choice and persistence for African Americans and whites. The Journal of
Higher Education, 76(5), 545-569.
St. John, E. P., Paulsen, M. B., & Starkey, J. B. (1996). The nexus between college
choice and persistence. Research in Higher Education, 37, 175-220.
Stage, F. K., & Hossler, D. (1989). Differences in family influences on college
attendance plans for male and female ninth graders. Research in Higher
Education, 30(3), 301-315.
Staley, D. J., & Trinkle, D. A. (2011). The changing landscape of higher education.
Educause Review, 46, 15-31.
Stoltzfus J. C. (2011). Logistic regression: A brief primer. Academic Emergency
Medicine, 18(10), 1099-1104.

237
Stricker, L. J., Rock, D. A., & Burton, N. W. (1991). Sex differences in SAT predictions
of college grades. New York, NY: College Board Publications.
Stringer, E.T. (2014). Action research (4th ed.). Thousand Oaks, CA: SAGE
Publications, Inc.
Tashakkori, A., & Teddlie, C. (2010a). Putting the human back in "human research
methodology": The researcher in mixed methods research. Journal of Mixed
Methods Research, 4(4), 271-277.
Tashakkori, A., & Teddlie, C. (2010b). SAGE handbook of mixed methods in social &
behavioral research. Thousand Oaks, CA: SAGE Publications, Inc.
Teddlie, C., & Tashakkori, A. (2009). Foundations of mixed methods research:
Integrating quantitative and qualitative approaches in the social and behavioral
sciences. Los Angeles, CA: SAGE Publications, Inc.
Teixeira, P. N., & Dill, D. D. (2011). Public vices, private virtues? Assessing the effects
of marketization in higher education. Rotherdam, Netherlands: Sense Publishers.
Tellis, W. M. (1997). Application of a case study methodology. The Qualitative
Report, 3(3), 1-19.
Tembon, M., & Fort, L. (Eds.). (2008). Girls' education in the 21st century: Gender
equality, empowerment, and economic growth. Washington, DC: World Bank.
Teranishi, R. T., Ceja, M., Antonio, A. L., Allen, W. R., & McDonough, P. (2004). The
college-choice process for Asian Pacific Americans: Ethnicity and socioeconomic
class in context. The Review of Higher Education, 27(4), 527-551.
Terenzini, P. T., Cabrera, A. F., and Bernal, E. M. (2001). Swimming against the tide:
The poor in American higher education. Report No. 2001-1. New York, NY:
College Entrance Examination Board.
Thomas, R. M. (2003). Blending qualitative and quantitative: Research methods in these
and dissertations. Thousand Oaks, CA: SAGE Publications.
Tierney, M. S. (1980). The impact of financial aid on student demand for public/private
higher education. Journal of Higher Education, 51(5), 527–545.
Tierney, W. G., & Venegas, K. M. (2009). Finding money on the table: Information,
financial aid, and access to college. The Journal of Higher Education, 80(4), 363-
388.
Tight, M. (2013). Students: Customers, clients or pawns? Higher Education Policy, 26,
291-307.

238
Title IX. (n.d.). In Encyclopedia Britannica online. Retrieved from
https://academic.eb.com/levels/collegiate/article/Title-IX/125072
Turley, R. (2009). College proximity: Mapping access to opportunity. Sociology of
Education, 82(2), 126-146.
UN Millennium Project. (2005). Taking action: Achieving gender equality and
empowering women: Achieving the millennium development goals. Task Force
on Education and Gender Equality. London, UK: Earthscan.
U.S. Department of Education, National Center for Education Statistics (1995). The
educational progress of women: Findings from the condition of education 1995.
Retrieved from https://nces.ed.gov/pubs/96768.pdf
U.S. Department of Education, National Center for Education Statistics (1999). Table
177: Total fall enrollment in institutions of higher education, by attendance
status, sex, and age: 1970 to 2009. Retrieved from
https://nces.ed.gov/programs/digest/d99/tables/PDF/Table177.pdf
U.S. Department of Education, National Center for Education Statistics (2017). Table
309.30: Residence and migration of all first-time degree/certificate-seeking
undergraduates in 4-year degree-granting postsecondary institutions who
graduated from high school in the previous 12 months, by state or jurisdiction:
Fall 2016. Retrieved from
https://nces.ed.gov/programs/digest/d17/tables/dt17_309.30.asp
U.S. Department of Education, National Center for Education Statistics (2018a). The
NCES fast facts tool provides quick answers to many education questions.
Retrieved from https://nces.ed.gov/fastfacts/display.asp?id=372
U.S. Department of Education, National Center for Education Statistics (2018b). Table
303.10: Total fall enrollment in degree-granting postsecondary institutions, by
attendance status, sex of student, and control of institution: Selected years, 1947
through 2027. Retrieved from
https://nces.ed.gov/programs/digest/d17/tables/dt17_303.10.asp
U.S. Department of Education, National Center for Education Statistics (2018c). Table
309.30: Residence and migration of all first-time degree/certificate-seeking
undergraduates in 4-year degree-granting postsecondary institutions who
graduated from high school in the previous 12 months, by state or jurisdiction:
Fall 2016. Retrieved from
https://nces.ed.gov/programs/digest/d17/tables/dt17_309.30.asp
U.S. Department of Education, National Center for Education Statistics. (2019). Status
and Trends in the Education of Racial and Ethnic Groups, Indicator 26: STEM
Degrees (NCES 2019-038). Retrieved from
https://nces.ed.gov/fastfacts/display.asp?id=899.

239
United Nations (2014). The road to dignity by 2030: Ending poverty, transforming all
lives, and protecting the planet. Retrieved from
https://thpadvocacy.files.wordpress.com/2014/08/2014-12-sg-synthesis-report-on-
sdgs.pdf
Volkwein, J. F. (2003). Using and enhancing existing data to respond to campus
challenges. In F.K. Stage & K. Manning (Eds.). Research in the college context
(183-207). New York, NY: Brunner-Routledge.
Vrontis, D., Thrassou, A., & Melanthiou, Y. (2007). A contemporary higher education
student-choice model for developed countries. Journal of Business Research,
60(9), 979;-989.
Weiler, W. (1994). Transition from consideration of a college to the decision to
apply. Research in Higher Education, 35(6), 631-646.
Wentz, E. (2014). How to design, write, and present a successful dissertation proposal.
London, England: SAGE Publications, Ltd.
West, C., & Zimmerman, D. (1987). Doing gender. Gender and Society, 1(2), 125-151.
Wiese, M., Van Heerden, C. H., & Jordaan, Y. (2010). The role of demographics in
students' selection of higher education institutions. Acta Commercii, 10(1), 150-
163.
Wilson, H. E., & Adelson, J. L. (2012). College choices of academically talented
secondary students. Journal of Advanced Academics, 23(1), 32–52.
Wood, R., & Bandura, A. (1989). Impact of conceptions of ability on self-regulatory
mechanisms and complex decision making. Journal of Personality and Social
Psychology, 56(3), 407–415. https://doi.org/10.1037/0022-3514.56.3.407
Woodall, T., Hiller, A., & Resnick, S. (2014). Making sense of higher education: students
as consumers and the value of the university experience. Studies in Higher
Education, 39(1), 48–67.
Yin, R. K. (2006). Mixed methods research: Are the methods genuinely integrated or
merely parallel? Research in the Schools, 13(1), 41.
Yin, R. K. (2013). Validity and generalization in future case study evaluations.
Evaluation, 19(3), 321-332.
Yin, R. K. (2014). Case study research: Design and methods (5th ed.). Thousand Oaks,
CA: SAGE Publications, Inc.
Zhang, K. Z. K., & Benyoucef, M. (2016). Consumer behavior in social commerce: A
literature review. Decision Support Systems, 86, 95-108.

240
Zhang, Y., & Wildemuth, B. M. (2009). Qualitative Analysis of Content. In: B. M.
Wildemuth, Applications of Social Research Methods to Questions in Information
and Library Science (308-319). Westport, CT: Libraries Unlimited.
Zwick, R. (2002). Fair game? The use of standardized admissions tests in higher
education. New York, NY: RoutledgeFalmer.