collective efficacy, deprivation and … · understanding criminal behaviour led to a waning...
TRANSCRIPT

© The Author 2013. Published by Oxford University Press on behalf of the Centre for Crime and Justice Studies (ISTD). All rights reserved. For permissions, please e-mail: [email protected]
COLLECTIVE EFFICACY, DEPRIVATION AND VIOLENCE IN LONDON
Alex Sutherland*, Ian Brunton-Smith and Jonathan Jackson
This paper examines the importance of neighbourhood context in explaining violence in London. Exploring in a new context Sampson’s work on the relationship between interdependent spatial patterns of concentrated disadvantage and crime, we assess whether collective efficacy (i.e. shared expectations about norms, values and goals, as well as the ability of members of the community to realize these goals) mediates any potential impact on violence of neighbourhood deprivation, resi-dential stability and population heterogeneity. Reporting findings from a data set based on face-to-face interviews of 60,000 individuals living in 4,700 London neighbourhoods, we find that collective efficacy is negatively related to police-recorded violence. But, unlike previous research, we find that collective efficacy does not mediate the statistical relationship between structural charac-teristics of the neighbourhood and violence. After finding that collective efficacy is unrelated to an alternative measure of neighbourhood violence, we discuss limitations and possible explanations for our results, before setting out plans for further research.
Keywords: collective efficacy, violence, social disorganization theory, social disadvantage
Introduction
Sampson’s (2012) recent book, Great American City: Chicago and the Enduring Neighborhood Effect, is a powerful restatement of the importance of place in social patterning and stratification. The argument is that ‘virtually all social life is interdependent in under-appreciated spatial forms—“things go together” in and across distinct places’ (Sampson 2012: 379). If analyses of social life and social conditions are to be complete, he reasons, they need to consider not only individual-level determinants, but place-level character-istics that can have causal effects which are irreducible to individual phenomena.
One aspect of Sampson’s work that has generated enduring interest across the social sciences is his investigation of the spatial patterning of violence across Chicago. In a series of papers (Sampson et al.1997; 1999; 2002), which that have since been built upon through a number of re-analyses of the same data (e.g. Browning et al. 2004), he has shown that neighbourhoods characterized by deprived social and economic condi-tions are limited in their ability to control or supervise behaviour (primarily that of young people). He also shows that the statistical effects of concentrated disadvantage, residential stability and population heterogeneity on violence (and perceived violence) are partly mediated by ‘collective efficacy’, namely shared values and shared propensi-ties for action. First, particular patterns of social and economic life shape the extent to which neighbourhoods develop shared dispositions to feel and act, fostering social control and cohesion. Second, significant variation in these shared propensities to act on behalf of the collective good, which is then related to levels of violence, as well
* Dr Alex Sutherland, Institute of Criminology, Sidgwick Site, Cambridge, CB3 9DA, UK; [email protected]; Ian Brunton-Smith, University of Surrey; Jonathan Jackson, London School of Economics.
doi:10.1093/bjc/azt050 BRIT. J. CRIMINOL
Page 1 of 25
British Journal of Criminology Advance Access published August 22, 2013 by guest on Septem
ber 11, 2013http://bjc.oxfordjournals.org/
Dow
nloaded from

as people’s perceptions of violence in their locality. Aspects of this framework have since been explored in a variety of cities, including Belo Horizonte, Brazil (Villarreal and Silva 2006); Brisbane, Australia (Mazerolle et al. 2010); Cologne and Freiberg, Germany (Oberwittler 2001, 2007); Indianapolis, Rochester, Tampa-St Petersburg, and St Louis, USA (Veléz 2001); Medellín, Colombia (Cerdá et al. 2012); Mesa, USA (Armstrong et al. 2010); Stockholm, Sweden (Sampson and Wikström 2008); Tianjin, China (Zhang et al. 2007), as well as nationally in Britain (Sampson and Groves 1989; Lowenkamp et al. 2003; Odgers et al. 2009).
The two central questions driving this paper are ‘What are the individual and struc-tural determinants of collective efficacy in London?’ and ‘Does collective efficacy have the same relationship to social disadvantage and crime as in other cities?’. We proceed as follows. After a brief review of the theoretical background to the paper, we discuss the research setting and outline the various sources of data used. Following a discus-sion of a series of multilevel statistical models that examine the correlates of collective efficacy, we then present results from a series of ecological models that examine the area-level relationship between structural disadvantage, collective efficacy and crime. Fitted models are discussed and limitations of the study are reviewed, before closing with a discussion on areas for further development.
This paper adds to the criminological literature on the spatial patterning of vio-lent literature by examining whether Sampson’s model of social and spatial context is ‘portable’ to the United Kingdom’s capital city, London. Investigating the link between structural characteristics of place (the social and economic conditions that vary across neighbourhood) and violence, and examining whether collective efficacy acts as a sta-tistical mediator between structural characteristics of the neighbourhood and violence, our empirical strategy (1) uses small-area geographical units, (2) has independent measures of neighbourhood quality and (3) combines both survey and routinely col-lected administrative data to create a unique and powerful data set.
Social Disorganization Theory
Although it has a long and distinguished history, starting with Park and Burgess (1924), Thrasher (1927) and Shaw and McKay (1942), the rise of psychological approaches to understanding criminal behaviour led to a waning interest in social disorganization until the late twentieth century (Bursik 1988). William J. Wilson’s (1987) US work is widely credited as the spark for a resurgent interest in understanding the influence of ‘context’ amongst academic criminologists, social commentators and the public alike, with MacLeod (1987) writing in a similar vein.
In parallel, the work of Robert J. Sampson and colleagues (inter alia Sampson 1987; Sampson and Groves 1989; Sampson et al.1997; 1999; 2002), as well as the review by Bursik (1988) brought social disorganization theory—and ecological theories more broadly—back to the forefront of sociological and criminological thinking. A key argu-ment of Sampson and Groves (1989)—and a central motivation for their focus on social disorganization—was that Shaw and McKay’s arguments relating to concentrated dis-advantage, residential stability and population heterogeneity had been fundamentally misunderstood (Akers and Sellers 2009). Sampson and Groves (1989) argued that resi-dential instability (for example) should not be regarded as a direct cause of crime,
Sutherland et al
Page 2 of 25
by guest on September 11, 2013
http://bjc.oxfordjournals.org/D
ownloaded from

but as something which ‘fosters institutional disruption and weakened social controls’ (Sampson et al. 1997: 919).1 Similarly, it is through a lack of contact and the erosion of trust in neighbours that population heterogeneity causes criminal behaviour (Sampson et al. 2005).2 Population density (see Sampson 1987) is often assumed to capture the effect of rapid depopulation associated with deprived neighbourhoods in the United States and/or reduced opportunities for interpersonal crime to occur (Browning et al. 2004) and has been found to be negatively correlated with homicide (Morenoff et al. 2001). ‘Family disruption’ (lone parenthood) was also added by Sampson (1987) to an explanatory model of crime; this was thought to affect the ability of parents to super-vise their own children as well as their capacity to provide guardianship of the local community.
The concept proposed by Sampson and colleagues as a way of bridging these and other neighbourhood characteristics and crime is collective efficacy. Building on notions of trust, cohesion, self-efficacy, collective action and informal social control, collective efficacy has been defined as ‘social cohesion among neighbors combined with their willingness to intervene on behalf of the common good’ (Sampson et al. 1997: 918). To measure collective efficacy, study participants are asked about the extent to which indi-viduals in a neighbourhood share values, trust one another and are willing to intervene if they see anti-social or criminal acts occurring. These measures have been success-fully combined into a single, reliable and valid scale at the neighbourhood level via the development of ‘ecometrics’ (see Raudenbush and Sampson 1999; but see Oberwittler 2001), where higher scores mean a more homogenous neighbourhood in terms of trust, values favouring law-abidance and acting for the collective good (what might be termed ‘pro-social collective efficacy’).3 To summarize the results from Chicago, collective effi-cacy has been found to have a strong negative relationship with crime, in particular vio-lence (Sampson et al. 1997; Sampson and Raudenbush 1999; Morenoff et al. 2001), and to mediate the relationship between deprivation, unemployment, ethnic heterogeneity and violent crime (Sampson et al. 1997). In essence, the extent of collective efficacy in a neighbourhood seems to act to dissuade or promote criminal acts by those with greater propensity for crime or who are particularly susceptible to contextual cues.
Of particular relevance to our present study of collective efficacy in London is Sampson’s (2006: 162) argument that ‘application of neighborhood studies to other societal contexts is badly needed if we are to make further progress in understanding the generalizability of the link between community social mechanisms and crime rates’. Many of the papers which test the crime–collective efficacy relationship within the United States use the same Chicago data set collected by Sampson and colleagues (e.g. Morenoff et al. 2001; Browning et al. 2004; Silver and Miller 2004; Kirk and Matsuda 2011; Kirk and Papachristos 2011; Gibson 2012). There is a growing body of independ-ent studies that often use the same as or similar measures to Sampson et al. (1997) reporting results akin to those in Chicago (Zhang et al. 2007; Sampson and Wikström
1 Hipp et al. (2009) found that violent crime increased residential instability (particularly in areas with high diversity), but not vice versa. To that end, violent crime, residential instability and population heterogeneity are linked together in a complex ‘spiral of decline’ (Hipp et al. 2009; see also Harding 2008; Kirk and Laub 2010: 42–8).
2 Sampson (2008) argues that increased heterogeneity will actually reduce disorder.3 Reflecting discussions on the strategic and conditional nature of trust, Sampson (2004) makes clear that, as with self-
efficacy, collective efficacy is task-specific in nature, hence the focused nature of the questions asked.
COLLECTIVE EFFICACY, DEPRIVATION AND VIOLENCE IN LONDON
Page 3 of 25
by guest on September 11, 2013
http://bjc.oxfordjournals.org/D
ownloaded from
2008; Oberwittler and Wikström 2009; Odgers et al. 2009; Armstrong et al. 2010; Mazerolle et al. 2010) (for a list of studies which examine collective efficacy and crime, see Appendix A). That said, there have been some contrary results in other contexts (e.g. Villarreal and Silva 2006; Cerdá et al. 2008; Kingston et al. 2009;) and, although a recent meta-analysis by Pratt and Cullen (2005) found that collective efficacy appeared to be an important concept in the understanding of crime (ranked fourth overall), the ‘failsafe n’ for this result was 13.4
Our central task in this paper is to assess whether results on collective efficacy gen-eralize to London. Building on other research in this field, we explore the relationship between collective efficacy and violent crime rates in over 4,600 London neighbour-hoods. We first examine whether certain structural characteristics predict area-level recoded rates of violence, before then assessing whether collective efficacy mediates any of the statistical effects, and checking whether these structural characteristics pre-dict collective efficacy.
Research Setting
London is the capital of the United Kingdom, and is one of the largest urban zones in the EU. As of the 2011 Census, it had an estimated population of 8,173,900 (ONS 2012a), although the boundaries and population estimates vary, with the ‘Greater London urban area’ having a population of 8,278,251 in 2001 (ONS 2001). Between 2001 and 2009, London’s population increased by over 430,000 people (ONS 2011). This is a highly diverse city. Department for Education data show that over 45 per cent of state-funded primary school children have English as a second language. Furthermore, there are 41 different national groups—those born outside the United Kingdom—with more than 10,000 members (ONS 2001), with an estimated 300 languages spoken in state schools (von Ahn et al. 2010). In terms of how the ethnic mix of the city has changed over time, figures from the Office for National Statistics (ONS 2012b) suggest that, between 2001 and 2011, the overall proportion of white inhabitants has dropped by more than percentage points, whereas there have been increases in the number of Asian and Chinese residents; but there is substantial ethnic clustering across the city. Administratively, London consists of the Greater London Authority (GLA), the 32 boroughs and the City of London. Boroughs are themselves divided into 624 elec-toral wards, which form the basic unit of administrative geography in England. Below this, electoral wards are further subdivided into 4,766 Lower-layer Super Output Areas (LSOAs).
Deprivation and inequality
The 2010 Index of Multiple Deprivation, developed by Noble et al. (2004), shows parts of London are consistently ranked amongst the most deprived in England on some measures (such as income deprivation), as well as being the least deprived on other
4 Meaning that only 13 ‘no effect’ studies are required to shift the overall p -value reported in the meta-analysis above the 5 per cent significance level.
Sutherland et al
Page 4 of 25
by guest on September 11, 2013
http://bjc.oxfordjournals.org/D
ownloaded from

measures (such as education, training and skills). Generally, the highest concentra-tions of deprivation are in the east, north and north-west of the city, mainly in the boroughs of Brent, Hackney, Islington, Newham and Tower Hamlets. Specifically, the three electoral wards with the highest levels of income deprivation in England are in the London boroughs of Tower Hamlets, Newham and Hackney, and nearly one in three children in London lives in poverty (GLA Intelligence Unit 2011). This masks significant variation within the city. For example, there is a 40 percentage point dif-ference in the proportion of children in poverty in Hackney (poorest) compared to Richmond (one of the richest). In relation to measures of the lived environment and housing, London is also highly deprived (see Leeser 2011). London has also amongst the highest income inequality in Europe, with Inner London being the most unequal region in the whole of England having roughly 28 per cent of individuals in both the top and bottom fifths of the income distribution (The Poverty Site 2011). This divi-sion is mirrored in boroughs themselves, with some of the most deprived boroughs containing a mixture of wealthy and very deprived wards (GLA 2002; London’s Poverty Profile 2011).
Crime trends in London
Table 1 details the crime rate per 1,000 head of population for a range of offences. As with the rest of England and Wales, crime in London has been declining over the past decade (with the exception being drugs offences, which have increased by 63 per cent in the same period). As with deprivation, these figures mask considerable variation within the city itself. Despite these general reductions in crime, London still stands apart from the rest of England and Wales in the amounts of crime experienced, with consistently higher rates of crime identified over the same period (see e.g. Flatley et al. 2010).
Data
Our data come from a range of sources, combining the Metropolitan Police Public Attitudes Survey (METPAS) collected between 2007 and 2010; the 2001 Census; reported violent crime data in 2010–11 provided by the Metropolitan Police; data from the London Ambulance Service on callouts for knife injuries in 2010–11 provided by
Table 1 Crime rates per 1,000 head of population in London 2002/03–2010/11
Crime type 02/03 03/04 04/05 05/06 06/07 07/08 08/09 09/10 10/11
Violence 25.00 25.34 27.36 26.58 24.29 23.02 23.12 22.82 21.43Sexual offences 1.00 1.39 1.47 1.39 1.24 1.16 1.16 1.30 1.32Robbery 6.00 5.53 5.29 6.11 6.10 4.93 4.31 4.37 4.63Burglary 16.00 14.34 13.75 13.95 12.88 12.51 12.39 12.12 12.06Criminal damage 20.00 20.07 18.39 16.49 15.17 13.66 12.62 11.53 10.38Drugs offences 5.00 6.01 5.92 7.09 7.19 9.50 10.04 8.73 8.18
Sources: GLA and MPS, http://data.london.gov.uk/visualisations/atlas/crime-pfa-annual/atlas.html; http://maps.met.police.uk/.
COLLECTIVE EFFICACY, DEPRIVATION AND VIOLENCE IN LONDON
Page 5 of 25
by guest on September 11, 2013
http://bjc.oxfordjournals.org/D
ownloaded from

the GLA; and the Index of Multiple Deprivation (IMD) (Noble et al. 2004). METPAS ran between 1983 and 2012, and was a representative face-to-face survey of residents of London aged 15 and over, covering a range of topics including public percep-tions of the criminal justice system, victimization and contact with the police. We use METPAS data from 2007 to 2010. METPAS used a multistage clustered design, with a total of 267 residents randomly drawn from the Postcode Address File within each of London’s 32 boroughs each quarter.5 This yielded a total achieved sample of 61,436 and an average response rate of 60 per cent across all boroughs (CELLO mruk research 2009).
Defining ‘neighbourhoods’
Selecting suitable boundaries to represent neighbourhoods has been a longstand-ing challenge for neighbourhood effects research, with many studies forced to use spatial units that bear little resemblance to residents’ own conceptions of their local neighbourhood (Sampson 2011). In the United Kingdom, this has meant studies rely-ing on postcode sectors, electoral wards (e.g. Sampson and Groves 1989) and other administrative boundaries—area geographies that can vary considerably in size and social composition. Larger areas increase internal heterogeneity and make it difficult to identify differences between areas, masking important social processes that operate within smaller geographical areas. Here, we use LSOAs to represent neighbourhoods. These consist of between four and six census enumeration Output Areas (OAs), cov-ering roughly 600 households with around 1,500 people on average. Households are grouped together based on spatial proximity, natural boundaries and homogeneity of dwelling type and tenure but, unlike electoral wards, are not subject to boundary changes. LSOAs are substantially smaller and more internally homogenous than the area geographies that have been relied upon by many previous studies, enhancing our ability to uncover evidence of neighbourhood processes operating within local com-munities. Data are available from a total of 4,761 LSOAs in London (99.9 per cent), with an average of 12 respondents per area.6
We are mindful that METPAS survey respondents were asked questions relating to their ‘local area and community’, where ‘local area’ is defined as ‘the area within about 15 minutes’ walk of here’. Leaving aside the division between ‘neighbourhood’ and ‘community’ (see Kirk and Laub 2010), this means there will be inherent variability in the areas people are thinking about when answering questions about ‘neighbour-hood’. For a healthy adult, a 15-minute walk could mean up to a mile (1.6 km) radius from their house depending on street layout and speed of walking; for someone who was infirmed, this would be a much shorter distance. We also know that this will vary by age. Previous research has shown that, for instance, most of the activities of children take place within 800 m of their home (Jones et al. 2009) but that adolescents move around a great deal more (Wikström et al. 2010) and thus what they define as their
5 The City of London is not included in the sample frame because it is covered by a separate police force.6 Twelve may seem like a small number of people to reliably report neighbourhood characteristics, but other studies (e.g. Hipp
2007; Oberwittler and Wikström 2009) as well as methodological texts in this area (e.g. Snijders and Bosker 2012) demonstrate that this number would allow adequate estimates of neighbourhood averages.
Sutherland et al
Page 6 of 25
by guest on September 11, 2013
http://bjc.oxfordjournals.org/D
ownloaded from

neighbourhood might not match well with administrative boundaries. However, there is other research which demonstrates an overlap between ‘artificial’ neighbourhoods such as OAs or LSOAs, neighbourhoods as subjectively defined by ‘experts’ (such as town planners) and residents’ own perceptions of their ‘neighbourhood’ (see Haynes et al. 2007). One important aspect of how residents sort ‘their’ neighbourhood from others is by housing type (e.g. detached, terraced, etc.), as this is a more visible marker than ‘deprivation’. Furthermore, it was noted that typically ‘[w]hen asked about their neighbourhood, respondents appeared to be describing the conditions within a very small distance from their home’ (Haynes et al. 2007: 824), in keeping with more recent theoretical and empirical research on the ecology of crime, this suggests that ‘smaller is better’ (Oberwittler and Wikström 2009). Given that LSOAs are constructed to capture homogeneity of housing type (amongst other elements), it seems reasonable to assume that they are capturing the lived reality of local residents’ neighbourhood. Henceforth, the terms ‘LSOA’ and ‘neighbourhood’ are used interchangeably.
Violent crime
Two measures of violence are used here. The first uses police-recorded counts of violent crimes7 occurring within the local area and the other is counts of ambulance callouts for injuries relating to knife crime. We incorporate these measures as the rate per 1,000 head of population of ‘violence against the person’ within each LSOA. The recorded crime measures are capped at 150 offences per 1,000 head of population to mitigate the impact of a small subset of LSOAs with particularly high crime rates. The recorded crime data are highly skewed so, unless otherwise stated, we use the natural logarithm of the recorded violent crime rate per 1,000 head of population.
Collective efficacy
To measure collective efficacy, we adopt a similar approach to Sampson et al. (1997), combining a series of questions covering social cohesion and informal social control. Individuals were asked to report on five-point Likert scales the extent to which they agreed with six statements, from ‘strongly agree’ (1) to ‘strongly disagree’ (5) (see Appendix B for details of questions used here and in a sample of other studies). All items were reverse coded so that higher scores represented greater pro-social efficacy (i.e. high trust, high social control), with the six items combined using principle compo-nents analysis (PCA) to produce a ‘collective efficacy’ score for each individual. These were then aggregated to the neighbourhood level.
Neighbourhood crime in 2001
We include a compound measure of all neighbourhood crime in 2001 from the IMD because residents who live in high-crime neighbourhoods might be unwilling to inter-vene and this might confound the collective efficacy/violence relationship.
7 Murder, wounding (with and without intent), common assault and public (dis)order offences.
COLLECTIVE EFFICACY, DEPRIVATION AND VIOLENCE IN LONDON
Page 7 of 25
by guest on September 11, 2013
http://bjc.oxfordjournals.org/D
ownloaded from

Neighbourhood social composition
To capture the social composition of each neighbourhood, we used data from the 2001 census of England and Wales and the neighbourhood statistics division of the ONS. This has the advantage of being independent of the METPAS survey data, whilst also allowing for temporal sequencing. Using data for all LSOAs in England and Wales (n = 32,478), variables covering unemployment, occupations, population structure, car ownership, housing, occupancy details and tenure, in- and out-migration, income sup-port and the amount of land classified as domestic, non-domestic and green space were combined using PCA with an orthogonal rotation to produce a series of indicators of neighbourhood difference (see Appendix C).8 The component structure is similar to previous studies (Sampson et al. 1997; Sampson and Raudenbush 1999; Morenoff et al. 2001), broadly capturing the levels of neighbourhood socio-economic disadvantage, population mobility and urbanicity, along with details of the area housing structure and age profile (with the final factor a reflection of both the proportion of children (<18) and the proportion of elderly residents). A measure of population density was also included, along with a measure of the adult-to-child ratio to capture elements of informal monitoring. Finally, we include a measure of the extent of ethnic diversity in the local area, based on the Herfindahl concentration formula (Gibbs and Martin 1962).9 This details the probability (ranging between 0 and 1) of two randomly selected individuals from the same area being of different ethnic origin, with higher scores representing more ethnically heterogeneous neighbourhoods. A table of descriptive statistics for all measures is given in Appendix D.
Analytic Strategy
To examine the relationship between collective efficacy, neighbourhood social com-position and violent crime, we specify a number of analytical models. First, we use multilevel linear regression models to examine the extent that individual perceptions of collective efficacy are shaped by the neighbourhood social composition, over and above the characteristics of the individual sample members. This informs us whether systematic differences in collective efficacy exist between local areas, over and above so-called ‘composition effects’. We then examine the aggregate relationships between neighbourhood characteristics, collective efficacy and crime by estimating a series of contextual regression models on the 4,761 neighbourhoods in London. In the first step, we present simple correlations between the aggregate measures. Second, we run a series of linear regression models using social composition factors as covariates, with the logged rate of violence per 1,000 head of population as the outcome. Third, we include our neighbourhood collective efficacy measure to give an estimate of the
8 We also explored an oblique rotation. This produced the same factor structure and was substantively the same, so we prefer to use the simpler orthogonal rotation results.
9 The diversity index is defined as
HI i
i
n
= −=∑1 2
1
s , [1]
where si is the share of ethnic group i out of a total of n ethnic groups (White, Black, Asian, Mixed, Other).
Sutherland et al
Page 8 of 25
by guest on September 11, 2013
http://bjc.oxfordjournals.org/D
ownloaded from

association between efficacy and violent crime, net of compositional factors. Finally, we run Poisson models using ambulance callouts as the dependent variable as validation of the Ordinary Least Squares (OLS) models. Our interest is in exploring whether effi-cacy is still associated with violence net of compositional characteristics and the extent to which efficacy mediates the relationship between measures of disadvantage.10 All analyses were undertaken using Stata 12.
Results
Correlates of collective efficacy in London
We begin by reporting the results from a series of multilevel models where individual assessments of collective efficacy are the outcome (Table 2). Model 1 partitions the variation in our measure of efficacy between individuals and local neighbourhoods. This reveals that approximately 9 per cent of the variation in levels of efficacy occurs between neighbourhoods lending support to the contention that efficacy is not simply an attribute of individuals, but may also have a collective/shared component. Model 2 incorporates individual predictors of efficacy, with all covariates operating in the expected direction given previous research. Higher levels of individual efficacy are evi-dent amongst older residents and people identified as having a higher socio-economic status. Those working full time and residents of owner-occupied accommodation also report higher levels of efficacy, as do longer-term residents of the local area (those liv-ing in an area for five or more years). Non-white ethnic groups also generally report higher collective efficacy, which is in keeping with research from the United States (Hipp 2010). Adding in the measures of the social composition of local neighbour-hoods, a mixed picture is evident (Model 3). In keeping with previous findings, resi-dents of more deprived areas and neighbourhoods with a higher density of terraced accommodation report lower efficacy than similar individuals living in more affluent local areas. We also find that average levels of efficacy are lower in more urban neigh-bourhoods, but higher in areas with an older age structure.
Unlike many studies which characterize ethnically diverse neighbourhoods in terms of segregation, distrust and low levels of cohesion (e.g. Alesina and La Ferrera 2000; Goodhart 2004; Putnam 2007), we find that levels of efficacy are higher in more ethni-cally diverse neighbourhoods. This might be due to the fact that there is greater ethnic
10 We fit simple OLS and Poisson models for the aggregate analyses and multilevel linear models for individual collective efficacy and calculating aggregate measures. Multilevel models are an extension to standard regression methods that enable us to account properly for the non-independence between residents living within the same local area, and to model heterogeneity in levels of perceived efficacy between neighbourhoods as a function of social composition (for detailed coverage of multilevel modelling, see Snijders and Bosker (2012)). Here, we use a linear multilevel model, denoted in Equation 2:
Y X W X W uij ij j ij j j= + + + +β β α α0 1 1 2 . [2]
Here, Yij is the perceived collective efficacy in the local area for the ith individual in the jth neighbourhood. β0 is the intercept and β1 is the regression coefficient for individual i in neighbourhood j for the individual-level covariate X. α1 is the regression coefficient for the area-level coefficient W in area j, and α2 is a cross-level interaction between individual covariate X and area covariate W. In the random part of the model, uj are neighbourhood departures from the overall level of collective efficacy. To account for the possibility that perceptions of collective efficacy vary systematically within local areas as a function of a person’s socio-demographic background, a vector of individual-level controls is included covering gender, age, ethnicity, social class, employment status and length of residence. As a result, the neighbourhood departures can be thought of as a sample adjusted estimate of the differences in levels of perceived collective efficacy by local residents across neighbourhoods.
COLLECTIVE EFFICACY, DEPRIVATION AND VIOLENCE IN LONDON
Page 9 of 25
by guest on September 11, 2013
http://bjc.oxfordjournals.org/D
ownloaded from

mixing in London, with Londoners more likely to experience meaningful social con-tact with people from other ethnicities (Hewstone 2009). We also identify marginally higher levels of 2007–10 efficacy in neighbourhoods characterized by greater levels of migration in the previous year (2000–01).
Contextual analyses of violence in London
Next, we use the aggregated measures of collective efficacy in 2007–10 along with 2001 census neighbourhood data to predict two outcomes: (the natural log of)
Table 2 Individual and neighbourhood correlates of individual perceptions of collective efficacy (multilevel linear models)
Model 1 Model 2 Model 3
Coeff. SE p Coeff. SE p Coeff. SE p
Female –0.001 0.009 0.915 0.000 0.009 0.974Age 0.018 0.003 0.000 0.017 0.003 0.000Living as marrieda –0.078 0.016 0.000 –0.078 0.016 0.000Single –0.103 0.013 0.000 –0.106 0.013 0.000Widowed –0.053 0.018 0.003 –0.053 0.018 0.003Divorced –0.219 0.023 0.000 –0.224 0.023 0.000Separated –0.190 0.028 0.000 –0.186 0.028 0.000Mixedb 0.063 0.017 0.000 0.057 0.017 0.001Asian 0.150 0.014 0.000 0.147 0.014 0.000Black 0.140 0.014 0.000 0.145 0.014 0.000Other 0.000 0.046 0.995 –0.010 0.046 0.8225+ year resident 0.101 0.010 0.000 0.100 0.010 0.000Rentedc –0.132 0.010 0.000 –0.142 0.011 0.000Other tenure –0.072 0.034 0.037 –0.084 0.034 0.014Working FTd 0.085 0.010 0.000 0.084 0.010 0.000Class C1e –0.046 0.014 0.001 –0.043 0.014 0.002Class C2 –0.089 0.015 0.000 –0.092 0.015 0.000Class D –0.109 0.020 0.000 –0.100 0.020 0.000Class E –0.043 0.018 0.016 –0.038 0.018 0.033NH: Concentrated disadvantage –0.126 0.010 0.000NH: Population mobility 0.013 0.010 0.185NH: Urbanicity –0.041 0.007 0.000NH: Age structure 0.029 0.007 0.000NH: Adult: child ratiof 0.026 0.008 0.001NH: Housing structure –0.100 0.009 0.000NH: Ethnic diversity (1 = diverse)f 0.277 0.044 0.000NH: IMD crime –0.001 0.007 0.856Intercept 0.010 0.007 0.124 –0.059 0.027 0.030 –0.257 0.045 0.000Random effects (sd)Between 0.322 0.006 0.304 0.006 0.279 0.006Within 0.943 0.003 0.923 0.003 0.923 0.003Rho 10.4% 0.004 9.8% 0.004 8.3% 0.003N individual/N group
49,560/ 4,748
47,308/ 4,748
47,299/ 4,746
All neighbourhood independent variables are from the 2001 Census. Individual data and outcome come from METPAS 2007–2010. Additional controls for the quarter the survey took place in were also included to account for seasonality (not shown). a Reference group is married. b Reference group is white. c Reference group is ‘owner occupier’ (outright or with a mortgage). d Reference group is other employment status. e Reference group is Classes A and B. f Unstandardized measure.
Sutherland et al
Page 10 of 25
by guest on September 11, 2013
http://bjc.oxfordjournals.org/D
ownloaded from

recorded violent crimes 2010–11, and ambulance callouts for knife crime injuries 2009–11. Both measures are averaged over time and expressed as rates per 1,000 head of population. Table 3 includes estimates from two models with the logged rate of violent crime in the neighbourhood as the outcome. This shows that neighbour-hood crime rates are closely related to the structure of the neighbourhood, with the included neighbourhood characteristics explaining nearly 60 per cent of the varia-tion in crime rates. As in previous research, we find that crime rates are higher in more socio-economically disadvantaged neighbourhoods, areas experiencing greater population mobility, areas with a greater proportion of terraced accommodation and flats and more ethnically diverse neighbourhoods. We also find evidence of enduring patterns of crime over time, with a strong relationship between the levels of crime in 2001 and the violent crime rates in 2010. One puzzling result was for the ‘Age structure’ factor (which combines the proportion of children and the proportion of elderly residents within a neighbourhood)—the higher this was, the lower the level of recorded violence. Given the time lag of roughly nine years, it is difficult to imagine why having a more youthful population in 2001 would result in lower recorded vio-lence in 2010–11, unless this is acting as a proxy for the proportion of young families in a given area during that decade.
Coming back to the central focus of the paper and again in keeping with other research in this area, we identify a negative association between collective efficacy and levels of crime (b –0.019, se 0.007, p ≤ 0.01). However, unlike previous research, this is considerably weaker than the other neighbourhood effects, equating to a fall of only 1.9 per cent of violent crimes per 1,000 head of population for every one standard deviation increase in collective efficacy. Interestingly, the inclusion of col-lective efficacy also only has a marginal mediation effect. The magnitude of effect for socio-economic disadvantage drops slightly when collective efficacy is included,
Table 3 OLS regression models for neighbourhood correlates of (log) recorded violence rate per 1,000 (2010–11 combined)
MPS 2010–11 Model 1 Model 2
Coeff. SE p Coeff. SE p
FactorConcentrated disadvantage 0.485 0.012 0.000 0.479 0.012 0.000Population mobility 0.364 0.011 0.000 0.363 0.011 0.000Urbanicity –0.049 0.008 0.000 –0.052 0.008 0.000Age structure –0.083 0.008 0.000 –0.082 0.008 0.000Housing structure 0.295 0.011 0.000 0.291 0.011 0.000Ethnic diversitya 0.458 0.051 0.000 0.478 0.052 0.000Adult:child ratioa –0.060 0.009 0.000 –0.059 0.009 0.000IMD crime 0.143 0.008 0.000 0.143 0.008 0.000Collective efficacy –0.019 0.007 0.008Intercept 2.881 0.044 0.000 2.868 0.044 0.000N 4,759 4,746R2 x 100 58.5 58.5
a Both the diversity index and the adult-to-child ratio are unstandardized measures. Disadvantage, mobility, urbanicity, ‘youthfulness’, housing structure, ethnic diversity and adult:child ratio all measured during 2001 census. Collective efficacy measured in 2007–10 with METPAS data.
COLLECTIVE EFFICACY, DEPRIVATION AND VIOLENCE IN LONDON
Page 11 of 25
by guest on September 11, 2013
http://bjc.oxfordjournals.org/D
ownloaded from
but very few other changes to the model are evident. This is unlike results from, for example, Chicago and Stockholm, where the coefficient for disadvantage is cut in half once collective efficacy is added (Sampson and Wikström 2008: 113). It is worth noting that, in addition to finding theoretically relevant relationships, the models do a good job of explaining variation at the neighbourhood level, again similar to results from elsewhere. In summary, whilst collective efficacy is negatively related to violent crime in London, it is only weakly so. Further, collective efficacy does not appear to mediate the relationship between measures of social disadvantage and crime as it does elsewhere.
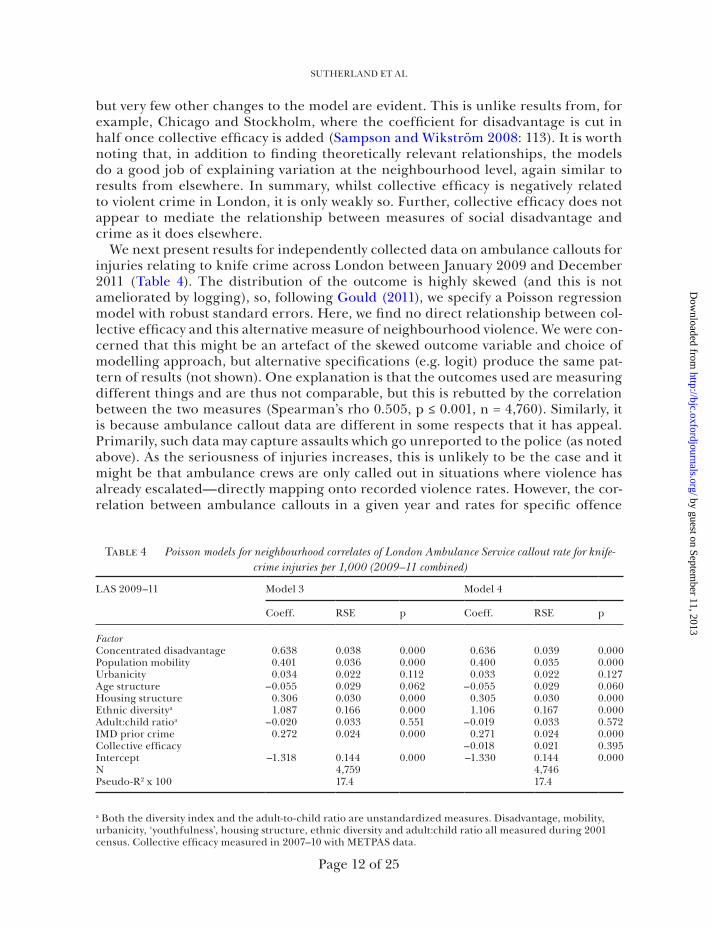
We next present results for independently collected data on ambulance callouts for injuries relating to knife crime across London between January 2009 and December 2011 (Table 4). The distribution of the outcome is highly skewed (and this is not ameliorated by logging), so, following Gould (2011), we specify a Poisson regression model with robust standard errors. Here, we find no direct relationship between col-lective efficacy and this alternative measure of neighbourhood violence. We were con-cerned that this might be an artefact of the skewed outcome variable and choice of modelling approach, but alternative specifications (e.g. logit) produce the same pat-tern of results (not shown). One explanation is that the outcomes used are measuring different things and are thus not comparable, but this is rebutted by the correlation between the two measures (Spearman’s rho 0.505, p ≤ 0.001, n = 4,760). Similarly, it is because ambulance callout data are different in some respects that it has appeal. Primarily, such data may capture assaults which go unreported to the police (as noted above). As the seriousness of injuries increases, this is unlikely to be the case and it might be that ambulance crews are only called out in situations where violence has already escalated—directly mapping onto recorded violence rates. However, the cor-relation between ambulance callouts in a given year and rates for specific offence
Table 4 Poisson models for neighbourhood correlates of London Ambulance Service callout rate for knife-crime injuries per 1,000 (2009–11 combined)
LAS 2009–11 Model 3 Model 4
Coeff. RSE p Coeff. RSE p
FactorConcentrated disadvantage 0.638 0.038 0.000 0.636 0.039 0.000Population mobility 0.401 0.036 0.000 0.400 0.035 0.000Urbanicity 0.034 0.022 0.112 0.033 0.022 0.127Age structure –0.055 0.029 0.062 –0.055 0.029 0.060Housing structure 0.306 0.030 0.000 0.305 0.030 0.000Ethnic diversitya 1.087 0.166 0.000 1.106 0.167 0.000Adult:child ratioa –0.020 0.033 0.551 –0.019 0.033 0.572IMD prior crime 0.272 0.024 0.000 0.271 0.024 0.000Collective efficacy –0.018 0.021 0.395Intercept –1.318 0.144 0.000 –1.330 0.144 0.000N 4,759 4,746Pseudo-R2 x 100 17.4 17.4
a Both the diversity index and the adult-to-child ratio are unstandardized measures. Disadvantage, mobility, urbanicity, ‘youthfulness’, housing structure, ethnic diversity and adult:child ratio all measured during 2001 census. Collective efficacy measured in 2007–10 with METPAS data.
Sutherland et al
Page 12 of 25
by guest on September 11, 2013
http://bjc.oxfordjournals.org/D
ownloaded from

types is only between 0.4 and 0.5 for assault and wounding, suggesting that, whilst there is some overlap between these measures, the ambulance data are capturing different aspects of violence in London. Finally, it might be that the nature of the act of calling an ambulance overlaps strongly with elements of collective efficacy (help-ing one’s neighbours, acting if trouble arises). However, if this were the case, then we would expect ambulance callouts to be highly correlated with collective efficacy, rather than conditionally orthogonal to it.
Discussion
This paper combines a unique, underutilized survey (although see Jackson et al. 2012) with administrative data to examine collective efficacy in London. The dataset arising from this work provides a diverse test-bed. Using small-area geographies for over 4,600 neighbourhoods, we found that the correlates of collective efficacy in London appear to be similar to, in many cases the same as, those reported elsewhere in the (mainly Western) world (e.g. Mazerolle et al. 2010). Concentrated disadvantage, the extent of ‘urbanicity’, the relationship for vacant properties/terraced housing were, for example, negatively related to collective efficacy.
Conversely, we found that ethnic heterogeneity in 2001 was positively associated with greater collective efficacy in 2007–10 (cf. Sturgis et al. 2013). At first, this seemed counterintuitive given results from elsewhere, but we believe that our measure of eth-nic diversity is capturing the effects of two related processes. First, although London’s population increased by an estimated 430,000 between 2001 and 2009 (ONS 2011), it is the rate of change that matters. Slow and steady in/out-migration would not result in wholesale destruction of personal networks and/or social control (Kirk and Laub 2010). However, rapid changes to demographics likely would. Second, as a function of in-migration to so-called ‘ethnic enclaves’ (Johnston et al. 2002), immigrants moving to London exist in pockets of social life rather unlike those around them—they may already have family and friends living nearby and are able to seamlessly move from one geographical context to the next with a great deal of continuity, fostering or maintain-ing higher levels of collective efficacy (for a detailed discussion of this issue, see Kirk and Laub (2010)). As such, we believe this measure of diversity captures some stability of residence and pre-existing network ties, hence the positive association with collective efficacy. Much has been made about influxes of poor residents to an area, but, as Van Wilsem et al. (2006) discuss, an influx of socio-economically advantaged groups could lead to disorganization because of the lack of commonality between the old and new residents. We also found that the ‘age structure’ of the neighbourhood was positively related to levels of collective efficacy, as was the ratio of adults to children. We believe these results might, in part or whole, reflect the proportion of families with young children living in a given area, but more research is needed in this area to unpick this relationship.
However, contrary to other research in both the United States and Europe, we did not find that collective efficacy mediated the relationship between disadvantage, resi-dential instability and recorded violent crime. Furthermore, collective efficacy was only weakly related to violent crime rates, and unrelated to an alternative measure of commu-nity violence (ambulance callouts for knife crime injuries). Some research has already
COLLECTIVE EFFICACY, DEPRIVATION AND VIOLENCE IN LONDON
Page 13 of 25
by guest on September 11, 2013
http://bjc.oxfordjournals.org/D
ownloaded from

pointed to the ‘limits of collective efficacy’ (Villarreal and Silva 2006; Cerdá et al. 2008; Maxwell et al. 2011) and these results contribute to that debate.
One area for criticism is our neglect of social and political institutions, specifically their role in ameliorating/propagating deprivation and/or crime. What exactly is meant by ‘institution’ appears to be open to interpretation with the current criminel du jour, banks (Veléz and Richardson 2012), being included alongside youth/com-munity organizations (Gardner and Brookes-Gunn 2009) and the police (Sampson and Bartusch 1998; Kubrin and Weitzer 2003a). It is important to remember that neighbourhoods do not exist in a political vacuum. But we do not think there is a convincing argument for claims such as ‘mortgage lending will directly affect local homicide much like other structural variables such as neighbourhood disadvantage’ (Veléz and Richardson 2012: 495, emphasis added) as it is more likely that the impact of the local political economy would be felt indirectly through, in this case, rates of homeownership and concomitant residential stability (see Kirk and Laub 2010: 44; Kirk and Hyra 2012).
We take more seriously the potential criticism in relation to the omission of commu-nity groups and the police, specifically the quality of police–public interactions. These again are elements that may have direct and/or indirect influences on the likelihood of violence occurring through a variety of mechanisms (see, e.g. Kubrin and Weitzer 2003b). We intend to investigate these further, particularly the role played by legal cyni-cism where agents of law enforcement are regarded as ‘illegitimate, unresponsive, and ill equipped to ensure public safety’ (Kirk and Matsuda 2011: 444, emphasis in original), as this would act to limit the legal options available to resolve disputes. With formal criminal justice avenues closed, settling disputes using violence would become more salient, thus increasing violence (and perhaps other crimes), as well as reducing the likelihood of cooperation with the police. Several papers have examined this (Sampson and Bartusch 1998; Sampson et al. 2005; Kirk and Papachristos 2011)—although each takes a slightly different view on how cynicism should be conceptualized and opera-tionalized. Nevertheless, Kirk and Matsuda (2011) demonstrate that high levels of legal cynicism at a neighbourhood level result in a lower likelihood of arrest for an individual after they have committed a crime, especially if that neighbourhood is predominantly black. They extend this by arguing that collective efficacy is the mediating mechanism between legal cynicism and the probability of arrest. In areas devoid of collective effi-cacy, the probability of arrest following a crime is almost zero, but increases as collective efficacy increases, net of neighbourhood legal cynicism. They also suggest that legal cynicism inhibits collective efficacy in environments with dense social ties. A neigh-bourhood with high collective efficacy and high levels of legal cynicism might result in more crimes occurring because of a belief that ‘the police can/will not act so we must protect ourselves’.11
Critics might also point out that a study in Chicago (1990–95) is very different from London (2001–11) and thus they are not comparable. Patterns of residential segregation are nowhere near as stark in London even now—one need only look at racial maps of the two cities to see this. Another reason for the different results might be the greater tem-poral lag in the present study. We have 2001 census data for LSOA characteristics, then
11 We may have seen examples of this during the 2011 London riots when ethnic minority businessmen and their relatives took to the streets with weapons in order to protect their businesses and neighbourhoods from rioters.
Sutherland et al
Page 14 of 25
by guest on September 11, 2013
http://bjc.oxfordjournals.org/D
ownloaded from

outcome data from 2007–10 and 2010–11. Changes may have occurred in some LSOA demographics between these time-points, but equally there will be a lot of stability in oth-ers. Given this, inter-temporal changes might part account for the relationships noted. But Sampson (2009a) demonstrates that neighbourhood characteristics are quite stable over time—something he has shown empirically within the United States (Sampson 2009b).
Conclusion
Going beyond neighbourhoods
The results from our models for collective efficacy appear to support the view that ‘smaller is better’ (Oberwittler and Wikström 2009). We found 9 per cent of variation in levels of collective efficacy occurred between neighbourhoods (as so defined) meaning that 91 per cent of variation occurs within them. This might help to explain the weak relationship between collective efficacy and violence: in essence, we may be operating at too high a level of aggregation. However, the work of Wikström et al. (2010; 2012) highlights that, no matter how small, focusing on geographical units has its limitations. To understand the relationship between environment and behaviour, we need to gain a better understand-ing of which people go where, when and with whom (kinds of people in kinds of places). The central reason for doing so is that ‘[p]eople react to the same set of local circumstances in different ways’ (Haynes et al. 2007: 823)—a view which is supported both theoretically and empirically (see Wikström et al. 2012). This type of work documenting time spent on activities has been undertaken in time-use studies (e.g. Gershuny and Sullivan 1998). However, Wikström et al. (2010; 2012) have developed a space–time–budget (STB) meth-odology which captures the what, where, when and with whom. Without such knowledge we may mistakenly believe that greater ethnic diversity equates to better social mixing. But it may be that groups lead ‘parallel lives’ (Burgess et al. 2005), where different ethnic groups exist in contiguous but non-overlapping daily routines, with little or no influ-ence on one another, operating with high levels of in-group/out-group bias. Similarly, although research (e.g. Haynes et al. 2007) demonstrates a good overlap between subjec-tive and artificial definitions of ‘neighbourhood’, these may still not capture where peo-ple go and what therefore influences their conceptions of place.
Collective efficacy and violence—is the cart before the horse?
We have ignored the issue of the precise causal (and likely cyclical) relationship between collective efficacy, concentrated deprivation, ‘disorder’ and violence. Sampson (2006: 157–9) alludes to this with some analyses from Chicago demonstrating that collective efficacy in 1995 was predictive of the level of deprivation five years later (r = 0.86; R2 = 0.75). It seems likely that present-day collective efficacy is a function of both past levels of violence and one or more of the factors comprising concentrated disadvantage. Skogan (1986: 207), for example, has argued that ‘the engine of neighborhood change is selective out-migration’. If, as Sampson (2006) suggests, current collective efficacy is a determinant of future economic success, then there is a serious endogeneity problem12 with research on collective efficacy
12 ‘Endogeneity refers to the fact that an independent variable included in the model is potentially a choice variable, corre-lated with unobservables relegated to the error term’ (Millimet 2001).
COLLECTIVE EFFICACY, DEPRIVATION AND VIOLENCE IN LONDON
Page 15 of 25
by guest on September 11, 2013
http://bjc.oxfordjournals.org/D
ownloaded from
which will only be resolved through strong theorizing and better data which incorporate changes within and between neighbourhoods over time (Kirk and Laub 2010) and using methods which focus on change (such as fixed-effects longitudinal models). The promise of such analyses is being able to disentangle some of the complexities within this field, as Hipp et al. (2009) appear to have done for residential instability and violence.
A final point which highlights the complexity with broadly defined ‘neighbourhood effects’ is the distinction drawn by Wikström and Sampson (2003) between neighbour-hoods as ‘contexts of action’ and ‘contexts of development’. In terms of the latter, there is good evidence that the collective efficacy of neighbourhoods influences the development of criminal propensity in adolescents, but neighbourhood collective efficacy is much less important than the collective efficacy of the family (see Wikström 2012). Returning to the former—neighbourhoods as ‘contexts of action’—it is unlikely that there are simple deter-ministic relationships between neighbourhood characteristics and criminal acts. As we note above, here, we are only dealing with one element of actions defined as crimes, so, in order to explain crime, ‘we must understand the complexity of crime as a type of behavior. Crime is, for analytic purposes, similar to a backache. Backaches will never be attributable to any single cause; neither will criminal acts’ (Brantingham and Brantingham 1993: 6).
AcknowledgementsBetsy Stanko (MPS) for access to METPAS data; Trevor Adams (MPS) for the LSOA violent crime data; Mat Ilic and Steve Forgan (GLA) for facilitating access to/provid-ing the London Ambulance Service data. Participants at the 2012 ESC conference in Bilbao (Spain) and the Leeds (England) RSS group meeting in January 2013.
References
Akers, R. L. and Sellers, C. S. (2009), Criminological Theories: Introduction, Evaluation, and Application, 5th edn. OUP.
Alesina, A. and La Ferrara, E. (2000), ‘Participation in Heterogeneous Communities’, Quarterly Journal of Economics, 115: 847–904.
Armstrong, T. A., Katz C. M. and Schnebly S. M. (2010), ‘The relationship between citizen perceptions of collective efficacy and neighbourhood violent crime’, Crime & Delinquency, xx: 1–22.
Brantingham, P. and Brantingham, P. (1993), ‘Nodes, Paths and Edges: Considerations on the Complexity of Crime and the Physical Environment’, Journal of Environmental Psychology, 13: 3–28.
Breetzke, G. D. (2010), ‘Modeling Violent Crime Rates: A Test of Social Disorganization in the City of Tshwane, South Africa’, Journal of Criminal Justice, 38: 446–52.
Browning, C. R. (2004), ‘The Span of Collective Efficacy: Extending Social Disorganization Theory to Partner Violence’, Journal of Marriage and Family, 64: 833–50.
Browning, C. R., Feinberg, S. L. and Dietz, R. D. (2004), ‘The Paradox of Social Organization: Networks, Collective Efficacy, and Violent Crime in Urban Neighbourhoods’, Social Forces, 83: 503–34.
Burgess, S., Wilson, D. and Lupton, R. (2005), ‘Parallel Lives? Ethnic Segregation in Schools and Neighbourhoods’, Urban Studies, 42: 1027–56.
Sutherland et al
Page 16 of 25
by guest on September 11, 2013
http://bjc.oxfordjournals.org/D
ownloaded from

Bursik, R. J. (1988), ‘Social Disorganization and Theories of Crime and Delinquency: Problems and Prospects’, Criminology, 26: 519–51.
CELLO mruk research (2009), Public Attitude Survey Technical Report (Q1 2009/10). CELLO mruk research.
Cerdá, M., Morenoff, J., Duque, L. F. and Buka, S. L. (2008), ‘The limits of collective efficacy: Investigating the influence of neighborhood context on levels of violence’, Paper presented at the American Sociological Association Annual Meeting, Boston, MA. Available online from. http://citation.allacademic.com/meta/p241636_index.html.
Cerdá, M., Morenoff, J. D., Hansen, B. B., Tessari Hicks, K. J., Duque, L. F., Restrepo, A. and Diez-Roux, A. V. (2012), ‘Reducing Violence by Transforming Neighborhoods: A Natural Experiment in Medellín, Colombia’, American Journal of Epidemiology, 175: 1045–53.
Flatley, J., Kershaw, C., Smith, K., Chaplin, R. and Moon, D. (2010), Crime in England and Wales 2009/10: Findings from the British Crime Survey and Police Recorded Crime, 3rd edn. Home Office Statistical Bulletin.
Gardner, M. and Brooks-Gunn, J. (2009), ‘Adolescents’ Exposure to Community Violence: Are Neighborhood Youth Organisations Protective?’, Journal of Community Psychology, 37: 505–25.
Gershuny, J. and Sullivan, O. (1998), ‘The Sociological Uses of Time-Use Diary Analysis’, European Sociological Review, 14: 69–85.
Gibbs, J. P. and Martin, W. T. (1962), ‘Urbanization, Technology, and the Division of Labor: International Patterns’, American Sociological Review, 27: 667–77.
Gibson, C. L. (2012), ‘An Investigation of Neighborhood Disadvantage, Low Self-Control, and Violent Victimization among Youth’, Youth Violence and Juvenile Justice, 10: 41–63.
GLA (2002), London Divided: Income Inequality and Poverty in the Capital. GLA.GLA Intelligence Unit (2011), Children in Poverty: Intelligence Update 14–2011. GLA.Goodhart, D. (2004), ‘Too Diverse?’, Prospect, February: 30–7.Gould, W. (2011), Use Poisson rather than Regress: Tell a Friend, The Stata Blog, available online
at http://blog.stata.com/2011/08/22/use-poisson-rather-than-regress-tell-a-friend/.Harding, D. J. (2008), ‘Neighborhood Violence and Adolescent Friendships’, International
Journal of Conflict and Violence, 2: 28–55.Haynes, R., Daras, K., Reading, R. and Jones, A. (2007), ‘Modifiable Neighbourhood
Units, Zone Design and Residents’ Perceptions’, Health & Place, 13: 812–25.Hewstone, M. (2009), ‘Living Apart, Living Together? The Role of Intergroup Contact in
Social Integration’, Proceedings of the British Academy, 162: 243–300.Hipp, J. (2010), ‘Assessing Crime as a Problem: The Relationship between Residents’
Perception of Crime and Official Crime Rates over 25 Years’, Crime & Delinquency, x: 1–33.
Hipp, J. R. (2007), ‘Block, Tract, and Levels of Aggregation: Neighborhood Structure and Crime and Disorder as a Case in Point’, American Sociological Review, 72: 659–80.
Hipp, J. R., Tita, G. E. and Greenbaum, R. T. (2009), ‘Drive-Bys and Trade-Ups: Examining the Directionality of the Crime and Residential Instability Relationship’, Social Forces, 87: 1777–812.
Jackson, J., Bradford, B., Stanko, E. A. and Hohl, K. (2012), Just Authority? Trust in the Police in England and Wales. Routledge.
Johnston, R., Forrest, J. and Poulsen, M. (2002), ‘Are There Ethnic Enclaves/Ghettos in English Cities?’, Urban Studies, 39: 591–618.
COLLECTIVE EFFICACY, DEPRIVATION AND VIOLENCE IN LONDON
Page 17 of 25
by guest on September 11, 2013
http://bjc.oxfordjournals.org/D
ownloaded from

Jones, A. P., Coombes, E. G., Griffin, S. J. and Van Sluijs, E. M. F. (2009), ‘Environmental Supportiveness for Physical Activity in English Schoolchildren: A Study Using Global Positioning Systems’, International Journal of Behavioral Nutrition and Physical Activity, 6: 42–50.
Kingston, B., Huizinga, D. and Elliott, D. S. (2009), ‘A Test of Social Disorganization Theory in High-Risk Urban Neighbourhoods’, Youth & Society, 41: 53–79.
Kirk, D. S. and Hyra, D. S. (2012), ‘Home Foreclosures and Community Crime: Causal or Spurious Association?’, Social Science Quarterly, 93: 648–70.
Kirk, D. S. and Laub, J. H. (2010), ‘Neighborhood Change and Crime in the Modern Metropolis’, Crime and Justice, 39: 441–502.
Kirk, D. S. and Matsuda, M. (2011), ‘Legal Cynicism, Collective Efficacy, and the Ecology of Arrest’, Criminology, 49: 443–72.
Kirk, D. S. and Papachristos, A. V. (2011), ‘Cultural Mechanisms and the Persistence of Neighbourhood Violence’, AJS, 116: 1190–233.
Kubrin, C. E. and Weitzer, R. (2003a), ‘New Directions in Social Disorganization Theory’, Journal of Research in Crime and Delinquency, 40: 374–402.
—— (2003b), ‘Retaliatory Homicide: Concentrated Disadvantage and Neighborhood Culture’, Social Problems, 50: 157–80.
Leeser, R. (2011), The English Indices of Deprivation 2010: A London Perspective. GLA.London’s Poverty Profile (2011), ‘Income Inequalities by Wards within London Boroughs’, avail-
able online at www.londonspovertyprofile.org.uk/indicators/topics/inequality/income- inequalities-within-london-boroughs/.
Lowenkamp, C. T., Cullen, F. T. and Pratt, T. C. (2003), ‘Replicating Sampson and Groves’s Test of Social Disorganization Theory: Revisiting a Criminological Classic’, Journal of Research in Crime and Delinquency, 40: 351–73.
MacLeod, J. (1987), Ain’t No Makin’ It: Leveled Aspirations in a Low-Income Neighborhood. Boulder, Westview Press.
Maxwell, C. D., Garner, J. H. and Skogan, W. G. (2011), Collective Efficacy and Criminal Behavior in Chicago, 1995–2004, final report submitted to the National Institute of Justice for grant no. 2008-IJ-CX-0013. US Department of Justice.
Mazerolle L. Wickes R. and McBroom J. (2010), ‘Community Variations in Violence: The Role of Social Ties and Collective Efficacy in Comparative Context’, Journal of Research in Crime and Delinquency, 47: 3–30.
Millimet, D. (2001), What Is the Difference between ‘Endogeneity’ and ‘Sample Selection Bias’?, Stata FAQs, available online at http://www.stata.com/support/faqs/statistics/endogeneity-versus-sample-selection-bias/.
Morenoff, J. D., Sampson, R. J. and Raudenbush, S. W. (2001), ‘Neighborhood Inequality, Collective Efficacy, and the Spatial Dynamics of Urban Violence’, Criminology, 39: 517–59.
Noble, M., Wright G., Dibben C., Smith G., McLennan D., Anttila C., Barnes H., Mokhtar C., Noble S., Gardner J., Covizzi I., Lloyd M. and Braswell S. (2004), English Indices of Deprivation 2004 (Summary). ODPM.
Oberwittler, D. (2001), Neighborhood Cohesion and Mistrust, Ecological Reliability and Structural Conditions, working papers of the project ‘Social Problems and Juvenile Delinquency in Ecological Perspective’. Max Planck Institute for Foreign and International Criminal Law.
——(2007), ‘The Effects of Neighbourhood Poverty on Adolescent Problem Behaviours: A Multi-Level Analysis Differentiated by Gender and Ethnicity’, Housing Studies, 22: 781–803.
Sutherland et al
Page 18 of 25
by guest on September 11, 2013
http://bjc.oxfordjournals.org/D
ownloaded from

Oberwittler, D. and Wikström, P.-O. H. (2009), ‘Why Small Is Better: Advancing the Study of the Role of Neighbourhood Contexts in Crime Causation’, in D. Weisburd, W. Bernasco and G. Bruinsma, eds, Putting Crime in Its Place: Units of Analysis in Spatial Crime Research, 35–59. Springer.
Odgers, C. L., Moffitt, T. E., Tach, L. M., Sampson, R. J., Taylor, A. and Matthews, C. L. (2009), ‘The Protective Effects of Neighbourhood Collective Efficacy on British Children Growing Up in Deprivation: A Developmental Analysis’, Developmental Psychology, 45: 942–57.
ONS (2001), ‘KS01 Usual Resident Population: Census 2001, Key Statistics for Urban Areas’, Office for National Statistics, archived from the original on 19 May 2011.
—— (2011), More about Areas: Further Areas, available online at www.neighbourhood.statis-tics.gov.uk/.
—— (2012a), 2011 Census, Population and Household Estimates for England and Wales, Table P04, released 16 July 2012.
—— (2012b), 2011 Census: Key Statistics for England and Wales, March 2011. ONS.Park, R. E. and Burgess, E. W. (1924), Introduction to the Science of Society. University of
Chicago Press.Pratt, T. C. and Cullen, F. T. (2005), ‘Assessing Macro-Level Predictors and Theories of
Crime: A Meta-Analysis’, Crime and Justice, 32: 373–450.Putnam, R. D. (2007), ‘E Pluribus Unum: Diversity and Community in the Twenty-
First Century: The 2006 Johan Skytte Prize Lecture’, Scandinavian Political Studies, 30: 137–74.
Rankin, B. H. and Quane, J. M. (2000), ‘Neighborhood Poverty and the Social Isolation of Inner-City African American Families’, Social Forces, 79: 139–64.
Raudenbush, S. W. and Sampson, R. J. (1999), ‘Ecometrics: Toward a Science of Assessing Ecological Settings, with Application to the Systematic Social Observation of Neighborhoods’, Sociological Methodology, 29: 1–41.
Sampson, R. J. (1987), ‘Urban Black Violence: The Effect of Male Joblessness and Family Disruption’, American Journal of Sociology, 93: 348–82.
—— (2004), ‘Networks and Neighbourhoods’, in H. McCarthy, P. Miller and P. Skidmore, eds, Network Logic: Who Governs in an Interconnected World? Demos.
—— (2006), ‘Collective Efficacy Theory: Lessons Learned and Directions for Future Inquiry’, in F. T. Cullen, J. P. Wright, and K. Blevins, eds, Taking Stock: The Status of Criminological Theory, Advances in Criminological Theory Vol. 15. Transaction Publishers.
—— (2008), ‘Rethinking Crime and Immigration’, Contexts, 7: 28–33.—— (2009a), ‘Disparity and Diversity in the Contemporary City: Social (Dis)Order
Revisited’, The British Journal of Sociology, 60: 1–31.—— (2009b), ‘Racial Stratification and the Durable Tangle of Neighborhood Inequality’,
Annals of the American Academy of Political and Social Science, 621: 260–80.—— (2011), ‘Neighborhood Effects, Causal Mechanisms, and the Social Structure of
the City’, in P. Demeulenaere, ed., Analytical Sociology and Social Mechanisms, 227–50. Cambridge University Press.
—— (2012), Great American City: Chicago and the Enduring Neighborhood Effect. University of Chicago Press.
Sampson, R. J. and Bartusch, D. J. (1998), ‘Legal Cynicism and (Subcultural?) Tolerance of Deviance: The Neighborhood Context of Racial Differences’, Law and Society Review, 32: 777–804.
COLLECTIVE EFFICACY, DEPRIVATION AND VIOLENCE IN LONDON
Page 19 of 25
by guest on September 11, 2013
http://bjc.oxfordjournals.org/D
ownloaded from
Sampson, R. J. and Groves, W. B. (1989), ‘Community Structure and Crime: Testing Social Disorganization Theory’, American Journal of Sociology, 94: 774–802.
Sampson, R. J. and Raudenbush, S. W. (1999), ‘Systematic Social Observation of Public Spaces: A New Look at Disorder in Urban Neighbourhoods’, American Journal of Sociology, 105: 603–51.
Sampson, R. J. and Wikström, P.-O. H. (2008), ‘The Social Order of Violence in Chicago and Stockholm Neighbourhoods: A Comparative Inquiry’, in S. N. Kalyva, I. Shapiro and T. Masoud, eds, Order, Conflict and Violence. CUP.
Sampson R. J., Morenoff, J. and Earls, F. (1999), ‘Beyond Social Capital: Spatial Dynamics of Collective Efficacy for Children’, American Sociological Review, 64: 633–60.
Sampson, R. J., Morenoff, J. D. and Gannon-Rowley, T. (2002), ‘Assessing Neighbourhood Effects: Social Processes and New Directions in Research’, Annual Review of Sociology, 28: 443–78.
Sampson, R. J., Morenoff, J. D. and Raudenbush, S. (2005), ‘Social Anatomy of Racial and Ethnic Disparities in Violence’, American Journal of Public Health, 95: 224–232.
Sampson, R. J., Raudenbush, S. W. and Earls, F. (1997), ‘Neighborhoods and Violent Crime: A Multilevel Study of Collective Efficacy’, Science, 277: 918–24.
Shaw, C. R. and McKay, H. D. (1942), Juvenile Delinquency in Urban Areas. University of Chicago Press.
Silver, E. and Miller, L. (2004), ‘Sources of Informal Social Control in Chicago Neighbourhoods’, Criminology, 42: 551–83.
Simons, R. L., Simons, L. G., Burt, C. H., Brody, G. H. and Cutrona, C. (2005), ‘Collective Efficacy, Parenting Practices, and Delinquency: A Longitudinal Test of a Model Integrating Community- and Family-Level Processes’, Criminology, 43: 989–1029.
Skogan, W. G. (1986), “Fear of Crime and Neighborhood Change.” In Communities and Crime, edited by Albert J. Reiss Jr. and Michael Tonry. Vol. 8 of Crime and Justice: A Review of Research, edited by Michael Tonry and Norval Morris. University of Chicago Press.
Snijders, T. and Bosker, R. (2012), Multilevel Analysis: An Introduction to Basic and Advanced Multilevel Modelling, 2nd edn. Sage.
Sturgis, P., Brunton-Smith, I., Jackson, J. and Kuha, J. (2013), ‘Ethnic Diversity, Segregation and the Social Cohesion of Neighbourhoods in London’, working paper.
The Poverty Site (2011), Income Inequalities, available online at www.poverty.org.uk/09/index.shtml.
Thrasher, F. M. (1927), The Gang: A Study of 1,313 Gangs in Chicago. University of Chicago Press.
Van Wilsem, J., Wittenbrood, K. and de Graaf, N. D. (2006), ‘Socioeconomic Dynamics of Neighborhoods and the Risk of Crime Victimization: A Multilevel Study of Improving, Declining, and Stable Areas in the Netherlands’, Social Problems, 53: 226–47.
Veléz, M. B. (2001), ‘The Role of Public Social Control in Urban Neighbourhoods: A Multi-Level Analysis of Victimization Risk’, Criminology, 3: 837–64.
Veléz, M. B. and Richardson, K. (2012), ‘The Political Economy of Neighbourhood Homicide in Chicago: The Role of Bank Investment’, British Journal of Criminology, 52: 490–513.
Villarreal, A. and Silva, B. F. A. (2006), ‘Social Cohesion, Criminal Victimization and Perceived Risk of Crime in Brazilian Neighborhoods’, Social Forces, 84: 1725–53.
von Ahn, M., Lupton, R., Greenwood, C. and Wiggins, D. (2010), Languages, Ethnicity, and Education in London, DoQQS Working Paper 1012. Institute of Education.
Sutherland et al
Page 20 of 25
by guest on September 11, 2013
http://bjc.oxfordjournals.org/D
ownloaded from

Wikström, P.-O. H. (2012), ‘Social Sources of Crime Propensity: A Study of the Collective Efficacy of Families, Schools and Neighbourhoods’, in T. Bliesener, A. Beelmann and M. Stemmler, eds, Antisocial Behavior and Crime: Contributions of Developmental and Evaluation Research to Prevention and Intervention. Hogrefe.
Wikström, P.-O. H. and Sampson, R. J. (2003), ‘Social Mechanisms of Community Influences on Crime and Pathways in Criminality’, in B. B. Lahey, T. E. Moffitt and A. Caspi, eds, From Causes of Conduct Disorder and Juvenile Delinquency. The Guilford Press.
Wikström, P.-O. H., Ceccato, V., Hardie, B. and Treiber, K. (2010), ‘Activity Fields and the Dynamics of Crime: Advancing Knowledge about the Role of the Environment in Crime Causation’, Journal of Quantitative Criminology, 26: 55–87.
Wikström, P.-O. H., Oberwittler, D., Treiber, K. and Hardie, B. (2012), Breaking Rules: The Social and Situational Dynamics of Young People’s Urban Crime. OUP.
Wilson, W. J. (1987), The Truly Disadvantaged: The Inner-City, the Underclass, and Public Policy. University of Chicago Press.
Zhang, L., Messner, S. F. and Liu, J. (2007), ‘A Multilevel Analysis of the Risk of Household Burglary in the City of Tianjin, China’, British Journal of Criminology, 47: 918–37.
Appendix A: Sample of Locations Where Collective Efficacy and Crime Have Been Assessed
Study Location
1. Armstrong et al. (2010) Mesa, Arizona2. Breetzke (2010) Tshwane, South Africa3. Browning et al. (2004) Chicago, USA4. Cerdá et al. (2008) Chicago, USA & Medellín, Colombia5. Kirk and Papachristos (2011) Chicago, USA6. Gibson (2012) Chicago, USA7. Lowenkamp et al. (2003) UK-wide8. Maxwell et al. (2011) Chicago, USA9. Mazerolle et al. (2010) Brisbane, Australia10. Morenoff et al. (2001) Chicago, USA11. Oberwittler (2001, 2007) Cologne, Freiburg and ‘a
rural location’, Germany12. Odgers et al. (2009) UK-wide13. Sampson et al. (1997) Chicago, USA14. Sampson and Groves (1989) UK-wide15. Sampson and Wikström (2008) Chicago, USA and
Stockholm, Sweden16. Silver and Miller 2004 Chicago, USA17. Veléz (2001) Indianapolis, Rochester, Tampa-St
Petersburg, and St Louis18. Villarreal and Silva (2006) Belo Horizonte, Brazil19. Zhang et al. (2007) Tianjin, China
Other studies have also found an association between collective efficacy (or its subdomains) and youth problem behaviour (Rankin and Quane 2000), delinquency (Simons et al. 2005) and intimate partner violence (Browning 2004).
COLLECTIVE EFFICACY, DEPRIVATION AND VIOLENCE IN LONDON
Page 21 of 25
by guest on September 11, 2013
http://bjc.oxfordjournals.org/D
ownloaded from

Appendix B: Questions Used for Collective Efficacy Scale in METPAS and Examples of Questions Used in Other Studies
METPAS
Participants were asked to respond whether they ‘strongly agree’ (1), ‘agree’, ‘neither agree nor disagree’, ‘disagree’ or ‘strongly disagree’ (5).
Cohesion/trust
• People in this neighbourhood can be trusted.• People act with courtesy to each other in public spaces in this area.• You can see from the public space here in the area that people take pride in their
environment.
Informal social control/willingness to intervene
• If any of the children or young people around here are causing trouble, local people will tell them off.
• The people who live here can be relied upon to call the police if someone is acting suspiciously.
• If I sensed trouble whilst in this area, I could get help from people who live here.
PHDCN (Sampson et al. 1997)
Informal social control
Neighbours can be counted on to intervene if:
• Children were skipping school and hanging out on a street corner.• Children were spray-painting graffiti on a local building.• Children were showing disrespect to an adult.• A fight broke out in front of their house.• The fire station closest to their home was threatened with budget cuts.
Social cohesion/trust
• People around here are willing to help their neighbours.• This is a close-knit neighbourhood.• People in this area can be trusted.• People in this area generally don’t get along with each other.• People in this neighbourhood do not share the same values.
Sampson and Wikström (2008)
• Informal social control: ‘If some children were spray-painting graffiti on a local building, how likely is it that your neighbours would do something about it?’
Sutherland et al
Page 22 of 25
by guest on September 11, 2013
http://bjc.oxfordjournals.org/D
ownloaded from

• Informal social control: ‘If there was a fight in front of your house and someone was being beaten or threatened, how likely is it that your neighbours would break it up?’
• Trust/cohesion: ‘People around here are willing to help their neighbours.’• Trust/cohesion: ‘People in this neighbourhood can be trusted.’
Mazerolle et al. (2010) ‘derived from PHDCN’
Informal social control/willingness to intervene
• If a group of neighbourhood children were skipping school and hanging out on a street corner, how likely is it that your neighbours would do something about it?
• If some children were spray-painting graffiti on a local building, how likely is it that your neighbours would do something about it?
• If there was a fight in front of your house and someone was being beaten or threat-ened, how likely is it that your neighbours would do something about it?
• If a child was showing disrespect to an adult, how likely is it that people in your neigh-bourhood would scold that child?
• Suppose that because of budget cuts the fire station closest to your home was going to be closed down by the city. Would you say that neighbourhood residents would organ-ize strongly to try to do something to keep the fire station open?
Social cohesion/trust
• People around here are willing to help their neighbours.• This is a close-knit neighbourhood.• People in this neighbourhood can be trusted.• People in this neighbourhood generally don’t get along with each other.• People in this neighbourhood do not share the same values.
Cerdá et al. (2008)
Informal social control
• Someone would call the police if they saw a fight in the street.• A neighbour would advise the parents of a child that their child was making
trouble.• A neighbour would reprimand someone because that [person] left graffiti in a house
or building in the neighbourhood.• Someone would intervene if a child was being disrespectful to an adult.
Social cohesion
• Neighbours help survey the neighbourhood.• One neighbour helps the other.• People offer to work in a committee or council for the neighbourhood.• Neighbours help survey or care for the children of others.
COLLECTIVE EFFICACY, DEPRIVATION AND VIOLENCE IN LONDON
Page 23 of 25
by guest on September 11, 2013
http://bjc.oxfordjournals.org/D
ownloaded from

Appendix C: Rotated Factor Loadings for Neighbourhood Measures Based upon 2001 Census Data for All of England and Wales (n = 32,478)
Rotated component matrixa
Concentrated disadvantage
Population mobility
Urbanicity Age structure Housing structure
% income support 0.890 0.202 0.155 0.125 0.085% lone parent 0.836 0.024 0.149 0.293 0.142% local authority housing
0.852 –0.008 0.019 0.078 –0.153
% unemployed 0.828 0.200 0.212 0.119 0.130% no car 0.817 0.371 0.338 –0.089 0.069% professional or managerial
–0.780 0.155 –0.024 0.174 –0.343
% owner-occupied –0.620 –0.374 –0.163 –0.529 0.040% domestic land use
0.044 0.110 0.919 0.044 0.174
% green space –0.143 –0.130 –0.905 0.030 –0.048Population density 0.237 0.242 0.807 0.162 –0.094% agricultural land
–0.109 –0.052 –0.628 –0.095 0.037
% in-migration –0.098 0.868 0.048 0.082 0.123% out-migration –0.045 0.856 0.098 0.126 0.203% single parent non-pensioners
0.314 0.778 0.244 0.074 –0.057
% non-domestic land use
0.292 0.570 0.262 –0.083 –0.066
Occupancy rating 0.454 0.552 0.376 0.144 –0.287% under 18 0.405 –0.398 0.039 0.702 0.136% over 65 0.015 –0.251 –0.148 –0.902 –0.043% vacant property 0.227 0.459 –0.138 –0.145 0.541% terraced property
0.274 0.095 0.259 0.242 0.690
% flats 0.485 0.529 0.214 –0.105 –0.502Factor name Ldisad lpoptrans lurban lyouthpop lhouse
a Rotation converged in six iterations. Extraction Method: Principal Component Analysis. Rotation Method: Varimax with Kaiser Normalization.Bold numbers indicate final factor loadings.
Sutherland et al
Page 24 of 25
by guest on September 11, 2013
http://bjc.oxfordjournals.org/D
ownloaded from

Appendix D: Descriptive Statistics
Individual measures (max n = 61,437)
Mean SDDemographics
Female 0.53 0.50Resident 5+ yrs 0.61 0.49Working full time 0.46 0.50
Age n %15–17 827 1.3518–21 2,215 3.6122–24 2,942 4.7925–34 11,912 19.3935–44 13,603 22.1445–54 10,304 16.7755–64 7,486 12.1865–74 7,904 12.8775–84 3,254 5.385+ 682 1.11Missing 308 0.5
EthnicityWhite 40,753 66.33Mixed 4,146 6.75Asian 8,079 13.15Black 7,503 12.21Chinese/other 737 1.20Missing 219 0.36
Marital statusMarried 29,971 48.78Living as married 5,597 9.11Single 16,182 26.34Widowed 5,101 8.3Divorced 2,419 3.94Separated 1,523 2.48Missing 644 1.05
Socio-economic groupA. Higher managerial/professional 707 1.15B. Intermediate managerial/professional 7,923 12.9C1. Supervisory/clerical 19,860 32.32C2. Skilled manual workers 15,401 25.07D. Semi-skilled and unskilled manual workers 5,544 9.02E. Casual labourers, pensioners, unemployed, those on basic benefits 10,661 17.35Missing 1,346 2.19
Neighbourhood measures (max n = 4,761)
N Mean SD Min. Max.
Violence ratea 4,760 21.72 19.89 0 150Ambulance call rate (knife crime)a 4,760 0.55 0.94 0 15.42Concentrated disadvantageb 4,759 0.24 1.17 –2.31 4.09Population mobilityb 4,759 0.56 1.19 –1.53 7.36Urbanicityb 4,759 0.90 0.82 –2.08 6.11Age structureb 4,759 0.32 0.75 –3.56 3.55Housing structureb 4,759 –0.88 1.25 –5.74 5.50Ethnic diversity (1 = diverse) b 4,760 0.40 0.18 0.01 0.72Adult:child ratiob 4,760 3.67 1.22 1.60 11.80IMD crimeb 4,760 0.40 0.71 –2.02 3.13Collective efficacyb 4,748 0.02 0.45 –2.24 1.59
a Both rates are calculated as per 1,000 head of population, with violence capped at 150. b Unstandardized measures are given here.
COLLECTIVE EFFICACY, DEPRIVATION AND VIOLENCE IN LONDON
Page 25 of 25
by guest on September 11, 2013
http://bjc.oxfordjournals.org/D
ownloaded from