collecting in-situ data in the field and laboratory an
TRANSCRIPT

Collecting in-situ data in the field and laboratory: artefact corrosion and conservation Dr Ian D MacLeod Western Australian Museum Fellow WA Maritime Museum Fremantle, Western Australia 6160, Australia [email protected] Abstract After many decades of collecting in-situ corrosion data on historic shipwrecks and interpreting the information into active improvements in the conservation management of recovered artefacts, this work has been extended to land based sites in the middle of Anatolia, Turkey. Collaboration with the director of conservation at the Japanese Institute of Anatolian Archaeology (JIAA) in Kaman provided the opportunity to characterise soils and the burial microenvironment for bronze objects dating back to 3,800 year before the present. Using simple laboratory instrumentation of flat surface pH and chloride ion electrodes and the redox potentials of objects, soils and solutions it has been possible to establish the mechanisms controlling the decay on land-based sites. This in turn has facilitated development of corrosion models that assist in determining the extent of interventive and preventive conservation that needs to be applied to objects. Introduction The work commenced in 2017 with the first inspections and assessments of the main site of Kaman Kalehöyük, a tell that rises 30 metres above the plain and contains the remains of successive communities dating back to the early bronze age in 1,800 BCE (Omura 2011). On this ancient site, 25 years of archaeological investigations has revealed occupation levels which show the successive occupation from the Bronze ages to the Iron Age and the succession of the Assyrian, Hittite, Hellenistic and Ottoman periods, along with their archaeological records. Detailed studies of the relationships between the pH and voltage enabled the development of site specific Pourbaix diagrams which illustrate the dominant corrosion mechanisms. This foundation work facilitated the measurements in 2018 and 2019 at the Büklükale site, some 30-minutes’ drive from Kaman. This site has a similar chronology to Kalehöyük and lies at the top of a granite boulder strewn steep sided hill with commanding views of the Kizilirmak River (Figure 1). Archaeological intervention on this site is 10 years old and so the deposits had been exposed for a much shorter time period than the main excavation site. Collecting in-situ pH, chloride and redox values on land sites The pH data was recorded using a flat surface pH electrode which had been calibrated each morning using standard pH buffers at pH 4 and pH 7 before the field measurements commenced (Table 1). The pH meter was temperature compensated using a thermocouple connected to the Kensington Scientific pH meter (KS-pH-220-BASIC) and the glass electrode was a VWR model no W7567287. Readings of the surface pH were standardised by recording the values after an elapsed interval of one minute. If the surface was more responsive and the pH reading stabilised in 40 seconds, then that value was recorded and keeping the probe in position did not alter the steady value that had been noted. Owing to the porous nature of the archaeological pits and profiles, prolonged equilibration times can result in pH values that are not reflective of the local microenvironment. A small amount of water is needed to keep the bulb wet and the solution in contact with the internal reference electrode.

2
The chloride ion activity was measured using a TPS WP-90 ion-pH-mV-oC meter coupled with a Thermo sure-flow chloride ion specific electrode (Model no 9617BNWP). The surfaces were wetted with two drops (0.08 ml) of a 0.05 molar sodium nitrate solution to provide an electrolyte to stabilise the liquid junction between the sensing head and the soil surface. Stable readings of the chloride activity were obtained within a minute. The electrode was calibrated daily with a 1,000 and a 100-ppm chloride reference solution before any field measurements were made. The redox potentials were obtained by inserting a 2 mm o.d. platinum wire, silver soldered to an insulated copper cable that terminated in a banana plug, with the total set up encased in a 100% solids electrically insulating epoxy casting resin, into the soil. The platinum wire penetrated a damp sponge rubber kitchen mat which was moistened with the local alkaline tap water. The silver chloride (Ag/AgCl 3M KCl) reference electrode was laid on the sponge rubber near the electrode penetration point and the voltage recorded on a high impedance digital multi-meter. The voltage of the reference electrode was calibrated using the voltage at the platinum electrode sitting in a pH 4 buffer solution saturated with quinhydrone, a secondary standard for providing known voltages at given pH values. The voltage was +0.210 volts vs. the Normal Hydrogen Electrode (NHE). Table 1: Location of origins of the test samples and their in-situ microenvironment
Location Grid Ref. Pit no. /room Bronze
sample no. Median [Cl]
ppm Median pH Median Eh volts NHE
Site 5 N6W4 P 359 2, 4, 5, 11,12 & 13
1,760 7.12 0.394
Site 1 N5W4 R 176 17 1,120 7.3 0.336 Site 3 N5W4 R 176 3,9 381 7.77 0.388 Site 4 N5W4 R 132 2,200 7.46 0.423 Site 2 N3W2 16 1,088 8.09 0.354

3
(Figure 1)
Results and discussion There are many variables that control the acidity (pH) of the soils in an archaeological site. Calcareous minerals such as calcite, aragonite and dolomite all dissolve to some extent in rainwater, to create alkaline fronts that move through the deposits. The principal form of carbonate that dominates the equilibria in the soils is the bicarbonate ion and the migration of this alkaline cation has a major impact on the pH of the burial microenvironment. In surface layers the soil is more acidic owing to the presence of microflora, whose metabolites are acidic. As a result of this activity there is an increasing alkalinity associated with an increased soil depth. This was experimentally observed in the archaeological on site 5 (N6W4, Pit 359) where it was found that two profiles had the same sensitivity to depth, i.e. the same experimental slope but had different intercept values (surface pH) owing to localised variations in biological activity, as seen in Equations 1 and 2, viz., pH05-1 = 4.50 (0.37) - 0.0146 (0.0028) d .................................. (1) pH05-2 = 5.73 (0.36) – 0.0154 (0.0029) d ................................. (2) The values in parenthesis are the standard deviations of the slopes with depth and the intercept values, at zero depth at the soil-air interface. Inspection of the slopes in equations 1 and 2 show that the soil has the same profile of pH with depth, since the difference between the slopes is less than the sum of the standard errors associated with the two regression equations. Comparison with data from the profile at site 2 at N3W2, in the more exposed part of the Büklükale site, showed it has an apparently higher level of microbiological activity as the pHsurface value was 4.06 as shown in equation 3 below, pH02 = 4.06 - 0.019 dm ............................................................. (3)
4
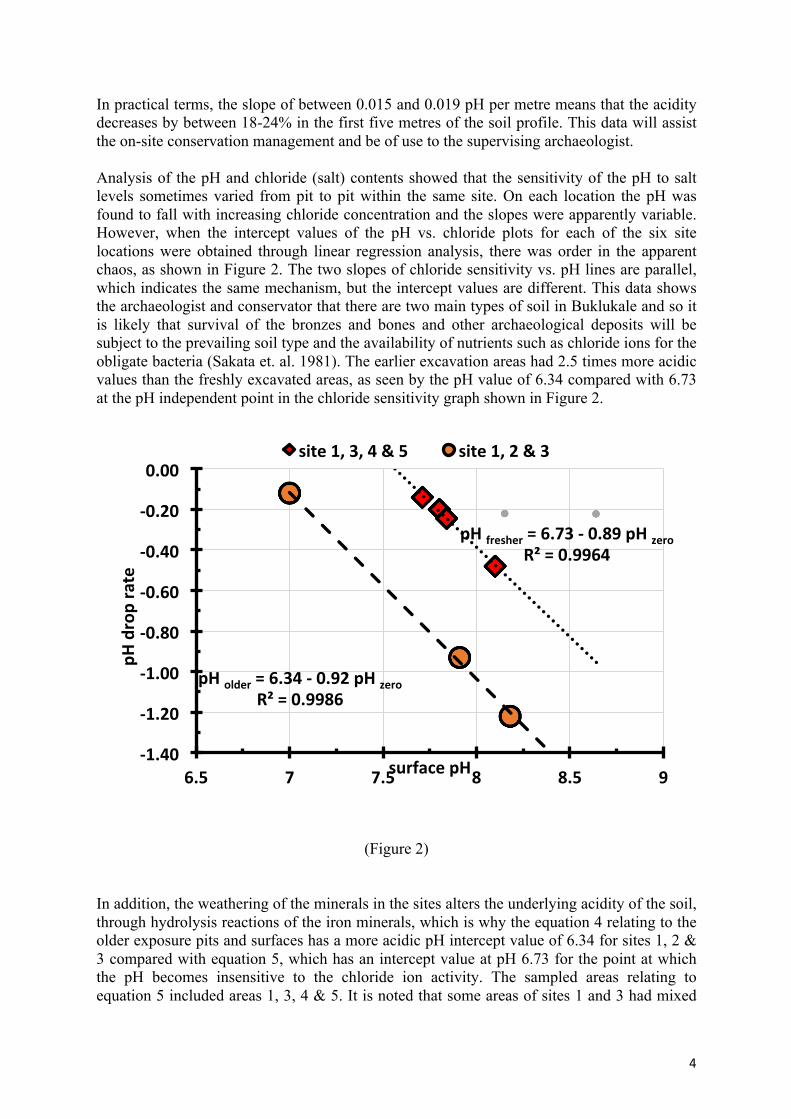
In practical terms, the slope of between 0.015 and 0.019 pH per metre means that the acidity decreases by between 18-24% in the first five metres of the soil profile. This data will assist the on-site conservation management and be of use to the supervising archaeologist. Analysis of the pH and chloride (salt) contents showed that the sensitivity of the pH to salt levels sometimes varied from pit to pit within the same site. On each location the pH was found to fall with increasing chloride concentration and the slopes were apparently variable. However, when the intercept values of the pH vs. chloride plots for each of the six site locations were obtained through linear regression analysis, there was order in the apparent chaos, as shown in Figure 2. The two slopes of chloride sensitivity vs. pH lines are parallel, which indicates the same mechanism, but the intercept values are different. This data shows the archaeologist and conservator that there are two main types of soil in Buklukale and so it is likely that survival of the bronzes and bones and other archaeological deposits will be subject to the prevailing soil type and the availability of nutrients such as chloride ions for the obligate bacteria (Sakata et. al. 1981). The earlier excavation areas had 2.5 times more acidic values than the freshly excavated areas, as seen by the pH value of 6.34 compared with 6.73 at the pH independent point in the chloride sensitivity graph shown in Figure 2.
(Figure 2)
In addition, the weathering of the minerals in the sites alters the underlying acidity of the soil, through hydrolysis reactions of the iron minerals, which is why the equation 4 relating to the older exposure pits and surfaces has a more acidic pH intercept value of 6.34 for sites 1, 2 & 3 compared with equation 5, which has an intercept value at pH 6.73 for the point at which the pH becomes insensitive to the chloride ion activity. The sampled areas relating to equation 5 included areas 1, 3, 4 & 5. It is noted that some areas of sites 1 and 3 had mixed
pHfresher=6.73-0.89pHzeroR²=0.9964
pHolder=6.34-0.92pHzeroR²=0.9986
-1.40
-1.20
-1.00
-0.80
-0.60
-0.40
-0.20
0.00
6.5 7 7.5 8 8.5 9
pHdroprate
surfacepH
site1,3,4&5 site1,2&3

5
surfaces, in terms of excavation dates and apparent reactivity, which is why the same sites can appear to have different activity in the other relationship. pH older = 6.34 – 0.92 pH zero ..................................................... (4) pH newer = 6.73 – 0.89 pH zero .................................................... (5) The term pH zero relates to the values of pH obtained by linear regression analyses of the dependence of pH on the activity of chloride obligate bacteria in the soil. The effect of time on the surface pH is shown in Figure 3.
(Figure 3)
Measurement of redox potential The purpose of measuring the redox potential or the Eh of the microenvironment is to enable plots of Eh versus pH (Pourbaix or thermodynamic stability diagrams) to be established for the site areas. This in turn informs the conservator and archaeologist about the decay microenvironment. Just as the pH was found to be sensitive to the chloride ion activity, so too the Eh; this is due to the impact of chloride ions on the overall reactivity of the Fe3+/Fe2+ redox couple associated with ferruginous clays. The Eh values were obtained by adding the numerical value of the calibrated voltage of the Ag/AgCl electrode (0.210 volts vs. NHE). The reference electrode was standardised by recording the voltage at a platinum electrode in a pH 4.0 solution which was saturated with quinhydrone, which has a standard voltage of +0.462 vs. the normal or standard hydrogen electrode.
medianpHsurface=7.90-0.11t1/2R²=0.9076
6.9
7.1
7.3
7.5
7.7
7.9
8.1
8.3
0 1 2 3 4 5 6 7 8
med
iangrou
ndpH
squarerootoftime,days
exposedverticalwall

6
Each of the five sites were measured at ten locations for the pH, the [Cl] and the Eh to gauge the overall chemistry of the site and how these parameters may affect the survival of the archaeological deposits. It was noticed during the data collection phase that there were sub-sections of sites that had quite different chloride ion levels, with concomitant changes in Eh and pH values. For example, the presence of calcareous microliths or hearths in a room or collection of pits will have a measurable impact on the local chemistry and microenvironment. Similarly, the remains of plaster on the floors results in more alkaline patches of the soil that has been exposed through the excavation process.
(Figure 4)
Redox potential and pH measurements at site 1 in N5W4 sector showed that for room 176 the Pourbaix diagram of Eh vs. pH showed that the chemistry of that part of the site is dominated by equation 6, Fe(OH)+ + H2O → Fe(OH)2
+ + H+ + e- ................................... (6) Thus, the soil chemistry of this area is controlled by the oxidative hydrolysis of iron (II) hydroxy complex Fe(OH)+ to the dihydroxy ferric species Fe(OH)2
+ ; this was verified by the experimental slope of -59 mV per pH. Such reactions are part and parcel of the chemical reactions controlling the pH and oxidative microenvironment of soils. On site 3, apart from one area on the ground being described by equation 6 (above) there were other areas where the response of the Eh to pH was best given by equation 7, viz., 2 Fe(OH)+ + H2O → Fe(OH)2+ + Fe(OH)2
+ + H+ + 2e- ...................... (7)

7
Because equation 7 involves two electrons per released proton it has a slope of -30 mV per pH. The presence of different pH and Eh relationships across a spatial area of 10 m2 attests to the impact of microenvironment on the chemistry of the soils. The overall reaction is much the same as in equation 6 but because it produces a range of iron(III) hydroxy species there is a different pH and Eh relationship. When the Eh versus chloride plots were analysed by linear regression across the five sites a similar trend to the pH response emerged. Just as the acidity increased with increased chloride ion activity, so too the voltage increased with chloride concentration. The increase in “activity” is due to the accelerating effect of chloride on the oxidation of iron (II) to iron (III), which is the reason why iron artefacts need to be desalinated. When the variable slopes of each site were plotted against the extrapolated Eh at zero chloride, the trends shown in Figure 5 emerged. The data shown in Figure 5 indicate that the sensitivity of voltage to chloride ions increases with the intercept value at zero chloride. In other words, the higher the activity of Fe3+ ions the greater the Eh. The parallel lines of the sensitivity of the Eh to chloride ions are separated by 17 mV. If it is assumed that voltages are driven by the iron (III)/iron(II) redox couple, the ratio of the concentration of Fe3+ to Fe2+ had increased by a factor of 2 times with the ageing of the soils. The factor is calculated from the value of 10^(0.017/0.0592). This calculation confirms the observation of the JIAA archaeologists that the freshly excavated soils had a green tinge that changed with time to a more reddish hue. It is possible that the green mineral has a Fe2+ ion in it and that it is in a reactive state which facilitates its oxidation. Corrosion of iron objects in the deposits from the Iron Age would lead to a significant supply of green rust (II), which has the overall formula of [Fe2+
2Fe3+(OH)6]+[Cl-
.2H2O]-, which is analogous with that of iowaite Mg6Fe23+(OH)6Cl2. 4H2O. Iowaite is a
rhombohedral crystal, consisting of Fe(OH)2 sheets which alternate regularly with interlayers composed of Cl- ions and H2O molecules.
Eholder=0.52Ezero-0.170R²=0.9728
Ehfresh=0.57Ezero-0.172R²=0.9998
0.000
0.010
0.020
0.030
0.040
0.050
0.060
0.300 0.320 0.340 0.360 0.380 0.400 0.420
E hse
nsitivity,V
/[Cl]
ppm
EhinterceptatzeroCl
site1,2,4&5 site1,3&5

8
(Figure 5)
The regression equations for the older soil is given by equation no 8 and the newer soils by equation no 9, with the standard errors in parenthesis. slope Eh/Cl older soils = 0.52 (0.05) E zero -0.170 (0.018) ............................... (8) slope Eh/Cl fresh soils = 0.57 (0.01) E zero -0.171 (0.003) ............................... (9) In these two equations the value of E zero relates to the voltage intercept when the individual regression lines at the five sites are extrapolated to zero chloride ion concentration. Through the process of obtaining the intercept values of the redox potentials and then plotting them against the varying slopes it was possible to demonstrate that the apparent differences between the voltage response across the Buklukale sites follows a simple pattern of behaviour and the outcomes of these processes are thus predictable. From the Pourbaix plots for each of the sites it was found that equation 6 with one proton per electron had a mean slope of 0.058 ± 0.011 volts and this was the dominant hydrolysis and oxidation reaction for sites 1, 2 and 5; it is noted that sites 2 and 5 were those where depth profiling or vertical sampling areas were undertaken. For some areas of site1, this same mechanism controlled the acidity and redox potential. For several areas of site 2 and for 3, 4 and 5 the slope was 0.030 ± 0.004 volts per pH change and this represents the common mechanism found for equation 7, which gives one proton being released during the oxidative hydrolysis of two molecules of Fe(OH)+ giving one unit each of Fe(OH)2+ and one of Fe(OH)2
+ and two electrons. As discussed previously, it is not unreasonable to have different chemical reactions occurring over a space of approximately 10 square metres as part of the natural variability of the soil chemistry. Interpretation of pH of soils on archaeological profiles In the preceding section it was noted that for many parts of the upper sites that the pH fell as the chloride ion concentration increased. This phenomenon has been associated with salt loving i.e. chloride obligate, bacteria giving off more metabolites as the biological activity increases with the salinity. One way of “neutralising” the impact of the varying chloride levels on the pH values, as the data is plotted as a function of burial depth, is to divide the pH by the log of the chloride ion concentration. The results from such data processing is seen in Figure 6 which shows the pH/log [Cl] falling linearly with increasing depth until it reaches a turnover point at a depth of approximately 2.0-2.5 metres, when the value becomes a constant.

9
(Figure 6)
A possible interpretation of the constancy of the data below 3.5 metres is that this is the depth to which the impact of the soil bacteria are having some meaningful effect. The slopes of the two lines for the upper and lower data sets in the shallower parts of the site represent the clearly marked differences in the presence of microfossils in the clay sediments and soil. The separation of the two parallel lines by a difference of 1.8 in pH is seen to be a direct measure of the impact of the solubilisation of lime based materials intersecting with the soil horizons, which relate to the age of the site and the activities associated with the dismantling and rebuilding programs associated with the different occupations of the site. On site 2 the vertical profiles were identified as being from the Ottoman period for depths from the surface layers to around 75 cm, followed by the Iron Age 100-150 cm with the Hittite period for the depths from 150 to 250 cm. The plot of pH/log[Cl] for Site 2 had a similar value for the Ottoman period on Site 5 with a slope value being given by equation 10, which indicates that the upper equation for Site 5 relates to penetration of carbonate bearing solutions. pH/log [Cl] = 4.06 – 0.019 d ....................................................... (10) In conclusion, it is noted that the Büklükale site has overall chemistry that is dominated by the activity of ferruginous soils which are interspersed with calcitic horizons associated with water seepage through calcareous minerals. Since the overall occupation of the site is based on soils of weathered granites it is likely that the source of the alkaline materials relates to the incorporation of lime associated with stabilisation of the adobe structures with lime wash and with the use of such materials as a treatment for the soil bases in the buildings. Correlation of burial depth, corrosion mechanisms and chloride ion removal Some preliminary desalination experiments had been conducted on seven bronze objects from Kaman Kalehöyük by using 3 ml of the weak electrolyte solution, 0.05M NaNO3, which stabilises the chloride ion electrode potential and facilitates determination of the chloride readings. The pH and chloride release data indicated that the burial microenvironment may be
pH/log[Cl]lower=4.41-0.013dR²=0.9701
pH/log[Cl]upper=6.18-0.0131dR²=0.9813
0.00.51.01.52.02.53.03.54.04.55.05.56.0
0 100 200 300 400 500
pH/log[C
l]
burialdepth,cm
pH/logCllower pH/logCldeeper

10
a major factor in the extent of corrosion. In a well oxygenated microenvironment, there is kinetic controlled oxidation of the copper-rich α-phase, owing to the facile reduction of dissolved oxygen at the copper rich surface layers. Since the primary corrosion products of copper is the copper (I) chloride or the Cu2O mineral phase there is less entrained chloride in the bronze than if it has been corroded under thermodynamic control in a low oxygen microenvironment. In this situation there is corrosion of the (α+δ) eutectoid. This phase is rich in tin and the oxidation involves at least two-electron steps for oxidation to Sn2+ or four-electrons for each stannic ion (Sn4+) formed in the corrosion process. The positive charges of the multi-valent tin corrosion products cause much more chloride ions to be accumulated in the corrosion matrix, which is why we get bronze disease problems with archaeological bronzes. In order to remove the boundary layer issues of sitting relatively large masses of bronze in a very small volume of solution, a more comprehensive test was carried out on freshly excavated bronze objects from the 2019 Büklükale season (Swann et.al. 1992). Desalination A series of 17 artefacts from the 2019 season at Büklükale were weighed, photographed and visually assessed to see what gross morphological features indicated features of the burial environment that might have a bearing on the future stability of the metals and their specific conservation needs (Table 2). Sample 1 was determined to be a child’s silver ring with a blue glass “stone” and sample no 4 was a crumpled wrought iron horseshoe nail! Other than keeping their chloride release rates on record, their data was not used in modelling the bronze corrosion processes taking place at Büklükale. Table 2: Raw and normalised chloride release rates for objects soaking in 0.05 M NaNO3
Object no
Grid Reference
Raw rates [Cl] ppm/min1/2
Surface Area cm2
Normalised rate ppm.min-1/2.cm-2
1000 * Norm Cl/ m-1
1 N0W1 0.017 9.8 0.002 2.2 7 N2W2 0.014 7.3 0.002 3.7 8 S1E1 0.061 19.3 0.003 9.9 4 N7W4 0.040 8.9 0.005 no depth data. 10 S1E1 0.025 4.0 0.006 9.3 9 N7W4 0.025 3.4 0.008 3.7 15 S2E0 0.051 6.4 0.008 9.5 2 N7W4 0.459 31.5 0.015 no depth data. 6 N7W4 0.167 10.8 0.015 3.5 13 N7W4 0.192 9.6 0.020 9.6 3 N5W3 0.146 5.5 0.027 7.4 14 N6W3 0.182 6.2 0.029 9.3 17 N5W4 0.966 29.8 0.032 14.3 5 N7W4 0.597 8.8 0.068 15.7 11 N6W4 1.095 7.2 0.151 48.8 16 N2W2 0.287 1.7 0.169 325.8
12 N7W4 3.008 13.3 0.226 108.2
11
(Figure 7)
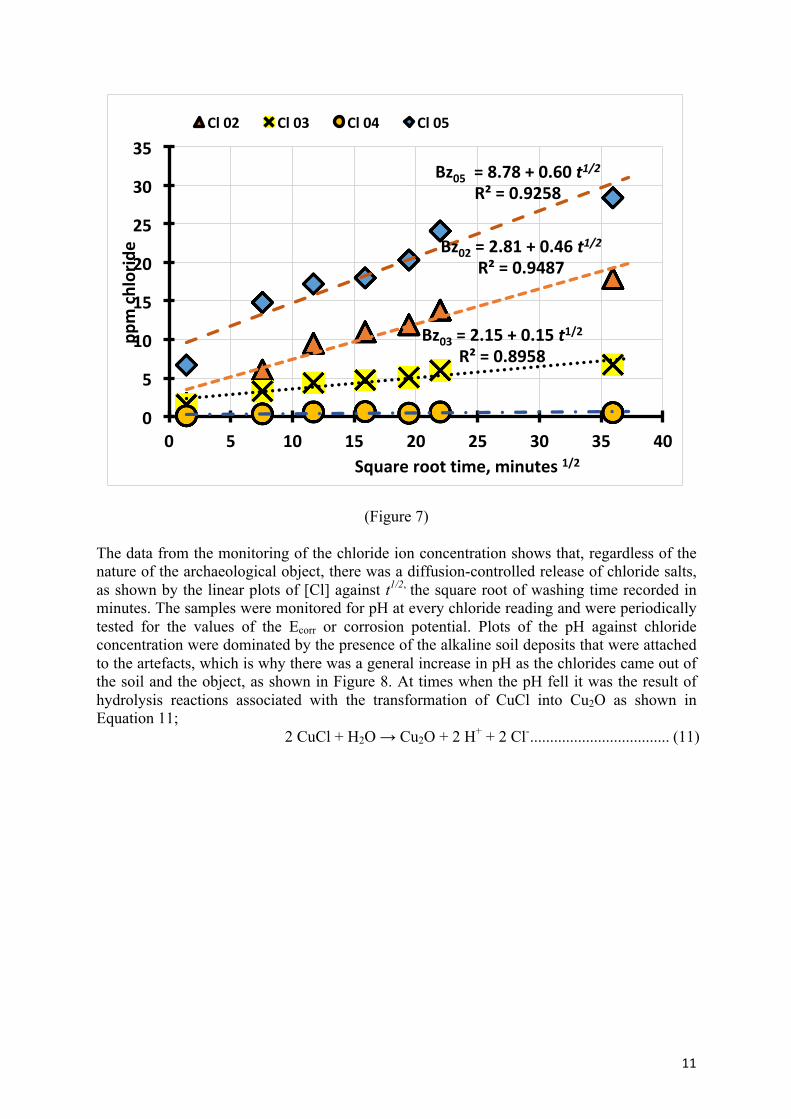
The data from the monitoring of the chloride ion concentration shows that, regardless of the nature of the archaeological object, there was a diffusion-controlled release of chloride salts, as shown by the linear plots of [Cl] against t1/2, the square root of washing time recorded in minutes. The samples were monitored for pH at every chloride reading and were periodically tested for the values of the Ecorr or corrosion potential. Plots of the pH against chloride concentration were dominated by the presence of the alkaline soil deposits that were attached to the artefacts, which is why there was a general increase in pH as the chlorides came out of the soil and the object, as shown in Figure 8. At times when the pH fell it was the result of hydrolysis reactions associated with the transformation of CuCl into Cu2O as shown in Equation 11; 2 CuCl + H2O → Cu2O + 2 H+ + 2 Cl- ................................... (11)
Bz02=2.81+0.46t1/2R²=0.9487
Bz03=2.15+0.15t1/2R²=0.8958
Bz05=8.78+0.60t1/2R²=0.9258
0
5
10
15
20
25
30
35
0 5 10 15 20 25 30 35 40
ppmchloride
Squareroottime,minutes1/2
Cl02 Cl03 Cl04 Cl05

12
(Figure 8)
It was apparent that the size and nature of the surfaces of the chosen test objects was significantly different to each other and so the observed rates of chloride removal, expressed as ppm [Cl]/min1/2, came together more when corrected for their apparent geometric surface areas, as shown in Table 2. A site plan for the Büklükale excavation areas is shown in Figure 9, from which it can be noted that the bronzes that were treated, given the basic rinse in the weak sodium nitrate solution, all came from a similar location on top of the hill which crowns the site.
5.00
5.50
6.00
6.50
7.00
7.50
8.00
8.50
0 5 10 15 20 25 30 35 40
solutio
npH
,0.05MNaN
O3
squareroottime,minutes
pH01 pH04 pH07 pH09pH10 pH15 pH16
silver&glassring
Fenail

13
(Figure 9)
Standardisation of chloride release rates for surface area and burial depth When the normalised chloride extraction rate (Table 2) is plotted as a function of the burial depth there is a steady decrease in the rate for objects numbered 5, 6, 11 and 12, which indicates that the deeper the burial the lower the corrosion rate and the less chloride is retained in the corrosion matrix inside the object. This appears to hold for the first 4.5 metres of burial. For six objects other bronzes there was a regular increase the total weight percent of chloride extracted with the age of the object, which indicates that for all other things being equal, corrosion is occurring at a steady state. The anomalously high chloride extraction rates obtained on object 11 and 12 were also associated with large amounts of sparkling halite (NaCl) crystals on the surface of the corroded artefacts. With the solubility of sodium chloride being in excess of 5 M or in excess of 300 grams per litre, it means that to get significant deposits of NaCl on the surface of the artefacts, as found for five out of the 15 Buklukale bronzes, that there is a real salt problem that is heavily impacting on the deterioration of the cast and worked non-ferrous alloys. Normalisation of chloride release rates by correcting for solution volume and surface area and time of immersion has been reported as being a useful method of rendering data to show the systematic behaviour of desalination process (MacLeod and Davies 1987, MacLeod 1987) and most laboratory desalination data should be standardised in this fashion if comparative results are to be effected across different archaeological profiles on different sites.

14
In two cases there was no archaeological depth recorded, owing to the collapse of the soil profiles. It is to be expected that the older, and hence deeper, bronze archaeological object would be expected to be more corroded and so more likely to release a larger amount of chloride i.e. have a faster normalised rate of washing. When the normalised release rate was divided by the depth at which the objects were recovered, the salt release rates formed clusters of values. There were four with a mean value of 3.3 ± 0.7 ppm.cm-2m-1 at a mean depth of 1.9 ± 1.7 metres and six around 9.1 ± 0.9 ppm.cm-2m-1, with a mean depth of 1.4 ± 1.2 metres. In such cases other variables are clearly at play and in the shallower depth there are clear chloride concentration lenses, which can see concentrations of chloride increase by more than a factor of twenty times over the space of 15 cm of depth profile. The additional complication for bronzes on the Büklükale site, other than that of the age of the archaeological deposit, is the complex hydrology and chlorinity. In addition to these two main variables there is the way in which the depth profile alters the corrosion mechanism and this in turn changes the amount of chloride ions incorporated into the corrosion products. For sites buried in shallower profiles the higher concentrations of dissolved oxygen in the soil lead to preferential corrosion of the α-rich copper phases of the bronze. At greater depths, where there is still access to lower concentrations of dissolved oxygen, the mechanism changes over to preferential corrosion on the (α+δ) eutectoid phases, as has been discussed above. There is a clear need for more detailed studies to correlate the in-situ burial microenvironment with the precise locations at which the bronzes were recovered. Future research will involve metallographic analysis of the cross sections of the bronzes to see if the changes in decay mechanism as the depth of burial increases are manifested with increased amounts of mineralisation and subsequent massive release of chloride ions when the objects are placed in a weak neutral electrolyte solution. In the 2018 soil analyses conducted on the site the maximum chloride reading was 10,500 ppm on the flat floor of room 176 in the N5W4 sector. In the vertical profile in Site 2 the maximum chloride ion concentration was 3,200 ppm at a depth of 2.25 metres, which places it at the Hittite period. The issue of chloride “lenses” is readily apparent with this section of the site, for there is another high chloride ion zone in the middle of the iron age period at depths ranging from 1.5-1.8 metres. The non-linear nature of the chloride distribution in the vertical profiles only serves to complicate an otherwise simple story that the age of a deposit is going to dominate the corrosion behaviour of the bronzes. The chloride levels reporting to solution were found to be linearly dependent on the time (in days) since the site was excavated, with the relationship shown in Equation 12, which had an R2 of 0.9371 for sites 1, 3 and 5. Detailed analysis of the data showed that the error associated with the intercept value 1038 ±50 ppm and the slope is 78±20 [Cl] mean = 1038 + 78 d ........................................................... (12) The excavation time intervals had covered two periods on sites 3 and 5, with the longer exposure periods resulting in less accumulation of chloride in the surface soils. Equation 12 states that there was an underlying background surface chloride concentration of 1,038 ppm which increased by evaporation of the capillary rise processes at the rate of 78 ppm per day following excavation. It also needs to be remembered that salts come and go from the surface, as moisture is added to or removed from the system. Moisture on cold nights will remobilise the salts and result in less surface evaporation as underlying moisture is removed after fresh excavation and exposure of the soils. For the Büklükale sites the changing salt profiles will have a potentially major impact on the buried bronzes.
15
When the median Eh value was plotted against the median [Cl] ppm it was seen that the redox potential of the sites increased monotonically with chloride ion concentration at the rate of 0.07 mV per ppm chloride, as shown in Equation 13, for which the R2 was 0.9546 which shows a high degree of correlation of the connection between Eh and chloride ions. The only site that did not conform to Equation 13, was site 3. Eh = 0.267 + 7E-05 [Cl] ppm ................................................... (13) As noted in the preceding paragraph, site 3 had a complex salt level profile. However, when the maximum chloride concentration, rather than the median value, was used the median Eh value for the site fitted in with all the others, in the relationship shown in Equation 13. Chloride extraction and initial pH In order to establish the mechanism that has been controlling the corrosion and decay of bronzes on Büklükale, it is necessary to have some form of non-destructive measurements available to the conservator. Owing to the availability of weak electrolyte solutions in the form of 0.05M NaNO3, used as the connecting solution for chloride ion measurements, it was possible to place the 17 objects into 100 ml of the solution and to monitor the pH and the chloride ions at regular intervals and so provide a standard method of assessing the susceptibility of the bronzes to undergo additional corrosion during storage. The presence of surface halite crystals (NaCl) on one third of the objects indicated that they had come from chloride rich microenvironments which had undergone extensive drying periods, which brought about the crystallisation of the salt crystals on the surface. An example of the impact of the salt crystals on the corrosion of the bronzes is seen in Figure 10, which shows object no 17 before the treatment condition. It was not possible to get details of the NaCl crystals deposited on the surface of the bronze fibula, which came from the N5W4 sector in the north west corner of the site and this was not one of the sectors examined in 2018.

16
(Figure 10)
Analysis of the total amount of chloride released during the 36-hour test showed significant elements of reproducibility, in terms of the concepts discussed above. The initial pH, that after 3 minutes of immersion, was found to be an excellent indicator of the total extractable chlorides in the objects. The highest chloride removals come from the five bronzes (5, 8, 11, 12 & 17) that had halite crystals on their surfaces: these objects conformed to Equation 14, [Cl] wt.% extracted = 0.56 – 0.09 pH ............................................ (14) For those bronzes where there was no apparent halite on the surface (2 & 3) they released chloride ions to the same extent, as indicated by the initial pH, as those which had come from a saturated salt environment, but with marginally less chloride in them (see equation 15). The difference in the intercept of equations 14 and 15 indicate that the halite accounts for only 0.04 wt.% of the total chloride content that was extracted. This small difference in the 36-hour extractable chloride levels indicate that all the Büklükale bronzes have significant chloride corrosion problems. [Cl] wt.% extracted = 0.52 -0.09 pH .............................................. (15) However, there were some differences noted with three bronzes from the NW sectors. For these objects there was an increase of extracted chloride with increasing pH of the initial solution. The bronzes from N6W3 and N7W4 (6, 13 & 14) were buried at depths of 4.36, 2.09 and 3.15 metres respectively and the complex patinas included pseudomorphs of timber and calcareous cements that had deeply bound sand grains to the surfaces. From the burial depths it is likely that they have had selective corrosion on the tin-rich phases so it is not unexpected that they had a more alkaline initial response, due to the mobilisation of the

17
minerals on the surfaces, but that the underlying corrosion matrix did end up yielding an appropriate amount of chloride ions from within the object. Conclusion The measurement of the in-situ pH, chloride activity and Eh of the soils at Büklükale provided the conservator with a very handy guide to interpret the results of a preliminary desalination test, which was extended from the initial 8 hours used in 2018 to a 36-hour test to see what trends would emerge. It can be concluded that for bronzes buried in shallow archaeological deposits, which presumably largely relate to the Ottoman period or the late Iron Age, there is less post excavational decay risk than for those which have come from moderate depths, ranging from 2.0-3.5 metres where the lower oxygen content results in thermodynamically controlled selective corrosion of the tin-rich (α+δ) eutectoid. Oudbashi et. al. published a seminal paper in 2016 in which they reported a detailed study of the patina on bronze age artefacts from Iran and a similar study on bronzes from Büklükale may well prove to provide a key into the complex decay mechanisms. The hydrolysis reactions of copper (I) chlorides with water in the neutral environment of the 0.05 M NaNO3 result in initially acidic solutions, which gradually become more alkaline as soluble bicarbonate ions wash out of the corrosion matrix and when mineralised patinas hydrolyse and release alkaline solutions. It was found that those bronzes with severe chloride issues at present or those likely to suffer future corrosion problems, the gave a 3-minute pH ≤ 5.75 as these were the most at risk. For objects such as these, artefacts would need post drying treatment of storage in an Escal bag to prevent oxygen access. The Büklükale site is characterised by iron-rich clayey soils which also provide an oxidizing microenvironment to metallic remains buried within their confines. The in-situ measurements of the soil confirmed that the amount of surface chloride is dependent on the age of the surface, with generally higher chloride contents associated with soils that were measured after longer periods of exposure. This process is directly relatable to the migration of salty water from within the sediment to the freshly exposed surfaces where they undergo evaporative concentration. The increased acidity of the older soils is also reflected in the increased redox potentials as the more reactive iron (II) minerals in the soil undergo oxidative hydrolysis to produce iron (III) compounds, all of which are more acidic when placed in deionised water. The voltages of the burial microenvironment were also found to increase with chloride content and the presence of these chloride-rich and iron-rich soils will provide enough oxidising energy to continue to corrode the historic bronzes even though they are buried in what is essentially a very low oxygen environment. Tylecote’s classic study in 1979 of the impact of soil pH and voltage on the corrosion of Bronze Age objects showed that “a reasonable relationship appears to exist between the pH of the soil and the state of the metal. Acid soils are aggressive to metals and alkaline soils are benign. In no cases were sulphate reducing bacteria active in promoting corrosion”. The absence of copper sulphides in the corrosion products found on bronze objects in Kalehöyük and Büklükale support his observation. The Eh data from the soil profiles on sites two and five show strong support for the oxidative microenvironment provided by the iron rich minerals down to a depth exceeding 4.5 metres. It is the presence of the minerals in the soil that effectively inhibits the activity of sulphate reducing bacteria. The constancy of oxidative decay in a chloride-rich environment provides an index of accumulated age for the archaeological materials.
18
Future work on the Büklükale and Kalehöyük sites should include analysis of the soils where the bronze objects were recovered. Apart from providing data on the burial pH which will inform conservators and archaeologists about the chemical microenvironment, data should also be collected on the redox potential of the soils so that the best combination mechanism can be confirmed and so assist us in understanding the decay patterns on both sites being actively excavated by the Japanese Institute for Anatolian Archaeology. This would provide a wealth of information to support the complex observations of Meeks who studied the interactions between the surfaces and interior elements of old bronzes on archaeological sites (Meeks 1986). Acknowledgment I would like to thank Dr Alice Boccia Paterakis for her encouragement and support during the field measurements at Kaman Kalehöyük and at Büklükale sites and for access to the conservation laboratory at the JIAA. The close support of Dr. Sachihiro Omura, Dr. Masako Omura and Dr. Kimiyoshi Matsumura has been invaluable. The invitation to join the JIAA team and develop procedures to enhance the preservation of the archaeological bronzes is greatly appreciated. References MacLeod, I.D., 1987, Stabilization of corroded copper alloys: a study of corrosion and desalination mechanisms, ICOM Committee for Conservation, Sydney, September 1987, p 1079-1085. MacLeod, I.D. & Davies, J.A., 1987, Desalination of glass, stone and ceramics recovered from shipwreck sites, ICOM Committee for Conservation, Sydney, September 1987, p 1003-1007. Meeks, N. D., 1986, Tin�rich surfaces on bronze–some experimental and archaeological considerations, Archaeometry, 28: 133-162. Doi:10.1111/j.1475-4754.1986.tb00383.x Omura, S., 2011, Kaman-Kalehöyük excavations in Central Anatolia, The Oxford Handbook on Ancient Anatolia (10,000 – 323 BCE), ed McMahon, G, and Steadman, S., University of Oxford Press, Oudbashi, O., Hasanpour, A. & Davami, P., 2016, Investigation on corrosion stratigraphy and morphology in some Iron Age bronze alloys vessels by OM, XRD and SEM–EDS methods, Appl. Phys. A 122: 262. https://doi.org/10.1007/s00339-016-9793-4 Sakata, T., Sugita, H., Mitsuoka, T. Kakimoto, D. and Kadota, H., 1981, Characteristics of Obligate Anaerobic Bacteria in the Intestines of Freshwater Fish, Nippon Suisan Gakkaishi (Japan Science and Technology Agency), 47 (3) 421-427 Swann, C.P., Fleming, S.J. and Jaksic, M., 1992, Recent applications of PIXE spectrometry in archaeology I. Characterization of bronzes with special consideration of the influence of corrosion processes on data reliability, Nuclear Instruments and Methods in Physics Research Section B: Beam Interactions with Materials and Atoms 64, 499-504. Tylecote, R.F., 1979, The effect of soil conditions on the long-term corrosion of buried tin-bronzes and copper, Journal of Archaeological Science, 6 (4), 345-368.