collaborative structures, inc. sales build and pro forma ...€¦ · collaborative structures, inc....
TRANSCRIPT

Collaborative Structures, Inc.Sales Build and Pro Forma Financial SummaryModel Rev Jan 22, 2000Run time 1/25/00 5:40 PM Total
Q 1 Q 2 Q 3 Q 4 Q 1 Q 2 Q 3 Q 4 Total 2000 2000 2000 2000 FY 2000 2001 2001 2001 2001 FY 2001
Summary Pro-Forma Financials Pct Rev Pct Rev Pct Cost Pct Cost
Revenues 92,500 152,188 362,018 654,547 1,261,252 100% 1,237,199 1,968,768 2,888,734 3,764,768 9,859,469 100% Cost of Goods Sold 128,004 160,506 215,509 231,760 735,779 58% 15% 378,516 416,018 413,516 432,267 1,640,317 17% 13%
Gross Margin (35,504) (8,319) 146,509 422,787 525,473 42% 858,683 1,552,750 2,475,218 3,332,501 8,219,152 83%
Selling Expenses 213,500 315,500 491,000 611,042 1,631,042 129% 33% 798,951 958,334 1,090,529 1,222,607 4,070,422 41% 33% Marketing 130,000 300,000 480,000 480,000 1,390,000 110% 28% 737,500 737,500 937,500 962,500 3,375,000 34% 28% Research & Development 115,000 135,000 155,000 155,000 560,000 44% 11% 385,000 410,000 587,500 587,500 1,970,000 20% 16% General and Administrative 147,500 147,500 167,500 167,500 630,000 50% 13% 245,000 265,000 337,500 337,500 1,185,000 12% 10%
100% 100% Net Income Before Taxes (641,504) (906,319) (1,146,991) (990,755) (3,685,569) -292% (1,307,768) (818,085) (477,810) 222,393 (2,381,270) -24%
Collaborative Structures Confidential 01/25/2000 CS_PROFORMA_C_01 Page 2

Collaborative Structures, Inc.Sales Build and Pro Forma Financial SummaryModel Rev Jan 22, 2000Run time 1/25/00 5:40 PM
Total Total Total FY 2002 FY 2003 FY 2004
Summary Pro-Forma Financials Pct Rev Pct Rev Pct Cost Pct Cost
Revenues 28,777,772 100% 57,447,750 100% 100,507,520 100% Cost of Goods Sold 4,106,598 14% 19% 6,952,606 12% 16% 11,460,104 11% 16%
Gross Margin 24,671,174 86% 50,495,144 88% 89,047,416 89%
Selling Expenses 5,801,081 20% 26% 7,202,626 13% 16% 7,709,248 8% 11% Marketing 6,167,500 21% 28% 14,792,500 26% 34% 27,567,500 27% 38% Research & Development 3,360,000 12% 15% 10,790,000 19% 25% 20,232,500 20% 28% General and Administrative 2,752,500 10% 12% 4,122,500 7% 9% 6,347,500 6% 9%
100% 100% 100% Net Income Before Taxes 6,590,093 23% 13,587,518 24% 27,190,668 27%
Collaborative Structures Confidential 01/25/2000 CS_PROFORMA_C_01 Page 3

Collaborative Structures, Inc. Sales Build and Pro Forma Financial Summary Model Rev Jan 22, 2000 Run time 1/25/00 5:21 PM
< ------- KEY INPUTS, FOR INDICATED PERIODS ------ > Start 2000 Q 1&2 2000 Q 3&4 2001 Q 1&2 2001 Q 3&4 2002 2003 2004 Notes
Summary Pro-Forma Financials
Revenues (<--see subsequent pages for detail) Cost of Goods Sold
Gross Margin
Selling Expenses Marketing These pro-forma financial statements are for the use of Collaborative Structures, Inc. and potential investors. Research & Development General and Administrative Please use in conjunction with Investment Summary
Net Income Before Taxes These statements project the growth curve of the Company as a function of sales force size, success of the sales force, average selling price, cost of goods sold, and duration of projects. These are the key sensitivities.
The presentation is organized as follows: Summary Financial Information Sales Build: The penetrations and assumptions leading to booking new work Cost of Goods Sold Selling Expenses (including input assumptions for success of sales staff) Marketing Expenses (success of sales relates to effectiveness of marketing effort - not quantified here) Research and Development Expenses General and Adminstrative Expenses
These pro-formas indicate one possible strategy. They can serve as a baseline for discussion of other strategies.
In projections: Box = input assumptions Box = key areas of sensitivity
Collaborative Structures Confidential 01/25/2000 CS_PROFORMA_C_01 Page 1
(24 months)
Collaborative Structures, Inc. Sales Build and Pro Forma Financial Summary Model Rev Jan 22, 2000 Run time 1/25/00 5:21 PM
< ------- KEY INPUTS, FOR INDICATED PERIODS ------ > Start 2000 Q 1&2 2000 Q 3&4 2001 Q 1&2 2001 Q 3&4 2002 2003 2004 Notes
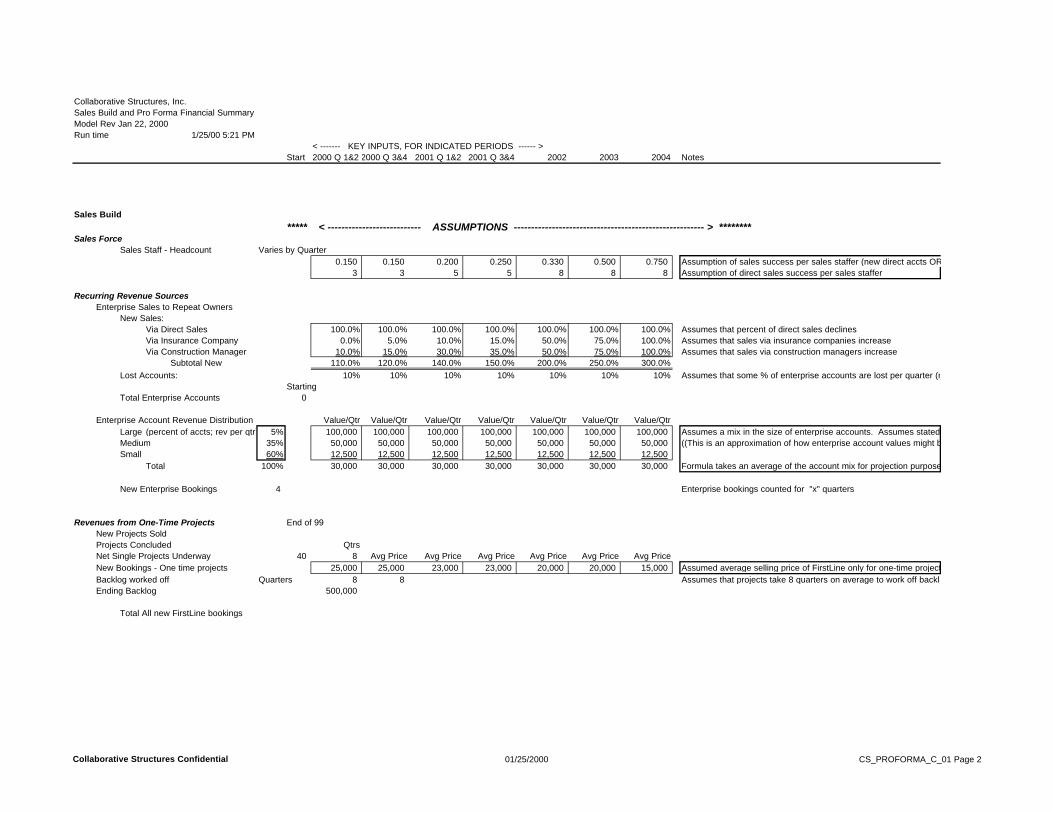
Sales Build ***** < --------------------------- ASSUMPTIONS ------------------------------------------------------- > ********
Sales Force Sales Staff - Headcount Varies by Quarter
0.150 0.150 0.200 0.250 0.330 0.500 0.750 3 3 5 5 8 8 8
Assumption of sales success per sales staffer (new direct accts OR new "channel" accts) Assumption of direct sales success per sales staffer
Recurring Revenue Sources Enterprise Sales to Repeat Owners
New Sales: Via Direct Sales 100.0% 100.0% 100.0% 100.0% 100.0% 100.0% 100.0% Assumes that percent of direct sales declines Via Insurance Company 0.0% 5.0% 10.0% 15.0% 50.0% 75.0% 100.0% Assumes that sales via insurance companies increase Via Construction Manager 10.0% 15.0% 30.0% 35.0% 50.0% 75.0% 100.0% Assumes that sales via construction managers increase
Subtotal New 110.0% 120.0% 140.0% 150.0% 200.0% 250.0% 300.0% Lost Accounts: 10% 10% 10% 10% 10% 10% 10% Assumes that some % of enterprise accounts are lost per quarter (rounded up)
Starting Total Enterprise Accounts 0
Enterprise Account Revenue Distribution Value/Qtr Value/Qtr Value/Qtr Value/Qtr Value/Qtr Value/Qtr Value/QtrLarge (percent of accts; rev per qtr) 5% 100,000 100,000 100,000 100,000 100,000 100,000 100,000 Assumes a mix in the size of enterprise accounts. Assumes stated value per account. Medium 35% 50,000 50,000 50,000 50,000 50,000 50,000 50,000 ((This is an approximation of how enterprise account values might be distributed)) Small 60% 12,500 12,500 12,500 12,500 12,500 12,500 12,500
Total 100% 30,000 30,000 30,000 30,000 30,000 30,000 30,000 Formula takes an average of the account mix for projection purposes
New Enterprise Bookings 4 Enterprise bookings counted for "x" quarters
Revenues from One-Time Projects End of 99 New Projects Sold Projects Concluded Qtrs Net Single Projects Underway 40 8 Avg Price Avg Price Avg Price Avg Price Avg Price Avg Price New Bookings - One time projects 25,000 25,000 23,000 23,000 20,000 20,000 15,000 Assumed average selling price of FirstLine only for one-time projects
Assumes that projects take 8 quarters on average to work off backlogBacklog worked off Quarters 8 8 Ending Backlog 500,000
Total All new FirstLine bookings
Collaborative Structures Confidential 01/25/2000 CS_PROFORMA_C_01 Page 2
Collaborative Structures, Inc. Sales Build and Pro Forma Financial Summary Model Rev Jan 22, 2000 Run time 1/25/00 5:21 PM
< ------- KEY INPUTS, FOR INDICATED PERIODS ------ > Start 2000 Q 1&2 2000 Q 3&4 2001 Q 1&2 2001 Q 3&4 2002 2003 2004 Notes
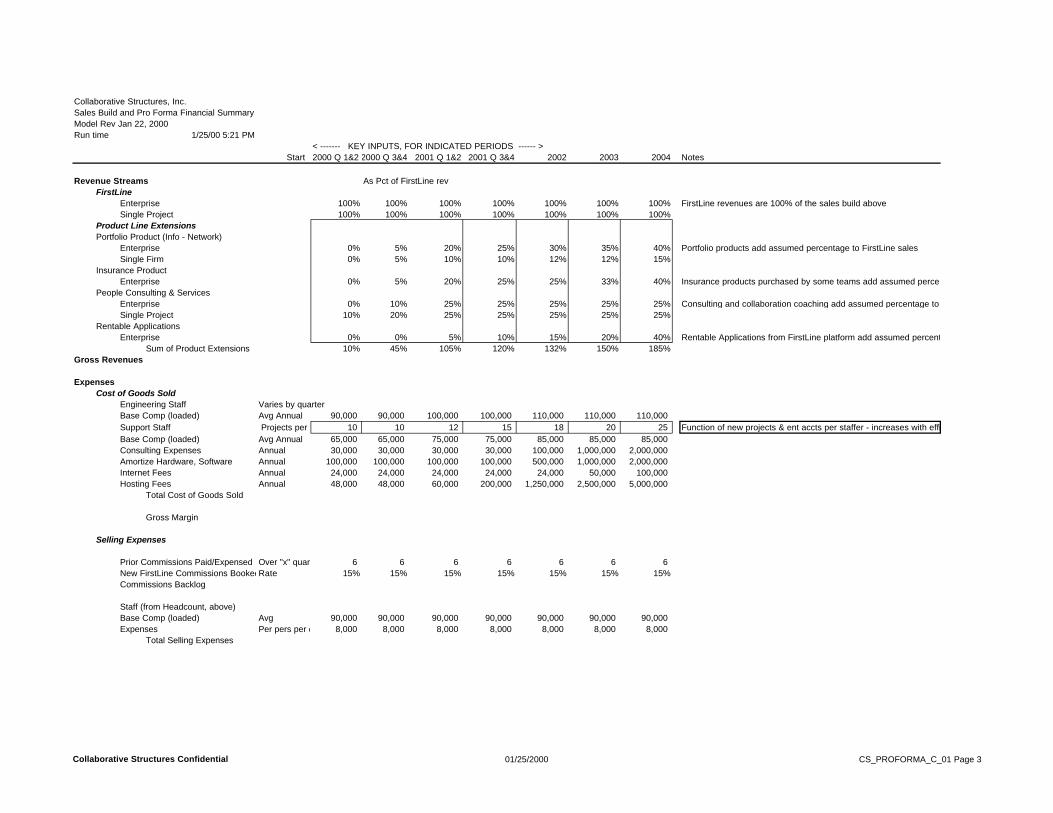
Revenue Streams As Pct of FirstLine rev FirstLine
Enterprise 100% 100% 100% 100% 100% 100% 100% FirstLine revenues are 100% of the sales build above Single Project
0%0%
0%
0%10%
0%
5%5%
5%
10%20%
0%
20%10%
20%
25%25%
5%
25%10%
25%
25%25%
10%
30%12%
25%
25%25%
15%
35%12%
33%
25%25%
20%
40%15%
40%
25%25%
40%
100% 100% 100% 100% 100% 100% 100%Product Line Extensions Portfolio Product (Info - Network)
Enterprise Portfolio products add assumed percentage to FirstLine sales Single Firm
Insurance Product Enterprise Insurance products purchased by some teams add assumed percentage to FL sales
People Consulting & Services Enterprise Consulting and collaboration coaching add assumed percentage to FL sales Single Project
Rentable Applications Enterprise Rentable Applications from FirstLine platform add assumed percentage to FL sales
Sum of Product Extensions 10% 45% 105% 120% 132% 150% 185% Gross Revenues
Expenses Cost of Goods Sold
Engineering Staff Varies by quarter Base Comp (loaded) Avg Annual 90,000 90,000 100,000 100,000 110,000 110,000 110,000 Support Staff Projects per Staff 10 10 12 15 18 20 25 Base Comp (loaded) Avg Annual 65,000 65,000 75,000 75,000 85,000 85,000 85,000 Consulting Expenses Annual 30,000 30,000 30,000 30,000 100,000 1,000,000 2,000,000 Amortize Hardware, Software Annual 100,000 100,000 100,000 100,000 500,000 1,000,000 2,000,000 Internet Fees Annual 24,000 24,000 24,000 24,000 24,000 50,000 100,000 Hosting Fees Annual 48,000 48,000 60,000 200,000 1,250,000 2,500,000 5,000,000
Total Cost of Goods Sold
Gross Margin
Selling Expenses
Prior Commissions Paid/Expensed Over "x" quarters 6 6 6 6 6 6 6 New FirstLine Commissions Booked Rate 15% 15% 15% 15% 15% 15% 15% Commissions Backlog
Staff (from Headcount, above) Base Comp (loaded) Avg 90,000 90,000 90,000 90,000 90,000 90,000 90,000 Expenses Per pers per qtr 8,000 8,000 8,000 8,000 8,000 8,000 8,000
Total Selling Expenses
Function of new projects & ent accts per staffer - increases with efficiency
Collaborative Structures Confidential 01/25/2000 CS_PROFORMA_C_01 Page 3

Collaborative Structures, Inc. Sales Build and Pro Forma Financial Summary Model Rev Jan 22, 2000 Run time 1/25/00 5:21 PM
< ------- KEY INPUTS, FOR INDICATED PERIODS ------ > Start 2000 Q 1&2 2000 Q 3&4 2001 Q 1&2 2001 Q 3&4 2002 2003 2004 Notes
Marketing Expenses Annual AnnualStaff Varies by QuarterBase Comp (loaded) Avg 80,000 80,000 100,000 100,000 110,000 110,000 110,000Promotion
Public Relations Annual 120,000 120,000 400,000 400,000 400,000 500,000 1,000,000Advertising Annual 200,000 500,000 750,000 1,000,000 1,500,000 5,000,000 10,000,000Trade Shows Annual 200,000 200,000 400,000 400,000 500,000 1,000,000 2,000,000Direct Mail Annual 200,000 400,000 500,000 500,000 1,000,000 1,000,000 1,000,000
Consulting Annual 60,000 100,000 100,000 100,000 500,000 1,000,000 2,000,000Collateral Annual 100,000 200,000 300,000 750,000 1,250,000 5,000,000 10,000,000
Total Marketing Expenses
R&D Staff Varies by quarterBase Comp (loaded) Avg 110,000 110,000 120,000 120,000 120,000 120,000 120,000Hardware Amortize Annual 40,000 40,000 200,000 200,000 250,000 500,000 1,000,000Software Amortize Annual 40,000 40,000 40,000 100,000 150,000 250,000 500,000Consulting & Contracting Expense Annual 100,000 100,000 200,000 500,000 500,000 3,500,000 7,000,000Licensing & Other Annual 40,000 40,000 500,000 750,000 1,250,000 5,000,000 10,000,000
Total R & D Expenses
G&A Staff Varies by quarterBase Comp (loaded) Avg 100,000 100,000 125,000 125,000 150,000 150,000 150,000Legal & Audit Annual 60,000 60,000 200,000 200,000 1,000,000 1,500,000 2,000,000Occupancy & Utilities (all depts) Annual 120,000 120,000 200,000 200,000 250,000 300,000 500,000Consulting Expense Annual 60,000 60,000 150,000 150,000 150,000 250,000 500,000Other Annual 30,000 30,000 30,000 100,000 500,000 1,000,000 2,000,000
Total G & A Expenses
Net Income
Headcount
Enterprise Members 125 175 200 225 250 300 350 Estimate for analysis - avg members per enterprise account Single Project Members 30 35 40 45 50 55 60 Estimate for analysis - avg members per single project
Total Project Members
Collaborative Structures Confidential 01/25/2000 CS_PROFORMA_C_01 Page 4

Collaborative Structures, Inc.Sales Build and Pro Forma Financial SummaryModel Rev Jan 22, 2000Run time 1/25/00 5:21 PM Total
Q 1 Q 2 Q 3 Q 4 Q 1 Q 2 Q 3 Q 4 Total 2000 2000 2000 2000 FY 2000 2001 2001 2001 2001 FY 2001
Summary Pro-Forma Financials Pct Rev Pct Rev Pct Cost Pct Cost
Revenues 92,500 152,188 362,018 654,547 1,261,252 100% 1,237,199 1,968,768 2,888,734 3,764,768 9,859,469 100% Cost of Goods Sold 128,004 160,506 215,509 231,760 735,779 58% 15% 378,516 416,018 413,516 432,267 1,640,317 17% 13%
Gross Margin (35,504) (8,319) 146,509 422,787 525,473 42% 858,683 1,552,750 2,475,218 3,332,501 8,219,152 83%
Selling Expenses 213,500 315,500 491,000 611,042 1,631,042 129% 33% 798,951 958,334 1,090,529 1,222,607 4,070,422 41% 33% Marketing 130,000 300,000 480,000 480,000 1,390,000 110% 28% 737,500 737,500 937,500 962,500 3,375,000 34% 28% Research & Development 115,000 135,000 155,000 155,000 560,000 44% 11% 385,000 410,000 587,500 587,500 1,970,000 20% 16% General and Administrative 147,500 147,500 167,500 167,500 630,000 50% 13% 245,000 265,000 337,500 337,500 1,185,000 12% 10%
100% 100% Net Income Before Taxes (641,504) (906,319) (1,146,991) (990,755) (3,685,569) -292% (1,307,768) (818,085) (477,810) 222,393 (2,381,270) -24%
Collaborative Structures Confidential 01/25/2000 CS_PROFORMA_C_01 Page 5

Collaborative Structures, Inc.Sales Build and Pro Forma Financial SummaryModel Rev Jan 22, 2000Run time 1/25/00 5:21 PM Total
Q 1 Q 2 Q 3 Q 4 Q 1 Q 2 Q 3 Q 4 Total 2000 2000 2000 2000 FY 2000 2001 2001 2001 2001 FY 2001
Sales Build *** < --- PROJECTIONS ---- > ***
Sales Force Sales Staff - Headcount 7 10 15 18 23 26 28 30
Assumption of sales success per sales staffer (new direct accts OR new "channel" accts)
Recurring Revenue Sources Enterprise Sales to Repeat Owners
New Sales: Via Direct Sales 1 2 2 3 5 5 7 8 Via Insurance Company 0 0 0 0 0 1 1 1 Via Construction Manager 0 0 0 1 1 2 2 3
Subtotal New 1 2 2 4 6 8 10 12 Lost Accounts: 0 0 0 0 1 1 2 3
Total Enterprise Accounts 1 2 4 8 8 13 20 28 37 37
Enterprise Account Revenue Distribution Large (percent of accts; rev per qtr) 5,000 10,000 20,000 40,000 75,000 65,000 100,000 140,000 185,000 490,000 Medium 17,500 35,000 70,000 140,000 262,500 227,500 350,000 490,000 647,500 1,715,000 Small 7,500 15,000 30,000 60,000 112,500 97,500 150,000 210,000 277,500 735,000
Total 30,000 60,000 120,000 240,000 450,000 390,000 600,000 840,000 1,110,000 2,940,000
New Enterprise Bookings 120,000 240,000 240,000 480,000 1,080,000 720,000 960,000 1,200,000 1,440,000 4,320,000
Revenues from One-Time Projects New Projects Sold 12 30 45 54 141 115 130 140 150 535 Projects Concluded 2 4 10 14 19 31 43 55 Net Single Projects Underway 50 76 111 151 247 346 443 538 New Bookings - One time projects 300,000 750,000 1,125,000 1,350,000 3,525,000 2,645,000 2,990,000 3,220,000 3,450,000 12,305,000 Backlog worked off 62,500 92,188 174,414 293,237 622,339 425,333 702,791 988,692 1,267,606 3,384,422 Ending Backlog 737,500 1,395,313 2,345,898 3,402,661 5,622,328 7,909,537 10,140,845 12,323,240
Total All new FirstLine bookings 420,000 990,000 1,365,000 1,830,000 4,605,000 3,365,000 3,950,000 4,420,000 4,890,000 16,625,000
Collaborative Structures Confidential 01/25/2000 CS_PROFORMA_C_01 Page 6

Collaborative Structures, Inc.Sales Build and Pro Forma Financial SummaryModel Rev Jan 22, 2000Run time 1/25/00 5:21 PM Total
Q 1 Q 2 Q 3 Q 4 Q 1 Q 2 Q 3 Q 4 Total 2000 2000 2000 2000 FY 2000 2001 2001 2001 2001 FY 2001
Revenue Streams FirstLine
Enterprise 30,000 60,000 120,000 240,000 450,000 36% 390,000 600,000 840,000 1,110,000 2,940,000 30% Single Project 62,500 92,188 174,414 293,237 622,339 49% 425,333 702,791 988,692 1,267,606 3,384,422 34%
Product Line Extensions Portfolio Product (Info - Network)
Enterprise 0 0 6,000 12,000 18,000 1% 78,000 120,000 210,000 277,500 685,500 7% Single Firm 0 0 8,721 14,662 23,383 2% 42,533 70,279 98,869 126,761 338,442 3%
Insurance Product Enterprise 0 0 6,000 12,000 18,000 1% 78,000 120,000 210,000 277,500 685,500 7%
People Consulting & Services Enterprise 0 0 12,000 24,000 36,000 3% 97,500 150,000 210,000 277,500 735,000 7% Single Project 0 0 34,883 58,647 93,530 7% 106,333 175,698 247,173 316,901 846,105 9%
Rentable Applications Enterprise 0 0 0 0 0 0% 19,500 30,000 84,000 111,000 244,500 2%
Sum of Product Extensions Gross Revenues 92,500 152,188 362,018 654,547 1,261,252 100% 1,237,199 1,968,768 2,888,734 3,764,768 9,859,469 100%
Expenses Cost of Goods Sold
Engineering Staff 2 2 3 3 4 4 4 4 Base Comp (loaded) 45,000 45,000 67,500 67,500 225,000 100,000 100,000 100,000 100,000 400,000 Support Staff 2 4 6 7 12 14 12 13 Base Comp (loaded) 32,500 65,000 97,500 113,750 308,750 225,000 262,500 225,000 243,750 956,250 Consulting Expenses 7,500 7,500 7,500 7,500 30,000 7,500 7,500 7,500 7,500 30,000 Amortize Hardware, Software 25,000 25,000 25,000 25,000 100,000 25,000 25,000 25,000 25,000 100,000 Internet Fees 6,000 6,000 6,000 6,000 24,000 6,000 6,000 6,000 6,000 24,000 Hosting Fees 12,000 12,000 12,000 12,000 48,000 15,000 15,000 50,000 50,000 130,000
Total Cost of Goods Sold 128,004 160,506 215,509 231,760 735,779 378,516 416,018 413,516 432,267 1,640,317
Gross Margin (35,504) (8,319) 146,509 422,787 525,473 858,683 1,552,750 2,475,218 3,332,501 8,219,152
Selling Expenses
Prior Commissions Paid/Expensed 0 10,500 33,500 62,042 97,451 165,334 236,529 307,607 New FirstLine Commissions Booked 63,000 148,500 204,750 274,500 690,750 504,750 592,500 663,000 733,500 2,493,750 Commissions Backlog 63,000 201,000 372,250 584,708 992,007 1,419,172 1,845,644 2,271,536
Staff (from Headcount, above) 7 10 15 18 23 26 28 30 Base Comp (loaded) 157,500 225,000 337,500 405,000 1,125,000 517,500 585,000 630,000 675,000 2,407,500 Expenses 56,000 80,000 120,000 144,000 400,000 184,000 208,000 224,000 240,000 856,000
Total Selling Expenses 213,500 315,500 491,000 611,042 1,631,042 798,951 958,334 1,090,529 1,222,607 4,070,422
Collaborative Structures Confidential 01/25/2000 CS_PROFORMA_C_01 Page 7

Collaborative Structures, Inc.Sales Build and Pro Forma Financial SummaryModel Rev Jan 22, 2000Run time 1/25/00 5:21 PM Total
Q 1 Q 2 Q 3 Q 4 Q 1 Q 2 Q 3 Q 4 Total 2000 2000 2000 2000 FY 2000 2001 2001 2001 2001 FY 2001
Marketing Expenses Staff 3 4 5 5 5 5 6 7 Base Comp (loaded) 60,000 80,000 100,000 100,000 340,000 125,000 125,000 150,000 175,000 575,000 Promotion
Public Relations 15,000 30,000 30,000 30,000 105,000 100,000 100,000 100,000 100,000 400,000 Advertising 10,000 50,000 125,000 125,000 310,000 187,500 187,500 250,000 250,000 875,000 Trade Shows 5,000 50,000 50,000 50,000 155,000 100,000 100,000 100,000 100,000 400,000 Direct Mail 20,000 50,000 100,000 100,000 270,000 125,000 125,000 125,000 125,000 500,000
Consulting 10,000 15,000 25,000 25,000 75,000 25,000 25,000 25,000 25,000 100,000 Collateral 10,000 25,000 50,000 50,000 135,000 75,000 75,000 187,500 187,500 525,000
Total Marketing Expenses 130,000 300,000 480,000 480,000 1,390,000 737,500 737,500 937,500 962,500 3,375,000
R&D Staff 3 4 5 5 6 7 8 8 Base Comp (loaded) 60,000 80,000 100,000 100,000 340,000 150,000 175,000 200,000 200,000 725,000 Hardware Amortize 10,000 10,000 10,000 10,000 40,000 50,000 50,000 50,000 50,000 200,000 Software Amortize 10,000 10,000 10,000 10,000 40,000 10,000 10,000 25,000 25,000 70,000 Consulting & Contracting Expense 25,000 25,000 25,000 25,000 100,000 50,000 50,000 125,000 125,000 350,000 Licensing & Other 10,000 10,000 10,000 10,000 40,000 125,000 125,000 187,500 187,500 625,000
Total R & D Expenses 115,000 135,000 155,000 155,000 560,000 385,000 410,000 587,500 587,500 1,970,000
G&A Staff 4 4 5 5 5 6 7 7 Base Comp (loaded) 80,000 80,000 100,000 100,000 360,000 100,000 120,000 175,000 175,000 570,000 Legal & Audit 15,000 15,000 15,000 15,000 60,000 50,000 50,000 50,000 50,000 200,000 Occupancy & Utilities (all depts) 30,000 30,000 30,000 30,000 120,000 50,000 50,000 50,000 50,000 200,000 Consulting Expense 15,000 15,000 15,000 15,000 60,000 37,500 37,500 37,500 37,500 150,000 Other 7,500 7,500 7,500 7,500 30,000 7,500 7,500 25,000 25,000 65,000
Total G & A Expenses 147,500 147,500 167,500 167,500 630,000 245,000 265,000 337,500 337,500 1,185,000
Net Income (641,504) (906,319) (1,146,991) (990,755) (3,685,569) (1,307,768) (818,085) (477,810) 222,393 (2,381,270)
Headcount 21 28 39 43 55 62 65 69
Enterprise Members 125 250 700 1,400 2,600 4,000 6,300 8,325 Single Project Members 1,500 2,280 3,885 5,285 9,880 13,840 19,935 24,210
Total Project Members 1,625 2,530 4,585 6,685 12,480 17,840 26,235 32,535
Collaborative Structures Confidential 01/25/2000 CS_PROFORMA_C_01 Page 8
Collaborative Structures, Inc.Sales Build and Pro Forma Financial SummaryModel Rev Jan 22, 2000Run time 1/25/00 5:21 PM
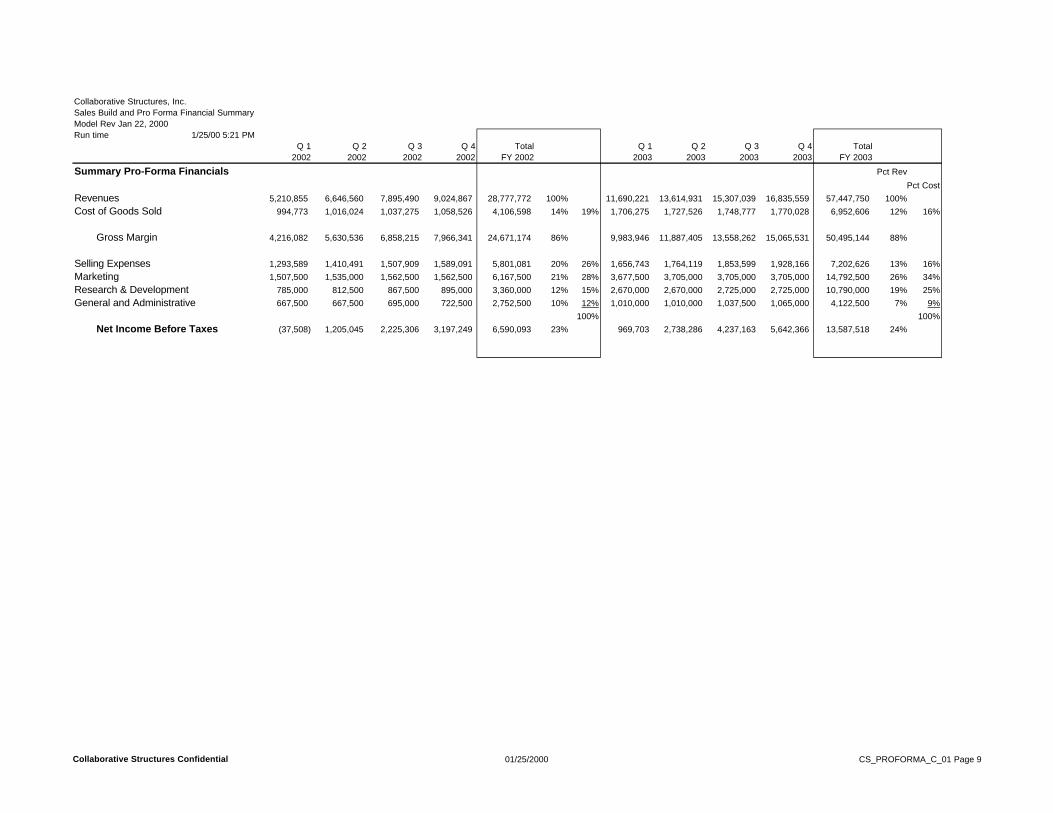
Q 1 Q 2 Q 3 Q 4 Total Q 1 Q 2 Q 3 Q 4 Total 2002 2002 2002 2002 FY 2002 2003 2003 2003 2003 FY 2003
Summary Pro-Forma Financials Pct Rev Pct Cost
Revenues 5,210,855 6,646,560 7,895,490 9,024,867 28,777,772 100% 11,690,221 13,614,931 15,307,039 16,835,559 57,447,750 100% Cost of Goods Sold 994,773 1,016,024 1,037,275 1,058,526 4,106,598 14% 19% 1,706,275 1,727,526 1,748,777 1,770,028 6,952,606 12% 16%
Gross Margin 4,216,082 5,630,536 6,858,215 7,966,341 24,671,174 86% 9,983,946 11,887,405 13,558,262 15,065,531 50,495,144 88%
Selling Expenses 1,293,589 1,410,491 1,507,909 1,589,091 5,801,081 20% 26% 1,656,743 1,764,119 1,853,599 1,928,166 7,202,626 13% 16% Marketing 1,507,500 1,535,000 1,562,500 1,562,500 6,167,500 21% 28% 3,677,500 3,705,000 3,705,000 3,705,000 14,792,500 26% 34% Research & Development 785,000 812,500 867,500 895,000 3,360,000 12% 15% 2,670,000 2,670,000 2,725,000 2,725,000 10,790,000 19% 25% General and Administrative 667,500 667,500 695,000 722,500 2,752,500 10% 12% 1,010,000 1,010,000 1,037,500 1,065,000 4,122,500 7% 9%
100% 100% Net Income Before Taxes (37,508) 1,205,045 2,225,306 3,197,249 6,590,093 23% 969,703 2,738,286 4,237,163 5,642,366 13,587,518 24%
Collaborative Structures Confidential 01/25/2000 CS_PROFORMA_C_01 Page 9

Collaborative Structures, Inc.Sales Build and Pro Forma Financial SummaryModel Rev Jan 22, 2000Run time 1/25/00 5:21 PM
Q 1 Q 2 Q 3 Q 4 Total Q 1 Q 2 Q 3 Q 4 Total 2002 2002 2002 2002 FY 2002 2003 2003 2003 2003 FY 2003
Sales Build
Sales Force Sales Staff - Headcount 30 30 30 30 30 30 30 30
Recurring Revenue Sources Enterprise Sales to Repeat Owners
New Sales: Via Direct Sales 10 10 10 10 15 15 15 15 Via Insurance Company 5 5 5 5 11 11 11 11 Via Construction Manager 5 5 5 5 11 11 11 11
Subtotal New 20 20 20 20 37 37 37 37 Lost Accounts: 4 5 7 8 9 12 15 17
Total Enterprise Accounts 53 68 81 93 93 121 146 168 188 188
Enterprise Account Revenue Distribution Large (percent of accts; rev per qtr) 265,000 340,000 405,000 465,000 1,475,000 605,000 730,000 840,000 940,000 3,115,000 Medium 927,500 1,190,000 1,417,500 1,627,500 5,162,500 2,117,500 2,555,000 2,940,000 3,290,000 10,902,500 Small 397,500 510,000 607,500 697,500 2,212,500 907,500 1,095,000 1,260,000 1,410,000 4,672,500
Total 1,590,000 2,040,000 2,430,000 2,790,000 8,850,000 3,630,000 4,380,000 5,040,000 5,640,000 18,690,000
New Enterprise Bookings 2,400,000 2,400,000 2,400,000 2,400,000 9,600,000 4,440,000 4,440,000 4,440,000 4,440,000 17,760,000
Revenues from One-Time Projects New Projects Sold 240 240 240 240 960 240 240 240 240 960 Projects Concluded 67 89 108 124 139 151 163 172 Net Single Projects Underway 711 862 994 1,110 1,211 1,300 1,377 1,445 New Bookings - One time projects 4,800,000 4,800,000 4,800,000 4,800,000 19,200,000 4,800,000 4,800,000 4,800,000 4,800,000 19,200,000 Backlog worked off 1,540,405 1,947,854 2,304,373 2,616,326 8,408,958 2,889,285 3,128,125 3,337,109 3,519,970 12,874,489 Ending Backlog 15,582,835 18,434,980 20,930,608 23,114,282 25,024,997 26,696,872 28,159,763 29,439,793
Total All new FirstLine bookings 7,200,000 7,200,000 7,200,000 7,200,000 28,800,000 9,240,000 9,240,000 9,240,000 9,240,000 36,960,000
Collaborative Structures Confidential 01/25/2000 CS_PROFORMA_C_01 Page 10

Collaborative Structures, Inc.Sales Build and Pro Forma Financial SummaryModel Rev Jan 22, 2000Run time 1/25/00 5:21 PM
Q 1 Q 2 Q 3 Q 4 Total Q 1 Q 2 Q 3 Q 4 Total 2002 2002 2002 2002 FY 2002 2003 2003 2003 2003 FY 2003
Revenue Streams FirstLine
Enterprise 1,590,000 2,040,000 2,430,000 2,790,000 8,850,000 31% 3,630,000 4,380,000 5,040,000 5,640,000 18,690,000 33% Single Project 1,540,405 1,947,854 2,304,373 2,616,326 8,408,958 29% 2,889,285 3,128,125 3,337,109 3,519,970 12,874,489 22%
Product Line Extensions Portfolio Product (Info - Network)
Enterprise 477,000 612,000 729,000 837,000 2,655,000 9% 1,270,500 1,533,000 1,764,000 1,974,000 6,541,500 11% Single Firm 184,849 233,743 276,525 313,959 1,009,075 4% 346,714 375,375 400,453 422,396 1,544,939 3%
Insurance Product Enterprise 397,500 510,000 607,500 697,500 2,212,500 8% 1,197,900 1,445,400 1,663,200 1,861,200 6,167,700 11%
People Consulting & Services Enterprise 397,500 510,000 607,500 697,500 2,212,500 8% 907,500 1,095,000 1,260,000 1,410,000 4,672,500 8% Single Project 385,101 486,964 576,093 654,081 2,102,239 7% 722,321 782,031 834,277 879,993 3,218,622 6%
Rentable Applications Enterprise 238,500 306,000 364,500 418,500 1,327,500 5% 726,000 876,000 1,008,000 1,128,000 3,738,000 7%
Sum of Product Extensions Gross Revenues 5,210,855 6,646,560 7,895,490 9,024,867 28,777,772 100% 11,690,221 13,614,931 15,307,039 16,835,559 57,447,750 100%
Expenses Cost of Goods Sold
Engineering Staff 6 6 6 6 6 6 6 6 Base Comp (loaded) 165,000 165,000 165,000 165,000 660,000 165,000 165,000 165,000 165,000 660,000 Support Staff 17 18 19 20 19 20 21 22 Base Comp (loaded) 361,250 382,500 403,750 425,000 1,572,500 403,750 425,000 446,250 467,500 1,742,500 Consulting Expenses 25,000 25,000 25,000 25,000 100,000 250,000 250,000 250,000 250,000 1,000,000 Amortize Hardware, Software 125,000 125,000 125,000 125,000 500,000 250,000 250,000 250,000 250,000 1,000,000 Internet Fees 6,000 6,000 6,000 6,000 24,000 12,500 12,500 12,500 12,500 50,000 Hosting Fees 312,500 312,500 312,500 312,500 1,250,000 625,000 625,000 625,000 625,000 2,500,000
Total Cost of Goods Sold 994,773 1,016,024 1,037,275 1,058,526 4,106,598 1,706,275 1,727,526 1,748,777 1,770,028 6,952,606
Gross Margin 4,216,082 5,630,536 6,858,215 7,966,341 24,671,174 9,983,946 11,887,405 13,558,262 15,065,531 50,495,144
Selling Expenses
Prior Commissions Paid/Expensed 378,589 495,491 592,909 674,091 741,743 849,119 938,599 1,013,166 New FirstLine Commissions Booked 1,080,000 1,080,000 1,080,000 1,080,000 4,320,000 1,386,000 1,386,000 1,386,000 1,386,000 5,544,000 Commissions Backlog 2,972,947 3,557,456 4,044,547 4,450,455 5,094,713 5,631,594 6,078,995 6,451,829
Staff (from Headcount, above) 30 30 30 30 30 30 30 30 Base Comp (loaded) 675,000 675,000 675,000 675,000 2,700,000 675,000 675,000 675,000 675,000 2,700,000 Expenses 240,000 240,000 240,000 240,000 960,000 240,000 240,000 240,000 240,000 960,000
Total Selling Expenses 1,293,589 1,410,491 1,507,909 1,589,091 5,801,081 1,656,743 1,764,119 1,853,599 1,928,166 7,202,626
Collaborative Structures Confidential 01/25/2000 CS_PROFORMA_C_01 Page 11

Collaborative Structures, Inc.Sales Build and Pro Forma Financial SummaryModel Rev Jan 22, 2000Run time 1/25/00 5:21 PM
Q 1 Q 2 Q 3 Q 4 Total Q 1 Q 2 Q 3 Q 4 Total 2002 2002 2002 2002 FY 2002 2003 2003 2003 2003 FY 2003
Marketing Expenses Staff 8 9 10 10 11 12 12 12 Base Comp (loaded) 220,000 247,500 275,000 275,000 1,017,500 302,500 330,000 330,000 330,000 1,292,500 Promotion
Public Relations 100,000 100,000 100,000 100,000 400,000 125,000 125,000 125,000 125,000 500,000 Advertising 375,000 375,000 375,000 375,000 1,500,000 1,250,000 1,250,000 1,250,000 1,250,000 5,000,000 Trade Shows 125,000 125,000 125,000 125,000 500,000 250,000 250,000 250,000 250,000 1,000,000 Direct Mail 250,000 250,000 250,000 250,000 1,000,000 250,000 250,000 250,000 250,000 1,000,000
Consulting 125,000 125,000 125,000 125,000 500,000 250,000 250,000 250,000 250,000 1,000,000 Collateral 312,500 312,500 312,500 312,500 1,250,000 1,250,000 1,250,000 1,250,000 1,250,000 5,000,000
Total Marketing Expenses 1,507,500 1,535,000 1,562,500 1,562,500 6,167,500 3,677,500 3,705,000 3,705,000 3,705,000 14,792,500
R&D Staff 9 10 12 13 13 13 15 15 Base Comp (loaded) 247,500 275,000 330,000 357,500 1,210,000 357,500 357,500 412,500 412,500 1,540,000 Hardware Amortize 62,500 62,500 62,500 62,500 250,000 125,000 125,000 125,000 125,000 500,000 Software Amortize 37,500 37,500 37,500 37,500 150,000 62,500 62,500 62,500 62,500 250,000 Consulting & Contracting Expense 125,000 125,000 125,000 125,000 500,000 875,000 875,000 875,000 875,000 3,500,000 Licensing & Other 312,500 312,500 312,500 312,500 1,250,000 1,250,000 1,250,000 1,250,000 1,250,000 5,000,000
Total R & D Expenses 785,000 812,500 867,500 895,000 3,360,000 2,670,000 2,670,000 2,725,000 2,725,000 10,790,000
G&A Staff 7 7 8 9 9 9 10 11 Base Comp (loaded) 192,500 192,500 220,000 247,500 852,500 247,500 247,500 275,000 302,500 1,072,500 Legal & Audit 250,000 250,000 250,000 250,000 1,000,000 375,000 375,000 375,000 375,000 1,500,000 Occupancy & Utilities (all depts) 62,500 62,500 62,500 62,500 250,000 75,000 75,000 75,000 75,000 300,000 Consulting Expense 37,500 37,500 37,500 37,500 150,000 62,500 62,500 62,500 62,500 250,000 Other 125,000 125,000 125,000 125,000 500,000 250,000 250,000 250,000 250,000 1,000,000
Total G & A Expenses 667,500 667,500 695,000 722,500 2,752,500 1,010,000 1,010,000 1,037,500 1,065,000 4,122,500
Net Income (37,508) 1,205,045 2,225,306 3,197,249 6,590,093 969,703 2,738,286 4,237,163 5,642,366 13,587,518
Headcount 77 80 85 88 88 90 94 96
Enterprise Members 13,250 17,000 20,250 23,250 36,300 43,800 50,400 56,400 Single Project Members 35,550 43,100 49,700 55,500 66,605 71,500 75,735 79,475
Total Project Members 48,800 60,100 69,950 78,750 102,905 115,300 126,135 135,875
Collaborative Structures Confidential 01/25/2000 CS_PROFORMA_C_01 Page 12

Collaborative Structures, Inc.Sales Build and Pro Forma Financial SummaryModel Rev Jan 22, 2000Run time 1/25/00 5:21 PM
Q 1 Q 2 Q 3 Q 4 Total 2004 2004 2004 2004 FY 2004
Summary Pro-Forma Financials Pct Rev Pct Cost
Revenues 21,762,964 24,142,968 26,317,347 28,284,241 100,507,520 100% Cost of Goods Sold 2,822,524 2,843,775 2,886,277 2,907,528 11,460,104 11% 16%
Gross Margin 18,940,440 21,299,193 23,431,070 25,376,713 89,047,416 89%
Selling Expenses 1,837,805 1,904,587 1,960,239 2,006,616 7,709,248 8% 11% Marketing 6,857,500 6,885,000 6,912,500 6,912,500 27,567,500 27% 38% Research & Development 5,037,500 5,037,500 5,065,000 5,092,500 20,232,500 20% 28% General and Administrative 1,552,500 1,580,000 1,607,500 1,607,500 6,347,500 6% 9%
100% Net Income Before Taxes 3,655,135 5,892,106 7,885,831 9,757,597 27,190,668 27%
Collaborative Structures Confidential 01/25/2000 CS_PROFORMA_C_01 Page 13

Collaborative Structures, Inc.Sales Build and Pro Forma Financial SummaryModel Rev Jan 22, 2000Run time 1/25/00 5:21 PM
Q 1 Q 2 Q 3 Q 4 Total 2004 2004 2004 2004 FY 2004
Sales Build
Sales Force Sales Staff - Headcount 25 25 25 25
Recurring Revenue Sources Enterprise Sales to Repeat Owners
New Sales: Via Direct Sales 19 19 19 19 Via Insurance Company 19 19 19 19 Via Construction Manager 19 19 19 19
Subtotal New 57 57 57 57 Lost Accounts: 19 23 26 29
Total Enterprise Accounts 226 260 291 319 319
Enterprise Account Revenue Distribution Large (percent of accts; rev per qtr) 1,130,000 1,300,000 1,455,000 1,595,000 5,480,000 Medium 3,955,000 4,550,000 5,092,500 5,582,500 19,180,000 Small 1,695,000 1,950,000 2,182,500 2,392,500 8,220,000
Total 6,780,000 7,800,000 8,730,000 9,570,000 32,880,000
New Enterprise Bookings 6,840,000 6,840,000 6,840,000 6,840,000 27,360,000
Revenues from One-Time Projects New Projects Sold 200 200 200 200 800 Projects Concluded 181 183 185 187 Net Single Projects Underway 1,464 1,481 1,496 1,509 New Bookings - One time projects 3,000,000 3,000,000 3,000,000 3,000,000 12,000,000 Backlog worked off 3,679,974 3,594,977 3,520,605 3,455,530 14,251,086 Ending Backlog 28,759,819 28,164,841 27,644,236 27,188,707
Total All new FirstLine bookings 9,840,000 9,840,000 9,840,000 9,840,000 39,360,000
Collaborative Structures Confidential 01/25/2000 CS_PROFORMA_C_01 Page 14
Collaborative Structures, Inc.Sales Build and Pro Forma Financial SummaryModel Rev Jan 22, 2000Run time 1/25/00 5:21 PM
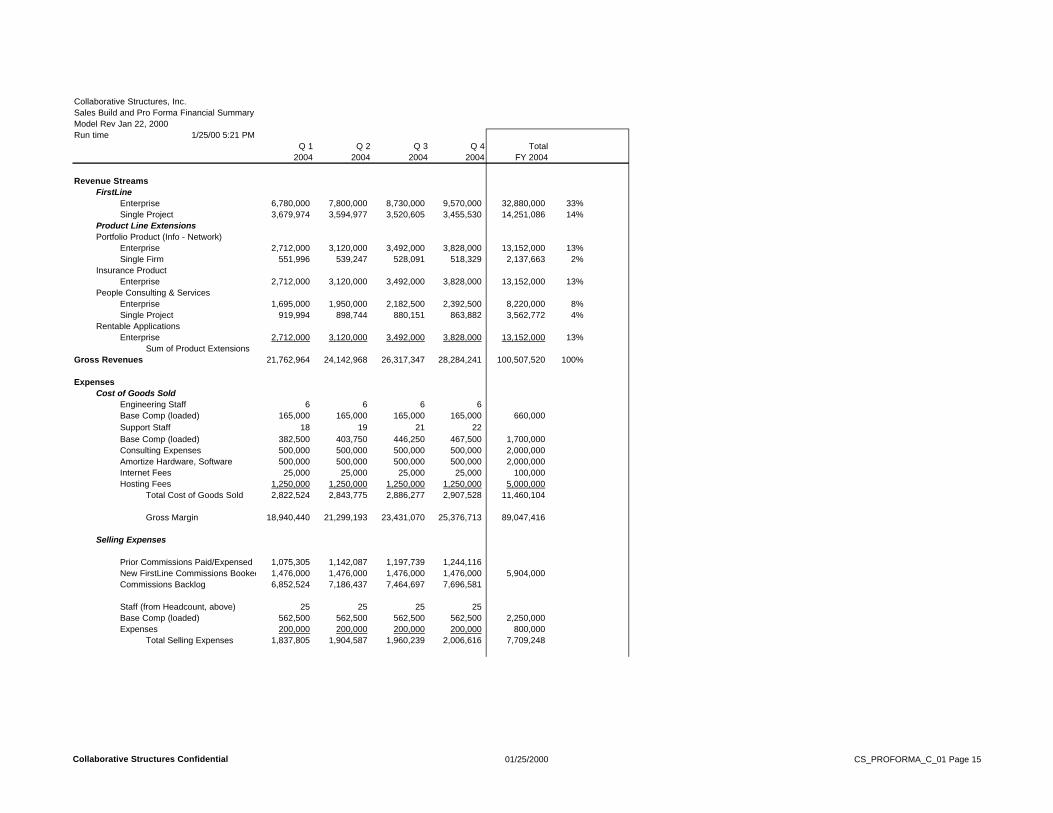
Q 1 Q 2 Q 3 Q 4 Total 2004 2004 2004 2004 FY 2004
Revenue Streams FirstLine
Enterprise 6,780,000 7,800,000 8,730,000 9,570,000 32,880,000 33% Single Project 3,679,974 3,594,977 3,520,605 3,455,530 14,251,086 14%
Product Line Extensions Portfolio Product (Info - Network)
Enterprise 2,712,000 3,120,000 3,492,000 3,828,000 13,152,000 13% Single Firm 551,996 539,247 528,091 518,329 2,137,663 2%
Insurance Product Enterprise 2,712,000 3,120,000 3,492,000 3,828,000 13,152,000 13%
People Consulting & Services Enterprise 1,695,000 1,950,000 2,182,500 2,392,500 8,220,000 8% Single Project 919,994 898,744 880,151 863,882 3,562,772 4%
Rentable Applications Enterprise 2,712,000 3,120,000 3,492,000 3,828,000 13,152,000 13%
Sum of Product Extensions Gross Revenues 21,762,964 24,142,968 26,317,347 28,284,241 100,507,520 100%
Expenses Cost of Goods Sold
Engineering Staff 6 6 6 6 Base Comp (loaded) 165,000 165,000 165,000 165,000 Support Staff 18 Base Comp (loaded) 382,500
660,000 19 21 22
403,750 446,250 467,500 1,700,000 Consulting Expenses 500,000 500,000 500,000 500,000 2,000,000 Amortize Hardware, Software 500,000 500,000 500,000 500,000 2,000,000 Internet Fees 25,000 25,000 25,000 25,000 100,000 Hosting Fees 1,250,000 1,250,000 1,250,000 1,250,000 5,000,000
Total Cost of Goods Sold 2,822,524 2,843,775 2,886,277 2,907,528 11,460,104
Gross Margin 18,940,440 21,299,193 23,431,070 25,376,713 89,047,416
Selling Expenses
Prior Commissions Paid/Expensed 1,075,305 1,142,087 1,197,739 1,244,116 New FirstLine Commissions Booked 1,476,000 1,476,000 1,476,000 1,476,000 5,904,000 Commissions Backlog 6,852,524 7,186,437 7,464,697 7,696,581
Staff (from Headcount, above) 25 25 25 25 Base Comp (loaded) 562,500 562,500 562,500 562,500 2,250,000 Expenses 200,000 200,000 200,000 200,000 800,000
Total Selling Expenses 1,837,805 1,904,587 1,960,239 2,006,616 7,709,248
Collaborative Structures Confidential 01/25/2000 CS_PROFORMA_C_01 Page 15
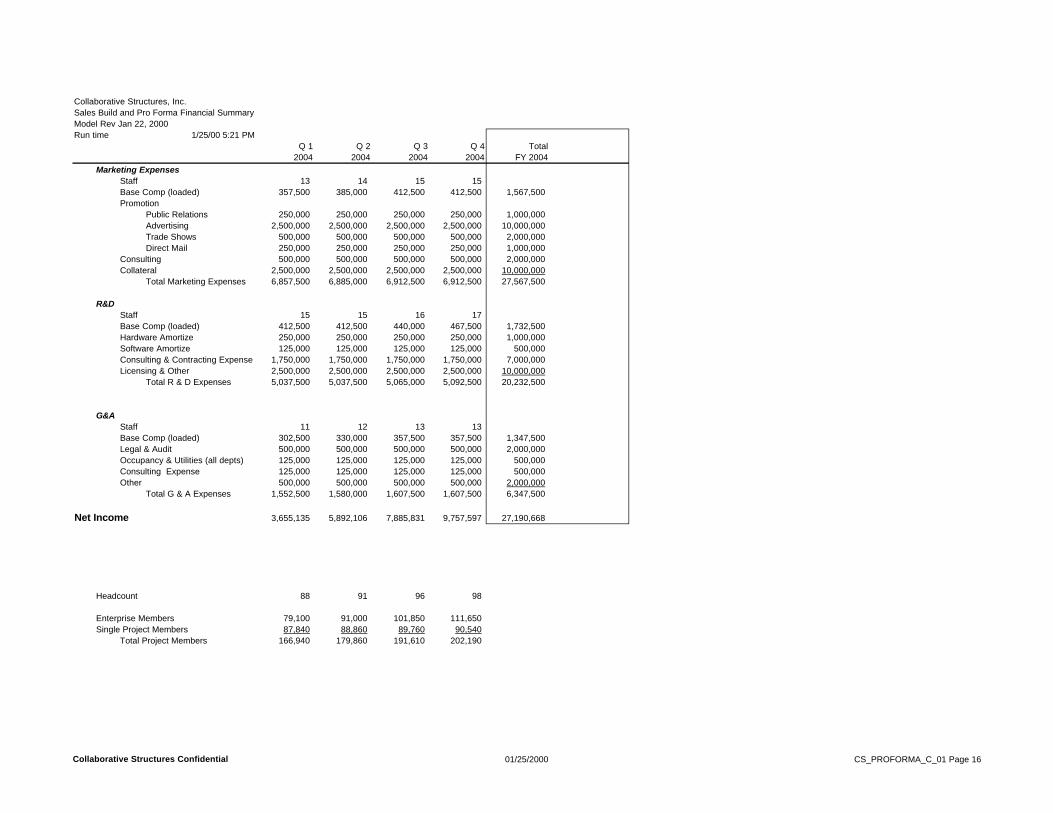
Collaborative Structures, Inc.Sales Build and Pro Forma Financial SummaryModel Rev Jan 22, 2000Run time 1/25/00 5:21 PM
Q 1 Q 2 Q 3 Q 4 Total 2004 2004 2004 2004 FY 2004
Marketing Expenses Staff 13 14 15 15 Base Comp (loaded) 357,500 385,000 412,500 412,500 1,567,500 Promotion
Public Relations 250,000 250,000 250,000 250,000 1,000,000 Advertising 2,500,000 2,500,000 2,500,000 2,500,000 10,000,000 Trade Shows 500,000 500,000 500,000 500,000 2,000,000 Direct Mail 250,000 250,000 250,000 250,000 1,000,000
Consulting 500,000 500,000 500,000 500,000 2,000,000 Collateral 2,500,000 2,500,000 2,500,000 2,500,000 10,000,000
Total Marketing Expenses 6,857,500 6,885,000 6,912,500 6,912,500 27,567,500
R&D Staff 15 15 16 17 Base Comp (loaded) 412,500 412,500 440,000 467,500 1,732,500 Hardware Amortize 250,000 250,000 250,000 250,000 1,000,000 Software Amortize 125,000 125,000 125,000 125,000 500,000 Consulting & Contracting Expense 1,750,000 1,750,000 1,750,000 1,750,000 7,000,000 Licensing & Other 2,500,000 2,500,000 2,500,000 2,500,000 10,000,000
Total R & D Expenses 5,037,500 5,037,500 5,065,000 5,092,500 20,232,500
G&A Staff 11 12 13 13 Base Comp (loaded) 302,500 330,000 357,500 357,500 1,347,500 Legal & Audit 500,000 500,000 500,000 500,000 2,000,000 Occupancy & Utilities (all depts) 125,000 125,000 125,000 125,000 500,000 Consulting Expense 125,000 125,000 125,000 125,000 500,000 Other 500,000 500,000 500,000 500,000 2,000,000
Total G & A Expenses 1,552,500 1,580,000 1,607,500 1,607,500 6,347,500
Net Income 3,655,135 5,892,106 7,885,831 9,757,597 27,190,668
Headcount 88 91 96 98
Enterprise Members 79,100 91,000 101,850 111,650 Single Project Members 87,840 88,860 89,760 90,540
Total Project Members 166,940 179,860 191,610 202,190
Collaborative Structures Confidential 01/25/2000 CS_PROFORMA_C_01 Page 16