collaborative quality framework: qoe-centric service
TRANSCRIPT
1554IEICE TRANS. COMMUN., VOL.E100–B, NO.9 SEPTEMBER 2017
INVITED PAPER Special Issue on the Past, Present, and Future of Communications Technologies in the IEICE
Collaborative Quality Framework: QoE-Centric Service Operationin Collaboration with Users, Service Providers, and NetworkOperators
Akira TAKAHASHI†a), Senior Member and Takanori HAYASHI†, Member
SUMMARY We propose a framework called “QoE-centric Service Op-eration,” with which we attempt to implement a means to enable the collab-oration of end-users, service providers, and network providers to achievebetter QoE of telecommunication services. First, we give an overview ofthe transition in the quality factors of voice, video, and web-browsing ap-plications. Then, taking into account the fact that many quality factors existnot only in networks, but also in servers and terminals, we discuss how tomeasure, assess, analyze, and control QoE and the technical requirementsin each component. We also propose approaches to meet these require-ments: packet- and KPI-based QoE estimation, compensation of sparsemeasurement, and quality prediction based on human behavior and trafficestimation. Finally, we explain the results of our proof-of-concept studyusing an actual video delivery service in Japan.key words: QoE, operation, quality, QoS
1. Introduction
The business environment of telecommunications serviceshas changed drastically not only in Japan but worldwidein the 1980s. In the United States, AT&T was broken upin 1982. In Japan, NTT was privatized in 1985 and laterbroken up into local, long-distance, and mobile companies.After such restructuring, users can choose their preferredterminals, such as personal computers, as well as telephonesets, and connect them to networks. Many service providershave ventured into telecommunications business, offeringvarious attractive applications by using carrier networks.
Telecommunication carriers have been making everyeffort to improve user quality of experience (QoE) [1] sincethe telephone era, which forms an important part of usersatisfaction for telecommunication services. However, theabove-mentioned situation makes it difficult for telecommu-nication carriers to have full control of QoE. Thus, improvingQoE requires collaboration with other players in the ecosys-tem.
Another aspect that has recently become important toimprove QoE is “flexible quality management.” Radio ac-cess and software defined network/network function virtual-ization (SDN/NFV) are the key network technologies usedin current and future telecommunication services, and oneof the common features of these technologies is “time-space
Manuscript received October 14, 2016.Manuscript revised January 26, 2017.Manuscript publicized March 22, 2017.
†The authors are with NTT, Musashino-shi, 180-8585 Japan.a) E-mail: [email protected]
DOI: 10.1587/transcom.2016PFI0013
variability” of network performance. Therefore, dynamicquality management is more important than pre-service qual-ity planning of networks.
From these viewpoints, we propose a framework inwhich all the players in the ecosystem, i.e., end users, serviceproviders and network providers, cooperate and collaborateto improve the QoE of telecommunication services. We callthis framework “QoE-centric Service Operation.”
In this paper, we first review the history of QoE studiesin telecommunications in terms of voice, video, and web-browsing applications to help in understanding the funda-mentals behind the discussion in the following sections. Westart discussion by defining the requirements on the technolo-gies composing the proposed framework. Then, we discusspossible approaches to meet them. Finally, we introduce ourstate-of-the-art investigation on the proposed framework, ap-plying it to one of the most popular video delivery servicesin Japan.
2. QoE Dimensions
2.1 Voice Communications
The study of telecommunication quality began by focus-ing on designing and maintaining telephone services. First,the issues were transmission loss, frequency distortion, cir-cuit noise, and circuit echo because all the transmissionequipment processed the speech signals in an analogue man-ner. As a result, the primary quality assessment dimensionswere loudness, due to transmission loss, and intelligibil-ity/annoyance due to distortion, noise, and circuit echo [2].In addition to such speech transmission quality, the avail-ability and connectivity of telephone services were indepen-dently studied because transmission quality was consideredonly if the service was available and the telephone connec-tion was established.
By the digitization of transmission equipment and links,most of the above analogue degradation disappeared. Theprimary quality factors in telephone services were quantiza-tion distortion due to PCM coding, delay, and circuit echo.At this stage, the quality dimension was usually “overall sat-isfaction,” rather than loudness and intelligibility/annoyanceof speech because telephone quality was high enough, espe-cially in Japan.
In the 1990’s, cellular phone systems and the personal
Copyright © 2017 The Institute of Electronics, Information and Communication Engineers
TAKAHASHI and HAYASHI: COLLABORATIVE QUALITY FRAMEWORK: QOE-CENTRIC SERVICE OPERATION1555
handy-phone system (PHS) penetrated the telephone mar-ket. In these systems, low-bitrate codecs were used to makeeffective use of radio resources, introducing non-negligiblespeech distortion. Due to the instability of radio links, speechquality degradation due to transmission error also becameimportant. At the same time, due to the nature of radio com-munications, it became difficult to separately discuss thethree quality dimensions of availability, connectivity, andtransmission quality when evaluating the QoE of cellularservices.
In the early 2000’s, the PSTN service started migrat-ing to Internet Protocol (IP)-based networks. This is called“IP telephony,” in which delay due to playout buffering isinevitable in addition to packet loss in both networks andterminal playout buffer. At this point, the evaluation of non-stationary or discrete distortion events became important,even in wired networks [3].
One of the most recent public telephony services isVoice over LTE (VoLTE), which expands the signal band-width of speech from 3.4 to 7 kHz, resulting in more naturalvoice quality. The quality factors of VoLTE have mixed char-acteristics of traditional cellular phones and IP telephonysince it is based on VoIP technology over radio access net-works.
2.2 Web-Browsing
Web-browsing is one of the most popular applications ofrecent telecommunications and often used as a means toaccess public services as well as on-line shopping.
At the beginning of web-browsing in the 1990’s, dueto the limitations on network and terminal performance, thecontent was not so rich; therefore, users’ expectations onQoE were not very high. It is often said that the objectivesof the page load time, which represents the time used to showthe next content after a user requires (or clicks) the originalpage, was about eight seconds during this time [4]. Recently,as network speed and terminal capability increased, users’expectations seem to have increased to a couple of seconds.
Since the structure and mechanism of traditional webcontent are rather simple, the QoE of web-browsing sim-ply depends on the average throughput of the network todownload the html and media files. However, web tech-nologies, such as JAVA, have dramatically evolved in thiscentury, and the characteristics of web content changed andbecame complex. Due to such changes, it is no longer asimple file download, but combinations of program down-load/execution and still image and video download/playout.This makes the relationship between network performanceand QoE of web-browsing much more complicated [5].
2.3 Video Streaming
With the advances in broadband network and multimediatechnologies such as encoders and decoders (codecs), vari-ous video services such as videophones, videoconferencing,video on demand (VoD), and IPTV have been developed and
provided. Recently, video streaming service providers candeliver ultra-high definition (UHD) video content over IPnetworks.
In analog video, such as conventional TV broadcasts,quality degradation occurs in a continuous fashion with grad-ual degradation in quality. However, in digital video, qualitydegradation is both spatially and temporally discontinuousand characterized by a very large amount of degradationoccurring once the digital signal is disrupted, interrupted,or stopped. The factors that cause degradation in the qual-ity of video services can be divided into spatial distortionand temporal distortion. Spatial distortion causes the pic-ture quality and/or screen resolution to decrease, and itstypical/characteristic effect on video quality is causing mo-saic distortion (block distortion) of the video. Temporaldistortion typically manifests as a reduction in frame rateor a frozen picture, resulting in a jerky picture and a lossof smoothness in moving objects. There are also spatio-temporal distortion effects including disruption in the videosignal [6], [7].
Recent video streaming services can be classified asReal-Time Protocol (RTP)-based (i.e., linear TV) or Hyper-text Transfer Protocol (HTTP)-based streaming (i.e., adap-tive bitrate streaming) [8]. In RTP-based video streamingservices, typical quality degradation factors are block distor-tion due to video compression and disruption of the videosignal due to network performance degradation such as IPpacket loss. On the other hand, in HTTP-based video stream-ing services, typical quality degradation factors are qualitylevel change and video stalling due to network through-put fluctuation. Thus, perceived video quality factors havechanged quite a bit within a couple of decades.
3. QoE-Centric Service Operation and Its Require-ments
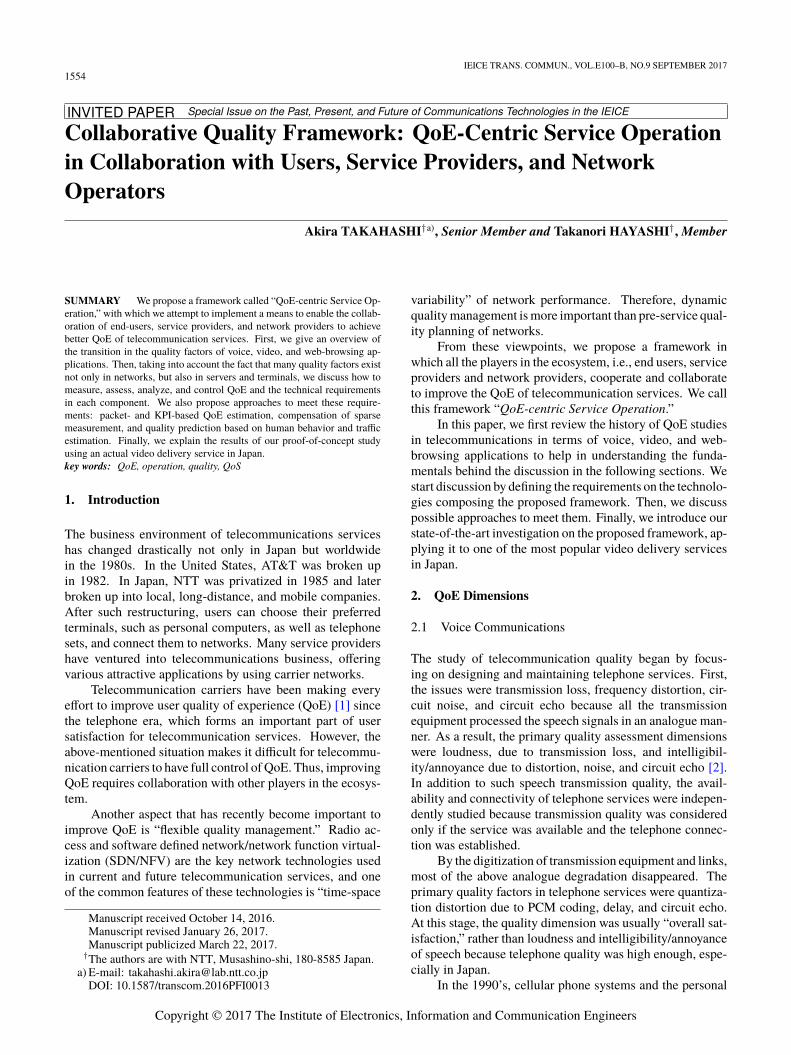
Various recent QoE investigations have revealed that the rela-tionship “QoE ≈ network performance” no longer holds [9].What makes the situation more complicated is that even net-work operation has become difficult in an end-to-end sensedue to the multi-provider environment. Thus, there are quitea few issues that cannot be found and solved only throughconventional network operation. Figure 1 explains the qual-ity factors in video streaming services.
Even if the network performance is the same, the re-sultant QoE heavily depends on what application an enduser uses. For example, 500 kb/s is sufficient for VoIP usersbut not for users enjoying high-resolution video streaming.The QoE also depends on server congestion, which doesnot necessarily correspond to network congestion, for client-server-type applications. By taking into account such factorsaffecting QoE, our QoE-centric Service Operation attemptsto harmonize the three main players in the service chain;end-users, service providers, and network providers.
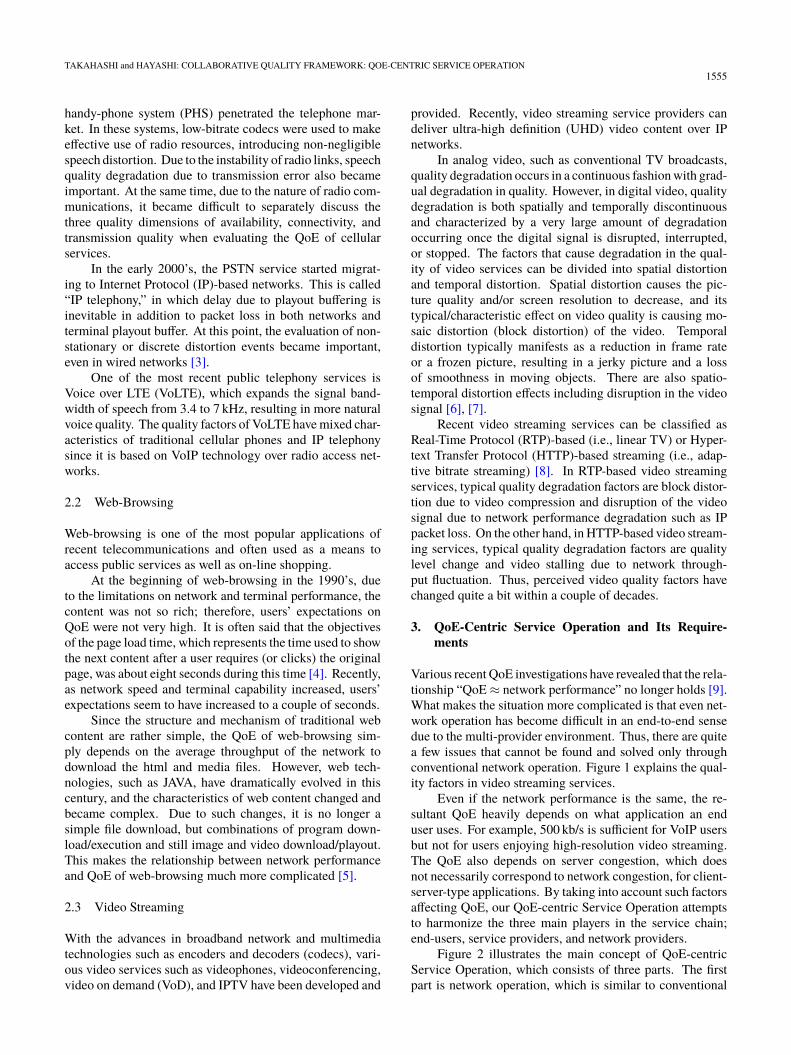
Figure 2 illustrates the main concept of QoE-centricService Operation, which consists of three parts. The firstpart is network operation, which is similar to conventional
1556IEICE TRANS. COMMUN., VOL.E100–B, NO.9 SEPTEMBER 2017
Fig. 1 Quality factors for video streaming services.
Fig. 2 QoE-centric service operation.
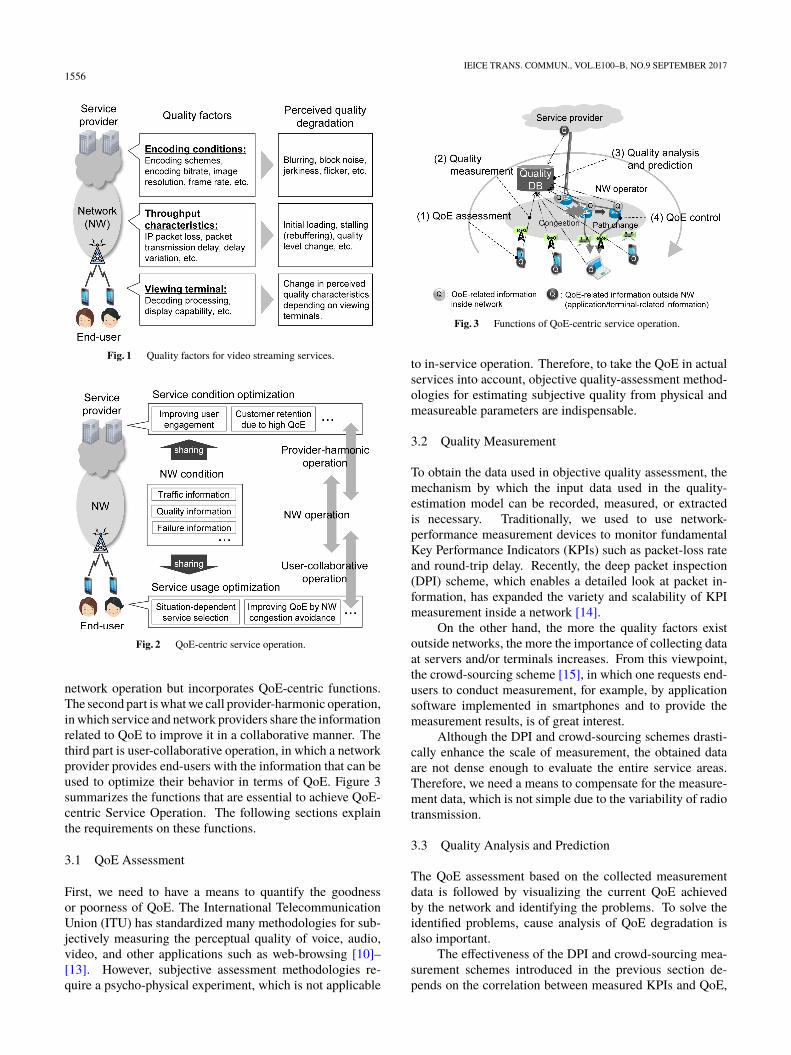
network operation but incorporates QoE-centric functions.The second part is what we call provider-harmonic operation,in which service and network providers share the informationrelated to QoE to improve it in a collaborative manner. Thethird part is user-collaborative operation, in which a networkprovider provides end-users with the information that can beused to optimize their behavior in terms of QoE. Figure 3summarizes the functions that are essential to achieve QoE-centric Service Operation. The following sections explainthe requirements on these functions.
3.1 QoE Assessment
First, we need to have a means to quantify the goodnessor poorness of QoE. The International TelecommunicationUnion (ITU) has standardized many methodologies for sub-jectively measuring the perceptual quality of voice, audio,video, and other applications such as web-browsing [10]–[13]. However, subjective assessment methodologies re-quire a psycho-physical experiment, which is not applicable
Fig. 3 Functions of QoE-centric service operation.
to in-service operation. Therefore, to take the QoE in actualservices into account, objective quality-assessment method-ologies for estimating subjective quality from physical andmeasureable parameters are indispensable.
3.2 Quality Measurement
To obtain the data used in objective quality assessment, themechanism by which the input data used in the quality-estimation model can be recorded, measured, or extractedis necessary. Traditionally, we used to use network-performance measurement devices to monitor fundamentalKey Performance Indicators (KPIs) such as packet-loss rateand round-trip delay. Recently, the deep packet inspection(DPI) scheme, which enables a detailed look at packet in-formation, has expanded the variety and scalability of KPImeasurement inside a network [14].
On the other hand, the more the quality factors existoutside networks, the more the importance of collecting dataat servers and/or terminals increases. From this viewpoint,the crowd-sourcing scheme [15], in which one requests end-users to conduct measurement, for example, by applicationsoftware implemented in smartphones and to provide themeasurement results, is of great interest.
Although the DPI and crowd-sourcing schemes drasti-cally enhance the scale of measurement, the obtained dataare not dense enough to evaluate the entire service areas.Therefore, we need a means to compensate for the measure-ment data, which is not simple due to the variability of radiotransmission.
3.3 Quality Analysis and Prediction
The QoE assessment based on the collected measurementdata is followed by visualizing the current QoE achievedby the network and identifying the problems. To solve theidentified problems, cause analysis of QoE degradation isalso important.
The effectiveness of the DPI and crowd-sourcing mea-surement schemes introduced in the previous section de-pends on the correlation between measured KPIs and QoE,
TAKAHASHI and HAYASHI: COLLABORATIVE QUALITY FRAMEWORK: QOE-CENTRIC SERVICE OPERATION1557
and the “cleanness” of the obtained data, respectively.Although we can expect accurate results in the DPI
measurement, the issue is what to measure. Since the mea-surement is conducted inside the network, it is often diffi-cult to analyze the payload information due to encryption.This may result in observing more generic KPIs, e.g., theIP packet-loss rate and round trip time, which do not nec-essarily represent the resultant QoE. Therefore, establishingwell-balanced KPIs in terms of both their availability andcorrelation with QoE is required.
In the crowd-sourcing measurement, using user devicesresults in certain “noise” which is not negligible. Therefore,establishing analysis methodologies for extracting the essen-tial features from such noisy data is also needed.
In addition to the analysis of the current QoE, predictionin the time domain is also important for effective qualitycontrol, which is introduced in Sect. 3.4. This is because, intime varying circumstances, traffic control or user navigationbased only on the current observation will result in poor QoEimprovement.
3.4 Quality Control
Finally, we need quality control methodologies for takinginto account the analysis of the current QoE distribution andits prediction in the time domain. Quality control includestraffic and resource control making use of the SDN/NFVfunctions. In addition to these network control mechanisms,we believe quality control should also be done in collabora-tion with service providers and end-users since, especiallyin mobile networks, the network resources are limited and itis sometimes difficult to allocate more resources to improveQoE.
3.4.1 Provider-Harmonic Operation
Allocating more resources to a certain service or user mayimprove QoE. However, in a very competitive environment,such as at a crowded train station, it is not always possible.In such a case, optimization between service and networkproviders plays an important role.
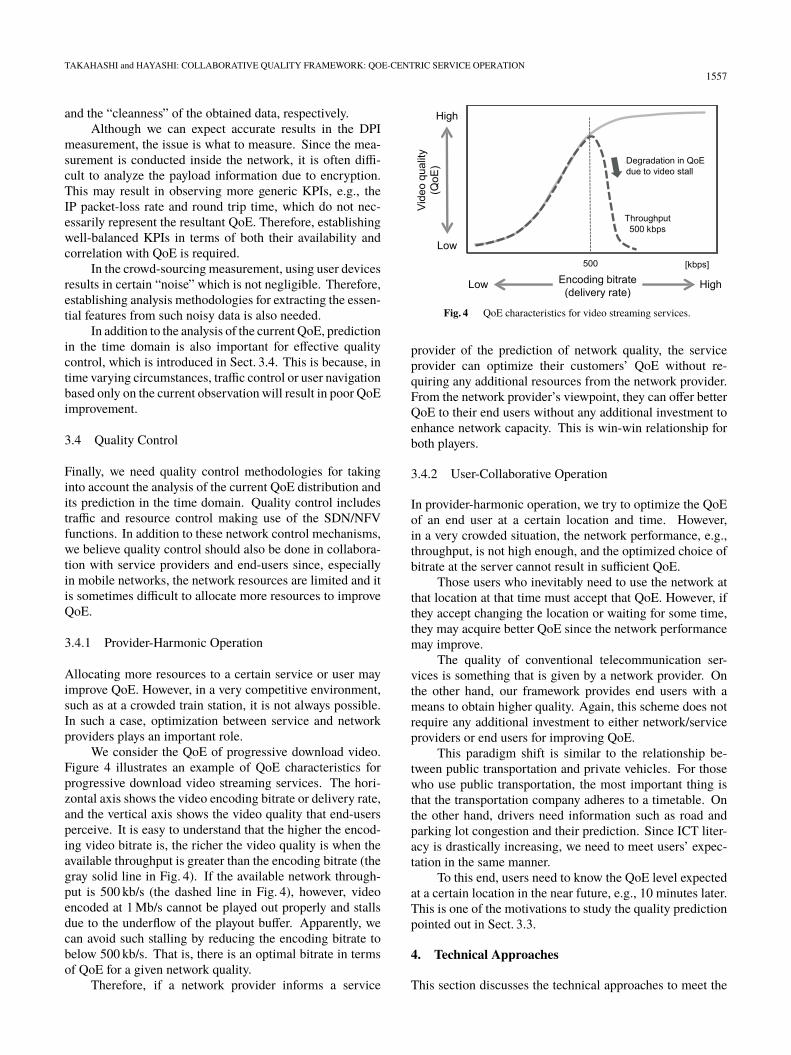
We consider the QoE of progressive download video.Figure 4 illustrates an example of QoE characteristics forprogressive download video streaming services. The hori-zontal axis shows the video encoding bitrate or delivery rate,and the vertical axis shows the video quality that end-usersperceive. It is easy to understand that the higher the encod-ing video bitrate is, the richer the video quality is when theavailable throughput is greater than the encoding bitrate (thegray solid line in Fig. 4). If the available network through-put is 500 kb/s (the dashed line in Fig. 4), however, videoencoded at 1 Mb/s cannot be played out properly and stallsdue to the underflow of the playout buffer. Apparently, wecan avoid such stalling by reducing the encoding bitrate tobelow 500 kb/s. That is, there is an optimal bitrate in termsof QoE for a given network quality.
Therefore, if a network provider informs a service
Fig. 4 QoE characteristics for video streaming services.
provider of the prediction of network quality, the serviceprovider can optimize their customers’ QoE without re-quiring any additional resources from the network provider.From the network provider’s viewpoint, they can offer betterQoE to their end users without any additional investment toenhance network capacity. This is win-win relationship forboth players.
3.4.2 User-Collaborative Operation
In provider-harmonic operation, we try to optimize the QoEof an end user at a certain location and time. However,in a very crowded situation, the network performance, e.g.,throughput, is not high enough, and the optimized choice ofbitrate at the server cannot result in sufficient QoE.
Those users who inevitably need to use the network atthat location at that time must accept that QoE. However, ifthey accept changing the location or waiting for some time,they may acquire better QoE since the network performancemay improve.
The quality of conventional telecommunication ser-vices is something that is given by a network provider. Onthe other hand, our framework provides end users with ameans to obtain higher quality. Again, this scheme does notrequire any additional investment to either network/serviceproviders or end users for improving QoE.
This paradigm shift is similar to the relationship be-tween public transportation and private vehicles. For thosewho use public transportation, the most important thing isthat the transportation company adheres to a timetable. Onthe other hand, drivers need information such as road andparking lot congestion and their prediction. Since ICT liter-acy is drastically increasing, we need to meet users’ expec-tation in the same manner.
To this end, users need to know the QoE level expectedat a certain location in the near future, e.g., 10 minutes later.This is one of the motivations to study the quality predictionpointed out in Sect. 3.3.
4. Technical Approaches
This section discusses the technical approaches to meet the
1558IEICE TRANS. COMMUN., VOL.E100–B, NO.9 SEPTEMBER 2017
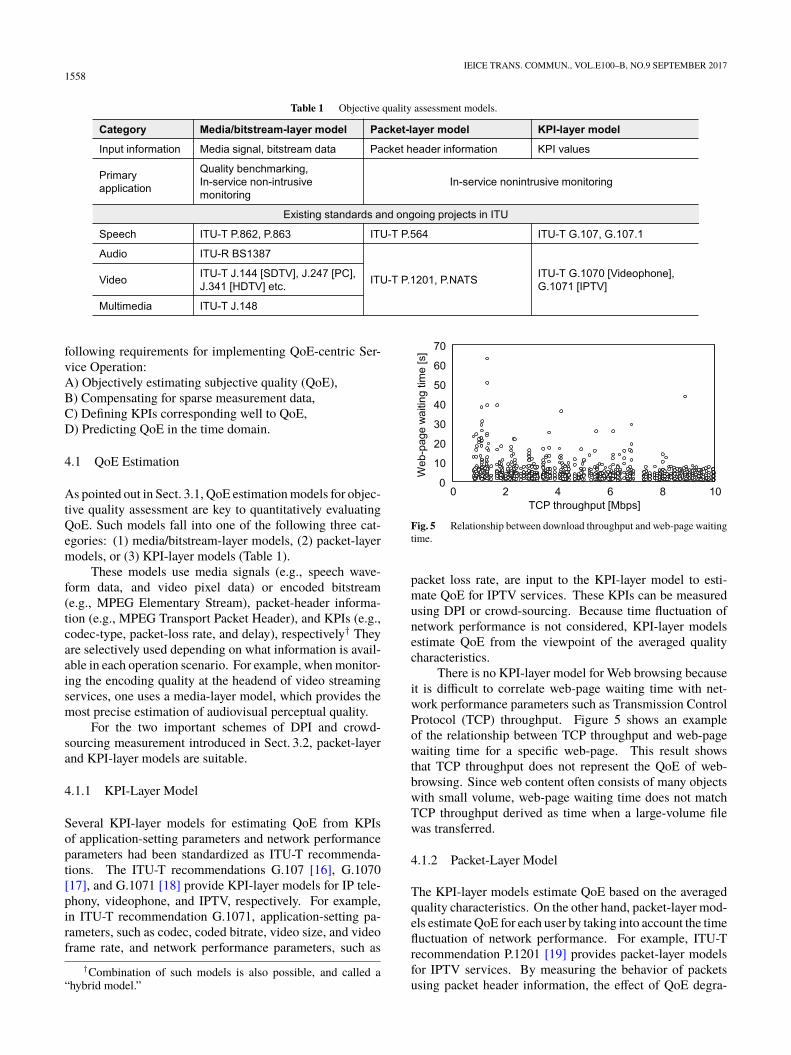
Table 1 Objective quality assessment models.
following requirements for implementing QoE-centric Ser-vice Operation:A) Objectively estimating subjective quality (QoE),B) Compensating for sparse measurement data,C) Defining KPIs corresponding well to QoE,D) Predicting QoE in the time domain.
4.1 QoE Estimation
As pointed out in Sect. 3.1, QoE estimation models for objec-tive quality assessment are key to quantitatively evaluatingQoE. Such models fall into one of the following three cat-egories: (1) media/bitstream-layer models, (2) packet-layermodels, or (3) KPI-layer models (Table 1).
These models use media signals (e.g., speech wave-form data, and video pixel data) or encoded bitstream(e.g., MPEG Elementary Stream), packet-header informa-tion (e.g., MPEG Transport Packet Header), and KPIs (e.g.,codec-type, packet-loss rate, and delay), respectively† Theyare selectively used depending on what information is avail-able in each operation scenario. For example, when monitor-ing the encoding quality at the headend of video streamingservices, one uses a media-layer model, which provides themost precise estimation of audiovisual perceptual quality.
For the two important schemes of DPI and crowd-sourcing measurement introduced in Sect. 3.2, packet-layerand KPI-layer models are suitable.
4.1.1 KPI-Layer Model
Several KPI-layer models for estimating QoE from KPIsof application-setting parameters and network performanceparameters had been standardized as ITU-T recommenda-tions. The ITU-T recommendations G.107 [16], G.1070[17], and G.1071 [18] provide KPI-layer models for IP tele-phony, videophone, and IPTV, respectively. For example,in ITU-T recommendation G.1071, application-setting pa-rameters, such as codec, coded bitrate, video size, and videoframe rate, and network performance parameters, such as
†Combination of such models is also possible, and called a“hybrid model.”
Fig. 5 Relationship between download throughput and web-page waitingtime.
packet loss rate, are input to the KPI-layer model to esti-mate QoE for IPTV services. These KPIs can be measuredusing DPI or crowd-sourcing. Because time fluctuation ofnetwork performance is not considered, KPI-layer modelsestimate QoE from the viewpoint of the averaged qualitycharacteristics.
There is no KPI-layer model for Web browsing becauseit is difficult to correlate web-page waiting time with net-work performance parameters such as Transmission ControlProtocol (TCP) throughput. Figure 5 shows an exampleof the relationship between TCP throughput and web-pagewaiting time for a specific web-page. This result showsthat TCP throughput does not represent the QoE of web-browsing. Since web content often consists of many objectswith small volume, web-page waiting time does not matchTCP throughput derived as time when a large-volume filewas transferred.
4.1.2 Packet-Layer Model
The KPI-layer models estimate QoE based on the averagedquality characteristics. On the other hand, packet-layer mod-els estimate QoE for each user by taking into account the timefluctuation of network performance. For example, ITU-Trecommendation P.1201 [19] provides packet-layer modelsfor IPTV services. By measuring the behavior of packetsusing packet header information, the effect of QoE degra-

TAKAHASHI and HAYASHI: COLLABORATIVE QUALITY FRAMEWORK: QOE-CENTRIC SERVICE OPERATION1559
Fig. 6 Relationship between HTTP-GET count and transmission com-pletion time for each object.
dation due to packet losses can be considered. Currently,ITU-T Study Group (SG) 12 is discussing the standard-ization of a packet-layer model for progressive downloadvideo streaming services and plans to release a recommen-dation in 2017. This recommendation is provisionally called“Parametric non-intrusive assessment of TCP-based multi-media streaming quality, considering adaptive streaming”(P.NATS).
It may be possible to estimate QoE for web browsing byadopting the packet-layer-model approach. Figure 6 showsthe relationship between the number of transmitted objects(HTTP-GET count) and transmission completion time foreach object comprising a specific web page. Even if a webpage’s address is the same, the number of objects sometimeschanges when content is renewed. For example, popularJapanese web-pages such as Yahoo!, Amazon, Rakuten, andgoo get renewed in a short span of time, so a unified model isneeded in order to estimate the web-page waiting time evenwhen the number of objects is changed in a small range.To do this, we first get the approximate number of objectsfrom a specific web-page from the data of both the numberof transmitted objects and real web-page waiting time in auser terminal. We then estimate the web-page waiting timefrom the features in the beginning part of the transmissionpatterns by using a support vector machine (SVM) [20]. Therelationship between the web-page waiting time that can bemeasured in a user terminal and the features in the begin-ning part of the transmission patterns of objects is learnedbeforehand. Figure 7 shows the estimation accuracy of thisapproach. We found that this approach had sufficient accu-racy for almost all plots. However, the estimation error ofone plot was large because the abrupt changes of the featureof the transmission patterns cannot be taken into accountwith this approach. This is for further study.
4.2 Measurement and Compensation
Exploiting schemes such as DPI and crowd-sourcing is ef-fective to visualize the QoE characteristics in geographicalareas, which is important, for example, in the area qual-
Fig. 7 Estimation accuracy of web-page waiting time.
ity management in mobile access networks. However, togeographically cover all the area is not so straightforwardbecause the radio transmission characteristics in a real envi-ronment is not monotonically distributed, and simple com-pensation between multiple measurement locations does notprovide a correct estimate. On the other hand, simulationtechnologies of radio propagation characteristics have be-come sufficiently mature [21]. Therefore, a combination ofactual measurement and such simulation can provide esti-mates of KPIs in a dense manner, even if the measurementdata are geographically sparse.
Figure 8 illustrates this idea. It is usually difficult to es-timate the continuous quality map of upper-layer KPIs (e.g.,TCP throughput) because the correlation of the adjacent lo-cations is not very high, depending on the radio transmissionquality, congestion in the mobile front haul, and so on. Thatis, the KPI value of a certain location does not necessarilyrepresent that of neighboring locations.
However, we may be able to assume that a KPI value,such as TCP throughput, is consistent if two locations are inthe area of the same beam of a base station (i.e., the samecongestion condition of upper networks) and have the sameradio condition. If this assumption holds, we can estimatethe KPI values in the entire region (in the same beam range)based on the actual measurement data of the radio conditionand KPI value in conjunction with the radio propagationsimulation. More concretely, if we have a measured radiocondition such as Reference Signal Received Power (RSRP)and the associated TCP throughput, we can expect the sameTCP throughput in other locations where we obtain equiva-lent RSRP through the radio propagation simulation.
To confirm the validity of estimating KPIs based on theradio condition, we measured the RSRP and TCP throughputin a real LTE environment. Ideally, it is better to measureall the data at the same time to exclude the effect of the traf-fic condition, which may change the relationship betweenthe RSRP and TCP throughput. Due to the limitation ofmeasurement devices, the data were obtained sequentiallyin our experiment. Since we carried out our experiment ina quiet residential area, the relationship between the RSRPand TCP throughput was expected to be preserved during the

1560IEICE TRANS. COMMUN., VOL.E100–B, NO.9 SEPTEMBER 2017
Fig. 8 Estimation of KPIs based on sparsely measured data and radiopropagation simulation.
Fig. 9 Relationship between RSRP and TCP Throughput.
measurement time frame. Figure 9 illustrates this relation-ship between the RSRP and TCP throughput, which wereactually measured at the same time using a smartphone. Themeasurement was carried out within the same beam areawith a fixed transmission radio band. We observed goodconsistency between them.
This result implies that we may be able to estimatethe KPIs that represent QoE, based on the actual measure-ment values of radio transmission performance and associ-ated KPIs, which can be collected using the crowd-sourcingscheme, and the simulation of the radio transmission perfor-mance for the entire region of interest. This can result indrawing a QoE map of individual services by mapping theKPIs to QoE based on respective mapping techniques.
It has been reported that the radio propagation simula-tion provides very close estimates of the actual radio trans-mission measurement results, such as received field strength
Fig. 10 Time variation of predicted and measured traffic.
[22]. However, if we assume crowd-sourcing data collec-tion, we need to investigate the stability of radio transmissionmeasurement, such as RSRP, when measured under realisticusage conditions of smartphones. This is for further study.
4.3 Quality Prediction
To avoid quality deterioration, mobile network operatorsneed to estimate the appropriate communication facilities.It is challenging to efficiently deploy communication facil-ities, such as Wi-Fi access points and mobile base stations,to transfer the huge mobile traffic during a large-scale event.Therefore, we assume that human behavior during an eventcan be categorized into typical behavior patterns determinedby the event content, and propose an approach for predict-ing the mobile traffic demand of an event venue through amulti-agent simulation given the typical behavior patternsof mobile users during an event. The behavior rules usedfor the simulation are first constructed from the data of pastevents that are similar to the predicted events. We also eval-uated the reproducibility of group behavior during an indoorevent through a simulation using individual behavior rules.In the simulation, user-behavior models and environmentalparameters are used as inputs. User-behavior models consistof movement rule and traffic occurrence condition, whichare based on each user’s purpose. Environmental parame-ters consist of the number of users, range of user movement,and exhibition locations where the user can achieve his/herpurpose. Moreover, the limit of the number of users in thesimulation is determined from the movement range and exhi-bition locations due to reconstructing of a crowd or a waitingline.
An example of predicted results and measurement val-ues of mobile traffic at a particular indoor event are shownin Figure 10. To compare the occurrence times of the traf-fic peaks, the measured and predicted mobile traffic volumeare normalized by the maximum value. This shows that ourapproach can be used to predict peak hours of event traffic.Prediction of traffic peaks at fine spatial granularity and im-proving prediction accuracy regarding the absolute value oftraffic volume are currently being investigated.
TAKAHASHI and HAYASHI: COLLABORATIVE QUALITY FRAMEWORK: QOE-CENTRIC SERVICE OPERATION1561
5. Proof of Concept
5.1 Overview
We give an example of QoE-centric Service Operation tar-geting a progressive-download video streaming service.
As shown in Fig. 1, the important factors affecting QoEin video streaming services exist both inside and outside thecarrier network. Therefore, even when higher video qualityis achieved with a higher encoding bitrate, video playbackmay frequently stall in a congested mobile network due toinsufficient throughput. Such video stalling not only de-grades the QoE but also greatly affects the length of videowatching time i.e., video viewing behavior [23]. Therefore,QoE control carried out by the network operator and videostreaming service provider in a collaborative manner is ef-fective in optimizing QoE. An effective response to such asituation would be to deliver the video at a coding bit ratefor which QoE could be optimized by taking network con-gestion into account. We define the interface between thenetwork operator and video streaming service provider asthe “quality application programming interface (API)” forexchanging quality-related information.
For video streaming service providers and end users,this form of control improves QoE, while for the networkoperator, it can reduce traffic that does not contribute to im-proving QoE while reducing network load (i.e., a reductionin the required facilities). In short, controlling the networkin this manner can result in a win-win relationship.
5.2 Quality API
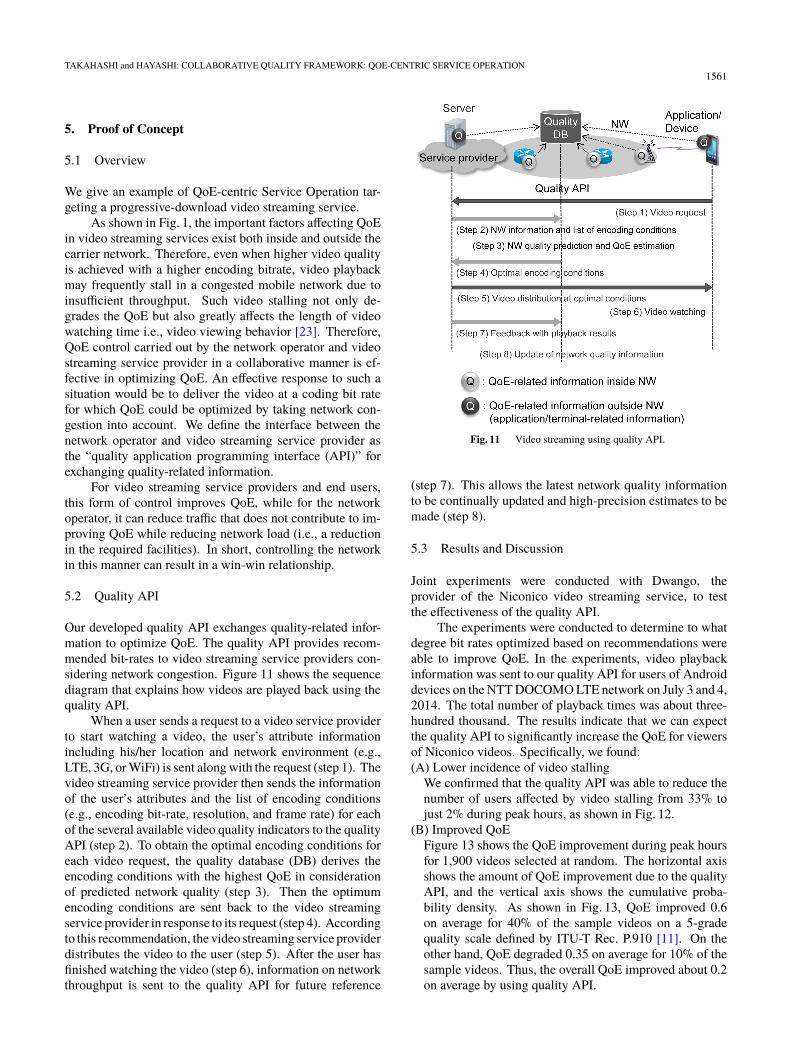
Our developed quality API exchanges quality-related infor-mation to optimize QoE. The quality API provides recom-mended bit-rates to video streaming service providers con-sidering network congestion. Figure 11 shows the sequencediagram that explains how videos are played back using thequality API.
When a user sends a request to a video service providerto start watching a video, the user’s attribute informationincluding his/her location and network environment (e.g.,LTE, 3G, or WiFi) is sent along with the request (step 1). Thevideo streaming service provider then sends the informationof the user’s attributes and the list of encoding conditions(e.g., encoding bit-rate, resolution, and frame rate) for eachof the several available video quality indicators to the qualityAPI (step 2). To obtain the optimal encoding conditions foreach video request, the quality database (DB) derives theencoding conditions with the highest QoE in considerationof predicted network quality (step 3). Then the optimumencoding conditions are sent back to the video streamingservice provider in response to its request (step 4). Accordingto this recommendation, the video streaming service providerdistributes the video to the user (step 5). After the user hasfinished watching the video (step 6), information on networkthroughput is sent to the quality API for future reference
Fig. 11 Video streaming using quality API.
(step 7). This allows the latest network quality informationto be continually updated and high-precision estimates to bemade (step 8).
5.3 Results and Discussion
Joint experiments were conducted with Dwango, theprovider of the Niconico video streaming service, to testthe effectiveness of the quality API.
The experiments were conducted to determine to whatdegree bit rates optimized based on recommendations wereable to improve QoE. In the experiments, video playbackinformation was sent to our quality API for users of Androiddevices on the NTT DOCOMO LTE network on July 3 and 4,2014. The total number of playback times was about three-hundred thousand. The results indicate that we can expectthe quality API to significantly increase the QoE for viewersof Niconico videos. Specifically, we found:(A) Lower incidence of video stalling
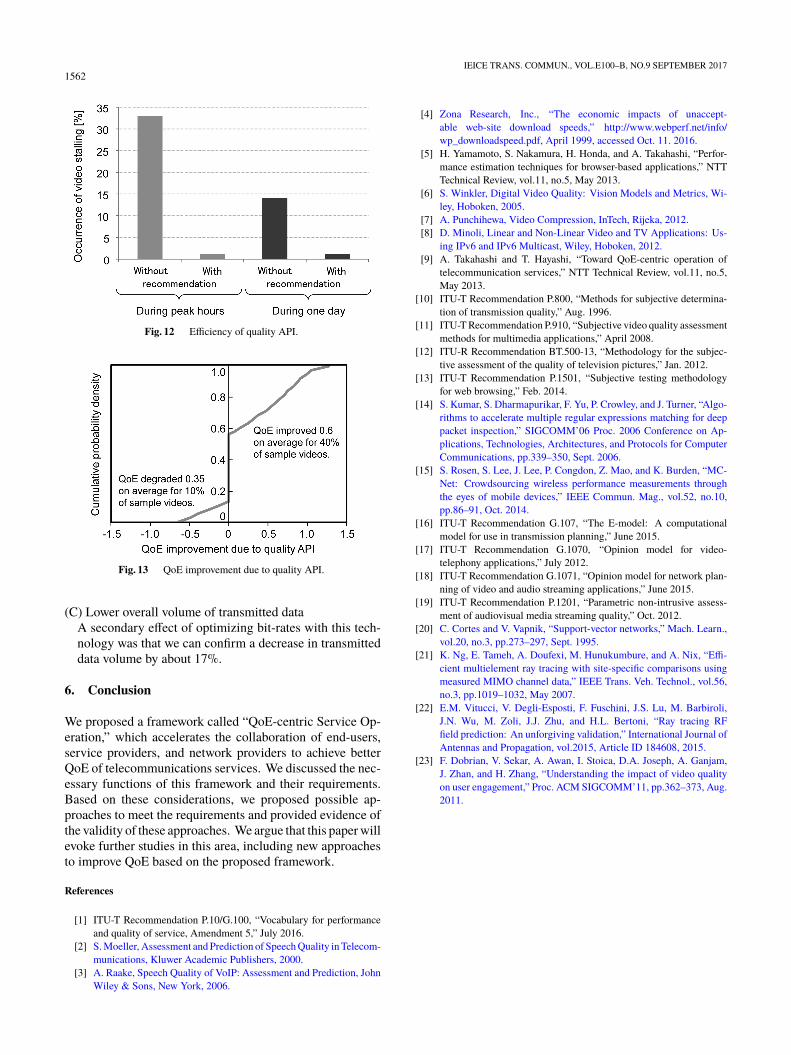
We confirmed that the quality API was able to reduce thenumber of users affected by video stalling from 33% tojust 2% during peak hours, as shown in Fig. 12.
(B) Improved QoEFigure 13 shows the QoE improvement during peak hoursfor 1,900 videos selected at random. The horizontal axisshows the amount of QoE improvement due to the qualityAPI, and the vertical axis shows the cumulative proba-bility density. As shown in Fig. 13, QoE improved 0.6on average for 40% of the sample videos on a 5-gradequality scale defined by ITU-T Rec. P.910 [11]. On theother hand, QoE degraded 0.35 on average for 10% of thesample videos. Thus, the overall QoE improved about 0.2on average by using quality API.
1562IEICE TRANS. COMMUN., VOL.E100–B, NO.9 SEPTEMBER 2017
Fig. 12 Efficiency of quality API.
Fig. 13 QoE improvement due to quality API.
(C) Lower overall volume of transmitted dataA secondary effect of optimizing bit-rates with this tech-nology was that we can confirm a decrease in transmitteddata volume by about 17%.
6. Conclusion
We proposed a framework called “QoE-centric Service Op-eration,” which accelerates the collaboration of end-users,service providers, and network providers to achieve betterQoE of telecommunications services. We discussed the nec-essary functions of this framework and their requirements.Based on these considerations, we proposed possible ap-proaches to meet the requirements and provided evidence ofthe validity of these approaches. We argue that this paper willevoke further studies in this area, including new approachesto improve QoE based on the proposed framework.
References
[1] ITU-T Recommendation P.10/G.100, “Vocabulary for performanceand quality of service, Amendment 5,” July 2016.
[2] S. Moeller, Assessment and Prediction of Speech Quality in Telecom-munications, Kluwer Academic Publishers, 2000.
[3] A. Raake, Speech Quality of VoIP: Assessment and Prediction, JohnWiley & Sons, New York, 2006.
[4] Zona Research, Inc., “The economic impacts of unaccept-able web-site download speeds,” http://www.webperf.net/info/wp_downloadspeed.pdf, April 1999, accessed Oct. 11. 2016.
[5] H. Yamamoto, S. Nakamura, H. Honda, and A. Takahashi, “Perfor-mance estimation techniques for browser-based applications,” NTTTechnical Review, vol.11, no.5, May 2013.
[6] S. Winkler, Digital Video Quality: Vision Models and Metrics, Wi-ley, Hoboken, 2005.
[7] A. Punchihewa, Video Compression, InTech, Rijeka, 2012.[8] D. Minoli, Linear and Non-Linear Video and TV Applications: Us-
ing IPv6 and IPv6 Multicast, Wiley, Hoboken, 2012.[9] A. Takahashi and T. Hayashi, “Toward QoE-centric operation of
telecommunication services,” NTT Technical Review, vol.11, no.5,May 2013.
[10] ITU-T Recommendation P.800, “Methods for subjective determina-tion of transmission quality,” Aug. 1996.
[11] ITU-T Recommendation P.910, “Subjective video quality assessmentmethods for multimedia applications,” April 2008.
[12] ITU-R Recommendation BT.500-13, “Methodology for the subjec-tive assessment of the quality of television pictures,” Jan. 2012.
[13] ITU-T Recommendation P.1501, “Subjective testing methodologyfor web browsing,” Feb. 2014.
[14] S. Kumar, S. Dharmapurikar, F. Yu, P. Crowley, and J. Turner, “Algo-rithms to accelerate multiple regular expressions matching for deeppacket inspection,” SIGCOMM’06 Proc. 2006 Conference on Ap-plications, Technologies, Architectures, and Protocols for ComputerCommunications, pp.339–350, Sept. 2006.
[15] S. Rosen, S. Lee, J. Lee, P. Congdon, Z. Mao, and K. Burden, “MC-Net: Crowdsourcing wireless performance measurements throughthe eyes of mobile devices,” IEEE Commun. Mag., vol.52, no.10,pp.86–91, Oct. 2014.
[16] ITU-T Recommendation G.107, “The E-model: A computationalmodel for use in transmission planning,” June 2015.
[17] ITU-T Recommendation G.1070, “Opinion model for video-telephony applications,” July 2012.
[18] ITU-T Recommendation G.1071, “Opinion model for network plan-ning of video and audio streaming applications,” June 2015.
[19] ITU-T Recommendation P.1201, “Parametric non-intrusive assess-ment of audiovisual media streaming quality,” Oct. 2012.
[20] C. Cortes and V. Vapnik, “Support-vector networks,” Mach. Learn.,vol.20, no.3, pp.273–297, Sept. 1995.
[21] K. Ng, E. Tameh, A. Doufexi, M. Hunukumbure, and A. Nix, “Effi-cient multielement ray tracing with site-specific comparisons usingmeasured MIMO channel data,” IEEE Trans. Veh. Technol., vol.56,no.3, pp.1019–1032, May 2007.
[22] E.M. Vitucci, V. Degli-Esposti, F. Fuschini, J.S. Lu, M. Barbiroli,J.N. Wu, M. Zoli, J.J. Zhu, and H.L. Bertoni, “Ray tracing RFfield prediction: An unforgiving validation,” International Journal ofAntennas and Propagation, vol.2015, Article ID 184608, 2015.
[23] F. Dobrian, V. Sekar, A. Awan, I. Stoica, D.A. Joseph, A. Ganjam,J. Zhan, and H. Zhang, “Understanding the impact of video qualityon user engagement,” Proc. ACM SIGCOMM’11, pp.362–373, Aug.2011.

TAKAHASHI and HAYASHI: COLLABORATIVE QUALITY FRAMEWORK: QOE-CENTRIC SERVICE OPERATION1563
Akira Takahashi received his B.S. degree inmathematics from Hokkaido University in Japanin 1988, M.S. degree in electrical engineeringfrom the California Institute of Technology inthe U.S. in 1993, and Ph.D degree in engineer-ing from the University of Tsukuba in Japan in2007. He joined NTT Laboratories in 1988 andhas been engaged in the quality assessment ofaudio and visual communications. Currently, heis the Project Manager of NTT Network Tech-nology Laboratories. He has been contributing
to ITU-T Study Group 12 (SG12) on QoS, QoE, and Performance since1994. He is a Vice-Chairman of ITU-T SG12. He received the Telecom-munication Technology Committee Award in Japan in 2004 and 2016 andthe ITU-AJ Award in Japan in 2005 and 2013. He also received the BestTutorial Paper Award from IEICE in Japan in 2006, Communications So-ciety: Outstanding Contributions Award from IEICE in Japan in 2015, andthe Telecommunications Advancement Foundation Awards in Japan in 2007and 2008.
Takanori Hayashi received his B.E., M.E.,and Ph.D degrees in engineering from the Uni-versity of Tsukuba, Ibaraki, in 1988, 1990, and2007. He joined NTT Laboratories in 1990 andhas been engaged in the quality assessment ofmultimedia telecommunication and network per-formance measurement methods. Currently, heis the manager of the Communication QualityGroup at NTT Network Technology Laborato-ries. He received the Telecommunication Ad-vancement Foundation Award in Japan in 2008
and the Telecommunication Technology Committee Award in Japan in 2012.