collaborative inquiry for data use in adolescent literacy instruction july 15, 2014 martin center...
TRANSCRIPT

Collaborative Inquiry for Data Use in Adolescent Literacy Instruction
July 15, 2014Martin Center for Professional Development
Nashville, TN
Welcome and Introduction
Margie JohnsonCoordinator of Business Intelligence, MNPS

MNPS Data Use Research Alliance goals
• Identify and implement best practices in data use that improve adolescent literacy instruction.
• Identify and apply the tools, processes, and skills necessary to implement a collaborative inquiry approach for data use in adolescent literacy instruction.
3

MNPS Data Use Research Alliance activities in 2014
• Collaborative inquiry workshops with Dr. Laura Lipton.• Fishbone session to identify root causes of barriers to
effective data use.• Logic modeling session to develop outcomes for effective
data-use practices.• Innovation configuration session to develop a collaborative
inquiry blueprint.• Survey of collaborative inquiry and data-use practices.*• Bridge event for Five Steps for Structuring Data-Informed
Conversations and Action in Education (Kekahio & Baker, 2013).*
*Under review by the Institute of Education Sciences4

Collaborative Inquiry for Data Use in Adolescent Literacy Instruction
Laura Lipton, Ph.D.Co-Director, MiraVia LLC

6
Got Data? Now What?

Workshop Goals and Objectives

Goals and objectives
• Increase knowledge about the seven qualities of high-performing collaborative inquiry groups.
• Develop and enhance frameworks for facilitating productive group learning, planning, and problem solving.
• Learn verbal and nonverbal tools for inviting and sustaining the thinking of group members during collaborative inquiry.
• Learn about facilitating difficult data-use conversations to promote professional interactions about tough-to-talk-about topics.
8

Collaborative Learning Cycle:Reflecting on Use

Reflecting on use: Stem completion strategy
• On an index card, complete the stems.• Topic is leading collaborative data-driven inquiry:
– “One thing that feels solid to me is …”
– “One thing that has not yet jelled is …”
• Table groups round-robin share.
(Use handout page 3.)
10
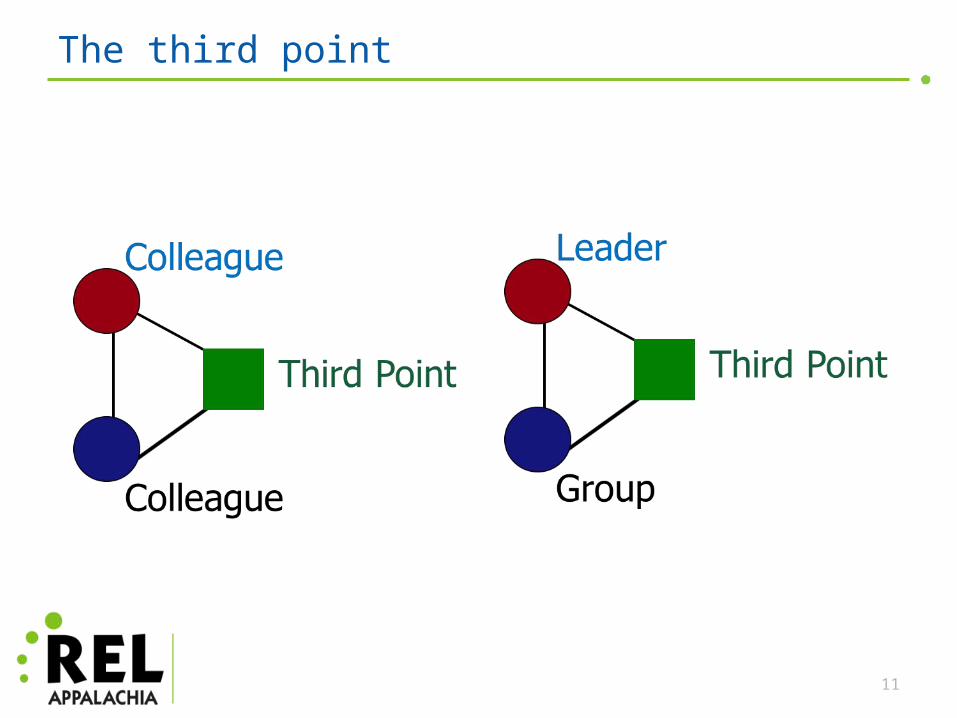
The third point
11

Seven Qualities of High-Performing Groups

Coordination
• We plan time and place, organize schedules, and identify resources– Who is doing what, when, where, with whom?
• Avoids duplication of effort; makes the best use of available resources
13

Collaboration
14

Collaboration definition
• Join two other pairs and create a definition of collaboration.
15
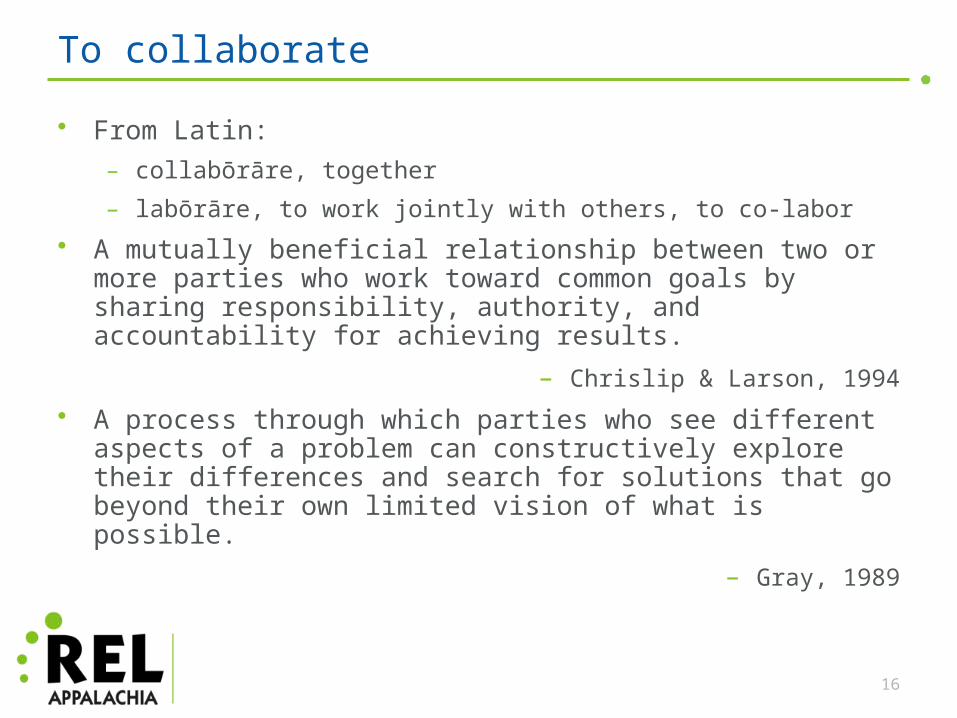
To collaborate
• From Latin:– collabōrāre, together
– labōrāre, to work jointly with others, to co-labor
• A mutually beneficial relationship between two or more parties who work toward common goals by sharing responsibility, authority, and accountability for achieving results.
– Chrislip & Larson, 1994
• A process through which parties who see different aspects of a problem can constructively explore their differences and search for solutions that go beyond their own limited vision of what is possible.
– Gray, 1989
16

Seven qualities of high-performing groups
17

Seven qualities of high-performing groups
• Choose a partner.• Refer to pages 11-14 in the got data? now what? book• Read silently to the designated stopping point.• When each partner is ready, stop and say something.
– Example, connection, question.
• Continue the process until you have completed the selection.
18

Processing the process
• What are some of the ways that the “process” influenced you?• What are some ways that paired interaction influenced you?• Share a new idea, emerging understanding, or next step connected to
your own work.
19

Group assessment inventories
• Tools for thoughtful feedback on group performance.• Use to modify, control, or change performance.• Two inventories:
– Scaled group inventory
– Self-assessment inventory
(Refer to pages 15-17 in the got data? now what? book.)
20

Break
Team Exercise: Applying the Collaborative Learning Cycle
What goes wrong in groups?
• What are some interpersonal dynamics that influence group work?– Record one idea per sticky note
– Example: A group member who isn’t willing to share ideas.
• Tip: Think about a “typical” group – use your recollections to generate your ideas.
23

Three constraints to productive discourse
• Affiliative constraints– Need to navigate task/relationship tensions.
• Egocentric constraints– Need for control, or low regard for collective thought processes.
• Cognitive constraints– Limited and limiting information and expertise.
24

Three constraints to productive discourse
• Classify your items by dynamic
AffiliativeNeed to navigate task/relationship
tensions.
CognitiveLimited and limiting
information and expertise.
EgocentricNeed for control or
low regard for collective though
processes.
25

26
Three models of discourse

Three models of discourse
• Dialogue– Promotes a spirit of shared inquiry.
• Discussion– Breaks issues and problems into components and parts.
• Decision-making– Making a choice from among clear alternatives.
27

Three models of discourse: first turn/last turn
• Refer to pages 100-104 in the got data? now what? book.• Read the selection and highlight two to three items.• The first turn.
– In turn, share one of your items – do not comment on it. Group members comment in round robin order (no cross-talk).
• The last turn.– Initiator now shares thinking.
28

Three models of discourse
Dialogue Discussion Decision-making
Purpose
• Talking to understand and connect.
• Understanding the underlying nature of an issue and how group members perceive it.
• Talking to persuade and influence.
• Generating options.• Clarifying outcomes.
• Talking to choose.• Determining the best
option from those the group generated.
Process (How)
• Speculating• Connecting• Theorizing• Visualizing
• Reasoning• Comparing• Contrasting• Analyzing
• Weighing• Choosing• Evaluating• Agreeing
Outcome (What)
• Understanding • Weighing options• Choosing
• Committing
(Refer to page 101 in the got data? now what? book.)
29
Three models of discourse: first turn/last turn
1. How is first turn/last turn a scaffold for dialogue?
2. How might this strategy contribute to your group work?
30

Three models of discourse
(Refer to page 101 in the got data? now what? book.)
Dialogue Discussion Decision
Self-talk
• What is the deeper meaning?
• What assumptions are operating here (for me and others)?
• What are some connections between these ideas?
• What’s not being said?• Are we all feeling safe
enough to share? • How can I increase the
invitation to share?
• What are the most important factors here?
• How can I influence this interaction?
• Are these data persuasive enough for me to let go of my ideas?
• How are these ideas different from each other and from my own ideas?
• What are the implications of this idea?
• What are the weightiest items or criteria?
• Which criteria are most important?
• How do the options stack up against our criteria?
• What are the pros and cons for each option?
• What are the implications?
• Who will be most affected?
31

Organizing and Integrating the Morning

Partner’s report: Most important point
• Think of a significant point or personal connection you are making, based on your experiences in the workshop thus far.– Join a partner.
– Share your thinking.
– Be ready to share your partner’s thinking with the group.
(Refer to page 6 of the handout.)
33

LunchProvided by MNPS

Team Exercise: Applying the Collaborative Learning Cycle (continued)
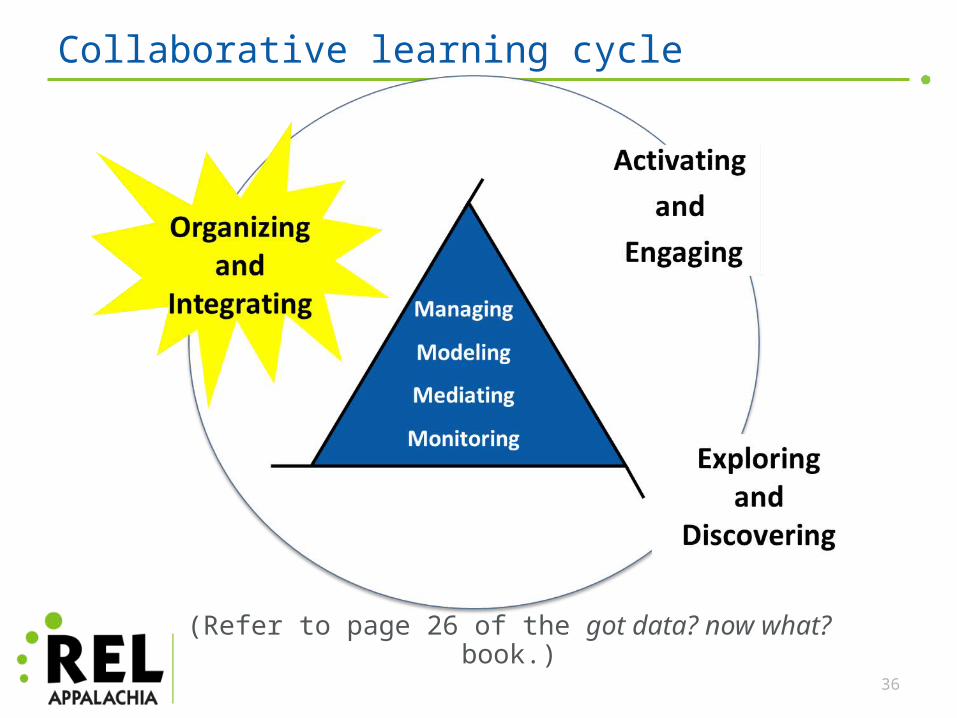
Collaborative learning cycle
(Refer to page 26 of the got data? now what? book.)
36

37
Collaborative learning cycle
Organizing and Integrating• What inferences,
explanations, or conclusions might we draw?
• What additional data sources might verify our explanations?
• What solutions might we explore?
• What data will we need to guide implementation?

Organizing and integrating
• Tips for success:– Study success.
– Generate multiple theories of causation.
– Allow for multiple causal theories.
– Seek calibrating data that are in existing archives.
– Generate multiple theories of solution.
– Make sure goals are clear and measurable (SMART goals).
(Refer to pages 35-36 of the got data? now what? book.)
38

Simulated data-based observations
• The population of English language learner students increased from 12 percent last year to 30 percent this year.
• Twenty percent of grade 7 students were proficient in reading compared with 35 percent of grade 8 students.
• The median score for grade 6 boys in reading is 40 percent at or above standards.
• Thirty-two percent of grade 8 students performed “below level” and 40 percent performed “on level” on the DIBELS oral reading fluency test.
39

40
Theories of causation
Observation:• Record three possible theories of
causation related to your observation:
1. 2. 3.
• Circle one theory to test. Record at least three sources of data that you could use to confirm this theory:
1. 2. 3.
• Achievement/Outcome Data
• Demographic Data• Process Data• Perception Data

41
Five causal categories
Five Causal
Categories
InstructionMethods, materials,
and resources
TeachersKnowledge, skills, and
dispositions
StudentsKnowledge, skills, and
dispositions
InfrastructureSchedules,
programming, and resources
CurriculumDesign and
implementation
Generate a causal theory for three different causal categories based on your chosen observation.
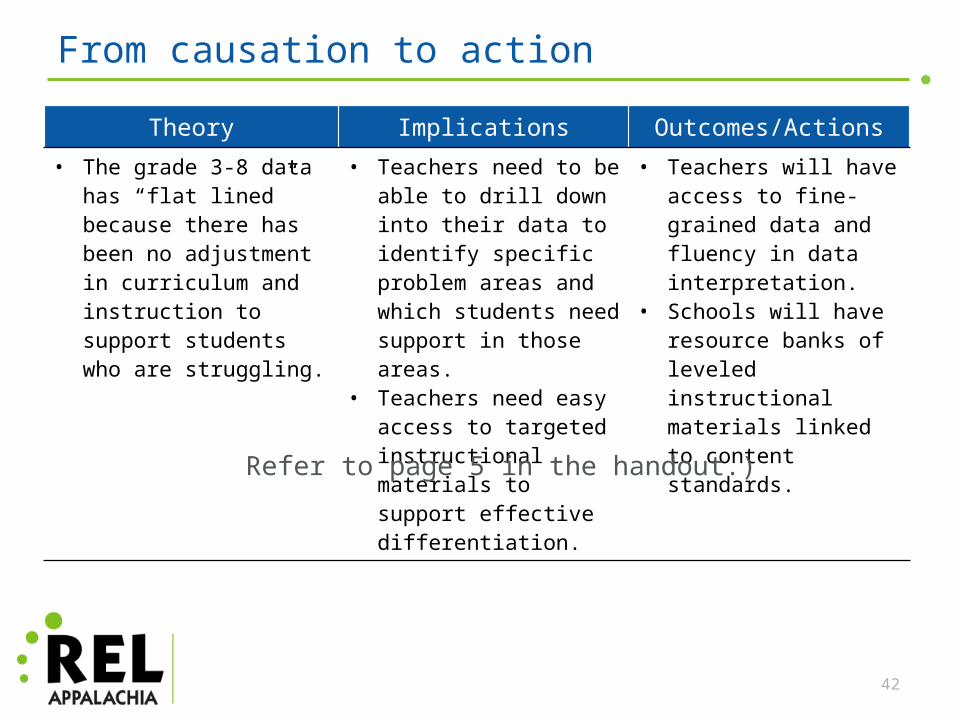
From causation to action
Theory Implications Outcomes/Actions• The grade 3-8 data has “flat
lined” because there has been no adjustment in curriculum and instruction to support students who are struggling.
• Teachers need to be able to drill down into their data to identify specific problem areas and which students need support in those areas.
• Teachers need easy access to targeted instructional materials to support effective differentiation.
• Teachers will have access to fine-grained data and fluency in data interpretation.
• Schools will have resource banks of leveled instructional materials linked to content standards.
Refer to page 5 in the handout.)
42

Looking ahead
• “As I anticipate my team leadership, a quality or skill that is important to me is …”– What might be some priorities?
– What are some goals for me?
43

Designer’s Mind: Framing and Structuring Decisions

The group leader’s design mind
(Refer to page 7 of the handout.)
45

Design frame: The purpose
• Task:– Revise the middle school language arts curriculum.
• Purpose:– Establish aligned concepts and sequenced skills that ensure literacy success for
all middle school learners.
46

47
Design frame: The purpose
• Task:– Develop school-wide
common assessments.– Generate a list of 21st century
skills.• Purpose:
– Create a purpose statement for each task example.
• Word bank:– Ensure– Promote– Assure– Maximize– Optimize– Empower– Guarantee– Sustain– Establish– Enrich

Applying the purpose
• Craft a purpose statement for an upcoming task you anticipate working on with a group or team.
48

The frame
• The purpose• The outcomes• The boundaries• The intentions• The benefits• The logistics
(Refer to pages 9-10 of the handout.)
49

Applying the frame
• Starting with the purpose statement, craft the frame for an upcoming session.
50

Structuring decisions
• Starting the conversation.• Structuring the conversation.• Sustaining thinking in the conversation.
• Group size and composition• Length of time• Degree of structure
(Refer to page 8 of the handout.) 51
Organizing and integrating
• One-word summary:– The what.
– Why you chose it.
– Who will share it.
52
Key point
• Count-off and join the table that corresponds to your number.• When you get to your table, share a key point from the day.
53

Wrap-up and Next Steps
Margie JohnsonMetropolitan Nashville Public Schools

Stakeholder Feedback Survey
Stephanie WilkersonREL Appalachia, Magnolia Consulting
References
• Chrislip, D. D., & Larson, C. E. (1994). Collaborative leadership: How citizens and civic leaders can make a difference. San Francisco: Jossey-Bass.
• Gray, B. (1989). Collaborating: Finding common ground for multiparty problems. San Francisco: Jossey-Bass.
• Lipton, L., & Wellman, B. (2012). Got data? Now what? Bloomington, IN: Solution Tree Press.
56