collaboration signatures reveal scientific impactrjohns15/content/presentations/asonam2015... ·...
TRANSCRIPT
Yuxiao Dong, Reid A. Johnson, Yang Yang, Nitesh V. Chawla Interdisciplinary Center for Network Science and Applications
Department of Computer Science and Engineering University of Notre Dame
Collaboration Signatures Reveal Scientific Impact

2!
Collaboration is an integral element of the scientific process that often leads to findings with significant impact.

3!
A real-world academic dataset from .
1. J. Tang, J. Zhang, L. Yao, J. Li, L. Zhang, Z. Su. ArnetMiner: Extraction and Mining of Academic Social Networks. KDD’08.
2. https://aminer.org/billboard/AMinerNetwork.
1,712,433!Authors !
2,092,356!Papers !
4,258,615!Collaborators!
4!
1970 1980 1990 2000 2010
1.5
2.0
2.5
3.0
Years
#aut
hors
per
pub
licat
ion
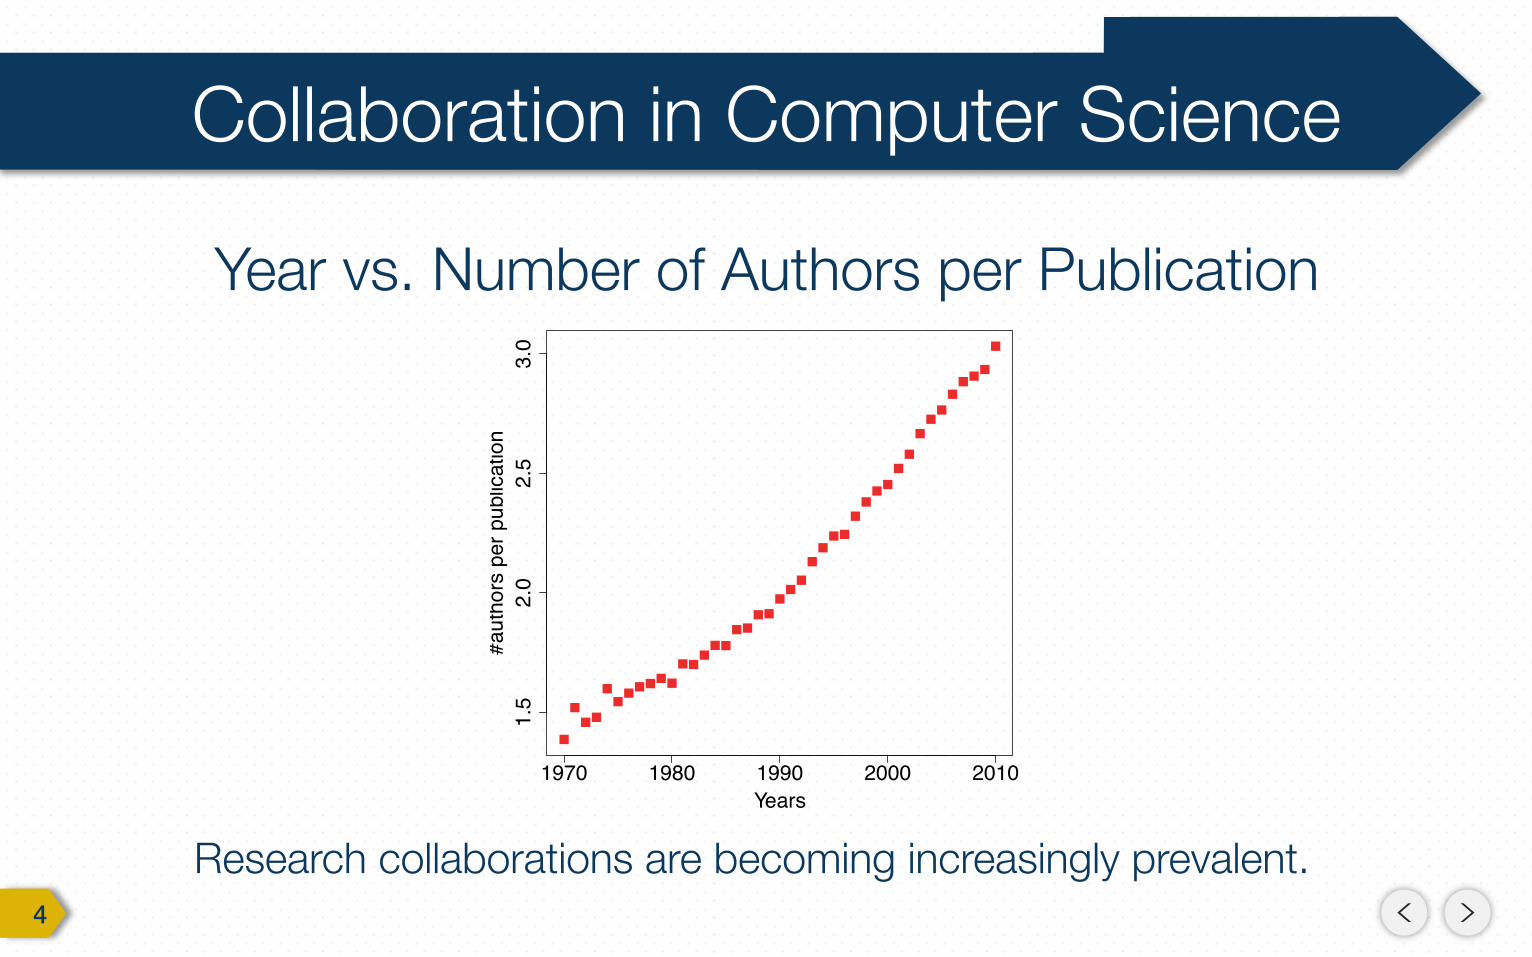
Year vs. Number of Authors per Publication
Research collaborations are becoming increasingly prevalent.

5!
year1960 1970 1980 1990 2000 2010
#p
ap
ers
101
102
103
104
105
Number of Publications
year1960 1970 1980 1990 2000 2010
#a
uth
ors
101
102
103
104
105#authors#new-authors
year1960 1970 1980 1990 2000 2010
#a
vera
ge
va
lue
0
0.5
1
1.5
2
2.5
3
3.5
4
#papers per author#authors per paper
Number of Authors Avg. of Paper/Author
Year (1950-2010) vs.:
Average publication output has remained roughly constant. Collaboration has substantially expanded.
6!
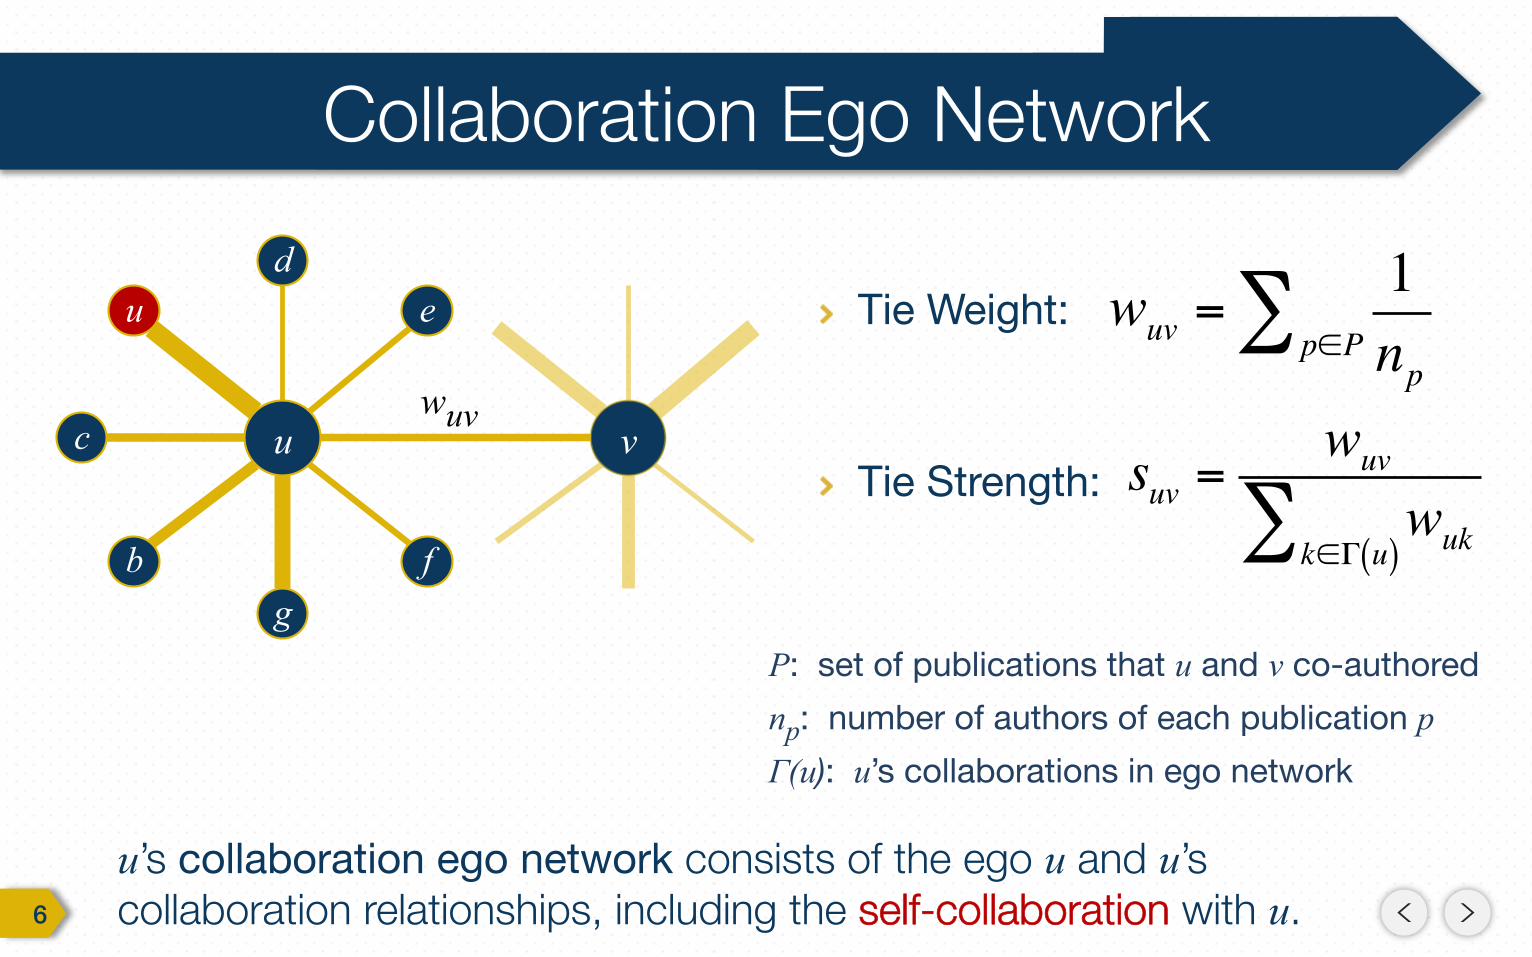
u’s collaboration ego network consists of the ego u and u’s collaboration relationships, including the self-collaboration with u.
Tie Weight:
Tie Strength:
P: set of publications that u and v co-authored np: number of authors of each publication p Γ(u): u’s collaborations in ego network
wuv =1npp∈P∑
suv =wuv
wukk∈Γ u( )∑u v
u d
e
c
b g
f
wuv

7!
Sociability: the number of collaborators . This metric examines the number of collaboration relationships that researchers can maintain throughout their academic careers.
Sociability Dependence
Diversity
Self-Collaboration
Γ u( )
u v
u d
e
c
b g
f
wuv

8!
Sociability Dependence
Diversity
Self-Collaboration
Dependence: the fraction of a researcher’s collaborators fulfilling:
This metric indicates the level of one’s research dependence.
suv > svu,I suv > svu( )
v∈Γ u( )∑Γ u( )
u v
u d
e
c
b g
f
wuv

9!
Diversity: the Shannon entropy of collaboration strength distribution:
This metric investigates how researchers distribute scientific collaborations among different collaborators.
Sociability Dependence
Diversity
Self-Collaboration
− suvv∈Γ u( )∑ × log suv( )
u v
u d
e
c
b g
f
wuv

Sociability Dependence
Diversity
Self-Collaboration
10!
Self-Collaboration: the fraction of ties that are self-collaboration, Suu.
This metric measures the efforts that are independent research, as compared to collaborative endeavors.
u v
u d
e
c
b g
f
wuv
11!
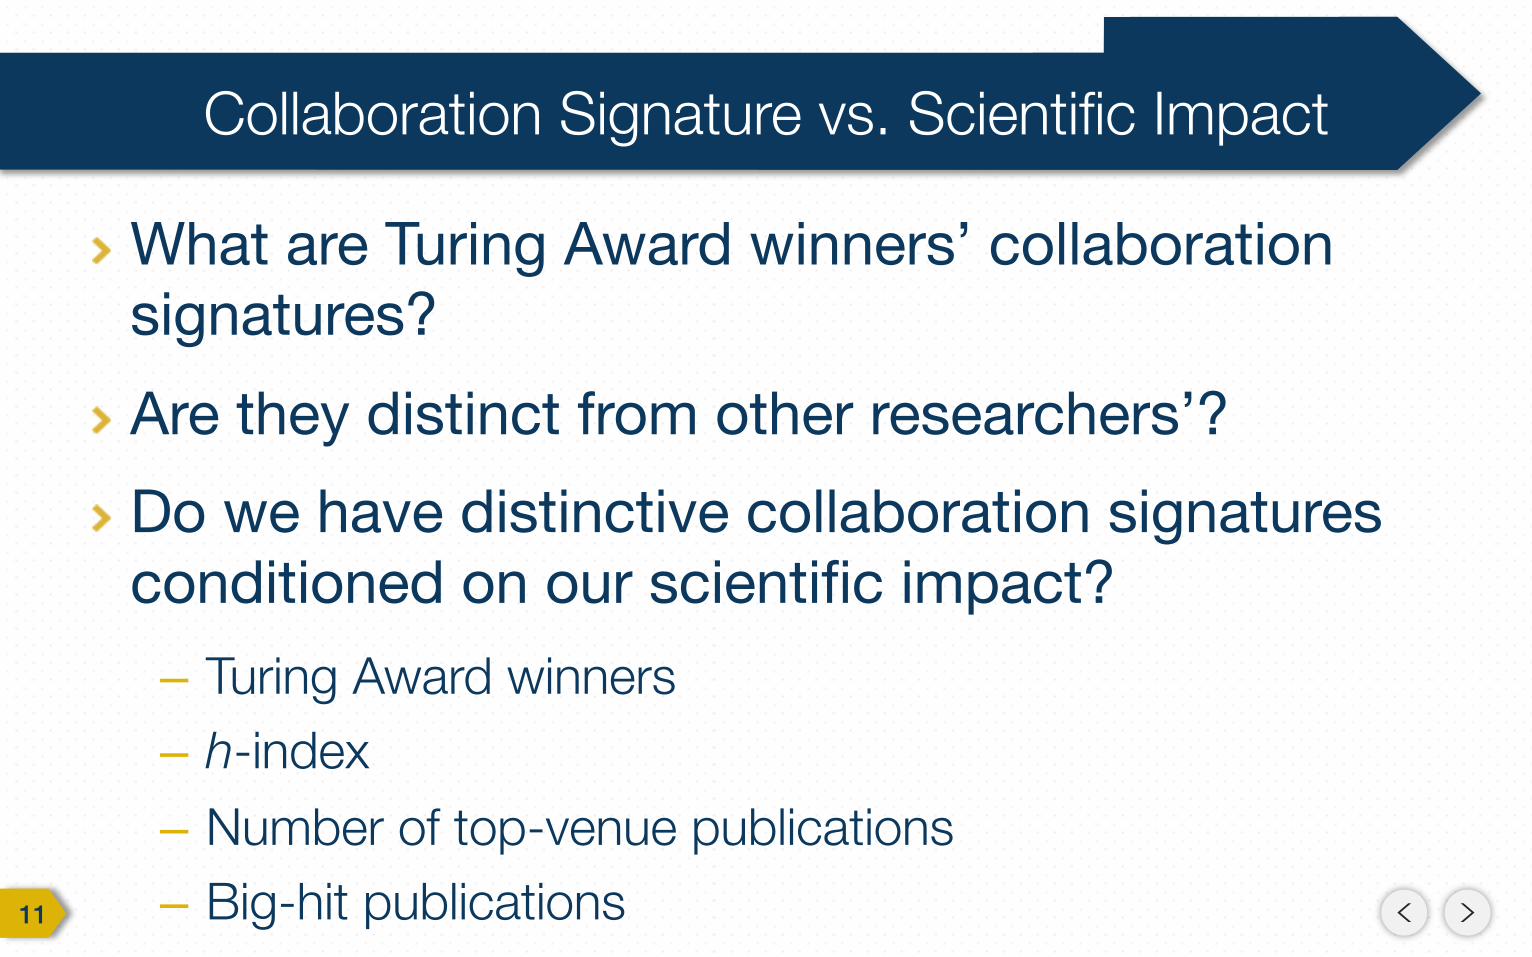
What are Turing Award winners’ collaboration signatures? Are they distinct from other researchers’? Do we have distinctive collaboration signatures conditioned on our scientific impact? – Turing Award winners – h-index – Number of top-venue publications – Big-hit publications

12! J. E. Hirsch. An Index to Quantify an Individual’s Scientific Research Output. PNAS 102(45). 2005.
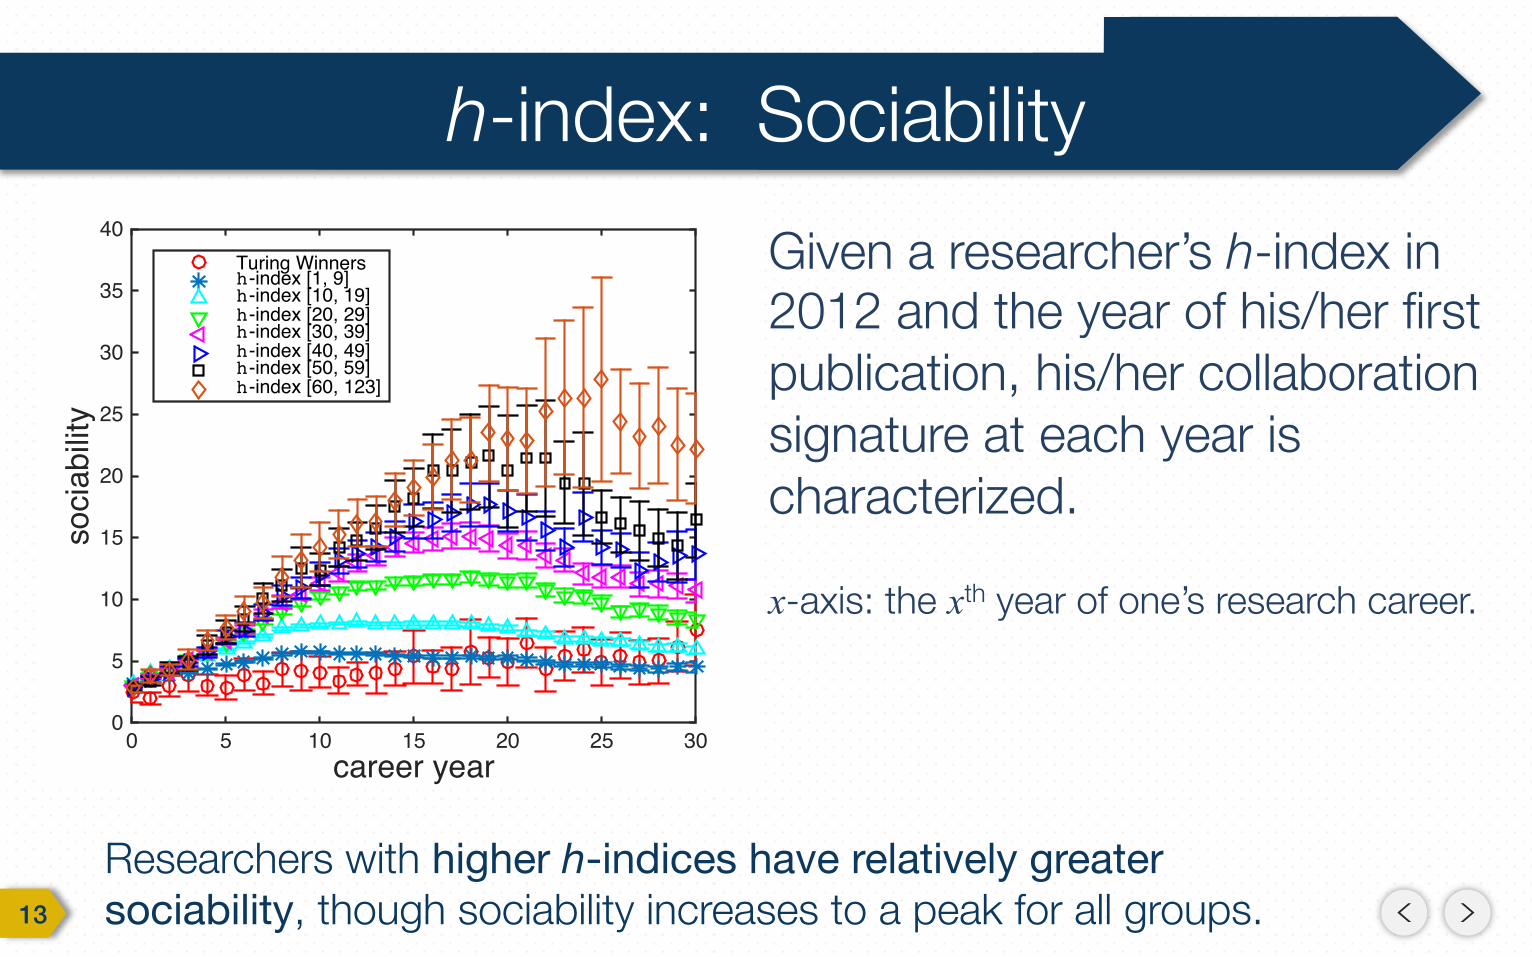
h-index
A researcher’s h-index can be used to quantify his/her scientific impact.
13!
career year0 5 10 15 20 25 30
soci
abilit
y
0
5
10
15
20
25
30
35
40Turing Winnersh-index [1, 9]h-index [10, 19]h-index [20, 29]h-index [30, 39]h-index [40, 49]h-index [50, 59]h-index [60, 123]
Researchers with higher h-indices have relatively greater sociability, though sociability increases to a peak for all groups.
Given a researcher’s h-index in 2012 and the year of his/her first publication, his/her collaboration signature at each year is characterized. x-axis: the xth year of one’s research career.

14!
#years10 15 20 25 30 35 40 45
h-index
20
30
40
50
60
70
80
90
x-axis: Number of years since first publication. y-axis: h-index.
h-indices range from 25 to 83 in 2012.

15!
career year0 5 10 15 20 25 30
depe
nden
ce
0
0.1
0.2
0.3
0.4
0.5
0.6
0.7
0.8
0.9
1
Researchers’ dependence scores generally decrease at the initial career stages and take time to increase.
Given a researcher’s h-index in 2012 and the year of his/her first publication, his/her collaboration signature at each year is characterized. x-axis: the xth year of one’s research career.

16!
career year0 5 10 15 20 25 30
dive
rsity
0
0.5
1
1.5
2
2.5
3
Between groups of researchers with different h-indices,’ diversity values tend to diverge over time, eventually stabilizing.
Given a researcher’s h-index in 2012 and the year of his/her first publication, his/her collaboration signature at each year is characterized. x-axis: the xth year of one’s research career.

17!
career year0 5 10 15 20 25 30
self-
colla
bora
tion
0
0.1
0.2
0.3
0.4
0.5
0.6
0.7
0.8
0.9
1
Between groups of researchers with different h-indices, a long-term difference in self-collaboration is identifiable early.
Given a researcher’s h-index in 2012 and the year of his/her first publication, his/her collaboration signature at each year is characterized. x-axis: the xth year of one’s research career.
18!
Extracted from 8 computer science focus areas. Choose top 3 venues for each area.
Top Venues
A researcher’s number of top-venue publications can be used to quantify his/her scientific impact.

19!
#top-venue papers100 101
soci
abilit
y
0
50
100
150
200
250AIIRCVMLTHDBDMNLP
Regardless of research area, the degree of sociability exhibited by researchers tends to increase with top-venue publications.
Artificial Intelligence (AI) - IJCAI, AAAI, ECAI
Information Retrieval (IR) - SIGIR, ECIR, TREC
Computer Vision (CV) - CVPR, ICCV, ECCV
Machine Learning (ML) - ICML, NIPS, ECML
Theory (TH) - FOCS, STOC, SODA
Databases (DB) - SIGMOD, VLDB, ICDE
Data Mining (DM) - KDD, ICDM, SDM
Natural Language Processing (NLP) - ACL, EMNLP, COLING

20!
#top-venue papers100 101
depe
nden
ce
0
0.1
0.2
0.3
0.4
0.5
0.6
0.7
0.8
0.9
1AIIRCVMLTHDBDMNLP
Regardless of research area, research dependence decreases with the number of publications in top-venues.
Artificial Intelligence (AI) - IJCAI, AAAI, ECAI
Information Retrieval (IR) - SIGIR, ECIR, TREC
Computer Vision (CV) - CVPR, ICCV, ECCV
Machine Learning (ML) - ICML, NIPS, ECML
Theory (TH) - FOCS, STOC, SODA
Databases (DB) - SIGMOD, VLDB, ICDE
Data Mining (DM) - KDD, ICDM, SDM
Natural Language Processing (NLP) - ACL, EMNLP, COLING

21!
#top-venue papers100 101
dive
rsity
0
0.5
1
1.5
2
2.5
3
3.5
4
4.5
5AIIRCVMLTHDBDMNLP
Regardless of research area, the degree of diversity exhibited by researchers tends to increase with top-venue publications.
Artificial Intelligence (AI) - IJCAI, AAAI, ECAI
Information Retrieval (IR) - SIGIR, ECIR, TREC
Computer Vision (CV) - CVPR, ICCV, ECCV
Machine Learning (ML) - ICML, NIPS, ECML
Theory (TH) - FOCS, STOC, SODA
Databases (DB) - SIGMOD, VLDB, ICDE
Data Mining (DM) - KDD, ICDM, SDM
Natural Language Processing (NLP) - ACL, EMNLP, COLING

22!
Big-Hit Papers
A researcher’s most cited publication can be used to quantify his/her scientific impact.

23!
year1975 1980 1985 1990 1995 2000
soci
abilit
y
0
50
100
150bighit [10, 100)bighit [100, 1000)bighit [1000, 10000)bighit [10000, +)
Researchers with high sociability tend to have big-hit publications.
24!
year1975 1980 1985 1990 1995 2000
depe
nden
ce
0
0.1
0.2
0.3
0.4
0.5
0.6
0.7
0.8
0.9
1bighit [10, 100)bighit [100, 1000)bighit [1000, 10000)bighit [10000, +)
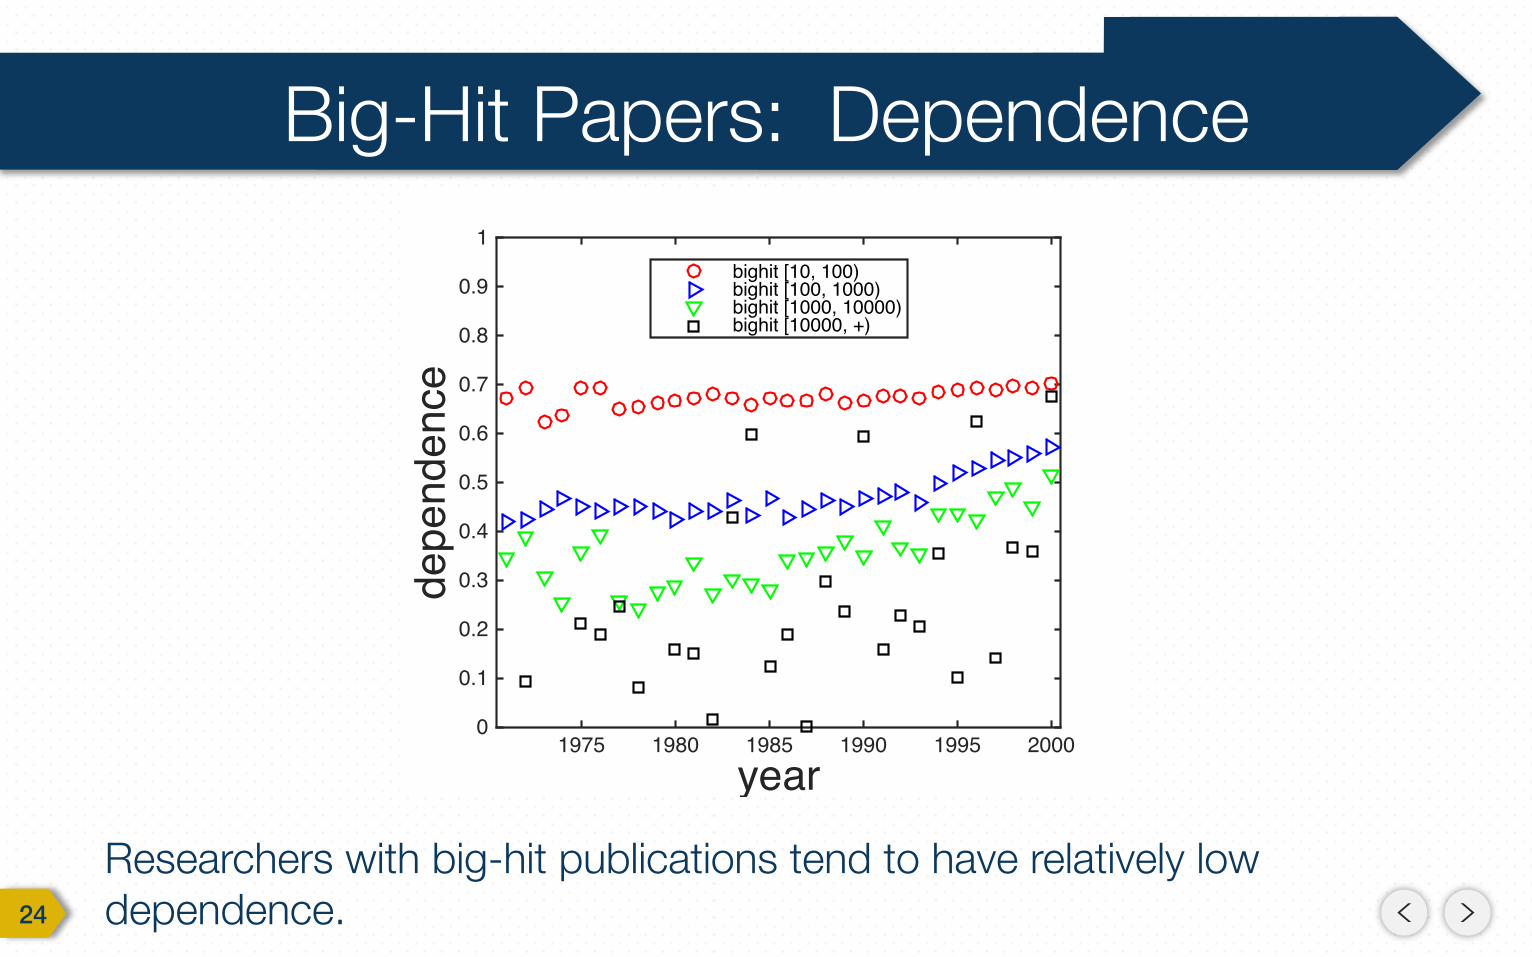
Researchers with big-hit publications tend to have relatively low dependence.

25!
year1975 1980 1985 1990 1995 2000
dive
rsity
0
0.5
1
1.5
2
2.5
3
3.5
4
4.5
5bighit [10, 100)bighit [100, 1000)bighit [1000, 10000)bighit [10000, +)
Researchers with high diversity tend to have big-hit publications.

26!
Based on these findings, we use collaboration signatures to predict scientific impact.

27!
year1950 1960 1970 1980 1990 20000
0.10.20.30.40.50.60.70.80.91
R2
PCC
Predictiveness vs. First Year Publishing
Scientific impact can be reasonably inferred from our four simple collaboration signatures even across generations of researchers.

28!
career year5 10 15 20 25 30
00.10.20.30.40.50.60.70.80.9
1R2
PCC
Predictiveness vs. Number of Years Publishing
With longer collaboration signatures, future scientific impact can be predicted with increasing fidelity (as measured by R2 and PCC).
29!
data (log)
pred
icte
d (lo
g)
10 100
1010
0
●
●
●
●
●
●
●
●
●
●
●
●
●
●
●
●
●
●
●
●
●
●
●
●
●
●
●
●
●
●
data (log)
pred
icte
d (lo
g)
10 100
1010
0
●
●
●
●
●
●
●
●
●
●
●
●
●
●
●
●
●
●
●
●
●
●
●
●
●
●
●
●
●
●
data (log)
pred
icte
d (lo
g)
10 100
1010
0
●
●
●
●
●
●
●
●
●
●
●
●
●
●
●
●
●
●
●
●
●
●
●
●
●
●
●
●
●
●
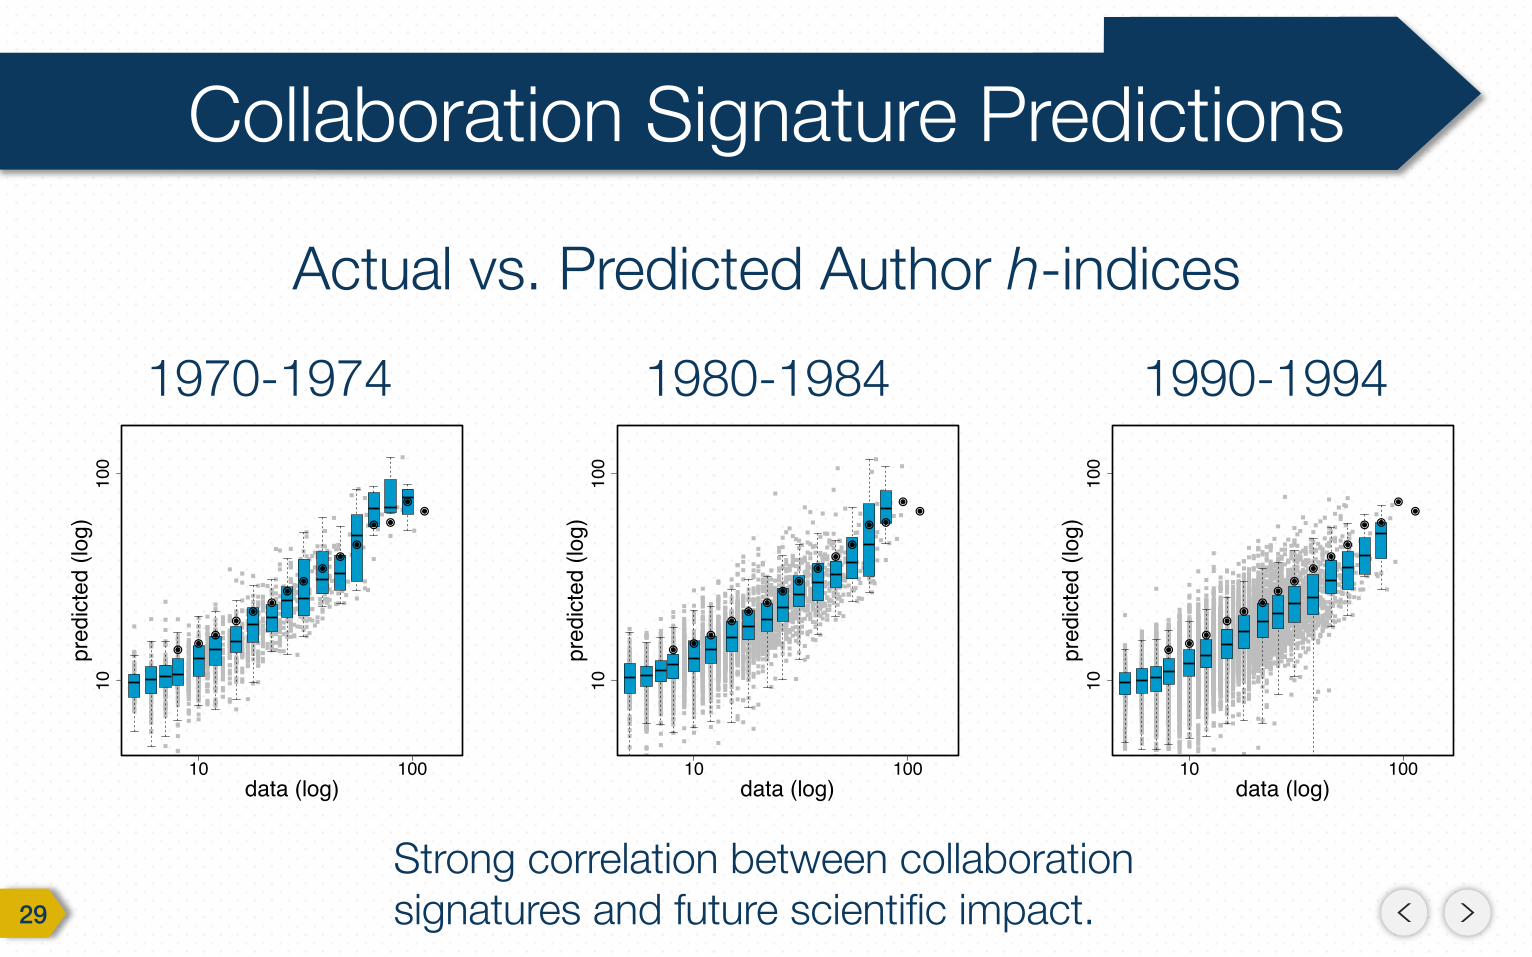
1970-1974 1980-1984 1990-1994
Actual vs. Predicted Author h-indices
Strong correlation between collaboration signatures and future scientific impact.

30!
data (log)
pred
icte
d (lo
g)
10 100
1010
0
●
●
●
●
●
●
●
●
●
●
●
●
●
●
●
●
●
●
●
●
●
●
●
●
●
●
●
●
●
●
data (log)
pred
icte
d (lo
g)
10 100
1010
0
●
●
●
●
●
●
●
●
●
●
●
●
●
●
●
●
●
●
●
●
●
●
●
●
●
●
●
●
●
●
data (log)
pred
icte
d (lo
g)
10 100
1010
0
●
●
●
●
●
●
●
●
●
●
●
●
●
●
●
●
●
●
●
●
●
●
●
●
●
●
●
●
●
●
First 5 Years First 15 Years First 25 Years
Actual vs. Predicted Author h-indices
Strong correlation between collaboration signatures and future scientific impact.

31!
Army Research Laboratory (ARL)
U.S. Air Force Office of Scientific Research (AFOSR)
Defense Advanced Research Projects Agency (DARPA)
National Science Foundation (NSF)

32!
Collaboration signatures reveal scientific impact. – Scholars with dissimilar impact produce distinctive collaboration signatures. – Scientific impact (e.g., h-index) can be inferred from collaboration signatures.
Turing Award winners display unique collaboration signatures. – Low level of sociability and diversity in collaborations. – High level of self-collaboration.
– Lifetime stability of collaboration signatures.

33!
Q & A
Will your ASONAM’15 paper or next paper increase your h-index? Dong, Johnson, Chawla. Will This Paper Increase Your h-index? Scientific Impact Prediction. In ACM WSDM’15.