collaboration on behalf of the spider lessons learned
TRANSCRIPT

Lessons learned from SPIDER’s
first flight implications for future ballooning
and satellite missions
1
Cosmology on Safari February, 2017
Jón E. GuðmundssonThe Oskar Klein Centre for
Cosmoparticle Physics,Stockholm University
on behalf of the SPIDER Collaboration

SPIDER
2
• A balloon-borne polarimeter• Mapped about 10% of the sky• Six telescopes, 3/3 at 94/150 GHz
• Approx. 2000 transition edge sensors cooled to 300 mK (85% yield)
• Sensitivity near photon-noise limit• About 0.5 deg resolution
• ℓ ≈ 10–300
• Science goals:• Set limits on primordial
gravitational wave amplitude of r < 0.03 @ 99% confidence (no foregrounds)
• Characterize polarized foregrounds• Launched on Jan 1, 2015• Flew for 16.5 days• See Benjamin Racine’s talk
following this one!

Long Duration Ballooning
• Circumpolar winds ~10 days/rev• On average 20 day flights at 36 km• Why Ballooning?• Space like loading (NET)• Access to larger angular scales• Wider frequency windows• Preparation for SPB promised land• Why Antarctica?• Continuous solar power• Long flight times• At what price?• Narrow launch windows• Recovery difficulties• Mass, power, and automation
3
Data from CSBF

4
December 2014 ca. Ross Island, Antarctica

The observational challengeTo clearly separate a primordial signal from more local sources we must
Constrain spectral energy
distribution

The observational challengeTo clearly separate a primordial signal from more local sources we must
Constrain spectral energy
distribution
Verify statistical isotropy
—
Commander dust intensity, 150 GHz

The observational challengeTo clearly separate a primordial signal from more local sources we must
Constrain spectral energy
distribution
Verify statistical isotropy
Probe all angular scales
— —
TT
EE
BBLensing B-modes
Large scale polarizationReionization
Primordial gravitational waves

8
Primary characteristicsSky coverage About 10 %
Scan rate (az) 3.6 deg/s at peak
Polarization modulation Stepped cryogenic HWP
Detector type Antenna-coupled TES
Multipole range 10 < ℓ < 300
Observation time 16 days
Limits on r† 0.03† Assuming no foregrounds, at 99% confidence
Frequency [GHz]
95 150
Telescopes 3 3
Bandwidth [GHz] 22 36
Optical efficiency 30-45% 30-50%
Angular resolution* [arcmin] 41.1 28.2
Number of detectors† 678 973
Detector loading‡ [pW] ≤ 0.25 ≤ 0.35
NET per detector [μK∙rts] 163 165*FWHM. †Current channel cuts‡Including atmosphere, sleeve, window, and baffle
Pivot
Aperture
Sun shield
Top dome
Hermetic feedthroughGondola
Reaction wheel
SIP
Vacuumvessel
8.1 m

9

VCS1
VCS2 10
Main tank
Vacuum vessel
Refrigerator
FPU
Objective
Eyepiece

Our trajectory
11

Feb 5, 2015 — data recovery
Fig. BAS

Nov 17, 2015 — payload recovery
Fig. Ed Young

Fig. Ed Young
Oct 13, 2016 — recycled aluminum

Observation regions
15
Fig. Sasha Rahlin

Polarization amplitude
16
● SPIDER scanned approximately 10% of the sky
Fig. Sasha Rahlin

SPIDER hits map
17
● About 12.3% covered, about 6.3% if you apply the following hits weight

First flight performance summary
18
Quantity 94 GHz 150 GHz
Good channels 678 973
Percentage flagged [%] 30.4 33.4
Integ. time [ch-yr] 16.2 22.2
Median NET [μKrts] 165 163
Total NET [μKrts] 5.4 6.7
Map depth [uK arcmin] 22.9 18.9
Beam FWHM [arcmin] 41.1 28.2
■ Most instantaneously sensitive experiment to have deployed!○ Currently flagging heavily to avoid RFI and thermal variations
■ Map depth currently around 20 μK arcmin ○ Planck HFI map depth around 77 and 33 μK arcmin
at 100 and 143 GHz, respectively■ Total data volume around 1.5 TB (very similar to Planck total)■ Remarkably low detector loading■ Detect non-CMB polarization with high significance!

SPIDER 150 GHz band
19
Map depth
currently about
20 μK arcmin
PRELIMINARY

Comparison to Planck HFI
20
Map depth about
33 μK arcmin
PRELIMINARY
Planck PR2 Maps, nominal Full Misison map

First science results
21
See preliminary results in Ben’s talk following
this one

22JPL Microdevices Lab

Cosmic rays
are insignificant...
23
Planck 143 GHz timeline
SPIDER 150 GHz timeline
Our TES detectors are
great for space!

Radio Frequency Interference (RFI)
24
...but radio interference from payload antennas is significant
Currently flagging about
30% of data.
Expect this to
come down.
Plot from A. Gambrel

25
• The most instantaneously sensitive experiment to date!
• Exceptionally low photon load• Phonon noise limited
• Colder focal plane desirable
In-band loading Instrument NET
94 GHz ≤ 0.25 pW 6.5 μK√s (652)
150 GHz ≤ 0.35 pW 5.1 μK√s (1030)
Boomerang (150 GHz) 0.5 pW ~ 60 μK√s
BICEP2(150 GHz) 4.7 pW ~ 16 μK√s
Planck (143 GHz) 0.8 pW ~ 16 μK√s
Overall detector performance

SPIDER-2 development
26
● Receivers operating at 285 GHz are built and undergoing testing● Project about 335 uKrts sensitivity per detector and 17 arcmin beam
New cryostat built
and leak tight!
NIST OMTs and silicon
platelete feedhorns

SPIDER-2 development
27
• Third frequency band (285 GHz) complementary to Planck

Detector back-of-the-envelope
28
• Absolute detector sensitivity set by:• Geometry, materials, and temperature• Instrument transmission and emissivities• Photon loading incl. atmosphere and the CMB• Readout electronics
• Altitude and water set atmospheric (photon) loading
• What’s the typical bolometer performance as a function of altitude?
am Atmospheric Model — Scott PaineThanks to S. Bergman!!
Atacama1 mm PWV45 deg elev.
Photo: JPL
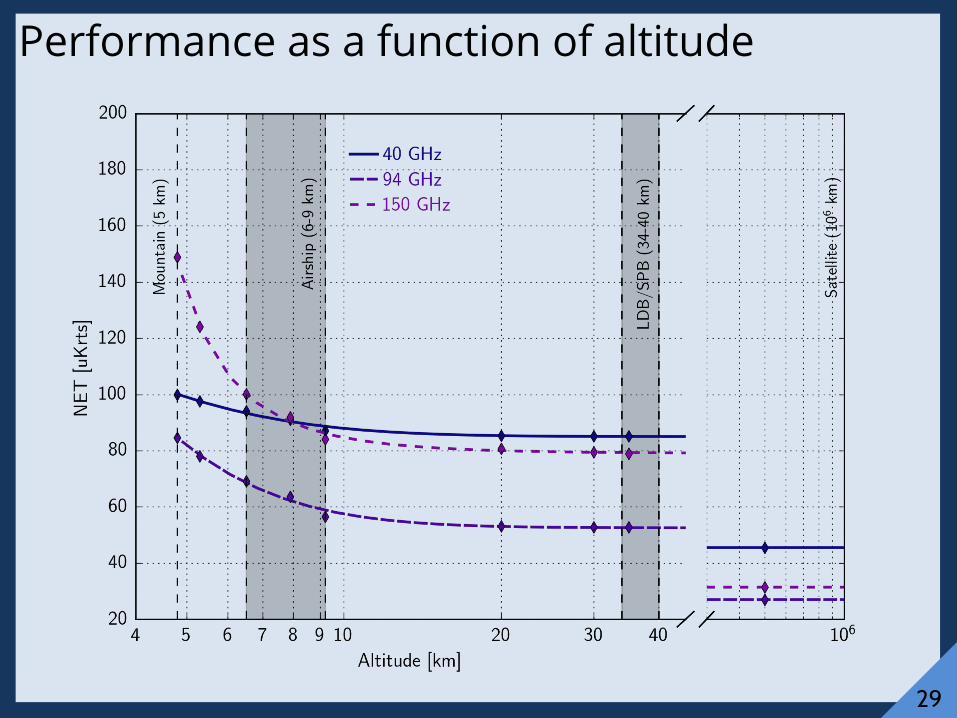
Performance as a function of altitude
29

Performance as a function of altitude
30
Of course, integration time
and filtering are
equally important!

Third flight scheduled for the spring of 2017
Wanaka, New Zealand44°42′S 169°09′E Second mid-latitude flight:
May 2016, 46 days in air
Wanaka, New Zealand44°42′S 169°09′E First mid-latitude flight:
March 2015, 33 days in air
Wanaka, New Zealand44°42′S 169°09′E
SPB Ballooning
31
• Constant volume balloons• Stable altitude
• First science flight in 2016• Potentially offers ~100 day flights
• Launch base in New-Zealand• Intermediate latitudes• Full diurnal cycles• Payload mass ~1000 kg
Data from CSBF

Nordita program – July 2017
32
Peter AdsheadAndreas AlbrechtFrank Avignone Nicholas BattagliaDaniel BaumannAnthony ChallinorCynthia ChiangJens ChlubaJoanne CohnCora DvorkinHans K. Eriksen Silvia GalliJohn T. GiblinAriel GoobarLavinia HeisenbergRenée HlozekDaniel HolzBhuvnesh JainBill Jones Renata Kallosh
Will KinneyEiichiro Komatsu Massimiliano Lattanzi Andrei LindeMarilena LoVerdePavel NaselskyPaolo NatoliHans Peter Nilles Lyman Page Enrico Pajer Marco Peloso Graca Rocha Subir Sarkar Uroš Seljak Ravi Sheth Jon SieversScott Watson Martin White
Invited and confirmed participants
OrganizersKatherine Freese, Martina Gerbino, Shirley Ho, Jon Gudmundsson, Ingunn Wehus
including conference on inflation and the CMB

SPIDER summary
• SPIDER is a completely autonomous payload • Electrical power, pointing control and reconstruction,
redundant data systems (100 GB/day), cryogenic single-crystal sapphire polarization modulators
• Most sensitive microwave receiver to date• Weighs a bit over 3.5 tons
• Over 500 kg cooled to 4 K• About 30 kg cooled to 250 mK
• About 15 km of cryogenic wiring• Hand-made with love (most of the time)• Subsequent flight planned for 2018
Photo: Z. Kermish

34
Stay tuned!