collaboration and informal hierarchy in innovation teams
TRANSCRIPT
S P E C I A L I S S U E A R T I C L E
Collaboration and informal hierarchy in innovationteams: Product introductions in entrepreneurialventures
Amrita Lahiri1 | Emily C. Pahnke2 | Michael D. Howard3 |
Warren Boeker2
1Department of Management, Information Systems and Entrepreneurship, Carson College of Business, Washington State University,
Pullman, Washington
2Department of Management and Organization, Michael G. Foster School of Business, University of Washington, Seattle,
Washington
3Department of Management, Mays Business School, Texas A&M University, College Station, Texas
Correspondence
Amrita Lahiri, Department of Management,
Information Systems and Entrepreneurship,
Carson College of Business, Washington State
University, Pullman, WA 99163.
Email: [email protected]
Funding information
Texas A&M University; University of
Washington
Abstract
Research Summary: Although stars may be particularly inno-
vative, building teams to collaborate with them can be diffi-
cult. Coordinating efforts between stars and non-stars may
be especially complex in new venture, which rely on infor-
mal hierarchy to manage organizational tasks. We investi-
gate how a venture's success at introducing new products
may be influenced by the extent to which company foun-
ders and star performers are involved in co-developing new
technologies. By analyzing innovation teams within a sector
of the medical device industry from 1986 to 2007, we find
that combining both star inventors and founder-inventors
on a venture's innovation team may limit product introduc-
tions. Our results highlight the importance of organizational
design in managing coordination and resource allocation in a
venture setting and suggest important boundary conditions
when stars may impede, rather than benefit, innovation.
Managerial Summary: Designing an innovation team can be
challenging for new ventures. While the presence of a tech-
nologically proficient founder or highly accomplished inven-
tor can significantly bolster a new venture's innovation
Received: 30 June 2017 Revised: 14 June 2019 Accepted: 18 June 2019
DOI: 10.1002/sej.1331
© 2019 Strategic Management Society
326 wileyonlinelibrary.com/journal/sej Strategic Entrepreneurship Journal. 2019;13:326–358.

efforts, our results indicate that these roles must be care-
fully managed to prevent conflicts between them. Our find-
ings suggest that founders who hire star inventors should
establish a clear hierarchy of decision-making within innova-
tion teams, while also offering greater autonomy to the star
inventor in matters concerning innovation leadership and
product development. We also suggest that it may be
advantageous for founders to hire star inventors with prior
experience working in new ventures as opposed to older,
established organizations. Overall, our study indicates that
new ventures need to exercise caution in hiring and manag-
ing star employees.
K E YWORD S
entrepreneurial leadership, innovation, innovation teams, new
product development teams, stars
1 | INTRODUCTION
Organizational design choices made during their early years have a long-lasting impact on ventures. New firms must
construct their internal structures in ways that will support the development of innovative products, quickly provid-
ing revenue, and legitimacy while establishing the venture's future viability. Past research has shown how coordi-
nated team efforts create innovations that can lead to successful product introductions (Hargadon, 2002; Matusik,
2002; Taylor & Greve, 2006) and has highlighted the importance of this team, variously labeled the inventive team
(Bercovitz & Feldman, 2011), creative team (Reagans & Zuckerman, 2001; Roberts, 1991), or innovation team
(Knight, 1989; Nerkar, McGrath, & MacMillan, 1996) to new venture success. The manner in which the new ven-
ture's innovation team1 (the term we adopt here) is organized can have important implications for the innovation
success of the firm.
Although the importance of the innovation team for the new venture's success is well-established (Beckman,
Burton, & O'Reilly, 2007), many questions remain as to how these teams should be configured to enhance their
effectiveness (Bercovitz & Feldman, 2011; Chen & Garg, 2018; Onal Vural, Dahlander, & George, 2013). At the firm
level, prior research establishes the considerable influence of founders and founder backgrounds on organizational
design. Founders with broader functional experience create greater opportunities for growth and success
(Beckman & Burton, 2008), and higher founder human capital may set the stage for the more rapid emergence of
hierarchical structure and greater administrative intensity (Baron, Hannan, & Burton, 1999; Colombo & Grilli, 2013).
By choosing to keep tight control over the firm, founders may ultimately even undermine its value
(Wasserman, 2017).
Founders must determine how to organize the innovation effort, specifying the roles that key members of the
innovation team should play and how decisions regarding new product introductions are made. These choices are
likely to be particularly challenging and impactful when managing star performers (Chen & Garg, 2018). Prior
research has shown that there is a significant positive impact of highly accomplished individuals or “stars” on team
innovation, reinforcing the intuitive notion that these members may make a team more innovative (Toole &
Czarnitzki, 2009; Tzabbar & Kehoe, 2014; Zucker, Darby, & Armstrong, 2002). However, as Chen and Garg (2018:
LAHIRI ET AL. 327
p.1240) note, “[Organizations] face a tradeoff in utilizing stars. On the one hand, stars possess unique skills and bring
new ideas to the organization. On the other hand, these unique skills may also make it difficult for organizations to
use stars effectively because organizational routines are typically geared to utilize more conventional skill sets”.
Founder characteristics, choices and consequences extend to the strategy and design of the innovation team (Eesley,
Hsu, & Roberts, 2014; Ott, Eisenhardt, & Bingham, 2017), illustrating the critical nature of these early organizational
decisions.
While established organizations typically have existing routines and formal hierarchy for managing organizational
tasks, new ventures are more likely to rely on informal hierarchy—an implicit rank ordering determined by the extent
to which they defer to each other's individual expertise and competence (Freeman, 1986; Magee & Galinsky, 2008;
Sørensen, 2007). However, the extent to which this informal hierarchy is understood and agreed upon is likely to
vary (Blau, 1977). For example, some teams may be implicitly organized based on social affinity, while others may be
based on their task expertise. When members of an innovation team derive their prior successes and standing within
the team from different sources there is likely to be less clarity and agreement among members as to whom should
be deferring to whom (He & Huang, 2011). As we suggest in this study, this ambiguity can impair the ability of the
venture to successfully innovate. In particular, we explore the challenges to ventures that configure their innovation
teams such that star inventors, who have already amassed an extremely successful record of accomplishment of
innovation, collaborate on invention with company founders, who are often originators of the initial ideas that led to
the firm's creation. Organizations face a tradeoff in utilizing stars. On the one hand, stars possess unique skills and
bring new ideas to an organization. On the other hand, these unique skills may also make it difficult for organizations
to use stars effectively because organizational routines are typically geared to utilize more conventional skill sets.
Our research is motivated by whether configuring teams to bring together individuals with expertise derived
from different sources can actually lead to subpar outcomes for the firm. For example, highly accomplished team
members may have a detrimental effect on innovation if competition among them undermines their ability to
work together effectively (Loch, Huberman, & Stout, 2000). Recent research has demonstrated how star per-
formers may have trouble collaborating effectively (Chen & Garg, 2018; Groysberg, Polzer, & Elfenbein, 2011)
or may engage in unproductive status-seeking when there are too many of them (Overbeck, Correll, & Park,
2005) or when group members hold differing perceptions of the informal hierarchy of expertise on the team
(Kilduff, Willer, & Anderson, 2016).
The empirical context of our study is the minimally invasive surgical device (MIS) segment of the US Medical
Devices industry, a quintessential example of an industry driven by innovation and entrepreneurship. We examine
the industry from its inception in 1986 through 2007, tracking all new ventures over this history. By setting our
study in a population of new ventures that are initially focused on the creation and launch of a single product, we
are able to identify the innovation team members (Gruber, MacMillan, & Thompson, 2012). We examine the role of
two types of team members on product introductions in these new ventures: (a) founder-inventors—founders of the
new venture who also engage in patenting for the venture they start and (b) star inventors—extraordinarily produc-
tive individuals whose past innovative output places them among the top 5% of all inventors in the industry.
Our findings suggest that the presence of star performers and founder-inventors on a firm's innovation team is
positively associated with improved firm performance. Surprisingly, combining founder-inventors and stars on the
team may actually limit successful product introductions. Our post-hoc analysis suggests that this outcome is likely a
result of a lack of innovation leadership within the venture arising of the informal organizational hierarchy. Our study
makes several contributions. First, we inform the literature on innovation in new ventures by exploring how entre-
preneurial ventures' internal organization shapes innovative performance. Specifically, we contribute to further
understanding how individual expertise and hierarchical structures act together to promote or limit the efforts of
innovation teams, highlighting some of the boundary conditions around the benefits that star performers can provide
for innovation. In doing so, our study extends an emerging body of evidence (e.g., Chen & Garg, 2018; Groysberg,
Lee, & Nanda, 2008; Kehoe & Tzabbar, 2015) that suggests that there are also significant challenges in managing
highly productive individuals within organizations. Second, we extend recent research on the effects of informal
328 LAHIRI ET AL.

hierarchy among group members (He & Huang, 2011; Kilduff et al., 2016) by showing how ambiguous hierarchies
may undermine the ability of the new venture to innovate successfully. Finally, our research contributes to and
extends understanding of how an important aspect of organizational design, the makeup of the innovation team (cf.,
Conti, Gambardella, & Mariani, 2014), has important consequences for the venture's subsequent success in introduc-
ing new products.
2 | THEORY
Innovation is often defined as “a process that begins with an invention, and results in the introduction of a new prod-
uct, process or service to the marketplace” (Edwards & Gordon, 1984; Katila & Shane, 2005). In this view, the intro-
duction of a product is the ultimate outcome of the innovation process, which typically begins with the development
of novel inventions documented in patents and then proceeds through various product development stages, such as
prototyping, testing for efficacy, and in our setting, clinical trials. The knowledge used in these processes is often
tacit and resides in individuals (Simon, 1991), necessitating collaborative interactions and relational ties (Polanyi,
1966). For example, Guimerà, Uzzi, Spiro, and Amaral (2005) argue that organizations create teams specifically to
combine individuals with different capabilities, knowledge, and skills, who can then work together to augment their
individual innovation efforts. The technological backgrounds of the individuals on the team and the ability of the
team to productively collaborate can determine the success of the firm's innovation efforts (Bercovitz &
Feldman, 2011).
Assembling an effective innovation team has been shown to be a difficult task for many firms (Guimerà et al.,
2005; Onal Vural et al., 2013). When the goal is to introduce a new product, ventures need to achieve the
integration of individual expertise within a team context to ensure the success of their innovation efforts (Ancona &
Caldwell, 1992). Achieving this integration may be particularly challenging in teams where stars and non-stars collab-
orate (Chen & Garg, 2018). Although the literature on star performers has drawn attention to the potential benefits
arising from their collaborative capability (Kehoe & Tzabbar, 2015; Oettl, 2012; Taylor & Greve, 2006), scholars have
also argued that, given the social and interdependent nature of knowledge creation, an organization's ability to lever-
age a star's unique skills can be “an exercise in learning under complexity,” involving “numerous trial and error adjust-
ments” (Chen & Garg, 2018: p.1241). Given the importance of organizing innovation teams in a way that actually
allows firms to capture their value (Conti et al., 2014; Reagans, Argote, & Brooks, 2005), we study the organization
of invention activities of star inventors and company founders in newly founded organizations.
2.1 | Team member quality and informal hierarchy
The success of innovation teams in new ventures depends on the participation of competent team members. In team
settings, members form beliefs about each other's competence and expertise, and such beliefs result in an informal
hierarchical ordering that influences how team members work together (He & Huang, 2011). As Magee and Galinsky
(2008) note, the creation of an informal hierarchy can occur in a wide variety of settings, including work groups
(Groysberg et al., 2011), fraternities (Gould, 2002), and even street corner gangs (Whyte, 1943). This informal hierar-
chy can help facilitate and clarify decision-making (He & Huang, 2011), including decisions around the technological
direction of the venture. Team members who are viewed as more competent or successful are likely to have a promi-
nent role in these decisions. Through the active involvement of highly accomplished individuals in the founding of
the firm and the innovation process, the new firm can enhance its legitimacy (Higgins & Gulati, 2003) and attract
additional resources from resource providers (Certo, 2003), benefiting the firm financially as well as improving its
access to timely information regarding technology developments in the industry.
LAHIRI ET AL. 329

2.1.1 | The role of star performers
Recruiting expert employees is one way for new firms to help ensure their survival (Wasserman, 2012). A rich body
of research has emphasized the important role that star performers play in innovative organizations (Baba, Shichijo, &
Sedita, 2009; Hess & Rothaermel, 2011; Zucker et al., 2002), where “stars” are defined as extraordinarily productive
individuals who achieve distinction in their respective fields (Chen & Garg, 2018; Kehoe & Tzabbar, 2015; Sub-
ramanian, Lim, & Soh, 2013; Zucker et al., 2002). Although hiring stars is often expensive (Groysberg et al., 2008;
Groysberg et al., 2011), new ventures may consider such investments worthwhile for several reasons. Most obvi-
ously, since stars have succeeded in the past, they are typically expected to do so in the future and may help ensure
the success of the new venture. For example, stars may have prior experience understanding and successfully
addressing problems with the product development process and may be aware of how to overcome these problems.
Stars may be especially valuable to new ventures lacking a history of success and tangible accomplishment. For
example, stars may help to legitimate a new venture (Benjamin & Podolny, 1999), thereby helping to recruit other
key personnel and resources (Hess & Rothaermel, 2011; Lacetera, Cockburn, & Henderson, 2004). In the new ven-
ture setting stars can provide alignment and direction and their position in the informal hierarchy (and the attendant
deference accorded them) may help focus the team more quickly around a set of problems and solutions (Johnson,
Funk, & Clay-Warner, 1998). A star inventor's leadership can help a team avoid many of the costs of undirected
exploration and better orchestrate team members' technological expertise to rapidly develop successful products
and secure their intellectual property rights through patents (Tzabbar & Kehoe, 2014). For example, stars may have
mental models of efficient ways of testing the efficacy of a new medical device, or connections to industry experts
who can help identify potential problems at an early stage. Such a focus is particularly important to resource-
constrained new ventures that cannot afford costly missteps, and for which product introduction is a key means of
gaining legitimacy and revenue (Schoonhoven, Eisenhardt, & Lyman, 1990). Given the voluminous amount of past
research that has demonstrated the importance of stars for innovative efforts, our baseline assumption is that new
ventures with more stars on their team will be more likely to introduce new products.
2.1.2 | The role of hierarchical position
In contrast to a position in the informal hierarchy based on technical expertise, such as for star inventors, the stature
of innovation team members may instead be obtained and evaluated based on their position in the organization's for-
mal hierarchy (Dahlander & McFarland, 2013; Gould, 2002). Founders occupy positions of influence within a start-up
firm that may transfer to their role within the innovation team. Research by Wasserman (2003) demonstrates how
the founders of a venture can have an extraordinary influence on the key decisions made within the firm. Founders
that also have technical expertise and participate on the innovation team are likely to be accorded deference based
on their positions both in the formal and informal hierarchy (Gruber, MacMillan, & Thompson, 2013), and past
research has demonstrated that greater founder human capital is associated with more rapid formation of hierarchi-
cal structure in a new venture (Colombo & Grilli, 2013). Founder-inventors have substantial discretion and greater
freedom to allocate resources such as funding and personnel to projects they find especially promising. Given their
discretion and influence, founder-inventors are able to coordinate the actions of the innovation team and focus
attention and resources toward projects in which they are actively involved. Such direction by founder-inventors is
likely to increase other team members' support of specific projects or approaches, facilitating better collaboration
(Bercovitz & Feldman, 2008). Therefore, the active participation of founders in technology development is likely to
improve product introduction in new ventures by directing knowledge development efforts, enhancing legitimacy,
and increasing resources. Our second baseline assumption is that new ventures with active founder-inventors will be
more likely to introduce new products.
330 LAHIRI ET AL.

2.2 | Deference among inventors
A star inventor or a founder-inventor might expect to play a critical role within the innovation team, commensurate
with her accomplishments and importance to the innovation efforts of the venture. However, some level of dysfunc-
tion may occur when a star inventor and a founder-inventor work together on the same innovation team, due to the
fact that each of them draw their standing from different sources (Magee & Galinsky, 2008). Consider a situation
where members of an innovation team can be clearly ordered based on their accomplishments such that the informal
hierarchy is clear. This informal hierarchy creates a straightforward social order in which the ideas and opinions of
higher-ranking team members are likely to be respected and followed more than those of lower-ranking team mem-
bers. In turn, this may lead to more clarity and agreement on the technological direction of the venture (He &
Huang, 2011).
In contrast, in a group where many members each see themselves as accomplished experts, some members may
need to subordinate their own views in order to maximize the performance of the group (Hogan & Hogan, 2002).
Problems may arise in such situations because these accomplished individual team members have different views
about the technological direction of the venture and may be less willing to engage in compromise or integrative
actions in order to further the work of the team (Hambrick, 1994). When no established hierarchy exists among team
members, group interactions tend to “become confusing, inefficient, and frustrating,” and coordination suffers
(Magee & Galinsky, 2008: p.357). Ridgeway and colleagues (Ridgeway & Johnson, 1990; Ridgeway, Johnson, &
Diekema, 1994) demonstrate that task groups that lack differentiation in the informal hierarchy also lack a sense of
group solidarity, leading to negative emotional reactions and poorer performance. For example, Groysberg et al.
(2011) in a study of investment banks, found that having multiple high-status analysts within a research department
had a diminishing and ultimately negative effect on performance.
Within innovation teams, leadership is typically assumed by the individual who is considered an expert in that
specific domain (Tzabbar & Kehoe, 2014; Zucker, Darby, & Armstrong, 1998). Innovation leadership, in this context,
can be defined as, “the ability of a firm's members to initiate and lead innovation” (Kehoe & Tzabbar, 2015: p.711).
Stars working in innovation teams are typically expected to lead the research agenda for that team (Kehoe &
Tzabbar, 2015). On the other hand, founder-inventors are empowered with a great deal of discretion and control
over the firm's resources and its technological direction (Park & Tzabbar, 2016). Foundational work on social theory
in organizations has long argued that sources of importance or influence based on different criteria can be detrimen-
tal for performance (Scott, 1966; Stinchcombe, 1959; Udy, 1959). For example, it is difficult to compare achieve-
ments in technological development or influential journal publications with a work history of important managerial
positions at prominent firms. Consequently, performance across different dimensions may not be easily reconciled
to determine a clear hierarchy of authority, which may lead to uncertainty and unproductive debate within the inno-
vation team. With greater uncertainty about relative standing among members of the group, individuals tend to
revert to beliefs that their own position surpasses that of others (Berger, Cohen, & Zelditch Jr, 1972; Berger,
Ridgeway, Fisek, & Norman, 1998). In firms where founders and stars work together on innovation activities, this
uncertainty can lead to ambiguity in innovation leadership.
Firms can vary in the extent to which founder-inventors and star inventors collaborate. Collaboration between
founder-inventors and stars on innovation activities will necessitate negotiation and coordination on the innovation
targets and activities to be performed by the firm. Firms where most innovation efforts involve collaboration
between founder-inventors and star inventors could indicate less delegation of innovation efforts by the founder-
inventor and could be at greater risk of negative consequences from poorer task coordination (Magee & Galinsky,
2008). Further, collaboration efforts with founders may limit the scope of search engaged in by the star for a specific
innovation effort as they would need to discuss and negotiate any innovation goals with the founder along with the
best way to achieve the goal (Azoulay, Graff Zivin, & Manso, 2011; Conti et al., 2014). However, firms where innova-
tion efforts can be independently led by founder-inventors or star inventors without necessitating joint collaboration
are likely to result in a better balance of innovation leadership in the firm, with such teams more likely to achieve
LAHIRI ET AL. 331

successful innovation outcomes. We argue that greater collaboration around innovation between founder-inventors
and star inventors may create greater challenges in bringing innovations to market for the new venture, thus delaying
the launch of new products.
Hypothesis 1: Firms with a greater proportion of their innovation activities performed jointly by stars and
founder-inventors will have fewer product introductions.
2.3 | Knowledge domains of founders and stars
The detrimental impact of the simultaneous presence of stars and founder-inventors on a venture's innovation team
may vary depending on the knowledge base from which each of them draws in the course of developing innovations.
Given that new ventures with no history cannot draw from a rich organizational knowledge base accumulated
through years of operating experience, the simplest approach is to exploit and pursue knowledge in areas with which
the founders are familiar (Chatterji, 2009; Stuart & Podolny, 1996). Exploiting knowledge domains familiar to the
founders enables the venture to leverage existing knowledge and build on routines that may have worked well in the
past (Park & Tzabbar, 2016; Winter, Cattani, & Dorsch, 2007). However, research suggests that star inventors, given
their past success, are more likely to innovate at the new venture in ways that build on their own expertise. As
Tzabbar and Kehoe (2014) note,
“Due to individuals' cognitive limitations (March & Simon, 1958), an interest in sustaining their unique posi-
tions within the firm (Pfeffer, 1981), and preferences for predictability in performance (Audia & Goncalo,
2007), stars are likely to prefer that a firm continues to focus on research activities and technological
niches that require their expertise, and thus are likely to prefer exploiting their own research
agendas” (p.455).
Within the context of a new venture's innovation team, the extent of technological knowledge similarity between
founder-inventors and star inventors is likely to have important implications for the venture's success in generating
innovations (e.g., Basu, Sahaym, Howard, & Boeker, 2015). Having similar knowledge domains would indicate that
the founder-inventor and star inventor are likely to have a similar understanding of how technologies work and are
likely to look for new solutions in a neighborhood familiar to both (Cohen & Levinthal, 1990; Fleming, 2001). When
the technological knowledge domains of the founder-inventors and star inventors are similar, they are likely to have
a higher capacity to leverage their mutually shared knowledge to further the firm's innovation goals. However, too
high levels of knowledge similarity between the founder-inventor and the star inventor may lead to greater ambigu-
ity in innovation leadership, potentially leading to disagreements on the technological direction of the venture,
thereby adversely affecting the firm's ability to introduce new products. For example, Dahlander and McFarland
(2013) find that greater overlap in the knowledge domain across scientists leads to lower likelihood of collaboration
and shorter duration for the collaborations that do exist. Indeed, as noted by a founder in the popular press, “Smaller
businesses tend to attract take-charge types who like to try new things, and roles within a startup often overlap by
necessity. When that tension escalates to an all-out turf war, it can destroy your business from the inside”
(Gerber, 2014).
Conversely, we suggest that if the areas of technological expertise between the founder-inventor and star inven-
tor are too dissimilar, it may be difficult to successfully integrate the knowledge areas of the star inventors and
founder-inventors and successfully produce innovative products. This is based on the argument that the absorptive
capacity of an individual or firm is principally grounded in their existing base of knowledge (Cohen & Levinthal, 1990;
Mowery, Oxley, & Silverman, 1996). When the knowledge similarity between founder-inventors and star inventors is
too low, they are likely to have a lower capacity to leverage their mutually shared knowledge to further the firm's
332 LAHIRI ET AL.

innovation goals (Ahuja & Katila, 2001; Dosi, 1988). Thus, both too high and too low a level of similarity between the
knowledge domains of the star and founder-inventor can have a negative effect on product introductions by the
new venture.
In sum, a certain degree of divergence between the technological knowledge domains of founders and star
inventors is often desirable; however, there are declining returns to such divergence. By combining the more familiar
knowledge domains of founders with the potentially dissimilar knowledge areas of star inventors, new ventures can
more successfully create new knowledge that leads to the introduction of new products (Tushman & O'Reilly, 1996).
Thus, we expect that new ventures will be most effective at introducing new products when a founder's own techni-
cal expertise diverges from the knowledge domains of the star inventor to some degree but not when this difference
is too high.
Hypothesis 2: The degree of similarity between the founder's and star inventor's technological knowledge
domains has an inverted U-shaped effect on product introductions by the venture.
3 | METHODS
3.1 | Sample and data sources
We focus our study on startups in the minimally invasive surgical devices (MIS) segment of the medical device indus-
try. These devices can radically improve patient outcomes by allowing for small incisions during surgical procedure.
Medical histories trace the origins of the industry to the mid-1980's, with the first companies focused on developing
these devices founded in 1986 in the U.S. (Park & Lee, 2011). MIS devices are technologically complex and typically
encompass multiple underlying patents. The protection of intellectual property via patenting is a vital part of the
product development cycle in this industry and innovation and collaboration can be observed through the patenting
record (Cohen, Nelson, & Walsh, 2000; Graham, Merges, Samuelson, & Sichelman, 2009). An important feature of
our focus on startups is that the notable ways in which they organize Research and Development (R&D) projects dif-
fers from R&D in established companies; this is particularly evident in the MIS industry for several reasons. First,
many medical device firms are founded by surgeons, who recognize the need for a specific device, which is related
to their personal experience and expertise (Smith & Shah, 2013). They then found a company to pursue the develop-
ment of this device. Typically, this focus persists at least until FDA approval is obtained. This contrasts with
established medical device firms that develop many, often unrelated, product lines, and technologies simultaneously.
Second, developing these devices is costly and takes several years. Unlike established companies that have consider-
able resources to pursue multiple, unrelated projects simultaneously, resource-constrained new ventures rarely have
the financial ability to pursue many concurrent R&D projects. Thus, our focus on new ventures enables us to draw
clearer causal inferences compared to large firms where many R&D projects are pursued simultaneously. Third, unlike
the rigid hierarchical structures and divisions that often exist in established organizations, the organizational structure
in startups is much flatter, which allows us to more precisely observe inventors that participate in specific projects. As
a result, when we observe the activities of inventors in our study, we are confident that they are involved in the core
R&D effort of the new venture, and the result of their participation should directly influence product introduction out-
comes for the firm.
Our data collection began by interviewing over 40 MIS device experts including VCs, entrepreneurs, regulators,
engineers, surgeons, medical professors, and consultants. Interviews lasted between 30 and 90 min and consisted of
open-ended questions about the participant's role in the industry. We asked entrepreneurs and engineers questions
about their role in inventing and commercializing new product devices. These interviews helped us develop our data
collection strategy and identify industry-appropriate measures. They also provided insight into the product develop-
ment process and industry dynamics and aided in validating our theory. The MIS industry is a distinct subclass of
LAHIRI ET AL. 333

medical devices in the minds of those involved in the industry. However, it is not clearly delineated by patent classes
or SIC codes. To examine the population of all United States firms in this industry, we compiled data from numerous
sources including survey data from Windhover Information Inc., (an industry intelligence firm) and membership lists
and conference proceedings from trade organizations (e.g., The International Society for Minimally Invasive Cardiac
Surgery and The Medical Device Manufacturer's Association). We also used the National Institute of Health's Medi-
cal Subject Heading (MESH) classification scheme to identify words associated with MIS devices, which we then
used to search LexisNexis and Google to identify individual startups. After identifying firms in the industry, we collected
data on company founders. These data were compiled from numerous sources including the firm's own websites, archives
of the firm's websites (htttp://www.archive.org/), ZoomInfo, Business Week, LinkedIn, and LexisNexis. Although we col-
lected data on the entire population of U.S. based firms in the industry, we restrict our analysis to firms that filed a patent,
attempted to develop an MIS device (not manufacturers or distributors), and were independently founded (i.e., not spi-
noffs) between 1986 and 2007, and for which we were able to find data on the founding teams.
We start the sample in 1986, which is when our industry informants and medical industry experts indicate the
first firms were founded to develop MIS devices. We matched this data with information on patents associated with
the new venture. We then created a comprehensive data set of all patents that were filed and subsequently granted
by firms in our data set. To create this data set, data on patents and inventors were triangulated across both the
Delphion database and disambiguated inventor data obtained from Harvard Dataverse (Li et al., 2014). For every
inventor associated with these patents, we created complete inventor histories that enabled us to track their collabo-
ration histories longitudinally, building on previous studies, which utilized patents to measure inventor team charac-
teristics (Paruchuri, 2010; Phelps, 2010; Singh & Fleming, 2010). Data on patents extends from 1976 to 2010,
providing an adequate period in which to observe subsequent patenting activity of the new ventures. Since many of
our variables of interest rely on patent data, we limited our sample to firms that have at least one patent in the first
5-years following the founding date. This constrained our sample to 132 firms.
Our study is at the firm level and examines the interaction between the founder-inventor(s) and star(s) for each
new venture in our data sample. This team consists of all individuals in the firm who actively participate in developing
the firm's technology, as documented in the patent record. The 132 firms in our final sample included data on
87 stars, 195 founders, and 93 founder-inventors (most firms have multiple founders), 2,205 inventors, and 3,346
unique patents over the observation period. We performed t-tests to understand how these firms might differ from
the entire population (i.e., those firms that did not patent or for which we could not find founder data) and found no
significant differences in terms of number of founders, firm financing, or founder experience variables.
3.2 | Measures
3.2.1 | Dependent variable
MIS devices cannot be sold in the U.S. without first receiving FDA approval (Chatterji, 2009). The date of an FDA approval
is a good proxy that indicates when a product was released to the market. Our dependent variable, product introductions, is
measured as the focal venture's count of products receiving class III device approval from the U.S. Food and Drug Adminis-
tration each year. Data on all product approvals were gathered from the FDA's publically available databases.
3.2.2 | Independent variables
Star inventors: “Stars” have been conceptualized as extraordinarily productive individuals who achieve distinction in
their respective fields (Chen & Garg, 2018; Kehoe & Tzabbar, 2015; Subramanian et al., 2013; Zucker et al., 2002).
For example, Zucker et al. (1998) studied stars in the biotech industry and found that the top 0.75% of contributors
accounted for almost 17% of all contributions to the genetic sequence database, GenBank. Other research defines
stars in terms of those who are both the most productive and whose work has the greatest impact (Azoulay, Graff
334 LAHIRI ET AL.

Zivin, & Wang, 2010; Rothaermel & Hess, 2007). To identify star inventors within our sample for a given year t, we
identified individuals that were in the 95th percentile of inventors based on total number of patents they filed
through year t, across all the companies in our sample. Our approach ensures that we are able to observe inventor
productivity through the course of the development of the MIS industry. We found 88 unique stars in our sample
based on this procedure. The average star inventor in our sample was granted 60 patents in the course of his or her
patenting history prior to new venture founding. We then created a binary variable (star) that was set to one if the
focal firm's innovation team contained one or more active star performers and zero otherwise.
Founder-inventor: We created a binary variable (founder-inventor) which was set to one if one or more of a ven-
ture's founders were actively involved in patenting for a focal startup and zero if they were not. In order to identify
firm founders among active inventors in a new venture, we first used a disambiguation algorithm to identify unique
inventors (Li et al., 2014) among the founders in our data. Our algorithm draws primarily from the founder's prior
organizational affiliation available through our compiled founder profile information. We used this information to
rank unique inventor matches by comparing the prior patenting history of a given inventor with the known prior
organizational affiliations of that individual. We also manually verified each match using additional information from
the founder biographies we compiled. This process allowed us to identify all founders who had engaged in invention
activities in the past. In order to identify founders who continued to be actively involved in patenting after founding
their company, we used the established unique inventor identity of each founder to determine whether he or she
was named on a patent that was filed after the founding date of the new venture.
Proportion of founder-star coinvention: The extent of founder-inventor and star collaboration on innovation activi-
ties within a firm in a given year was captured through a time-varying measure. This was the count of annual patents
filed by the focal new venture that listed both a founder and star as coinventors, divided by the total number of
annual firm patents filed that year.2 This variable was lagged by a year because the trend in our data shows that
product introductions lag patents.
Founder-star technological distance: The degree of similarity between the founder and star's knowledge base is mea-
sured based on the technology areas of their patents during the 5 years prior to the founding date of the new venture. By
using data on patents in the 5-year period prior to the new venture's inception, we capture their most recent and relevant
knowledge base. We measured this construct (founder-star tech distance) as the Euclidean distance between patent classes
following the approach of Rosenkopf and Almeida (2003). For a specific patent class i, this measure was defined as:
Xi
star patent proportioni – founder patent proportionið Þ2" #1=2
The results are then scaled to provide a range from zero to one, with values close to one reflecting high techno-
logical distance between the founder's and the star's knowledge base. For firms that had multiple founder-inventors
or multiple stars involved in patenting activities, we considered the maximum distance between each founder-star
dyad.3 Although firms with multiple founder-inventors and stars are a minority in our sample (only five firms fall into
this category), Figure 1 demonstrates how this distance would be calculated for a hypothetical firm with two
founder-inventors and two stars. In this example, the founder-star technological distance will be calculated as:
Max DF1S1,DF1S2,DF2S1,DF2S2ð Þ
3.2.3 | Control variables
We included a number of control variables in our analyses. New venture innovation outcomes are likely to be
affected by the amount of resources at the disposal of the new venture (Kortum & Lerner, 2000). We collected data
LAHIRI ET AL. 335

on the financial resources that each MIS venture obtained annually from venture capitalists, corporate venture capi-
talists, and the government. These data were obtained from VentureXpert, VentureSource, and the government's
SBIR program. The net total was captured in the variable total funding. This process enabled us to control for perfor-
mance differences due to heterogeneity in financial resources between firms. The variable was lagged by 1 year in
order to account for response time for the funding to impact performance and transformed to account for skewness
in its distribution by using the logarithm of the original value. The age of the firm may account for heterogeneity in
the extent of legitimacy earned by new ventures, with older firms having more time to establish themselves. This
was captured in the variable firm age, also lagged by 1 year. The introduction of new products may be directly
influenced by a firm's engagement in inventive activities demonstrated by the number of patents filed. Thus, patent
count controls for the number of patents filed by a firm, lagged by 1 year. As more prominent venture capital firms
might plausibly provide superior contacts, expertise, and resources to their target firms (Stuart, Hoang, & Hybels,
1999), we also controlled for heterogeneity of resource providers by tracking whether the firm had a high status
venture capital investor, coded as the variable, VC status. This binary variable is set to one if the firm received invest-
ment from one or more of the top 30 VC organizations in terms of their eigenvector centrality within the VC
co-investment networks in technology industries (Bonacich, 1987; Katila, Rosenberger, & Eisenhardt, 2008). Differ-
ences in regional ecosystems could affect the firm's ability to innovate. Hence, we control for geographical factors
related to firm location by including binary variables if the firm was located in the Bay Area, Orange County, Boston or
Minneapolis, and New York/New Jersey/Connecticut—five regions noted for medical device innovation. Henceforth,
we refer to these geographical controls as location dummies. We also include dummies representing the primary com-
petitive subsegment associated with each firm that allowed us to control for heterogeneity across subsegment
dynamics within the MIS industry (Pahnke, McDonald, Wang, & Hallen, 2015).
We also control for several factors related to founding team. We control for the size of the founding team (num-
ber of founders). In addition, we control for the technological distance between founder-inventors and non-star
inventors by incorporating a variable founder non-star tech distance that measures the Euclidean distance between
F IGURE 1 Calculation of founder-star technological distance for ahypothetical firm with two foundersand two stars
336 LAHIRI ET AL.

the founder-inventor and the non-star inventors in the innovation team following the procedure previously
described for the creation of the variable founder-star technological distance.4 We also separately controlled for the
number of founder-inventors in the focal firm (founder-inventor count).
We included several controls for heterogeneity in founder-star dynamics. To control for founder and star pre-
founding ties, we incorporated a dummy variable (founder-star common employer) that was set to one if the founder
and star had a common prior employer. Shared ties through prior experience at industry incumbent firms may influ-
ence the knowledge base and interactions between innovation team members (Klepper & Sleeper, 2005). We also
included a control for the observed time of star entry into the firm by including a dummy variable (star entry) that
was set to one for the first year when star patenting activity was observed in the firm. Stars that were most recently
employed by older organizations are likely to be more attuned to formal hierarchy than stars who were most recently
employed by younger organizations. We thus created a binary variable star origin that was set to one if the firm had
at least one star who was most recently employed by an older organization (at least 20 years-old) (McDougall & Rob-
inson, 1990) based on the patent assignment history of the star inventor. Since firms self-select into hiring stars, the
factors that enable firms to hire stars are endogenous to the firm and may be associated with performance achieved
(and observed). We discuss our approach to dealing with this potential endogeneity in the next section.
We also controlled for the number of active inventors in a firm (team size) as larger teams have both broader and
deeper knowledge from which to draw. We did this by including a count (2-year moving average) of inventors who
are active in patenting for the new venture. Teams can also vary in the extent to which members share collaboration
ties based on their patenting history. To consider this in our analysis, we include controls for the innovation team's
clustering coefficient and team density (Newman, Watts, & Strogatz, 2002), calculated as a 2-year moving average. In
calculating the clustering coefficient for a venture's innovation team, we considered the nodes to be individual mem-
bers of the firm's innovation team. Two nodes were considered to be connected in a given year if the two focal
members of the firm's innovation team had collaborated on a patent filed in any period before that year based on
their prior patenting histories. The clustering coefficient for a firm's innovation team in a given year was calculated
as follows:
Clustering= 3* The number of triangles in the graphð Þ= number of connected triplesð Þ
Here, a triangle is a set of three nodes, each of which is connected to both the others. A connected triple is a set
of three nodes where at least one is connected to both the others. The overall clustering coefficient thus calculated
quantifies the extent to which members of a firm's innovation team had a prior history of collaboration with each
other. This measure varies between zero and one.
The density of the firm's internal collaboration network for a given year was calculated by dividing the number of
actual connections among members of the firm's innovation team in a given year based on their prior history of col-
laboration prior to the focal year, by the maximum number of potential collaborations among team members.
3.3 | Statistical methods
The level of analysis used in our study is the firm-year, with the data organized as a panel consisting of 1,158 obser-
vations from the 132 firms in our final sample. In our study, the presence of star inventors on the innovation team is
not exogenous. Firms may hire star performers with the intent of pursuing specific strategies regarding the launch of
their initial products. Thus, our empirical strategy was designed to address this issue. We ran our analysis using the
system general method of moments (GMM) estimator (Arellano & Bond, 1991). GMM models have several advan-
tages for dealing with challenges in a data set like ours where the dependent variable partly depends on its own prior
history, the independent variables may not be strictly exogenous, and where autocorrelation within (but not across)
firm level variables is possible (Roodman, 2009). We use the system GMM estimator where the first difference of
explanatory variables is instrumented with corresponding levels of lagged variables and the levels are simultaneously
LAHIRI ET AL. 337

instrumented with adequate lagged differences. The system GMM estimator provides an important advantage over
the alternative difference GMM estimator, because persistence in the dependent variable (product introductions)
can cause severe weak instrument problems in difference GMM models (Roodman, 2009). In our approach, we treat
the dependent variable, product introductions, and the proportion of founder-star coinvention as potentially endoge-
nous. Location and year controls were treated as exogenous variables. All other independent variables were treated
as predetermined. We follow the recommendation in Blundell and Bond (1998) and incorporate lags of t-2 for all
endogenous variables and lags of t-1 for all predetermined ones. A similar approach to addressing endogeneity has
been taken by several recent studies (e.g., Berchicci, 2013; Suarez, Cusumano, & Kahl, 2013; Uotila, Maula, Keil, &
Zahra, 2009). We use the “xtabond2” routine in Stata 14 to obtain the estimations, which are tabulated in Table 2.
To further exclude the possibility of endogenous or unobserved effects confounding our results, we incorporate year
dummy variables to absorb any category-invariant heterogeneity occurring within the period of our study. We also
use robust standard errors to account for potential heteroscedasticity or serial autocorrelation.
Several tests were used to evaluate the validity of the results obtained. We examine the AR(1) and
AR(2) statistics that report the Arellano Bond test for serial correlation in the error terms. Serial autocorrelation is
expected in the AR(1) statistic but not in the AR(2) statistic. This assumption is consistent with our finding a non-
significant AR(2) statistic. We thus conclude that serial autocorrelation is not present in the error structure. We also
test for and report the Hansen's J statistic, with the reported results further demonstrating the validity of the GMM
estimates obtained.
3.3.1 | Endogeneity in star selection
As noted earlier in this article, a potential source of endogeneity when analyzing star influence on firm performance
is that firms self-select into hiring stars. For that reason, observed firm performance may be conditional on
unobserved factors that influence firms' ability to hire star inventors. To correct for this potential bias, we used a
two-stage Heckman selection model (Heckman, 1979). Following Hamilton and Nickerson (2003), the first stage of
this model is used to specify the selection model, that is, the likelihood of sampled firms to successfully hire star
inventors. The results of this stage are used to calculate the Inverse Mills ratio, which is then used as a control vari-
able for the second stage.
4 | RESULTS
Table 1 presents the means, SD, and correlations among the variables. As is indicated in the correlation matrix, the
presence of stars is significantly correlated with larger teams and a higher number venture patents.
In our first stage probit model, we used the following variables to estimate the likelihood that a firm hires a star:
external economic conditions indicated by the year-end closing value of the S&P500 index (logged), founder science
professor (binary variable indicating whether any of the founders were Science Professors), founders' industry expe-
rience, management experience, and entrepreneurial experience (binary indicators of whether any of the founders
had industry-specific prior experience, management experience or had previously founded a medical device start-
up), founder education variables (binary variables indicating whether any of the founders had a Ph.D., MBA, JD, or
MD) number of firm founders, and the total amount of funding received by the venture. This analysis is tabulated in
Table 2. We used the S&P500 index as an instrument that would reflect environmental munificence. The broad mar-
ket performance of established, publicly traded firms might plausibly influence the opportunity costs of star scientists
and their likelihood to pursue the relatively risky path of joining startups, without directly impacting individual firm
performance outcomes. Furthermore, this variable met the criteria for “strong” instruments recommended by past
research, assessed by the significance of the F-statistics (Bascle, 2008).
338 LAHIRI ET AL.
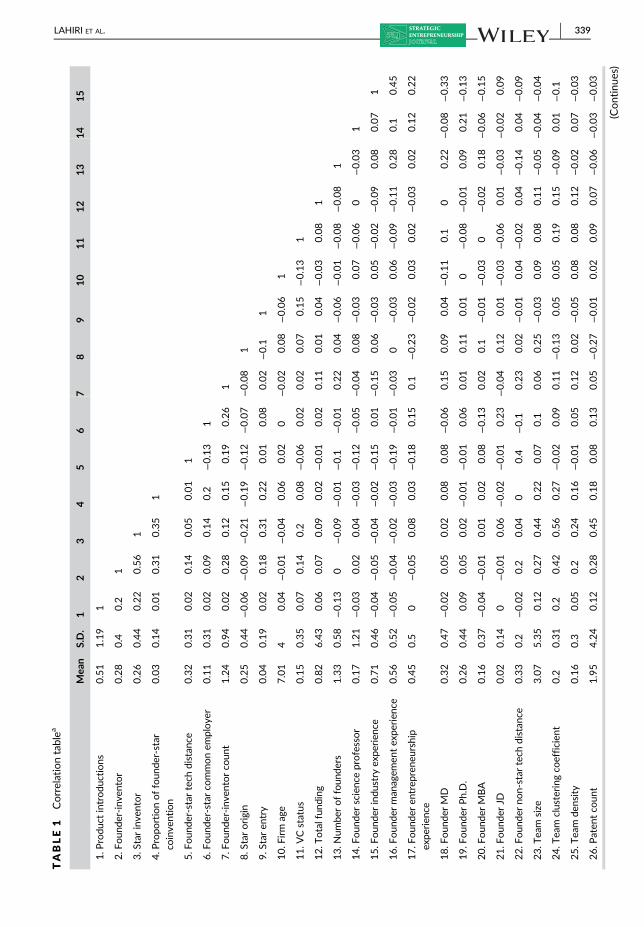
TABLE1
Correlationtablea
Mea
nS.D.
12
34
56
78
910
11
12
13
14
15
1.P
rodu
ctintrodu
ctions
0.51
1.19
1
2.F
oun
der-inve
ntor
0.28
0.4
0.2
1
3.S
tarinve
ntor
0.26
0.44
0.22
0.56
1
4.P
ropo
rtionoffoun
der-star
coinve
ntion
0.03
0.14
0.01
0.31
0.35
1
5.F
oun
der-star
tech
distan
ce0.32
0.31
0.02
0.14
0.05
0.01
1
6.F
oun
der-star
commonem
ploye
r0.11
0.31
0.02
0.09
0.14
0.2
−0.13
1
7.F
oun
der-inve
ntorco
unt
1.24
0.94
0.02
0.28
0.12
0.15
0.19
0.26
1
8.S
tarorigin
0.25
0.44
−0.06
−0.09
−0.21
−0.19
−0.12
−0.07
−0.08
1
9.S
taren
try
0.04
0.19
0.02
0.18
0.31
0.22
0.01
0.08
0.02
−0.1
1
10.F
irm
age
7.01
40.04
−0.01
−0.04
0.06
0.02
0−0.02
0.08
−0.06
1
11.V
Cstatus
0.15
0.35
0.07
0.14
0.2
0.08
−0.06
0.02
0.02
0.07
0.15
−0.13
1
12.T
otalfun
ding
0.82
6.43
0.06
0.07
0.09
0.02
−0.01
0.02
0.11
0.01
0.04
−0.03
0.08
1
13.N
umbe
roffoun
ders
1.33
0.58
−0.13
0−0.09
−0.01
−0.1
−0.01
0.22
0.04
−0.06
−0.01
−0.08
−0.08
1
14.F
oun
derscienc
eprofessor
0.17
1.21
−0.03
0.02
0.04
−0.03
−0.12
−0.05
−0.04
0.08
−0.03
0.07
−0.06
0−0.03
1
15.F
oun
derindu
stry
expe
rien
ce0.71
0.46
−0.04
−0.05
−0.04
−0.02
−0.15
0.01
−0.15
0.06
−0.03
0.05
−0.02
−0.09
0.08
0.07
1
16.F
oun
derman
agem
entex
perien
ce0.56
0.52
−0.05
−0.04
−0.02
−0.03
−0.19
−0.01
−0.03
0−0.03
0.06
−0.09
−0.11
0.28
0.1
0.45
17.F
oun
deren
trep
rene
urship
expe
rien
ce
0.45
0.5
0−0.05
0.08
0.03
−0.18
0.15
0.1
−0.23
−0.02
0.03
0.02
−0.03
0.02
0.12
0.22
18.F
oun
derMD
0.32
0.47
−0.02
0.05
0.02
0.08
0.08
−0.06
0.15
0.09
0.04
−0.11
0.1
00.22
−0.08
−0.33
19.F
oun
derPh.D.
0.26
0.44
0.09
0.05
0.02
−0.01
−0.01
0.06
0.01
0.11
0.01
0−0.08
−0.01
0.09
0.21
−0.13
20.F
oun
derMBA
0.16
0.37
−0.04
−0.01
0.01
0.02
0.08
−0.13
0.02
0.1
−0.01
−0.03
0−0.02
0.18
−0.06
−0.15
21.F
oun
derJD
0.02
0.14
0−0.01
0.06
−0.02
−0.01
0.23
−0.04
0.12
0.01
−0.03
−0.06
0.01
−0.03
−0.02
0.09
22.F
oun
derno
n-star
tech
distan
ce0.33
0.2
−0.02
0.2
0.04
00.4
−0.1
0.23
0.02
−0.01
0.04
−0.02
0.04
−0.14
0.04
−0.09
23.T
eam
size
3.07
5.35
0.12
0.27
0.44
0.22
0.07
0.1
0.06
0.25
−0.03
0.09
0.08
0.11
−0.05
−0.04
−0.04
24.T
eam
clustering
coefficien
t0.2
0.31
0.2
0.42
0.56
0.27
−0.02
0.09
0.11
−0.13
0.05
0.05
0.19
0.15
−0.09
0.01
−0.1
25.T
eam
density
0.16
0.3
0.05
0.2
0.24
0.16
−0.01
0.05
0.12
0.02
−0.05
0.08
0.08
0.12
−0.02
0.07
−0.03
26.P
aten
tco
unt
1.95
4.24
0.12
0.28
0.45
0.18
0.08
0.13
0.05
−0.27
−0.01
0.02
0.09
0.07
−0.06
−0.03
−0.03
(Continue
s)
LAHIRI ET AL. 339

TABLE1
(Continue
d)
16
17
18
19
20
21
22
23
24
25
16.F
oun
derman
agem
entex
perien
ce1
17.F
oun
deren
trep
rene
urship
expe
rien
ce0.35
1
18.F
oun
derMD
−0.2
−0
1
19.F
oun
derPhD
−0.14
−0.1
−0.1
1
20.F
oun
derMBA
0.11
0.03
0.07
−0.13
1
21.F
oun
derJD
0.12
0.16
−0.1
−0.08
0.01
1
22.F
oun
derno
n-star
tech
distan
ce−0.03
0.01
−0.02
0.01
0.06
−0.02
1
23.T
eam
size
−0.03
0.01
0.09
−0.06
0.16
0.22
0.01
1
24.T
eam
clustering
coefficien
t−0.1
−0.1
0.03
−0.01
0.03
−0.01
0.03
0.58
1
25.T
eam
density
−0.06
−0
0.03
0.06
−0.05
−0.04
0.06
0.24
0.51
1
26.P
aten
tco
unt
−0.03
0.01
0.05
−0.05
0.09
0.3
0.03
0.82
0.49
0.16
aCorrelations
equa
ltoorgrea
terthan
0.20aresign
ifican
tat
the0.05leve
l.
340 LAHIRI ET AL.

Table 3 presents the regression results for our hypothesis tests. For a conservative test of the study's hypothe-
ses, we interpret all our results with two-tailed t-tests and estimate robust standard errors. Model 1 presents the
regression results with all control variables incorporated. Model 1 shows that, consistent with previous literature,
firm age is positively associated with new venture product introductions. We also find that the venture's level of
financial resources is positively associated with new product introductions. We find support for our baseline predic-
tion that star inventors and founder-inventors enable firms to launch more products, reflected in the positive, signifi-
cant coefficients for these variables in Model 1. The year of star entry is negatively associated with new product
introductions indicating that the year that stars join organizations is likely to be marked with significant disruption of
existing organizational structures and greater team clustering is positively associated with new product
TABLE 2 First-stage selection modelfor the likelihood of hiring stars
Star hiring
S&P500 −7.764*
(3.506)
Total funding 0.031***
(0.007)
Founder science professor 0.101**
(0.033)
Founder industry experience −0.147
(0.108)
Founder management experience 0.060
(0.096)
Founder entrepreneurship experience 0.409***
(0.092)
Founder MD −0.051
(0.096)
Founder Ph.D. 0.154
(0.098)
Founder MBA 0.145
(0.109)
Founder JD 0.862**
(0.269)
Number of founders 1.173**
(0.405)
Number of founders squared −0.406***
(0.111)
Constant 52.654*
(25.063)
Year dummies Yes
Location dummies Yes
Wald χ2 261.94***
Number of firms 132
Note: Robust standard errors in parentheses.
***p < .001, **p < .01, *p < .05, +p < .1.
LAHIRI ET AL. 341

TABLE 3 Arellano–Bond GMM estimations of new product introductions by MIS ventures
Model 1 Model 2 Model 3 Model 4 Model 5
Product introductions t–1 0.401*** 0.425*** 0.414*** 0.418*** 0.408***
(0.055) (0.059) (0.057) (0.058) (0.058)
Star inventor 0.568*** 0.494* 0.548** 0.518** 0.561**
(0.171) (0.196) (0.198) (0.196) (0.198)
Founder-inventor 0.343* 0.365+ 0.430* 0.315 0.387+
(0.170) (0.187) (0.200) (0.192) (0.210)
Proportion of founder-star coinvention −0.742* −0.698*
(0.311) (0.304)
Founder-star tech distance 1.647* 1.514*
(0.772) (0.757)
Founder-star tech distance squared −2.150* −1.973*
(1.002) (0.981)
Star origin −0.173 −0.008 0.042 −0.041 0.003
(0.199) (0.162) (0.164) (0.184) (0.188)
Founder-star common employer 0.119 0.135 0.176 0.077 0.121
(0.308) (0.335) (0.335) (0.345) (0.348)
Star entry −1.194*** −1.228*** −1.099*** −1.258*** −1.133***
(0.285) (0.304) (0.296) (0.305) (0.296)
Firm age 0.061** 0.035+ 0.038+ 0.043+ 0.044+
(0.021) (0.020) (0.020) (0.024) (0.024)
VC status 0.115 0.162 0.136 0.149 0.117
(0.192) (0.196) (0.198) (0.201) (0.204)
Total funding 0.027** 0.025** 0.024** 0.025** 0.024**
(0.008) (0.008) (0.008) (0.008) (0.008)
Founder-inventor count −0.001 −0.025 −0.007 −0.008 0.002
(0.101) (0.108) (0.111) (0.116) (0.118)
Number of founders −0.177 −0.030 −0.018 −0.047 −0.033
(0.181) (0.151) (0.152) (0.161) (0.162)
Founder non-star tech distance −0.818 −0.300 −0.242 −0.010 −0.113
(0.588) (0.572) (0.540) (0.535) (0.555)
Team size −0.010 −0.008 −0.006 −0.015 −0.013
(0.015) (0.012) (0.012) (0.013) (0.012)
Patent count −0.008 −0.012 −0.014 −0.011 −0.013
(0.015) (0.017) (0.017) (0.017) (0.017)
Team clustering coefficient 0.608** 0.358+ 0.379* 0.402* 0.425*
(0.225) (0.192) (0.192) (0.203) (0.203)
Team density −0.073 −0.128 −0.113 −0.124 −0.108
(0.143) (0.155) (0.156) (0.154) (0.155)
Inverse Mills ratio 1.267+ 1.275+ 1.377* 1.342*
(0.671) (0.654) (0.691) (0.673)
342 LAHIRI ET AL.

introductions. In addition, the coefficient of the lagged dependent variable is positive and statistically significant
(p < .01) for all models. This supports our expectation underlying the GMM model that prior levels of product perfor-
mance influence firm product performance for subsequent years.
In Model 2 (Table 3), we add the Inverse Mills ratio corresponding to the selection effect of stars into the new
venture. The Inverse Mills ratio is marginally significant (p < .1) indicating that there is some evidence of endogeneity
due to selection effects. In Model 3 (Table 3), we add the variable corresponding to Hypothesis 1—the proportion of
founder-star coinvention. Hypothesis 1 predicted that the firms that have a greater proportion of their innovation
activities being performed jointly by stars and founder-inventors are likely to suffer a negative effect on innovation,
as opposed to a beneficial effect when they are active separately. We test this in Model 3 (Table 3) through the pro-
portion of patents coinvented by stars and founders, calculated based on the firm's annual patenting activity, while
controlling for the direct effects of each individually. We find that the proportion term is negative and significant
(Model 2, β = −0.742, p < .05).
Hypothesis 2 posits that there is a curvilinear, inverted U-shaped relationship between the degree of similarity of
the founder-inventor and star inventor's technological knowledge domains and the new venture's number of product
introductions. To test this hypothesis, we add the variables corresponding to founder-star technological distance to
the model, Model 4 (Table 3). In Model 4, the coefficient of the linear term for founder-star technological distance is
positive and significant (β = 1.647, p < .05) while the squared term is negative and significant (β = −2.15, p < .05).
This supports Hypothesis 2. We now add the variables corresponding to the proportion of founder-star coinvention
and founder-star technological distance to obtain our full model in Model 5 (Table 3). We can estimate the “inflection
point” of the curve by calculating the partial derivative:
∂ProductIntroductionsi∂founder−star tech distancei
= β1 + 2 β2 founder−star tech distancei
Using the value of the coefficients from Model 3 (Table 3), we calculate the inflection point to be 0.38. This indi-
cates that the relationship between founder-star technological distance and product launch is increasingly positive
until the founder-star tech distance reaches the 0.38 threshold. Beyond this point, increases in founder-star techno-
logical distance have a detrimental impact on the launch of new products. Figure 2 offers a graphical representation
TABLE 3 (Continued)
Model 1 Model 2 Model 3 Model 4 Model 5
Constant −0.114 −0.772 −0.757 −0.831 −0.886
(0.599) (0.634) (0.682) (0.704) (0.699)
Observations 1,158 1,158 1,158 1,158 1,158
Year dummies Yes Yes Yes Yes Yes
Location dummies Yes Yes Yes Yes Yes
Industry subsegment dummies Yes Yes Yes Yes Yes
Number of firms 132 132 132 132 132
Wald χ2 1,733.74*** 1,103.35*** 839.14*** 706.88*** 801.15***
AR(1) −3.22** −4.38** −4.45** −4.31** −4.46**
AR(2) 1.32 0.76 0.82 0.77 0.82
Hansen J test 80.72 85.79 80.82 73.22 73.93
Note: Model specification—Arellano–Bond GMM estimations at time t; Robust standard errors in parentheses ();
***p < .001, **p < .01, *p < .05, + p < .1, two-tailed t-tests.
LAHIRI ET AL. 343

of the relationship between the founder-star technological distance and number of product introductions of the new
venture. Values closer to zero illustrate firms where founder(s) and star(s) leverage more similar knowledge domains
while values that are closer to one represent firms where founder(s) and star(s) exhibit more disparate knowledge,
with the results indicating an optimal founder-star tech distance of ~0.4.
Our results reinforce the economic importance of the effects we study. A one standard deviation increase in the
proportion of founder and star coinvention is associated with a 9% decrease in the number of product introductions
in a given year. With respect to founder-star technological distance, a one standard deviation increase (beyond the
optimal level) leads to a 17% decrease in the number of product introductions.
4.1 | Post-hoc analysis
We conducted a post-hoc analysis to examine whether the results we observe were due to informal hierarchy or
alternative explanations. To do so, we examined differences in the type of prior work experience among star scien-
tists in our data. Based on our theoretical logic, stars who were most recently employed by older organizations
(e.g., Becton, Dickinson and Company, Medtronics, Abbott Labs and SRI international, in our data) are likely to be sig-
nificantly more disruptive in a new venture setting as opposed to stars most recently employed by younger organiza-
tions. This is because star inventors previously employed by older organizations are more likely to be accustomed to
norms and expectations of formal organizational hierarchy that start-ups are less likely to have (Freeman, 1986;
Sørensen, 2007).
We tested this premise by interacting the binary variable star origin (that was set to one if the firm had at least
one star who was most recently employed by an older organization) with the variable proportion of founder-star
coinvention. The resulting interaction term was negative and significant (Model 1, Table 4). Figure 3 plots this interac-
tion. As hypothesized, we find that the negative effect of founder-star coinvention is significantly higher if the star
inventor was previously employed by an older established organization. This supports our theoretical argument that
the negative effect of founder-star coinvention is driven by conflict arising from informal hierarchy as opposed to
alternate explanations.
We also considered an additional outcome that was consistent with our theoretical model.5 Specifically, we con-
sidered the impact of the knowledge generated by the firm in the form of external forward patent citations. We
coded the impact dependent variable by considering the number of 5-year external forward citations generated by
the patents of the focal firm in a specific year. This measure has often been used in prior research to reflect the qual-
ity or overall impact of developed knowledge (e.g., Basu et al., 2015). The results of this analysis are tabulated in
F IGURE 2 Graphicalrepresentation of H2
344 LAHIRI ET AL.

TABLE 4 Post-hoc analysis
Model 1 (productintroductions)
Model 2 (knowledgeimpact)
Product introductions t–1 0.405***
(0.066)
Star inventor 0.489* 1.341***
(0.197) (0.223)
Founder-inventor 0.285 2.155***
(0.224) (0.202)
Proportion of founder-star coinvention −1.128* −1.765*
(0.479) (0.887)
Founder-star tech distance 2.282** 4.907***
(0.885) (0.965)
Founder-star tech distance squared −2.618* −6.567***
(1.164) (1.250)
Star origin 0.171 −0.529
(0.198) (0.234)
Star origin * proportion of founder-star
coinvention
−1.113*
(0.556)
Founder-star common employer 0.060 −0.781*
(0.327) (0.316)
Star entry −1.193*** 0.262
(0.331) (0.270)
Firm age 0.052+ −0.081**
(0.029) (0.031)
VC status 0.072 0.107
(0.200) (0.228)
Total funding 0.028** 0.060***
(0.010) (0.016)
Founder-inventor count 0.093 −0.509***
(0.105) (0.105)
Number of founders −0.124 −0.074
(0.166) (0.189)
Founder non-star tech distance −0.754 −0.114
(0.493) (0.514)
Team size −0.001 −0.011
(0.012) (0.017)
Patent count −0.017 0.004
(0.015) (0.019)
Team clustering coefficient 0.049 0.860*
(0.272) (0.350)
(Continues)
LAHIRI ET AL. 345

Table 4 (Model 2). Similar to our results with product introductions, we find that although star inventors and
founder-inventors are individually positively associated with knowledge impact, the proportion of founder-star
coinvention is negatively associated with knowledge impact. This offers additional support for our theoretical frame-
work suggesting that collaboration between stars and founder-inventors has a dysfunctional effect on the
innovation team.
TABLE 4 (Continued)
Model 1 (productintroductions)
Model 2 (knowledgeimpact)
Team density −0.138 0.082
(0.141) (0.330)
Inverse mills ratio 0.516 −0.367
(0.669) (0.711)
Constant −0.214 −16.325***
(0.668) (0.836)
Observations 1,158 1,158
Year dummies Yes Yes
Location dummies Yes Yes
Industry subsegment dummies Yes Yes
Number of firms 132 132
Wald χ2 971.04*** 719.34***
Pseudo R2 0.2261
AR(1) −4.65***
AR(2) 0.81
Hansen J test 75.10
Note: Model specification for Model 1—Arellano–Bond GMM estimations at time t; Robust standard errors in parentheses
(). Model 1 incorporates an interaction between proportion of founder-star coinvention and star origin. Model specification
for Model 2—Negative Binomial; Robust standard errors in parentheses (); Model 2 incorporates knowledge impact as the
dependent variable. ***p < .001, **p < .01, *p < .05, +p < .1, two-tailed t-tests.
F IGURE 3 Post-hoc analysis:Interaction of proportion of founder-starcoinvention and star origin
346 LAHIRI ET AL.

4.2 | Additional analyses
We conducted several robustness checks to assess and verify the strength of our findings. First, we reran our analy-
sis with the full sample of firms for which we had founder data, including those that had no record of patenting dur-
ing the period of the study. This provided more conservative tests for our hypotheses as it involved the inclusion of
many firms for which our key independent variables were set to zero. When running this test, we separately con-
trolled for heterogeneity among firms with respect to their patenting records by incorporating a binary variable (firm
patenting dummy) that was set to one if the firm had any patent on record during the observation period and zero, if
not. The results supported both of our hypotheses and are summarized in Model 1 (Table 5).
We also examined the direct interaction of the founder-inventor and star inventor variables to see if this specifi-
cation supported our theorizing that this type of coinvention would impair product introductions. The interaction
term is negative and significant, supporting Hypothesis 1. The results are summarized in Model 2 (Table 5).
Another possibility we probed relates to the interaction between the proportion of founder-star coinvention and
founder-star technological distance. In hypothesis 1, we argued that there is a negative relationship between the
proportion of founder-star coinvention and the venture's number of product introductions. In hypothesis 2, we pre-
dict a curvilinear relationship between founder-star technological distance and the number of product introductions.
Theoretically, there could be an interactive effect between proportion of founder-star coinvention and founder-star
technological distance. When founder-star technological distance is high, a greater proportion of founder-star
coinvention is likely to strengthen their mutual capacity to understand and leverage shared knowledge. The effect of
this on clarifying innovation leadership is unclear. However, we might expect that higher proportion of founder-star
coinvention may improve firm performance when founder-star technological distance is high. When founder-star
technological distance is low, a greater proportion of founder-star coinvention may exacerbate ambiguity in social
hierarchy and innovation leadership in the firm while not significantly increasing the founder-inventor and star's
mutual capacity to understand and leverage each other's knowledge toward furthering the firm's innovation goals. In
this case, we would expect that greater proportion of founder-star coinvention is likely to be particularly detrimental
for firm performance when founder-star technological distance is low. We probed these ideas by interacting the vari-
ables proportion of founder-star coinvention and the founder-star distance relationship. However, the interaction
was not significant (p-value = .14).6
We also considered the possibility that there might be some differential effect of having more than one star per-
former in the innovation team of the firm. To investigate this further, we broke down our stars variable into single
and multi-star firms. For firms with single stars, we created a variable Single Star that was the proportion of annual
founder and star patents, calculated based on the total number of annual firm patents. For firms with more than one
star, we created a separate variable Multiple Star, which calculated a similar proportion of annual founder and stars'
patents to the firm's annual patents. We then test our hypotheses again by incorporating these two variables as a
substitute for our original founder-star coinvention variable (proportion of founder-star coinvention). We found our
results to hold for both single star and multiple star firms (Table 5, Model 4, β (Single Star) = −1.149, p < .05; β (Multi
Star) = −0.680, p < .05). This result provides additional evidence that our finding pertaining to the negative interac-
tive effect of stars and founder collaboration on product introduction is not driven by a differential effect of having
more than one star performer in the innovation team of the firm.
Another alternative explanation that we probed is whether potential redundancy and resource inefficiency of
having both founder-inventors and star scientists may explain our findings. Startup firms such as those sampled in
our study are likely to face significant resource constraints, suggesting that inefficiencies in R&D or other activities
could significantly undermine their success. We conducted a robustness test for this potential effect by including an
interaction term between number of founders and founder-inventor. If the founding team's distraction from other
duties accounts for negative effects on product launch, this problem should be exacerbated for smaller founding
teams. However, our results suggest that this is not the case, as the interaction term remained insignificant. At the
same time, the hypothesized effects also remain significant, consistent with our theoretical framework.
LAHIRI ET AL. 347

TABLE 5 Robustness checks
Model 1 Model 2 Model 3 Model 4 Model 5
Product introductionst–1 0.430*** 0.408*** 0.401*** 0.436***
(0.056) (0.057) (0.060) (0.046)
Product introductionst–1 (logged) 0.401***
(0.064)
Star inventor 0.500* 0.876*** 0.551** 0.132* 0.613**
(0.212) (0.250) (0.202) (0.064) (0.204)
Founder-inventor 0.441+ 0.703** 0.446* 0.066 0.522**
(0.229) (0.231) (0.223) (0.073) (0.176)
Founder-inventor * star inventor −0.847**
(0.315)
Proportion of founder-star coinvention −0.671* −0.176* −0.927**
(0.306) (0.079) (0.323)
Proportion of founder-star coinvention
(single star)
−1.149*
(0.556)
Proportion of founder-star coinvention (multi
star)
−0.680*
(0.317)
Founder-star tech distance 1.605* 1.580* 1.655* 0.728** 1.764**
(0.748) (0.688) (0.810) (0.238) (0.649)
Founder-star tech distance squared −2.092* −1.967* −2.157* −1.020** −2.303**
(1.015) (0.897) (1.074) (0.328) (0.825)
Star origin −0.060 0.054 0.017 −0.006 −0.121
(0.215) (0.178) (0.208) (0.071) (0.207)
Founder-star common employer 0.166 0.083 0.127 0.005 −0.012
(0.375) (0.344) (0.359) (0.114) (0.283)
Star entry −1.233*** −1.190*** −1.120*** −0.274** −0.928**
(0.334) (0.297) (0.304) (0.093) (0.347)
Firm age 0.051+ 0.055** 0.056* 0.016* 0.030
(0.026) (0.021) (0.028) (0.008) (0.021)
VC status 0.094 0.164 0.117 0.056 0.159
(0.198) (0.193) (0.210) (0.064) (0.259)
Total funding 0.029*** 0.023** 0.029*** 0.007* 0.021*
(0.009) (0.008) (0.009) (0.003) (0.009)
Founder-inventor count −0.001 0.048 0.006 0.023 −0.028
(0.133) (0.117) (0.127) (0.040) (0.124)
Number of founders −0.132 −0.021 −0.067 −0.015 −0.053
(0.192) (0.148) (0.180) (0.048) (0.174)
Founder non-star tech distance −0.573 −0.084 −0.326 −0.017 −0.528
(0.615) (0.510) (0.625) (0.164) (0.573)
348 LAHIRI ET AL.

We also considered the possibility that our results could be driven by firms that are ultimately acquired, since the
presence of a star inventor at the venture may make it an appealing acquisition target. In such cases, product intro-
ductions by the venture may not be observed because it is acquired before they occur. To probe this potential expla-
nation, we reran our analysis but excluded all firms that were ultimately acquired in our sample. This limited our
sample to 84 firms. Our results continued to hold in this smaller subset of firms and are reported in Model
5 (Table 5).
In additional, unreported analyses (available from the authors on request), we reran our models with alter-
nate specifications. Since our dependent variable is the number of product introductions by the firm in a year,
statistical models for count data such as the Poisson or Negative Binomial are the most appropriate. The distri-
bution of our data on product introductions indicated over dispersion, making the negative binomial distribu-
tion a preferred choice. Of the 132 firms in our sample, 46 introduce no products across the years of
observation. Standard negative binomial models cannot handle the presence of zero counts of the dependent
TABLE 5 (Continued)
Model 1 Model 2 Model 3 Model 4 Model 5
Team size −0.014 −0.015 −0.015 −0.006 −0.022+
(0.012) (0.012) (0.011) (0.004) (0.012)
Patent count −0.008 −0.009 −0.010 −0.002 −0.000
(0.016) (0.017) (0.016) (0.005) (0.020)
Team clustering coefficient 0.699** 0.453* 0.488* 0.087 0.237
(0.228) (0.206) (0.216) (0.068) (0.177)
Team density −0.093 −0.100 −0.116 −0.037 −0.161
(0.148) (0.157) (0.156) (0.048) (0.171)
Inverse Mills ratio 1.004 1.456* 1.310+ 0.474* 0.823
(0.729) (0.693) (0.695) (0.230) (0.558)
Firm patenting dummy 0.355
(0.418)
Constant −0.655 −1.113 −0.982 −0.300 −0.128
(0.788) (0.734) (0.744) (0.237) (0.605)
Observations 1,323 1,158 1,158 1,158 725
Year dummies Yes Yes Yes Yes Yes
Location dummies Yes Yes Yes Yes Yes
Industry subsegment dummies Yes Yes Yes Yes Yes
Number of firms 161 132 132 132 84
Wald χ2 1072*** 701.35*** 673.18*** 490.27*** 4,615.03***
AR(1) −4.44** −4.31** −4.46** −5.03** −3.51**
AR(2) 1.10 0.71 0.73 0.10 1.02
Hansen J test 103.02 70.06 70.83 76.93 18.70
Note: Model specification—Arellano–Bond GMM estimations at time t; Robust standard errors in parentheses (). Model 1
includes firms with no patenting history; Model 2 incorporates an interaction term instead of the variable, proportion of
founder-star coinvention; Model 3 breaks up the variable, proportion of founder-star coinvention, for single stars and
multiple stars, Model 4 incorporates a logged dependent variable and Model 5 excludes acquired firms. ***p < .001,
**p < .01, *p < .05, +p < .1, two-tailed t-tests.
LAHIRI ET AL. 349

variable which may be a result of unobserved firm heterogeneity (Blundell, Griffith, & Van Reenen, 1995). To
address this problem of excess zeros in the data, the zero-inflated negative binomial model (ZINB) is the pre-
ferred estimation technique. We used the total amount of funding received by the venture (total funding) and
the total size of the innovation team (team size) as parameters for predicting zero new venture product intro-
ductions in the zero-inflation model. We followed the recommendation offered by Greene (2003) and applied
the Vuong test statistic (Vuong, 1989) to confirm that the zero-inflated model was a better fit compared to the
standard negative binomial model for our data. This specification also afforded robust support for both our
hypotheses.
In order to test whether our results are robust to arbitrary patterns of serial autocorrelation that may underlie
the panel nature of our data set, we used Poisson quasi-maximum likelihood (QML) estimation to obtain a more con-
servative estimate of the coefficients (Wooldridge, 2002). A key advantage of this method is that as long as the mean
of the dependent variable is correctly specified, the coefficient estimates are consistent and the robust standard
errors thus generated remain consistent even if the underlying data-generating process is not Poisson (Gourieroux,
Monfort, & Trognon, 1984). Although the time invariant nature of many of our key independent variables means that
we are unable to test both of the hypotheses using this modeling technique, we are able to test the negative interac-
tive effect of founder-inventors and star inventors based on the time varying proportion of founder-star collabora-
tion. The imposition of QML led to several firms in our sample that had largely time invariant variables dropping out,
and we were left with a sample size of 79 firms with this test. Despite the smaller sample, which significantly
reduced the power of the test, we found that the coefficient of the proportion of founder-star coinvention was par-
tially significant (p = .08).
It is possible that the influence of inventors will decline over longer periods, reducing their impact on the com-
mercialization of technologies. To test this, we reran our analysis using 3-year and 5-year moving averages. For all of
these analyses, our results were substantively the same as the results reported for our primary analysis. We also ran
our models by lagging all patent-based variables, which are time variant by 2 years, and our results stayed consistent.
In addition, we ran our models by taking 3- and 2-year moving windows for patent-based variables and our main
results stay significant. Finally, we incorporated lags of 2 and 3 years as instruments in our model (since xtabond uses
lags of variables as instruments) and our results again held up. Log-linear models can help to avoid the problem of
“Simpson's Paradox,” wherein a pair of variables can spuriously have a relationship opposite in direction to their
actual relationship (Christensen, 2006). Hence, we also ran our analysis by logging our dependent variable and have
reported the results in Model 4 (Table 5). Both our hypotheses continue to hold. Finally, we calculated variance infla-
tion factors (VIF) for the full model. Typically, VIF values less than five indicate that multicollinearity is not a concern
in the regression model (Chatterjee, Hadi, & Price, 2000; Kennedy, 2008). We verified that all our models satisfied
this condition (mean VIF was 1.58 with a maximum VIF value of 3.61), suggesting that multicollinearity is not a seri-
ous problem in our analysis.
5 | DISCUSSION
Researchers have long sought to understand how the organizational design of new ventures and founders' early
choices in constructing this enables the venture to pursue promising commercial applications. Having highly accom-
plished individuals or “stars” on the innovation team has been shown to be an important means of achieving signifi-
cant performance gains for firms (Hess & Rothaermel, 2011; Kehoe & Tzabbar, 2015; Toole & Czarnitzki, 2009;
Zucker et al., 2002). However, while scholars have made important strides in understanding the value of star per-
formers as individual contributors, little work has examined the fit between star performers and the organizations in
which they work (Call, Nyberg, & Thatcher, 2015). Founders of new ventures face especially critical choices around
the organization and makeup of the innovation team that have important consequences for the venture's future suc-
cess. Our research points to the hazards of fostering close collaboration between individuals who draw their standing
350 LAHIRI ET AL.

from different sources of social hierarchy, focusing particular attention on the potentially precarious combination of
talented star inventors and firm founders. In doing so, we offer important insights into the relationship between
organizational design and new venture outcomes.
A new venture's innovation team is central to its success, and critical decisions about the composition of the
team must be made early on. While the recruitment of star inventors offers an attractive option to new ventures
seeking to commercialize new technologies, our empirical results show that firms need to exercise caution in hiring
as well as managing star employees. Although our results are consistent with other studies on star scientists that
have found a positive result of stars on firms' innovation success (e.g., Higgins, Stephan, & Thursby, 2011; Zucker
et al., 1998), our results also point to boundary conditions around the benefits that star performers can provide for
innovation. In highlighting the problems of egalitarianism versus hierarchy in new ventures, Wasserman (2012) noted
that as ventures evolve over time, they typically have to adopt a more hierarchical structure, which can be a difficult
process, but failure to do so, “can be even more painful” (p.124). In our study, we demonstrate that founder-inven-
tors, whose standing within the informal hierarchy of the innovation team derives mainly from their heirarchical posi-
tion, may come into conflict with star inventors, who derive their hierarchical standing from past innovation success.
This appears to result in a strong negative effect on product introduction. Our findings lead us to suggest that foun-
ders who hire star inventors should not only establish a clear hierarchy in decision-making within the innovation
teams, but also potentially offer greater autonomy to the star inventor in matters concerning innovation leadership
and product development, even if the founder is technologically proficient. We also suggest that it may be advanta-
geous for founders to hire star inventors with prior experience in working in new ventures as opposed to older
established organizations. Our findings align with prior work that has shown that firms may experience suboptimal
results when they organize their innovation teams such that experienced inventors have to work under managerial
supervision and guidance (Conti et al., 2014) or when the presence of stars fosters an over-reliance on their contri-
butions resulting in inhibiting non-star teammates' knowledge acquisition (Li, Li, Li, & Li, in-press).
Another key decision that ventures face when configuring their innovation teams is whether to recruit team
members of similar or different technological backgrounds. Past research has found support for both approaches,
and our results reveal that a balance should be struck between them. The degree of similarity between the founder's
and star inventor's technological knowledge domains has an inverted U-shaped effect on product introductions by
the venture, a finding that is consistent and robust across all of our models and post-hoc tests. This finding is consis-
tent with prior research in other contexts that has underscored the need to balance the extent of knowledge overlap
between key subgroups involved in knowledge creation in new ventures (e.g., Basu et al., 2015).
Our study contributes to the literature on stars, venture team composition, and the internal design of innovative
efforts in the new venture. As Bercovitz and Feldman (2011) note, much remains to be understood about why some
innovation teams successfully create new products and others do not. Research on both star scientists and founder-
inventors have independently argued for the benefits of incorporating each of these types of individuals in the inno-
vation team (Bercovitz & Feldman, 2008; Toole & Czarnitzki, 2009). However, an emerging body of evidence sug-
gests that there are also significant challenges in managing highly productive individuals within organizations. Having
stars within the firm may lead to an excessive amount of organizational resources to be garnered by the star which
can hinder capability development of non-stars (Kehoe & Tzabbar, 2015) or may lead to the development of sub-
optimal task structures within the organization (Chen & Garg, 2018). Too many stars within the organization can lead
to jockeying for power and diminish firm performance (Groysberg et al., 2011). Our study extends this literature by
suggesting that organizational dysfunction may also occur when a star inventor and a founder-inventor work
together on the same innovation team, as each of them draw their standing from different sources. Our study also
extends recent research on group interactions by showing that highly accomplished team members may have diffi-
culty working together, undermining their ability to collaborate (Groysberg et al., 2011). More broadly, our results
extend the recent work of Sauermann and Cohen (2010) and Joshi and Knight (2015), to further understand how
individual expertise and inherent hierarchical structures act together to promote or limit the efforts of innovative
LAHIRI ET AL. 351

and scientific teams. In sum, our research adds further insight to prior work, demonstrating that organizations must
carefully consider the composition of innovation teams to maximize the value added by stars.
The limitations of our study suggest promising opportunities for future research. First, we rely on patent records
to determine innovation team membership. Organizations are required by law to list all individuals who made sub-
stantial contributions to the conception and design of a given invention (Ducor, 2000).7 Although patenting of medi-
cal devices is considered a critical part of firm strategy in this industry (Chatterji, 2009), patents represent an
intermediate innovation output (Griliches, 1990). As such, a limitation of relying on patent data are those not every
product may be patented and not every patent underlies a novel process or product introduced by the firm. As a
result, we do not capture the influence of any participant in the innovation team not listed on a patent, despite the
possibility that otherwise influential collaborators may not have been directly engaged in patenting activities
(a possibility that we note is unlikely, based on our informants' explanations of industry and firm practices). Future
research based on employment records or other data sources may provide an improved understanding of the dynam-
ics of innovation teams. Second, in the industry we study, patents may play a more important role in the innovation
process than in other industries. However, one strength of our study design lies in our use of new product introduc-
tions as an outcome variable; new product introductions are likely to be considered an important outcome across all
technology and manufacturing industries. Thus, to the extent that our patent-based covariates provide a reasonably
accurate depiction of the characteristics of a new venture's innovation team, we believe that the observed effects of
these characteristics are generalizable to a broader universe of industries. Third, our study does not account for the
alternative explanation that the negative interaction between stars and founder-inventors we observe could be a
result of constraints on inventors' time when they are on same team thereby limiting independent efforts. Finally, we
note that the medical device industry in the US likely differs from that observed in other countries. Ventures in our
setting face similar regulatory and resource environments, however these could be materially different from that
faced in other institutional environments. Future scholarship may consider how differing institutional environments
may affect the impact of team composition on innovation outcomes.
Future research may reveal further insights into clashes between team members who derive their standing from
different sources. As Joshi and Knight (2015) highlighted, there are multiple dynamics at play when teams collabo-
rate. Although our research is focused specifically on standing based on either expertise or hierarchical position, our
theory suggests that any divergent sources of high status may yield similarly dysfunctional results. For example, the
presence of individuals whose status is based on important external affiliations or connection to socially prominent
institutions may also produce conflict within teams. Alternately, conflict may be particularly intense when stars and
founders are different in terms of gender or ethnicity (cf., Jung, Vissa, & Pich, 2017). Given the wide range of possi-
ble sources of status and standing, it would be interesting to compare the impact of different combinations of types
of high-status individuals and examine whether there are combinations that are particularly disruptive. Furthermore,
our study focuses on new product introductions, and future research could examine whether products delayed by
these potential clashes also suffer in terms of outcomes such as sales, market share, or return on investment. Results
from such research could also indicate whether teams suffering clashes among prominent individuals may ultimately
deliver better products, in some way justifying the challenges experienced during the development process. Our
findings may also open fruitful new avenues for research concerning other types of potential conflict between star
inventors and management. As such, conflicts may result in the departure of a star inventor or turnover in the top
management team, it would be beneficial to determine the conditions under which these detrimental outcomes are
most likely.
Our research directs attention to the composition of the innovation team as a key mechanism for understanding
the introduction of new technologies and the performance of technology-based new ventures. By simultaneously
capturing the beneficial influence of a moderate degree of technical similarity between innovators and the detrimen-
tal effects of conflicts among accomplished team members, our study contributes to active streams of research in
the fields of knowledge creation and entrepreneurship. Future research in this area holds the promise of helping to
352 LAHIRI ET AL.
gain greater insight into how founders of entrepreneurial ventures may best design their organizations, assembling
teams to launch successful innovations.
ACKNOWLEDGEMENTS
We are indebted to thoughtful comments of our editor, Dr. Diane Burton, and to three anonymous reviewers who
helped us refine this manuscript. We are grateful to participants at seminars and conferences where we presented
this research for their insights and help in shaping earlier versions of this paper. We are especially thankful to
Dr. Sudipta Sinha for his assistance with writing the program that was used to disambiguate the founder data. This
project was partially funded with a Kauffman Dissertation Grant (for the second Author) and by the Arthur W. Buerk
Center for Entrepreneurship at the University of Washington. We also appreciate the support of the McFerrin Cen-
ter for Entrepreneurship in the Mays Business School, Texas A&M University.
ENDNOTES
1 We consider the innovation team to represent the set of individuals in the venture with technological expertise who par-
ticipate in the development and commercialization of the new venture's products.2 For example, one firm in our sample had four patents with application dates in the year 2000, and of these three were
jointly authored between the founder and the star inventor. In this case, the proportion of founder-star coinvention has a
value 0.75 for the year 2000 for this firm. On the other hand, for another firm in our sample, the number of co-authored
patents between the founder and star in the year 2000 was one of five patents filed by the firm in the year, leading to the
value of 0.2 for the proportion of founder-star coinvention for this firm in the year 2000.3 An alternate operationalization of this variable was tested using average distance between the founder-star dyad. The
results were consistent for both measures.4 Specifically, we calculated the technological distance between the founder's patents and those of the non-star inventors
in the innovation team based on their patenting history in the 5-year period prior to the founding of the focal firm. The
maximum of the distances thus calculated was used as the founder non-star technological distance.5 We would like to thank the editors of the special issue for encouraging us to investigate this.6 These results are available from the authors. We appreciate the suggestions of the editors and an anonymous reviewer to
consider these effects.7 Specifically, the statute of US law states, “Inventors may apply for a patent jointly even though (a) they did not physically
work together or at the same time, (b) each did not make the same type or amount of contribution, or (c) each did not
make a contribution to the subject matter of every claim of the patent.”(35 U.S.C. §116).
ORCID
Amrita Lahiri https://orcid.org/0000-0002-4034-5885
Michael D. Howard https://orcid.org/0000-0001-5886-9233
REFERENCES
Ahuja, G., & Katila, R. (2001). Technological acquisitions and the innovation performance of acquiring firms: A longitudinal
study. Strategic Management Journal, 22(3), 197–220.Ancona, D. G., & Caldwell, D. F. (1992). Demography and design: Predictors of new product team performance. Organization
Science, 3(3), 321–341.Arellano, M., & Bond, S. (1991). Some tests of specification for panel data: Monte Carlo evidence and an application to
employment equations. Review of Economic Studies, 58(2), 277–297.Audia, P. G., & Goncalo, J. A. (2007). Past success and creativity over time: A study of inventors in the hard disk drive indus-
try. Management Science, 53(1), 1–15.Azoulay, P., Graff Zivin, J., & Wang, J. (2010). Superstar extinction. Quarterly Journal of Economics, 25, 549–589.
LAHIRI ET AL. 353

Azoulay, P., Graff Zivin, J. S., & Manso, G. (2011). Incentives and creativity: Evidence from the academic life sciences. The
Rand Journal of Economics, 42(3), 527–554.Baba, Y., Shichijo, N., & Sedita, S. R. (2009). How do collaborations with universities affect firms' innovative performance?
The role of “Pasteur scientists” in the advanced materials field. Research Policy, 38(5), 756–764.Baron, J. N., Hannan, M. T., & Burton, M. D. (1999). Building the iron cage: Determinants of managerial intensity in the early
years of organizations. American Sociological Review, 64(4), 527–547.Bascle, G. (2008). Controlling for endogeneity with instrumental variables in strategic management research. Strategic Orga-
nization, 6(3), 285–327.Basu, S., Sahaym, A., Howard, M. D., & Boeker, W. (2015). Parent inheritance, founder expertise, and venture strategy:
Determinants of new venture knowledge impact. Journal of Business Venturing, 30(2), 322–337.Beckman, C. M., & Burton, M. D. (2008). Founding the future: Path dependence in the evolution of top management teams
from founding to IPO. Organization Science, 19(1), 3–24.Beckman, C. M., Burton, M. D., & O'Reilly, C. (2007). Early teams: The impact of team demography on VC financing and
going public. Journal of Business Venturing, 22(2), 147–173.Benjamin, B. A., & Podolny, J. M. (1999). Status, quality, and social order in the California wine industry. Administrative Sci-
ence Quarterly, 44(3), 563–589.Berchicci, L. (2013). Towards an open R&D system: Internal R&D investment, external knowledge acquisition and innovative
performance. Research Policy, 42(1), 117–127.Bercovitz, J., & Feldman, M. (2008). Academic entrepreneurs: Organizational change at the individual level. Organization Sci-
ence, 19(1), 69–89.Bercovitz, J., & Feldman, M. (2011). The mechanisms of collaboration in inventive teams: Composition, social networks, and
geography. Research Policy, 40(1), 81–93.Berger, J., Cohen, B. P., & Zelditch, M., Jr. (1972). Status characteristics and social interaction. American Sociological Review,
37(3), 241–255.Berger, J., Ridgeway, C. L., Fisek, M. H., & Norman, R. Z. (1998). The legitimation and delegitimation of power and prestige
orders. American Sociological Review, 63(3), 379–405.Blau, P. M. (1977). Inequality and heterogeneity: A primitive theory of social structure. New York: Free Press.
Blundell, R., & Bond, S. (1998). Initial conditions and moment restrictions in dynamic panel data models. Journal of Economet-
rics, 87(1), 115–143.Blundell, R., Griffith, R., & Van Reenen, J. (1995). Dynamic count data models of technological innovation. The Economic
Journal, 105, 333–344.Bonacich, P. (1987). Power and centrality: A family of measures. American Journal of Sociology, 92(5), 1170–1182.Call, M. L., Nyberg, A. J., & Thatcher, S. (2015). Stargazing: An integrative conceptual review, theoretical reconciliation, and
extension for star employee research. Journal of Applied Psychology, 100(3), 623–640.Certo, S. T. (2003). Influencing initial public offering investors with prestige: Signaling with board structures. Academy of
Management Review, 28(3), 432–446.Chatterjee, S., Hadi, A. S., & Price, B. (2000). Regression analysis by example. New York: Wiley.
Chatterji, A. K. (2009). Spawned with a silver spoon? Entrepreneurial performance and innovation in the medical device
industry. Strategic Management Journal, 30(2), 185–206.Chen, J. S., & Garg, P. (2018). Dancing with the stars: Benefits of a star employee's temporary absence for organizational
performance. Strategic Management Journal, 39(5), 1239–1267.Christensen, R. (2006). Log-linear models and logistic regression. New York, NY: Springer Science & Business Media.
Cohen, W., Nelson, R., & Walsh, J. P. (2000). Protecting their intellectual assets: Appropriability conditions and why US
manufacturing firms patent (or not) (NBER Working Paper No. 7552). Cambridge, MA: National Bureau of Economic
Research.
Cohen, W. M., & Levinthal, D. A. (1990). Absorptive capacity: A new perspective on learning and innovation. Administrative
Science Quarterly, 35(1), 128–152.Colombo, M. G., & Grilli, L. (2013). The creation of a middle-management level by entrepreneurial ventures: Testing eco-
nomic theories of organizational design. Journal of Economics & Management Strategy, 22(2), 390–422.Conti, R., Gambardella, A., & Mariani, M. (2014). Learning to be Edison: Inventors, organizations, and breakthrough inven-
tions. Organization Science, 25(3), 833–849.Dahlander, L., & McFarland, D. A. (2013). Ties that last tie formation and persistence in research collaborations over time.
Administrative Science Quarterly, 58(1), 69–110.Dosi, G. (1988). Sources, procedures, and microeconomic effects of innovation. Journal of Economic Literature, 26(3),
1120–1171.Ducor, P. (2000). Coauthorship and coinventorship. Science, 289(5481), 873–875.
354 LAHIRI ET AL.

Edwards KL, Gordon TJ. 1984. Characterization of Innovations Introduced on the US Market in 1982. The Futures Group,
U.S. Small Business Administration, Contract No. SBA-6050–0A-82.Eesley, C. E., Hsu, D. H., & Roberts, E. B. (2014). The contingent effects of top management teams on venture performance:
Aligning founding team composition with innovation strategy and commercialization environment. Strategic Management
Journal, 35(12), 1798–1817.Fleming, L. (2001). Recombinant uncertainty in technological search. Management Science, 47(1), 117–132.Freeman, J. (1986). Entrepreneurs as organizational products: Semiconductor firms and venture capital firms. In
G. Libecap (Ed.), Advances in the study of entrepreneurship, innovation, and economic growth (pp. 33–58). Greenwich,
CT: JAI Press.
Gerber S. 2014. 11 conflicts between startup founders and employees. http://readwrite.com/2014/01/27/startup-
founders-employees-conflicts [10-20-2015].
Gould, R. V. (2002). The origins of status hierarchies: A formal theory and empirical test. American Journal of Sociology, 107
(5), 1143–1178.Gourieroux, C., Monfort, A., & Trognon, A. (1984). Pseudo maximum likelihood methods: Theory. Econometrica: Journal of
the Econometric Society, 52, 681–700.Graham, S. J., Merges, R. P., Samuelson, P., & Sichelman, T. (2009). High technology entrepreneurs and the patent system:
Results of the 2008 Berkeley patent survey. Berkeley Technology Law Journal, 24, 1255.
Greene, W. H. (2003). Econometric analysis. New York: Prentice Hall.
Griliches, Z. (1990). Patent statistics as economic indicators: A survey. Journal of Economic Literature, 28(4), 1661–1707.Groysberg, B., Lee, L.-E., & Nanda, A. (2008). Can they take it with them? The portability of star knowledge workers' perfor-
mance. Management Science, 54(7), 1213–1230.Groysberg, B., Polzer, J. T., & Elfenbein, H. A. (2011). Too many cooks spoil the broth: How high-status individuals decrease
group effectiveness. Organization Science, 22(3), 722–737.Gruber, M., MacMillan, I. C., & Thompson, J. D. (2012). From minds to markets how human capital endowments shape mar-
ket opportunity identification of technology start-ups. Journal of Management, 38(5), 1421–1449.Gruber, M., MacMillan, I. C., & Thompson, J. D. (2013). Escaping the prior knowledge corridor: What shapes the number and
variety of market opportunities identified before market entry of technology start-ups? Organization Science, 24(1),
280–300.Guimerà, R., Uzzi, B., Spiro, J., & Amaral, L. A. N. (2005). Team assembly mechanisms determine collaboration network struc-
ture and team performance. Science, 308(5722), 697–702.Hambrick, D. C. (1994). Top management groups: A conceptual integration and reconsideration of the" team" label. Research
in Organizational Behavior, 16, 171–171.Hamilton, B. H., & Nickerson, J. A. (2003). Correcting for Endogeneity in strategic management research. Strategic Organiza-
tion, 1(1), 51–78.Hargadon, A. B. (2002). Brokering knowledge: Linking learning and innovation. Research in Organizational Behavior, 24,
41–85.He, J., & Huang, Z. (2011). Board informal hierarchy and firm financial performance: Exploring a tacit structure guiding
boardroom interactions. Academy of Management Journal, 54(6), 1119–1139.Heckman, J. J. (1979). Sample selection bias as a specification error. Econometrica: Journal of the Econometric Society, 47(1),
153–161.Hess, A. M., & Rothaermel, F. T. (2011). When are assets complementary? Star scientists, strategic alliances, and innovation
in the pharmaceutical industry. Strategic Management Journal, 32(8), 895–909.Higgins, M. C., & Gulati, R. (2003). Getting off to a good start: The effects of upper echelon affiliations on underwriter pres-
tige. Organization Science, 14(3), 244–263.Higgins, M. J., Stephan, P. E., & Thursby, J. G. (2011). Conveying quality and value in emerging industries: Star scientists and
the role of signals in biotechnology. Research Policy, 40(4), 605–617.Hogan, R., & Hogan, J. (2002). Leadership and socio-political intelligence. In R. Riggio, S. Murphy, & F. Pirozzolo (Eds.), Multi-
ple intelligences and leadership (pp. 75–88). Mahwah, NJ: Erlbaum.
Johnson, C., Funk, S., & Clay-Warner, J. (1998). Organizational contexts and conversation patterns. Social Psychology Quar-
terly, 61, 361–371.Joshi, A., & Knight, A. P. (2015). Who defers to whom and why? Dual pathways linking demographic differences and dyadic
deference to team effectiveness. Academy of Management Journal, 58(1), 59–84.Jung, H., Vissa, B., & Pich, M. (2017). How do entrepreneurial founding teams allocate task positions? Academy of Manage-
ment Journal, 60(1), 264–294.Katila, R., Rosenberger, J. D., & Eisenhardt, K. M. (2008). Swimming with sharks: Technology ventures, defense mechanisms
and corporate relationships. Administrative Science Quarterly, 53(2), 295–332.
LAHIRI ET AL. 355

Katila, R., & Shane, S. (2005). When does lack of resources make new firms innovative? Academy of Management Journal, 48
(5), 814–829.Kehoe, R. R., & Tzabbar, D. (2015). Lighting the way or stealing the shine? An examination of the duality in star scientists'
effects on firm innovative performance. Strategic Management Journal, 36(5), 709–727.Kennedy, P. (2008). A Guide to Econometrics. Oxford: Blackwell Publishing.
Kilduff, G. J., Willer, R., & Anderson, C. (2016). Hierarchy and its discontents: Status disagreement leads to withdrawal of
contribution and lower group performance. Organization Science, 27(2), 373–390.Klepper, S., & Sleeper, S. (2005). Entry by spinoffs. Management Science, 51(8), 1291–1306.Knight, R. M. (1989). Technological innovation in Canada: A comparison of independent entrepreneurs and corporate inno-
vators. Journal of Business Venturing, 4(4), 281–288.Kortum, S., & Lerner, J. (2000). Assessing the contribution of venture capital to innovation. RAND Journal of Economics, 31
(4), 674–692.Lacetera, N., Cockburn, I. M., & Henderson, R. (2004). Do firms change capabilities by hiring new people? A study of the
adoption of science-based drug discovery. Advances in Strategic Management, 21, 133–159.Li, G.-C., Lai, R., D'Amour, A., Doolin, D. M., Sun, Y., Torvik, V. I., … Fleming, L. (2014). Disambiguation and co-authorship
networks of the U.S. patent inventor database (1975–2010). Research Policy, 43(6), 941–955.Li, Y., Li, N., Li, C., & Li, J. (in-press). The boon and bane of creative “stars”: A social network exploration of how and when
team creativity is (and is not) driven by a star teammate. Academy of Management Journal. https://doi.org/10.5465/amj.
2018.0283
Loch, C. H., Huberman, B. A., & Stout, S. (2000). Status competition and performance in work groups. Journal of Economic
Behavior & Organization, 43(1), 35–55.Magee, J. C., & Galinsky, A. D. (2008). Social hierarchy: The self-reinforcing nature of power and status. The Academy of
Management Annals, 2(1), 351–398.March, J. G., & Simon, H. A. (1958). Organizations. New York: John Wiley.
Matusik, S. F. (2002). An empirical investigation of firm public and private knowledge. Strategic Management Journal, 23(5),
457–467.McDougall, P., & Robinson, R. B. (1990). New venture strategies: An empirical identification of eight ‘archetypes’ of compet-
itive strategies for entry. Strategic Management Journal, 11(6), 447–467.Mowery, D. C., Oxley, J. E., & Silverman, B. S. (1996). Strategic alliances and interfirm knowledge transfer. Strategic Manage-
ment Journal, 17(S2), 77–91.Nerkar, A. A., McGrath, R. G., & MacMillan, I. C. (1996). Three facets of satisfaction and their influence on the performance
of innovation teams. Journal of Business Venturing, 11(3), 167–188.Newman, M. E., Watts, D. J., & Strogatz, S. H. (2002). Random graph models of social networks. Proceedings of the National
Academy of Sciences, 99(suppl 1), 2566–2572.Oettl, A. (2012). Reconceptualizing stars: Scientist helpfulness and peer performance. Management Science, 58(6),
1122–1140.Onal Vural, M., Dahlander, L., & George, G. (2013). Collaborative benefits and coordination costs: Learning and capability
development in science. Strategic Entrepreneurship Journal, 7(2), 122–137.Ott, T. E., Eisenhardt, K. M., & Bingham, C. B. (2017). Strategy formation in entrepreneurial settings: Past insights and future
directions. Strategic Entrepreneurship Journal, 11(3), 306–325.Overbeck, J. R., Correll, J., & Park, B. (2005). Internal status sorting in groups: The problem of too many stars. In M. Neale,
E. Mannix, & M. C. Thomas-Hunt (Eds.), Research on managing groups and teams (pp. 171–201). Greenwich, CT: JAI Press.
Pahnke, E. C., McDonald, R., Wang, D., & Hallen, B. (2015). Exposed: Venture capital, competitor ties, and entrepreneurial
innovation. Academy of Management Journal, 58(5), 1334–1360.Park, A. E., & Lee, T. H. (2011). Evolution of minimally invasive surgery and its impact on surgical residency training. In
R. Matteotti & S. W. Ashley (Eds.), Minimally invasive surgical oncology (pp. 11–22). New York, NY: Springer.
Park, H. D., & Tzabbar, D. (2016). Venture capital, CEOs' sources of power, and innovation novelty at different life stages of
a new venture. Organization Science, 27(2), 336–353.Paruchuri, S. (2010). Intraorganizational networks, interorganizational networks, and the impact of central inventors: A longi-
tudinal study of pharmaceutical firms. Organization Science, 21(1), 63–80.Pfeffer, J. (1981). Power in organizations. Marshfield, MA: Pitman.
Phelps, C. C. (2010). A longitudinal study of the influence of alliance network structure and composition on firm exploratory
innovation. Academy of Management Journal, 53(4), 890–913.Polanyi, M. (1966). The logic of tacit inference. Philosophy, 41(155), 1–18.Reagans, R., Argote, L., & Brooks, D. (2005). Individual experience and experience working together: Predicting learning
rates from knowing who knows what and knowing how to work together. Management Science, 51(6), 869–881.
356 LAHIRI ET AL.

Reagans, R., & Zuckerman, E. W. (2001). Networks, diversity, and productivity: The social capital of corporate R&D teams.
Organization Science, 12(4), 502–517.Ridgeway, C., & Johnson, C. (1990). What is the relationship between socioemotional behavior and status in task groups?
American Journal of Sociology, 95(5), 1189–1212.Ridgeway, C. L., Johnson, C., & Diekema, D. (1994). External status, legitimacy, and compliance in male and female groups.
Social Forces, 72(4), 1051–1077.Roberts, E. (1991). Entrepreneurs in high technology, Lessons from MIT and beyond. New York: Oxford University Press.
Roodman, D. (2009). How to do xtabond2: An introduction to difference and system GMM in Stata. Stata Journal, 9(1),
86–136.Rosenkopf, L., & Almeida, P. (2003). Overcoming local search through alliances and mobility. Management Science, 49(6),
751–766.Rothaermel, F. T., & Hess, A. M. (2007). Building dynamic capabilities: Innovation driven by individual-, firm-, and network-
level effects. Organization Science, 18(6), 898–921.Sauermann, H., & Cohen, W. M. (2010). What makes them tick? Employee motives and firm innovation. Management Sci-
ence, 56(12), 2134–2153.Schoonhoven, C. B., Eisenhardt, K. M., & Lyman, K. (1990). Speeding products to market: Waiting time to first product intro-
duction in new firms. Administrative Science Quarterly, 35(3), 177–207.Scott, W. R. (1966). Professionals in bureaucracies-areas of conflict. In H. M. Vollmer & D. L. Mills (Eds.), Professionalization
(pp. 265–275). New Jersey: Prentice Hall: Englewood Cliffs.
Simon, H. A. (1991). Bounded rationality and organizational learning. Organization Science, 2(1), 125–134.Singh, J., & Fleming, L. (2010). Lone inventors as sources of breakthroughs: Myth or reality?Management Science, 56(1), 41–56.Smith, S. W., & Shah, S. K. (2013). Do innovative users generate more useful insights? An analysis of corporate venture Capi-
tal Investments in the Medical Device industry. Strategic Entrepreneurship Journal, 7(2), 151–167.Sørensen, J. B. (2007). Bureaucracy and entrepreneurship: Workplace effects on entrepreneurial entry. Administrative Sci-
ence Quarterly, 52(3), 387–412.Stinchcombe, A. L. (1959). Bureaucratic and craft administration of production: A comparative study. Administrative Science
Quarterly, 4, 168–187.Stuart, T. E., Hoang, H., & Hybels, R. C. (1999). Interorganizational endorsements and the performance of entrepreneurial
ventures. Administrative Science Quarterly, 44(2), 315–349.Stuart, T. E., & Podolny, J. M. (1996). Local search and the evolution of technological capabilities. Strategic Management Jour-
nal, 17(S1), 21–38.Suarez, F. F., Cusumano, M. A., & Kahl, S. J. (2013). Services and the business models of product firms: An empirical analysis
of the software industry. Management Science, 59(2), 420–435.Subramanian, A. M., Lim, K., & Soh, P.-H. (2013). When birds of a feather don't flock together: Different scientists and the
roles they play in biotech R&D alliances. Research Policy, 42(3), 595–612.Taylor, A., & Greve, H. R. (2006). Superman or the fantastic four? Knowledge combination and experience in innovative
teams. Academy of Management Journal, 49(4), 723–740.Toole, A. A., & Czarnitzki, D. (2009). Exploring the relationship between scientist human capital and firm performance: The
case of biomedical academic entrepreneurs in the SBIR program. Management Science, 55(1), 101–114.Tushman, M., & O'Reilly, C. (1996). Evolution and revolution: Mastering the dynamics of innovation and change. California
Management Review, 38(4), 8–30.Tzabbar, D., & Kehoe, R. R. (2014). Can opportunity emerge from disarray? An examination of exploration and exploitation
following star scientist turnover. Journal of Management, 40(2), 449–482.Udy, S. H. (1959). " bureaucracy" and" rationality" in Weber's organization theory: An empirical study. American Sociological
Review, 24, 791–795.Uotila, J., Maula, M., Keil, T., & Zahra, S. A. (2009). Exploration, exploitation, and financial performance: Analysis of S&P
500 corporations. Strategic Management Journal, 30(2), 221–231.Vuong, Q. H. (1989). Likelihood ratio tests for model selection and non-nested hypotheses. Econometrica: Journal of the
Econometric Society, 57(2), 307–333.Wasserman, N. (2003). Founder-CEO succession and the paradox of entrepreneurial success. Organization Science, 14(2),
149–172.Wasserman, N. (2012). The founder's dilemmas: Anticipating and avoiding the pitfalls that can sink a startup. Princeton, NJ:
Princeton University Press.
Wasserman, N. (2017). The throne vs. the kingdom: Founder control and value creation in startups. Strategic Management
Journal, 38(2), 255–277.Whyte, W. F. (1943). Street corner society; the social structure of an Italian slum. Chicago, IL: University of Chicago
Press.
LAHIRI ET AL. 357

Winter, S. G., Cattani, G., & Dorsch, A. (2007). The value of moderate obsession: Insights from a new model of organizational
search. Organization Science, 18(3), 403–419.Wooldridge, J. M. (2002). Econometric analysis of cross section and panel data. Cambridge, MA: MIT Press.
Zucker, L. G., Darby, M. R., & Armstrong, J. (1998). Geographically localized knowledge: Spillovers or markets? Economic
Inquiry, 36(1), 65–86.Zucker, L. G., Darby, M. R., & Armstrong, J. S. (2002). Commercializing knowledge: University science, knowledge capture,
and firm performance in biotechnology. Management Science, 48(1), 138–153.
How to cite this article: Lahiri A, Pahnke EC, Howard MD, Boeker W. Collaboration and informal hierarchy
in innovation teams: Product introductions in entrepreneurial ventures. Strategic Entrepreneurship Journal.
2019;13:326–358. https://doi.org/10.1002/sej.1331
358 LAHIRI ET AL.