colides+ pic: a cognitive model of web-navigation based on semantic information from pictures
TRANSCRIPT

This article was downloaded by: [RMIT University]On: 19 August 2014, At: 09:52Publisher: Taylor & FrancisInforma Ltd Registered in England and Wales Registered Number: 1072954 Registered office: Mortimer House,37-41 Mortimer Street, London W1T 3JH, UK
Behaviour & Information TechnologyPublication details, including instructions for authors and subscription information:http://www.tandfonline.com/loi/tbit20
CoLiDeS+ Pic: a cognitive model of web-navigationbased on semantic information from picturesHerre van Oostendorp a , Saraschandra Karanam b & Bipin Indurkhya ba Institute of Information and Computing Sciences , Utrecht University , Princetonplein 5,3584 CC Utrecht, The Netherlandsb Cog Sci Lab , International Institute of Information Technology , Hyderabad, 500032,Andhra Pradesh, IndiaAccepted author version posted online: 15 Jul 2011.Published online: 20 Sep 2011.
To cite this article: Herre van Oostendorp , Saraschandra Karanam & Bipin Indurkhya (2012) CoLiDeS+ Pic: a cognitive modelof web-navigation based on semantic information from pictures, Behaviour & Information Technology, 31:1, 17-30, DOI:10.1080/0144929X.2011.603358
To link to this article: http://dx.doi.org/10.1080/0144929X.2011.603358
PLEASE SCROLL DOWN FOR ARTICLE
Taylor & Francis makes every effort to ensure the accuracy of all the information (the “Content”) containedin the publications on our platform. However, Taylor & Francis, our agents, and our licensors make norepresentations or warranties whatsoever as to the accuracy, completeness, or suitability for any purpose of theContent. Any opinions and views expressed in this publication are the opinions and views of the authors, andare not the views of or endorsed by Taylor & Francis. The accuracy of the Content should not be relied upon andshould be independently verified with primary sources of information. Taylor and Francis shall not be liable forany losses, actions, claims, proceedings, demands, costs, expenses, damages, and other liabilities whatsoeveror howsoever caused arising directly or indirectly in connection with, in relation to or arising out of the use ofthe Content.
This article may be used for research, teaching, and private study purposes. Any substantial or systematicreproduction, redistribution, reselling, loan, sub-licensing, systematic supply, or distribution in anyform to anyone is expressly forbidden. Terms & Conditions of access and use can be found at http://www.tandfonline.com/page/terms-and-conditions

CoLiDeS þ Pic: a cognitive model of web-navigation based on semantic information from pictures
Herre van Oostendorpa*, Saraschandra Karanamb and Bipin Indurkhyab
aInstitute of Information and Computing Sciences, Utrecht University, Princetonplein 5, 3584 CC Utrecht, The Netherlands;bCog Sci Lab, International Institute of Information Technology, Hyderabad 500032, Andhra Pradesh, India
(Received 10 October 2010; final version received 7 April 2011)
Comprehension-based linked model of deliberate search (CoLiDeS) þ Pic is a cognitive model of web-navigationthat takes into account the semantic information from graphical elements present on a web-page to compute theinformation scent value of the hyperlinks. The model is based on CoLiDeS, which has a two-phase processing cycle:(a) attention phase, which first parses the web-page and focuses attention on the region of the web-page that issemantically most similar to the goal, and (b) action-selection phase, which evaluates the available actions in thefocused region and selects a particular action such as clicking a link. The graphical elements are important both forattracting attention to a region of the web-page and for communicating semantic meaning that may alter or enhancethe meaning of the hyperlink labels. In the first part of this article, we give a theoretical explanation of theCoLiDeS þ Pic model and describe the methodology followed to implement it. In the second part, we run asimulation on a mock-up website and evaluate the effect of pictures on information scent of hyperlinks by means ofthe CoLiDeS þ Pic model on basis of the simulation results. It was found that CoLiDeS þ Pic with highly relevantpictures increases the values of information scent of task-relevant hyperlinks, and therefore it increases theprobability of selecting those hyperlinks compared to CoLiDeS (without pictures) or CoLiDeS þ Pic with lowlyrelevant pictures. These results confirm the importance of including information from pictures into the modelling ofweb-navigation.
Keywords: information scent; graphics; pictures; semantics; web-navigation; modelling
1. Introduction
The Internet is expanding quite rapidly with severalbillion pages currently published. Searching for re-levant information in such a huge information space isoften a laborious task. Typical users surfing the WorldWide Web (www) follow various strategies to minimisetheir efforts in finding the required information.Information foraging theory (Pirolli and Card 1999)introduced the concept of information scent to modelthe strategies employed by users navigating on theweb. Information scent is an estimate of the cost orvalue associated with taking a particular action such asclicking on a hyperlink in the case of a website.According to information foraging theory, users weighand compare the information obtained from severalcues, filter unnecessary information and selectivelyseek the path with the highest information scent.Users’ search behaviour and navigation patterns onthe Internet were found to follow the concept ofinformation scent (Pirolli and Card 1999, Chi et al.2000, 2001).
Several cognitive models that simulate web-navigation behaviour on the web are inspired byinformation foraging theory and the concept of
information scent: comprehension-based linked modelof deliberate search (CoLiDeS) (Kitajima et al. 2000,2005), SNIF-ACT (Pirolli and Fu 2003, Fu and Pirolli2007) and CoLiDeSþ (Juvina et al. 2005, Juvina andvan Oostendorp 2008).
We describe briefly CoLiDeS and CoLiDeSþ here.CoLiDeS assumes that the comprehension of textand images is the key to web-navigation. According toCoLiDeS, navigating a website involves four processes:parsing the web-page into sub-regions, selecting one ofthese sub-regions, comprehending screen objects with-in that sub-region, and finally selecting the mostappropriate object in that sub-region. CoLiDeS selectsthe most appropriate object by measuring the semanticrelatedness of various screen objects in the selectedsub-region with the user goal. This measure providesan operational estimate of information scent.
CoLiDeSþ extends CoLiDeS by incorporatingstructural knowledge in addition to semantic informa-tion in modelling web-navigation. CoLiDeSþ takesinto account context, that is, the path of the linkschosen so far. Accordingly, path adequacy inCoLiDeSþ is defined as the semantic similaritybetween the navigation path and the user goal. A link
*Corresponding author. Email: [email protected]
Behaviour & Information Technology
Vol. 31, No. 1, January 2012, 17–30
ISSN 0144-929X print/ISSN 1362-3001 online
� 2012 Taylor & Francis
http://dx.doi.org/10.1080/0144929X.2011.603358
http://www.tandfonline.com
Dow
nloa
ded
by [
RM
IT U
nive
rsity
] at
09:
52 1
9 A
ugus
t 201
4
is chosen only if it increases path adequacy. Otherwise,a path switch takes place: other links with lowersimilarities are considered if they increase path ade-quacy. Eventually, backtracking to other regions on thesame page, and even to other pages, is considered.
Although CoLiDeS acknowledges the importanceof images in web-navigation by including the stages ofparsing and focusing, where mostly lower levelperceptual features and pre-attentive processing playa major role, it actually only models the selectionphase. Although CoLiDeSþ performs better thanCoLiDeS by incorporating structural informationand modelling backtracking behaviour (Juvina andvan Oostendorp 2008), it also leaves out the informa-tion coming from pictures.
While some studies focused on the impact ofgraphics on locating web-page widgets (Hinesley2005, Hinesley and Blackmon 2008, Karanam et al.2009), Karanam et al. (2010) looked at the impact ofproviding picture icons next to hyperlinks on informa-tion retrieval tasks on the web. Few other studiesexplored the impact of providing graphical representa-tions of website architecture (De Jong and Van derHulst 2002, Nilson and Mayer 2002) on users’navigation behaviour. However, there does not seemto be any attempt to use the semantic informationfrom graphical elements on a web-page to compute theinformation scent trails in web-navigation. In order tofill this gap, we first conducted an extensive review ofthe literature on the impact of pictures in otherdomains, which we summarise here. Mayer andMoreno (2003, 2004) conducted a series of experimentson the supportive role played by pictures in multimedialearning. They found that people learn informationmore quickly using multimedia when compared to thetraditional class-room teaching method. Multimediatools include the use of pictures, sound and animationin addition to simple text. Faster multimedia learninghas been shown in domains as diverse as brakesystems, lightning formation, bicycle pumps andhuman circulatory system (Hegarty and Just 1993,Ainsworth and Loizou 2003).
In the domain of memory and cognitive loadtheory, it has been shown by Sweller and Chandler(1994) that integrating picture and its associated text inclose proximity is effective. Further, Ginns (2006)showed that integrated formats that place text directlyinto pictures are superior to split-source formats wheretext and picture are physically separated. Larkin andSimon (1987) demonstrated that by preserving topo-logical and spatial relations, a diagram makes it mucheasier to solve certain problems in physics andgeometry. Shimada and Kitajima (2006) showed thatillustrated text promotes comprehension by increasingmotivation: that is, a user will more likely read an
article with an illustrated picture than an article withpure text.
Research on the visual system also shows that it isadept at perceiving visually salient objects. An objectis classified as visually salient by our visual system if itis significantly different from surrounding objectsalong one or more of these properties: intensity,contrast, colour, edge orientation, stereo disparityand motion direction (Treisman and Gelade 1980).Visual search is easy if targets and non-targets areeasily discriminated, and difficult if non-targets aresimilar to targets (Desimone and Duncan 1995).Objects that are brighter, faster, larger, moving, andthat appear suddenly in the visual field are quicklyfound (Treisman and Gormican 1988). It can beinferred from these results that pictures on a web-page are visually salient compared to the text, andtherefore they attract the immediate attention of theuser. All this research further convinced us that if thesemantic information from pictures is incorporatedinto cognitive models of web-navigation, they wouldperform much better than they are doing now.
In Karanam et al. (in press), we made our firstattempt at augmenting CoLiDeS with additionalinformation from pictures present next to the maincontent of a web-page. We provide a more detailedtheoretical description of the processes behind themodel in this article. It is important to note here thatthe CoLiDeS model stays mainly the same; only theinput is different. That is, CoLiDeS þ Pic handlessemantic information from pictures in addition to thesemantic information from the hyperlink text handledby CoLiDeS.
This article is organised as follows: section 2 givesan overview of the CoLiDeS þ Pic model and thevarious stages involved in it. Section 3 simulates themodel with an example goal and describes the resultsof applying the methodology underlying CoLiDeS þPic (incorporating semantic information from picturesinto the computation of information scent) on a mock-up website with eight search goals. In section 4, wepresent conclusions and discuss limitations and furtherresearch.
2. CoLiDeS þ Pic
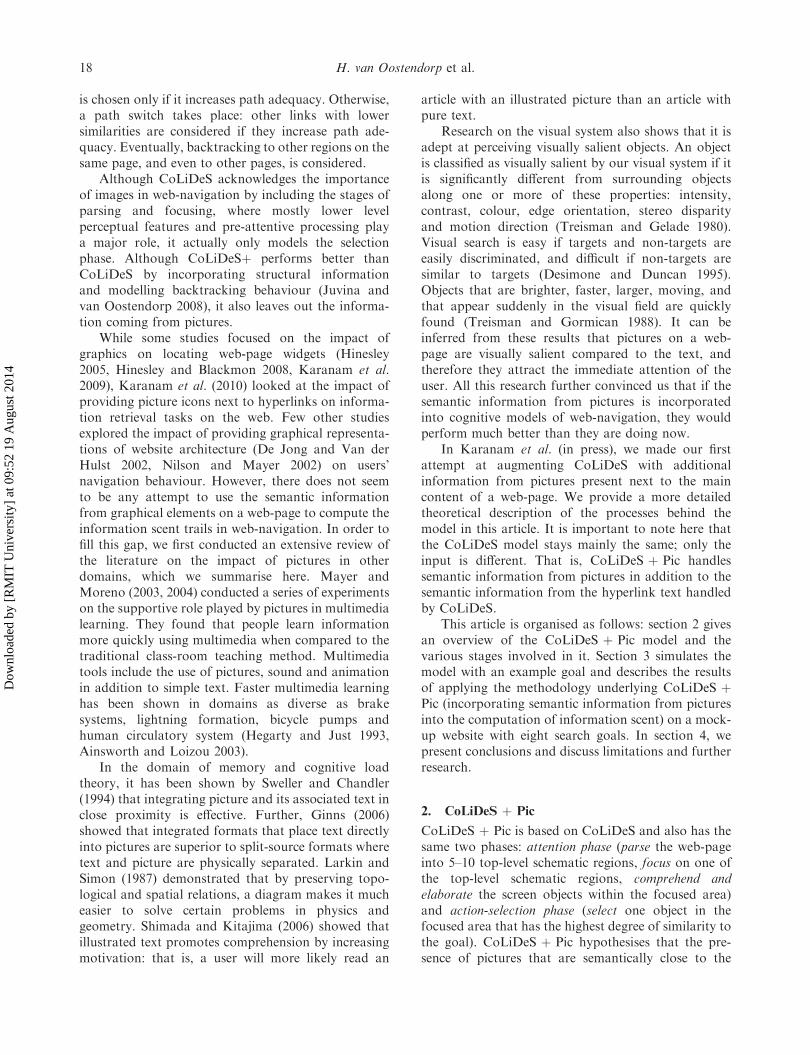
CoLiDeS þ Pic is based on CoLiDeS and also has thesame two phases: attention phase (parse the web-pageinto 5–10 top-level schematic regions, focus on one ofthe top-level schematic regions, comprehend andelaborate the screen objects within the focused area)and action-selection phase (select one object in thefocused area that has the highest degree of similarity tothe goal). CoLiDeS þ Pic hypothesises that the pre-sence of pictures that are semantically close to the
18 H. van Oostendorp et al.
Dow
nloa
ded
by [
RM
IT U
nive
rsity
] at
09:
52 1
9 A
ugus
t 201
4

current context (context includes goal, set of hyper-links and the content of the page) would increase theinformation scent of a semantically close hyperlink ona web-page. We assume the information scent of acertain link can be enhanced by semantic features of arelevant picture in that context (consisting of the givengoal and set of link labels). This hypothesis issupported by Levie and Lentz (1982), who have shownthat information is remembered and retrieved betterwhen accompanied by relevant pictures. More pre-cisely, Budiu and Anderson (2004) demonstrated thatusers can use a rich sentence context to arrive at themeaning of an ambiguous word. Another supportingpiece of research is based on construction-integrationtheory of text comprehension (Kintsch 1998), whichexplains that the incoming text element, the previouslyread text, the user goal, and the user backgroundknowledge determine, in this order of priority, whichconcepts are activated at any given point of time.Kitajima and Polson (1992, 1995) use Kintsch’s (1998)theory to come up with a computational model ofskilled use of a graphical-user interface. Their modelassumes that a particular user will focus his or herattention on screen objects that are most relevant tothe current task. Thus, relevance of the context seemsto have a major influence on selecting an object fromthe objects on display, which supports the heuristicthat a relevant picture on a web-page can facilitate theselection of a hyperlink from a large collection ofhyperlinks on the web-page. In this way, CoLiDeS þPic assumes that pictures with higher relevance to thespecific context (goal and link labels) contribute to theactivation value of the task-relevant hyperlinks with agreater probability.
2.1. Processes modelled in CoLiDeS þ Pic
We now explain how the processes modelled inCoLiDeS þ Pic take into account the informationfrom pictures. During the attention phase, we assumethat depending on the saliency and spatial location ofthe picture on the page, it can either form one of thetop-level schematic regions or be an actual object inone of the top-level schematic regions. In either case,owing to its high saliency, during the focus stage, theattention of the user is drawn towards the picture firstand then to the other schematic regions. Bottom–upprocessing has a greater influence than top–downprocessing of goal on the user at this stage. Thus, weassume that the information from the picture isencoded at a subconscious level of the human braineven before looking at all the other regions. Just ascognitive models of web-navigation assume that therelevance of all hyperlinks on a page is consideredbefore selection, which is not necessarily the case in a
real scenario (Brumby and Howes 2008), we also makethis simplifying assumption that a picture is viewedfirst. A more accurate model would be the one thatdoes not make this assumption, but can predict when auser would focus on a picture and only then includesemantic information from that picture.
During the action-selection phase, information fromthe viewed picture is elaborated and taken into accountto identify the hyperlink with the highest similarity tothe goal. We explain this process by presenting twoexamples.
Figure 1 shows a schematic representation ofCoLiDeS þ Pic with two examples. In the left example(middle column), the user goal is ‘I want to know atleast three regions in the human body where lymphnodes are present’. The user is on the ‘CirculatorySystem’ page. The user first parses the web-page intotop-level schematic regions: logo, left navigationcolumn, main content and a picture. Each schematicregion is elaborated and comprehended. Owing to itssize and placement (saliency), the picture forms one ofthe top-level schematic regions and also attractsattention first. The picture can be elaborated as ‘aschematic diagram of human circulatory system withthe arteries, veins and heart’. After focusing on thepicture, the user selects the navigation column, parsesit further into constituent hyperlinks and, using thedescription of the picture as well as the text in thehyperlinks, chooses the hyperlink that is closest insimilarity to the goal: Lymphatic system in this case.
In the right example, the user goal is ‘I want toknow the health risks posed by the use of asbestos inresidential settings’. The user parses the web-page intothe following top-level schematic regions: top-bar,banner, central region and advertisements. Note thatin this scenario, the small iconic pictures do not formthe top-level schematic regions. They are embeddedinside ‘central region’. Each schematic region is againelaborated and comprehended. The user attends to thecentral region and further parses it into icons and theircorresponding blurbs and advertisements. Since thepicture icons are more salient than the blurbs, theyattract the attention of the user first. The elaborationof the small icon next to ‘environmental health’ can be‘eco-friendly, environment-safe, green usage’. Usingthis description and the elaboration of the other icons,the user chooses the blurb on ‘Environmental Health’as it has the highest relevance to the goal. There couldbe a third scenario, when a picture does not form oneof the top-level schematic regions and the user alsodoes not focus on that top-level region that containsthe picture. The picture in such a scenario is neverfocused upon, and therefore this scenario is the sameas in CoLiDeS for there is no role of semanticinformation from pictures. The next section describes
Behaviour & Information Technology 19
Dow
nloa
ded
by [
RM
IT U
nive
rsity
] at
09:
52 1
9 A
ugus
t 201
4

how CoLiDeS þ Pic is implemented. For the imple-mentation, we assume Scenario 1, where the pictureforms one of the top-level schematic regions andattracts the initial attention of the user.
2.2. Implementation of CoLiDeS þ Pic
The first step towards implementation of CoLiDeS þPic requires a method to extract semantic informationfrom pictures. There are currently two approaches todo this: content-based image retrieval (CBIR) andannotation-based image retrieval (ABIR). CBIR ana-lyses images in terms of low-level perceptual featuressuch as colour, texture, shape and orientation. Itmatches these low-level features with those of a queryimage to come up with the target image. Chang et al.(1997) found that search results based on CBIRtechniques are not found intuitive or relevant by theusers. ABIR, on the other hand, generally operates onthe annotations (textual descriptions) associated withimages. ABIR has philosophical and practical chal-lenges in trying to translate visually encoded knowl-edge into verbal surrogate, a challenge to the indexer’sintellectual capacity to detect multiple layers of mean-ing. This is further influenced by personal knowledge,cultural conditioning and past experience (Enser et al.2007).
Smeulders et al. (2002) noted: ‘The major challengefor both these methods has been the lack ofcoincidence between the information that one canextract from the visual data and the interpretation thatthe same data have for a user in a given situation.’
Accordingly, it is becoming clearer in the image-retrieval community that only the integration of thetwo techniques can result in a satisfactory retrievalperformance (Zhao and Grosky 2002). Automaticsemantic image-retrieval techniques are also con-fronted with features that do not have any visualpresence such as time, space, a historic event andemotions. Given the difficulties associated with ex-tracting semantic information from pictures usingalgorithmic methods, for answering our researchquestions and demonstrating the impact of incorpor-ating such additional information, we used humanannotators to extract semantic features manually.
The implementation of CoLiDeS þ Pic that wehave developed involves two phases: the first phase isthe feature-extraction phase (steps i–v), using humanannotators to generate semantic features. During thisphase, semantic features of pictures present on eachpage of the website are collected. The second phase isthe actual running of CoLiDeS þ Pic (steps vi–xi). Inthis phase, latent semantic analysis (LSA, henceforth) isused to compute similarity between the goal, thehyperlinks and the features of the picture. In thisarticle, we focus on the implementation of only theaction-selection phase (the second phase) of CoLiDeSþ Pic and leave a full implementation for futureresearch.
LSA (Landauer et al. 1998) is a statisticalprocedure that employs singular value decompositionto a large representative corpus of text and representsmeanings of words and sentences as a vector in amultidimensional space of about 300 dimensions. The
Figure 1. CoLiDeS þ Pic.
20 H. van Oostendorp et al.
Dow
nloa
ded
by [
RM
IT U
nive
rsity
] at
09:
52 1
9 A
ugus
t 201
4

cosine value between two vectors in this multidimen-sional space gives the semantic relatedness. A cosinevalue of þ1 denotes identical texts and 71 denotestexts with opposite meanings; in other words valuesaround þ1 denote a high semantic similarity whereasvalues around 71 indicate a high semantic dissim-ilarity; values near 0 indicate two unrelated texts. LSAalso provides various semantic spaces to representdifferent vocabulary levels of users to model differencesin terms used in various domains.
We now describe the methodology in general termsinvolved in the implementation of CoLiDeS þ Picwhich is broken up into 11 steps. The first phasecollects semantic features of pictures on web-pages(steps i–v). The second phase computes the semanticsimilarity between the goal, the hyperlink text, and thesemantic features attached to the pictures (steps vi–xi).In section 3, we will present an elaborated example ofapplying the methodology.
2.2.1. Phase I: feature extraction
i. Compile a set of user goals: compile a list of usergoals covering all pages of the website. Co-LiDeS þ Pic collects semantic features of pic-tures in the right context. Since the goal is oneof the major parameters of the context, we firstneed to compile a set of user goals.
ii. Compile pictures for each page: a set of picturesvarying in relevance to the content of each web-page is collected. First, a large set of pictures iscompiled, approximately 10 per page. Threejudges select five pictures on an intuitive basis;pictures that have low relevance to highrelevance in the context (of that page). Themain criterion is that the pictures are compa-tible with the context, some highly relevant,others lowly relevant. That provides a hetero-geneous set of pictures.
iii. Collect semantic features: participants areprovided with a web-page, a goal correspond-ing to that page, and one of the picturescorresponding to that page. They are thenasked to write down at least five features thatoccur to their mind while looking at the picturein that context within a restricted time period.The text in the main content area of the web-page is removed to ensure that the participantsdo not use it to list their features. This methodis followed in collecting semantic features of allpictures, corresponding to all the pages of thewebsite.
iv. Generate frequency distribution of features: foreach picture, we combine features generated bydifferent participants and create a frequency
distribution to show how often each feature wasgenerated. A feature is deemed to be represent-ing the picture if it is among the top five in thefrequency distribution and was generated by atleast 50% of all the participants. The featuresthat satisfy the above criteria for each pictureare considered to be the semantic representa-tion of the picture in that context.
v. Compute high- and low-relevance pictures: usingLSA, for each web-page, and for the goalcorresponding to that web-page, semanticsimilarity is computed between the goal andthe five sets of features corresponding to each ofthe five pictures (using a semantic space thatbest fits the vocabulary level of the hypotheticalusers). The picture corresponding to the highestsimilarity measure is termed as the highlyrelevant picture and the picture with lowestsimilarity measure as the lowly relevant picture.
Figure 2 shows a schematic representation of thefeature-extraction phase. At the end of feature-extrac-tion phase, we have a set of highly relevant and lowlyrelevant pictures available corresponding to each pageof the website.
2.2.2. Methodology at Phase II: actual run of themodel(s)
vi. Select a goal: from the set of goals compiledduring the feature-extraction phase.
vii. Select a semantic space: LSA provides avariety of semantic spaces. Select one thatbest fits the vocabulary level of the hypothe-tical users.
Figure 2. Schematic representation of feature-extractionphase of CoLiDeS þ Pic.
Behaviour & Information Technology 21
Dow
nloa
ded
by [
RM
IT U
nive
rsity
] at
09:
52 1
9 A
ugus
t 201
4
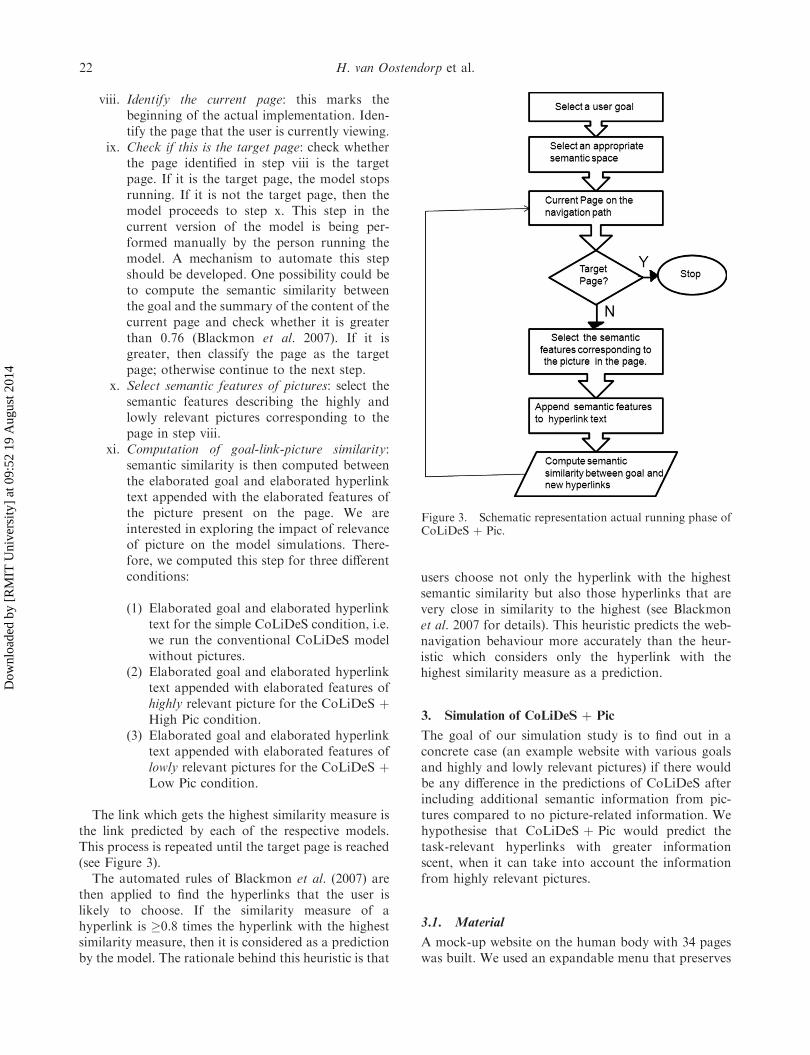
viii. Identify the current page: this marks thebeginning of the actual implementation. Iden-tify the page that the user is currently viewing.
ix. Check if this is the target page: check whetherthe page identified in step viii is the targetpage. If it is the target page, the model stopsrunning. If it is not the target page, then themodel proceeds to step x. This step in thecurrent version of the model is being per-formed manually by the person running themodel. A mechanism to automate this stepshould be developed. One possibility could beto compute the semantic similarity betweenthe goal and the summary of the content of thecurrent page and check whether it is greaterthan 0.76 (Blackmon et al. 2007). If it isgreater, then classify the page as the targetpage; otherwise continue to the next step.
x. Select semantic features of pictures: select thesemantic features describing the highly andlowly relevant pictures corresponding to thepage in step viii.
xi. Computation of goal-link-picture similarity:semantic similarity is then computed betweenthe elaborated goal and elaborated hyperlinktext appended with the elaborated features ofthe picture present on the page. We areinterested in exploring the impact of relevanceof picture on the model simulations. There-fore, we computed this step for three differentconditions:
(1) Elaborated goal and elaborated hyperlinktext for the simple CoLiDeS condition, i.e.we run the conventional CoLiDeS modelwithout pictures.
(2) Elaborated goal and elaborated hyperlinktext appended with elaborated features ofhighly relevant picture for the CoLiDeS þHigh Pic condition.
(3) Elaborated goal and elaborated hyperlinktext appended with elaborated features oflowly relevant pictures for the CoLiDeS þLow Pic condition.
The link which gets the highest similarity measure isthe link predicted by each of the respective models.This process is repeated until the target page is reached(see Figure 3).
The automated rules of Blackmon et al. (2007) arethen applied to find the hyperlinks that the user islikely to choose. If the similarity measure of ahyperlink is �0.8 times the hyperlink with the highestsimilarity measure, then it is considered as a predictionby the model. The rationale behind this heuristic is that
users choose not only the hyperlink with the highestsemantic similarity but also those hyperlinks that arevery close in similarity to the highest (see Blackmonet al. 2007 for details). This heuristic predicts the web-navigation behaviour more accurately than the heur-istic which considers only the hyperlink with thehighest similarity measure as a prediction.
3. Simulation of CoLiDeS þ Pic
The goal of our simulation study is to find out in aconcrete case (an example website with various goalsand highly and lowly relevant pictures) if there wouldbe any difference in the predictions of CoLiDeS afterincluding additional semantic information from pic-tures compared to no picture-related information. Wehypothesise that CoLiDeS þ Pic would predict thetask-relevant hyperlinks with greater informationscent, when it can take into account the informationfrom highly relevant pictures.
3.1. Material
A mock-up website on the human body with 34 pageswas built. We used an expandable menu that preserves
Figure 3. Schematic representation actual running phase ofCoLiDeS þ Pic.
22 H. van Oostendorp et al.
Dow
nloa
ded
by [
RM
IT U
nive
rsity
] at
09:
52 1
9 A
ugus
t 201
4

the full context as the user is browsing as opposed to asequential menu that provides only partial context(van Oostendorp et al. 2009). Figure 4 shows asnapshot of the menu when the user is on the ‘MotorNeurons’ page. In the expandable menu style, the usercould see approximately eight links on any page(M ¼ 8.74, SD ¼ 1.74). The website had four levelsof depth. Eight user goals, two for each level wereconstructed (see Figure 5). All eight questions couldonly be answered with text information. Refer toAppendix 1 for the list of user goals used and theircorresponding shortest navigation paths.
3.2. Implementing phase I: feature-extraction
Participants: 50 graduate and under-graduate students(age: M ¼ 23 years, SD ¼ 2.3 years) from Interna-tional Institute of Information Technology – Hyder-abad, India, participated in the feature-extraction task.They were given a complimentary gift at the end oftheir session. Each participant was presented with 34pictures from a set of 170 pictures corresponding to 34web-pages chosen randomly under different contexts(provided by different goals and different hyperlinksets). Each participant was asked to write at least fivesemantic features describing the picture in that context.Thus, for each picture, we received features from 10participants.
Steps:
i. Compile a set of user goals: user goalswere represented in the form of questions(see Appendix 1). For example, the goal‘Name four upper respiratory tract infections’corresponds to the page on ‘Head and Neckregion’.
ii. Compile pictures for each web-page: the fivepictures corresponding to the page on ‘Headand Neck region’ are shown in Table 1. Asindicated in section 2.1.1, step ii, in the firstinstance a large set was selected. Three judgesselected these five pictures per page on anintuitive basis, varying in semantic relevance.
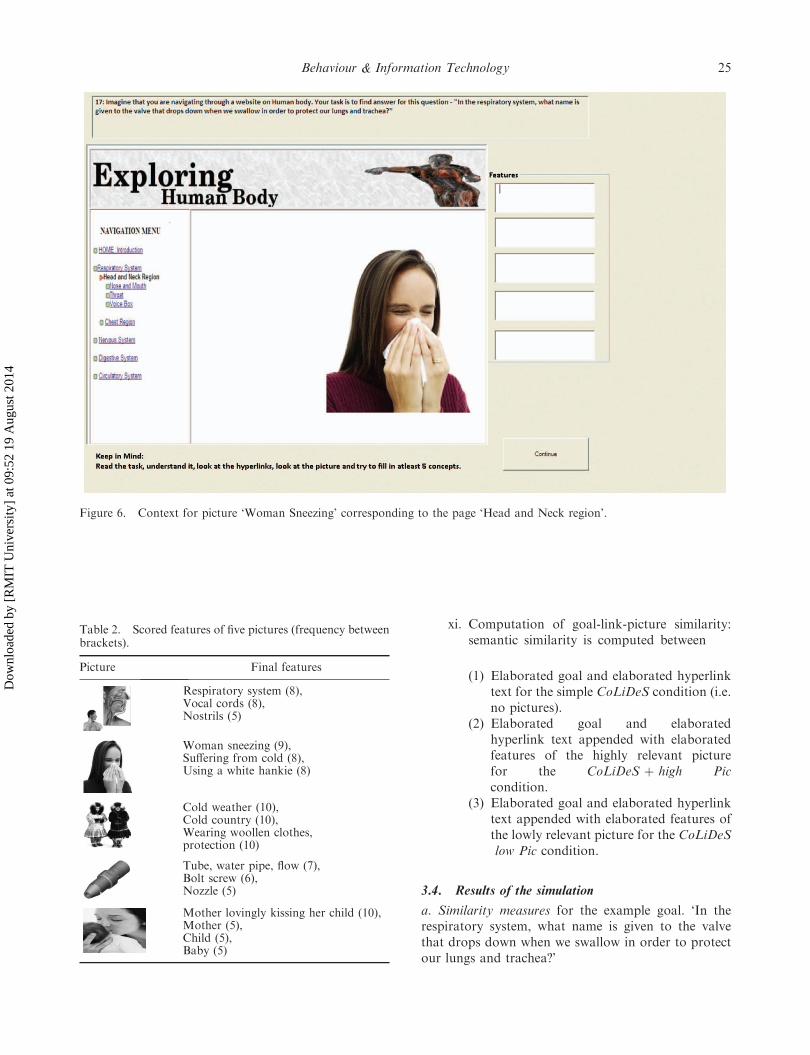
iii. Collect semantic features for each picture:semantic features describing these featureswere collected from the participants by provid-ing them the goal and the corresponding set ofhyperlinks. As an example, for the ‘womansneezing’ picture, a snapshot of the instructionscreen is shown in Figure 6. Similarly, semanticfeatures for the other four pictures of this pageare collected.
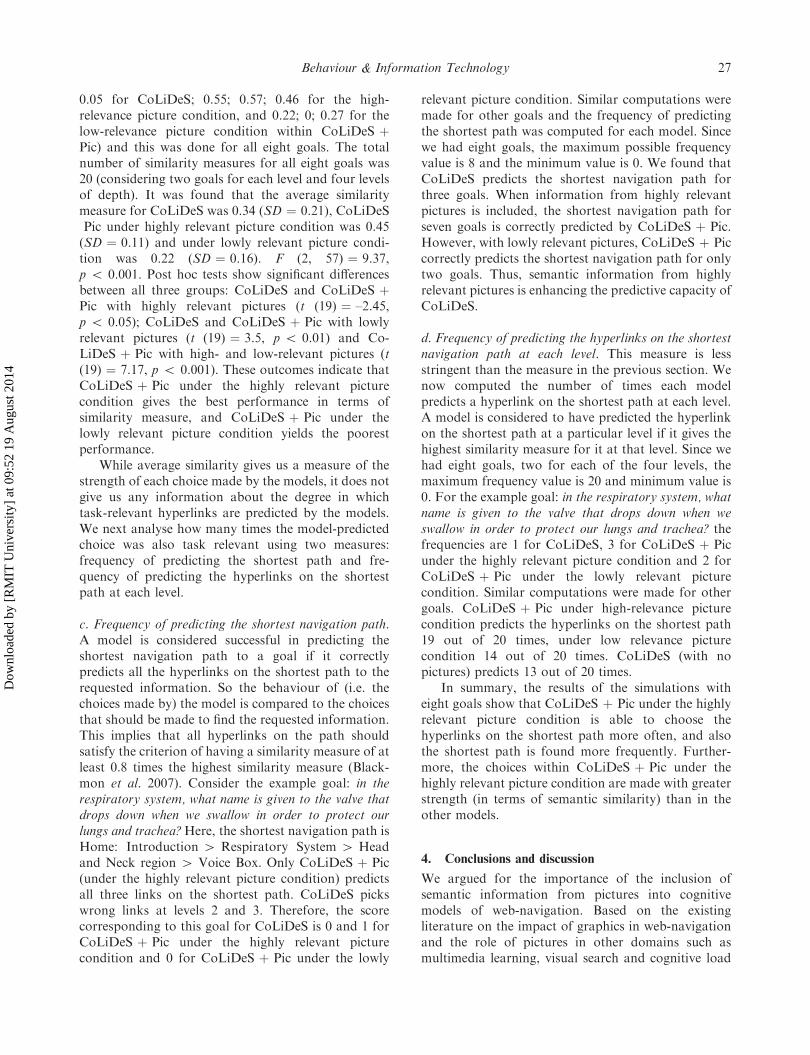
iv. Generate frequency distribution of features: theabove features are scored by combiningrepeating features. Table 2 shows the finalfeatures representing the five pictures corre-sponding to the page ‘Head and Neck region’.We had 10 participants judging each pictureand therefore the maximum possible fre-quency was 10.
v. Computing highly and lowly relevant pictures:the user goal and the features are elaborated(i.e. semantically close and frequent termsthat are activated by reading a word areappended. See Blackmon et al. 2007; for theelaboration procedure). Next, semantic simi-larity is computed between the elaborateduser goal and the elaborated features usingthe ‘tasaALL’ semantic space (a semanticspace covering material read by first yearcollege students) because all the 50 partici-pants were graduate and undergraduatestudents. The similarity measure (cosinevalues) obtained for the five pictures corre-sponding to our example goal are 0.40, 0.24,0.01, –0.03, 0.01, respectively.
For this example, picture 1 (a schematic diagram ofthe upper respiratory tract) is the highly relevantpicture and picture 4 (sneezing nozzle) is the lowlyrelevant picture. Similarly, highly and lowly relevantpictures are selected for all the other pages of thewebsite and the other seven goals.Figure 4. Expandable navigation menu.
Behaviour & Information Technology 23
Dow
nloa
ded
by [
RM
IT U
nive
rsity
] at
09:
52 1
9 A
ugus
t 201
4

3.3. Implementing phase II: actual run
vi. Select a goal: to explain this phase, we use thegoal: ‘In the respiratory system, what name isgiven to the valve that drops down when weswallow in order to protect our lungs andtrachea?’. The shortest navigation path corre-sponding to this goal is: Home Introduc-tion 4 Respiratory System 4 Head andNeck region 4 Voice Box. The requested
information meeting the goal is represented onthe fourth level, on the page accessible afterclicking on the link Voice Box.
vii. Select a semantic space: we select the semanticspace – ‘tasaALL’ provided by LSA (http://lsa.colorado.edu).
viii. Identify the current page: assuming we are onthe home page, the current page is ‘Home:Introduction’.
ix. Check if this is the target page: Since ‘HomeIntroduction’ is not the target page, weproceed to the next step. (If the page werethe target page, then we would have stopped).
x. Select semantic features of pictures: thesemantic features corresponding to the highlyand lowly relevant pictures on the page in stepviii are selected. In our example, the semanticfeatures corresponding to the ‘Home: Intro-duction’ page are collected.
Figure 5. Branched tree visualisation of our mock up website on human body. The eight target pages used for our goals areshown as white circles.
Table 1. Five pictures varying in relevance to the content ofthe page on ‘Head and Neck region’.
Page Pictures
Head andNeck region
24 H. van Oostendorp et al.
Dow
nloa
ded
by [
RM
IT U
nive
rsity
] at
09:
52 1
9 A
ugus
t 201
4
xi. Computation of goal-link-picture similarity:semantic similarity is computed between
(1) Elaborated goal and elaborated hyperlinktext for the simple CoLiDeS condition (i.e.no pictures).
(2) Elaborated goal and elaboratedhyperlink text appended with elaboratedfeatures of the highly relevant picturefor the CoLiDeS þ high Piccondition.
(3) Elaborated goal and elaborated hyperlinktext appended with elaborated features ofthe lowly relevant picture for the CoLiDeSlow Pic condition.
3.4. Results of the simulation
a. Similarity measures for the example goal. ‘In therespiratory system, what name is given to the valvethat drops down when we swallow in order to protectour lungs and trachea?’
Figure 6. Context for picture ‘Woman Sneezing’ corresponding to the page ‘Head and Neck region’.
Table 2. Scored features of five pictures (frequency betweenbrackets).
Picture Final features
Respiratory system (8),Vocal cords (8),Nostrils (5)
Woman sneezing (9),Suffering from cold (8),Using a white hankie (8)
Cold weather (10),Cold country (10),Wearing woollen clothes,protection (10)
Tube, water pipe, flow (7),Bolt screw (6),Nozzle (5)
Mother lovingly kissing her child (10),Mother (5),Child (5),Baby (5)
Behaviour & Information Technology 25
Dow
nloa
ded
by [
RM
IT U
nive
rsity
] at
09:
52 1
9 A
ugus
t 201
4

The hyperlinks on the shortest navigation path forthis goal are shown in bold (Respiratory System, Headand Neck region and Voice Box). The similaritymeasures obtained (by running steps viii–xi for the‘Home Introduction’ page) for the hyperlinks underLevel 1 are shown in Table 3. The similarity measuresin Level 2 and Level 3 are also obtained by repeatingsteps viii–xi for the other pages on the shortestnavigation path. The hyperlink with the highestsimilarity measure is normally considered to be themodel-predicted hyperlink. In some scenarios, basedon the semantic similarity measures obtained, it ispossible that a model predicts more than one hyperlinkwith equal probability. If the similarity measure of ahyperlink is � 0.8 times the hyperlink with the highestsimilarity measure, then it is also considered as aprediction by the model (see Blackmon et al. 2007).The rationale behind this heuristic is that a user isattracted to not only the hyperlink with highestsemantic similarity but also those hyperlinks that arevery close in similarity to the highest (refer Table 3,levels 2 and 3). The predicted links at all three levelsare identified using this heuristic, and the correspond-ing similarity measures are shown in bold for bothmodels.
We can see from Table 3 that CoLiDeS þ Picunder highly relevant picture condition predicts (forthe example goal) the link on the shortest path at twoof the three levels. The information scent of CoLiDeSPic under the lowly relevant picture condition is lowerthan both CoLiDeS and CoLiDeS þ Pic under thehighly relevant picture condition at all three levels.
At Level 1, both CoLiDeS and CoLiDeS þ Pic(both conditions of picture relevance) predict
‘Respiratory system’ with highest information scent.However, at Level 2, while CoLiDeS picks the wronglink (Chest region) with greater information scent,CoLiDeS þ Pic under the highly relevant picturecondition picks both links (Head and Neck region,Chest region) with almost equal probability becausethey have almost the same similarity value (0.57 vs.0.58). The two hyperlinks have similarity measuresvery close to each other after adding semanticinformation from a highly relevant picture. Addingsemantic information from a lowly relevant picture hasthe opposite effect: the similarity measures of bothlinks drop very close to zero. Thus, for this case,CoLiDeS þ Pic under the lowly relevant picturecondition is no more likely to pick the link on theshortest path than some other wrong link. Again, atLevel 3, the link on the shortest path is ‘Voice Box’.CoLiDeS picks a wrong link with a relative highinformation scent (‘Throat’). CoLiDeS þ Pic (underboth conditions of picture relevance) also picks awrong link (‘Throat’) with higher information scent.But since it also gives similarity measures very close toeach other for other two hyperlinks, we consider thatCoLiDeS þ Pic predicts all three links with equalprobability at Level 3.
b. Average similarity across all eight goals. Aftercompiling similar computations from the other sevengoals, the average similarity measures given by thethree models for the hyperlinks on the shortest pathcorresponding to each goal were compared. For allthree models we compared for a specific goal thesimilarity value on each level for the link on theshortest path (in the goal example above, e.g. 0.63; 0;
Table 3. Final similarity measures obtained by the two models: CoLiDeS, CoLiDeS þ Pic under highly and lowly relevantpicture conditions.
GoalIn the respiratory system, what name is given to the valve that drops down when we swallow in
order to protect our lungs and trachea?
CoLiDeS þ Pic
Link CoLiDeS Highly relevant picture condition Lowly relevant picture condition
Level 1Respiratory System 0.63 0.55 0.22Nervous system 0.06 0.11 0.06Digestive system 0.19 0.22 0.15Circulatory system 0.35 0.29 0.16
Level 2Head and neck region 0 0.57 0Chest region 0.37 0.58 0.03
Level 3Nose and mouth 0.16 0.48 0.29Throat 0.27 0.49 0.32Voice box 0.05 0.46 0.27
26 H. van Oostendorp et al.
Dow
nloa
ded
by [
RM
IT U
nive
rsity
] at
09:
52 1
9 A
ugus
t 201
4
0.05 for CoLiDeS; 0.55; 0.57; 0.46 for the high-relevance picture condition, and 0.22; 0; 0.27 for thelow-relevance picture condition within CoLiDeS þPic) and this was done for all eight goals. The totalnumber of similarity measures for all eight goals was20 (considering two goals for each level and four levelsof depth). It was found that the average similaritymeasure for CoLiDeS was 0.34 (SD ¼ 0.21), CoLiDeSPic under highly relevant picture condition was 0.45(SD ¼ 0.11) and under lowly relevant picture condi-tion was 0.22 (SD ¼ 0.16). F (2, 57) ¼ 9.37,p 5 0.001. Post hoc tests show significant differencesbetween all three groups: CoLiDeS and CoLiDeS þPic with highly relevant pictures (t (19) ¼ –2.45,p 5 0.05); CoLiDeS and CoLiDeS þ Pic with lowlyrelevant pictures (t (19) ¼ 3.5, p 5 0.01) and Co-LiDeS þ Pic with high- and low-relevant pictures (t(19) ¼ 7.17, p 5 0.001). These outcomes indicate thatCoLiDeS þ Pic under the highly relevant picturecondition gives the best performance in terms ofsimilarity measure, and CoLiDeS þ Pic under thelowly relevant picture condition yields the poorestperformance.
While average similarity gives us a measure of thestrength of each choice made by the models, it does notgive us any information about the degree in whichtask-relevant hyperlinks are predicted by the models.We next analyse how many times the model-predictedchoice was also task relevant using two measures:frequency of predicting the shortest path and fre-quency of predicting the hyperlinks on the shortestpath at each level.
c. Frequency of predicting the shortest navigation path.A model is considered successful in predicting theshortest navigation path to a goal if it correctlypredicts all the hyperlinks on the shortest path to therequested information. So the behaviour of (i.e. thechoices made by) the model is compared to the choicesthat should be made to find the requested information.This implies that all hyperlinks on the path shouldsatisfy the criterion of having a similarity measure of atleast 0.8 times the highest similarity measure (Black-mon et al. 2007). Consider the example goal: in therespiratory system, what name is given to the valve thatdrops down when we swallow in order to protect ourlungs and trachea? Here, the shortest navigation path isHome: Introduction 4 Respiratory System 4 Headand Neck region 4 Voice Box. Only CoLiDeS þ Pic(under the highly relevant picture condition) predictsall three links on the shortest path. CoLiDeS pickswrong links at levels 2 and 3. Therefore, the scorecorresponding to this goal for CoLiDeS is 0 and 1 forCoLiDeS þ Pic under the highly relevant picturecondition and 0 for CoLiDeS þ Pic under the lowly
relevant picture condition. Similar computations weremade for other goals and the frequency of predictingthe shortest path was computed for each model. Sincewe had eight goals, the maximum possible frequencyvalue is 8 and the minimum value is 0. We found thatCoLiDeS predicts the shortest navigation path forthree goals. When information from highly relevantpictures is included, the shortest navigation path forseven goals is correctly predicted by CoLiDeS þ Pic.However, with lowly relevant pictures, CoLiDeS þ Piccorrectly predicts the shortest navigation path for onlytwo goals. Thus, semantic information from highlyrelevant pictures is enhancing the predictive capacity ofCoLiDeS.
d. Frequency of predicting the hyperlinks on the shortestnavigation path at each level. This measure is lessstringent than the measure in the previous section. Wenow computed the number of times each modelpredicts a hyperlink on the shortest path at each level.A model is considered to have predicted the hyperlinkon the shortest path at a particular level if it gives thehighest similarity measure for it at that level. Since wehad eight goals, two for each of the four levels, themaximum frequency value is 20 and minimum value is0. For the example goal: in the respiratory system, whatname is given to the valve that drops down when weswallow in order to protect our lungs and trachea? thefrequencies are 1 for CoLiDeS, 3 for CoLiDeS þ Picunder the highly relevant picture condition and 2 forCoLiDeS þ Pic under the lowly relevant picturecondition. Similar computations were made for othergoals. CoLiDeS þ Pic under high-relevance picturecondition predicts the hyperlinks on the shortest path19 out of 20 times, under low relevance picturecondition 14 out of 20 times. CoLiDeS (with nopictures) predicts 13 out of 20 times.
In summary, the results of the simulations witheight goals show that CoLiDeS þ Pic under the highlyrelevant picture condition is able to choose thehyperlinks on the shortest path more often, and alsothe shortest path is found more frequently. Further-more, the choices within CoLiDeS þ Pic under thehighly relevant picture condition are made with greaterstrength (in terms of semantic similarity) than in theother models.
4. Conclusions and discussion
We argued for the importance of the inclusion ofsemantic information from pictures into cognitivemodels of web-navigation. Based on the existingliterature on the impact of graphics in web-navigationand the role of pictures in other domains such asmultimedia learning, visual search and cognitive load
Behaviour & Information Technology 27
Dow
nloa
ded
by [
RM
IT U
nive
rsity
] at
09:
52 1
9 A
ugus
t 201
4

theory, we came up with an augmented model ofCoLiDeS called CoLiDeS þ Pic which considerssemantic information from a picture presented on apage in addition to the semantic information in thehyperlink text in predicting user behaviour. We gave adetailed explanation of the cognitive processing ofinformation from pictures in CoLiDeS þ Pic. Basedon our assumption about the stage at which thesemantic information from pictures is encoded in theuser memory, we illustrated three different scenariosthat can arise during the parsing phase of CoLiDeS þPic: Scenario 1 when the picture itself forms one of thetop-level schematic regions and is focused upon,Scenario 2 in which the picture is encoded inside oneof the top level schematic regions (which is also theregion the user has to focus on to reach his or hertarget), and Scenario 3 in which the picture is encodedinside a top-level schematic region that is not theregion the user has to focus on to reach his or hertarget information. In the implementation of CoLiDeSþ Pic, we used a better heuristic on the basis ofBlackmon et al. (2007) to get more accurate modelpredictions (User behaviour predictions will be exam-ined in another article in this issue).
We described the methodology and the stepsinvolved in the implementation of CoLiDeS þ Picand performed a simulation with a detailed example.The results confirm our hypothesis that the presence ofsemantically related pictures close to the context wouldsignificantly change the goal-link similarity. It alsohappens that CoLiDeS þ Pic under the highly relevantpicture condition predicts the hyperlinks on the short-est path more frequently and with significantly greaterinformation scent than CoLiDeS. Conversely, Co-LiDeS þ Pic under the lowly relevant picture condi-tion leads to a significant lower performance (in termsof semantic similarity) than CoLiDeS because theirrelevant pictures introduce distracting information.These results concur with the results regarding theinfluence of relevancy found in other domains such asmultimedia learning, cognitive load theory and visualsearch.
Next, we would like to distinguish differentrelationships that can exist between the scent of apicture and the scent of a link and discuss whatadditional impasses CoLiDeS þ Pic may face and howusers may react to them.
(a) Weak scent hyperlink þ weak scent picture:both the hyperlink text as well the pictureshave weak scent. The user cannot get anyadditional useful information from picturesthat could disambiguate the hyperlinks andgive more clarity as to which hyperlink iscorrect. Under the no picture condition, the
goal relevance of ‘Head and Neck region’ was0. Adding additional semantic informationfrom a lowly relevant picture (rusted ironmetal) made no effective difference in the goalrelevance.
(b) Strong scent hyperlink þ weak scent picture:the information scent associated with thehyperlink text is pretty strong, but the corre-sponding picture has a weak scent. This couldpotentially reduce the overall scent of thehyperlinks and lead the user back to an impasse(a) above. In the no picture condition, the goalrelevance of ‘Chest region’ was 0.37 which wasstrong. Adding additional semantic informa-tion from a lowly relevant picture (rusted ironmetal) reduced the goal relevance to a very lowvalue of 0.03.
(c) Increasing information scent of all hyperlinks:adding semantic information from picturescould increase the relevance of all the hyper-links, thereby creating the opposite scenario of(a). At Level 3 in Table 2, both highly relevantand lowly relevant pictures increased theinformation scent of all three hyperlinks. Insuch a scenario, users would pick any one ofthem with equal probability.
(d) Unfamiliar picture: just as using technical termsthat are beyond the knowledge of the user isnot useful, though they give high informationscent, it is also not useful to use pictures thatare meaningless to the users. An unfamiliarpicture is as good as having no picture, if notworse.
The current version of CoLiDeS þ Pic is devel-oped to model user-behaviour only. It is possible todevelop a tool that can identify the above-mentionedproblems (a)–(d) based on CoLiDeS þ Pic. Also,CoLiDeS þ Pic assumed the presence of only onepicture on a web-page. Another limitation is ofcourse that we used only a mock-up website and nota real one. Also the main topic of our mock-upwebsite was the human body. It would be interestingto replicate this study on real websites and also onother domains than that of human body. Thecomplexity of the cognitive mechanisms processingthe semantic information from pictures during theattention phase and also the computation of in-formation scent increases with the number ofpictures. It would be interesting to explore thisdirection and investigate when, how and whichpicture is focused upon when there is more thanone picture on a web-page. Another important nextquestion is how correct are the predictions made byCoLiDeS þ Pic? That is, in the absence of pictures,
28 H. van Oostendorp et al.
Dow
nloa
ded
by [
RM
IT U
nive
rsity
] at
09:
52 1
9 A
ugus
t 201
4

would actual users also select the links as predictedby CoLiDeS at Levels 2 and 3 in Table 3? Wouldusers pick the three links at Level 3 with equalprobability as predicted by CoLiDeS þ Pic under thehighly and the lowly relevant picture conditions?These questions are investigated elsewhere (seeKaranam et al. this issue).
References
Ainsworth, S. and Loizou, A.T., 2003. The effects of self-explaining when learning with text or diagrams. CognitiveScience, 27 (4), 669–681.
Blackmon, M.H., et al., 2007. Automating usability evalua-tion: cognitive walkthrough for the web puts LSA towork on real-world HCI design problems. In: T.K.Landauer, D.S. McNamara, S. Dennis, and W. Kintsch,eds. Handbook of latent semantic analysis. Mahwah, NJ:Lawrence Erlbaum Associates, 345–375.
Brumby, D.P. and Howes, A., 2008. Strategies for guidinginteractive search: an empirical investigation into theconsequences of label relevance for assessment andselection. Human–Computer Interaction, 23, 1–46.
Budiu, R. and Anderson, J.R., 2004. Interpretation-basedprocessing: a unified theory of semantic sentencecomprehension. Cognitive Science, 28, 1–44.
Chang, S.F., et al., 1997. Visual information retrieval fromlarge distributed online repositories. Communications ofthe ACM, 40 (12), 63–71.
Chi, E.H., Pirolli, P., and Pitkow, J., 2000. The scent of a site:a system for analyzing and predicting information scent,usage, and usability of a website. In: Proceedings of CHI2000, 1–6 April, The Hague, The Netherlands. NewYork: ACM Press, 161–168.
Chi, E.H., et al., 2001. Using information scent to modeluser information needs and actions and the Web. In:Proceedings of CHI 2001, 31 March–5 April, Seattle,WA. New York: ACM Press, 490–497.
De Jong, T. and Van der Hulst, A., 2002. The effects ofgraphical overviews on knowledge acquisition in hyper-text. Journal of Computer Assisted Learning, 18 (2),219–231.
Desimone, R. and Duncan, J., 1995. Neural mechanisms ofselective visual attention. Annual Review of Neuroscience,18, 193–222.
Enser, P.G., et al., 2007. Facing the reality of semanticimage retrieval. Journal of Documentation, 63 (4), 465–481.
Fu, W. and Pirolli, P., 2007. SNIF-ACT: a cognitive modelof user navigation on the World Wide Web. Human-Computer Interaction, 22 (4), 355–412.
Ginns, P., 2006. Integrating information: a meta-analysis ofthe spatial contiguity and temporal contiguity effects.Learning and Instruction, 16, 511–525.
Hegarty, M. and Just, J.A., 1993. Constructing mentalmodels of machines from text and diagrams. Journal ofMemory and Language, 32 (6), 717–742.
Hinesley, G.A., 2005. The impact of graphical conventions andlayout location on search for web-page widgets. Unpub-lished dissertation, University of Colorado, Boulder,USA.
Hinesley, G.A. and Blackmon, M.H., 2008. The impact ofgraphics and location expectations on the search for web-page widgets. In: Workshop on cognition and the web, 24–26 April, Granada, Spain.
Juvina, I., et al., 2005. Toward modeling contextualinformation in web navigation. In: 27th annual conferenceof the cognitive science society, 21–23 July, Stresa, Italy.
Juvina, I. and van Oostendorp, H., 2008. Modeling semanticand structural knowledge in web navigation. DiscourseProcesses, 45 (4–5), 346–364.
Karanam, S., et al., 2009. Integrating graphical informationinto cognitive modeling of web-navigation. In: 31stannual conference of the cognitive science society, 29July–1 August, Amsterdam, The Netherlands.
Karanam, S., et al., 2010. Impact of placing picture iconsnext to hyperlinks on information retrieval tasks on theweb. In: Annual meeting of the cognitive science society(CogSci 2010), 11–14 August, Portland, OR, USA.
Karanam, S., et al., in press. Embedding semantic informa-tion from pictures into cognitive modeling of web-navigation. European Review of Applied Psychology.
Karanam, S., van Oostendorp, H., and Indurkhya, B., thisissue. Evaluating CoLiDeS þ Pic: the role of relevance ofpictures in user navigation behavior. Special issue oncognitive modeling of web-navigation. Behavior andInformation Technology.
Kintsch, W., 1998. Comprehension: a paradigm for cognition.Cambridge: Cambridge University Press.
Kitajima, M., Blackmon, M.H., and Polson, P.G., 2000. Acomprehension-based model of web navigation and itsapplication to web usability analysis. In: S. McDonald,Y. Waern, and G. Cockton, eds. People and computersXIV – Usability or else!, Proceedings of HCI 2000, 5–8September, Sunderland, UK. Berlin: Springer-Verlag,357–373.
Kitajima, M., Blackmon, M.H., and Polson, P.G., 2005.Cognitive architecture for website design and usabilityevaluation: comprehension and information scent inperforming by exploration. In: Proceedings of HCI-International 2005, 22–27 July, Las Vegas, NV, USA.
Kitajima, M. and Polson, P.G., 1992. A computationalmodel of skilled use of a graphical user interface. In:Proceedings of CHI 1992, 3–7 May, Monterey, CA,USA. New York: ACM, 241–249.
Kitajima, M. and Polson, P.G., 1995. A comprehension-based model of correct performance and errors inskilled, display-based human–computer interaction. In-ternational Journal of Human–Computer Studies, 43 (1),65–99.
Landauer, T.K., Foltz, P.W., and Laham, D., 1998. Anintroduction to latent semantic analysis. DiscourseProcesses, 25 (2), 259–284.
Larkin, J.H. and Simon, H.A., 1987. Why a diagram is(sometimes) worth ten thousand words. CognitiveScience, 11, 65–99.
Levie, H.W. and Lentz, R., 1982. Effect of text illustrations:A review of research. Educational Communication andTechnology Journal, 30, 195–232.
Mayer, R.E. and Moreno, R., 2003. Nine ways to reducecognitive load in multimedia learning. EducationalPsychologist, 38 (1), 43–52.
Mayer, R.E. and Moreno, R., 2004. Animation as an aid tomultimedia learning. Journal of Educational PsychologyReview, 14 (1), 87–99.
Pirolli, P. and Card, S.K., 1999. Information foraging.Psychological Review, 106 (4), 643–675.
Pirolli, P. and Fu, W.T., 2003. SNIF-ACT: a model ofinformation foraging on the World Wide Web. In: 9thinternational conference on user modeling, Johnstown,PA. Berlin: Springer Verlag; 2003; LNCS 2702, 45–54.
Behaviour & Information Technology 29
Dow
nloa
ded
by [
RM
IT U
nive
rsity
] at
09:
52 1
9 A
ugus
t 201
4

Shimada, H. and Kitajima, M., 2006. Why do illustrationspromote text comprehension? Motivation effect andelaboration effect. In: 5th international conference of thecognitive science, 26–29 July, Vancouver, BC, Canada.
Smeulders, A.W.M., et al., 2002. Content-based imageretrieval at the end of the early years. IEEE Transactionson Pattern Analysis and Machine Intelligence, 22 (12),1349–1380.
Sweller, J. and Chandler, P., 1994. Why some material isdifficult to learn. Cognition and Instruction, 12, 185–233.
Treisman, A.M. and Gelade, G., 1980. A feature integrationtheory of attention. Cognitive Psychology, 12, 97–136.
Treisman, A.M. and Gormican, S., 1988. Feature analysis inearly vision: evidence from search asymmetries. Psycho-logical Review, 95 (1), 15–48.
van Oostendorp, H., Madrid, R.I., and Puerta Melguizo,M.C., 2009. The effect of menu type and task complexityon information retrieval performance. Ergonomics OpenJournal, 64–71.
Zhao, R. and Grosky, W.I., 2002. Bridging the semantic gapin image retrieval. In: T.K. Shih, ed. Distributed multi-media databases: techniques and applications. Hershey,PA: Idea Group Publishing, 14–36.
Appendix 1. User goals and their shortest
navigation paths
Goal 1
Imagine that you are navigating through a website on humanbody. Your task is to find answer for this question – ‘Whichcenter in the brain controls the automatic process ofbreathing?’
Home: Introduction 4 Respiratory System
Goal 2
Imagine that you are navigating through a website on humanbody. Your task is to find answer for this question – ‘Themuscles of the oesophagus contract in waves to move thefood down into the stomach. What name is given to thesecontractions?’
Home: Introduction 4 Digestive System
Goal 3
Imagine that you are navigating through a website on humanbody. Your task is to find answer for this question – ‘Nameat least three chemicals that aid in transmission ofinformation from one neuron to the other in our nervoussystem’
Home: Introduction 4 Nervous System 4 Nerve Cells
Goal 4
Imagine that you are navigating through a website on humanbody. Your task is to find answer for this question –‘Lymphatic System contains immune cells calledlymphocytes, which protect our body from antigens. Theyare produced by lymph nodes. Name at least three locationsin the body where lymph nodes are present.’
Home: Introduction 4 Circulatory System 4 LymphaticSystem
Goal 5
Imagine that you are navigating through a website on humanbody. Your task is to find answer for this question – ‘In therespiratory system, what name is given to the valve thatdrops down when we swallow in order to protect our lungsand trachea?’
Home: Introduction 4 Respiratory System 4 Headand Neck Region 4 Voice Box
Goal 6
Imagine that you are navigating through a website on humanbody. Your task is to find answer for this question – ‘Namethe three layers of tissue that form the heart wall’
Home: Introduction 4 Circulatory System 4 Cardio-vascular System 4 Heart
Goal 7
Imagine that you are navigating through a website on humanbody. Your task is to find answer for this question – ‘Whatspecific name is given to those motor neurons that act on themuscles of the face and the neck?’
Home: Introduction 4 Nervous System 4 Nerve Cells4 Motor Neurons 4 Classification
Goal 8
Imagine that you are navigating through a website onhuman body. Your task is to find answer for this question –‘If a blood sample contains A-antigens and anti-Bantibodies, what name is given to this according to ABOsystem?’
Home: Introduction 4 Circulatory System 4 Cardio-vascular System 4 Blood 4 Blood Groups
30 H. van Oostendorp et al.
Dow
nloa
ded
by [
RM
IT U
nive
rsity
] at
09:
52 1
9 A
ugus
t 201
4