cold-rolled steel flat products from brazil, china, … · cold-rolled steel flat products from...
TRANSCRIPT

U.S. International Trade CommissionPublication 4564 September 2015
Washington, DC 20436
Cold-Rolled Steel Flat Products from Brazil, China, India, Japan, Korea, Netherlands,
Russia, and the United Kingdom
Investigation Nos. 701-TA-540-544 and 731-TA-1283-1290 (Preliminary)

U.S. International Trade Commission
COMMISSIONERS
Meredith M. Broadbent, Chairman Dean A. Pinkert, Vice Chairman
Irving A. Williamson David S. Johanson
F. Scott Kieff Rhonda K. Schmidtlein
Catherine DeFilippo
Staff assigned
Address all communications to Secretary to the Commission
United States International Trade Commission Washington, DC 20436
Director of Operations
Nathanael Comly, Investigator Karen Taylor, Industry Analyst
Aimee Larsen, Economist Andrew Knipe, Economist Charles Yost, Accountant
Lita David-Harris, Statistician Carolyn Holmes, Statistical Assistant
Michael Haldenstein, Attorney Douglas Corkran, Supervisory Investigator
U.S. International Trade CommissionWashington, DC 20436
www.usitc.gov
Publication 4564 September 2015
Cold-Rolled Steel Flat Products from Brazil, China, India, Japan, Korea, Netherlands,
Russia, and the United Kingdom
Investigation Nos. 701-TA-540-544 and 731-TA-1283-1290 (Preliminary)


CONTENTS Page
i
Determinations ............................................................................................................................... 1 Views of the Commission ............................................................................................................... 3
Part I: Introduction .............................................................................................................. I-1
Background ................................................................................................................................ I-1
Statutory criteria and organization of the report ..................................................................... I-1
Statutory criteria ................................................................................................................... I-1
Organization of report ........................................................................................................... I-3
Market summary ....................................................................................................................... I-3
Summary data and data sources ............................................................................................... I-4
Previous and related investigations .......................................................................................... I-5
Safeguard investigations ....................................................................................................... I-8
Nature and extent of alleged subsidies and sales at LTFV ........................................................ I-8
Alleged subsidies ................................................................................................................... I-8
Alleged sales at LTFV ........................................................................................................... I-16
The subject merchandise ........................................................................................................ I-17
Commerce’s scope .............................................................................................................. I-17
Tariff treatment ................................................................................................................... I-19
The product ............................................................................................................................. I-20
Description and applications ............................................................................................... I-20
Manufacturing processes .................................................................................................... I-21
Domestic like product issues ................................................................................................... I-22
Physical characteristics and uses ......................................................................................... I-22
Manufacturing facilities and production employees .......................................................... I-23
Interchangeability ................................................................................................................ I-23
Customer and producer perceptions .................................................................................. I-23
Channels of distribution ...................................................................................................... I-24
Price ..................................................................................................................................... I-24
CONTENTS Page
ii
Part II: Conditions of competition in the U.S. market........................................................... II-1
U.S. market characteristics....................................................................................................... II-1
Channels of distribution ........................................................................................................... II-1
Geographic distribution ........................................................................................................... II-3
Supply and demand considerations ......................................................................................... II-4
U.S. supply ............................................................................................................................ II-4
U.S. demand ....................................................................................................................... II-11
Substitutability issues ............................................................................................................. II-16
Lead times .......................................................................................................................... II-16
Comparison of U.S.-produced and imported cold-rolled steel .......................................... II-16
Part III: U.S. producers’ production, shipments, and employment ...................................... III-1
U.S. producers ......................................................................................................................... III-1
Tolling operations and joint ventures ................................................................................. III-3
Changes in operations ......................................................................................................... III-3
U.S. production, capacity, and capacity utilization ................................................................. III-6
Alternative products ............................................................................................................ III-7
U.S. producers’ U.S. shipments and exports ........................................................................... III-8
Captive consumption ............................................................................................................ III-10
Internal transfers and merchant market sales .................................................................. III-10
First statutory criterion in captive consumption ............................................................... III-10
Second statutory criterion in captive consumption .......................................................... III-11
U.S. producers’ inventories ................................................................................................... III-11
U.S. producers’ imports and purchases ................................................................................ III-12
U.S. employment, wages, and productivity .......................................................................... III-13

CONTENTS Page
iii
Part IV: U.S. imports, apparent U.S. consumption, and market shares ................................ IV-1
U.S. importers.......................................................................................................................... IV-1
U.S. imports ............................................................................................................................. IV-1
Negligibility .............................................................................................................................. IV-6
Cumulation considerations ..................................................................................................... IV-9
Fungibility ............................................................................................................................ IV-9
Presence in the market ..................................................................................................... IV-10
Geographical markets ....................................................................................................... IV-10
Apparent U.S. consumption .................................................................................................. IV-14
Merchant market ............................................................................................................... IV-15
U.S. market shares ................................................................................................................ IV-17
Merchant market ............................................................................................................... IV-19
Part V: Pricing data ............................................................................................................. V-1
Factors affecting prices ............................................................................................................ V-1
Raw material costs ............................................................................................................... V-1
Energy costs .......................................................................................................................... V-2
U.S. inland transportation costs ........................................................................................... V-3
Pricing practices ....................................................................................................................... V-4
Pricing methods .................................................................................................................... V-4
Sales terms and discounts .................................................................................................... V-6
Price data .................................................................................................................................. V-7
Price trends ......................................................................................................................... V-18
Price comparisons .............................................................................................................. V-20
Lost sales and lost revenue .................................................................................................... V-22

CONTENTS Page
iv
Part VI: Financial experience of U.S. producers .................................................................. VI-1
Background .............................................................................................................................. VI-1
Operations on cold-rolled steel ............................................................................................... VI-1
Variance analysis ............................................................................................................... VI-11
Capital expenditures and research and development (R&D) expenses ............................... VI-15
Assets and return on assets .................................................................................................. VI-16
Capital and investment ......................................................................................................... VI-19
Part VII: Threat considerations and information on nonsubject countries .......................... VII-1
The industry in Brazil .............................................................................................................. VII-3
Overview ............................................................................................................................. VII-3
Changes in operations ........................................................................................................ VII-3
Operations on cold-rolled steel .......................................................................................... VII-4
Alternative products ........................................................................................................... VII-5
Exports ................................................................................................................................ VII-5
The industry in China .............................................................................................................. VII-7
Overview ............................................................................................................................. VII-7
Exports ................................................................................................................................ VII-7
The industry in India ............................................................................................................... VII-9
Overview ............................................................................................................................. VII-9
Changes in operations ........................................................................................................ VII-9
Operations on cold-rolled steel .......................................................................................... VII-9
Alternative products ......................................................................................................... VII-10
Exports .............................................................................................................................. VII-10

CONTENTS Page
v
Part VII: Threat considerations and information on nonsubject countries--Continued
The industry in Japan ........................................................................................................... VII-12
Overview ........................................................................................................................... VII-12
Changes in operations ...................................................................................................... VII-13
Operations on cold-rolled steel ........................................................................................ VII-13
Alternative products ......................................................................................................... VII-14
Exports .............................................................................................................................. VII-15
The industry in Korea ........................................................................................................... VII-17
Overview ........................................................................................................................... VII-17
Changes in operations ...................................................................................................... VII-18
Operations on cold-rolled steel ........................................................................................ VII-18
Alternative products ......................................................................................................... VII-19
Exports .............................................................................................................................. VII-19
The industry in the Netherlands .......................................................................................... VII-21
Overview ........................................................................................................................... VII-21
Changes in operations ...................................................................................................... VII-21
Operations on cold-rolled steel ........................................................................................ VII-22
Alternative products ......................................................................................................... VII-22
Exports .............................................................................................................................. VII-22
The industry in Russia .......................................................................................................... VII-24
Overview ........................................................................................................................... VII-24
Changes in operations ...................................................................................................... VII-24
Operations on cold-rolled steel ........................................................................................ VII-25
Alternative products ......................................................................................................... VII-25
Exports .............................................................................................................................. VII-26

CONTENTS Page
vi
Part VII: Threat considerations and information on nonsubject countries--Continued
The industry in the United Kingdom .................................................................................... VII-27
Overview ........................................................................................................................... VII-27
Changes in operations ...................................................................................................... VII-27
Operations on cold-rolled steel ........................................................................................ VII-28
Alternative products ......................................................................................................... VII-28
Exports .............................................................................................................................. VII-29
The industries in the subject countries ................................................................................ VII-30
U.S. inventories of imported merchandise .......................................................................... VII-31
U.S. importers’ outstanding orders ...................................................................................... VII-31
Antidumping or countervailing duty orders in third-country markets ................................ VII-31
Information on nonsubject countries .................................................................................. VII-32
Appendixes
A. Federal Register notices ................................................................................................. A-1
B. List of conference witnesses .......................................................................................... B-1
C. Summary data ................................................................................................................ C-1
D. Nonsubject country price data ....................................................................................... D-1
E. Financial data of U.S. producers ..................................................................................... E-1
F. Monthly import data ...................................................................................................... F-1
Note.—Information that would reveal confidential operations of individual concerns may not be published and therefore has been deleted. Such deletions are indicated by asterisks.

UNITED STATES INTERNATIONAL TRADE COMMISSION
Investigation Nos. 701-TA-540-544 and 731-TA-1283-1290 (Preliminary)
Cold-Rolled Steel Flat Products from Brazil, China, India, Japan, Korea, Netherlands, Russia, and the United Kingdom
DETERMINATIONS
On the basis of the record1 developed in the subject investigations, the United States International Trade Commission (“Commission”) determines,2 pursuant to the Tariff Act of 1930 (“the Act”), that there is a reasonable indication that an industry in the United States is materially injured by reason of imports of cold-rolled steel flat products from Brazil, China, India, Japan, Korea, Russia, and the United Kingdom, provided for in subheadings 7209.15, 7209.16, 7209.17, 7209.18, 7209.25, 7209.26, 7209.27, 7209.28, 7209.90, 7210.70, 7211.23, 7211.29, 7211.90, 7212.40, 7225.50, 7225.99, and 7226.92 of the Harmonized Tariff Schedule of the United States, that are allegedly sold in the United States at less than fair value (“LTFV”), and by imports of cold-rolled steel flat products that are allegedly subsidized by the governments of Brazil, China, Korea, and Russia. The Commission also determines, pursuant to the Act, that there is a reasonable indication that an industry in the United States is threatened with material injury by reason of imports of cold-rolled steel flat products that are allegedly subsidized by the government of India.
The Commission further determines that imports of cold-rolled steel flat products from the Netherlands are negligible pursuant to section 771(24) of the Act, and its investigation with regard to cold-rolled steel flat products from this country is thereby terminated pursuant to section 733(a)(1) of the Act.
COMMENCEMENT OF FINAL PHASE INVESTIGATIONS
Pursuant to section 207.18 of the Commission’s rules, the Commission also gives notice of the commencement of the final phase of its investigations. The Commission will issue a final phase notice of scheduling, which will be published in the Federal Register as provided in section 207.21 of the Commission’s rules, upon notice from the Department of Commerce (“Commerce”) of affirmative preliminary determinations in the investigations under sections 703(b) or 733(b) of the Act, or, if the preliminary determinations are negative, upon notice of affirmative final determinations in those investigations under sections 705(a) or 735(a) of the Act. Parties that filed entries of appearance in the preliminary phase of the investigations need not enter a separate appearance for the final phase of the investigations. Industrial users, and, if the merchandise under investigation is sold at the retail level, representative consumer organizations have the right to appear as parties in Commission antidumping and countervailing duty investigations. The Secretary will prepare a public service list containing
1 The record is defined in sec. 207.2(f) of the Commission’s Rules of Practice and Procedure (19 CFR § 207.2(f)).
2 Commissioner F. Scott Kieff not participating.

the names and addresses of all persons, or their representatives, who are parties to the investigations.
BACKGROUND
On July 28, 2015, AK Steel Corporation (West Chester, Ohio), ArcelorMittal USA LLC (Chicago, Illinois), Nucor Corporation (Charlotte, North Carolina), Steel Dynamics, Inc. (Fort Wayne, Indiana), and United States Steel Corporation (Pittsburgh, Pennsylvania) filed a petition with the Commission and Commerce, alleging that an industry in the United States is materially injured or threatened with material injury by reason of subsidized imports of cold-rolled steel flat products from Brazil, China, India, Korea, and Russia and LTFV imports of cold-rolled steel flat products from Brazil, China, India, Japan, Korea, Netherlands, Russia, and the United Kingdom. Accordingly, effective July 28, 2015, the Commission, pursuant to sections 703(a) and 733(a) of the Tariff Act of 1930 (19 U.S.C. §§ 1671b(a) and 1673b(a)), instituted countervailing duty investigation Nos. 701-TA-540-544 and antidumping duty investigation Nos. 731-TA-1283-1290 (Preliminary).
Notice of the institution of the Commission’s investigations and of a public conference to be held in connection therewith was given by posting copies of the notice in the Office of the Secretary, U.S. International Trade Commission, Washington, DC, and by publishing the notice in the Federal Register of August 3, 2015 (80 FR 46047). The conference was held in Washington, DC, on August 18, 2015, and all persons who requested the opportunity were permitted to appear in person or by counsel.

3
Views of the Commission I.
Based on the record in the preliminary phase of these investigations, we find that there is a reasonable indication that an industry in the United States is materially injured by reason of imports of cold-rolled steel flat products (“cold-rolled steel”) from Brazil, China, India, Japan, Korea, Russia, and the United Kingdom that are allegedly sold in the United States at less than fair value (“LTFV”) and that are allegedly subsidized by the governments of Brazil, China, Korea, and Russia. We further find that there is a reasonable indication that an industry in the United States is threatened with material injury by reason of imports of cold-rolled steel that are allegedly subsidized by the government of India. We also determine that imports of cold-rolled steel from the Netherlands that are allegedly sold in the United States at LTFV are negligible.1
The Legal Standard for Preliminary Determinations II.
The legal standard for preliminary antidumping and countervailing duty determinations requires the Commission to determine, based upon the information available at the time of the preliminary determinations, whether there is a reasonable indication that a domestic industry is materially injured or threatened with material injury, or that the establishment of an industry is materially retarded, by reason of the allegedly unfairly traded imports.2 In applying this standard, the Commission weighs the evidence before it and determines whether “(1) the record as a whole contains clear and convincing evidence that there is no material injury or threat of such injury; and (2) no likelihood exists that contrary evidence will arise in a final investigation.”3
Background III.
The petitions in these investigations were filed on July 28, 2015 by five domestic cold-rolled steel producers: AK Steel Corporation (West Chester, Ohio) (“AK Steel”), ArcelorMittal USA LLC (Chicago, Illinois) (“ArcelorMittal”), Nucor Corporation (Charlotte, North Carolina) (“Nucor”), Steel Dynamics, Inc. (Fort Wayne, Indiana) (“Steel Dynamics”) , and United States Steel Corporation (Pittsburgh, Pennsylvania) (“U.S. Steel”). Representatives of each petitioner appeared at the staff conference and each submitted a postconference brief.4 Additionally,
1 Commissioner Kieff did not participate in these investigations. 2 19 U.S.C. §§ 1671b(a), 1673b(a) (2000); see also American Lamb Co. v. United States, 785 F.2d
994, 1001-04 (Fed. Cir. 1986); Aristech Chem. Corp. v. United States, 20 CIT 353, 354-55 (1996). No party argues that the establishment of an industry in the United States is materially retarded by the allegedly unfairly traded imports.
3 American Lamb Co., 785 F.2d at 1001; see also Texas Crushed Stone Co. v. United States, 35 F.3d 1535, 1543 (Fed. Cir. 1994).
4 Another domestic producer of cold-rolled steel, California Steel Industries (“CSI”), filed a joint brief with petitioner Steel Dynamics.

4
USS-POSCO Industries (“UPI”), a domestic producer, appeared at the conference and submitted a postconference brief in support of the petitions.
Several respondent entities participated in these investigations. Companhia Siderurgica Nacional, a Brazilian producer and exporter of cold-rolled steel, and Companhia Siderurgica Nacional, LLC, a U.S. producer and importer of cold-rolled steel (collectively, "CSN") appeared at the conference and submitted a postconference brief. Japanese producers and exporters Nippon Steel & Sumitomo Metal Corporation; JFE Steel Corporation; Kobe Steel Ltd. and Nisshin Steel Co., Ltd. (collectively, “Japanese Respondents”) appeared at the staff conference and submitted a joint postconference brief. The Korea Iron and Steel Association, whose members are producers of subject merchandise in Korea, and two subject producers in Korea, POSCO and Hyundai Steel Co., Ltd., (collectively, "Korean Respondents") appeared at the staff conference and submitted a joint postconference brief. Representatives of Tata Steel Netherlands BV (“Tata Netherlands”) and Tata Steel U.K. Ltd. (“Tata U.K.”), producers and exporters of subject merchandise in the Netherlands and United Kingdom, respectively, appeared at the conference and filed postconference briefs. A representative from the Ministry of Economic Development of the Russian Federation appeared at the conference and submitted a postconference brief. Finally, a representative from the Brazilian Embassy appeared at the conference but did not file a brief.
U.S. industry data are based on the questionnaire responses of 12 domestic producers accounting for the vast majority of U.S. production of cold-rolled steel during 2014.5 U.S. import data are based on official Commerce import statistics adjusted to include alloy cold-rolled steel data collected separately in questionnaire responses.6 Questionnaire responses were received from 50 importers, representing 93.7 percent of U.S. imports under the non-alloy cold-rolled steel HTS numbers from Brazil, 77.1 percent from China, 62.4 percent from India, 95.8 percent from Japan, 94.3 percent from Korea, 99.7 percent from the Netherlands, 65.5 percent from Russia and 99.2 percent from United Kingdom between January 2012 and May 2015.7
Producers in seven of the eight subject countries submitted questionnaire responses. With respect to Brazil, three responding firms accounted for *** production capacity and *** percent of U.S. imports.8 With respect to India, one responding firm accounted for *** percent of capacity and all U.S. imports.9 Japanese industry data are based on five responding firms that accounted for *** percent of capacity and *** percent of U.S. imports.10 Korean industry data are based on four responding firms that accounted for *** percent of capacity and *** percent of U.S. imports.11 With respect to the Netherlands, one
5 Confidential Report (“CR”) at III-1, Public Report (“PR” at III-1). Three of these firms *** by the domestic industry. CR/PR at VI-1.
6 CR/PR at IV-1. 7 CR/PR at IV-1. May 2015 was the most recent month for which comparable data were
available. 8 CR at VII-3, PR at VII-3. 9 CR at VII-13, PR at VII-9. 10 CR at VII-19, PR at VII-12. 11 CR at VII-25, PR at VII-17.

5
responding firm accounted for all capacity and *** percent of U.S. imports.12 Russian industry data are based on two responding firms that accounted for *** percent of capacity and all imports.13 With respect to the United Kingdom, one responding firm accounted for all confirmed capacity and *** percent of imports.14 No producers or exporters from China submitted responses to the foreign producer questionnaires.15
Domestic Like Product IV.
In determining whether there is a reasonable indication that an industry in the United States is materially injured or threatened with material injury by reason of imports of the subject merchandise, the Commission first defines the “domestic like product” and the “industry.”16 Section 771(4)(A) of the Tariff Act of 1930, as amended (“the Tariff Act”), defines the relevant domestic industry as the “producers as a whole of a domestic like product, or those producers whose collective output of a domestic like product constitutes a major proportion of the total domestic production of the product.”17 In turn, the Tariff Act defines “domestic like product” as “a product which is like, or in the absence of like, most similar in characteristics and uses with, the article subject to an investigation.”18
The decision regarding the appropriate domestic like product(s) in an investigation is a factual determination, and the Commission has applied the statutory standard of “like” or “most similar in characteristics and uses” on a case-by-case basis.19 No single factor is dispositive, and the Commission may consider other factors it deems relevant based on the facts of a particular investigation.20 The Commission looks for clear dividing lines among possible like products and disregards minor variations.21 Although the Commission must accept
12 CR at VII-31, PR at VII-21. 13 CR at VII-37, PR at VII-24. 14 CR at VII-43, PR at VII-27. 15 CR at VII-9, PR at VII-7. 16 19 U.S.C. § 1677(4)(A). 17 19 U.S.C. § 1677(4)(A). 18 19 U.S.C. § 1677(10). 19 See, e.g., Cleo Inc. v. United States, 501 F.3d 1291, 1299 (Fed. Cir. 2007); NEC Corp. v.
Department of Commerce, 36 F. Supp. 2d 380, 383 (Ct. Int’l Trade 1998); Nippon Steel Corp. v. United States, 19 CIT 450, 455 (1995); Torrington Co. v. United States, 747 F. Supp. 744, 749 n.3 (Ct. Int’l Trade 1990), aff’d, 938 F.2d 1278 (Fed. Cir. 1991) (“every like product determination ‘must be made on the particular record at issue’ and the ‘unique facts of each case’”). The Commission generally considers a number of factors including the following: (1) physical characteristics and uses; (2) interchangeability; (3) channels of distribution; (4) customer and producer perceptions of the products; (5) common manufacturing facilities, production processes, and production employees; and, where appropriate, (6) price. See Nippon, 19 CIT at 455 n.4; Timken Co. v. United States, 913 F. Supp. 580, 584 (Ct. Int’l Trade 1996).
20 See, e.g., S. Rep. No. 96-249 at 90-91 (1979). 21 See, e.g., Nippon, 19 CIT at 455; Torrington, 747 F. Supp. at 748-49; see also S. Rep. No. 96-249
at 90-91 (Congress has indicated that the like product standard should not be interpreted in “such a narrow fashion as to permit minor differences in physical characteristics or uses to lead to the (Continued…)
6
the U.S. Department of Commerce’s (“Commerce”) determination as to the scope of the imported merchandise that is subsidized and/or sold at less than fair value,22 the Commission determines what domestic product is like the imported articles Commerce has identified.23
A. Scope Definition
In its notices of initiation, Commerce defined the imported merchandise within the scope of the investigations as follows:
The products covered by these investigations are certain cold-rolled (cold-reduced), flat-rolled steel products, neither clad, plated, nor coated with metal, but whether or not annealed, painted, varnished, or coated with plastics or other non-metallic substances. The products covered include coils that have a width of 12.7 mm wide or greater, regardless of form of coil (e.g., in successively superimposed layers, spirally oscillating, etc.). The products covered also include products not in coils (e.g., in straight lengths) of a thickness less than 4.75 mm and a width that is 12.7 mm or greater and that measures at least 10 times the thickness. The products covered also include products not in coils (e.g., in straight lengths) of a thickness of 4.75 mm or more and a width exceeding 150 mm and measuring at least twice the thickness. The products described above may be rectangular, square, circular, or other shape and include products of either rectangular or non-rectangular cross-section where such cross-section is achieved subsequent to the rolling process, i.e., products which have been “worked after rolling” (e.g., products which have been beveled or rounded at the edges). For purposes of the width and thickness requirements referenced above: (1) where the nominal and actual measurements vary, a product is within the scope if application of either the nominal or actual measurement would place it within the scope based on the definitions set forth above, and
(…Continued) conclusion that the product and article are not ‘like’ each other, nor should the definition of ‘like product’ be interpreted in such a fashion as to prevent consideration of an industry adversely affected by the imports under consideration.”).
22 See, e.g., USEC, Inc. v. United States, 34 Fed. App’x 725, 730 (Fed. Cir. 2002) (“The ITC may not modify the class or kind of imported merchandise examined by Commerce.”); Algoma Steel Corp. v. United States, 688 F. Supp. 639, 644 (Ct. Int’l Trade 1988), aff’d, 865 F.3d 240 (Fed. Cir.), cert. denied, 492 U.S. 919 (1989).
23 Hosiden Corp. v. Advanced Display Mfrs., 85 F.3d 1561, 1568 (Fed. Cir. 1996) (the Commission may find a single like product corresponding to several different classes or kinds defined by Commerce); Cleo, 501 F.3d at 1298 n.1 (“Commerce’s {scope} finding does not control the Commission’s {like product} determination.”); Torrington, 747 F. Supp. at 748-52 (affirming the Commission’s determination defining six like products in investigations where Commerce found five classes or kinds).

7
(2) where the width and thickness vary for a specific product (e.g., the thickness of certain products with non-rectangular cross-section, the width of certain products with non-rectangular shape, etc.), the measurement at its greatest width or thickness applies. Steel products included in the scope of these investigations are products in which: (1) iron predominates, by weight, over each of the other contained elements; (2) the carbon content is 2 percent or less, by weight; and (3) none of the elements listed below exceeds the quantity, by weight, respectively indicated: 2.50 percent of manganese, or 3.30 percent of silicon, or 1.50 percent of copper, or 1.50 percent of aluminum, or 1.25 percent of chromium, or 0.30 percent of cobalt, or 0.40 percent of lead, or 2.00 percent of nickel, or 0.30 percent of tungsten (also called wolfram), or 0.80 percent of molybdenum, or 0.10 percent of niobium (also called columbium), or 0.30 percent of vanadium, or 0.30 percent of zirconium Unless specifically excluded, products are included in this scope regardless of levels of boron and titanium.24
24 Commerce’s scope definition further states:
For example, specifically included in this scope are vacuum degassed, fully stabilized (commonly referred to as interstitial-free (IF)) steels, high strength low alloy (HSLA) steels, and motor lamination steels. IF steels are recognized as low carbon steels with micro-alloying levels of elements such as titanium and/or niobium added to stabilize carbon and nitrogen elements. HSLA steels are recognized as steels with micro-alloying levels of elements such as chromium, copper, niobium, titanium, vanadium, and molybdenum. Motor lamination steels contain micro-alloying levels of elements such as silicon and aluminum but do not meet the definition of grain-oriented electrical steel (GOES) or non-oriented electrical steel (NOES). Furthermore, this scope also includes Advanced High Strength Steels (AHSS) and Ultra High Strength Steels (UHSS), both of which are considered high tensile strength and high elongation steels. All products that meet the written physical description, and in which the chemistry quantities do not exceed any one of the noted element levels listed above, are within
(Continued…)

8
The subject merchandise encompasses cold-rolled flat products.25 Cold-rolled steel is produced from hot-rolled steel by a rolling process at ambient temperature (“cold-rolling”) that hardens the steel and reduces its thickness.26 Unlike previous investigations of cold-rolled steel, these investigations cover both carbon and the common alloy steels for flat-rolled steel products.27
B. Arguments of the Parties
Petitioners assert that the Commission should define a single domestic like product that is coextensive with the scope of the investigations. They emphasize that the scope definition is an updated version of the one used in the 2002 investigations of cold-rolled steel in which the Commission defined a single domestic like product. They contend that there have been no significant changes in the uses, channels of distribution, or manufacturing processes of cold-rolled steel since the 2002 investigations.28
The Korean Respondents contend that black plate should be found to be a separate domestic like product.29 While recognizing that the Commission has previously found that
(…Continued)
the scope of these investigations unless specifically excluded. The following products are outside of and/or specifically excluded from the scope of these investigations: Ball bearing steels, as defined in the HTS; Tool steels, as defined in the HTS; Silicon-manganese steel, as defined in the HTS; Silicon-electrical steels, as defined in the HTS, that are GOES; Silicon-electrical steels, as defined in the HTS, that are not grain-oriented and that have a silicon level exceeding 1.00 percent and a surface oxide coating, to which an insulation coating may be applied (NOES); and Non-rectangular shapes, not in coils, which are the result of having been processed by cutting or
stamping and which have assumed the character of articles or products classified outside chapter 72 of the HTS.
Certain Cold-Rolled Steel Flat Products From Brazil, the People’s Republic of China, India, Japan, the Republic of Korea, the Netherlands, the Russian Federation, and the United Kingdom: Initiation of Less-Than-Fair-Value Investigations, 80 Fed. Reg. 51198 (Aug. 24, 2015); Certain Cold-Rolled Steel Flat Products From Brazil, India, the People’s Republic of China, the Republic of Korea, and the Russian Federation: Initiation of Countervailing Duty Investigations, 80 Fed. Reg. 51206 (Aug. 24, 2015).
25 CR at I-25, PR at I-20. 26 CR at I-26, PR at I-20. 27 Petition Vol. I at 8. 28 Petition at 18 (citing Cold-Rolled Steel Products From Australia, India, Japan, Sweden, and
Thailand, Inv. Nos. 731-TA-965, 971-972, 979, and 981 (Final), USITC Pub. 3536 at 6 (Sept. 2002)). 29 Korean Respondents’ Brief at 4-6, Exhibit 1 at 1-3. The Japanese Respondents note that they
agree with the Korean Respondents that black plate should be a separate domestic like product. Japanese Respondents Brief at 4.

9
black plate should not be defined as a separate domestic like product, Korean Respondents argue that there now is reduced availability and fewer domestic producers of black plate.30
C. Analysis
Based on the following analysis, we find that the record of the preliminary phase of these investigations does not support defining black plate as a distinct domestic like product. We accordingly define a single domestic like product consisting of all cold-rolled steel within the scope of the investigations.
Physical Characteristics and Uses. The record indicates that there is some overlap between black plate and other cold-rolled steel with respect to physical characteristics and uses. Black plate is a type of light gauge cold-rolled steel. Consequently, black plate is similar to other flat rolled carbon steel products that similarly have undergone a cold-rolling process.31 Black plate is often used to make tin mill products, but it is also used to produce toys, serving trays, building materials, and household goods.32 Black plate may also be employed to produce ***, which can also be produced with other forms of cold-rolled steel products.33 Moreover, ***.34 Therefore, there are specific overlaps in uses between black plate and other types of cold-rolled steel.
Manufacturing Facilities, Production Processes and Employees. The record indicates that black plate is made in the same facilities as other cold-rolled steel on similar equipment and with the same workers.35 Petitioners contend that black plate is simply rolled longer than other products, making it thinner.36 Double-reduced black plate has an additional cold-rolling step.37
Channels of Distribution. The record indicates that there is only one significant purchaser of black plate on the open market, and the majority of domestic production is internally consumed to produce tin mill products. Other cold-rolled steel also is internally consumed to a large extent, but it has a significant merchant market and is sold to distributors and end users.38
Interchangeability. The Korean Respondents argue that black plate and other cold-rolled steel products are not interchangeable, but U.S. Steel contends that black plate and certain other cold-rolled steel are both used to produce tin coated sheets.39 As previously discussed, the record indicates some overlap in uses, which suggests there is some degree of interchangeability between black plate and other types of cold-rolled steel.
30 Korean Respondents’ Brief at 4-6. 31 CR at I-25, PR at I-20. 32 CR at I-27 n.26, PR at I-22 n.26. 33 CR at I-26, PR at I-21; U.S. Steel Brief, Exhibit 35 (Affidavit of Douglas Matthews). 34 CR at I-26, PR at I-21; U.S. Steel Brief, Exhibit 35 (Affidavit of Douglas Matthews). 35 CR at I-27, PR at I-21. 36 CR at I-27, PR at I-21. 37 CR at I-27, PR at I-21. 38 CR at I-27, PR at I-21. 39 CR at I-27, PR at I-21; U.S. Steel Brief, Exhibit 35 (Affidavit of Douglas Matthews).

10
Producer and Customer Perceptions. The record of the preliminary phase of these investigations contains limited information with respect to how producers and customers perceive black plate and other cold-rolled steel.40
Price. Petitioners and Respondents disagree whether black plate commands higher prices than other types of cold-rolled steel. Although black plate is generally more expensive than other cold-rolled steel products because it undergoes additional rolling steps, other lighter gauge products are priced comparably. Petitioners contend that black plate and certain other forms of cold-rolled steel, particularly in lighter gauges, are priced comparably.41
Conclusion. Based on the record in the preliminary phase of these investigations, we define a single domestic like product. While there are distinctions between black plate and other types of cold-rolled steel, such as black plate’s more limited sales on the open market, the record nonetheless indicates substantial similarities. Black plate is rolled more thinly than most other types of cold-rolled steel, but it is one of many cold-rolled steel products that vary by gauge and strength.42 Black plate shares a similar manufacturing process with other cold-rolled steel. There are some distinctions with respect to the uses, interchangeability and price of black plate, but there is also some overlap in these characteristics. However, given that there are similarities in physical characteristics, uses, and manufacturing processes as well as some interchangeability, we decline to define black plate as a separate domestic like product. Therefore, for purposes of our preliminary determinations, we define a single domestic like product corresponding to the scope of the investigations.
Domestic Industry and Related Parties V.
The domestic industry is defined as the domestic “producers as a whole of a domestic like product, or those producers whose collective output of a domestic like product constitutes a major proportion of the total domestic production of the product.”43 In defining the domestic industry, the Commission’s general practice has been to include in the industry producers of all domestic production of the like product, whether toll-produced, captively consumed, or sold in the domestic merchant market.
We must determine whether any producer of the domestic like product should be excluded from the domestic industry as a related party pursuant to Section 771(4)(B) of the Tariff Act. This provision allows the Commission, if appropriate circumstances exist, to exclude from the domestic industry producers that are related to an exporter or importer of subject merchandise or which are themselves importers.44 Exclusion of such a producer is within the Commission’s discretion based upon the facts presented in each investigation.45
40 See CR at I-30, PR at I-23. 41 CR at I-27 to I-28, PR at I-24. The Commission did not collect pricing data for black plate or
specialty cold-rolled steel products. Average unit values for black plate were higher than those for domestically produced cold-rolled steel generally. See CR/PR at Tables I-3 and III-7.
42 Steel Dynamics and CSI Brief at 6. 43 19 U.S.C. § 1677(4)(A). 44 See Torrington Co. v. United States, 790 F. Supp. 1161, 1168 (Ct. Int’l Trade 1992), aff’d
without opinion, 991 F.2d 809 (Fed. Cir. 1993); Sandvik AB v. United States, 721 F. Supp. 1322, 1331-32 (Continued…)
11
Only Steel Dynamics and California Steel commented on the related party issues in these investigations. They argued that the Commission should determine not to exclude any U.S. producers from the domestic industry because use of the related party producers’ data would not distort the data used for the Commission's analysis.46
Four U.S. producers (***) are related parties as they either share common control with exporters or importers of the subject merchandise or directly imported subject merchandise during January 2012 to June 2015 (the period of investigation or “POI”).47 For three of the related parties (***) the ratio of subject imports to domestic production was low during most of the POI. The ratios of subject imports to domestic production never exceeded *** percent for any of these producers during any portion of the POI, except for *** during 2014 and interim 2015.48 This indicates that each of these related parties’ principal interests is in domestic production. There is no indication that the relatively small size of their imports relative to their domestic production shielded any of these domestic producers from subject imports.49 Accordingly, we do not find it appropriate to exclude any of these producers.
*** imports exceeded its production during the POI, and it opposes the petitions with respect to the United Kingdom and the Netherlands.50 ***. No party asked that *** be excluded. In light of these considerations, for purposes of the preliminary phase of these
(…Continued) (Ct. Int’l Trade 1989), aff’d mem., 904 F.2d 46 (Fed. Cir. 1990); Empire Plow Co. v. United States, 675 F. Supp. 1348, 1352 (Ct. Int’l Trade 1987).
45 The primary factors the Commission has examined in deciding whether appropriate circumstances exist to exclude a related party include the following:
(1) the percentage of domestic production attributable to the importing producer; (2) the reason the U.S. producer has decided to import the product subject to investigation, i.e.,
whether the firm benefits from the LTFV sales or subsidies or whether the firm must import in order to enable it to continue production and compete in the U.S. market; and
(3) the position of the related producer vis-à-vis the rest of the industry, i.e., whether inclusion or exclusion of the related party will skew the data for the rest of the industry.
See, e.g., Torrington Co. v. United States, 790 F. Supp. at 1168. The Commission has also analyzed whether the interests of a related party producer lie
principally in production or importation. See, e.g., Certain Crystalline Silicon Photovoltaic Products from China and Taiwan, Inv. Nos. 701-TA-511 and 731-TA-1246-1247 (Final), USITC Pub. 4519 at 17-18 (Feb. 2015), aff’d Changzou Trina Solar Energy Co. v. USITC, slip op 15-84 (Ct. Int’l Trade Aug 7, 2015).
46 Steel Dynamics and CSI Brief at 11. 47 CR at III-4, III-17, PR at III-3, III-12. ***. See Arcelor Mittal Brazil Questionnaire Response. It is
therefore not a related party. See 19 U.S.C. § 1677(4)(B)(i). 48 See CR/PR at Table III-9. 49 CR/PR at Table III-1. We have also considered these producers’ positions on the petitions.
***. 50 See CR/PR at Table III-1. Additionally, it reported operating income ratios that are *** than
the industry average. CR/PR at Table III-1; CR/PR at Table at E-3. See also CR/PR at Tables E-1 (constructed FMV) and E-2 (gross profit share).
12
determinations, we find that appropriate circumstances do not exist to exclude *** from the domestic industry.51
Accordingly, we define the domestic industry as all U.S. producers of cold-rolled steel.
Negligible Imports VI.
Pursuant to Section 771(24) of the Tariff Act, imports from a subject country of merchandise corresponding to a domestic like product that account for less than three percent (four percent in the case of a developing country in a countervailing duty investigation) of all such merchandise imported into the United States during the most recent 12 months for which data are available preceding the filing of the petition shall be deemed negligible.52
Additionally, even if subject imports are found to be negligible for purposes of present material injury, they shall not be treated as negligible for purposes of a threat analysis should the Commission determine that there is a potential that subject imports from the country concerned will imminently account for more than three percent of all such merchandise imported into the United States.53 In the case of countervailing duty investigations involving developing countries (as designated by the United States Trade Representative), the statute indicates that the negligibility limits are four percent and nine percent, rather than three percent and seven percent.54
A. Arguments of the Parties
Domestic Producers contend that the Commission should not terminate any of the current investigations on the basis of negligibility. They observe that imports from six of the eight subject countries are clearly above negligible levels.55
Domestic Producers do not contest that subject imports from the Netherlands are below the three percent negligibility threshold for the July 2014-June 2015 period the statute directs the Commission to use in its analysis of negligible imports.56 They argue, however, that there is a likelihood that the Commission will obtain information in any final phase of these investigations that will lead it to reduce the volume of total imports derived from official import
51 In any final phase of these investigations, we will again consider whether there are
appropriate circumstances to exclude this producer from the domestic industry pursuant to the related parties provision.
52 19 U.S.C. §§ 1671b(a), 1673b(a), 1677(24)(A)(i), 1677(24)(B); see also 15 C.F.R. § 2013.1 (developing countries for purposes of 19 U.S.C. § 1677(36)).
53 19 U.S.C. § 1677(24)(A)(iv). 54 19 U.S.C. § 1677(24)(B). 55 U.S. Steel Brief at 8; AK Steel Brief at 4. AK Steel asserts that subject imports from Russia
accounted for 3.2 percent of total imports for the pertinent 12-month period and consequently exceed the negligibility threshold. AK Steel Brief at 4.
56 U.S. Steel states that during this period subject imports from the Netherlands constituted approximately 2.7 percent of total imports based on official import statistics. U.S. Steel Brief at 8.

13
statistics. They contend that such adjustments could result in subject imports from the Netherlands exceeding three percent of total imports.57
Domestic Producers also argue that there is a potential that subject imports from the Netherlands will imminently exceed the three percent statutory negligibility threshold. Domestic Producers posit that terminating the investigation on subject imports from the Netherlands but not the investigations on subject imports from the United Kingdom and India will cause Tata to switch sourcing of its exports of subject merchandise from its British and Indian facilities to its Dutch facility, which it contends is well within the technical capabilities of Tata Netherlands.58
Domestic Producers also do not dispute that the available data indicate that subject imports from India are below the four percent negligibility threshold pertinent to countervailing duty investigations on imports from developing countries.59 They contend, however, that there is a likelihood that the Commission will obtain contrary information in any final phase of these investigations, citing both adjustments that may be needed to total import data and large discrepancies between official Indian export data and official U.S. import data concerning the volume of cold-rolled steel imports from India.60 They further argue that because subject imports from India are increasing rapidly, and exceeded four percent of total imports in the first half of 2015, there is a potential that they will imminently exceed that threshold.61
Tata Netherlands argues that the Commission should terminate the investigation on subject imports from the Netherlands on the grounds of negligibility. It contends that, whatever computation method is used, subject imports from the Netherlands accounted for less than three percent of total imports during the pertinent 12-month period.62 Tata Netherlands further argues that there is no potential that subject imports from the Netherlands will imminently exceed the three percent negligibility threshold.63
B. Analysis
For the reasons stated below, we determine that subject imports from the Netherlands are negligible and terminate the antidumping duty investigation with respect to such imports. We find that in the countervailing duty investigation on India, the subject imports are below the four percent negligibility threshold for present material injury.64 We also find that subject
57 AK Steel Brief at 7-9; U.S. Steel Brief at 9. 58 AK Steel Brief at 15-17; U.S. Steel Brief at 10-11. U.S. Steel additionally asserts that Tata
Netherlands could switch production from hot-rolled steel, which is also currently subject to a separate investigation, to cold-rolled steel. U.S. Steel Brief at 10.
59 Domestic Producers contend that the ratio is somewhere between 3.5 and 3.9 percent for the pertinent 12-month period. AK Steel Brief at 10-11; U.S. Steel Brief at 11.
60 U.S. Steel Brief at 11-12; AK Steel Brief at 10-11. 61 AK Steel Brief at 17-18; U.S. Steel Brief at 12. 62 Tata Netherlands Brief at 5-6. 63 Tata Netherlands Brief at 12-13. 64 USTR has designated India to be a developing country subject to the four percent negligibility
threshold for countervailing duty investigations. 15 C.F.R. § 2013.1; see 19 U.S.C. § 1677(24)(B).
14
imports from India in the countervailing duty investigation are likely to imminently exceed the four percent negligibility threshold for purposes of determining threat of material injury.65
The Netherlands. Subject imports of cold-rolled steel from the Netherlands accounted for *** percent of total imports over the applicable 12-month period prior to filing of the petition, which is July 2014 to June 2015. This is below the three percent negligibility threshold.66
We find it unlikely the Commission will receive any additional or contrary information in the final phase of these investigations affecting the quantity of subject imports from the Netherlands (the numerator in the negligibility calculation). The Commission received a questionnaire response from Tata Steel Imjuiden, the only producer of cold-rolled steel in the Netherlands.67 The Commission also received questionnaire responses from importers Tata Steel Imjuiden and Ternium International, which collectively accounted for virtually all subject imports from the Netherlands.68 Because the available data are complete, the calculation of subject import volume from the Netherlands during the relevant time period is unlikely to change to any meaningful extent in any final phase of these investigations.
As to the total quantity of subject imports during the pertinent time period (the denominator in the negligibility calculation), it is unlikely that it would change in such a manner that subject imports from the Netherlands would exceed the three percent negligibility threshold. The volume of reported subject imports contained in Table IV-3 of the Commission Report for the relevant time period may change in any final phase of these investigations to the extent that the Commission receives further questionnaires from importers that permit it further to adjust the official import data, but these adjustments are likely to increase rather than decrease total import volume – they are therefore likely to decrease rather than increase the ratio of subject imports from the Netherlands to total imports. This is because further questionnaire responses are likely to report additional quantities of alloyed cold-rolled steel that are within the scope definition but are not currently included in Table IV-3. Accordingly, we do not find a likelihood that subject imports from the Netherlands will reach the three percent threshold based on information collected in any final phase of these investigations.
65 Imports from the other six subject countries are above the pertinent negligibility thresholds.
For the 12-month period preceding filing of the petition, as a percentage of total imports, subject imports from Brazil were 7.0 percent, subject imports from China were 33.1 percent, subject imports from Japan were 4.9 percent, subject imports from Korea were *** percent, subject imports from Russia were 3.4 percent, and subject imports from the United Kingdom were *** percent. CR/PR at Table IV-3.
66 CR/PR at Table IV-3. We have relied on data in Table IV-3 of the Commission Staff Report which adjusts official import statistics to include data concerning imports of in-scope alloy cold-rolled steel received from importers. We have also considered the unadjusted import figures contained in Table IV-4, which are known to include out-of-scope merchandise because the HTS categories encompassing alloy cold-rolled steel include out-of-scope merchandise. We note that, even under this more expansive definition of subject imports, imports from the Netherlands are less than three percent of total imports. See CR at I-6 and IV-1, PR at I-4 and IV-1.
67 CR at VII-31, PR at VII-21. 68 CR/PR at IV-1; CR/PR at Table IV-1.

15
With respect to negligibility for purposes of threat, we find that the record in the preliminary phase of these investigations provides clear evidence that subject imports from the Netherlands are not likely to surpass the three percent negligibility threshold in the imminent future. Subject imports from the Netherlands displayed a downward trend in the first half of 2015, declining from *** short tons in the second half of 2014 to *** short tons in the first half of 2015.69 They accounted for *** percent of total imports in the second half of 2014, but only *** percent of total imports in the first half of 2015.70 Similarly, despite fluctuating volume, unadjusted monthly import data do not indicate that it is likely that subject imports from the Netherlands will likely imminently exceed three percent over a 12-month period.71 Information reported by the sole subject producer in the Netherlands pertaining to its capacity and inventories also suggests that it is unlikely imminently to increase exports of cold-rolled steel to the United States.72
In short, imports of cold-rolled steel from the Netherlands are well below the negligibility threshold, the record in these preliminary investigations contains clear and convincing evidence that it is unlikely that they will imminently surpass the three percent threshold given the trends over the past 12-month period, and there is no likelihood that evidence leading to a contrary result will arise in any final phase investigations. Accordingly, we find that imports from the Netherlands are negligible and terminate the antidumping duty investigation with respect to such imports.
India. We find that subject imports from India in the countervailing duty investigation are negligible for purposes of our analysis of reasonable indication of present material injury. Subject imports from India accounted for 3.7 percent of total imports over the applicable 12-month period. It is below the four percent negligibility threshold applicable to the countervailing duty investigation concerning subject imports from India.73
69 See CR/PR at Table IV-2. 70 See CR/PR at Table IV-2. 71 The unadjusted HTS data indicate that subject imports from the Netherlands exceeded three
percent of total imports of cold-rolled steel during only one of the first six months of 2015. See CR/PR at Table F-1. See generally Certain Steel Nails from India, Korea, Malaysia, Oman, Taiwan, Turkey, and Vietnam, Inv. Nos. 701-TA-515-521, 731-TA-1251-1257 (Preliminary), USITC Pub. 4480 at 14, 16 (July 2014) (examining percentages of imports during individual months of negligibility period, as well as whether these percentages were rising or declining, in ascertaining whether subject imports were likely imminently to exceed the negligibility threshold).
72 The producer in the Netherlands (Tata Steel Ijmuiden) reported operating at *** percent capacity utilization in 2014 and *** percent in interim 2015. Its inventories of cold-rolled steel remained *** percent of its domestic production during the POI. CR/PR at Table VII-27. Its *** and the fact that Tata Steel Ijmuiden does not have the capability to produce the continuously annealed cold-rolled steel produced by Tata UK and sold in the United States indicates that a shift of exports to the United States from Tata UK to Tata Steel Imjuiden is unlikely. See Tata Netherlands Brief at 16.
73 CR/PR at Table IV-3. USTR has designated India to be a developing country subject to the four percent negligibility threshold for countervailing duty investigations. 15 C.F.R. § 2013.1; see 19 U.S.C. § 1677(24)(B).

16
We also find that it is not likely that evidence leading to a contrary result will arise in any final phase of these investigations notwithstanding that subject imports from India were relatively close to the four percent threshold and there is limited importer questionnaire coverage in the preliminary phase of these investigation concerning subject imports from India for the applicable 12-month period.74 Upward adjustments in the volume of subject imports from India are unlikely. The import numbers in Table IV-3 are based on official import statistics for non-alloy cold-rolled steel plus imports of alloy cold-rolled steel reported in questionnaire responses.75 Unadjusted import statistics for alloy and non-alloy cold-rolled steel are provided in Table IV-4; these data indicate the maximum quantity of subject imports from each country during the relevant period. As there is very little difference between the calculated subject imports from India under each methodology, upward adjustments to the pertinent volume of subject imports from India that would raise the ratio of subject imports to total imports to above four percent are not likely.76 Further, as explained above, any adjustments to the volume of total imports shown in Table IV-3 in any final phase of these investigations would increase total imports and cause the negligibility ratio to fall. Accordingly, we find that it is not likely that contrary evidence concerning the level of subject imports from India will arise in any final phase of these investigations that would make them non-negligible for purposes of material injury analysis in the countervailing duty investigation.
On the other hand, we find subject imports from India in the countervailing duty investigation are not negligible for purposes of our analysis of reasonable indication of threat of material injury.77 During the first six months of 2015, subject imports from India accounted for 5.1 percent of total imports of cold-rolled steel.78 Given this level of subject imports from India during the most recent period (interim 2015), we determine that there is the potential that subject imports from India will imminently exceed the four percent threshold.79 We therefore consider subject imports from India in the countervailing duty investigation for purposes of our consideration of whether there is a reasonable indication of a threat of material injury.80
74 The Commission received questionnaire responses from importers accounting for 62.4
percent of subject imports from India. CR/PR at Table IV-1. 75 See CR at IV-9, PR at IV-6. 76 See Tables IV-3 and IV-4 (showing difference of only 175 short tons between two tables for
subject imports from India). Using the method most likely to increase the ratio of subject imports from India to total imports – which is comparing the highest possible numerator (one taken from Table IV-4 with the lowest possible denominator (one taken from Table IV-3) the pertinent ratio is 3.8 percent.
77 See 19 U.S.C. § 1677(24)(A)(iv). 78 CR/PR at Table IV-2. Subject imports from India accounted for 4.2 percent of total imports
during the first half of 2014 and 2.6 percent of total imports during the second half of 2014. See CR/PR at Table IV-2.
79 Additionally, the reporting producer in India, ***, reported ***. See CR at Table VII-11. 80 Domestic producers also posit that the Commission should consider what the negligibility
ratio would be should the Commission find that black plate is a separate domestic like product. Although we did not define black plate to be a separate like product, had we done so it would not have impacted the negligibility analysis. Negligibility calculations for subject imports from India and the (Continued…)

17
Cumulation VII.
For purposes of evaluating the volume and effects for a determination of reasonable indication of material injury by reason of subject imports, section 771(7)(G)(i) of the Tariff Act requires the Commission to cumulate subject imports from all countries as to which petitions were filed and/or investigations self-initiated by Commerce on the same day, if such imports compete with each other and with the domestic like product in the U.S. market. In assessing whether subject imports compete with each other and with the domestic like product, the Commission generally has considered four factors:
(1) the degree of fungibility between subject imports from different countries and between subject imports and the domestic like product, including consideration of specific customer requirements and other quality related questions;
(2) the presence of sales or offers to sell in the same geographic markets of subject imports from different countries and the domestic like product;
(3) the existence of common or similar channels of distribution for subject imports from different countries and the domestic like product; and
(4) whether the subject imports are simultaneously present in the market.81
While no single factor is necessarily determinative, and the list of factors is not exclusive, these factors are intended to provide the Commission with a framework for determining whether the subject imports compete with each other and with the domestic like product.82 Only a “reasonable overlap” of competition is required.83
As discussed above, we have found that imports are negligible in the antidumping duty investigation involving subject imports from the Netherlands and terminated that investigation. Consequently, these imports are ineligible for cumulation.84 We have also found that subject
(…Continued) Netherlands remain under the pertinent negligibility thresholds for imports of cold-rolled steel other than black plate. See CR at IV-10 nn 7 & 9, PR at IV-6 n 10 and IV-7 n 12.
81 See Certain Cast-Iron Pipe Fittings from Brazil, the Republic of Korea, and Taiwan, Inv. Nos. 731-TA-278-280 (Final), USITC Pub. 1845 (May 1986), aff’d, Fundicao Tupy, S.A. v. United States, 678 F. Supp. 898 (Ct. Int’l Trade), aff’d, 859 F.2d 915 (Fed. Cir. 1988).
82 See, e.g., Wieland Werke, AG v. United States, 718 F. Supp. 50 (Ct. Int’l Trade 1989). 83 The Statement of Administrative Action (SAA) to the Uruguay Round Agreements Act (URAA),
expressly states that “the new section will not affect current Commission practice under which the statutory requirement is satisfied if there is a reasonable overlap of competition.” H.R. Rep. No. 103-316, Vol. I at 848 (1994) (citing Fundicao Tupy, 678 F. Supp. at 902); see Goss Graphic Sys., Inc. v. United States, 33 F. Supp. 2d 1082, 1087 (Ct. Int’l Trade 1998) (“cumulation does not require two products to be highly fungible”); Wieland Werke, AG, 718 F. Supp. at 52 (“Completely overlapping markets are not required.”).
84 19 U.S.C. § 1677(7)(G)(ii)(II).

18
imports from India in the countervailing duty investigation are negligible for purposes of our consideration of reasonable indication of material injury. Therefore, these imports are also ineligible for cumulation for purposes of our material injury analysis.85 Allegedly dumped imports from Brazil, China, India, Japan, Korea, Russia, and the United Kingdom and allegedly subsidized imports from Brazil, China, Korea, and Russia remain eligible for cumulation because petitioners filed petitions with respect to all such subject imports on the same day, July 28, 2015. As explained below, we find a reasonable overlap of competition between the domestic like product and those imports from each subject country eligible for cumulation and between those imports from each such subject country.
A. Arguments of the Parties
AK Steel asserts that the requirements for cumulating subject imports from all countries are satisfied. It maintains that cold-rolled steel is highly interchangeable, regardless of source; cold-rolled steel from all subject sources serves the same geographic markets; subject imports and the domestic like product are sold through the same channels of distribution; cold-rolled steel from all subject countries was simultaneously present in the U.S. market during the POI.86 With respect to Japanese Respondents’ arguments, AK Steel contends that questionnaire responses show that imports from Japan ***, but other types of subject merchandise as well.87
Japanese Respondents argue that the Commission may not cumulate subject imports from Japan with imports from any other subject country because of a lack of reasonable overlap of competition between subject imports from Japan and the domestic like product. They assert that subject imports from Japan are focused on two niche products: ultra high tensile strength steel and black plate.88 Japanese Respondents acknowledge that the domestic industry produces both these products, but they nonetheless maintain that there is a lack of fungibility between the domestic like product and subject imports from Japan because domestically produced ultra high tensile strength steel is insufficiently reliable to meet purchaser requirements, and the principal U.S. purchaser of black plate imported from Japan cannot obtain sufficient supplies from domestic producers for competitive, geographic, or quality reasons.89
B. Analysis
Based on the record of the preliminary phase of these investigations, we find a reasonable overlap of competition among eligible subject imports from Brazil, China, India,
85 19 U.S.C. § 1677(24)(A)(iv). 86 AK Steel Brief at 25-26. 87 AK Steel Brief, Exhibit 1 at 6-7. 88 Japanese Respondents Brief at 2. 89 Japanese Respondents Brief at 5-8.

19
Japan, Korea, Russia, and the United Kingdom and between subject imports from each source and the domestic like product.90
Fungibility. There is a high degree of substitutability between domestically produced cold-rolled steel and cold-rolled steel imported from eligible subject sources.91 Most responding U.S. producers reported that cold-rolled steel produced in the United States and imported from each subject source are “always” used interchangeably, while most responding importers reported that cold-rolled steel from domestic and individual subject sources are “always” or “frequently” used interchangeably.92 In addition, most U.S. producers reported that there were “never” differences other than price between all country pairs, while most importers reported that there were “sometimes” or “never” differences other than price between subject imports and domestic cold-rolled steel.93
Domestic producers’ and importers’ responses with respect to interchangeability and non-price differences with respect to subject imports from Japan did not differ from their responses concerning the other subject countries whose imports are eligible for cumulation.94 The data indicate that shipments of subject imports from Japan were primarily dedicated to end uses in the automotive sector, and substantial portions of the subject imports from Korea, as well as domestically produced cold-rolled steel, were also dedicated to end uses in the automotive business during the POI.95 We also observe that a relatively small portion of subject imports from Japan are, in fact, black plate.96 In light of the foregoing, the record indicates that there is a sufficient degree of fungibility among the subject imports and the domestic like product for purposes of finding a reasonable overlap of competition in the preliminary phase of these investigations.97
Channels of Distribution. U.S. shipments of cold-rolled steel by producers and importers are sold to both distributors and end users. In 2014, the majority of domestic producers' U.S. shipments of cold-rolled steel (***), as well as substantial portions of imports of cold-rolled steel from Brazil (***), China (***), India (***), Japan (***), ***), and Russia (***), were sold to end users.98 Substantial proportions of the domestic like product *** and appreciable proportions of shipments from Brazil, China, India, Japan, Korea, and Russia (ranging from ***
90 As explained above, while we have not considered allegedly subsidized subject imports from
India in our analysis, we have considered allegedly dumped subject imports from India in our analysis. 91 CR at II-23, PR at II-16. 92 CR/PR at Table II-7. 93 CR/PR at Table II-8. 94 See CR/PR at Tables II-7 and II-8. 95 See CR/PR at Table IV-5. 96 Compare CR/PR at Table I-3 with CR/PR at Table IV-2. 97 If parties believe that there are specific types of data other than those typically collected in
the questionnaires which would be pertinent to the Commission’s analysis of fungibility, they should identify and request collection of such data in their comments on the draft questionnaires in any final phase of these investigations.
98 CR/PR at Table II-1.

20
percent) were sold to distributors, as were the *** majority of imports of cold-rolled steel from the United Kingdom ***.99
Geographic Overlap. Domestically produced cold-rolled steel and imports from each subject source are sold in most regions of the continental United States.100 During the POI, domestically produced cold-rolled steel and imports from all seven subject countries eligible for cumulation were sold in the Northeast, Midwest, Southeast, and Central Southwest, and at least some overlap in the Mountain and Pacific Coast markets.101
Simultaneous Presence in Market. Imports of cold-rolled steel from each eligible subject country, with the exception of Russia, entered the United States during at least 40 months of the 42-month POI.102 Subject imports from Russia entered during 15 of the 42 months.103
Conclusion. The record indicates that imports from the eligible subject countries are fungible with the domestic like product and with each other, that imports from each of the subject countries and the domestic like product are sold in similar channels of distribution and similar geographic markets, and that subject imports and the domestic like product have been simultaneously present in the U.S. market. In light of the foregoing, we find that there is a reasonable overlap of competition between the domestic like product and imports from each subject country eligible for cumulation and between imports from each such subject country.
Reasonable Indication of Material Injury by Reason of Subject Imports VIII.
A. Legal Standard
In the preliminary phase of antidumping and countervailing duty investigations, the Commission determines whether there is a reasonable indication that an industry in the United States is materially injured or threatened with material injury by reason of the imports under investigation.104 In making this determination, the Commission must consider the volume of subject imports, their effect on prices for the domestic like product, and their impact on domestic producers of the domestic like product, but only in the context of U.S. production operations.105 The statute defines “material injury” as “harm which is not inconsequential, immaterial, or unimportant.”106 In assessing whether there is a reasonable indication that the
99 CR/PR at Table II-1. 100 See CR/PR at Table II-2. 101 See CR/PR at Table II-2. 102 CR/PR at Table IV-6. 103 CR/PR at Table IV-6. 104 19 U.S.C. §§ 1671b(a), 1673b(a). The Trade Preferences Extension Act of 2015, Pub. L. 114-
27, amended the provisions of the Tariff Act pertaining to Commission determinations of reasonable indication of material injury and threat of material injury by reason of subject imports in certain respects. We have applied these amendments here.
105 19 U.S.C. § 1677(7)(B). The Commission “may consider such other economic factors as are relevant to the determination” but shall “identify each {such} factor ... {a}nd explain in full its relevance to the determination.” 19 U.S.C. § 1677(7)(B).
106 19 U.S.C. § 1677(7)(A).

21
domestic industry is materially injured by reason of subject imports, we consider all relevant economic factors that bear on the state of the industry in the United States.107 No single factor is dispositive, and all relevant factors are considered “within the context of the business cycle and conditions of competition that are distinctive to the affected industry.”108
Although the statute requires the Commission to determine whether there is a reasonable indication that the domestic industry is “materially injured by reason of” unfairly traded imports,109 it does not define the phrase “by reason of,” indicating that this aspect of the injury analysis is left to the Commission’s reasonable exercise of its discretion.110 In identifying a causal link, if any, between subject imports and material injury to the domestic industry, the Commission examines the facts of record that relate to the significance of the volume and price effects of the subject imports and any impact of those imports on the condition of the domestic industry. This evaluation under the “by reason of” standard must ensure that subject imports are more than a minimal or tangential cause of injury and that there is a sufficient causal, not merely a temporal, nexus between subject imports and material injury.111
In many investigations, there are other economic factors at work, some or all of which may also be having adverse effects on the domestic industry. Such economic factors might include nonsubject imports; changes in technology, demand, or consumer tastes; competition among domestic producers; or management decisions by domestic producers. The legislative history explains that the Commission must examine factors other than subject imports to ensure that it is not attributing injury from other factors to the subject imports, thereby inflating an otherwise tangential cause of injury into one that satisfies the statutory material injury threshold.112 In performing its examination, however, the Commission need not isolate
107 19 U.S.C. § 1677(7)(C)(iii). 108 19 U.S.C. § 1677(7)(C)(iii). 109 19 U.S.C. §§ 1671b(a), 1673b(a). 110 Angus Chemical Co. v. United States, 140 F.3d 1478, 1484-85 (Fed. Cir. 1998) (“{T}he statute
does not ‘compel the commissioners’ to employ {a particular methodology}.”), aff’d 944 F. Supp. 943, 951 (Ct. Int’l Trade 1996).
111 The Federal Circuit, in addressing the causation standard of the statute, has observed that “{a}s long as its effects are not merely incidental, tangential, or trivial, the foreign product sold at less than fair value meets the causation requirement.” Nippon Steel Corp. v. USITC, 345 F.3d 1379, 1384 (Fed. Cir. 2003). This was re-affirmed in Mittal Steel Point Lisas Ltd. v. United States, 542 F.3d 867, 873 (Fed. Cir. 2008), in which the Federal Circuit, quoting Gerald Metals, Inc. v. United States, 132 F.3d 716, 722 (Fed. Cir. 1997), stated that “this court requires evidence in the record ‘to show that the harm occurred “by reason of” the LTFV imports, not by reason of a minimal or tangential contribution to material harm caused by LTFV goods.’” See also Nippon Steel Corp. v. United States, 458 F.3d 1345, 1357 (Fed. Cir. 2006); Taiwan Semiconductor Industry Ass’n v. USITC, 266 F.3d 1339, 1345 (Fed. Cir. 2001).
112 SAA, H.R. Rep. 103-316, Vol. I at 851-52 (1994) (“{T}he Commission must examine other factors to ensure that it is not attributing injury from other sources to the subject imports.”); S. Rep. 96-249 at 75 (1979) (the Commission “will consider information which indicates that harm is caused by factors other than less-than-fair-value imports.”); H.R. Rep. 96-317 at 47 (1979) (“in examining the overall injury being experienced by a domestic industry, the ITC will take into account evidence (Continued…)

22
the injury caused by other factors from injury caused by unfairly traded imports.113 Nor does the “by reason of” standard require that unfairly traded imports be the “principal” cause of injury or contemplate that injury from unfairly traded imports be weighed against other factors, such as nonsubject imports, which may be contributing to overall injury to an industry.114 It is clear that the existence of injury caused by other factors does not compel a negative determination.115
Assessment of whether material injury to the domestic industry is “by reason of” subject imports “does not require the Commission to address the causation issue in any particular way” as long as “the injury to the domestic industry can reasonably be attributed to the subject imports” and the Commission “ensure{s} that it is not attributing injury from other sources to the subject imports.”116 117 Indeed, the Federal Circuit has examined and affirmed various Commission methodologies and has disavowed “rigid adherence to a specific formula.”118 (…Continued) presented to it which demonstrates that the harm attributed by the petitioner to the subsidized or dumped imports is attributable to such other factors;” those factors include “the volume and prices of nonsubsidized imports or imports sold at fair value, contraction in demand or changes in patterns of consumption, trade restrictive practices of and competition between the foreign and domestic producers, developments in technology and the export performance and productivity of the domestic industry”); accord Mittal Steel, 542 F.3d at 877.
113 SAA at 851-52 (“{T}he Commission need not isolate the injury caused by other factors from injury caused by unfair imports.”); Taiwan Semiconductor Industry Ass’n , 266 F.3d at 1345. (“{T}he Commission need not isolate the injury caused by other factors from injury caused by unfair imports ... . Rather, the Commission must examine other factors to ensure that it is not attributing injury from other sources to the subject imports.” (emphasis in original)); Asociacion de Productores de Salmon y Trucha de Chile AG v. United States, 180 F. Supp. 2d 1360, 1375 (Ct. Int’l Trade 2002) (“{t}he Commission is not required to isolate the effects of subject imports from other factors contributing to injury” or make “bright-line distinctions” between the effects of subject imports and other causes.); see also Softwood Lumber from Canada, Inv. Nos. 701-TA-414 and 731-TA-928 (Remand), USITC Pub. 3658 at 100-01 (Dec. 2003) (Commission recognized that “{i}f an alleged other factor is found not to have or threaten to have injurious effects to the domestic industry, i.e., it is not an ‘other causal factor,’ then there is nothing to further examine regarding attribution to injury”), citing Gerald Metals, 132 F.3d at 722 (the statute “does not suggest that an importer of LTFV goods can escape countervailing duties by finding some tangential or minor cause unrelated to the LTFV goods that contributed to the harmful effects on domestic market prices.”).
114 S. Rep. 96-249 at 74-75; H.R. Rep. 96-317 at 47. 115 See Nippon, 345 F.3d at 1381 (“an affirmative material-injury determination under the
statute requires no more than a substantial-factor showing. That is, the ‘dumping’ need not be the sole or principal cause of injury.”).
116 Mittal Steel, 542 F.3d at 877-78; see also id. at 873 (“While the Commission may not enter an affirmative determination unless it finds that a domestic industry is materially injured ‘by reason of’ subject imports, the Commission is not required to follow a single methodology for making that determination ... {and has} broad discretion with respect to its choice of methodology.”) citing United States Steel Group v. United States, 96 F.3d 1352, 1362 (Fed. Cir. 1996) and S. Rep. 96-249 at 75. In its decision in Swiff-Train v. United States, 793 F.3d 1355 (Fed. Cir. 2015), the Federal Circuit affirmed the Commission’s causation analysis as comporting with the Court’s guidance in Mittal.

23
The Federal Circuit’s decisions in Gerald Metals, Bratsk, and Mittal Steel all involved cases in which the relevant “other factor” was the presence in the market of significant volumes of price-competitive nonsubject imports. The Commission interpreted the Federal Circuit’s guidance in Bratsk as requiring it to apply a particular additional methodology following its finding of material injury in cases involving commodity products and a significant market presence of price-competitive nonsubject imports.119 The additional “replacement/benefit” test looked at whether nonsubject imports might have replaced subject imports without any benefit to the U.S. industry. The Commission applied that specific additional test in subsequent cases, including the Carbon and Certain Alloy Steel Wire Rod from Trinidad and Tobago determination that underlies the Mittal Steel litigation.
Mittal Steel clarifies that the Commission’s interpretation of Bratsk was too rigid and makes clear that the Federal Circuit does not require the Commission to apply an additional test nor any one specific methodology; instead, the court requires the Commission to have “evidence in the record ‘to show that the harm occurred ‘by reason of’ the LTFV imports,’” and requires that the Commission not attribute injury from nonsubject imports or other factors to subject imports.120 Accordingly, we do not consider ourselves required to apply the replacement/benefit test that was included in Commission opinions subsequent to Bratsk.
The progression of Gerald Metals, Bratsk, and Mittal Steel clarifies that, in cases involving commodity products where price-competitive nonsubject imports are a significant
(…Continued)
117 Vice Chairman Pinkert does not join this paragraph or the following three paragraphs. He points out that the Federal Circuit, in Bratsk, 444 F.3d 1369, and Mittal Steel, held that the Commission is required, in certain circumstances when considering present material injury, to undertake a particular kind of analysis of non-subject imports, albeit without reliance upon presumptions or rigid formulas. Mittal Steel explains as follows:
What Bratsk held is that “where commodity products are at issue and fairly traded, price competitive, non-subject imports are in the market,” the Commission would not fulfill its obligation to consider an important aspect of the problem if it failed to consider whether non-subject or non-LTFV imports would have replaced LTFV subject imports during the period of investigation without a continuing benefit to the domestic industry. 444 F.3d at 1369. Under those circumstances, Bratsk requires the Commission to consider whether replacement of the LTFV subject imports might have occurred during the period of investigation, and it requires the Commission to provide an explanation of its conclusion with respect to that factor.
542 F.3d at 878. 118 Nucor Corp. v. United States, 414 F.3d 1331, 1336, 1341 (Fed. Cir. 2005); see also Mittal Steel,
542 F.3d at 879 (“Bratsk did not read into the antidumping statute a Procrustean formula for determining whether a domestic injury was ‘by reason’ of subject imports.”).
119 Mittal Steel, 542 F.3d at 875-79. 120 Mittal Steel, 542 F.3d at 873 (quoting from Gerald Metals, 132 F.3d at 722), 875-79 & n.2
(recognizing the Commission’s alternative interpretation of Bratsk as a reminder to conduct a non-attribution analysis).
24
factor in the U.S. market, the Court will require the Commission to give full consideration, with adequate explanation, to non-attribution issues when it performs its causation analysis.121
The question of whether the material injury threshold for subject imports is satisfied notwithstanding any injury from other factors is factual, subject to review under the substantial evidence standard.122 Congress has delegated this factual finding to the Commission because of the agency’s institutional expertise in resolving injury issues.123
B. Conditions of Competition and the Business Cycle
The following conditions of competition inform our analysis of whether there is a reasonable indication of material injury and threat of material injury by reason of subject imports.
1. Captive Production Provision The domestic industry captively consumes the majority of its production of the domestic
like product in the manufacture of downstream articles. Accordingly, we have considered whether the statutory captive production provision requires us to focus our analysis primarily on the merchant market when assessing market share and the factors affecting the financial performance of the domestic industry.124 125
121 To that end, after the Federal Circuit issued its decision in Bratsk, the Commission began to
present published information or send out information requests in final phases of investigations to producers in nonsubject countries that accounted for substantial shares of U.S. imports of subject merchandise (if, in fact, there were large nonsubject import suppliers). In order to provide a more complete record for the Commission’s causation analysis, these requests typically seek information on capacity, production, and shipments of the product under investigation in the major source countries that export to the United States. The Commission plans to continue utilizing published or requested information in final phases of investigations in which there are substantial levels of nonsubject imports.
122 We provide in our respective discussions of volume, price effects, and impact a full analysis of other factors alleged to have caused any material injury experienced by the domestic industry.
123 Mittal Steel, 542 F.3d at 873; Nippon Steel Corp., 458 F.3d at 1350, citing U.S. Steel Group, 96 F.3d at 1357; S. Rep. 96-249 at 75 (“The determination of the ITC with respect to causation is ... complex and difficult, and is a matter for the judgment of the ITC.”).
124 The captive production provision, 19 U.S.C. § 1677(7)(C)(iv), provides: (iv) CAPTIVE PRODUCTION –If domestic producers internally transfer significant production of the domestic like product for the production of a downstream article and sell significant production of the domestic like product in the merchant market, and the Commission finds that –
(I) the domestic like product produced that is internally transferred for processing into that downstream article does not enter the merchant market for the domestic like product, and (II) the domestic like product is the predominant material input in the production of that downstream article;
(Continued…)

25
Petitioners argue that the captive production provision should be applied.126 Among respondents, only the Korean Respondents specifically address application of the provision, and they acknowledge that it applies to these investigations.127
Threshold Criterion. The captive production provision is to be applied only if, as a threshold matter, significant production of the domestic like product is internally transferred and significant production is sold in the merchant market. In these investigations, internal consumption accounted for 59.0 percent of U.S. producers’ U.S. shipments of cold-rolled steel during the POI.128 We find that both the internal consumption and merchant market portions of the market (41 percent and 59 percent) are significant.
First Statutory Criterion. The first criterion tests whether the domestic like product produced that is internally transferred for processing into downstream articles does not enter the merchant market for the domestic like product.129 No domestic producers in these investigations reported diverting cold-rolled steel that was to be internally consumed to the merchant market.130 This criterion is therefore satisfied.
Second Statutory Criterion. In applying the second statutory criterion, the Commission generally considers whether the domestic like product is the predominant material input into a downstream product by referring to its share of the raw material cost of the downstream product.131 In these investigations, seven of eight reporting domestic producers indicated that cold-rolled steel accounted for 80-87 percent of the cost of downstream coated steel products, which comprise the vast majority of downstream products internally produced from cold-rolled steel.132 For tin mill products, domestic producers estimated a cost share for cold-rolled steel of 68-84 percent.133 Because cold-rolled steel is the predominant material input into downstream products, this criterion is also satisfied in these investigations.
Conclusion. We conclude that the criteria for application of the captive production provision are satisfied in these investigations and, accordingly, we focus primarily on the merchant market in analyzing the market share and financial performance of the domestic
(…Continued)
then the Commission, in determining market share and the factors affecting financial performance set forth in clause (iii), shall focus primarily on the merchant market for the domestic like product.
125 The Trade Preferences Extension Act of 2015 eliminated what had been the third statutory criterion of the captive production provision. Pub. L. 114-27, § 503(c).
126 AK Steel Br. at 20; ArcelorMittal Brief at 3-4; Nucor Brief at 17; U.S. Steel Brief Exh. 1 at 7; Korean Respondents Brief at 6 n.26.
127 Korean Respondents Brief at 8. 128 CR at III-12, PR at III-8. 129 See Raw Flexible Magnets from China and Taiwan, Inv. Nos. 701-TA-452 and 731-TA-1129-
1130 (Preliminary), USITC Pub. 3961 at 13 (Nov. 2007) (“No producer reported diverting raw flexible magnets intended for internal consumption to the merchant market.”).
130 CR at III-14, PR at III-10. 131 See 19 U.S.C. § 1677(7)(C)(iv)(II). 132 CR at III-15 to III-16, PR at III-11; CR/PR at Table II-11. 133 CR at III-16, PR at III-11; CR/PR at Table II-11.

26
industry. We also have considered the market as a whole and the captive portion of the market.
2. Demand Conditions
Cold-rolled steel is used in the manufacture of goods in the automotive, construction, container, appliance, and electrical equipment industries. Such goods include refrigerators, washers, dryers, bathtubs, and other home appliances, as well as automobile parts, containers, and electric motors. Other reported end uses include aircraft parts, steel barrels and drums, tubing, decking, HVAC systems, furniture, and sheet for further conversion.134 A large portion of cold-rolled steel is used internally or transferred to related firms for production of downstream products including corrosion-resistant steel, tin plate, and other products. Domestic producers reported that 20.9 percent of their 2014 commercial shipments went to automotive end uses, 7.2 percent went to appliance uses, 4.8 percent went to container end uses, and 67.1 percent went to “other” end uses.135
Demand for cold-rolled steel is driven by demand in the above-mentioned industries, as well as overall economic conditions.136 Apparent U.S. consumption of cold-rolled steel increased overall by 7.2 percent in the merchant market from 2012 to 2014, falling from 11.9 million short tons in 2012 to 11.7 million short tons in 2013, and then increasing to 12.8 million short tons in 2014.137 Apparent U.S. consumption in the merchant market was 6.3 million short tons in January-June (“interim”) 2014 and 5.9 million short tons in interim 2015.138
Most responding U.S. producers reported that U.S. demand for cold-rolled steel had increased since January 2012, particularly in the automotive and construction sectors.139 Most importers also reported that demand in the United States for cold-rolled steel had increased or fluctuated.140
3. Supply Conditions
The domestic industry satisfied the majority of U.S. demand for cold-rolled steel. The share of apparent U.S. consumption in the merchant market that the domestic industry supplied increased from 89.3 percent in 2012 to 89.6 percent in 2013 and then declined to 79.6 percent in 2014; the U.S. industry’s share of apparent U.S. consumption in the merchant market was 82.6 percent in interim 2014 and 78.6 percent in interim 2015.141 The domestic industry
134 CR at II-17, PR at II-11. 135 CR/PR at Fig II-1. Data from the ***. See CR/PR at Table II-5. 136 CR/PR at II-1. 137 CR/PR at Table C-2. Apparent U.S. consumption in the overall market increased from 27.5
million short tons in 2012 to 27.6 million short tons in 2013 and 29.3 million short tons in 2014. It was 14.7 million short tons in interim 2014 and 13.6 million short tons in interim 2014. CR/PR at Table IV-8.
138 CR/PR at Table C-2. 139 CR/PR at Table II-3; CR at II-22, PR at II-14. 140 CR/PR at Table II-3. 141 CR/PR at Table C-2.

27
supplied 95.4 percent of apparent U.S. consumption in the overall market in 2012, 95.6 percent in 2013, and 91.1 percent in 2014.142 The domestic industry supplied 92.5 percent of the overall market in interim 2014, and it supplied 90.7 percent in interim 2015.143 In 2014, the three largest domestic producers, ***, accounted for over *** of domestic cold-rolled production.144
The domestic industry reported significant consolidation and restructuring during the period of investigation. AK Steel ***. ArcelorMittal USA purchased the Calvert, Alabama, mill from ThyssenKrupp Steel USA in February 2014 and formed a joint venture with Nippon Steel and Sumitomo Metal Corp. to operate the plant at a purchase price of $1.55 billion for the facility.145 Steel Dynamics also purchased a mill in Columbus, Mississippi, in September 2014 from Severstal for $1.625 billion.146
Six responding domestic producers reported shutdowns or curtailments, mostly during 2014 and 2015.147 Production capacity, however, was not significantly affected by the production curtailments, and the domestic industry’s capacity remained essentially stable over the POI,148 as the domestic industry’s capacity was negligibly lower in 2014 than it was in 2012.149 Notwithstanding respondents’ arguments that the U.S. market experienced shortages during 2014, the domestic industry had ample unused capacity throughout the POI.150
By the conclusion of the POI, cumulated subject imports were the next largest source of supply to the U.S. market after the domestic industry. Cumulated subject imports’ share of apparent U.S. consumption in the merchant market declined from *** percent in 2012 to *** percent in 2013 and then increased to *** percent in 2014; this share was higher in interim 2015, at *** percent, than in interim 2014, when it was *** percent.151 In the total market, cumulated subject imports’ share of apparent U.S. consumption declined from *** percent in 2012 to *** percent in 2013 and then increased to *** percent in 2014; this share was higher in interim 2015, at *** percent, than in interim 2014, when it was *** percent.152
Nonsubject imports increased from 5.0 percent of total apparent U.S. consumption in the merchant market in 2012 to 5.1 percent in 2013 and 7.3 percent in 2014; their share of the merchant market was 7.1 percent in interim 2014 and 6.6 percent in interim 2015.153 In the market as a whole, nonsubject imports’ share of apparent U.S. consumption was 2.2 percent in
142 CR/PR at Table IV-10. 143 CR/PR at Table IV-10. 144 CR/PR at Table III-1. 145 CR/PR at Table III-3. 146 CR/PR at Table III-3. 147 CR/PR at Table III-4. After the POI, U.S. Steel announced that it had decided to permanently close its cold-rolled steel operations at Fairfield, Alabama in November 2015. CR at VI-22, PR at VI-17. 148 See CR/PR at Table III-5. 149 See CR/PR at Table III-5. 150 See CR/PR at Table III-5. 151 CR/PR at Table C-2. 152 CR/PR at Table IV-10 153 CR/PR at Table C-2. Imports from the Netherlands are presented separately in this table.
28
2012 and 2013 and 3.2 percent in 2014.154 In 2014, the largest source of nonsubject imports was Canada, accounting for approximately 20 percent of total cold-rolled steel imports during the POI.155 Over *** percent of the nonsubject imports from Canada were imported by ***.156
4. Substitutability and Other Conditions
The record indicates that there is a high degree of substitutability between domestically produced cold-rolled steel and cold-rolled steel imported from the subject sources.157 As discussed above, most responding U.S. producers reported that cold-rolled steel produced in the United States and imported from each subject source are "always" used interchangeably, while most responding importers reported that cold-rolled steel from domestic and individual subject sources are “always” or “frequently” used interchangeably.158 Although the Japanese Respondents, Korean Respondents, and Tata UK have argued that their exports of cold-rolled steel are comprised of specialty products that are not substitutable with domestically produced cold-rolled steel, the record indicates that subject imports from each of these countries and the domestic like product are used in the automotive sector.159
The record also indicates that price is an important consideration for purchasers of cold-rolled steel.160 Most U.S. producers reported that there were “never” differences other than price between cold-rolled steel from all country sources, and most importers reported that differences other than price were “sometimes” or “never” important for all country sources.161 Prices for the primary raw materials used to produce cold-rolled steel fluctuated over the POI, with prices for iron ore, coal, and iron and steel scrap decreasing over the period by 26.8 percent, 7.2 percent, and 41.4 percent, respectively.162 Prices for hot-rolled coil, the intermediate product used to produce cold-rolled steel, declined by *** percent between January 2012 and June 2015.163
The record indicates that over half of the domestic producers’ commercial shipments were directly to end users, while a majority of importers’ sales of subject merchandise were to distributors.164 U.S. producers reported selling 80.1 percent of their commercial shipments through annual or long-term contracts, while importers sold 62.5 percent of the subject
154 CR/PR at Table C-1. Imports from the Netherlands are presented separately in this table. 155 See CR at IV-2, PR at IV-2. 156 See CR/PR at Table IV-1 157 CR at II-23-II-24, PR at II-16. 158 CR/PR at Table II-9. 159 See CR/PR at Table IV-5. Respondents should specify in their comments on the draft
questionnaires in any final phase of these investigations the additional information that the Commission should gather to support their claims that their exports of cold-rolled steel to the United States are comprised of specialty products not produced by domestic producers.
160 See CR/PR at Tables II-7 and II-8. 161 CR/PR at Table II-7. 162 CR/PR at V-1 and Figure V-1. 163 CR/PR at V-2. 164 CR/PR at Table II-1.

29
merchandise on the spot market.165 Petitioners indicated that contract pricing is closely tied to spot market prices such as those published by the CRU Group, an industry monitoring service, and even long-term contracts contain mechanisms by which their pricing is adjusted based upon spot market prices.166
C. Volume of Subject Imports
Section 771(7)(C)(i) of the Tariff Act provides that the “Commission shall consider whether the volume of imports of the merchandise, or any increase in that volume, either in absolute terms or relative to production or consumption in the United States, is significant.”167
We find that the volume and the increase in volume of cumulated subject imports was significant over the POI. Cumulated subject imports declined from *** short tons in 2012 to *** short tons in 2013 and then increased to *** short tons in 2014, a level *** percent higher than in 2012.168 Subject imports were *** short tons in interim 2014 and *** short tons in interim 2015.169
Cumulated subject imports increased overall as a share of apparent U.S. consumption in the merchant market during the period, decreasing from *** percent in 2012 to *** percent in 2013, before increasing to *** percent in 2014.170 Subject imports’ share of apparent U.S. consumption in the merchant market was also higher in interim 2015, at *** percent, than in in interim 2014, at *** percent.171 Subject imports’ gain in market share during the POI came at the expense of the domestic industry, which lost 9.7 percentage points of market share in the merchant market from 2012 to 2014 and 4.0 percentage points between interim periods.172
In light of the foregoing, we find that the volume of subject imports and the increase in the volume of subject imports are significant in both absolute terms and relative to consumption.
165 CR/PR at Table V-2. 166 CR at V-9, PR at V-6; Tr. at 57, 115-16 (Blume). 167 19 U.S.C. § 1677(7)(C)(i). 168 See CR/PR at Table IV-2. 169 CR/PR at Table IV-2. 170 CR/PR at Table IV-11. 171 CR/PR at Table C-2. Cumulated subject imports also increased as a share of apparent U.S.
consumption in the overall market during the period, declining from *** percent in 2012 to *** percent in 2013 and then increasing to *** percent in 2014. Subject imports’ share of apparent U.S. consumption in the overall market was *** percent in interim 2014 and *** percent in interim 2015. CR/PR at Table C-1.
172 The domestic industry’s market share by quantity in the merchant market declined during the period of investigation. Its share first increased from 89.3 percent in 2012 to 89.6 percent in 2013 and then declined to 79.6 percent in 2014. CR/PR at Table C-2.
In the overall market, the domestic industry’s market share increased from 95.4 percent in 2012 to 95.6 percent in 2013 and then decreased to 91.1 percent in 2014, for an overall decline of 4.2 percentage points, and its share was higher in interim 2014 (92.5 percent) than in interim 2015 (90.7 percent). See CR/PR at Table IV-10.
30
D. Price Effects of the Subject Imports
Section 771(7)(C)(ii) of the Tariff Act provides that, in evaluating the price effects of subject imports, the Commission shall consider whether –
(I) there has been significant price underselling by the imported merchandise as compared with the price of domestic like products of the United States, and
(II) the effect of imports of such merchandise otherwise depresses prices to a
significant degree or prevents price increases, which otherwise would have occurred, to a significant degree.173
As addressed in section VII.B.4 above, the record indicates that there is a high degree of
substitutability between subject imports and the domestic like product and that price is an important consideration in purchasing decisions.
Seven domestic producers and 25 importers of subject merchandise from Brazil, China India, Japan, Korea, and Russia provided usable quarterly f.o.b. price data for four products,174 although not all firms reported pricing for all products for all quarters.175 The data show that cumulated subject imports undersold the domestic like product in 100 of 167 quarterly comparisons, or 59.9 percent of comparisons, at margins ranging from 0.1 to 18.9 percent.176 There were *** short tons of cumulated subject import shipments involved in underselling comparisons and *** short tons of cumulated subject import shipments involved in overselling comparisons.177 Thus on a volume basis, subject imports undersold the domestic like product *** percent of the time. We also observe that the majority of the instances of underselling (57
173 19 U.S.C. § 1677(7)(C)(ii). 174 CR at V-11, PR at V-8. All four pricing products are defined as cold-rolled carbon steel sheet,
in coils, commercial quality (ASTM A-1008), not interstitial free, not painted, box annealed and temper rolled. The four products, however, differ in dimensions and terms of sale. Product 1 is 24” to 48” in width and 0.0120” to 0.0219” in thickness; Product 2 is 34” to 72” in width and 0.0220” to 0.0849” in thickness; Product 3 is 34” to 72” in width and 0.0220” to 0.0849” in thickness; and Product 4 is 34” to 72” in width and 0.0850” to 0.1350” in thickness. Data for products 1, 2 and 4 are limited to non-contract sales, while product 3 data are restricted to contract sales. CR at V-10, PR at V-7.
175 In 2014, reported pricing data accounted for approximately 16.5 percent of U.S. producers’ U.S. commercial shipments, 98.4 percent of U.S. commercial shipments of subject imports from Brazil, 79.9 percent of U.S. commercial shipments of subject imports from China, 50.9 percent of U.S. commercial shipments of subject imports from India, 2.7 percent of U.S. commercial shipments of subject imports from Japan, 25.4 percent of U.S. commercial shipments of subject imports from Korea, and 19.1 percent of U.S. commercial shipments of subject imports from Russia. CR at V-12, PR at V-8-9. The Commission did not receive any usable pricing data for subject imports from the United Kingdom. CR at V-12 n.12, PR at V-9 n.12. We invite the parties in their comments on the draft questionnaires in any final phase investigations to suggest additional or alternative pricing products that may increase product coverage.
176 CR/PR at Table V-9; CR at V-28 n.20, PR at V-21 n.20. 177 CR/PR at Table V-9.
31
percent) occurred during 2014 as subject imports gained *** percentage points of market share.178 We find this subject import underselling to be significant.
We also examined changes in prices for the domestic like product and the cumulated subject imports. Prices for all pricing products from both domestic and subject sources declined from January 2012 to June 2015.179 Domestic prices for the four pricing products declined between 14.4 and 27.1 percent over the period.180 Although subject imports undersold the domestic like product at the same time that these price declines occurred, other factors in the U.S. market (raw material cost declines, changes in other factory costs, demand changes, and competition between domestic producers) may have affected domestic prices.181 We are therefore unable to conclude on the current record that subject imports depressed domestic prices to a significant degree.182
We have also considered whether subject imports prevented price increases, which otherwise would have occurred, to a significant degree during the POI. As discussed above, in the merchant market apparent U.S. consumption increased from 2012 to 2014 and was lower in interim 2015 than in interim 2014.183 During that time, the domestic industry’s average unit net sales values in the merchant market declined from $789 per short ton in 2012 to $754 per short ton in 2013, and then increased to $793 per short ton in 2014; the average unit net sales value was $793 per short ton in interim 2014 and $726 per short ton in interim 2015.184 By comparison, the domestic industry’s unit COGS declined overall during the POI. Unit COGS were $761 per short ton in 2012, $727 per short ton in 2013, $736 per short ton in 2014, $754 per short ton in interim 2014, and $696 per short ton in interim 2015.185 As a result, the domestic industry’s COGS as a ratio to net sales increased from 96.4 percent in 2012 to 96.5 percent in 2013, but then fell to 92.8 percent in 2014; it was 95.1 percent in interim 2014 and 95.9 percent in interim 2015.186 Based on the overall decline in the domestic industry’s COGS
178 CR at V-28 n.21, PR at V-21 n.21. 179 See CR/PR at Table V-8. 180 See CR/PR at Table V-8. 181 Raw material costs, which accounted for the largest portion of cost of goods sold, declined
over the POI. CR at VI-9, PR at VI-9. Other factory costs, the second largest component of cost of goods sold, increased. CR at VI-10, PR at VI-9.
182 In any final phase of these investigations, we will consider the extent to which both the subject imports and factors other than subject imports, such as changes in the industry’s costs, may have played a role in price declines for cold-rolled steel in the U.S. market.
183 See CR/PR at Table C-2. 184 CR/PR at Table C-2. 185 CR/PR at Table C-2. 186 CR/PR at Table C-2. In the market as whole, the domestic industry’s COGS to net sales ratio
followed a similar trend. See CR/PR at Table VI-1. The ratio increased from 98.4 percent in 2012 to 98.8 percent in 2013, and then declined to 95.7 percent in 2014. The industry’s COGS as a ratio to net sales was 97.7 percent in interim 2014 and 98.5 percent in interim 2015. Id. Based on data for captive production derived from Tables VI-1 and VI-3, the ratio increased from 100.0 percent in 2012 to 100.5 percent in 2013, and then declined 97.8 percent in 2014. It was 99.5 percent in interim 2014 and 100.4 percent in interim 2015. See CR/PR at Tables VI-1 and VI-3.

32
to net sales ratio over the POI, the record does not indicate that subject imports prevented price increases that would have otherwise occurred to a significant degree.187 188
Nevertheless, the record in the preliminary phase of these investigations indicates that as a result of significant underselling by subject imports, the domestic industry lost market share. Therefore, for purposes of the preliminary phase of these investigations, we find that the subject imports had significant price effects.
E. Impact of the Subject Imports189
Section 771(7)(C)(iii) of the Tariff Act provides that the Commission, in examining the impact of the subject imports on the domestic industry, “shall evaluate all relevant economic factors which have a bearing on the state of the industry.” These factors include output, sales, inventories, capacity utilization, market share, employment, wages, productivity, gross profits, net profits, operating profits, cash flow, return on investment, return on capital, ability to raise capital, ability to service debt, research and development, and factors affecting domestic prices. No single factor is dispositive and all relevant factors are considered “within the context of the business cycle and conditions of competition that are distinctive to the affected industry.”190
The domestic industry’s performance declined between 2012 and 2014 by several measures. Despite increasing apparent U.S. consumption, the domestic industry’s performance suffered from 2012 to 2014 in terms of decreases in market share,191 commercial shipments,192
187 CR/PR at Table VI-3. Although the COGS/sales ratio was slightly higher in interim 2015 than
in interim 2014, declines in costs and apparent U.S. consumption made price increases unlikely. 188 CR/PR at Table C-2. We have also considered the lost sales and lost revenue allegations
made against subject imports from Brazil, China, and Russia. The 23 lost sales allegations totaled $52.3 million and involved 80,805 tons of cold-rolled steel, and the six lost revenue allegations totaled $1.1 million and concerned 19,150 tons of cold-rolled steel. CR at V-30, PR at V-22. Purchasers only responded to staff’s inquiries with respect to two of the 29 allegations; only one of the allegations was confirmed. See CR/PR at Tables V-10 and V-11.
189 Commerce initiated antidumping duty investigations of cold-rolled steel from the subject countries based on estimated antidumping duty margins of 30.28 to 35.43 percent for imports from Brazil, an estimated margin of 265.79 percent for imports from China, an estimated margin of 43.12 percent for imports from India, an estimated margin of 71.35 percent for imports from Japan, estimated margins of 75.42 percent to 177.50 percent for imports from Korea, estimated margins of 67.12 percent to 227.52 percent for imports from Russia, and estimated margins of 32.59 percent to 69.30 percent for imports from the United Kingdom. Certain Cold-Rolled Steel Flat Products From Brazil, the People’s Republic of China, India, Japan, the Republic of Korea, the Netherlands, the Russian Federation, and the United Kingdom: Initiation of Less-Than-Fair-Value Investigations, 80 Fed. Reg. 51198 (Aug. 24, 2015).
190 19 U.S.C. § 1677(7)(C)(iii). This provision was recently amended by the Trade Preferences Extension Act of 2015, Pub. L. 114-27.
191 The domestic industry’s market share by quantity in the merchant market first increased from 89.3 percent in 2012 to 89.6 percent in 2013, and then declined to 79.6 percent in 2014. CR/PR at Table C-2. In the overall market, the domestic industry’s share also fell during this period. Its share was 95.4 percent in 2012, 95.6 percent in 2013 and 91.1 percent in 2014. CR/PR at Table C-1.

33
and sales revenues.193 By contrast, the industry’s capacity,194 production,195 capacity utilization, 196 and inventories197 were relatively stable from 2012 to 2014.198 During this period, the industry’s employment and hours worked fell, although wages paid and productivity rose.199 Net sales values,200 gross profit, net income, and operating income all rose from 2012 to 2014, reflecting lower costs for the industry.201 The industry’s operating income as a share
(…Continued)
192 The domestic industry’s commercial shipments were 10.6 million short tons in 2012, 10.5 million short tons in 2013, and 10.2 million short tons in 2014. CR/PR at Table C-2. Total U.S. shipments were 26.2 million short tons in 2012, 26.4 million short tons in 2013, and 26.7 million short tons in 2014. CR/PR at Table C-1.
193 Sales revenues in the merchant market were $8.9 billion during 2012 and $8.4 billion in 2013 and 2014. By quantity, commercial sales were 11.3 million short tons in 2012, 11.1 million short tons in 2013, and 10.6 million short tons in 2014. CR/PR at Table C-2. Total net sales were 26.9 million short tons in 2012, 27.0 million short tons in 2013, and 27.2 million short tons in 2014. CR/PR at Table C-1. Captive consumption was 15.6 million short tons in 2012, 15.9 million short tons in 2013, and 16.6 million short tons in 2014. See CR/PR at Tables VI- 1 and VI-3 (derived from values).
194 The domestic industry’s production capacity was 39.5 million short tons in 20612, 40.0 million short tons in 2013, and 39.5 million short tons in 2014. CR/PR at Table III-5.
195 The domestic industry’s production was 26.9 million short tons in 2012, 27.0 million short tons in 2013, and 27.2 million short tons in 2014. CR/PR at Table C-1.
196 The domestic industry’s capacity utilization rate was 68.1 percent in 2012, 67.5 percent in 2013 and 68.9 percent in 2014. CR/PR at Table C-1.
197 The domestic industry’s end-of-period inventories were stable in full-year comparisons between 2012 and 2014, fluctuating between 4.3 and 4.4 percent of total shipments. CR/PR at Table III-8.
198 As discussed above, we have focused our analysis primarily on the merchant market when assessing market share and the factors affecting the financial performance of the domestic industry. We have also considered the overall market as well as the captive portion of the market.
199 From 2012 to 2014, employment fell by 258 production related workers or 2.3 percent, hours worked decreased by 1.5 percent, wages paid rose by 3.3 percent, and productivity rose by 2.6 percent. CR/PR at Table C-1.
200 The industry’s average unit net sales values in the merchant market declined from $789 per short ton in 2012 to $754 per short ton in 2013, and then increased to $793 per short ton in 2014. CR/PR at Table C-2. In the market as a whole, the industry’s average unit net sales values fell from $760 per short ton in 2012 to $726 per short ton in 2013, and then increased to $762 per short ton in 2014. CR/PR at Table C-1.
201 From 2012 to 2014, operating income and net income improved. Operating income in the merchant market improved from $80.7 million in 2012 to $349.5 million in 2014. Net income in the merchant market improved from a loss of $95.0 million in 2012 to a profit of $277.0 million in 2014. CR/PR at Table C-2.
In the overall market, operating income improved from a loss of $195.5 million in 2012 to a profit of $255.1 million in 2014. Net income improved from a loss of $547.1 million in 2012 to a profit of $22.8 million in 2014. CR/PR at Table C-1.
The domestic industry’s performance in the captive portion of the market improved from an operating loss of $276.2 million in 2012 to an operating loss of $94.4 million in 2014. Its net loss on (Continued…)

34
of net sales, and the industry’s ratio of operating income to total assets, also increased from 2012 to 2014.202 The industry’s capital expenditures declined during the period, and its research and development (“R&D”) expenditures increased slightly.203
Between the interim periods, however, the domestic industry’s performance deteriorated by virtually all measures. While apparent U.S. consumption was 6.5 percent lower in the merchant market in interim 2015 than in interim 2014, the domestic industry’s U.S. commercial shipments were 11.1 percent lower, and the value of its commercial sales was down 18.1 percent.204 Its market share was 4.0 percentage points lower in the merchant market.205 The domestic industry’s production was 9.0 percent lower and its rate of capacity utilization was 6.0 percentage points lower.206 The number of production-related workers also decreased 2.9 percent, and other employment-related indicators (wages, hours, productivity) were lower in interim 2015 than in interim 2014.207 In the merchant market, the domestic industry’s commercial net sales volume was 10.5 percent lower in interim 2015 than in interim
(…Continued) captive consumption declined from $452.1 million to $254.1 million. See CR/PR at Tables VI- 1 and VI-3 (derived from values).
202 The domestic industry’s operating income as a share of net sales in the merchant market decreased from 0.9 percent in 2012 to 0.7 percent in 2013 before increasing to 4.1 percent in 2014. CR/PR at Table C-2. In the overall market, the ratio decreased from negative 1.0 percent in 2012 to negative 1.6 percent in 2013 and then increased to 1.2 percent in 2014. CR/PR at Table C-1. In the captive market, the ratio improved from negative 2.4 percent in 2012 to negative 0.8 percent in 2014. See CR/PR at Tables VI- 1 and VI-3 (derived from values).
The industry’s return on assets, expressed as operating income as a share of total assets, decreased from negative 1.7 percent in 2012 to negative 2.8 percent in 2013 before improving to 2.7 percent in 2014. CR/PR at Table VI-8.
203 The domestic industry’s capital expenditures decreased from $528.3 million in 2012 to $315.0 million in 2013 and then to $314.7 million in 2014. CR/PR at Table VI-7. The industry’s R&D expenses increased from $*** in 2012 to $*** in 2013 and then fell to $*** in 2014. Id.
204 CR/PR at Table C-2. Commercial shipments were 5.2 million short tons in interim 2014 and 4.7 million short tons in interim 2015. Commercial sales were $4.4 million in interim 2014 and $3.6 million in interim 2015. CR/PR at Table C-2. In the total market, the industry’s production was 13.8 million short tons in interim 2014 and 12.5 million short tons in interim 2015. The industry’s capacity utilization rate was 69.4 percent in interim 2014 and 63.4 percent in interim 2015. By contrast, capacity showed little change; it was 19.8 million short tons in interim 2014 and 19.7 million short tons in interim 2015. End of period inventories were 3.5 percent higher in interim 2015 relative to interim 2014. CR/PR at Table C-1.
Total U.S. shipments were 13.6 million short tons in interim 2014 and 12.3 million short tons in interim 2015. CR/PR at Table C-1. Captive consumption was 8.4 million short tons in interim 2014 and 7.7 million short tons in interim 2015. See CR/PR at Tables VI-1 and VI-3 (derived from values).
205 The domestic industry’s share of the merchant market was 82.6 percent in interim 2014 and 78.6 percent in interim 2015. CR/PR at Table C-2. In the overall market, the domestic industry’s share was 92.5 percent in interim 2014 and 90.7 percent in interim 2015. CR/PR at Table C-1.
206 CR/PR at Tables C-1 and III-5. 207 CR/PR at Table C-1.

35
2014 and its sales revenues were 18.1 percent lower.208 In interim 2015, the industry’s gross profit in the merchant market was 31.3 percent lower than in interim 2014, its operating income was 80.1 percent lower, and the industry’s net income turned into a loss.209 As a share of net sales in the merchant market, the industry’s operating income was 0.4 percent in interim 2015, down from 1.8 percent in interim 2014.210
For purposes of the preliminary phase of these investigations, we find that subject imports had a significant impact on the domestic industry by the end of the POI. Subject import volume increased significantly in absolute terms during the POI, and subject import market share also increased as the domestic industry’s market share declined in the merchant market and overall market.211 Pervasive subject import underselling led to lower production, shipments, sales, revenues, and market share for the domestic industry than levels that they otherwise would have reached.
Respondents claim that there is no causal link between subject imports and negative effects on the domestic industry because the domestic industry improved by some measures in 2014 when subject imports were increasing; they instead argue that the industry’s financial performance was driven by changes in certain costs (i.e., other factory costs) that were unrelated to subject imports.212 We do not find these arguments persuasive. As discussed above, the domestic industry experienced declines from 2012 to 2014 in such indicators as market share, shipments, and sales revenues in the merchant market as subject imports gained in volume and market share and apparent consumption rose. The industry’s performance was worse for many indicators in interim 2015 than in interim 2014, while the volume and market share of subject imports were higher.213
208 CR/PR at Table C-2. Net sales quantities were 9.1 percent lower in the overall market during
interim 2015 relative to interim 2014. CR/PR at Table C-1. Net sales values in the overall market were also 17.3 percent lower in the overall market during interim 2015 relative to interim 2014. CR/PR at Table C-1 (constructed fair market value).
209 CR/PR at Table C-2. In the total market, the industry’s gross profit was 47.5 percent lower and its net loss was 95.7 percent greater in interim 2015 than in interim 2014. CR/PR at Table C-1. The domestic industry’s gross profit on captive consumption in interim 2014 also turned to a loss in interim 2015, and its net loss on its captive consumption increased 39.4 percent. See CR/PR at Tables VI- 1 and VI-3 (derived from values).
210 CR/PR at Table C-2. Five responding producers reported the cancellation, postponement, or rejection of expansion projects, one reported a reduction in the size of capital investments, six reported that their return on specific investments was negatively impacted, and six reported other negative effects on investment. CR/PR at Table VII-9. Two responding producers reported a lowering of their credit ratings, one reported a reduced ability to service its debt, and six reported other negative effects on their growth and development. Id.
211 See CR/PR at Tables C-1 and C-2. 212 Korean Respondents’ Brief at 26-28. 213 Moreover, under the statute, the Commission’s analysis cannot be limited to whether the
industry’s performance improved on an absolute basis if subject imports still had significant effects. 19 U.S.C. § 1677(7)(J).

36
Additionally, the parties expressed differing views concerning the reasons for the decline in apparent U.S. consumption during interim 2015 and whether the decline was due to stockpiling of subject imports at service centers or an actual decline in demand. Petitioners contended that inventories of subject imports were drawn down during interim 2015. The record indicates that importers’ inventories of cold-rolled steel increased at the end of 2014 relative to 2013; inventories held by service centers rose in late 2014, although we note that this data is not limited to the domestic like product.214 We will further examine the issue of inventories held at service centers in any final phase of the investigations.
We have considered whether there are other factors that may have had an impact on the domestic industry during the POI to ensure that we are not attributing injury from such other factors to subject imports. Nonsubject imports as a share of apparent U.S. consumption in the merchant market increased from 5.0 percent in 2012 to 5.1 percent in 2013 and then 7.3 percent in 2014.215 Nonsubject imports’ share of apparent U.S. consumption was 7.1 percent in interim 2014 and 6.6 percent in interim 2015.216 The pricing data also indicate that nonsubject imports were priced higher than the domestic product and subject imports during the POI.217 Consequently, nonsubject imports cannot explain the domestic industry’s loss of market share and revenues due to underselling by subject imports. As discussed above, the majority of nonsubject imports were from Canada, and a majority of nonsubject imports from Canada were imported by domestic producers. We intend to further investigate the role of nonsubject imports in the U.S. market, including those imported by U.S. producers, in any final phase of the investigations.
For the reasons stated above, we determine that there is a reasonable indication that an industry in the United States is materially injured by reason of imports of cold-rolled steel from Brazil, China, India, Japan, Korea, Russia, and the United Kingdom that are allegedly sold in the United States at LTFV and by reason of imports of cold-rolled steel that are allegedly subsidized by the governments of Brazil, China, Korea, and Russia.
214 See CR at II-16, PR at II-10; CR/PR at Table VII-142. 215 CR/PR at Table C-2. In the market as a whole, nonsubject imports’ share of apparent U.S.
consumption was 2.2 percent in 2012 and 2013 and 3.2 percent in 2014. CR/PR at Table C-1. Imports from the Netherlands are presented separately in this table.
216 CR/PR at Table C-1. Imports from the Netherlands are presented separately in this table. 217 See CR/PR at Appendix D-3.

37
Reasonable Indication of Threat of Material Injury by Reason of Allegedly IX.Subsidized Subject Imports from India
As discussed earlier, we have determined that subject imports from India would imminently account for more than four percent of all subject merchandise imported into the United States. Therefore we proceed to determine whether there is a reasonable indication that the U.S. industry is threatened with material injury by reason of allegedly subsidized subject imports from India.
A. Legal Standard
Section 771(7)(F) of the Tariff Act directs the Commission to determine whether there is a reasonable indication that the U.S. industry is threatened with material injury by reason of subject imports by analyzing whether “further dumped or subsidized imports are imminent and whether material injury by reason of imports would occur unless an order is issued or a suspension agreement is accepted.”218 The Commission may not make such a determination “on the basis of mere conjecture or supposition,” and considers the threat factors “as a whole” in making its determination whether dumped or subsidized imports are imminent and whether material injury by reason of subject imports would occur unless an order is issued.219 In making our determinations, we consider all statutory threat factors that are relevant to these investigations.220
218 19 U.S.C. § 1677(7)(F)(ii). 219 19 U.S.C. § 1677(7)(F)(ii). 220 These factors are as follows: (I) if a countervailable subsidy is involved, such information as may be presented to it by the
administering authority as to the nature of the subsidy (particularly as to whether the countervailable subsidy is a subsidy described in Article 3 or 6.1 of the Subsidies Agreement) and whether imports of the subject merchandise are likely to increase,
(II) any existing unused production capacity or imminent, substantial increase in production capacity in the exporting country indicating the likelihood of substantially increased imports of the subject merchandise into the United States, taking into account the availability of other export markets to absorb any additional exports,
(III) a significant rate of increase of the volume or market penetration of imports of the subject merchandise indicating the likelihood of substantially increased imports,
(IV) whether imports of the subject merchandise are entering at prices that are likely to have a significant depressing or suppressing effect on domestic prices and are likely to increase demand for further imports,
(V) inventories of the subject merchandise, (VI) the potential for product-shifting if production facilities in the foreign country, which can be
used to produce the subject merchandise, are currently being used to produce other products, … (VIII) the actual and potential negative effects on the existing development and production
efforts of the domestic industry, including efforts to develop a derivative or more advanced version of the domestic like product, and (Continued…)

38
B. Cumulation for Threat
Because our determinations involve the issue of reasonable indication of threat of material injury by reason of subject imports, we must consider whether to cumulate allegedly subsidized subject imports from India with those from other sources eligible for cumulation. In contrast to cumulation for material injury, cumulation for a threat analysis is discretionary. Under Section 771(7)(H) of the Tariff Act, the Commission may “to the extent practicable” cumulatively assess the volume and price effects of subject imports from all countries as to which petitions were filed on the same day if the requirements for cumulation in the material injury context are satisfied.221 While imports from the Netherlands remain ineligible for cumulation because the antidumping investigation with respect to these imports has been terminated, imports from all other sources subject to investigation remain eligible for cumulation with allegedly subsidized subject imports from India for purposes of the threat analysis.222
Petitioners contend that the Commission should cumulate all subject imports for purposes of the threat analysis.223 With respect to subject imports from Brazil, Korea, Japan, and the United Kingdom, respondents argue that the Commission should not cumulate subject imports from their individual subject countries with any other subject imports for the purposes of its threat analysis. They contend that there are important differences in the conditions of competition with respect to imports from each of these four countries, as well as different trends in import volumes and prices, that individually distinguish cold-rolled steel from Brazil, Korea, Japan, and the United Kingdom from other subject imports.224
We found above that there is a reasonable overlap of competition between all subject imports eligible for cumulation and between imports from each of these subject countries and
(…Continued)
(IX) any other demonstrable adverse trends that indicate the probability that there is likely to be material injury by reason of imports (or sale for importation) of the subject merchandise (whether or not it is actually being imported at the time).
19 U.S.C. § 1677(7)(F)(i). To organize our analysis, we discuss the applicable statutory threat
factors using the same volume/price/impact framework that applies to our material injury analysis. Statutory threat factors (I), (II), (III), (V), and (VI) are discussed in the analysis of subject import volume. Statutory threat factor (IV) is discussed in the analysis of subject import price effects. Statutory factors (VIII) and (IX) are discussed in the analysis of impact. Statutory factor (VII) concerning agricultural products is inapplicable to these investigations.
221 19 U.S.C. § 1677(7)(H). 222 See 19 U.S.C. § 1677(7)(G)(ii), (7)(H); see generally Oil Country Tubular Goods from India,
Korea, the Philippines, Taiwan, Turkey, Ukraine, and Vietnam, Inv. Nos. 701-TA-499-500, 731-TA-1215-1217, 1219-1123 (Final), USITC Pub. 4489 at 50 (Sept. 2014).
223 ArcelorMittal Brief at 15-16; U.S. Steel Brief at 39-40. 224 Korean Respondents Brief at 38-40; CSN Brief at 4-6; Japanese Respondents Brief at 10; Tata
UK Brief at 2-4.

39
the domestic like product.225 There is no information on the record to suggest that the reasonable overlap of competition between and among subject imports and the domestic like product that now exists will not continue into the imminent future. We find that it is appropriate to exercise our discretion to cumulate eligible subject imports from Brazil, China India, Japan, Korea, Russia, and the United Kingdom for purposes of our threat analysis. We recognize the potential for some differences in conditions of competition among subject imports from the seven countries but find that they are not significant enough to warrant not cumulating allegedly subsidized subject imports from India with the other subject imports eligible for cumulation. In addition, the quantity of subject imports from each subject country increased from 2012 to 2014,226 and prices for subject imports from all seven sources declined over the POI.227 For these reasons, we conclude that it is appropriate to exercise our discretion to cumulate allegedly subsidized subject imports from India with the other subject imports eligible for cumulation in the preliminary phase of these investigations for our analysis of whether there is a reasonable indication of a threat of material injury to the domestic industry.
B. Analysis of Threat of Material Injury Factors
1. Likely Volume
We found in Section VII.C. above that the volume of cumulated subject imports and the increase in the volume of these imports over the POI was significant in absolute terms and relative to consumption. Cumulated subject imports are likely to maintain a significant presence in the U.S. market, and the significant increase in cumulated subject import volume observed during the POI is likely to persist in the imminent future. The producers in the subject countries have excess capacity, export in appreciable quantities, and have demonstrated the ability, on a cumulated basis, to increase exports to the U.S. market. The combined excess capacity for the industries in Brazil, India, Japan, Korea, Russia, and the United Kingdom amounted to *** short tons in 2014.228 This figure is more than *** times total subject imports from those six countries in 2014 and equivalent to over *** percent of total apparent U.S. consumption in 2014.229 Total export shipments of the industries in these six countries increased from *** short tons and 19.8 percent of their total shipments in 2012 to *** short tons and *** percent of their total shipments in 2014.230 Their exports to the United States, as
225 As explained above, this analysis included allegedly dumped imports from India (which are
identical to the allegedly subsidized imports from India), as well as subject imports from Brazil, China, Japan, Korea, Russia, and the United Kingdom.
226 CR/PR at Table IV-2. 227 CR/PR at Table V-8. 228 Derived from CR/PR at Table VII-41. 229 Derived from CR/PR at Tables IV-2, IV-8. 230 CR/PR at Table VII-41.
40
a share of their total shipments, more than doubled from 2012 to 2014.231 These data on subject producers’ aggregate excess capacity and exports do not include data for the industry in China because no subject producers in China responded to the Commission’s questionnaire.232 Public data indicate, however, that China has the world’s largest cold-rolled steel industry, with enormous capacity, production, and exports.233
Despite some monthly declines in cumulated subject import volume in the latter portion of the POI, these imports were higher in interim 2015, at *** short tons, than in interim 2014, at *** short tons, and were at elevated levels relative to the earlier portions of the POI.234 Moreover, cumulated inventories held by the subject producers in Brazil, India, Japan, Korea, Russia, and the United Kingdom relative to their total production and total shipments increased from 2012 to 2014 and were higher in interim 2015 than in interim 2014.235
In light of the increases in cumulated subject import volume and market penetration observed during the POI, the substantial cumulated excess capacity of the subject industries, and the subject industries’ demonstrated ability to supply export markets generally and the United States in particular, we find that the significant increase in cumulated subject import volume that occurred during the POI will likely continue in the imminent future.236
2. Likely Price Effects
As explained in Section VII.D. above, the domestic like product and subject imports are highly substitutable, and price is an important consideration in purchasing decisions. We found significant underselling by subject imports, which caused the domestic industry to lose market share. The significant and increasing volumes of subject imports that will likely enter the U.S. market in the imminent future will likely continue predominantly to undersell the domestic like product at significant rates, as they did during the POI, absent the issuance of any orders. The
231 CR/PR at Table VII-41. Additionally, certain producers in Brazil, Japan, Korea, and Russia manufacture products other than cold-rolled steel in the facilities that they use to produce subject merchandise. CR at VII-6-7, VII-23, VII-29, VII-40, PR at VII-5, VII-14, VII-19, VII-25.
232 CR at VII-9, PR at VII-7; CR/PR at Table VII-41. 233 CR at VII-9-12, PR at VII-7-8. 234 E.g., CR/PR at Tables IV-2, F-1. Available monthly data indicate that cumulated subject
imports increased sharply from August to September 2014, when they reached a period high, and then increased to a new period high in October 2014. Since then, monthly subject import volumes have fluctuated, but are well above any levels reached from January 2012 through March 2014. CR/PR at Table F-1.
235 CR/PR at Table VII-41. Inventories of subject merchandise in the United States were higher on an absolute basis in 2014 than in 2012 and higher in interim 2015 than in interim 2014, but fluctuated in a relatively narrow range relative to shipments. CR/PR at Table VII-42.
Additionally, cold-rolled steel from several individual subject countries – China, Japan, Korea, Russia, and the United Kingdom – is subject to antidumping duty or safeguard measures in third countries. CR/PR at Table VII-44.
236 Commerce has initiated countervailing duty investigations on 67 alleged subsidy programs in Brazil, 65 alleged subsidy programs in China, 41 alleged subsidy programs in India, 38 alleged subsidy programs in Korea, and ten alleged subsidy programs in Russia. CR at I-11-20, PR at I-8-16.

41
likely low prices of the subject imports, in turn, are likely to increase demand for the subject imports, displace sales of the domestic like product, and cause reduction in the domestic industry’s market share in the imminent future, as they did during the POI. Accordingly, we find that subject imports are likely in the imminent future to enter the U.S. market at prices that are likely to increase demand for further imports.
3. Likely Impact
We found in Section VII.E. above that the subject imports had a significant impact on the domestic industry during the POI. In our threat analysis, we have found that cumulated subject imports are likely to continue both to enter the U.S. market in significant and increasing volumes and to engage in significant underselling of the domestic like product in the imminent future. We conclude that cumulated subject imports will likely have the same type of adverse impact on the domestic industry in the imminent future that they did during the POI. The significant volumes of low-priced subject imports will likely continue to displace sales of the domestic like product and cause the domestic industry to lose market share, which will lead to adverse effects on the domestic industry’s revenues and financial performance.
In Section VII.E., we have already considered other factors, including nonsubject imports, and concluded that any injury that may be attributable to these factors is distinct from the injury attributable to the subject imports. This analysis is equally pertinent to likely conditions in the imminent future. We accordingly find that further subject imports are imminent and that material injury by reason of subject imports would occur unless orders are issued on subject imports. Accordingly, we have made an affirmative determination of a reasonable indication of threat of material injury in the countervailing duty investigation of cold-rolled steel from India.
IX. Conclusion
For the foregoing reasons, we conclude that there is a reasonable indication that an industry in the United States is materially injured by reason of imports of cold-rolled steel from Brazil, China, India, Japan, Korea, Russia, and the United Kingdom that are allegedly sold at LTFV and by reason of imports of cold-rolled steel that are allegedly subsidized by the governments of Brazil, China, Korea, and Russia, and a reasonable indication that an industry in the United States is threatened with material injury by reason of allegedly subsidized imports of cold-rolled steel from India. We also conclude that allegedly dumped imports of cold-rolled steel from the Netherlands are negligible.


I-1
PART I: INTRODUCTION
BACKGROUND
These investigations result from a petition filed with the U.S. Department of Commerce (“Commerce”) and the U.S. International Trade Commission (“USITC” or “Commission”) by AK Steel Corporation (“AK Steel”) (West Chester, Ohio), ArcelorMittal USA LLC (“ArcelorMittal USA”) (Chicago, Illinois), Nucor Corporation (“Nucor”) (Charlotte, North Carolina), Steel Dynamics, Inc. (“Steel Dynamics”) (Fort Wayne, Indiana), and United States Steel Corporation (“U.S. Steel”) (Pittsburgh, Pennsylvania), on July 28, 2015, alleging that an industry in the United States is materially injured and threatened with material injury by reason of subsidized imports of cold-rolled steel 1 from Brazil, China, India, Korea, and Russia and less-than-fair-value (“LTFV”) imports of cold-rolled steel from Brazil, China, India, Japan, Korea, Netherlands, Russia, and the United Kingdom. The following tabulation provides information relating to the background of these investigations.2 3
Effective date Action
July 28, 2015
Petition filed with Commerce and the Commission; institution of Commission investigations (80 FR 46047, August 3, 2015)
August 18, 2015 Commission’s conference
August 24, 2015 Commerce’s notice of initiation of countervailing duty investigations (80 FR 51206, August 24, 2015)
August 24, 2015 Commerce’s notice of initiation of antidumping duty investigations (80 FR 51198, August 24, 2015)
September 10, 2015 Commission’s vote September 11, 2015 Commission’s determinations September 18, 2015 Commission’s views
STATUTORY CRITERIA AND ORGANIZATION OF THE REPORT
Statutory criteria
Section 771(7)(B) of the Tariff Act of 1930 (the “Act”) (19 U.S.C. § 1677(7)(B)) provides that in making its determinations of injury to an industry in the United States, the Commission--
shall consider (I) the volume of imports of the subject merchandise, (II) the effect of imports of that merchandise on prices in the United States for
1 See the section entitled “The Subject Merchandise” in Part I of this report for a complete description of the merchandise subject to these investigations.
2 Pertinent Federal Register notices are referenced in appendix A, and may be found at the Commission’s website (www.usitc.gov).
3 A list of witnesses appearing at the conference is presented in appendix B of this report.

I-2
domestic like products, and (III) the impact of imports of such merchandise on domestic producers of domestic like products, but only in the context of production operations within the United States; and. . . may consider such other economic factors as are relevant to the determination regarding whether there is material injury by reason of imports.
Section 771(7)(C) of the Act (19 U.S.C. § 1677(7)(C)) further provides that--4 In evaluating the volume of imports of merchandise, the Commission shall consider whether the volume of imports of the merchandise, or any increase in that volume, either in absolute terms or relative to production or consumption in the United States is significant.. . .In evaluating the effect of imports of such merchandise on prices, the Commission shall consider whether. . .(I) there has been significant price underselling by the imported merchandise as compared with the price of domestic like products of the United States, and (II) the effect of imports of such merchandise otherwise depresses prices to a significant degree or prevents price increases, which otherwise would have occurred, to a significant degree.. . . In examining the impact required to be considered under subparagraph (B)(i)(III), the Commission shall evaluate (within the context of the business cycle and conditions of competition that are distinctive to the affected industry) all relevant economic factors which have a bearing on the state of the industry in the United States, including, but not limited to. . . (I) actual and potential decline in output, sales, market share, gross profits, operating profits, net profits, ability to service debt, productivity, return on investments, return on assets, and utilization of capacity, (II) factors affecting domestic prices, (III) actual and potential negative effects on cash flow, inventories, employment, wages, growth, ability to raise capital, and investment, (IV) actual and potential negative effects on the existing development and production efforts of the domestic industry, including efforts to develop a derivative or more advanced version of the domestic like product, and (V) in {an antidumping investigation}, the magnitude of the margin of dumping.
In addition, Section 771(7)(J) of the Act (19 U.S.C. § 1677(7)(J)) provides that—5 (J) EFFECT OF PROFITABILITY.—The Commission may not determine that there is no material injury or threat of material injury to an industry in the
4 Amended by PL 114-27 (as signed, June 29, 2015), Trade Preferences Extension Act of 2015. 5 Amended by PL 114-27 (as signed, June 29, 2015), Trade Preferences Extension Act of 2015.

I-3
United States merely because that industry is profitable or because the performance of that industry has recently improved.
Organization of report
Part I of this report presents information on the subject merchandise, alleged subsidy and dumping margins, and domestic like product. Part II of this report presents information on conditions of competition and other relevant economic factors. Part III presents information on the condition of the U.S. industry, including data on capacity, production, shipments, inventories, and employment. Parts IV and V present the volume of subject imports and pricing of domestic and imported products, respectively. Part VI presents information on the financial experience of U.S. producers. Part VII presents the statutory requirements and information obtained for use in the Commission’s consideration of the question of threat of material injury as well as information regarding nonsubject countries.
MARKET SUMMARY
Cold-rolled steel generally is used in any project where tolerances, surface condition, concentricity, and straightness are the major factors. The leading U.S. producers of cold-rolled steel are AK Steel, ArcelorMittal USA, Nucor, Steel Dynamics, and U.S. Steel, while leading producers of cold-rolled steel outside the United States include ArcelorMittal Brasil S/A (“ArcelorMittal Brasil”) and Usinas Siderúrgicas De Minas Gerais (“USIMINAS”) of Brazil, Boasteel, Benxi Steel, and Anshan of China, ArcelorMittal Dofasco, Inc. of Canada, JSW Steel of India, Nippon Steel & Sumitomo Metal and JFE Steel of Japan, POSCO of Korea, Ternium MX of Mexico, NLMK of Russia, Tata Steel IJmuiden BV (“Tata Steel Ijmuiden”) of Netherlands, SSAB Tunnplat of Sweden, and Tata Steel United Kingdom (“Tata Steel UK”).
The leading U.S. importers of cold-rolled steel from Brazil are ***. The leading importers of cold-rolled steel from China are ***. The leading U.S. importers of cold-rolled steel from India are ***. The leading importers of cold-rolled steel from Japan are ***. The leading U.S. importers of cold-rolled steel from Korea are ***. The leading importer of cold-rolled steel from the Netherlands is ***. The leading U.S. importers of cold-rolled steel from Russia are ***. The leading importer of cold-rolled steel from the United Kingdom is ***. Leading importers of cold-rolled steel from top nonsubject sources include ***.
Apparent U.S. consumption of cold-rolled steel totaled approximately 29.3 million short tons ($21.9 billion) in 2014. Currently, at least 12 firms are known to produce cold-rolled steel in the United States. U.S. producers’ U.S. shipments of cold-rolled steel totaled 26.7 million short tons ($19.9 billion) in 2014, and accounted for 91.1 percent of apparent U.S. consumption by quantity and 90.7 percent by value. U.S. imports from subject sources totaled 1.7 million short tons ($1.2 billion) in 2014 and accounted for 5.7 percent of apparent U.S. consumption by quantity and 5.5 percent by value. U.S. imports from nonsubject sources totaled 0.9 million short tons ($827 million) in 2014 and accounted for 3.2 percent of apparent U.S. consumption by quantity and 3.8 percent by value.
Apparent U.S. consumption of cold-rolled steel in the merchant market totaled approximately 12.8 million short tons ($10.0 billion) in 2014. U.S. producers’ merchant market

I-4
U.S. shipments of cold-rolled steel totaled 10.2 million short tons ($8.0 billion) in 2014, and accounted for 79.6 percent of apparent U.S. merchant market consumption by quantity and 79.8 percent by value. U.S. imports from subject sources totaled 1.7 million short tons ($1.2 billion) in 2014 and accounted for 13.1 percent of apparent U.S. merchant market consumption by quantity and 12.0 percent by value. U.S. imports from nonsubject sources totaled 0.9 million short tons ($827 million) in 2014 and accounted for 7.3 percent of apparent U.S. merchant market consumption by quantity and 8.3 percent by value.
SUMMARY DATA AND DATA SOURCES
A summary of data collected in these investigations is presented in appendix C, tables C-1 and C-2. Except as noted, U.S. industry data are based on questionnaire responses of twelve firms that accounted for vast majority of U.S. production of cold-rolled steel during 2014. U.S. imports are based on official import statistics for non-alloy cold-rolled steel6 as supplemented from importer questionnaire responses to include imports of certain alloy cold-rolled steel.7 8
6 HTS statistical reporting numbers 7209.15.0000, 7209.16.0030, 7209.16.0060, 7209.16.0070, 7209.16.0091, 7209.17,0030, 7209.17.0060, 7209.17,0070, 7209.17.0091, 7209.18.1530, 7209.18.1560, 7209.18.2510, 7209.18.2520, 7209.18.2580, 7209.18.6020, 7209.18.6090, 7209.25.0000, 7209.26.0000, 7209.27.0000, 7209.28.0000, 7209.90.0000, 7210.70.3000, 7211.23.1500, 7211.23.2000, 7211.23.3000, 7211.23.4500, 7211.23.6030, 7211.23.6060, 7211.23.6075, 7211.23.6085, 7211.29.2030, 7211.29.2090, 7211.29.4500, 7211.29.6030, 7211.29.6080, 7211.90.0000, 7212.40.1000, and 7212.40.5000.
7 Certain alloy cold-rolled steel, a subset of cold-rolled steel, in which: (1) iron predominates by weight, over each of the other contained elements; (2) the carbon content is 2 percent or less, by weight; and (3) one or more of the elements listed below is present in the quantity, by weight, respectively indicated:
• 0.30 - 1.50 percent of aluminum • 0.0008 – unlimited percent of boron • 0.40 – 1.50 percent of copper • 0.30 – 1.25 percent of chromium • 1.65 – 2.50 percent of manganese • 0.08 – 0.80 percent of molybdenum • 0.30 – 2.00 percent of nickel • 0.06 – 0.10 percent of niobium (also called columbium) • 0.60 – 3.30 percent of silicon • 0.05 – unlimited percent of titanium • 0.10 – 0.30 percent of vanadium • 0.05 – 0.30 percent of zirconium 8 Staff adjusted imports of certain alloy cold-rolled steel for one importer,*** that was the importer
of record for U.S. imports under alloy cold-rolled HTS numbers (7225.50.6000, 7225.50.8015, 7225.50.8085, 7225.99.0090, 7226.92.5000, 7226.92.7050, and 7226.92.8050), but did not report any U.S. imports of alloy cold-rolled steel in its questionnaire response. Staff contacted ***, but did not receive a timely response. Given this firm reported U.S. imports of cold-rolled steel from *** approximated those reported under nonalloy and alloy HTS numbers, Staff used official U.S. import
(continued...)
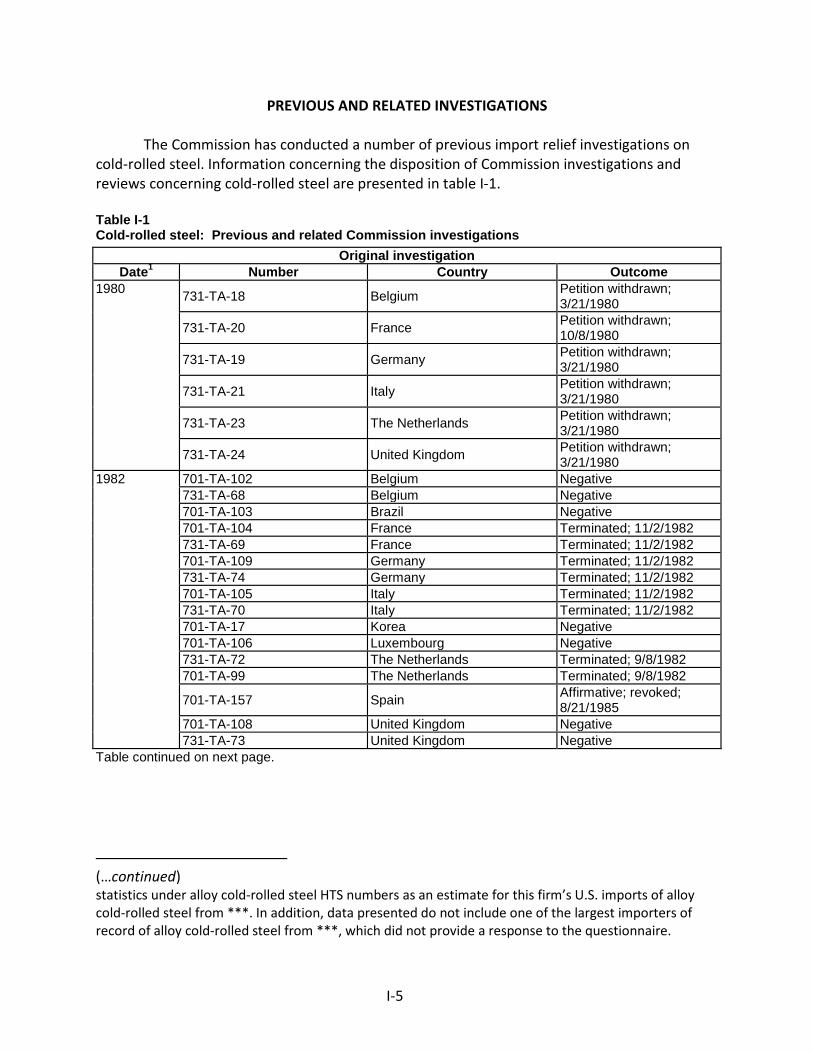
I-5
PREVIOUS AND RELATED INVESTIGATIONS
The Commission has conducted a number of previous import relief investigations on cold-rolled steel. Information concerning the disposition of Commission investigations and reviews concerning cold-rolled steel are presented in table I-1. Table I-1 Cold-rolled steel: Previous and related Commission investigations
Original investigation Date1 Number Country Outcome
1980 731-TA-18 Belgium Petition withdrawn; 3/21/1980
731-TA-20 France Petition withdrawn; 10/8/1980
731-TA-19 Germany Petition withdrawn; 3/21/1980
731-TA-21 Italy Petition withdrawn; 3/21/1980
731-TA-23 The Netherlands Petition withdrawn; 3/21/1980
731-TA-24 United Kingdom Petition withdrawn; 3/21/1980
1982 701-TA-102 Belgium Negative 731-TA-68 Belgium Negative 701-TA-103 Brazil Negative 701-TA-104 France Terminated; 11/2/1982 731-TA-69 France Terminated; 11/2/1982 701-TA-109 Germany Terminated; 11/2/1982 731-TA-74 Germany Terminated; 11/2/1982 701-TA-105 Italy Terminated; 11/2/1982 731-TA-70 Italy Terminated; 11/2/1982 701-TA-17 Korea Negative 701-TA-106 Luxembourg Negative 731-TA-72 The Netherlands Terminated; 9/8/1982 701-TA-99 The Netherlands Terminated; 9/8/1982
701-TA-157 Spain Affirmative; revoked; 8/21/1985
701-TA-108 United Kingdom Negative 731-TA-73 United Kingdom Negative
Table continued on next page.
(…continued) statistics under alloy cold-rolled steel HTS numbers as an estimate for this firm’s U.S. imports of alloy cold-rolled steel from ***. In addition, data presented do not include one of the largest importers of record of alloy cold-rolled steel from ***, which did not provide a response to the questionnaire.

I-6
Table I-1--Continued Cold-rolled steel: Previous and related Commission investigations
Original investigation Date1 Number Country Outcome
1984 701-TA-218 Korea Affirmative; revoked; 10/10/1985
701-TA-207 Brazil Affirmative; revoked; 9/6/1985
731-TA-154 Brazil Negative
731-TA-176 South Africa Petition withdrawn; 1/18/1985
701-TA-177 Spain Petition withdrawn; 1/18/1985
731-TA-175 Argentina Negative
701-TA-230 Austria Affirmative; revoked; 5/7/1986
731-TA-224 Austria Terminated; 8/19/1985 731-TA-225 Czechoslovakia Petition withdrawn; 6/4/1985
731-TA-227 Finland Petition withdrawn; 1/18/1985
731-TA-226 Germany Terminated; 8/14/1985 731-TA-228 Romania Terminated; 7/19/1985
701-TA-231 Sweden Affirmative; Review: USITC negative; 12/1/2000
701-TA-232 Venezuela Terminated; 7/19/1985 1992 731-TA-598 Australia Negative
701-TA-343 New Zealand Negative 701-TA-345 Taiwan Negative 701-TA-346 United Kingdom Negative 731-TA-611 United Kingdom Negative 731-TA-597 Argentina Negative 701-TA-336 Austria Negative 731-TA-599 Austria Negative 701-TA-337 Belgium Negative 731-TA-600 Belgium Negative 701-TA-338 Brazil Negative 731-TA-601 Brazil Negative 731-TA-602 Canada Negative 701-TA-339 France Negative 731-TA-603 France Negative
701-TA-340 Germany Affirmative; Review: USITC negative; 12/1/2000
731-TA-604 Germany Affirmative; Review: USITC negative; 12/1/2000
701-TA-341 Italy Negative 731-TA-607 Italy Negative 731-TA-606 Japan Negative
701-TA-342 Korea Affirmative; Review: USITC negative; 12/1/2000
731-TA-607 Korea Affirmative; Review: USITC negative; 12/1/2000
Table continued on next page.

I-7
Table I-1--Continued Cold-rolled steel: Previous and related Commission investigations
Original investigation Date1 Number Country Outcome
1992 731-TA-608 The Netherlands Affirmative; Review: USITC negative; 12/1/2000
701-TA-344 Spain Negative 731-TA-609 Spain Negative 731-TA-611 Taiwan Negative
1999 701-TA-394 Indonesia Negative (Negligible) 701-TA-395 Thailand Negative (Negligible) 701-TA-396 Venezuela Negative (Negligible) 731-TA-829 Argentina Negative 701-TA-393 Brazil Negative 731-TA-830 Brazil Negative 731-TA-831 China Negative 731-TA-832 Indonesia Negative 731-TA-833 Japan Negative 731-TA-834 Russia Negative 731-TA-835 Slovakia Negative 731-TA-836 South Africa Negative 731-TA-837 Taiwan Negative 731-TA-838 Thailand Negative 731-TA-839 Turkey Negative 731-TA-840 Venezuela Negative
2001 701-TA-422 Argentina Negative 701-TA-423 Brazil Negative 701-TA-424 France Negative 701-TA-425 Korea Negative 731-TA-964 Argentina Negative 731-TA-965 Brazil Negative 731-TA-966 Turkey Negative 731-TA-967 Australia Negative 731-TA-968 China Negative 731-TA-969 New Zealand Negative 731-TA-970 Belgium Negative 731-TA-971 France Negative 731-TA-972 Russia Negative 731-TA-973 Venezuela Negative 731-TA-974 Germany Negative 731-TA-975 India Negative 731-TA-976 Japan Negative 731-TA-977 Korea Negative 731-TA-978 Netherlands Negative 731-TA-979 South Africa Negative 731-TA-980 Spain Negative 731-TA-981 Sweden Negative 731-TA-982 Taiwan Negative 731-TA-983 Thailand Negative
1 The dates presented in this table refer to the year in which the petitions were filed. Source: Compiled from Commission publications and determinations published in the Federal Register.

I-8
Safeguard investigations
In 1984, the Commission determined that carbon and alloy steel sheet (including cold-rolled steel) was being imported into the United States in such increased quantities as to be a substantial cause of serious injury to the domestic industry producing such articles, and recommended quantitative restrictions of imports for a period of five years. President Ronald Reagan determined that import relief under section 201 of the Trade Act of 1974 was not in the national interest. At the President’s direction, quantitative limitations under voluntary restraint agreements (“VRAs”) for a five-year period ending September 30, 1989, were negotiated. In July 1989, the VRAs were extended for two and one half years until March 31, 1992.
In 2001, the Commission determined that certain carbon and alloy steel, including cold-rolled steel, was being imported into the United States in such increased quantities as to be a substantial cause of serious injury to the domestic industry producing such articles, and recommended additional duties on imports for a period of four years.9 On March 5, 2002, President George W. Bush announced the implementation of steel safeguard measures. Import relief relating to cold-rolled steel consisted of an additional tariff for a period of three years and one day (30 percent ad valorem on imports in the first year, 24 percent in the second year, and 18 percent in the third year).10 Following receipt of the Commission’s mid-term monitoring report in September 2003, and after seeking information from the U.S. Secretary of Commerce and U.S. Secretary of Labor, President Bush determined that the effectiveness of the action taken had been impaired by changed circumstances. Therefore, he terminated the U.S. measure with respect to increased tariffs on December 4, 2003.11
NATURE AND EXTENT OF ALLEGED SUBSIDIES AND SALES AT LTFV
Alleged subsidies
On August 24, 2015, Commerce published a notice in the Federal Register of the initiation of its countervailing duty investigations on cold-rolled steel from Brazil, China, India,
9 Steel; Import Investigations, 66 FR 67304, December 28, 2001. 10 Presidential Proclamation 7529 of March 5, 2002, To Facilitate Positive Adjustment to Competition
From Imports of Certain Steel Products, 67 FR 10553, March 7, 2002. The President also instructed the Secretaries of Commerce and the Treasury to establish a system of import licensing to facilitate steel import monitoring.
11 Presidential Proclamation 7741 of December 4, 2003, To Provide for the Termination of Action Taken With Regard to Imports of Certain Steel Products, 68 FR 68483, December 8, 2003. Import licensing, however, remained in place through March 21, 2005, and continues in modified form at this time.
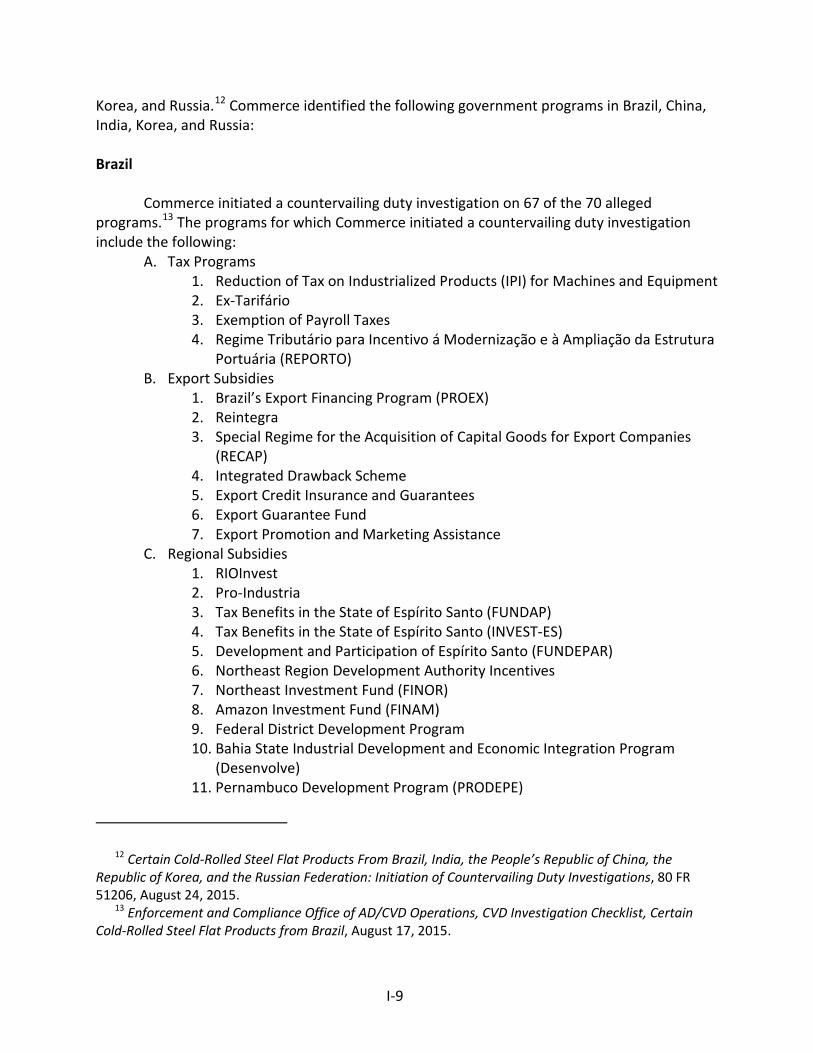
I-9
Korea, and Russia.12 Commerce identified the following government programs in Brazil, China, India, Korea, and Russia: Brazil
Commerce initiated a countervailing duty investigation on 67 of the 70 alleged programs.13 The programs for which Commerce initiated a countervailing duty investigation include the following:
A. Tax Programs 1. Reduction of Tax on Industrialized Products (IPI) for Machines and Equipment 2. Ex-Tarifário 3. Exemption of Payroll Taxes 4. Regime Tributário para Incentivo á Modernização e à Ampliação da Estrutura
Portuária (REPORTO) B. Export Subsidies
1. Brazil’s Export Financing Program (PROEX) 2. Reintegra 3. Special Regime for the Acquisition of Capital Goods for Export Companies
(RECAP) 4. Integrated Drawback Scheme 5. Export Credit Insurance and Guarantees 6. Export Guarantee Fund 7. Export Promotion and Marketing Assistance
C. Regional Subsidies 1. RIOInvest 2. Pro-Industria 3. Tax Benefits in the State of Espírito Santo (FUNDAP) 4. Tax Benefits in the State of Espírito Santo (INVEST-ES) 5. Development and Participation of Espírito Santo (FUNDEPAR) 6. Northeast Region Development Authority Incentives 7. Northeast Investment Fund (FINOR) 8. Amazon Investment Fund (FINAM) 9. Federal District Development Program 10. Bahia State Industrial Development and Economic Integration Program
(Desenvolve) 11. Pernambuco Development Program (PRODEPE)
12 Certain Cold-Rolled Steel Flat Products From Brazil, India, the People’s Republic of China, the Republic of Korea, and the Russian Federation: Initiation of Countervailing Duty Investigations, 80 FR 51206, August 24, 2015.
13 Enforcement and Compliance Office of AD/CVD Operations, CVD Investigation Checklist, Certain Cold-Rolled Steel Flat Products from Brazil, August 17, 2015.

I-10
12. Program for the Development of Santa Catarina’s Business (PRODEC) D. Loans: BNDES Financing
1. BNDES PROGEREN 2. ExIm Loans 3. FINAME Loans 4. BNDESPAR Loans 5. Investment Maintenance Program 6. Automatic BNDES 7. BNDES Funtec
E. Research and Development Incentives 1. INOVA Brasil Program 2. Economic Subvention to National Innovation Program
China
Commerce initiated a countervailing duty investigation on 65 of the 66 alleged programs.14 The programs for which Commerce initiated a countervailing duty investigation include the following:
A. Preferential Loans and Interest Rates 1. Policy Loans to the Cold-Rolled Steel Industry 2. Export Loans 3. Treasury Bond Loans 4. Preferential Loans for State-Owned Enterprises 5. Preferential Loans for Key Projects and Technologies 6. Preferential Lending to Cold-Rolled Steel Producers and Exporters Classified
As “Honorable Enterprises” 7. Loans and Interest Subsidies Provided Pursuant to the Northeast
Revitalization Program B. Debt-to-Equity Swaps, Equity Infusions, and Loan Forgiveness
1. Debt-to-Equity Swaps 2. Equity Infusions 3. Exemptions for SOEs from Distributing Dividends to the State 4. Loans and Interest Forgiveness for SOEs
C. Income Tax and Other Direct Tax Subsidies 1. Income Tax Programs Under the GOC’s 2008 Corporate Income Tax Law
a. Preferential Income Tax Program for High and New Technology Enterprises
b. Preferential Income Tax Program for High and New Technology Enterprises in Designated Zones
14 Enforcement and Compliance Office of AD/CVD Operations, CVD Investigation Checklist, Certain Cold-Rolled Steel Flat Products from People’s Republic of China, August 17, 2015.

I-11
c. Preferential Deduction of Research and Development (R&D) Expenses for HNTEs
2. Other Countervailable Income Tax Programs a. Income Tax Credits for Domestically-Owned Companies Purchasing
Domestically Produced Equipment b. Preferential Income Tax Policy for Enterprises in the Northeast Region c. Forgiveness of Tax Arrears for Enterprises in the Old Industrial Bases
of Northeast China d. Reduction in or Exemption from Fixed Assets Investment Orientation
Regulatory Tax e. Preferential Income Tax Subsidies for Foreign Invested Enterprises –
“Productive” Foreign-Invested Enterprises (FIEs) f. Preferential Income Tax Subsidies for Foreign Invested Enterprises –
High or New Technology FIEs g. Income Tax Benefits for Domestically-Owned Enterprises Engaging in
Research and Development D. Indirect Tax Programs
1. Stamp Exemption on Share Transfer Under Non-Tradable Share Reform 2. VAT and Tariff Exemptions for Purchases of Fixed Assets Under the Foreign
Trade Development Fund 3. Import Tariff and VAT Exemptions for FIEs and Certain Domestic Enterprises
Using Imported Equipment in Encouraged Industries 4. Deed Tax Exemption for SOEs Undergoing Mergers or Restructuring
E. Government Provision of Goods and Services for Less Than Adequate Remuneration (LTAR)
1. Provision of Land-Use Rights for LTAR 2. Provision of Land to SOEs for LTAR 3. Provision of Hot-Rolled Steel for LTAR 4. Provision of Iron Ore for LTAR 5. Provision of Steam Coal for LTAR 6. Provision of Coking Coal for LTAR 7. Provision of Electricity for LTAR
F. Grant Programs 1. State Key Technology Project Fund 2. Foreign Trade Development Fund Grants 3. Export Assistance Grants 4. Programs to Rebate Antidumping Legal Fees 5. Subsidies for Development of Famous Export Brands and China World Top
Brands 6. Sub-Central Government Programs to Promote Famous Export Brands and
China World Top Brands 7. Grants to Loss-Making SOEs 8. Export Interest Subsidies 9. Grants for Energy Conservation and Emission Reduction

I-12
10. Grants for the Retirement of Capacity 11. Grants for Relocating Production Facilities
India
Commerce initiated a countervailing duty investigation on 41 of the 43 alleged programs.15 The programs for which Commerce initiated a countervailing duty investigation include the following:
A. Duty Exemption/Remission Schemes 1. Advance License Program (ALP) 2. Advance Authorization Program (AAP) 3. Duty Free Import Authorization Scheme (DFIA Scheme) 4. Duty Drawback Program (DDB)
B. Subsidies for Export Oriented Units (EOU) 1. Duty-Free Import of Goods, Including Capital Goods and Raw Materials 2. Reimbursements of Central Sales Tax Paid on Goods Manufactured in India 3. Duty Drawback on Fuel Procured from Domestic Oil Companies 4. Exemption from Payment of Central Excise Duty on Goods Manufactured in India
and Procured from a DTA C. Export Promotion of Capital Goods Scheme (EPCGS) D. Pre-Shipment and Post-Shipment Export Financing E. Market Development Assistance Scheme F. Market Access Initiative G. Focus Product Scheme H. Government of India Loan Guarantees I. Status Certificate Program J. Special Economic Zones (SEZ)
1. Duty-Free Importation of Capital Goods and Raw Materials, Components, Consumables, Intermediates, Spare Parts, and Packing Material
2. Exemption from Payment of Central Sales Tax on Purchases of Capital Goods and Raw Materials, Components, Consumables, Intermediates, Spare Parts, and Packing Material
3. Exemption from Electricity Duty and Cess on Electricity Supplied to a SEZ Unit 4. SEZ Income Tax Exemption 5. Service Tax Exemption 6. Exemption From Payment of Local Government Taxes and Duties, Such as Sales
Tax and Stamp Duties K. Steel Development Fund Loans (SDF) L. Provision of Goods and Services for Less Than Adequate Remuneration
15 Enforcement and Compliance Office of AD/CVD Operations, CVD Investigation Checklist, Certain Cold-Rolled Steel Flat Products from India, August 17, 2015.

I-13
1. Provision of Captive Mining Rights for Iron Ore 2. Provision of Captive Mining Rights for Coal 3. Provision of High-Grade Iron Ore for Less than Adequate Remuneration 4. Provision of Flat-Rolled Steel for Less than Adequate Remuneration
M. Incremental Exports Incentivisation Scheme N. State Government Subsidy Programs
1. State Government of Andhra Pradesh (SGAP) Subsidy Programs a. Subsidies Under the SGAP Industrial Investment Promotion Policy b. Grant under the Industrial Investment Promotion Policy: 25 Percent
Reimbursement of the Cost of Land in Industrial Estates and Development Areas
c. Grant under the Industrial Investment Promotion Policy: Reimbursement of Power at the Rate of Rs. 0.75 per Unit
d. Grant under the Industrial Investment Promotion Policy: 50 Percent Subsidy for Expenses Incurred for Quality Certification
e. Grant under the Industrial Investment Promotion Policy: 50 Percent Subsidy on Expenses Incurred in Patent Registration
f. Grant under the Industrial Investment Promotion Policy: 25 Percent Subsidy on Cleaner Production Measures
g. Tax Incentives under the Industrial Investment Promotion Policy: 100 Percent Reimbursement of Stamp Duty and Transfer Duty Paid for the Purchase of Land and Buildings and the Obtaining of Financial Deeds and Mortgages
h. Tax Incentives under the Industrial Investment Promotion Policy: 25 Percent Reimbursement on Value Added Tax (VAT), CST, and State Goods and Services Tax
i. Tax Incentives under the Industrial Investment Promotion Policy: Exemption from the SGAP Non-agricultural Land Assessment
j. Provision of Goods and Services for Less than Adequate Remuneration under the Industrial Investment Promotion Policy: Provision of Infrastructure for Industries Located More than 10 Kilometers from Existing Industrial Estates or Development Areas
k. Subsidies Provided by the Andhra Pradesh Industrial Investment Corporation: Allotment of Land for Less than Adequate Remuneration
2. State Government Of Gujarat (SGOG) Subsidy Programs a. The State Government of Gujarat’s Exemptions and Deferrals on Sales
Tax for Purchases of Goods b. The State Government of Gujarat’s VAT Remission Scheme Established
on April 1, 2006 c. The State Government of Gujarat Special Economic Zone Act (SGOG SEZ
Act): Stamp Duty and Registration Fees for Land Transfers, Loan Agreements, Credit Deeds, and Mortgages

I-14
d. The State Government of Gujarat Special Economic Zone Act (SGOG SEZ Act): Sales Tax, Purchase Tax, and Other Taxes Payable on Sales and Transactions
e. The State Government of Gujarat Special Economic Zone Act (SGOG SEZ Act): Sales and Other State Taxes on Purchases of Inputs (Both Goods and Services) for the SEZ or a Unit within the SEZ
3. State Government of Maharashtra (SGOM) Subsidy Programs a. State Government of Maharashtra Sales Tax Program b. VAT Refunds under the SGOM Package Scheme of Incentives c. Electricity Duty Exemptions d. Waiving of Loan Interest by SICOM e. Investment Subsidies f. Infrastructure Assistance for Mega Projects Under The Maharashtra
Industrial Policy of 2013 And Other SGOM Industrial Promotion Policies To Support Mega Projects
g. Subsidies for Mega Projects under the Package Scheme of Incentives h. Other Subsidies under the Package Scheme of Incentives, 2013 i. Provision of Land for Less than Adequate Remuneration
Korea
Commerce initiated a countervailing duty investigation on 38 of the 40 alleged programs.16 The programs for which Commerce initiated a countervailing duty investigation include the following:
A. Provision of Inputs for Less Than Adequate Remuneration 1. Provision of Electricity for Less Than Adequate Remuneration 2. Power Business Law Subsidies 3. Energy Savings Program Subsidies 4. Provision of Liquefied Natural Gas (LNG) for LTAR
B. The Government of Korea Purchases Electricity from Cold-Rolled Steel Producers for More Than Adequate Remuneration
C. Korean Export-Import Bank Countervailable Subsidy Programs 1. Short-Term Export Credits 2. Export Factoring 3. Export Loan Guarantees 4. Trade Bill Rediscounting Program 5. Import Financing 6. Overseas Investment Credit Program
D. Korea Development Bank (KDB) and Industrial Base Fund (IBF) Loans
16 Enforcement and Compliance Office of AD/CVD Operations, CVD Investigation Checklist, Certain Cold-Rolled Steel Flat Products from People’s Republic of Republic of Korea, August 17, 2015.

I-15
1. Short-Term Discounted Loans for Export Receivables 2. Loans under the Industrial Base Fund
E. Korea Trade Insurance Corporation (K-SURE) - Export Insurance and Export Credit Guarantees 1. Short-Term Export Credit Insurance 2. Export Credit Guarantees
F. Energy and Resource Subsidies 1. Long-Term Loans from the Korean Resources Corporation and the Korea National
Oil Corporation 2. Special Accounts for Energy and Resources (SAER) Loans 3. Clean Coal Subsidies 4. VAT Exemption for Purchases of Anthracite Coal
G. Green Subsidies 1. GOK Subsidies for “Green Technology R&D” and its Commercialization 2. Support for SME “Green Partnerships”
H. Daewoo International Corporation Debt Work Out I. Income Tax Programs
1. Research, Supply, or Workforce Development Investment Tax Deduction for “New Growth Engines” under RSTA Article 10(1)(1)
2. Research, Supply, or Workforce Development Expense Tax Deductions for “Core Technologies” under RSTA Article 10(1)(2)
3. Tax Reduction for Research and Human Resources Development under RSTA Article 10(1)(3)
4. Tax Credit for Investment in Facilities for Research and Manpower under RSTA Article 11
5. Tax Deductions for Investments in Energy Economizing Facilities under RSTA Article 25(2)
6. Tax Deduction for Investment in Environmental and Safety Facilities under RSTA Article 25(3)
7. GOK Facilities Investment Support under Article 26 of the RSTA 8. Tax Program for Third-Party Logistics Operations under RSTA Article 104(14)
J. Subsidies to Companies Located in Certain Economic Zones 1. Tax Reductions and Exemptions in Free Economic Zones 2. Exemptions and Reductions of Lease Fees in Free Economic Zones 3. Grants and Financial Support in Free Economic Zones 4. Acquisition and Property Tax Benefits to Companies Located in Industrial
Complexes K. Grants
1. Research and Development Grants under the Industrial Technology Innovation Promotion Act (ITIPA)
2. Modal Shift Program 3. Sharing of Working Opportunities/Employment Creating Incentives 4. Various Government Grants Contained in Financial Statements

I-16
Program in which the department is partially initiating an investigation: A. Dongbu’s Debt Restructuring
Russia:
Commerce initiated a countervailing duty investigation on 10 of the 14 alleged programs.17 The programs for which Commerce initiated a countervailing duty investigation include the following:
A. Grant Programs 1. Grants for “Technical Retooling” and Modernization 2. Grants for Export Credit Interest for “Highly Processed” Industrial Goods 3. State Program to Develop Industry and Increase Competitiveness
B. Tax Programs 1. Tax Incentives in Special Economic Zones (SEZs) 2. Tax Incentives for Mining Operations
C. Provision of Good and Services for Less Than Adequate Remuneration (LTAR) 1. Provision of Natural Gas for LTAR 2. Provision of Mining Rights for LTAR
D. Preferential Export Financing 1. Eximbank Financing
E. Regional Government Subsidies 1. Incentives in Lipetsk’s Regional SEZs (RSEZs) 2. Income Tax Reductions and Property Tax Exemptions for Key Sectors in the
Republic of Karelia
Alleged sales at LTFV
On August 24, 2015, Commerce published a notice in the Federal Register of the initiation of its antidumping duty investigations on cold-rolled steel from Brazil, China, India, Japan, Korea, the Netherlands, Russia, and the United Kingdom.18 Commerce has initiated antidumping duty investigations based on estimated dumping margins shown in table I-2.
17 Enforcement and Compliance Office of AD/CVD Operations, CVD Investigation Checklist, Certain Cold-Rolled Steel Flat Products from People’s Republic of the Russian Federation, August 17, 2015.
18 Certain Cold-Rolled Steel Flat Products From Brazil, the People’s Republic of China, India, Japan, the Republic of Korea, the Netherlands, the Russian Federation, and the United Kingdom: Initiation of Less-Than-Fair-Value Investigations, 80 FR 51198, August 24, 2015.

I-17
Table I-2 Cold-rolled steel: Alleged dumping margins
Country Dumping margin (percent) Brazil 30.28 – 35.43 China 265.79 India 43.12 Japan 71.35 Korea 75.42 – 177.50 Netherlands 39.43 – 121.53 Russia 69.12 – 227.52 United Kingdom 32.59 – 69.30
Source: Certain Cold-Rolled Steel Flat Products From Brazil, the People’s Republic of China, India, Japan, the Republic of Korea, the Netherlands, the Russian Federation, and the United Kingdom: Initiation of Less-Than-Fair-Value Investigations, 80 FR 51198, August 24, 2015.
THE SUBJECT MERCHANDISE
Commerce’s scope
Commerce has defined the scope of these investigations as follows: The products covered by these investigations are certain cold-rolled (cold-reduced), flat-rolled steel products, neither clad, plated, nor coated with metal, but whether or not annealed, painted, varnished, or coated with plastics or other non-metallic substances. The products covered include coils that have a width of 12.7 mm wide or greater, regardless of form of coil (e.g., in successively superimposed layers, spirally oscillating, etc.). The products covered also include products not in coils (e.g., in straight lengths) of a thickness less than 4.75 mm and a width that is 12.7 mm or greater and that measures at least 10 times the thickness. The products covered also include products not in coils (e.g., in straight lengths) of a thickness of 4.75 mm or more and a width exceeding 150 mm and measuring at least twice the thickness. The products described above may be rectangular, square, circular, or other shape and include products of either rectangular or non-rectangular cross-section where such cross-section is achieved subsequent to the rolling process, i.e., products which have been “worked after rolling” (e.g., products which have been beveled or rounded at the edges). For purposes of the width and thickness requirements referenced above: (1) where the nominal and actual measurements vary, a product is within the scope if application of either the nominal or actual measurement would place it within the scope based on the definitions set forth above, and

I-18
(2) where the width and thickness vary for a specific product (e.g., the thickness of certain products with non-rectangular cross-section, the width of certain products with non-rectangular shape, etc.), the measurement at its greatest width or thickness applies. Steel products included in the scope of these investigations are products in which: (1) iron predominates, by weight, over each of the other contained elements; (2) the carbon content is 2 percent or less, by weight; and (3) none of the elements listed below exceeds the quantity, by weight, respectively indicated: 2.50 percent of manganese, or 3.30 percent of silicon, or 1.50 percent of copper, or 1.50 percent of aluminum, or 1.25 percent of chromium, or 0.30 percent of cobalt, or 0.40 percent of lead, or 2.00 percent of nickel, or 0.30 percent of tungsten (also called wolfram), or 0.80 percent of molybdenum, or 0.10 percent of niobium (also called columbium), or 0.30 percent of vanadium, or 0.30 percent of zirconium Unless specifically excluded, products are included in this scope regardless of levels of boron and titanium. For example, specifically included in this scope are vacuum degassed, fully stabilized (commonly referred to as interstitial-free (IF)) steels, high strength low alloy (HSLA) steels, and motor lamination steels. IF steels are recognized as low carbon steels with micro-alloying levels of elements such as titanium and/or niobium added to stabilize carbon and nitrogen elements. HSLA steels are recognized as steels with micro-alloying levels of elements such as chromium, copper, niobium, titanium, vanadium, and molybdenum. Motor lamination steels contain micro-alloying levels of elements such as silicon and aluminum but do not meet the definition of grain-oriented electrical steel (GOES) or non-oriented electrical steel (NOES). Furthermore, this scope also includes Advanced High Strength Steels (AHSS) and Ultra High Strength Steels (UHSS), both of which are considered high tensile strength and high elongation steels.

I-19
All products that meet the written physical description, and in which the chemistry quantities do not exceed any one of the noted element levels listed above, are within the scope of these investigations unless specifically excluded. The following products are outside of and/or specifically excluded from the scope of these investigations: Ball bearing steels, as defined in the HTS; Tool steels, as defined in the HTS; Silicon-manganese steel, as defined in the HTS; Silicon-electrical steels, as defined in the HTS, that are GOES; Silicon-electrical steels, as defined in the HTS, that are not grain-oriented and that have a silicon level exceeding 1.00 percent and a surface oxide coating, to which an insulation coating may be applied (NOES); and Non-rectangular shapes, not in coils, which are the result of having been processed by cutting or stamping and which have assumed the character of articles or products classified outside chapter 72 of the HTS.
Tariff treatment
Based upon the scope set forth by Commerce, the subject merchandise is imported under the following HTS statistical reporting numbers: 7209.15.0000, 7209.16.0030, 7209.16.0060, 7209.16.0070, 7209.16.0091, 7209.17.0030, 7209.17.0060, 7209.17.0070, 7209.17.0091, 7209.18.1530, 7209.18.1560, 7209.18.2510, 7209.18.2520, 7209.18.2580, 7209.18.6020, 7209.18.6090, 7209.25.0000, 7209.26.0000, 7209.27.0000, 7209.28.0000, 7209.90.0000, 7210.70.3000, 7211.23.1500, 7211.23.2000, 7211.23.3000, 7211.23.4500, 7211.23.6030, 7211.23.6060, 7211.23.6075, 7211.23.6085, 7211.29.2030, 7211.29.2090, 7211.29.4500, . 7211.29.6030, 7211.29.6080, 7211.90.0000, 7212.40.1000, 7212.40.5000, 7225.50.6000, 7225.50.8015, 7225.50.8085, 7225.99.0090, 7226.92.5000, 7226.92.7050, and 7226.92.8050.19 The general U.S. tariff rate on cold-rolled steel, applicable to U.S. imports that are products of Brazil, China, India, Japan, Korea, the Netherlands, Russia, and the United Kingdom and imported under these provisions, is free.
19 Subject merchandise may also enter under HTS statistical reporting numbers 7210.90.9000, 7212.50.0000, 7225.19.0000, 7226.19.1000, 7226.19.9000, and 7226.99.0180. The Commission’s identification of potential HTS classifications for any subject merchandise is based on available information and should not be read as having binding effect on the actual classification of imports by U.S. Customs and Border Protection.

I-20
THE PRODUCT
Description and applications20
Steel is generally defined as a combination of carbon and iron that is usefully malleable as first cast, and in which iron predominates, by weight, over each of the other contained elements, and the carbon content is 2 percent or less, by weight. Carbon steel includes most common grades of steel and is generally less expensive to produce than the various grades of alloy steels, due primarily to the cost of the alloying elements. The chemical composition of carbon steel has traditionally been defined as:
steel for which no minimum content is specified or required for aluminum, chromium, cobalt, columbium, molybdenum, nickel, titanium, tungsten, vanadium, or zirconium, or any other element added to obtain a desired alloying effect; when the specified minimum for copper does not exceed 0.40 percent; and when the maximum content specified for any of the following elements does not exceed the percentages noted: manganese 1.65, silicon 0.60, and copper 0.60.21
The subject merchandise covers products recognized by the marketplace as cold-rolled flat products, including both carbon steel and the standard alloy steels commonly produced for sheet and strip.22
The term "cold-rolling" refers to a process in which the product is fed into a rolling mill at ambient temperature. Cold-rolling can be performed for a variety of reasons, including a desire to reduce product thickness or a need to impart specific mechanical properties or impart surface texture. Cold-rolled steel is flat, usually rectangular in shape, and usually produced in coils.
Cold-rolled steel products are used in a variety of applications including automotive, construction, container, appliance, and electrical equipment manufacturing. A large portion of cold-rolled steel is not sold on the open market but is used internally or transferred to related firms for production of downstream products including corrosion-resistant steel, tin plate, and other products. Cold-rolled steel that is not further processed is used for such applications as panels in electrical equipment and appliances, or for body parts in automobiles, where surface
20 Unless otherwise noted, information is from Certain Cold-Rolled Steel Products From Australia, India, Japan, Sweden, and Thailand, Invs. Nos. 731-TA-965, 971-972, 979, and 981 (Final), USITC Publication 3536, September 2002, p. I-17.
21 AISI, "Instructions for Reporting Steel Shipment Statistics," Revised May, 1978. A similar definition is given in USS, The Making, Shaping, and Treating of Steel (Pittsburgh, PA: Herbick & Held, 1985), p. 1277; and in Iron and Steel Society, Steel Products Manual, Sheet Steel, February 1996, p. 3.
22 Although cold-rolled steel flat-rolled products are produced with alloying elements in excess of the quantity thresholds described in the product scope, the product scope includes the standard alloy steels commonly produced for sheet and strip. The Iron & Steel Society, Pocketbook of Standard Steels, Table 8: Standard Alloy Steels Commonly Produced for Sheet and Strip, July 1996.

I-21
finish or strength-to-weight ratio is important but resistance to corrosion is not. Cold-rolled steel is also used for automotive transmission and seat belt components, and serves as a material for utensils, cutting tools, and cutlery.
Manufacturing processes23
The manufacturing processes for cold-rolled steel products are summarized below. There is no significant difference in the basic production process between mills in the United States and those in the subject countries.24
The raw material input for cold-rolled steel is hot-rolled steel. Hot-rolled steel is cleaned, or pickled, in a bath of sulfuric or hydrochloric acid to remove surface oxide (scale) formed during hot- rolling. The cleaned (pickled) steel is then processed through a cold-rolling mill, which is typically a continuous (or tandem) mill having four to six roll stands, and which reduces the thickness of the hot-rolled material by 30-90 percent. The cold-rolling-process hardens steel so that it usually must be heated in an annealing furnace to make it more formable.
There are two basic annealing processes: batch and continuous. In a batch annealing process, coils of cold-rolled sheets are stacked on a base. Covers are placed over the stacks to contain the annealing atmosphere, which is needed to prevent oxidation of the steel. The annealing furnace is then lowered over the covered stacks. The heating and re-cooling of the sheet may take five or six days. Continuous annealing involves uncoiling the steel and processing it through an annealing furnace continuously, thereby reducing the annealing time to a matter of minutes and achieving greater uniformity of results.
After the steel has been annealed, it is rolled on a temper mill to produce the desired hardness, flatness, and surface quality. Temper rolling of annealed product is required to reduce the tendency of the steel to develop surface distortions during fabrication. Temper rolling involves very light reduction in thickness and should not be confused with cold-rolling.
Cold-rolled steel that is used as a substrate for hot-dipped galvanized steel is usually not annealed or temper rolled because those operations are done on the continuous galvanizing lines. Product that is used as a substrate for electrolytically galvanized steel or for tin plate is usually annealed and temper rolled. Black plate, a type of very thin25 cold-rolled steel, is most
23 Unless otherwise noted, information is from Certain Cold-Rolled Steel Products From Australia, India, Japan, Sweden, and Thailand, Invs. Nos. 731-TA-965, 971-972, 979, and 981 (Final), USITC Publication 3536, September 2002, p. I-18-I-19.
24 Tata Steel UK Ltd. produces only continuously annealed cold-rolled steel and Tata Steel IJmuiden BV produces only batch annealed cold-rolled steel. Conference transcript, p. 195 (Cunningham).
25 Standard thickness for black plate is in the range of 0.0050-0.0149 inch; double-reduced black plate is 0.0050-0.0118 inch in thickness. Standard thickness of cold-rolled sheet goes up to 0.142 inch. ASTM International, ASTM specifications A 625 Standard Specification for Tin Mill Products, Black Plate, Single-Reduced; A 650 Standard Specification for Tin Mill Products, Black Plate, Double Reduced; A 657 Standard Specification for Tin Mill Products, Black Plate Electrolytic Chromium-Coated, Single and Double
(continued...)

I-22
often used as the substrate for tin plate products although it does have other applications.26 It is commonly produced to certain industry specifications, for example, those of ASTM International. For single-reduced black plate, the production process is generally that described above. Double-reduced black plate replaces the temper-rolling step with another cold-rolling to further reduce the thickness of the steel.
DOMESTIC LIKE PRODUCT ISSUES
The petitioners propose that the Commission define one like product as defined in the Petition that contains a continuum of products including black plate.27 Respondent Tata Steel Ijmuiden accepts the definition of the like product proposed in the Petition.28 The respondent Korean parties argue that black plate is a separate like product.29 No additional issues with respect to domestic like product have been raised in these investigations.30
The Commission’s decision regarding the appropriate domestic product(s) that are “like” the subject imported product is based on a number of factors including: (1) physical characteristics and uses; (2) common manufacturing facilities and production employees; (3) interchangeability; (4) customer and producer perceptions; (5) channels of distribution; and (6) price. Information regarding these factors is discussed below.31
Physical characteristics and uses
Respondents note that black plate is manufactured with thickness of 0.0149 inches or below. In addition, black plate also has restricted temper and hardness that other cold-rolled products do not have. The vast majority of black plate is used in the production of tin plate products. Petitioners contend that there is significant overlap between black plate and other
(…continued) Reduced; A 568 Standard Specification for Steel, Sheet, Carbon, Structural, and High-Strength, Low-Alloy, Hot-Rolled and Cold-Rolled, General Requirements.
26 Other applications include toys, serving trays, building materials, and household goods. American Iron and Steel Institute, “The Tinplate Production Process,” http://www.steel.org/SMDISteel_org/Web%20Root/Packaging/Steel%20Packaging/Tinplate%20Production%20Process.aspx, accessed on August 26, 2015.
27 U.S. Steel’s postconference brief, p. 5 n.18 and Steel Dynamics Inc. and California Steel Industries’ postconference brief, pp. 3-7.
28 Tata Steel Ijmuiden’s postconference brief, p. 2. 29 Respondent Japanese parties concur. Japanese producers’ postconference brief, p. 4. 30 Respondent Japanese parties initially indicated their intent to ask for a separate like product for
very high-strength steel for automotive application, but subsequently clarified that for the preliminary phase investigations they do not argue for such a separate like product. Conference transcript, p. 231 (Weiner) and Japanese producers’ postconference brief, exh. 1, p. 2.
31 Petitioners arguments taken from Steel Dynamics and California Steel Industries postconference brief, pp. 3-7. Respondent arguments taken from Korean producers’ postconference brief, Responses to Staff Questions, question 1.

I-23
forms of cold-rolled steel, with black plate being basically a type of light gauge cold-rolled steel often used to make tin mill products. Black plate may have other uses, including *** and ***.32
According to the American Iron and Steel Institute (“AISI”), over 80 percent of AISI member U.S. black plate shipments goes into the “Containers, Packaging and Shipping Material” market segment in 2014. 33 The remainder of U.S. blackplate shipments goes to the “Sheet & Strip for Painting & Coating,” market segment. 34
Manufacturing facilities and production employees
There are currently only three domestic producers of black plate, U.S. Steel, ArcelorMittal USA, and USS-Posco.35 These three producers, which accounted for approximately *** percent of U.S. cold-rolled steel production in 2014, also produce other cold-rolled steel products. Respondents contend that when black plate is double reduced it goes through a separate finishing mill.36 Petitioners argue that tin mill black plate is made in the same facilities as other cold-rolled steel on the similar equipment with the same workers. Petitioners further contend that it is simply rolled longer than other cold-rolled steel products, making it thinner.
Interchangeability
Respondents argue that black plate used in tin mill products are not interchangeable with other cold-rolled steel, which cannot be substituted for black pate in tin mill. As noted earlier, petitioners contend that black plate may have other uses, including ***, and further report that ***.”
Customer and producer perceptions
Respondents contend that because there is no real market for black plate, this criterion does not apply. They note that customers perceive imported and domestically produced black plate differently. Imported black plate from Japan and Korea is perceived as having higher quality, produced to tighter tolerances, and without surface issues. Petitioners contend that black plate is part of a continuum of cold-rolled steel, with significant overlap with other forms of cold-rolled steel, particularly lighter gauges of cold-rolled steel.37 Moreover, petitioners argue that, for the most part, domestically-produced cold-rolled steel, regardless of where it may lie on the continuum, is interchangeable with U.S. imports of cold-rolled steel.38
32 US Steel’s postconference brief, exh. 35. 33 AISI, Shipments by Market Classification – Carbon AIS16C, 2014. 34 Ibid. 35 Conference transcript, p. 182 (Tennant). 36 Conference transcript, p. 185 (Tennant). 37 US Steel’s postconference brief, exh. 35. 38 Conference transcript, pp. 107-108 (Blume).

I-24
Channels of distribution
Respondents contend that OCC is the only significant purchaser of black plate steel. The majority of domestic production is internally consumed to produce tin mill products. This is said to be distinct from other cold-rolled steel products that have a significant merchant market and are sold to distributors and end-users. Petitioners argue that black plate and other forms of cold-rolled steel (particularly lighter gauges) are regularly sold by the same distributors.39
Price
Respondents note that black plate is generally more expensive than cold-rolled steel because it is thinner, and thus more expensive to produce. A specific additional cold reduction mill must be employed, which is not available at all domestic producers, increasing production cost and, hence, the final price. Petitioners contend that black plate and certain other forms of cold-rolled steel, particularly in lighter gauges, often share the same general price points.40
Table I-3 presents exports of black plate to the United States, and U.S. shipments of domestically-produced black plate and U.S. imports of black plate.
39 US Steel’s postconference brief, exh. 35. 40 US Steel’s postconference brief, exh. 35.
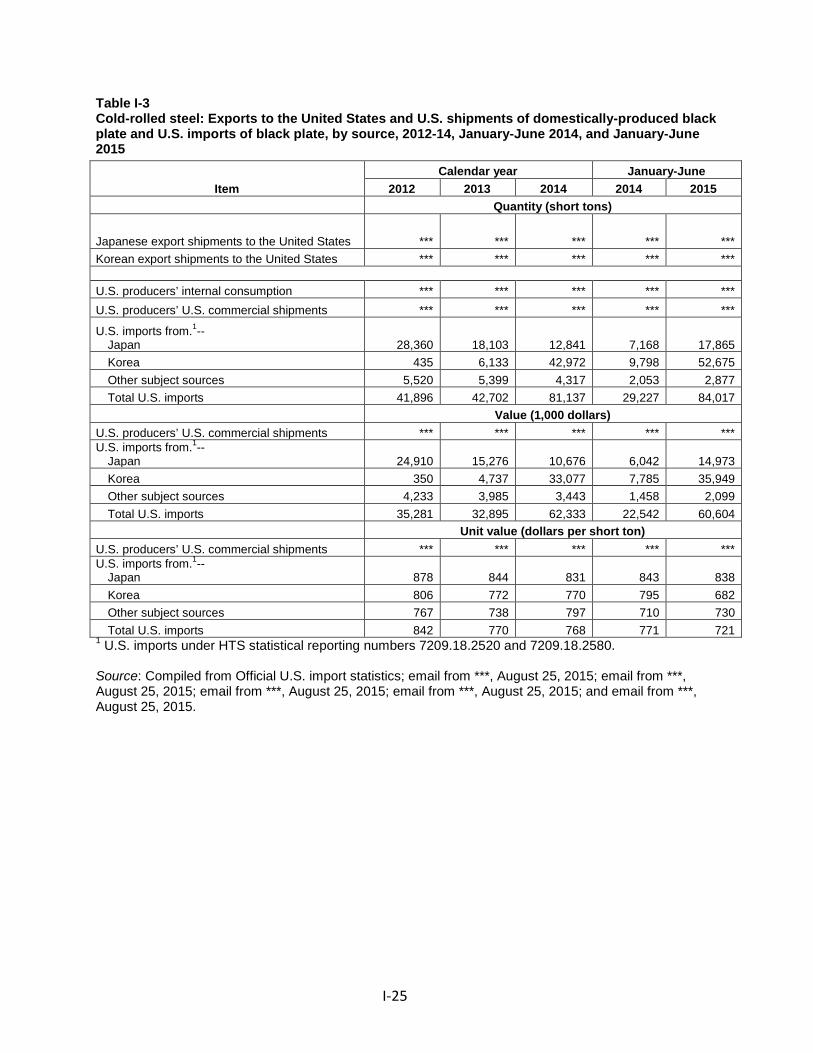
I-25
Table I-3 Cold-rolled steel: Exports to the United States and U.S. shipments of domestically-produced black plate and U.S. imports of black plate, by source, 2012-14, January-June 2014, and January-June 2015
Item Calendar year January-June
2012 2013 2014 2014 2015 Quantity (short tons)
Japanese export shipments to the United States *** *** *** *** *** Korean export shipments to the United States *** *** *** *** *** U.S. producers’ internal consumption *** *** *** *** *** U.S. producers’ U.S. commercial shipments *** *** *** *** ***
U.S. imports from.1-- Japan 28,360 18,103 12,841 7,168 17,865 Korea 435 6,133 42,972 9,798 52,675 Other subject sources 5,520 5,399 4,317 2,053 2,877 Total U.S. imports 41,896 42,702 81,137 29,227 84,017 Value (1,000 dollars) U.S. producers’ U.S. commercial shipments *** *** *** *** *** U.S. imports from.1-- Japan 24,910 15,276 10,676 6,042 14,973 Korea 350 4,737 33,077 7,785 35,949 Other subject sources 4,233 3,985 3,443 1,458 2,099 Total U.S. imports 35,281 32,895 62,333 22,542 60,604 Unit value (dollars per short ton) U.S. producers’ U.S. commercial shipments *** *** *** *** *** U.S. imports from.1-- Japan 878 844 831 843 838 Korea 806 772 770 795 682 Other subject sources 767 738 797 710 730 Total U.S. imports 842 770 768 771 721 1 U.S. imports under HTS statistical reporting numbers 7209.18.2520 and 7209.18.2580. Source: Compiled from Official U.S. import statistics; email from ***, August 25, 2015; email from ***, August 25, 2015; email from ***, August 25, 2015; email from ***, August 25, 2015; and email from ***, August 25, 2015.


II-1
PART II: CONDITIONS OF COMPETITION IN THE U.S. MARKET
U.S. MARKET CHARACTERISTICS
Cold-rolled steel products are used in a variety of applications including automotive, construction, container, home appliance, and electrical equipment manufacturing. Demand for cold-rolled steel is driven generally by demand in these industries, as well as overall economic conditions. The majority of sales on the open market are produced-to-order. A large portion of cold-rolled steel is not sold on the open market but is used internally for the production of downstream products, particularly corrosion-resistant steel and tin mill products such as tin- and chromium-coated steel sheet. Apparent U.S. consumption of cold-rolled steel, by quantity, increased by 6.5 percent from 27.5 million short tons in 2012 to 29.3 million short tons in 2014. Apparent U.S. consumption was 14.7 million short tons in interim 2014 and 13.6 million short tons in interim 2015.
CHANNELS OF DISTRIBUTION
U.S. producers consumed internally approximately 60 percent of their total shipments in 2014, a share that has been increasing since 2012. Of the open market sales by U.S. producers, approximately 63 to 70 percent are sold to end users (such as appliance and automotive manufacturers), and the remainder are sold to distributors/service centers. Importers of subject product (except imports from the Netherlands) shipped to both distributors/service centers and end users, as shown in table II-1.1 Table II-1 Cold-rolled steel: U.S. producers’ and importers’ U.S. commercial shipments, by sources and channels of distribution, 2012-14, January-June 2014, and January-June 2015
* * * * * * *
U.S. producers’ largest specified end-use market was the automotive industry while
importers’ largest specified end-use market was containers in 2014 (figure II-1).2 More than one-half of firms’ commercial U.S. shipments were sold to “other end uses.” These other end
1 U.S. commercial shipments of cold-rolled steel imported from Netherlands was sold ***. 2 U.S. importers’ largest specified end-use market was the automotive industry in 2012-13,
accounting for almost a quarter of importers’ commercial shipments. In 2014, importers’ commercial shipments to the automotive industry increased in terms of volume, but the share of importers’ total commercial shipments to the automotive industry declined by 6.4 percentage points primarily due to the very large volumes sold to “other end uses” as well as the increased volumes shipped to container end uses. Importers’ commercial shipments to containers grew during 2012-14, increasing from 7.2 percent of importers’ total commercial shipments in 2012 to 15.8 percent in 2014 and were 23.1 percent in interim 2015 compared to 13.6 percent in interim 2014.

II-2
Automotive, 14.4
Containers, 15.8
Appliances, 5.7
Other end uses, 64.1
U.S. importers' commercial U.S. shipments
uses included: furniture, construction, compressed gas cylinders, pipe and tube, controlled heating, ventilation and air (“HVAC”) systems, decking, electrical equipment, and service center/distributors. Figure II-1 Cold-rolled steel: Share of U.S. producers’ and importers’ commercial U.S. shipments by end use, 2014
Source: Compiled from data submitted in response to Commission questionnaires.
U.S. producers’ shares of commercial shipments by end use remained relatively unchanged during 2012-14 and interim 2015.3 As seen in figure II-2, more than one-half of U.S. importers’ commercial shipments of imported product from Japan and the Netherlands were sold for automotive manufacturing in 2014. Almost *** of importers’ commercial shipments of imported product from Brazil and Korea were sold for containers.4 5 More than *** of U.S. importers’ commercial shipments of imports from the United Kingdom were sold for use in appliances in 2014.6 Most of U.S. importers’ commercial shipments of imported product from China, India, and Russia were sold for “other end uses” in 2014.
3 See Part IV of this report for more information on U.S. producers’ and importers’ annual U.S. shipments by end use.
4 In 2012-13, approximately *** of U.S. importers’ commercial shipments of imports from Korea were sold for automotive end uses. However, in 2014 the share to automotive manufacturing decreased to *** percent and the share of imports from Korea to containers and “other end uses” increased. According to Korean respondents, approximately *** percent of imports from Korea were automobile grade cold-rolled steel used in the automotive industry or black plate used to make tin plate products. Korean producers’ postconference brief, p. 39.
5 U.S. importers’ commercial shipments from Brazil were sold *** for “other end uses” during 2012-13 and accounted for *** of U.S. importers’ commercial shipments from Brazil in 2014. “Other end uses” included construction, display shelving, and office furniture.
6 U.S. importers’ commercial shipments of imports from the United Kingdom by end use shifted over time. During 2012-13, approximately *** of U.S. importers’ commercial shipments of imports from the
(continued...)
Automotive, 20.9
Containers, 4.8
Appliances, 7.2
Other end uses, 67.1
U.S. producers' commercial U.S. shipments

II-3
Figure II-2 Cold-rolled steel: Share of U.S. importers’ U.S. commercial shipments by subject country and end use, 2014
* * * * * * *
GEOGRAPHIC DISTRIBUTION
Both U.S. producers and importers reported selling cold-rolled steel to all regions in the contiguous United States (table II-2). However, in many cases subject importers concentrated their sales in specific regions which included: Northeast, Midwest, Southeast, and Central Southwest.7 For U.S. producers, 27.4 percent of sales were within 100 miles of their production facility, 66.7 percent were between 101 and 1,000 miles, and 5.9 percent were over 1,000 miles. Importers sold 67.4 percent within 100 miles of their U.S. point of shipment, 30.4 percent between 101 and 1,000 miles, and 2.2 percent over 1,000 miles.
(…continued) United Kingdom were sold for use in automotive manufacturing with the *** being used primarily for “other end uses.” However, in 2014, U.S. importers’ commercial shipments of imports from the United Kingdom shifted to appliances and sales to “other end uses” fell by *** percentage points to *** percent.
7 *** reported that they do not ship product to the Pacific Coast or Mountains regions because the freight expense makes it uneconomical to do so. They reported that *** are shipped within 100 miles from the port of entry. ***.

II-4
Table II-2 Cold-rolled steel: Geographic market areas in the United States served by U.S. producers and importers
Region U.S.
producers U.S. imports from
Brazil China India Japan Northeast 9 4 15 10 3 Midwest 11 5 16 8 6 Southeast 10 6 12 8 4 Central Southwest 10 7 16 12 4 Mountains 8 0 7 1 0 Pacific Coast 10 0 17 1 2 Other1 1 0 0 0 0 All regions (except Other) 5 0 5 1 0 Reporting firms 11 9 22 16 9
Region
U.S. imports from
Korea Netherlands Russia United
Kingdom Subject sources
Northeast 4 1 3 3 27 Midwest 8 1 6 3 30 Southeast 5 1 2 2 28 Central Southwest 4 1 4 2 25 Mountains 0 0 1 0 7 Pacific Coast 2 0 0 1 20 Other1 0 0 0 0 0 All regions (except Other) 0 0 0 0 6 Reporting firms 12 1 10 3 39
1 All other U.S. markets, including AK, HI, PR, and VI. Source: Compiled from data submitted in response to Commission questionnaires.
SUPPLY AND DEMAND CONSIDERATIONS
U.S. supply
Domestic production
Based on available information, U.S. producers of cold-rolled steel have the ability to respond to changes in demand with moderate-to-large changes in the quantity of shipments of U.S.-produced cold-rolled steel to the U.S. market. The main contributing factors to this degree of responsiveness of supply are the large total capacity, availability of unused capacity and ability to produce alternate products; supply responsiveness is somewhat constrained due to limited inventories and limited export shipments.

II-5
Industry capacity Domestic capacity fluctuated from 39.5 million short tons in 2012, to 40.0 million short
tons in in 2013, to 39.5 million short tons in 2014. Domestic capacity utilization remained close to 68 percent during 2012-14.8 Capacity utilization was 63.4 percent in interim 2015 compared to 69.4 percent in interim 2014. This relatively moderate level of capacity utilization suggests that U.S. producers may have substantial ability to increase production of cold-rolled steel in response to an increase in prices. Alternative markets
U.S. producers’ exports, as a share of total shipments, declined from a high of 2.5
percent in 2012 to a low of 1.8 percent in 2014. This indicates that U.S. producers may have limited ability to shift shipments between the U.S. market and other markets in response to price changes. Inventory levels
U.S. producers’ inventories remained close to 4 percent of total U.S. shipments during
2012-14 and January-June 2015. These inventory levels suggest that U.S. producers may have limited ability to respond to changes in demand with changes in the quantity shipped from inventories. Production alternatives
Two of 12 responding U.S. producers stated that they could switch production from
cold-rolled steel to other products. Other products that U.S. producers reportedly can produce on the same equipment as cold-rolled steel are hot-rolled pickled and oiled products, corrosion-resistant steel, and tin mill products. Supply constraints
The majority of U.S. producers reported that there were no constraints in domestic
supply. Two of eleven responding U.S. producers reported that their firms were unable to supply cold-rolled steel at some point since 2012. ***. ***.
Respondents reported that severe winter weather conditions in the fourth quarter of 2013 and first quarter of 2014 caused domestic production problems and domestic supply shortages in the United States. In addition to weather-related issues, U.S. producers AK Steel, ArcelorMittal USA, and U.S. Steel experienced equipment issues. Respondents argue that the
8 According to U.S. Steel, cold-rolled steel plants are designed to run 24-7 maintaining high capacity utilization rates. Conference transcript, p. 45 (Mathews).

II-6
domestic supply shortage in early 2014 motivated purchasers to diversify their sources of supply and that this contributed to an increase in orders for imports in the last quarter of 2014 and the first quarter of 2015.9 Subject imports
Table II-4 provides a summary of supply-related data for subject countries.
Table II-4 Cold-rolled steel: Foreign industry factors that affect ability to increase shipments to the U.S. market
Country
Capacity (millions of short tons)
Capacity utilization (percent)
Inventory levels relative to total
shipments (percent)
Able to shift to alternate products
Home market shipments in
2014
Shipments exported to
non-U.S. markets in
2014
2012 2014 2012 2014 2012 2014 No. of firms
reporting “yes” (percent) (percent) Brazil *** *** *** *** *** *** *** *** *** China1 -- -- -- -- -- -- -- -- -- India *** *** *** *** *** *** *** *** *** Japan 27.7 26.4 80.7 85.0 *** *** 2 of 5 *** *** Korea *** *** *** *** *** *** *** *** *** Netherlands *** *** *** *** *** *** *** *** *** Russia *** *** *** *** *** *** *** *** *** United Kingdom *** *** *** *** *** *** *** *** *** 1 The Commission received no questionnaire responses from Chinese suppliers. Source: Compiled from data submitted in response to Commission questionnaires. Subject imports from Brazil10
Based on available information, producers of cold-rolled steel from Brazil have the
ability to respond to changes in demand with moderate changes in the quantity of shipments of cold-rolled steel to the U.S. market. The main contributing factors to this degree of responsiveness of supply are the availability of unused capacity and ***.
9 Tata Steel Ijmuiden’s postconference brief, Attachment I, p. 12. Korean producers’ postconference brief, Responses to staff questions, pp. 6-8.
10 The Commission received three questionnaire responses from Brazilian producers. These firms’ exports to the United States were equivalent to *** percent of U.S. imports of cold-rolled steel from Brazil, by quantity, during 2012-14 and January-June 2015.

II-7
Subject imports from China11 According to data from ***, Chinese capacity to produce cold-rolled steel increased
from *** short tons in 2012 to *** short tons in 2014. Production of cold-rolled steel in China also increased from *** short tons in 2012 to *** short tons in 2014.12 Subject imports from India13
Based on available information, producers of cold-rolled steel from India have the ability
to respond to changes in demand with moderate-to-large changes in the quantity of shipments of cold-rolled steel to the U.S. market. The main contributing factors to this degree of responsiveness of supply are increasing capacity, some availability of unused capacity, and the existence of alternate markets.
AK Steel contends that the increase in cold-rolled steel from India in 2014 is due to falling demand in India along with import competition in its home market from China, Japan, and Korea.14 Additionally, Indian cold-rolled production capacity has increased.15 Subject imports from Japan16
Based on available information, producers of cold-rolled steel from Japan have the
ability to respond to changes in demand with moderate-to-large changes in the quantity of shipments of cold-rolled steel to the U.S. market. The main contributing factors to this degree of responsiveness of supply are a large total capacity, some availability of unused capacity, existence of alternate markets, and ***.
11 The Commission received no questionnaire responses from Chinese suppliers. 12 ***. See Part VII for more information on China’s cold-rolled steel industry. 13 The Commission received one questionnaire response from a producer in India. This firm’s exports
to the United States were equivalent to *** percent of U.S. imports of cold-rolled steel from India, by quantity, during 2012-14 and January-June 2015.
14 Indian producers’ home market shipments fell from *** percent of total shipments in 2012 to *** percent in 2014.
15 AK Steel’s postconference brief, Answers to Questions, p. 6. 16 The Commission received five questionnaire responses from Japanese producers. These firms’
exports to the United States were equivalent to *** percent of U.S. imports of cold-rolled steel from Japan, by quantity, during 2012-14 and January-June 2015.

II-8
Subject imports from Korea17 Based on available information, producers of cold-rolled steel from Korea have the
ability to respond to changes in demand with moderate-to-large changes in the quantity of shipments of cold-rolled steel to the U.S. market. The main contributing factors to this degree of responsiveness of supply are a large total capacity, some availability of unused capacity, existence of alternate markets, and ***. Subject imports from the Netherlands18
Based on available information, producers of cold-rolled steel from the Netherlands
have the ability to respond to changes in demand with small-to-moderate changes in the quantity of shipments of cold-rolled steel to the U.S. market. The main contributing factors to this degree of responsiveness of supply is the existence of alternate markets; supply responsiveness is somewhat constrained due to limited availability of unused capacity, limited inventories, and ***.
AK Steel asserts that Tata Steel can switch its production and exports of cold-rolled steel products to the United States from either of its plants in the United Kingdom or the Netherlands. While the United Kingdom can only produce continuously annealed cold-rolled steel, AK Steel argues that there is some degree of interchangeability between batch-annealed and continuously-annealed products. In addition, it contends that not all cold-rolled products are annealed prior to export but instead may be annealed by the customer during subsequent processing in the United States, and therefore, could be produced in either the United Kingdom or the Netherlands.19 Tata Steel Ijmuiden argues that the different annealing processes results in two different products characteristics which are used in different applications, and therefore, there is limited interchangeability between batch-annealed and continuously-annealed products. Furthermore, Tata Steel Ijmuiden contends that it does not have the available capacity to handle any significant shift of import volume represented by the exports to the United States from the United Kingdom. Tata Steel Ijmuiden stated that a large portion of its capacity is committed to the production of downstream products.20
AK Steel asserts that imports from the Netherlands increased in 2014 due to increased import competition in Europe, with imports from China in particular on the rise. It also stated that Tata Steel has been increasing its focus on the U.S. market ***.21 However, Tata Steel
17 The Commission received four questionnaire responses from Korean producers. These firms’ exports to the United States were equivalent to *** percent of U.S. imports of cold-rolled steel from Korea, by quantity, during 2012-14 and January-June 2015.
18 The Commission received one questionnaire response from a Dutch producer. This firm’s exports to the United States were equivalent to *** percent of U.S. imports of cold-rolled steel from the Netherlands, by quantity, during 2012-14 and January-June 2015.
19 AK Steel’s postconference brief, pp. 15-16. 20 Tata Steel Ijmuiden’s postconference brief, pp. 15-17. 21 AK Steel’s postconference brief, Answers to Questions, p. 5.

II-9
Ijmuiden reported that ***. It also contends that the increase in imports from the Netherlands reflects purchasers’ supply concerns generated by the problems experienced by U.S. producers in 2014, namely severe equipment issues and weather related logistical and manufacturing issues.22 Subject imports from Russia23
Based on available information, producers of cold-rolled steel from Russia have the
ability to respond to changes in demand with moderate-to-large changes in the quantity of shipments of cold-rolled steel to the U.S. market. The main contributing factors to this degree of responsiveness of supply are the availability of unused capacity and existence of alternate markets. Subject imports from the United Kingdom24
Based on available information, producers of cold-rolled steel from the United Kingdom
have the ability to respond to changes in demand with moderate changes in the quantity of shipments of cold-rolled steel to the U.S. market. The main contributing factors to this degree of responsiveness of supply are the availability of unused capacity and existence of alternate markets or inventories; supply responsiveness is somewhat constrained due to a small total capacity, limited inventories, and ***. Supply constraints
Six of 45 responding importers reported that their firms were unable to supply cold-
rolled steel at some point since 2012. *** both reported that their firms placed customers on allocation and were unable to meet timely shipment commitments during 2012-13. *** also reported that it had been unable to meet timely shipment commitments due to general production disturbances during 2012-13. *** reported that there have been occasional credit restraints on certain accounts. *** stated that the antidumping duty order on non-oriented electrical steel (“NOES”) from Japan have affected its supply because cold-rolled steel can be used as a substitute for NOES in ignitions. *** reported late shipments due to adverse river conditions.
22 Email from ***, August 19, 2015. 23 The Commission received two questionnaire responses from Russian producers. These firms’
exports to the United States were equivalent to *** percent of U.S. imports of cold-rolled steel from Russia, by quantity, during 2012-14 and January-June 2015.
24 The Commission received one questionnaire response from a UK producer. This firm’s exports to the United States were equivalent to *** percent of U.S. imports of cold-rolled steel from the United Kingdom, by quantity, during 2012-14 and January-June 2015.

II-10
Nonsubject imports Canada was the largest source of nonsubject imports during 2012-14, accounting for
*** percent of nonsubject imports in 2014. Imports of cold-rolled steel from Canada accounted for 20.3 percent of the total quantity of U.S. imports in 2014. U.S. imports of cold-rolled steel from Canada increased by *** percent between 2012 and 2014, and U.S. imports of cold-rolled steel from all other nonsubject countries increased by *** percent during this period. Service centers’ inventories
According to domestic parties, large volumes of subject imports entered into service
centers’ inventories in 2014, resulting in decreased demand for newly milled cold-rolled steel products in 2015.25 They note that beginning in 2015, data based on the open market from Metals Service Center Institute (“MSCI”) reflects large increases in service centers’ total inventories and the number of months of inventory on hand.26 Respondents argue that end-of-period inventories from all eight subject countries are relatively small, particularly when compared to U.S. producers’ inventories.27 Korean respondents argue that it is the domestic product in service centers’ inventories that are responsible for the inventory overhang in 2014, not imports.28
According to MSCI, service centers’ inventories of carbon flat-rolled products steadily increased during 2014.29 As shown in figure II-3, service centers’ inventory levels of carbon flat-rolled products began to rise in mid-2014 and peaked in December 2014, increasing by *** percent from December 2013. The number of months of inventory on hand also peaked in December 2014 and has since decreased throughout 2015 but still remain above 2014 levels. Figure II-3 Carbon flat-rolled products: Service centers’ U.S. shipments to end users, end-of-month inventories, and the number of months of inventory on hand, monthly, January 2012-July 2015
* * * * * * *
25 Conference transcript, pp. 35-38 (Price). Domestic parties also contend that subject imports were being sold at prices much lower than domestic prices, and therefore, customers built up their inventories with imports. Conference transcript, p. 42 (Price).
26 Conference transcript, pp. 82-83 (Schagrin). 27 Korean producers’ postconference brief, p. 14. 28 Korean producers’ postconference brief, p. 15. 29 MSCI collects data on shipments from service centers’ owned inventory (stock shipments) to
customer end markets and month-end service center inventories. These shipments include cold-rolled, hot-rolled, and coated flat-rolled steel. MSCI does not break the data out by country of origin.

II-11
U.S. demand
Based on available information, the overall demand for cold-rolled steel is likely to experience small-to-moderate changes in response to changes in price. The main contributing factors are the somewhat limited range of substitute products and the moderate-to-large cost share of cold-rolled steel in most of its end-use products. End uses
U.S. demand for cold-rolled steel is derived from the demand for downstream products.
Common applications for cold-rolled steel are appliances (e.g., refrigerators, washers, dryers, bathtubs, and other home appliances), automobiles, containers, electric motors, and construction. Other reported end uses included: aircraft parts, steel barrels and drums, tubing, decking, HVAC systems, electrical equipment, furniture, and sheet for further conversion. More than half of U.S. producers’ open market shipments of cold-rolled steel are shipped directly to end users. According to AISI, the automotive industry is the largest market in which cold-rolled steel is shipped directly from U.S. producers to the end user (table II-5). Table II-5 End use distribution: Shipments by U.S. producers of cold-rolled steel by market classification, 2014
* * * * * * * Cost share
Cold-rolled steel products may be used in various products, with relevant cost shares varying greatly. Depending on the product, cold-rolled steel products can account for a relatively high percentage of the cost of the components. Reported cost shares for some end uses ranged from 30 percent or less (agriculture, appliances, automotive, and construction), to 54-68 percent (appliances, light fixtures, doors and windows, and furniture), to 70-100 percent (containers, decking, drums, fixtures, pipe and tubing, and steel shelving).
U.S. producers were requested to report the cost share of the cold-rolled steel that they consume internally or transfer to related firms to produce coated products, tin mill products, and other products. The majority of U.S. producers reported cost shares for coated products ranging from 80-87 percent.30 Three U.S. producers reported cost shares of 68-84 percent for tin mill products. Two U.S. producers reported cost shares of 78 and 90 percent for “other” products.
30 One U.S. producer (***) reported a cost share of 30 percent for its cold-rolled steel used to produce coated products.

II-12
Business cycles
The U.S. industry producing cold-rolled steel products follows a business cycle tied closely to that of the general economy. Six of nine responding U.S. producers and 14 of 45 responding importers indicated that the market was subject to business cycles. Specifically, U.S. producers and importers reported seasonal fluctuations in the automotive, packing, and construction industries. One U.S. producer reported increased demand for cold-rolled steel in packing and construction end uses during the spring.
Four of seven responding U.S. producers and two of 33 importers indicated that the market was subject to distinct conditions of competition. Three of four responding U.S. producers identified an increase in low-cost imports which has resulted in large inventories. One U.S. producer reported that demand was heavily influenced by conditions in the construction, appliance, and automotive industries. One importer stated that the capability to produced advanced high strength steels impacted the conditions of competition. One importer (***) reported that it imports cold-rolled steel that “compete in a narrow, specialized market ***, with its own unique conditions of competition, far different from the automobile manufacturers and others that constitute the market(s) for the other products covered.”
Half of the responding U.S. producers (4 of 8) and importers (7 of 15) reported that there have been changes to the business cycle and conditions of competition since 2012. U.S. producers reported an increase in import volumes, declining prices, and decreasing demand in Europe and other foreign markets. Four importers identified the strengthening automotive market and one importer identified an improving general economic environment. One importer reported that there has been an increase in demand for advanced high strength steel. Demand trends
Based on questionnaire responses from U.S. producers and importers, U.S. demand for
cold-rolled steel is affected by changes in overall U.S. economic activity. The aggregate U.S. economy, as measured by percentage changes in the gross domestic product, fluctuated from 2012 to 2013, and then declined steeply during the first quarter of 2014, but has since increased (figure II-4). Firms reported that the rebounding economy has attributed to an increased demand for cold-rolled steel. According to U.S. Steel, CRU reported that 2014 was the strongest year of demand for cold-rolled steel since 2008.31
31 Conference transcript, p. 45 (Mathews).

II-13
Figure II-4 Real U.S. GDP growth: Percentage change from the previous quarter, quarterly, January 2012-June 2015
Source: National Income and Product Accounts-Table 1.1.1, Percent Change from Preceding Period in Real Gross Domestic Product, Bureau of Economic Analysis, http://www.bea.gov/iTable/index_nipa.cfm, retrieved August 12, 2015.
Demand for cold-rolled steel is primarily driven by automotive and construction demand. Both the U.S. automotive and construction industries have seen substantial growth since 2012. The total U.S. light trucks and automobiles sales increased during January 2012-June 2015 (figure II-5). Total U.S. light truck and automobile sales grew by 21.1 percent from 14.0 million units in January 2012 to 17.0 million units in June 2015. Total construction spending increased overall from January 2012 to April 2015 (figure II-6). Total U.S. construction increased by 32.2 percent from January 2012 to January 2015, and continued to grow to $766.4 billion dollars by June 2015.
-2
-1
0
1
2
3
4
5
I II III IV I II III IV I II III IV I II
2012 2013 2014 2015
Perc
ent c
hang
e

II-14
Figure II-5 U.S. automotive sales: Automobile and light truck retail unit sales, monthly, seasonally adjusted at annual rates, January 2012-June 2015
Source: BEA, Motor Vehicle Unit Retail Sales, table 6, Light Vehicle and Total Vehicle Sales, www.bea.gov/national/xls/gap_hist.xls, retrieved August 12, 2015. Figure II-6 U.S. construction activity: Total construction spending (private and public construction), monthly, seasonally adjusted at annual rates, January 2012-June 2015
Source: Construction Spending, U.S. Census Bureau, http://www.census.gov/, retrieved August 12, 2015.
Most U.S. producers and 16 of 43 importers reported an increase in U.S. demand for cold-rolled steel since January 1, 2012 (table II-6). Firms attributed the increase in demand for cold-rolled steel to improved economic conditions with growth in U.S. construction activity and automotive manufacturing. A plurality of importers reported that demand for cold-rolled steel has fluctuated since 2012 and has followed the overall trend of the economy.
0
2
4
6
8
10
12
14
16
18
20
2012 2013 2014 2015
Milli
ons
of u
nits
200
400
600
800
1,000
1,200
2012 2013 2014 2015
Billio
ns o
f dol
lars

II-15
Firms’ responses regarding demand for cold-rolled steel outside the United States varied. Two U.S. producers and one importer reported an increase in foreign demand and attributed the growth to an increase in automotive sales. Several U.S. producers reported that demand in the EU and in China have been stagnant or have decreased. Four importers reported an increase in demand in emerging markets. According to one Brazilian source, demand for steel products in Brazil has declined, with its domestic sales forecasted to fall 15.6 percent in 2015. Falling demand in Brazil is attributed to declining economic conditions in its automotive, construction, machinery, and equipment sectors.32 Table II-6 Cold-rolled steel: Firms’ responses regarding U.S. demand and demand outside the United States
Item Increase No change Decrease Fluctuate Demand in the United States U.S. producers 7 2 0 2 Importers 16 7 1 19 Demand outside the United States U.S. producers 3 2 1 3 Importers 11 6 0 16
Source: Compiled from data submitted in response to Commission questionnaires. Substitute products
Substitutes for cold-rolled steel are limited in certain applications. Substitutes for cold-
rolled steel include aluminum, plastic, hot-rolled pickled and oiled products, NOES, galvanized steel, and stainless steel.33 Seven of 11 responding U.S. producers and six of 42 responding importers indicated that there were substitute products for cold-rolled steel. Five of seven responding U.S. producers and two of six responding importers reported that price changes for substitutes do not affect the price of cold-rolled steel. Two U.S. producers (***) reported that the price of hot-rolled pickled and oiled products, aluminum, and stainless steel affect the price of cold-rolled steel. *** reported that substitutes influence the pricing of cold-rolled steel as well as put pressure on the company to continue R&D efforts to produce lighter and more cost-effective cold-rolled steel options for its customers. Importers *** reported that galvanized steel used in “lightweighting” applications for automotive uses has reduced demand for cold-rolled steel and has impacted price. Importer *** stated that Ford has switched from cold-rolled steel to aluminum and indicated that aluminum impacts the price of cold-rolled steel.
32 ArcelorMittal USA’s postconference brief, exhibit 11, Brazilian Steel Institute, “Brazilian Steel Industry Faces Its Worst Crisis,” p. 2.
33 Aluminum was reported as a substitute for cold-rolled steel in automotive end uses; plastic was identified as a substitute in office furniture and electrical fixtures; hot-rolled pickled and oiled products was reported as a substitute in pipe and tube end uses; NOES was reported as a substitute in ignition applications; galvanized steel was reported as a substitute in non-critical exposed automotive applications; and stainless steel was identified as a substitute for cold-rolled steel in appliances.

II-16
SUBSTITUTABILITY ISSUES
The degree of substitution between domestic and imported cold-rolled steel depends upon such factors as relative prices, quality (e.g., grade standards, reliability of supply, defect rates, etc.), and conditions of sale (e.g., price discounts/rebates, lead times between order and delivery dates, payment terms, product services, etc.). Based on available data, staff believes that there is high degree of substitutability between domestically produced cold-rolled steel and cold-rolled steel imported from subject sources.
Lead times
Cold-rolled steel is primarily produced-to-order. U.S. producers reported that 99.3
percent of their commercial shipments were produced-to-order, with lead times averaging 46 days. The remaining 0.7 percent of their commercial shipments came from inventories, with lead times averaging 3.5 weeks. U.S. importers reported that 85.7 percent of their commercial shipments were produced-to-order, with lead times averaging 108 days. U.S. importers reported that 12.8 percent of their commercial shipments came from U.S. inventories and the remaining 1.5 percent of their commercial shipments came from foreign inventories. Importers averaged 34 days to complete orders from U.S. inventories and 44 days to complete orders from foreign inventories.
Comparison of U.S.-produced and imported cold-rolled steel
In order to determine whether U.S.-produced cold-rolled steel can generally be used in
the same applications as imports from Brazil, China, India, Japan, Korea, the Netherlands, Russia, and the United Kingdom, U.S. producers and importers were asked whether the products can “always,” “frequently,” “sometimes,” or “never” be used interchangeably. As shown in table II-7, the majority of U.S. producers reported that cold-rolled steel from all country pairs was “always” interchangeable. Most importers reported that cold-rolled steel from all country pairs was either “always” or “frequently” interchangeable.

II-17
Table II-7 Cold-rolled steel: Interchangeability between cold-rolled steel produced in the United States and in other countries, by country pairs
Country pair Number of U.S. producers
reporting Number of U.S. importers reporting A F S N A F S N
U.S. vs. subject countries: United States vs. Brazil 8 1 1 0 8 11 5 0 United States vs. China 8 0 1 1 9 14 7 0 United States vs. India 8 0 1 1 8 10 8 0 United States vs. Japan 8 2 0 0 11 10 4 1 United States vs. Korea 8 1 1 0 9 9 9 0 United States vs. Netherlands 8 1 1 1 9 7 3 0 United States vs. Russia 8 0 1 1 8 8 5 0 United States vs. United Kingdom 8 2 0 1 8 8 4 0 Subject countries comparisons: Brazil vs. China 8 0 1 0 8 9 3 0 Brazil vs. India 8 0 1 0 8 9 3 0 Brazil vs. Japan 8 1 0 0 8 7 3 1 Brazil vs. Korea 8 1 0 0 8 7 6 0 Brazil vs. Netherlands 8 1 0 0 8 8 3 0 Brazil vs. Russia 8 0 1 0 8 6 4 0 Brazil vs. United Kingdom 8 1 0 0 8 7 3 0 China vs. India 8 0 1 0 9 9 4 0 China vs. Japan 8 0 1 0 8 7 3 1 China vs. Korea 8 0 1 0 8 7 6 0 China vs. Netherlands 8 0 1 0 8 7 4 0 China vs. Russia 8 0 1 0 8 6 5 0 China vs. United Kingdom 8 0 1 0 8 6 4 0 India vs. Japan 8 0 1 0 8 6 4 1 India vs. Korea 8 0 1 0 8 6 8 0 India vs. Netherlands 8 0 1 0 8 6 5 0 India vs. Russia 8 0 1 0 8 7 4 0 India vs. United Kingdom 8 0 1 0 8 5 5 0 Japan vs. Korea 8 1 0 0 9 6 7 1 Japan vs. Netherlands 8 1 0 0 8 7 3 1 Japan vs. Russia 8 0 1 0 8 4 5 1 Japan vs. United Kingdom 8 1 0 0 8 7 4 1 Korea vs. Netherlands 8 1 0 0 8 7 3 0 Korea vs. Russia 8 0 1 0 8 5 4 1 Korea vs. United Kingdom 8 1 0 0 8 6 4 0 Netherlands vs. Russia 8 0 1 0 8 5 4 0 Netherlands vs. United Kingdom 8 1 0 0 8 7 3 0 Russia vs. United Kingdom 8 0 1 0 8 5 5 0
Table continued on next page.

II-18
Table II-7—Continued Cold-rolled steel: Interchangeability between cold-rolled steel produced in the United States and in other countries, by country pairs
Country pair Number of U.S. producers
reporting Number of U.S. importers reporting A F S N A F S N
Nonsubject countries comparisons: United States vs. Other 7 0 2 0 7 9 5 0 Brazil vs. Other 7 0 1 0 7 5 3 0 China vs. Other 7 0 1 0 7 7 3 0 India vs. Other 7 0 1 0 7 7 3 0 Japan vs. Other 7 0 1 0 7 5 3 1 Korea vs. Other 7 0 1 0 7 5 3 0 Netherlands vs. Other 7 0 1 0 7 5 3 0 Russia vs. Other 7 0 1 0 7 6 3 0 United Kingdom vs. Other 7 0 1 0 7 5 3 0
Note.—A=Always, F=Frequently, S=Sometimes, N=Never. Source: Compiled from data submitted in response to Commission questionnaires.
Several importers reported limited product interchangeability due to differences in
quality, production processes, and grades. Importers *** reported that product imported from the United Kingdom was sometimes interchangeable with domestic product. *** stated that the precision cold-rolled steel strip imported from the United Kingdom is sold at a premium price. *** stated that the limited interchangeability of UK product with domestic product and product imported from other countries is attributed partly to the differences in annealing process as well as the superior quality and differences in customer service.34 Importers *** reported that Korean producer POSCO produces higher automotive grade steel which is not interchangeable with other cold-rolled steel and is not generally available from U.S. mills or from other importers. Two importers (***) stated that cold-rolled steel from China had lower surface quality and was only sometimes interchangeable with domestic product. Several importers stated that cold-rolled steel from both India and Russia does not always meet quality requirements necessary to be interchangeable with domestic product.
AK Steel, ArcelorMittal USA, Nucor, and U.S. Steel contend that the domestic industry has the capability to produce the entire range of products along the quality continuum.35 36 However, according to Japanese respondents, cold-rolled steel from Japan has limited
34 It stated that the cold-rolled steel imported from the United Kingdom is produced from a continuous annealing process, while domestic product is box/batch annealed.
35 Conference transcript, pp. 87, 90-91 (Kopf, Mull, and Mathews). AK Steel’s postconference brief, p. 7.
36 U.S. Steel reported that it made a substantial investment to its Leipsic, Ohio facility in 2012 and can produce cold-rolled advanced high strength steels. These steels are demanded in the automotive industry in order to help automotive manufacturers meet safety standards as well as lightweight their vehicles. Conference transcript, pp. 106-107 (Mathews).

II-19
interchangeability with domestic product. They contend that Japanese cold-rolled steel products are high-quality niche products that satisfy specific customer requirements. Japanese respondents stated that imports of cold-rolled steel from Japan are focused on two products: ultra-high tensile steel for automotive applications and black plate used to produce cans.37 They argue that the quality and supply availability of high tensile steel produced by domestic producers is unreliable to meet purchasers’ requirements.38 Tata Steel Ijmuiden contends that it is the only producer capable of rolling coil to widths of 81 inches. It stated that only one domestic producer can produce cold-rolled coil with a maximum width of 78 inches.39
In addition, producers and importers were asked to assess how often differences other than price were significant in sales of cold-rolled steel from the United States, subject, or nonsubject countries. As seen in table II-8, most U.S. producers reported that there were “never” differences other than price between all country pairs. Importer responses were more varied; most importers reported that there were “sometimes” or “never” differences other than price between all country pairs. Table II-8 Cold-rolled steel: Significance of differences other than price between cold-rolled steel produced in the United States and in other countries, by country pairs
Country pair Number of U.S. producers
reporting Number of U.S. importers reporting A F S N A F S N
U.S. vs. subject countries: United States vs. Brazil 1 0 3 5 3 4 10 5 United States vs. China 1 0 3 5 6 9 10 5 United States vs. India 1 0 3 5 5 5 11 5 United States vs. Japan 1 0 2 6 6 4 10 5 United States vs. Korea 1 0 2 6 7 6 8 5 United States vs. Netherlands 2 0 2 6 6 2 6 5 United States vs. Russia 1 0 3 5 3 2 9 5 United States vs. United Kingdom 2 0 2 6 7 2 5 5
Table continued on next page.
37 Japanese Mills’ postconference brief, p. 5 and exhibit 2. Japanese producer ***. Japanese Mills’ postconference brief, exhibit 4.
38 Japanese Mills’ postconference brief, p. 6. Ohio Coatings Company (“OCC”), a producer of tin mill products, stated that ArcelorMittal USA and U.S. Steel are its only viable domestic sources of black plate. However, because ArcelorMittal USA and U.S. Steel are also its competitors in the tin plate market, OCC imports the vast majority of its black plate from Korea and Japan. Conference transcript, pp. 182-183 (Tennant). According to Korean producers, 70 percent of imports of black plate are sourced from Japan and Korea and nearly all of these imports are purchased by OCC for its production of tin plate. Korean producers’ postconference brief, pp. 5-6.
39 Tata Steel Ijmuiden’s postconference brief, p. 22.
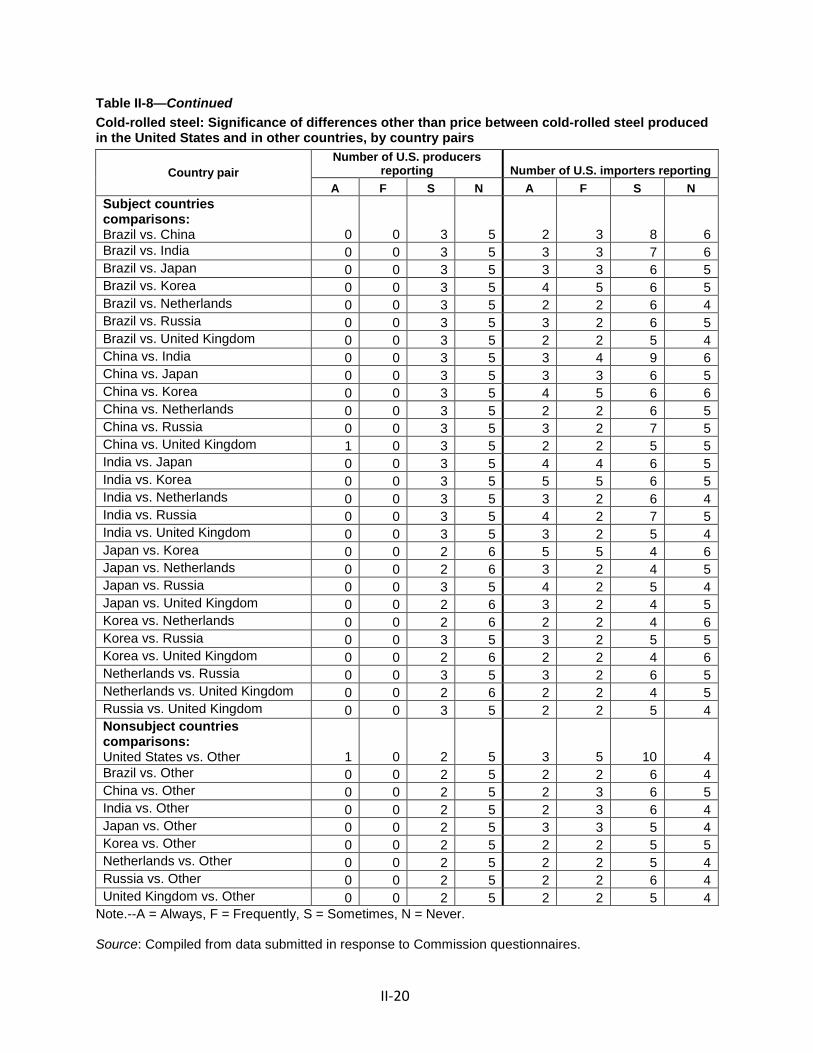
II-20
Table II-8—Continued Cold-rolled steel: Significance of differences other than price between cold-rolled steel produced in the United States and in other countries, by country pairs
Country pair Number of U.S. producers
reporting Number of U.S. importers reporting A F S N A F S N
Subject countries comparisons: Brazil vs. China 0 0 3 5 2 3 8 6 Brazil vs. India 0 0 3 5 3 3 7 6 Brazil vs. Japan 0 0 3 5 3 3 6 5 Brazil vs. Korea 0 0 3 5 4 5 6 5 Brazil vs. Netherlands 0 0 3 5 2 2 6 4 Brazil vs. Russia 0 0 3 5 3 2 6 5 Brazil vs. United Kingdom 0 0 3 5 2 2 5 4 China vs. India 0 0 3 5 3 4 9 6 China vs. Japan 0 0 3 5 3 3 6 5 China vs. Korea 0 0 3 5 4 5 6 6 China vs. Netherlands 0 0 3 5 2 2 6 5 China vs. Russia 0 0 3 5 3 2 7 5 China vs. United Kingdom 1 0 3 5 2 2 5 5 India vs. Japan 0 0 3 5 4 4 6 5 India vs. Korea 0 0 3 5 5 5 6 5 India vs. Netherlands 0 0 3 5 3 2 6 4 India vs. Russia 0 0 3 5 4 2 7 5 India vs. United Kingdom 0 0 3 5 3 2 5 4 Japan vs. Korea 0 0 2 6 5 5 4 6 Japan vs. Netherlands 0 0 2 6 3 2 4 5 Japan vs. Russia 0 0 3 5 4 2 5 4 Japan vs. United Kingdom 0 0 2 6 3 2 4 5 Korea vs. Netherlands 0 0 2 6 2 2 4 6 Korea vs. Russia 0 0 3 5 3 2 5 5 Korea vs. United Kingdom 0 0 2 6 2 2 4 6 Netherlands vs. Russia 0 0 3 5 3 2 6 5 Netherlands vs. United Kingdom 0 0 2 6 2 2 4 5 Russia vs. United Kingdom 0 0 3 5 2 2 5 4 Nonsubject countries comparisons: United States vs. Other 1 0 2 5 3 5 10 4 Brazil vs. Other 0 0 2 5 2 2 6 4 China vs. Other 0 0 2 5 2 3 6 5 India vs. Other 0 0 2 5 2 3 6 4 Japan vs. Other 0 0 2 5 3 3 5 4 Korea vs. Other 0 0 2 5 2 2 5 5 Netherlands vs. Other 0 0 2 5 2 2 5 4 Russia vs. Other 0 0 2 5 2 2 6 4 United Kingdom vs. Other 0 0 2 5 2 2 5 4
Note.--A = Always, F = Frequently, S = Sometimes, N = Never. Source: Compiled from data submitted in response to Commission questionnaires.
II-21
U.S. producer *** stated that differences can include “Buy America” compliance requirements, lead-time requirements, and customer service. Importer *** stated that different factors such as quality, availability, and lead times are frequently significant. With respect to product from the United Kingdom, importers *** stated that “the product imported from Tata Steel UK is continuously annealed, which imparts certain characteristics to the steel, including flatter surfaces, cleaner surfaces, and hardness, making it better suited than batch annealed cold-rolled steel for certain applications. Conversely, batch annealed cold rolled steel has better deep drawing capability than continuously annealed product.” Importer *** stated that the quality, size range, and availability of cold-rolled steel produced by some producers in China is more favorable than that of West Coast U.S. domestic producers. Importer *** reported that lead time, quality, shipment reliability, and technical support place products from both China and India at a disadvantage.

III-1
PART III: U.S. PRODUCERS’ PRODUCTION, SHIPMENTS, AND
EMPLOYMENT
The Commission analyzes a number of factors in making injury determinations (see 19 U.S.C. §§ 1677(7)(B) and 1677(7)(C)). Information on the subsidies and dumping margins was presented in Part I of this report and information on the volume and pricing of imports of the subject merchandise is presented in Part IV and Part V. Information on the other factors specified is presented in this section and/or Part VI and (except as noted) is based on the questionnaire responses of twelve firms that accounted for the vast majority of U.S. production of cold-rolled steel during 2015.1
U.S. PRODUCERS
The Commission issued a U.S. producer questionnaire to 24 firms based on information contained in the petition, and review of industry reports. Twelve firms provided useable data on their productive operations.2 Staff believes that these responses represent the vast majority of U.S. production of cold-rolled steel.
Table III-1 lists U.S. producers of cold rolled-steel, their production locations, positions on the petition, and shares of total production in 2014.
1 The coverage estimate is based on total production of cold-rolling in the United States of *** short tons as reported by ***.
2 One firm, *** submitted a late questionnaire response but with data that was not useable. Eleven firms, which are believed to be processors of cold-rolled steel, (***) did not respond to the Commission’s questionnaire.

III-2
Table III-1 Cold-rolled steel: U.S. producers of cold-rolled steel, their positions on the petition, production locations, production, and shares of reported production, 2014
Firm Position on petition Production location(s) Share of production
(percent)
AK Steel Support
Ashland, KY Butler, PA Dearborn, MI Middletown, OH Rockport, IN ***
ArcelorMittal, USA Support
Burns Harbor, IN Cleveland, OH East Chicago, IN Weirton, WV New Carlisle, IN Calvert, AL ***
Blair *** New Castle, PA *** CSI *** Fontana, CA *** CSN *** Terre Haute, IN ***
Nucor Support
Blytheville, AR Berkeley, SC Trinity, AL Crawfordsville, IN ***
Steel Dynamics Support Butler, IN Columbus, MS ***
Steelscape *** Kalama, Washington *** Thomas *** Warren, OH ***
U.S. Steel Support
Fairfield, AL Gary, IN East Chicago, IN Portage, IN Granite City, IL Ecorse, MI West Mifflin, PA ***
USS-POSCO *** Pittsburg, CA ***
Worthington Steel *** Columbus, OH Cleveland, OH ***
Total *** Note.— ***. ***. Source: Compiled from data submitted in response to Commission questionnaires.
Table III-2 presents information on U.S. producers’ ownership and related and/or
affiliated firms.

III-3
Table III-2 Cold-rolled steel: U.S. producers’ ownership and related and/or affiliated firms.
* * * * * * *
As indicated in table III-2, four U.S. producers (***) are related to foreign producers of
the subject merchandise, and one U.S. producer (***) is related to U.S. importers of the subject merchandise. In addition, as discussed in greater detail below, four U.S. producers (***) directly imported the subject merchandise, while no U.S. producers purchased the subject merchandise from U.S. importers.
Tolling operations and joint ventures
Two domestic producers reported tolling operations, ***. *** reported that ***. *** reported that ***.
Changes in operations
Table III-3 summarizes more recent important events that have taken place in the U.S. cold-rolled industry. Table III-3 Cold-rolled steel: Important industry events since January 1, 2012
Date Company Action Year Month
2012
April Severstal
A new labor agreement with the United Auto Workers was ratified covering Severstal’s Dearborn, Michigan operations. The Dearborn Works is an integrated steelmaking facility that produces flat-rolled products including cold-rolled steel, as well as other products.
July AK Steel
A new labor agreement with the United Auto Workers was ratified on July 17, 2012 covering workers at the Butler, Pennsylvania operations. The Butler facility produces carbon steel slabs which are finished (i.e. rolled) at other locations, as well as products outside the scope of these investigations such as stainless steel and electrical steel, The previous agreement was due to expire on September 30, 2012 and the new agreement will expire on October 1, 2016.
October ArcelorMittal
A new labor agreement with the United Steelworkers union was ratified on October 12, 2012 as negotiations continued past the September 1, 2012 expiration date of the previous agreement.
Table continued on next page.

III-4
Table III-3--Continued Cold-rolled steel: Important industry events since January 1, 2012
Date Company Action Year Month
2013
June
AK Steel
The blast furnace at the Middletown, Ohio Works had an unplanned outage on June 22, 2013 and restarted on July 12, 2013. As a result of the unplanned outage, the company’s steelmaking production during the quarter was reduced, resulting in a delay of shipments to some carbon steel spot market customers and an overall reduction in shipments during the third quarter of 2013.
August
A new labor agreement is ratified with the United Auto Workers covering workers at the Rockport, Indiana Works. The previous agreement was set to expire on September 30, 2013 and the new agreement will expire on September 30, 2017. The Rockport Works is a finishing operation only (i.e. does not make steel) and produces cold-rolled steel as well as products outside of the product scope of these investigations such as coated and stainless steel flat-rolled products.
2014
February
ArcelorMittal
Acquires, in a joint venture with Nippon Steel & Sumitomo Metal Corp., ThyssenKrupp Steel USA, which is a steel processing plant in Calvert, Alabama, The Calvert, Alabama plant produces hot rolled, cold rolled, and coated steel.
AK Steel
The blast furnace at the Ashland, Kentucky facility had an unplanned outage on February 22, 2014 and resumed operation in March.
June
A new labor agreement with the International Association of Machinists and Aerospace Workers was ratified covering workers at the Middletown, Ohio Works. The previous agreement was set to expire on September 15, 2014 and the new agreement will expire on March 15, 2018.
July
Announced an unplanned blast furnace outage at its Ashland, Kentucky facility. An announcement was made on September 3, 2014 that the blast furnace was back in operation although at reduced production levels. AK Steel also stated that it would compensate for the lower production levels by purchasing slabs on the open market, boosting slab output at its Butler, Pennsylvania operations, and using output from its recently acquired Dearborn, Michigan facility.
September
Acquired the former Severstal plant in Dearborn, Michigan. The Dearborn Works is an integrated steelmaking facility that produces flat-rolled products including hot- and cold-rolled steel, galvanized steel, as well as other products.
Table continued on next page.
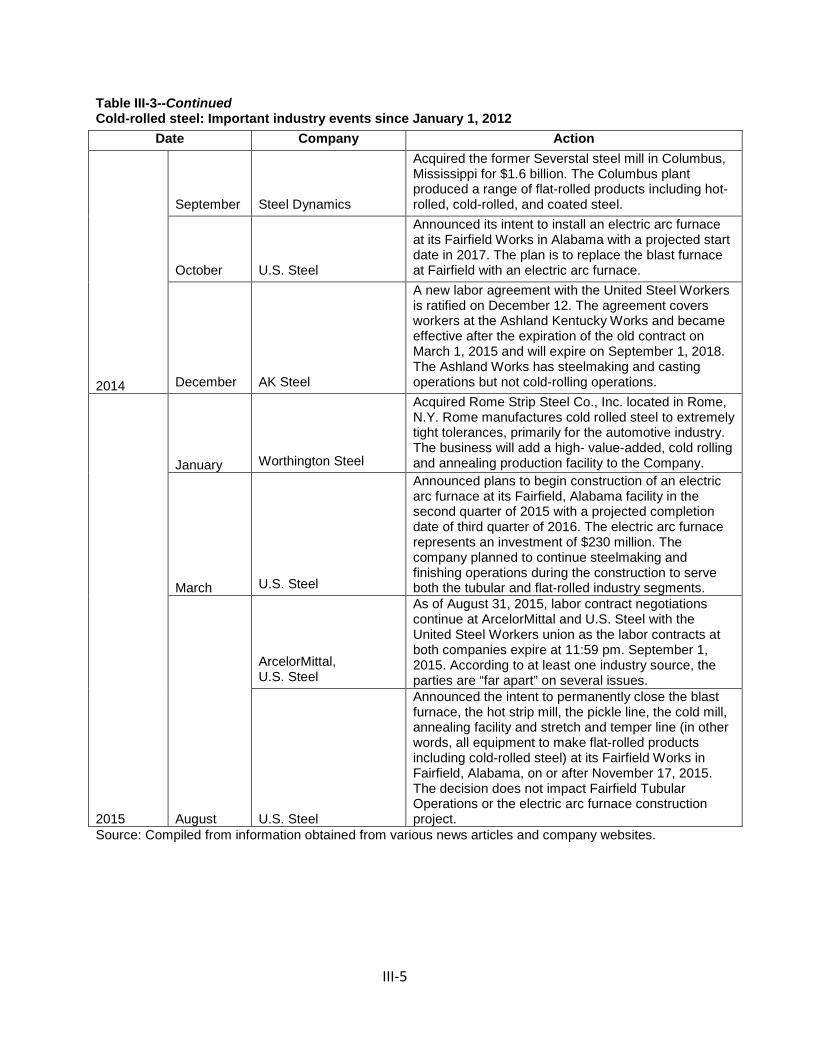
III-5
Table III-3--Continued Cold-rolled steel: Important industry events since January 1, 2012
Date Company Action
2014
September Steel Dynamics
Acquired the former Severstal steel mill in Columbus, Mississippi for $1.6 billion. The Columbus plant produced a range of flat-rolled products including hot-rolled, cold-rolled, and coated steel.
October U.S. Steel
Announced its intent to install an electric arc furnace at its Fairfield Works in Alabama with a projected start date in 2017. The plan is to replace the blast furnace at Fairfield with an electric arc furnace.
December AK Steel
A new labor agreement with the United Steel Workers is ratified on December 12. The agreement covers workers at the Ashland Kentucky Works and became effective after the expiration of the old contract on March 1, 2015 and will expire on September 1, 2018. The Ashland Works has steelmaking and casting operations but not cold-rolling operations.
2015
January Worthington Steel
Acquired Rome Strip Steel Co., Inc. located in Rome, N.Y. Rome manufactures cold rolled steel to extremely tight tolerances, primarily for the automotive industry. The business will add a high- value-added, cold rolling and annealing production facility to the Company.
March U.S. Steel
Announced plans to begin construction of an electric arc furnace at its Fairfield, Alabama facility in the second quarter of 2015 with a projected completion date of third quarter of 2016. The electric arc furnace represents an investment of $230 million. The company planned to continue steelmaking and finishing operations during the construction to serve both the tubular and flat-rolled industry segments.
August
ArcelorMittal, U.S. Steel
As of August 31, 2015, labor contract negotiations continue at ArcelorMittal and U.S. Steel with the United Steel Workers union as the labor contracts at both companies expire at 11:59 pm. September 1, 2015. According to at least one industry source, the parties are “far apart” on several issues.
U.S. Steel
Announced the intent to permanently close the blast furnace, the hot strip mill, the pickle line, the cold mill, annealing facility and stretch and temper line (in other words, all equipment to make flat-rolled products including cold-rolled steel) at its Fairfield Works in Fairfield, Alabama, on or after November 17, 2015. The decision does not impact Fairfield Tubular Operations or the electric arc furnace construction project.
Source: Compiled from information obtained from various news articles and company websites.

III-6
Nine responding domestic producers reported changes in their operations related to the production of cold-rolled steel since January 1, 2012. Such changes are presented in table III-4. Table III-4 Cold-rolled steel: Reported changes in operations by U.S. producers
* * * * * * *
U.S. PRODUCTION, CAPACITY, AND CAPACITY UTILIZATION
Table III-5 and figure III-1 present U.S. producers’ production, capacity, and capacity utilization. Domestic producers’ aggregate capacity was relatively stable, increasing by less than 0.1 percent from 2012 to 2014.3 Reported capacity was 0.3 percent lower in interim 2015 compared with interim 2014. Production increased by 1.0 percent from 2012 to 2014, but was 9.0 percent lower in interim 2015 compared with interim 2014. Capacity utilization was 0.8 percentage points higher in 2014 than in 2012, but was 6.0 percentage points lower in interim 2015 compared with interim 2014. Line shutdowns and production curtailments reported by six of the responding U.S. producers, including ***, mostly in 2014 and 2015 (see table III-3), did not result in a substantial decline in the reported aggregate capacity data or the aggregate production data during 2012-14, but were reflected in the lower aggregate production reported during interim 2015. Table III-5 Cold-rolled steel: U.S. producers’ production, capacity, and capacity utilization, 2012-14, January-June 2014, and January-June 2015
Item Calendar year January-June
2012 2013 2014 2014 2015 Quantity (short tons) Capacity1 39,514,662 39,961,225 39,510,948 19,802,264 19,738,901 Production 26,925,495 26,969,346 27,205,722 13,752,234 12,517,060 Ratio (percent) Capacity utilization 68.1 67.5 68.9 69.4 63.4
1 ***. Source: Compiled from data submitted in response to Commission questionnaires.
3 U.S. producer ***. Email from ***, August 26, 2015.

III-7
Figure III-1 Cold-rolled steel: U.S. producers’ production, capacity, and capacity utilization, 2012-14, January-June 2014, and January-June 2015
Source: Compiled from data submitted in response to Commission questionnaires.
Alternative products
As shown in table III-6, the majority of product produced by U.S. producers is subject cold-rolled steel. Production of cold-rolled steel accounted for 65.7 percent of total production on common equipment in 2014, while hot-rolled steel accounted for 27.2 percent and all other products accounted for 7.1 percent.4 The share of production represented by cold-rolled steel declined between 2012 and 2014, while the share of hot-rolled steel and other products increased. A majority of responding firms reported that they do not produce alternative products on the same equipment or using the same employees as cold-rolled steel. Firms that reported alternative products included ***.
4 Other products included coated steel (***) and tin mill products (***).
0.010.020.030.040.050.060.070.080.090.0100.0
05,000,000
10,000,00015,000,00020,000,00025,000,00030,000,00035,000,00040,000,00045,000,000
2012 2013 2014 2014 2015
Calendar year January to June
Ratio
(percent) Q
uant
ity
(sho
rt to
ns)
Capacity (left-axis) Production (left-axis) Capacity utilization (right-axis)

III-8
Table III-6 Cold-rolled steel: U.S. producers’ overall plant capacity and production on the same equipment as subject production, 2012-14, January-June 2014, and January-June 2015
Item Calendar year January-June
2012 2013 2014 2014 2015 Quantity (short tons) Overall production capacity 53,971,596 54,285,596 54,274,937 27,774,842 27,575,883 Production: Cold-rolled steel products 26,925,495 26,969,346 27,205,722 13,752,234 12,517,060
Hot-rolled steel products 10,770,293 11,006,368 11,268,931 5,698,712 4,958,279 Other products 2,713,446 2,879,266 2,940,449 1,490,560 1,378,823
Total production 40,409,234 40,854,980 41,415,102 20,941,506 18,854,162 Ratios and shares (percent) Overall capacity utilization 74.9 75.3 76.3 75.4 68.4 Share of production: Cold-rolled steel products 66.6 66.0 65.7 65.7 66.4
Hot-rolled steel products 26.7 26.9 27.2 27.2 26.3 Other products 6.7 7.0 7.1 7.1 7.3
Total production 100.0 100.0 100.0 100.0 100.0 Source: Compiled from data submitted in response to Commission questionnaires.
U.S. PRODUCERS’ U.S. SHIPMENTS AND EXPORTS
Table III-7 presents U.S. producers’ U.S. shipments, export shipments, and total shipments. These data show that total shipments increased in each period during 2012-14, but were lower in interim 2015 compared with interim 2014. The increase between 2012 and 2014 was solely due to increased internal consumption, while commercial U.S. shipments, transfers to related firms, and export shipments declined over this period. All but export shipments were lower in interim 2015 compared with interim 2014.
Internal consumption accounted for between *** percent of total shipments, with all but two domestic producers (***) reporting internal consumption. All but two firms (***) reported export shipments, *** to principal markets Canada and Mexico. *** accounted for *** percent of domestic producers’ exports in 2014, followed by *** accounting for *** percent. Exports accounted for 1.8 percent of U.S. producers’ total shipments in 2014.
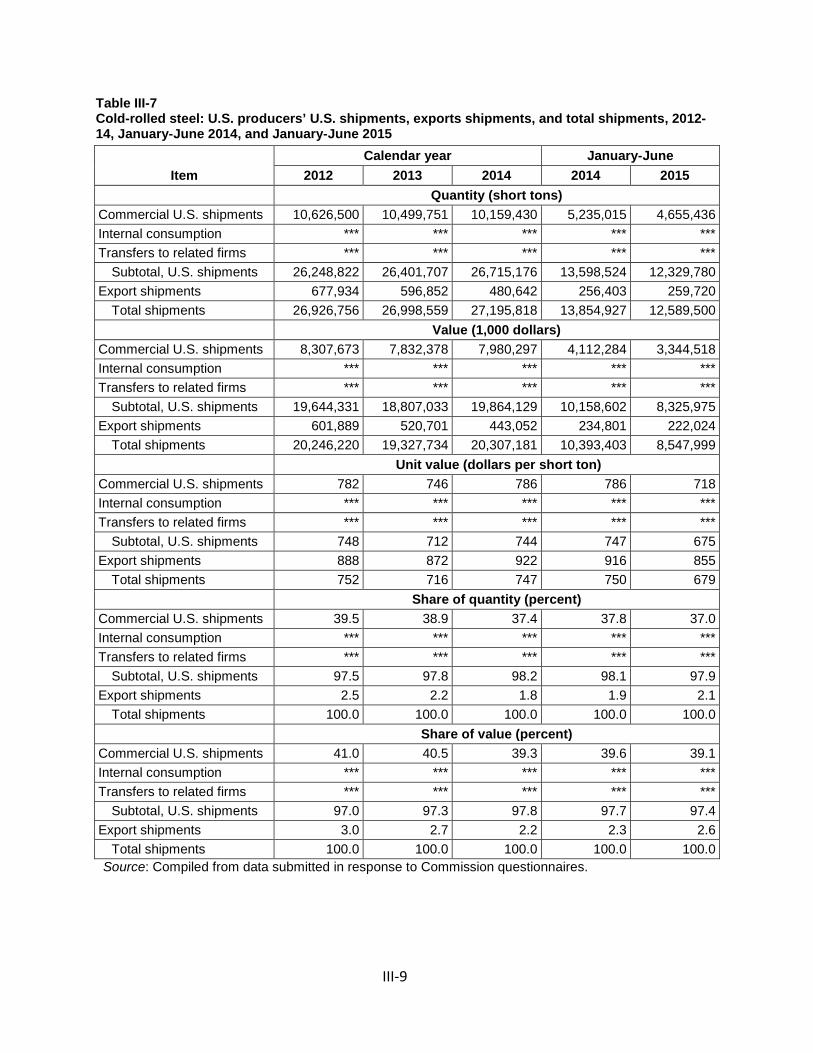
III-9
Table III-7 Cold-rolled steel: U.S. producers’ U.S. shipments, exports shipments, and total shipments, 2012-14, January-June 2014, and January-June 2015
Item Calendar year January-June
2012 2013 2014 2014 2015 Quantity (short tons) Commercial U.S. shipments 10,626,500 10,499,751 10,159,430 5,235,015 4,655,436 Internal consumption *** *** *** *** *** Transfers to related firms *** *** *** *** ***
Subtotal, U.S. shipments 26,248,822 26,401,707 26,715,176 13,598,524 12,329,780 Export shipments 677,934 596,852 480,642 256,403 259,720
Total shipments 26,926,756 26,998,559 27,195,818 13,854,927 12,589,500 Value (1,000 dollars) Commercial U.S. shipments 8,307,673 7,832,378 7,980,297 4,112,284 3,344,518 Internal consumption *** *** *** *** *** Transfers to related firms *** *** *** *** ***
Subtotal, U.S. shipments 19,644,331 18,807,033 19,864,129 10,158,602 8,325,975 Export shipments 601,889 520,701 443,052 234,801 222,024
Total shipments 20,246,220 19,327,734 20,307,181 10,393,403 8,547,999 Unit value (dollars per short ton) Commercial U.S. shipments 782 746 786 786 718 Internal consumption *** *** *** *** *** Transfers to related firms *** *** *** *** ***
Subtotal, U.S. shipments 748 712 744 747 675 Export shipments 888 872 922 916 855
Total shipments 752 716 747 750 679 Share of quantity (percent) Commercial U.S. shipments 39.5 38.9 37.4 37.8 37.0 Internal consumption *** *** *** *** *** Transfers to related firms *** *** *** *** ***
Subtotal, U.S. shipments 97.5 97.8 98.2 98.1 97.9 Export shipments 2.5 2.2 1.8 1.9 2.1
Total shipments 100.0 100.0 100.0 100.0 100.0 Share of value (percent) Commercial U.S. shipments 41.0 40.5 39.3 39.6 39.1 Internal consumption *** *** *** *** *** Transfers to related firms *** *** *** *** ***
Subtotal, U.S. shipments 97.0 97.3 97.8 97.7 97.4 Export shipments 3.0 2.7 2.2 2.3 2.6
Total shipments 100.0 100.0 100.0 100.0 100.0 Source: Compiled from data submitted in response to Commission questionnaires.

III-10
CAPTIVE CONSUMPTION
Section 771(7)(C)(iv) of the Act states that–5 If domestic producers internally transfer significant production of the domestic like product for the production of a downstream article and sell significant production of the domestic like product in the merchant market, and the Commission finds that–
(I) the domestic like product produced that is internally transferred
for processing into that downstream article does not enter the merchant market for the domestic like product,
(II) the domestic like product is the predominant material input in the
production of that downstream article, and
then the Commission, in determining market share and the factors affecting financial performance . . ., shall focus primarily on the merchant market for the domestic like product.
Internal transfers and merchant market sales
Internal consumption accounted for *** percent of U.S. producers’ U.S. shipments of cold-rolled steel during January 2012-June 2015. Transfers to related firms accounted for an additional *** percent. Commercial shipments accounted for the remaining 39.2 percent during this 42-month period.
First statutory criterion in captive consumption
The first requirement for application of the captive consumption provision is that the domestic like product that is internally transferred for processing into that downstream article not enter the merchant market for the domestic like product. U.S. producers reported internal consumption of cold-rolled steel for the production of coated steel. No U.S. producer, however, reported diverting cold-rolled steel intended for internal consumption to the merchant market. *** reported sales of limited volumes of cold-rolled steel (***) that were transferred to related firms.
Table III-11 presents the U.S. producers’ share of internal consumption and transfers to related firms by end-use in 2014. The vast majority of internal consumption is processed into coated steel, followed by tin milled products, while vast majority of transfers to related firms were processed into other (largely construction-related) products, with a smaller share sold as cold-rolled steel or processed into coated steel.
5 Amended by PL 114-27 (as signed, June 29, 2015), Trade Preferences Extension Act of 2015.
III-11
Table III-11 Cold rolled steel: U.S. producers' share of internal consumption and transfers to related firms by end-use, 2014
* * * * * * *
Second statutory criterion in captive consumption
The second criterion of the captive consumption provision concerns whether the domestic like product is the predominant material input in the production of the downstream article that is captivity produced. With respect to the downstream articles resulting from captive production, all but one of the eight responding domestic producers reported that cold-rolled steel comprises between 80 and 87 percent of the finished cost of coated products.6 Three responding U.S. producers estimated that cold-rolled steel compromises 68-84 percent of the finished cost of tin mill products, while two responding producers estimated that cold-rolled steel accounted for 78-90 percent of other products.
U.S. PRODUCERS’ INVENTORIES
Table III-8 presents U.S. producers’ end-of-period inventories and the ratio of these inventories to U.S. producers’ production, U.S. shipments, and total shipments. These data show that inventories fluctuated between 2012 and 2014, ending 2.0 percent lower in 2014, than in 2012, and were 3.5 percent higher in interim 2015 compared with interim 2014. U.S. producers’ inventories were equivalent to between 4.3 and 4.4 percent of U.S. producers’ U.S. production and total shipments, and between 4.4 and 4.5 percent of U.S. shipments, during 2012-14. While all U.S. producers reported inventories, the majority (more than *** percent) of domestic producers’ inventories were reported by two firms (***). ***’s inventories increased 2012-14 and were higher in interim 2015, while ***’s inventories declined in 2012-14 and were lower in interim 2015.
6 *** reported that cold-rolled steel accounted for *** percent of coated products.

III-12
Table III-8 Cold-rolled steel: U.S. producers’ inventories, 2012-14, January-June 2014, and January-June 2015
Item Calendar year January-June
2012 2013 2014 2014 2015 Quantity (short tons) U.S. producers' end-of-period inventories 1,193,312 1,163,147 1,169,857 1,059,422 1,096,561 Ratio (percent) Ratio of inventories to.-- U.S. production 4.4 4.3 4.3 3.9 4.4
U.S. shipments 4.5 4.4 4.4 3.9 4.4 Total shipments 4.4 4.3 4.3 3.8 4.4
Source: Compiled from data submitted in response to Commission questionnaires.
U.S. PRODUCERS’ IMPORTS AND PURCHASES
Table III-9 presents U.S. producers’ imports and purchases of cold-rolled steel. One U.S. producer, *** directly imported cold-rolled steel from subject countries. Three other U.S. producers, ***, are related to U.S. importers that imported cold-rolled steel from subject countries. Four other U.S. producers imported or purchased cold-rolled steel imported from nonsubject countries.
Table III-9 Cold-rolled steel: U.S. producers’ U.S. production, imports and purchases, 2012-14, January-June 2014, and January-June 2015
* * * * * * *
U.S. producer *** imported from *** in 2014 and interim 2015. These imports accounted for *** percent of U.S. production, respectively. U.S. producer *** is related to ***. These imports were equivalent to *** percent of U.S. production in any given time period. U.S. producer *** is related to ***. The total imports of *** were equivalent to between *** percent of *** U.S. production. None of these importers listed *** as one of their top ten customers for cold-rolled steel in 2014, and *** did not report any purchases of imports or direct imports. U.S. producer USS-POSCO is a joint venture between U.S. Steel and Korean producer POSCO. POSCO is the *** of U.S. importers POSCO America and POSCO-AAPC. The total imports of cold-rolled steel from Korea of both of these importer were equivalent to between *** percent of USS-POSCO’s U.S. production of cold-rolled steel. Neither of these importers ***.
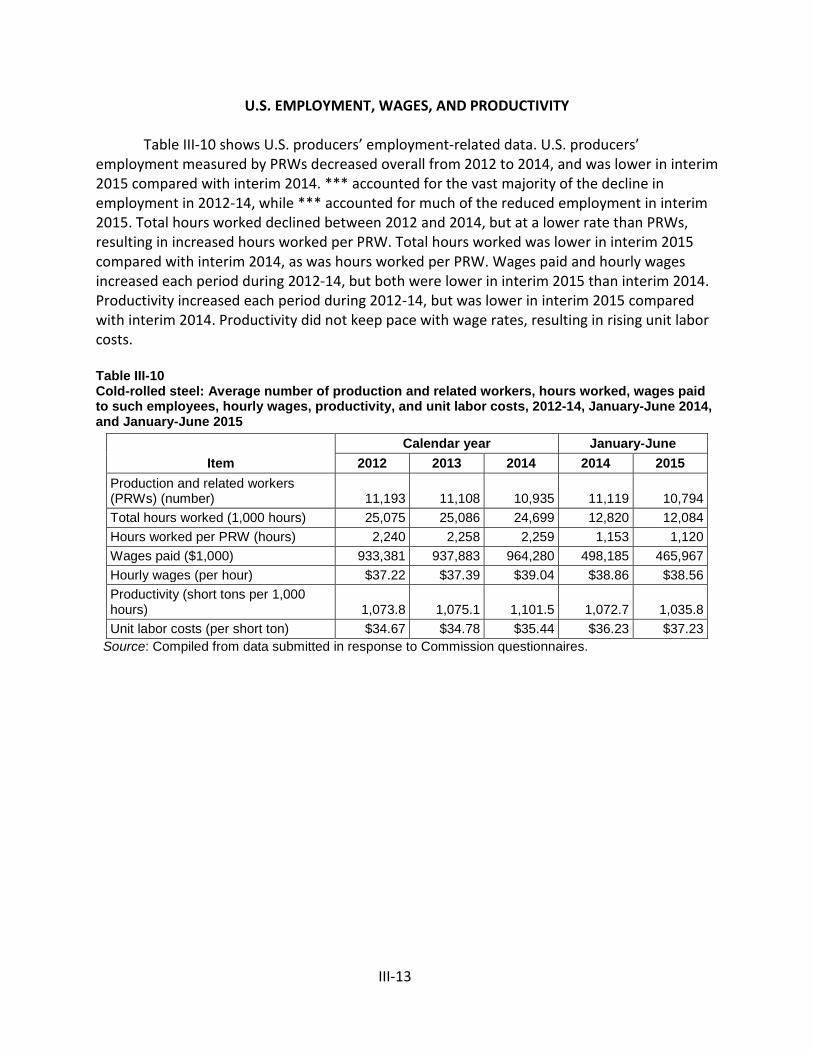
III-13
U.S. EMPLOYMENT, WAGES, AND PRODUCTIVITY
Table III-10 shows U.S. producers’ employment-related data. U.S. producers’ employment measured by PRWs decreased overall from 2012 to 2014, and was lower in interim 2015 compared with interim 2014. *** accounted for the vast majority of the decline in employment in 2012-14, while *** accounted for much of the reduced employment in interim 2015. Total hours worked declined between 2012 and 2014, but at a lower rate than PRWs, resulting in increased hours worked per PRW. Total hours worked was lower in interim 2015 compared with interim 2014, as was hours worked per PRW. Wages paid and hourly wages increased each period during 2012-14, but both were lower in interim 2015 than interim 2014. Productivity increased each period during 2012-14, but was lower in interim 2015 compared with interim 2014. Productivity did not keep pace with wage rates, resulting in rising unit labor costs. Table III-10 Cold-rolled steel: Average number of production and related workers, hours worked, wages paid to such employees, hourly wages, productivity, and unit labor costs, 2012-14, January-June 2014, and January-June 2015
Item Calendar year January-June
2012 2013 2014 2014 2015 Production and related workers (PRWs) (number) 11,193 11,108 10,935 11,119 10,794 Total hours worked (1,000 hours) 25,075 25,086 24,699 12,820 12,084 Hours worked per PRW (hours) 2,240 2,258 2,259 1,153 1,120 Wages paid ($1,000) 933,381 937,883 964,280 498,185 465,967 Hourly wages (per hour) $37.22 $37.39 $39.04 $38.86 $38.56 Productivity (short tons per 1,000 hours) 1,073.8 1,075.1 1,101.5 1,072.7 1,035.8 Unit labor costs (per short ton) $34.67 $34.78 $35.44 $36.23 $37.23
Source: Compiled from data submitted in response to Commission questionnaires.


IV-1
PART IV: U.S. IMPORTS, APPARENT U.S. CONSUMPTION, AND MARKET SHARES
U.S. IMPORTERS
The Commission issued an importer questionnaire to 68 firms believed to be importers of subject cold-rolled steel, as well as to all U.S. producers of cold-rolled steel.1 Usable questionnaire responses were received from 50 companies, representing 93.7 percent of official U.S. imports from Brazil, 77.1 percent from China, 62.4 percent from India, 95.8 percent from Japan, 94.3 percent from Korea, 99.7 percent from the Netherlands, 65.5 percent from Russia, 99.2 percent from United Kingdom, and 79.0 percent from nonsubject countries between January 2012 and May 2015 (last month for which data were available from ***).2 3 In light of less-than-complete coverage of data from several subject countries provided in Commission questionnaires, import data in this report are based on official Commerce statistics for cold-rolled steel, as adjusted to include alloy cold-rolled steel data collected separately in questionnaire responses. Table IV-1 lists all responding U.S. importers of cold-rolled steel, their locations, and their shares of U.S. imports, in 2014. Table IV-1 Cold-rolled steel: U.S. importers by source, 2014
* * * * * * *
U.S. IMPORTS
Table IV-2 and figure IV-1 present data for U.S. imports of cold-rolled steel from Brazil, China, India, Japan, Korea, the Netherlands, Russia, the United Kingdom, Canada (largest nonsubject source) and all other sources. Imports of cold-rolled steel from subject countries, by quantity, declined 8.5 percent between 2012 and 2013 and then increased 167.8 percent in 2014, ending 144.8 percent higher than in 2012. U.S. imports from subject countries were 34.2
1 The Commission issued questionnaires to those firms identified in the petition, along with firms that, based on a review of data provided by ***, may have accounted for more than five percent of total imports under the non-alloy or alloy cold-rolled steel HTS statistical reporting numbers during 2012-14.
2 The coverage estimates presented are based on the share of total imports under alloy and non-alloy cold-rolled steel HTS numbers (from data provided by ***) accounted for by each responding importer. The HTS numbers include 7209.15.0000, 7209.16.0030, 7209.16.0060, 7209.16.0070, 7209.16.0091, 7209.17,0030, 7209.17.0060, 7209.17,0070, 7209.17.0091, 7209.18.1530, 7209.18.1560, 7209.18.2510, 7209.18.2520, 7209.18.2580, 7209.18.6020, 7209.18.6090, 7209.25.0000, 7209.26.0000, 7209.27.0000, 7209.28.0000, 7209.90.0000, 7210.70.3000, 7211.23.1500, 7211.23.2000, 7211.23.3000, 7211.23.4500, 7211.23.6030, 7211.23.6060, 7211.23.6075, 7211.23.6085, 7211.29.2030, 7211.29.2090, 7211.29.4500, 7211.29.6030, 7211.29.6080, 7211.90.0000, 7212.40.1000, 7212.40.5000, 7225.50.6000, 7225.50.8015, 7225.50.8085, 7225.99.0090, 7226.92.5000, 7226.92.7050, and 7226.92.8050.
3 In addition, nine firms reported that they had not imported cold-rolled steel from any country at any time since January 1, 2012.

IV-2
percent higher in interim 2015 compared with interim 2014. While U.S. imports from each subject country were higher in 2014 than in 2012, the majority of the increase was U.S. imports from China, while the higher level of imports in interim 2015 was due to U.S. imports from Brazil followed by imports from China and Korea.4 As a share of the quantity of total imports, subject imports decreased from 53.4 percent in 2012 to 50.9 percent in 2013, and then rose to 64.1 percent in 2014, ending 10.7 percentage points higher than in 2012. Subject imports were also 9.8 percentage points higher in interim 2015 compared with interim 2014. The average unit values of subject imports, which were lower than those reported for nonsubject imports, decreased by $115 per short ton or 13.8 percent from 2012 to 2014,5 6 and were $84 per short ton or 11.3 percent lower in interim 2015 compared with interim 2014.
Canada was the largest nonsubject source for U.S. imports of cold-rolled steel, accounting for *** percent of the quantity of total U.S. imports of cold-rolled steel in 2014. U.S. imports from all nonsubject countries combined declined by *** percent from 2012 to 2014, and were *** percent lower in interim 2015 compared with interim 2014. The average unit values of nonsubject imports decreased 4.0 percent ($36 per short ton) from 2012 to 2014, and were 4.5 percent lower ($38 per short ton) in interim 2015 compared with interim 2014.
4 Petitioners note that U.S. imports of cold-rolled steel from Russia increased (from 0 short tons in 2012 and 222 short tons in 2013) after the suspension agreement on hot-rolled steel was terminated and the issuance of an antidumping order in December 2014. Arcelor Mittal USA’s postconference brief, p. 35 and U.S. Steel’s postconference brief, p. 47 n. 191. A suspension agreement between Russia and the United States on imports of hot-rolled steel was negotiated effective on July 12, 1999. Suspension of Antidumping Duty Investigation: Hot-Rolled Flat-Rolled Carbon-Quality Steel Products From the Russian Federation, 64 FR 38642, July 19, 1999. The agreement was terminated effective on December 19, 2014. Termination of the Suspension Agreement on Hot-Rolled Flat-Rolled Carbon-Quality Steel Products From the Russian Federation, Rescission of 2013–2014 Administrative Review, and Issuance of Antidumping Duty Order, 79 FR 77455, December 24, 2014.
5 This reflects, in part, the relatively stable quantity of imports from Japan (with the highest subject unit values in 2014) and the substantial growth in the quantity of imports from China (with the lowest subject unit values in 2014).
6 The average unit values of U.S. imports from the United Kingdom in 2012 and 2013 were substantially higher than from other sources and during other periods, due to the smaller quantity of U.S. imports, mainly by U.S. importer ***.

IV-3
Table IV-2 Cold-rolled steel: U.S. imports by source, 2012-14, January-June 2014, and January-June 2015
Item Calendar year January - June
2012 2013 2014 2014 2015 Quantity (short tons) U.S. imports from.-- Brazil 97,559 32,953 98,755 29,928 125,335
China 277,087 266,627 865,816 322,093 371,638 India 7,656 17,537 85,640 46,655 64,530 Japan 119,576 133,537 129,907 69,085 74,561 Korea *** *** *** *** *** Russia 0 222 89,385 28,851 34,759 United Kingdom *** *** *** *** ***
Subtotal *** *** *** *** *** Netherlands *** *** *** *** ***
Subtotal, all subject sources 680,133 621,823 1,665,149 650,307 872,914 Canada *** *** *** *** *** All other sources *** *** *** *** ***
Subtotal, nonsubject sources 594,565 600,001 933,254 450,482 393,641 Total U.S. imports 1,274,698 1,221,823 2,598,403 1,100,789 1,266,555
Value (1,000 dollars) U.S. imports from.-- Brazil 66,430 20,925 68,100 19,878 70,526
China 191,993 166,752 545,679 206,656 214,386 India 9,420 15,066 61,803 33,998 41,477 Japan 129,691 134,843 135,558 73,831 71,462 Korea *** *** *** *** *** Russia 0 127 58,969 19,902 22,114 United Kingdom *** *** *** *** ***
Subtotal *** *** *** *** *** Netherlands *** *** *** *** ***
Subtotal, all subject sources 568,088 491,766 1,198,908 485,532 578,314 Canada *** *** *** *** *** All other sources *** *** *** *** ***
Subtotal, nonsubject sources 548,223 519,352 827,353 397,884 332,790 Total U.S. imports 1,116,311 1,011,118 2,026,262 883,416 911,104
Table continued on next page.

IV-4
Table IV-2 --Continued Cold-rolled steel: U.S. imports by source, 2012-14, January-June 2014, and January-June 2015
Item Calendar year January - June
2012 2013 2014 2014 2015 Unit value (dollars per short ton) U.S. imports from.-- Brazil 681 635 690 664 563
China 693 625 630 642 577 India 1,230 859 722 729 643 Japan 1,085 1,010 1,044 1,069 958 Korea *** *** *** *** *** Russia -- 573 660 690 636 United Kingdom *** *** *** *** ***
Subtotal *** *** *** *** *** Netherlands *** *** *** *** ***
Subtotal, all subject sources 835 791 720 747 663 Canada *** *** *** *** *** All other sources *** *** *** *** ***
Subtotal, nonsubject sources 922 866 887 883 845 Total U.S. imports 876 828 780 803 719
Share of quantity (percent) U.S. imports from.-- Brazil 7.7 2.7 3.8 2.7 9.9
China 21.7 21.8 33.3 29.3 29.3 India 0.6 1.4 3.3 4.2 5.1 Japan 9.4 10.9 5.0 6.3 5.9 Korea *** *** *** *** *** Russia 0.0 0.0 3.4 2.6 2.7 United Kingdom *** *** *** *** ***
Subtotal *** *** *** *** *** Netherlands *** *** *** *** ***
Subtotal, all subject sources 53.4 50.9 64.1 59.1 68.9 Canada *** *** *** *** *** All other sources *** *** *** *** ***
Subtotal, nonsubject sources 46.6 49.1 35.9 40.9 31.1 Total U.S. imports 100.0 100.0 100.0 100.0 100.0
Table continued on next page.

IV-5
Table IV-2 --Continued Cold-rolled steel: U.S. imports by source, 2012-14, January-June 2014, and January-June 2015
Item Calendar year January - June
2012 2013 2014 2014 2015 Share of value (percent) U.S. imports from.-- Brazil 6.0 2.1 3.4 2.3 7.7
China 17.2 16.5 26.9 23.4 23.5 India 0.8 1.5 3.1 3.8 4.6 Japan 11.6 13.3 6.7 8.4 7.8 Korea *** *** *** *** *** Russia 0.0 0.0 2.9 2.3 2.4 United Kingdom *** *** *** *** ***
Subtotal *** *** *** *** *** Netherlands *** *** *** *** ***
Subtotal, all subject sources 50.9 48.6 59.2 55.0 63.5 Canada *** *** *** *** *** All other sources *** *** *** *** ***
Subtotal, nonsubject sources 49.1 51.4 40.8 45.0 36.5 Total U.S. imports 100.0 100.0 100.0 100.0 100.0
Ratio to production (percent) U.S. imports from.-- Brazil 0.4 0.1 0.4 0.2 1.0
China 1.0 1.0 3.2 2.3 3.0 India 0.0 0.1 0.3 0.3 0.5 Japan 0.4 0.5 0.5 0.5 0.6 Korea *** *** *** *** *** Russia 0.0 0.0 0.3 0.2 0.3 United Kingdom *** *** *** *** ***
Subtotal *** *** *** *** *** Netherlands *** *** *** *** ***
Subtotal, all subject sources 2.5 2.3 6.1 4.7 7.0 Canada *** *** *** *** *** All other sources *** *** *** *** ***
Subtotal, nonsubject sources 2.2 2.2 3.4 3.3 3.1 Total U.S. imports 4.7 4.5 9.6 8.0 10.1
Source: Compiled from data submitted in response to Commission questionnaires and from official Commerce statistics.

IV-6
Figure IV-1 Cold-rolled steel: U.S. imports, by source, 2012-14, January-June 2014, and January-June 2015
Source: Compiled from data submitted in response to Commission questionnaires and from official Commerce statistics.
NEGLIGIBILITY
The statute requires that an investigation be terminated without an injury determination if imports of the subject merchandise are found to be negligible.7 Negligible imports are generally defined in the Tariff Act of 1930, as amended, as imports from a country of merchandise corresponding to a domestic like product where such imports account for less than 3 percent of the volume of all such merchandise imported into the United States in the most recent 12-month period for which data are available that precedes the filing of the petition or the initiation of the investigation. However, if there are imports of such merchandise from a number of countries subject to investigations initiated on the same day that individually account for less than 3 percent of the total volume of the subject merchandise, and if the imports from those countries collectively account for more than 7 percent of the volume of all such merchandise imported into the United States during the applicable 12-month period, then imports from such countries are deemed not to be negligible.8 The statute further provides that, in the case of countervailing duty investigations involving developing countries, the negligibility limits are 4 percent and 9 percent, rather than 3 percent and 7 percent.9
Table IV-3 presents U.S. imports for July 2014-June 2015 based on official U.S. import statistics for non-alloy cold-rolled steel adjusted to include alloy cold-rolled steel data collected separately in questionnaire responses.10 Table IV-4 presents U.S. imports for July 2014-June
7 Sections 703(a)(1), 705(b)(1), 733(a)(1), and 735(b)(1) of the Act (19 U.S.C. §§ 1671b(a)(1), 1671d(b)(1), 1673b(a)(1), and 1673d(b)(1)).
8 Section 771 (24) of the Act (19 U.S.C § 1677(24)). 9 Section 771 (24)(B) of the Act (19 U.S.C § 1677(24)(B)). 10 Exclusive of U.S. imports of black plate (under HTS 7209.18.2520 and 7209.18.2580), U.S. imports
of cold-rolled steel from the subject countries accounted for the following percentages of total U.S. imports: Brazil – 7.4 percent, China- 34.7 percent, India- 3.9, Japan- 4.3, Korea-*** percent,
(continued...)
0
200
400
600
800
1,000
0
500,000
1,000,000
1,500,000
2,000,000
2,500,000
3,000,000
2012 2013 2014 2014 2015
Calendar year January - June
Average unit value (dollars per short ton)
Qua
ntity
(s
hort
tons
)
Subject import volume (left-axis) Nonsubject import volume (left-axis)
Subject AUV (right-axis) Nonsubject AUV (right-axis)

IV-7
2015 based on official U.S. import statistics for non-alloy and alloy cold-rolled steel.11 12 Imports from the Netherlands, the subject country that accounted for the smallest share of total imports, represented *** percent of total quantity of imports of cold-rolled steel as measured by official U.S. import statistics adjusted to include alloy cold-rolled steel collected in questionnaire responses during July 2014-June 2015 and 2.7 percent of total quantity of imports of cold-rolled steel as measured by unadjusted official import statistics of non-alloy and alloy cold-rolled steel. Imports from Russia represented 3.4 percent and 3.2 percent of total imports of cold-rolled steel by quantity during July 2014-June 2015, for official statistics augmented by alloy questionnaire data and official statistics for non-alloy and alloy cold-rolled steel, respectively. Imports from India represented 3.7 percent and 3.5 percent of total imports of cold-rolled steel by quantity during July 2014-June 2015, for official statistics augmented by alloy questionnaire data and official statistics for non-alloy and alloy cold-rolled steel, respectively. Imports from India and the Netherlands, combined, accounted for *** percent and 6.2 percent of total imports of cold-rolled steel by quantity during July 2014-June 2015, for official statistics augmented by alloy questionnaire data and official statistics for non-alloy and alloy cold-rolled steel, respectively.13 14 15 All other subject sources accounted for more than 4 percent of total imports by either measure.
(…continued) Netherlands- ***, Russia- 3.6, and United Kingdom- *** percent. U.S. imports of cold-rolled steel from India and the Netherlands, combined, accounted for 6.6 percent of total U.S. imports.
11 These include carbon cold-rolled steel HTS statistical reporting numbers: 7209.15.0000, 7209.16.0030, 7209.16.0060, 7209.16.0070, 7209.16.0091, 7209.17.0030, 7209.17.0060, 7209.17.0070, 7209.17.0091, 7209.18.1530, 7209.18.1560, 7209.18.2510, 7209.18.2520, 7209.18.2580, 7209.18.6020, 7209.18.6090, 7209.25.0000, 7209.26.0000, 7209.27.0000, 7209.28.0000, 7209.90.0000, 7210.70.3000, 7211.23.1500, 7211.23.2000, 7211.23.3000, 7211.23.4500, 7211.23.6030, 7211.23.6060, 7211.23.6085, 7211.29.2030, 7211.29.2090, 7211.29.4500, 7211.29.6030, 7211.29.6080, 7211.90.0000, 7212.40.1000, 7212.40.5000. These also include certain alloy cold-rolled steel HTS statistical reporting numbers: 7225.50.6000, 7225.50.8085, 7225.99.0090, 7226.92.5000, 7226.92.7050, and 7226.92.8050.
12 Exclusive of U.S. imports of black plate (under HTS 7209.18.2520 and 7209.18.2580), U.S. imports of cold-rolled steel from the subject countries accounted for the following percentages of total U.S. imports: Brazil - 6.8 percent, China- 32.3 percent, India- 3.6, Japan- 4.6, Korea-7.1 percent, Netherlands- 2.8, Russia- 3.4, and United Kingdom- 5.0 percent. U.S. imports of cold-rolled steel from India and the Netherlands, combined, accounted for 6.4 percent of total U.S. imports.
13 The quantity of U.S. imports, by month and source for January 2012 – June 2015 is presented in appendix F.
14 Tata Steel Ijmuiden reported that *** U.S. imports from the United Kingdom under alloy cold-rolled HTS numbers, ***, were of nonsubject polymer-coated tin-free sheet (under HTS statistical reporting number 7225.99.0090, a basket category).
15 As noted in Part VII, the responding foreign producer from India, which reported to be *** percent of cold-rolled production in India and *** percent of Indian exports to the United States in 2014, reported exports to the United States equivalent to *** percent of U.S. imports from India, by quantity, during 2012-14 and January-June 2015.

IV-8
Table IV-3 Cold-rolled steel: Monthly U.S. imports by source, July 2014 - June 2015 (adjusted)
Source Quantity (short tons) Share of quantity (percent)
July 2014 - June 2015 U.S. imports from.-- Brazil 194,162 7.0
China 915,362 33.1 India 103,515 3.7 Japan 135,382 4.9 Korea *** *** Netherlands *** *** Russia 95,293 3.4 United Kingdom *** ***
Subject sources 1,887,757 68.3 Canada *** *** All other sources *** ***
Subtotal, nonsubject sources 876,413 31.7 Total U.S. imports 2,764,170 100.0
Netherlands and India, combined 173,876 *** Note.—The share of U.S. imports of subject alloy steel accounted for the following: Brazil - 0.0 percent; China - 0.0 percent; India - 0.0 percent; Japan - 51.1 percent; Korea - *** percent; Netherlands - *** percent; Russia - 0.0 percent; United Kingdom - *** percent; Subject sources - 9.7 percent; Canada - *** percent; and All other sources - *** percent. Source: Compiled from Official U.S. imports statistics (non-alloy HTS numbers) and data submitted in response to Commission questionnaires. Table IV-4 Cold-rolled steel: Monthly U.S. imports by source, July 2014 - June 2015 (official)
Source Quantity (short tons) Share of quantity (percent)
July 2014 - June 2015 U.S. imports from.-- Brazil 194,182 6.5
China 921,107 30.9 India 103,690 3.5 Japan 153,255 5.1 Korea 288,667 9.7 Netherlands 80,218 2.7 Russia 95,293 3.2 United Kingdom 142,012 4.8
Subject sources 1,978,424 66.5 Canada 460,356 15.5 All other sources 538,369 18.1
Subtotal, nonsubject sources 998,726 33.5 Total U.S. imports 2,977,150 100.0
Netherlands and India, combined 183,909 6.2 Note.—The share of U.S. imports of alloy steel accounted for the following: Brazil - 0.0 percent; China - 0.6 percent; India- 0.2 percent; Japan - 56.8 percent; Korea - 30.9 percent; Netherlands- 43.4 percent; Russia - 0.0 percent; United Kingdom- 40.5 percent; Subject sources - 13.9 percent; Canada - 22.3 percent; and All other sources - 28.9 percent. Source: Compiled from Official U.S. imports statistics (non-alloy and alloy HTS numbers).

IV-9
CUMULATION CONSIDERATIONS
In assessing whether imports should be cumulated, the Commission determines whether U.S. imports from the subject countries compete with each other and with the domestic like product and has generally considered four factors: (1) fungibility, (2) presence of sales or offers to sell in the same geographical markets, (3) common or similar channels of distribution, and (4) simultaneous presence in the market. Additional information concerning fungibility, geographical markets, and simultaneous presence in the market is presented below.
Fungibility
Shipments of cold-rolled steel, by end use
Table IV‐5 presents data for U.S. producers’ and U.S. importers’ commercial U.S. shipments of cold-rolled steel, by end use. U.S. producers reported that cold-rolled steel is sold mainly for other end uses (particularly construction) followed by automotive end uses.16 The data show that during 2012‐14, *** percent of U.S. commercial shipments of U.S.‐produced cold-rolled steel was sold for other end uses, *** percent of shipments was sold for automotive end uses, *** percent was sold for appliance end uses, and the remaining *** percent was for container end uses. U.S. commercial shipments of U.S. imports from the Netherlands were largely to automotive and appliance end uses during 2012-14. U.S. commercial shipments of U.S. imports from the United Kingdom were largely to other end uses in 2012-13, but with an increase in imports in 2014, shifted to automotive and appliance end uses during 2014. Japan and Korea were the only other subject countries that reported a higher share of its commercial U.S. shipments to a non-other end use, namely automotive end use in each year each period, although the share for automotive end uses declined and the share for container end uses increased from 2012 to 2014.
16 Other end uses listed by U.S. producers include service centers, pipe and tube, construction, industrial, machinery and equipment, and converters.

IV-10
Table IV-5 Cold-rolled steel: U.S. shipments by end use, 2012-14, January-June 2014, and January-June 2015
* * * * * * *
Presence in the market
Table IV-6 presents information on the monthly presence of U.S. imports in the United States during 2012-14, January-June 2014, and January-June 2015. These data show that imports of cold-rolled steel from the subject countries were present in the U.S. market in every month during January 2012 to June 2015, except for Brazil (in 2013) and Russia.17 Table IV-6 Cold-rolled steel: Monthly presence of U.S. imports, 2012-14, January-June 2014, and January-June 2015
Item Calendar year January - June
2012 2013 2014 2014 2015 Months present (number) U.S. imports from.-- Brazil 12 9 12 6 6
China 12 12 12 6 6 India 12 12 12 6 6 Japan 12 12 12 6 6 Korea 12 12 12 6 6 Netherlands 12 12 12 6 6 Russia 0 1 10 5 4 United Kingdom 12 12 12 6 6
Subject sources 12 12 12 6 6 Canada 12 12 12 6 6 All other sources 12 12 12 6 6
Subtotal, nonsubject sources 12 12 12 6 6 Total U.S. imports 12 12 12 6 6
Source: Compiled from official Commerce statistics (alloy and non-alloy HTS numbers).
Geographical markets
As noted previously, cold-rolled steel production occurs throughout the United States and cold-rolled steel is shipped nationwide. As illustrated in table IV-7, the New Orleans, Los Angeles, and Philadelphia Customs districts accounted for more than half of the imports of cold-rolled steel from the subject countries during 2014.
17 The quantity of U.S. imports, by month and source for January 2012 – June 2015 is presented in appendix F.
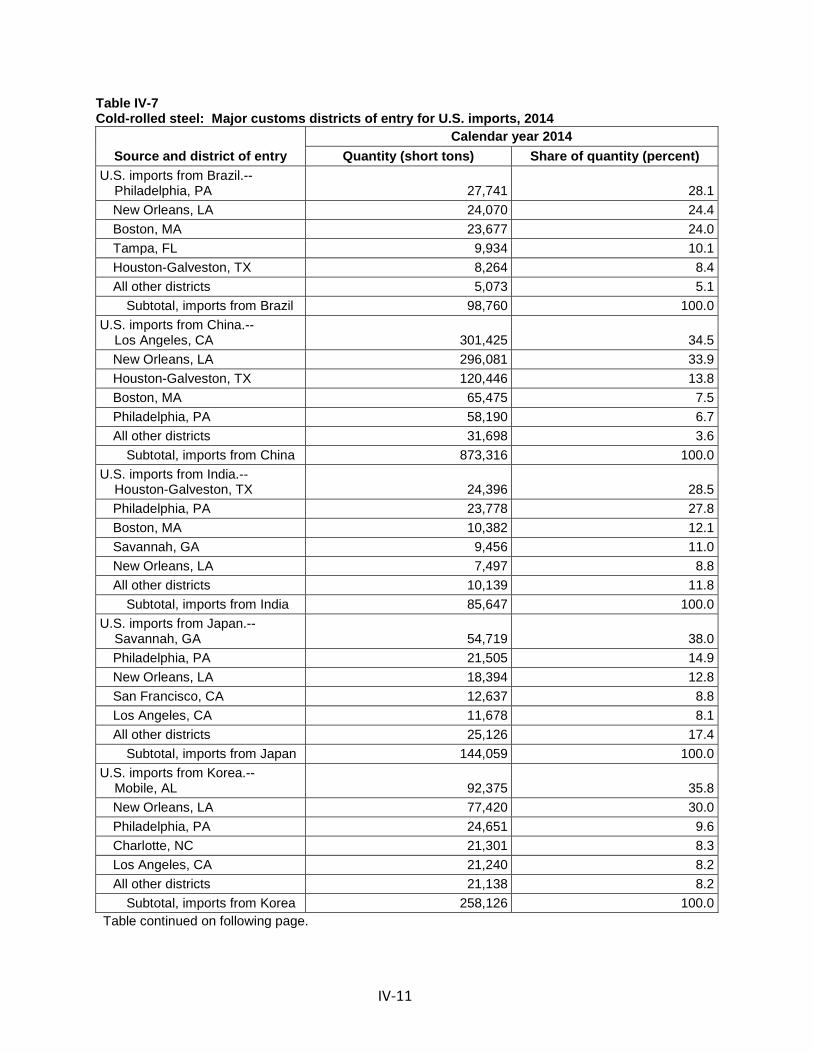
IV-11
Table IV-7 Cold-rolled steel: Major customs districts of entry for U.S. imports, 2014
Source and district of entry Calendar year 2014
Quantity (short tons) Share of quantity (percent) U.S. imports from Brazil.-- Philadelphia, PA 27,741 28.1
New Orleans, LA 24,070 24.4 Boston, MA 23,677 24.0 Tampa, FL 9,934 10.1 Houston-Galveston, TX 8,264 8.4 All other districts 5,073 5.1
Subtotal, imports from Brazil 98,760 100.0 U.S. imports from China.-- Los Angeles, CA 301,425 34.5
New Orleans, LA 296,081 33.9 Houston-Galveston, TX 120,446 13.8 Boston, MA 65,475 7.5 Philadelphia, PA 58,190 6.7 All other districts 31,698 3.6
Subtotal, imports from China 873,316 100.0 U.S. imports from India.-- Houston-Galveston, TX 24,396 28.5
Philadelphia, PA 23,778 27.8 Boston, MA 10,382 12.1 Savannah, GA 9,456 11.0 New Orleans, LA 7,497 8.8 All other districts 10,139 11.8
Subtotal, imports from India 85,647 100.0 U.S. imports from Japan.-- Savannah, GA 54,719 38.0
Philadelphia, PA 21,505 14.9 New Orleans, LA 18,394 12.8 San Francisco, CA 12,637 8.8 Los Angeles, CA 11,678 8.1 All other districts 25,126 17.4
Subtotal, imports from Japan 144,059 100.0 U.S. imports from Korea.-- Mobile, AL 92,375 35.8
New Orleans, LA 77,420 30.0 Philadelphia, PA 24,651 9.6 Charlotte, NC 21,301 8.3 Los Angeles, CA 21,240 8.2 All other districts 21,138 8.2
Subtotal, imports from Korea 258,126 100.0 Table continued on following page.

IV-12
Table IV-7--Continued Cold-rolled steel: Major customs districts of entry for U.S. imports, 2014
Source and district of entry
Calendar year 2014
Quantity (short tons) Share of quantity
(percent) U.S. imports from Russia.-- New Orleans, LA 54,474 60.9
Chicago, IL 21,951 24.6 Houston-Galveston, TX 10,541 11.8 Tampa, FL 1,513 1.7 Charleston, SC 502 0.6 All other districts 403 0.5
Subtotal, imports from Russia 89,385 100.0 U.S. imports from United Kingdom.-- Chicago, IL 48,283 39.4
Philadelphia, PA 39,632 32.3 Detroit, MI 14,576 11.9 Cleveland, OH 7,868 6.4 Boston, MA 5,506 4.5 All other districts 6,724 5.5
Subtotal, imports from United Kingdom 122,589 100.0 U.S. imports from subject sources less Netherlands.-- New Orleans, LA 477,947 28.6
Los Angeles, CA 334,476 20.0 Philadelphia, PA 195,497 11.7 Houston-Galveston, TX 173,391 10.4 Boston, MA 105,050 6.3 All other districts 385,520 23.1
Subtotal, Imports from subject sources less Netherlands 1,671,882 100.0 U.S. imports from Netherland.-- Philadelphia, PA 25,237 30.2
Chicago, IL 20,577 24.6 Cleveland, OH 19,475 23.3 Milwaukee, WI 7,497 9.0 Laredo, TX 7,457 8.9 All other districts 3,328 4.0
Subtotal, imports from Netherlands 83,572 100.0 U.S. imports from all subject sources.-- New Orleans, LA 477,947 27.2
Los Angeles, CA 334,476 19.1 Philadelphia, PA 220,734 12.6 Houston-Galveston, TX 174,088 9.9 Boston, MA 106,582 6.1 All other districts 441,626 25.2
Subtotal, Imports from all subject sources 1,755,454 100.0 Table continued on following page.

IV-13
Table IV-7--Continued Cold-rolled steel: Major customs districts of entry for U.S. imports, 2014
Source and district of entry
Calendar year 2014
Quantity (short tons) Share of quantity
(percent) U.S. imports from Canada.-- Detroit, MI 414,168 83.5
Buffalo, NY 79,581 16.0 Baltimore, MD 827 0.2 Cleveland, OH 589 0.1 Ogdensburg, NY 344 0.1 All other districts 448 0.1
Subtotal, imports from Canada 495,956 100.0 U.S. imports from all other sources.-- Laredo, TX 191,648 35.8
Philadelphia, PA 81,211 15.2 Chicago, IL 59,487 11.1 Detroit, MI 43,448 8.1 Cleveland, OH 27,595 5.2 All other sources 131,958 24.6
Subtotal, imports from all other sources 535,348 100.0 U.S. imports from nonsubject sources.-- Detroit, MI 457,617 44.4
Laredo, TX 191,648 18.6 Philadelphia, PA 81,211 7.9 Buffalo, NY 79,873 7.7 Chicago, IL 59,487 5.8 All other sources 161,468 15.7
Subtotal, imports from nonsubject sources 1,031,304 100.0 U.S. imports from all sources.-- New Orleans, LA 492,153 17.7
Detroit, MI 478,211 17.2 Los Angeles, CA 353,374 12.7 Philadelphia, PA 301,946 10.8 Laredo, TX 204,885 7.4 All other sources 956,189 34.3
Total U.S. imports 2,786,757 100.0 Source: Official U.S. imports statistics using HTS statistical reporting numbers 7209.15.0000, 7209.16.0030, 7209.16.0060, 7209.16.0070, 7209.16.0091, 7209.17.0030, 7209.17.0060, 7209.17.0070, 7209.17.0091, 7209.18.1530, 7209.18.1560, 7209.18.2510, 7209.18.2520, 7209.18.2580, 7209.18.6020, 7209.18.6090, 7209.25.0000, 7209.26.0000, 7209.27.0000, 7209.28.0000, 7209.90.0000, 7210.70.3000, 7211.23.1500, 7211.23.2000, 7211.23.3000, 7211.23.4500, 7211.23.6030, 7211.23.6060, 7211.23.6085, 7211.29.2030, 7211.29.2090, 7211.29.4500, 7211.29.6030, 7211.29.6080, 7211.90.0000, 7212.40.1000, 7212.40.5000, 7225.50.6000, 7225.50.8085, 7225.99.0090, 7226.92.5000, 7226.92.8050 and 7226.99.0180 (both non-alloy and alloy HTS numbers), accessed August 7, 2015.

IV-14
APPARENT U.S. CONSUMPTION
Table IV-8 and figure IV-2 present data on apparent U.S. consumption and U.S. market shares for cold-rolled steel. These data show that apparent U.S. consumption, by quantity, increased by 6.5 percent from 2012 to 2014, but was 7.6 percent lower in interim 2015 compared with interim 2014. The value of apparent U.S. consumption increased 5.4 percent from 2012 to 2014, but was 16.3 percent lower in interim 2015 compared with interim 2014. Table IV-8 Cold-rolled steel: Apparent U.S. consumption, 2012-14, January-June 2014, and January-June 2015
Item Calendar year January - June
2012 2013 2014 2014 2015 Quantity (short tons) U.S. producers' U.S. shipments 26,248,822 26,401,707 26,715,176 13,598,524 12,329,780 U.S. imports from.-- Brazil 97,559 32,953 98,755 29,928 125,335
China 277,087 266,627 865,816 322,093 371,638 India 7,656 17,537 85,640 46,655 64,530 Japan 119,576 133,537 129,907 69,085 74,561 Korea *** *** *** *** *** Russia 0 222 89,385 28,851 34,759 United Kingdom *** *** *** *** ***
Subtotal *** *** *** *** *** Netherlands *** *** *** *** ***
Subtotal, all subject sources 680,133 621,823 1,665,149 650,307 872,914 Canada *** *** *** *** *** All other sources *** *** *** *** ***
Subtotal, nonsubject sources 594,565 600,001 933,254 450,482 393,641 Total U.S. imports 1,274,698 1,221,823 2,598,403 1,100,789 1,266,555
Apparent U.S. consumption 27,523,520 27,623,530 29,313,579 14,699,313 13,596,335 Value (1,000 dollars) U.S. producers' U.S. shipments 19,644,331 18,807,033 19,864,129 10,158,602 8,325,975 U.S. imports from.-- Brazil 66,430 20,925 68,100 19,878 70,526
China 191,993 166,752 545,679 206,656 214,386 India 9,420 15,066 61,803 33,998 41,477 Japan 129,691 134,843 135,558 73,831 71,462 Korea *** *** *** *** *** Russia 0 127 58,969 19,902 22,114 United Kingdom *** *** *** *** ***
Subtotal *** *** *** *** *** Netherlands *** *** *** *** ***
Subtotal, all subject sources 568,088 491,766 1,198,908 485,532 578,314 Canada *** *** *** *** *** All other sources *** *** *** *** ***
Subtotal, nonsubject sources 548,223 519,352 827,353 397,884 332,790 Total U.S. imports 1,116,311 1,011,118 2,026,262 883,416 911,104
Apparent U.S. consumption 20,760,642 19,818,151 21,890,391 11,042,018 9,237,079 Source: Compiled from data submitted in response to Commission questionnaires.

IV-15
Figure IV-2 Cold-rolled steel: Apparent U.S. consumption, 2012-14, January-June 2014, and January-June 2015
Source: Compiled from data submitted in response to Commission questionnaires.
Merchant market
Table IV-9 and figure IV-3 present data on apparent U.S. consumption and U.S. market shares for merchant market cold-rolled steel. These data show that merchant market apparent U.S. consumption, by quantity, increased by 7.2 percent from 2012 to 2014, but was 6.5 percent lower in interim 2015 compared with interim 2014.18 The value of merchant market apparent U.S. consumption, increased by 6.2 percent from 2012 to 2014, but was 14.8 percent lower in interim 2015 compared with interim 2014.
18 Petitioners’ argue that the lower apparent U.S. consumption in interim 2015 was a reflection of a buildup in importer, service center, and end user inventories, following the increase in imports in 2014, rather than a decline in actual demand. Nucor’s postconference brief, p. 8.
0
5,000,000
10,000,000
15,000,000
20,000,000
25,000,000
30,000,000
35,000,000
2012 2013 2014 2014 2015
Calendar year January - June
Qua
ntity
(s
hort
tons
)
U.S. producers Subject imports Nonsubject imports

IV-16
Table IV-9 Cold-rolled steel: Apparent U.S. merchant market consumption, 2012-14, January-June 2014, and January-June 2015
Item Calendar year January - June
2012 2013 2014 2014 2015 Quantity (short tons) U.S. producers' commercial U.S. shipments 10,626,500 10,499,751 10,159,430 5,235,015 4,655,436 U.S. imports from.-- Brazil 97,559 32,953 98,755 29,928 125,335
China 277,087 266,627 865,816 322,093 371,638 India 7,656 17,537 85,640 46,655 64,530 Japan 119,576 133,537 129,907 69,085 74,561 Korea *** *** *** *** *** Russia 0 222 89,385 28,851 34,759 United Kingdom *** *** *** *** ***
Subtotal *** *** *** *** *** Netherlands *** *** *** *** ***
Subtotal, all subject sources 680,133 621,823 1,665,149 650,307 872,914 Canada *** *** *** *** *** All other sources *** *** *** *** ***
Subtotal, nonsubject sources 594,565 600,001 933,254 450,482 393,641 Total U.S. imports 1,274,698 1,221,823 2,598,403 1,100,789 1,266,555
Apparent U.S. merchant market consumption 11,901,198 11,721,574 12,757,833 6,335,804 5,921,991 Value (1,000 dollars) U.S. producers' commercial U.S. shipments 8,307,673 7,832,378 7,980,297 4,112,284 3,344,518 U.S. imports from.-- Brazil 66,430 20,925 68,100 19,878 70,526
China 191,993 166,752 545,679 206,656 214,386 India 9,420 15,066 61,803 33,998 41,477 Japan 129,691 134,843 135,558 73,831 71,462 Korea *** *** *** *** *** Russia 0 127 58,969 19,902 22,114 United Kingdom *** *** *** *** ***
Subtotal *** *** *** *** *** Netherlands *** *** *** *** ***
Subtotal, all subject sources 568,088 491,766 1,198,908 485,532 578,314 Canada *** *** *** *** *** All other sources *** *** *** *** ***
Subtotal, nonsubject sources 548,223 519,352 827,353 397,884 332,790 Total U.S. imports 1,116,311 1,011,118 2,026,262 883,416 911,104
Apparent U.S. merchant market consumption 9,423,984 8,843,496 10,006,559 4,995,700 4,255,622
Source: Compiled from data submitted in response to Commission questionnaires and official Commerce statistics.

IV-17
Figure IV-3 Cold-rolled steel: Apparent U.S. merchant market consumption, 2012-14, January-June 2014, and January-June 2015
Source: Compiled from data submitted in response to Commission questionnaires and official Commerce statistics.
U.S. MARKET SHARES
U.S. market share data for cold-rolled steel are presented in table IV-10. These data show that U.S. producers’ market share declined by 4.2 percentage points from 2012 to 2014, while the market share held by subject sources increased by 3.2 percentage points during the same period. U.S. producers’ market share was also 1.8 percentage points lower in interim 2015 compared with interim 2014, while U.S. imports from subject countries were 2.0 percentage points higher. Measured by value, U.S. producers’ market share of the cold-rolled steel merchant market decreased 3.9 percentage points between 2012 and 2014, while the market share of subject imports was 2.7 percentage points higher. U.S. producers’ market share was 1.9 percentage points lower in interim 2015 compare with 2014, while subject imports market share was 1.9 percentage points higher.
0
2,000,000
4,000,000
6,000,000
8,000,000
10,000,000
12,000,000
14,000,000
2012 2013 2014 2014 2015
Calendar year January - June
Qua
ntity
(s
hort
tons
)
U.S. producers Subject imports Nonsubject imports

IV-18
Table IV-10 Cold-rolled steel: U.S. consumption and market shares, 2012-14, January-June 2014, and January-June 2015
Item Calendar year January - June
2012 2013 2014 2014 2015 Quantity (short tons) Apparent U.S. consumption 27,523,520 27,623,530 29,313,579 14,699,313 13,596,335 Share of quantity (percent) U.S. producers' U.S. shipments 95.4 95.6 91.1 92.5 90.7 U.S. imports from.-- Brazil 0.4 0.1 0.3 0.2 0.9
China 1.0 1.0 3.0 2.2 2.7 India 0.0 0.1 0.3 0.3 0.5 Japan 0.4 0.5 0.4 0.5 0.5 Korea *** *** *** *** *** Russia 0.0 0.0 0.3 0.2 0.3 United Kingdom *** *** *** *** ***
Subtotal *** *** *** *** *** Netherlands *** *** *** *** ***
Subtotal, all subject sources 2.5 2.3 5.7 4.4 6.4 Canada *** *** *** *** *** All other sources *** *** *** *** ***
Subtotal, nonsubject sources 2.2 2.2 3.2 3.1 2.9 Total U.S. imports 4.6 4.4 8.9 7.5 9.3
Value (1,000 dollars) Apparent U.S. consumption 20,760,642 19,818,151 21,890,391 11,042,018 9,237,079 Share of value (percent) U.S. producers' U.S. shipments 94.6 94.9 90.7 92.0 90.1 U.S. imports from.-- Brazil 0.3 0.1 0.3 0.2 0.8
China 0.9 0.8 2.5 1.9 2.3 India 0.0 0.1 0.3 0.3 0.4 Japan 0.6 0.7 0.6 0.7 0.8 Korea *** *** *** *** *** Russia 0.0 0.0 0.3 0.2 0.2 United Kingdom *** *** *** *** ***
Subtotal *** *** *** *** *** Netherlands *** *** *** *** ***
Subtotal, all subject sources 2.7 2.5 5.5 4.4 6.3 Canada *** *** *** *** *** All other sources *** *** *** *** ***
Subtotal, nonsubject sources 2.6 2.6 3.8 3.6 3.6 Total U.S. imports 5.4 5.1 9.3 8.0 9.9
Source: Compiled from data submitted in response to Commission questionnaires and official Commerce statistics.

IV-19
Merchant market
U.S. market share data for the cold-rolled steel merchant market are presented in table IV-11. These data show that U.S. producers’ market share declined by 9.7 percentage points from 2012 to 2014, while the market share held by subject sources increased by 7.3 percentage points during the same period. U.S. producers’ market share was also 4.0 percentage points lower in interim 2015 compared with interim 2014, while U.S. imports from subject countries were 4.5 percentage points higher. Measured by value, U.S. producers’ market share of the cold-rolled steel merchant market decreased 8.4 percentage points between 2012 and 2014, while the market share of subject imports was 6.0 percentage points higher. U.S. producers’ market share was 3.7 percentage points lower in interim 2015 compare with 2014, while subject imports market share was 3.9 percentage points higher.
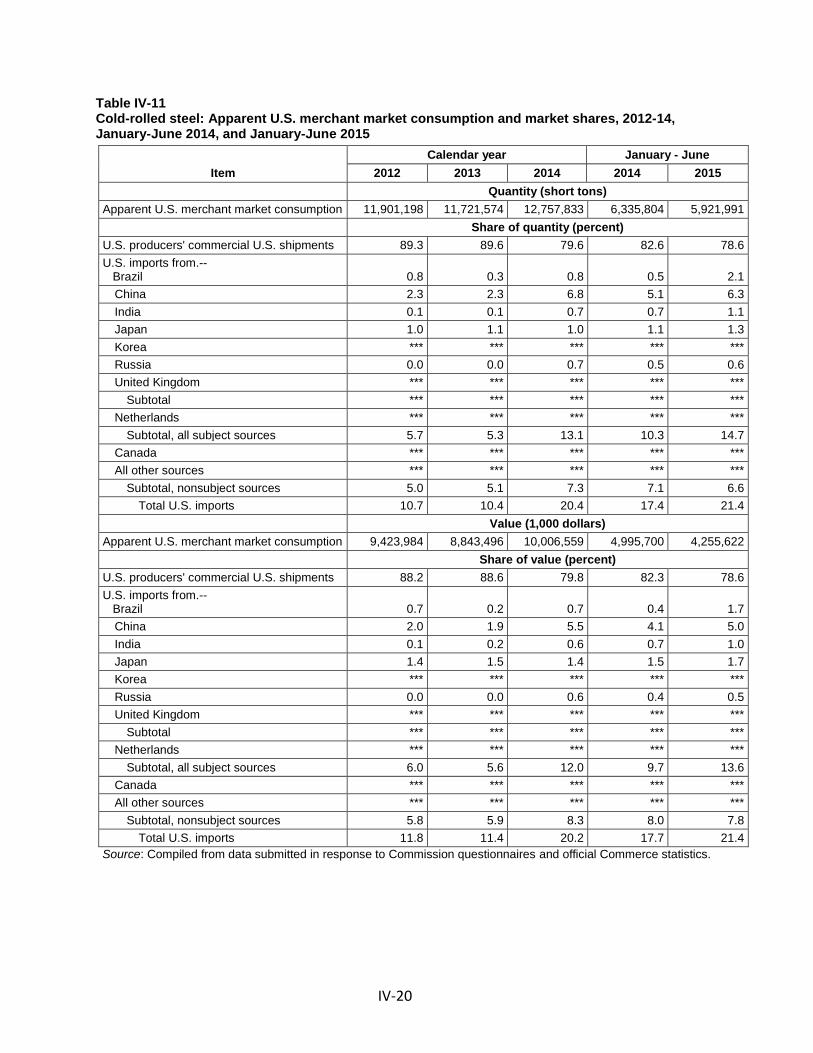
IV-20
Table IV-11 Cold-rolled steel: Apparent U.S. merchant market consumption and market shares, 2012-14, January-June 2014, and January-June 2015
Item Calendar year January - June
2012 2013 2014 2014 2015 Quantity (short tons) Apparent U.S. merchant market consumption 11,901,198 11,721,574 12,757,833 6,335,804 5,921,991 Share of quantity (percent) U.S. producers' commercial U.S. shipments 89.3 89.6 79.6 82.6 78.6 U.S. imports from.-- Brazil 0.8 0.3 0.8 0.5 2.1
China 2.3 2.3 6.8 5.1 6.3 India 0.1 0.1 0.7 0.7 1.1 Japan 1.0 1.1 1.0 1.1 1.3 Korea *** *** *** *** *** Russia 0.0 0.0 0.7 0.5 0.6 United Kingdom *** *** *** *** ***
Subtotal *** *** *** *** *** Netherlands *** *** *** *** ***
Subtotal, all subject sources 5.7 5.3 13.1 10.3 14.7 Canada *** *** *** *** *** All other sources *** *** *** *** ***
Subtotal, nonsubject sources 5.0 5.1 7.3 7.1 6.6 Total U.S. imports 10.7 10.4 20.4 17.4 21.4
Value (1,000 dollars) Apparent U.S. merchant market consumption 9,423,984 8,843,496 10,006,559 4,995,700 4,255,622 Share of value (percent) U.S. producers' commercial U.S. shipments 88.2 88.6 79.8 82.3 78.6 U.S. imports from.-- Brazil 0.7 0.2 0.7 0.4 1.7
China 2.0 1.9 5.5 4.1 5.0 India 0.1 0.2 0.6 0.7 1.0 Japan 1.4 1.5 1.4 1.5 1.7 Korea *** *** *** *** *** Russia 0.0 0.0 0.6 0.4 0.5 United Kingdom *** *** *** *** ***
Subtotal *** *** *** *** *** Netherlands *** *** *** *** ***
Subtotal, all subject sources 6.0 5.6 12.0 9.7 13.6 Canada *** *** *** *** *** All other sources *** *** *** *** ***
Subtotal, nonsubject sources 5.8 5.9 8.3 8.0 7.8 Total U.S. imports 11.8 11.4 20.2 17.7 21.4
Source: Compiled from data submitted in response to Commission questionnaires and official Commerce statistics.

V‐1
PART V: PRICING DATA
FACTORS AFFECTING PRICES
Raw material costs
The primary raw material inputs used to produce cold‐rolled steel include iron ore, coal, and iron and steel scrap. Prices for these raw materials fluctuated during January 2012‐June 2015, though the prices for each input showed an overall decrease. U.S. producers’ raw material costs as a share of the cost of goods sold (“COGS”) decreased from 69.1 percent in 2012 to 63.6 percent in 2014, and was 57.0 percent in January‐June 2015 (compared to 61.4 percent during January‐June 2014).
Prices for iron ore, coal, and iron and steel scrap decreased by 26.8 percent, 7.2 percent, and 41.4 percent, respectively, between January 2012 and June 2015 (figure V‐1). Figure V-1 Raw material costs: Producer price indexes of iron ore, coal, and iron and steel scrap in the United States, monthly, January 2012- June 20151
Source: U.S. Bureau of Labor Statistics, August 11, 2015.
1 Data for March‐June 2015 is projected, as final Bureau of Labor Statistics data are not yet available.
40
50
60
70
80
90
100
110
120
2012 2013 2014 2015
January 2012 = 100
Iron Ore Coal Iron and steel scrap
Projected Actual

V‐2
The immediate upstream input to cold‐rolled steel is hot‐rolled steel. According to *** data, between January 2012 and June 2015 prices of hot‐rolled coil decreased by *** percent and prices of cold‐rolled coil decreased by *** percent (figure V‐2). Prices for both cold‐rolled and hot‐rolled steel coil rose slightly in July 2015, and according to *** prices are projected to continue to increase, despite high levels of Chinese exports.2 Figure V-2 Raw material costs: Steel sheet product prices, USA Midwest, January 2012-July 2015, monthly
* * * * * * *
Nearly all firms reported that raw material prices had either fluctuated or decreased since January 2012. Five of 11 responding U.S. producers reported that raw material prices fluctuated with no clear trend, while six firms reported that they had decreased.3 Two U.S. producers, ***, reported that raw material prices have declined due to oversupply.
Twenty‐two of 45 responding importers reported that raw material prices had fluctuated since January 2012, while 22 reported that prices had decreased, and one reported that they had not changed. The importers that reported a decrease in raw material costs since January 2012 cited decreases in iron ore, coking coal, and scrap prices.
Energy costs
Energy costs are also an important factor in cold‐rolled steel production costs. Electricity
prices fluctuated slightly from January 2012 to May 2015, but increased overall by 3.3 percent (figure V‐3). Natural gas prices fluctuated between a low of $3.02 per thousand cubic feet in May 2012 and a high of $6.57 per thousand cubic feet in February 2014, and showed an overall decrease in price between January 2012 and May 2015 of 23.8 percent.
2 *** attributes this forecasted rise in U.S. prices to *** and “***.” “***.” ***, August 2015; ***, April 2015.
3 In April 2015, during U.S. producer Nucor’s quarterly earnings conference call, it was noted by the firm’s president and CEO that their St. James Parish facility – which produces direct‐reduced iron (“DRI”) – produced 1.3 million tons of DRI during the previous year, and that this was a “meaningful factor supporting February {2015}'s dramatic downward adjustment of more than $100 per ton in scrap pricing.” Nucor Corporation’s Q1 2015 Earnings conference call transcript, available at http://s.t.st/media/xtranscript/2015/Q2/13125011.pdf.

V‐3
Figure V-3 Industrial natural gas and electricity: Monthly prices, January 2012-May 20151
1 Data for June 2015 are not yet available. Source: Short Term Energy Outlook, Energy Information Administration, www.eia.gov, August 11, 2015.
U.S. inland transportation costs
Eight of 10 responding U.S. producers and 20 of 39 importers reported that they typically arrange transportation to their customers.4 U.S. producers reported that their U.S. inland transportation costs ranged from 3 to 8 percent of the total delivered costs, while importers reported U.S. inland transportation costs of 1 to 10 percent.5 6
4 Importer *** reported that it sometimes delivers to its customers and sometimes the customers pick up the steel at the port.
5 One importer, ***, reported inland transportation costs of 17 percent. 6 U.S. producers reported that the majority of their sales were between 101 and 1,000 miles from
their production facility, while importers reported that the majority of their sales of subject product were within 100 miles of their U.S. point of shipment (see also Part II of this report).
0
1
2
3
4
5
6
7
8
0
1
2
3
4
5
6
7
2012 2013 2014 2015
Cents per kilowatt‐hour (electricity)
Dollars per thousand cubit feet (natural gas)
Natural gas Electricity

V‐4
PRICING PRACTICES
Pricing methods
U.S. producers reported primarily using transaction‐by‐transaction negotiations, contracts, or a combination of these methods for determining the prices they charge for sales of cold‐rolled steel (table V‐1). The majority of U.S. producers reported using contracts for their sales to automotive end users and using transaction‐by‐transaction negotiations for their sales to distributors and service centers. *** reported that they also set prices by reference to competing foreign import prices, and *** reported that it has informal volume arrangements that adjust during the year based on CRU or Platt’s indices.
Importers reported primarily using transaction‐by‐transaction negotiations and contracts, or a combination of the two. The majority of importers reported using contracts for their sales to automotive end users and using transaction‐by‐transaction negotiations for their sales to other end users and to distributors and service centers. Table V-1 Cold-rolled steel: U.S. producers’ and importers’ reported price setting methods, by customer type, by number of responding firms1
Price setting method
Customer type
Automotive end users
Other end users
Distributors and service centers
U.S. producers Transaction-by-transaction 5 11 11 Contracts 8 11 9 Set price lists 0 0 0 Other 2 3 3
Total 9 11 11
Importers Transaction-by-transaction 11 26 32 Contracts 13 13 12 Set price lists 1 0 4 Other 0 0 0
Total 21 31 34 1 The sum of responses down may not add up to the total number of responding firms as each firm was instructed to check all applicable price setting methods employed. Source: Compiled from data submitted in response to Commission questionnaires.
U.S. producers reported selling the majority of their product through contracts (80.1 percent), while importers reported selling the majority of their product on the spot market (58.7 percent). For U.S. producers’ sales to automotive end users in 2014, 92.4 percent was sold through either annual or long‐term contracts, while their sales to other end users and steel service centers were mostly through annual contracts (table V‐2). Most of U.S. producers’ spot sales, by quantity, were to steel service centers and distributors.

V‐5
Importers reported selling most of their product to automotive end users through annual or short‐term contracts (75.0 percent), while the majority of their sales to other end users and steel service centers were through the spot market. Table V-2 Cold-rolled steel: U.S. producers’ and importers’ shares of U.S. commercial shipments by type of sale, 2014
Type of sale
Customer type
Automotive end users
Other end users
Steel service centers and distributors
U.S. producers Long-term contracts 33.9 2.8 4.0 Annual contracts 58.5 78.7 59.2 Short-term contracts 3.4 1.4 3.1 Spot sales 4.1 17.1 33.7 Total 100.0 100.0 100.0
Importers Long-term contracts 4.0 0.0 0.0 Annual contracts 43.1 1.6 9.7 Short-term contracts 31.9 42.7 22.8 Spot sales 21.0 55.7 67.4 Total 100.0 100.0 100.0
Note.--Because of rounding, figures may not add to the totals shown. Source: Compiled from data submitted in response to Commission questionnaires.
A majority of responding U.S. producers (8 of 11) and importers (21 of 23) reported using short‐term contracts. Most of those U.S. producers as well as a plurality of importers reported that the average duration of their short‐term contracts was 90 days.7 A majority of U.S. producers and importers reported that price could not be renegotiated during the contract period and that their short‐term contracts did not include meet‐or‐release provisions. Half of U.S. producers and 12 of 21 importers reported that their short‐term contracts fixed both quantity and price.
A majority of responding U.S. producers (9 of 11) also reported using annual contracts. Most (6 of 9) of these U.S. producers reported that price could not be renegotiated during the annual contract period, and more than half reported that their contracts did not include meet‐or‐release provisions. Four of nine U.S. producers also reported that their annual contracts
7 Five of eight U.S. producers reported an average contract duration of 90 days, one reported an average contract duration of 30‐90 days, one reported an average contract duration of 90‐180 days, and one reported an average contract duration of 180 days.
Nine of 23 importers reported an average contract duration of 90 days, four reported an average contract duration of 180 days, two reported an average contract duration of 120 days, and one firm each reported average contract durations of the following numbers of days: 30, 60, and 90‐180.
V‐6
fixed both quantity and price. Most U.S. importers did not offer annual contracts. Of the importers that did, a majority (7 of 8) reported that price could not be renegotiated during the contract period, and all responding importers reported that their annual contracts did not include meet‐or‐release provisions.
Six of 11 U.S. producers reported offering long‐term contracts. Four of these six U.S. producers reported that their typical long‐term contracts were for 2 years, one reported that they were for three years, and one reported that they were for *** days. Half of those firms reported that price could not be renegotiated during the contract period, and a majority (4 of 6) of U.S. producers reported that their long‐term contracts did not include meet‐or‐release provisions. Of the two importers that reported offering long‐term contracts, only one reported the average duration for its long‐term contracts, which was *** days. Both of these importers reported that price could not be renegotiated during the contract period. One of the importers also reported that its long‐term contracts fixed both quantity and price, and one reported that its long‐term contracts did not include meet‐or‐release provisions.
Petitioners and domestic interested party USS‐POSCO reported that contract pricing is closely tied to the spot market through indexing to publications such as CRU or Platt’s. They argue that as contract renegotiations come up for renewal, U.S. producers have been forced to accept much lower prices or to reduce previously agreed‐upon volumes due to low spot prices.8 U.S. producer *** also reported that there are no binding agreements between the firm and its customers to purchase specific volumes, and that prices can adjust monthly or quarterly based on customers’ requests.9
Sales terms and discounts
U.S. producers reported that they typically quote prices on an f.o.b. basis, with typical
sales terms of either net 30 days (7 of 11 firms) or ½ ‐ 10 net 30 days (five firms). Among responding importers, 19 reported quoting prices on a delivered basis and 20 reported quoting prices on an f.o.b. basis. The larger majority of importers reported typical sales terms of net 30 days (34 of 39).
Most responding U.S. producers and importers reported offering no discounts, regardless of customer type (table V‐3). Some U.S. producers reported offering quantity and/or total volume discounts, and others reported that while their firms do not have a set discount policy, they offer volume incentive programs or rebates that are negotiated on a case‐by‐case basis.
8 Conference transcript, pp. 53 (Mull), 61‐62 (Lauschke ), 115‐116 (Blume), 116‐117 (Mull), 117‐118, and 120 (Kopf); USS‐POSCO’s postconference brief, pp. 12‐13; AK Steel’s postconference brief, pp. 31‐32 and exhibit 11; Nucor’s postconference brief, pp. 10‐14.
9 *** U.S. producer questionnaire response, question IV‐3 and attachment 33‐A.
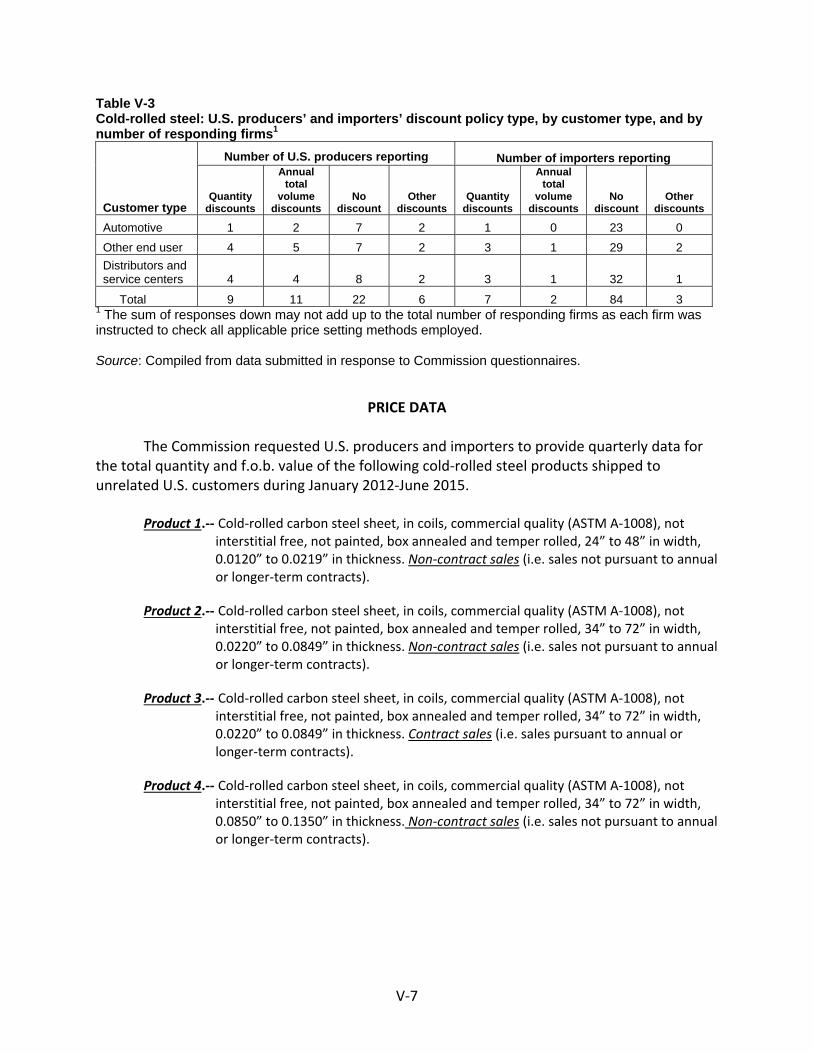
V‐7
Table V-3 Cold-rolled steel: U.S. producers’ and importers’ discount policy type, by customer type, and by number of responding firms1
Customer type
Number of U.S. producers reporting
Number of importers reporting
Quantity discounts
Annual total
volume discounts
No discount
Other discounts
Quantity discounts
Annual total
volume discounts
No discount
Other discounts
Automotive 1 2 7 2 1 0 23 0 Other end user 4 5 7 2 3 1 29 2 Distributors and service centers 4 4 8 2 3 1 32 1
Total 9 11 22 6 7 2 84 3 1 The sum of responses down may not add up to the total number of responding firms as each firm was instructed to check all applicable price setting methods employed. Source: Compiled from data submitted in response to Commission questionnaires.
PRICE DATA
The Commission requested U.S. producers and importers to provide quarterly data for the total quantity and f.o.b. value of the following cold‐rolled steel products shipped to unrelated U.S. customers during January 2012‐June 2015.
Product 1.‐‐ Cold‐rolled carbon steel sheet, in coils, commercial quality (ASTM A‐1008), not
interstitial free, not painted, box annealed and temper rolled, 24” to 48” in width, 0.0120” to 0.0219” in thickness. Non‐contract sales (i.e. sales not pursuant to annual or longer‐term contracts).
Product 2.‐‐ Cold‐rolled carbon steel sheet, in coils, commercial quality (ASTM A‐1008), not interstitial free, not painted, box annealed and temper rolled, 34” to 72” in width, 0.0220” to 0.0849” in thickness. Non‐contract sales (i.e. sales not pursuant to annual or longer‐term contracts).
Product 3.‐‐ Cold‐rolled carbon steel sheet, in coils, commercial quality (ASTM A‐1008), not interstitial free, not painted, box annealed and temper rolled, 34” to 72” in width, 0.0220” to 0.0849” in thickness. Contract sales (i.e. sales pursuant to annual or longer‐term contracts).
Product 4.‐‐ Cold‐rolled carbon steel sheet, in coils, commercial quality (ASTM A‐1008), not interstitial free, not painted, box annealed and temper rolled, 34” to 72” in width, 0.0850” to 0.1350” in thickness. Non‐contract sales (i.e. sales not pursuant to annual or longer‐term contracts).
V‐8
Seven U.S. producers and 26 importers provided usable pricing data for sales of the requested products, although not all firms reported pricing for all products for all quarters.10 11 Pricing data reported by these firms accounted for approximately 16.5 percent of U.S. producers’ U.S. commercial shipments of cold‐rolled steel and the following percentages of U.S. commercial shipments of imports from subject countries in 2014: Brazil‐ 98.4 percent, China‐
10 Per‐unit pricing data are calculated from total quantity and total value data provided by U.S. producers and importers. The precision and variation of these figures may be affected by rounding, limited quantities, and producer or importer estimates.
11 U.S. producer *** provided pricing data for products 1 and 2, but the average unit values (AUV) of its reported data ranged from $*** per ton to $*** per ton. Staff contacted ***, but did not receive revised pricing data; accordingly its pricing data are not included in these pricing tables and analyses.
Several firms provided price data which contained product that was produced by a different annealing process (continuous annealing) than that defined in the pricing definitions (box or “batch” annealing). The continuous annealing process tends to yield cold‐rolled steel that is generally flatter, has more uniform coil properties, is easier to bend, and allows for the potential to produce higher strength steels (due to a fast quenching step), which is not possible with box/batch annealed product. Firms reported that these separate processes often, but do not always, translate to different pricing structures. U.S. producer *** reported that the continuous annealed product that it produces commands comparable prices to box annealed product, while importer *** reported that the continuous annealed product that it produces is not functionally interchangeable with box annealed product (see also part II of this report). The pricing data that *** provided was also consistent with other reported U.S. producer prices. Accordingly, the data provided by *** has been included in this pricing analysis, while the data provided by *** has not.
Staff notes that several firms initially reported pricing data that included products that fall under the ASTM A‐1008 classification but not the “commercial quality” designation identified by ASTM. After staff contacted several firms, U.S. producer *** reported that it produces little to none of the commercial quality product; importer *** reported that their Korean product falls under the *** designation and contains additional value added due to ***; importer *** provided a shipping receipt identifying its Korean product as micro‐alloyed grade high strength steel; importer *** reported that while some of its Korean product was commercial grade, some was “higher grade with {a} higher price”; importer *** reported that its Japanese imports were “high value because {they were} high tensile or high‐strength low‐alloy steel”; and importer *** reported that its Japanese imports were “quite different from Chinese product as the quality attributes {were} much more refined than a typical commodity product.”
For these non‐commercial grade and higher value products, the AUVs reported ranged from roughly $*** per ton to $*** per ton more than the vast majority of reported AUVs. While staff did not receive revised data from importer ***, the firm’s AUVs for its Japanese imports were similarly priced. Based on these *** pricing differences, the data for all non‐commercial quality cold‐rolled steel are not included in these pricing tables and analyses.
Staff also notes that it received revisions from some but not all firms. Accordingly, some of the pricing data may include both commercial and higher quality steel.

V‐9
79.9 percent, India‐ 50.9 percent, Japan‐ 2.7 percent, Korea‐ 25.4 percent, Netherlands‐ 13.8 percent, and Russia‐ 19.1 percent.12
Price data for products 1‐4 are presented in tables V‐4 to V‐7 and figures V‐4 to V‐7. Nonsubject country prices for Canada are presented in Appendix D.
12 The Commission did not receive usable pricing product import data for product 1 from Japan, the Netherlands, or the United Kingdom; for product 2 from the United Kingdom; for product 3 from Brazil, Korea, or the United Kingdom; or for product 4 from Japan, Korea, or the United Kingdom.

V‐10
Table V-4 Cold-rolled steel: Weighted-average f.o.b. prices and quantities of domestic and imported product 11 and margins of underselling/(overselling), by quarters, January 2012-June 2015
Period
United States Brazil China Price
(per short ton)
Quantity (short tons)
Price (per short
ton)
Quantity (short tons)
Margin (percent)
Price (per short
ton) Quantity
(short tons) Margin
(percent) 2012: Jan.-Mar. 826.67 3,618 *** *** *** *** *** *** Apr.-Jun. 823.17 5,094 *** *** *** 824.31 1,786 (0.1) Jul.-Sep. 756.91 4,586 *** *** *** 812.71 1,195 (7.4) Oct.-Dec. 744.95 4,713 *** *** *** *** *** ***2013: Jan.-Mar. 744.22 2,571 *** *** *** 724.79 2,400 2.6 Apr.-Jun. 745.85 3,224 *** *** *** 748.78 963 (0.4) Jul.-Sep. 736.00 2,438 *** *** *** 681.54 335 7.4 Oct.-Dec. 722.34 3,789 *** *** *** 673.90 955 6.72014: Jan.-Mar. 801.98 2,319 *** *** *** 793.98 2,048 1.0 Apr.-Jun. 746.23 2,656 *** *** *** 732.95 1,842 1.8 Jul.-Sep. *** *** *** *** *** 706.36 3,276 *** Oct.-Dec. 781.77 1,896 *** *** *** 706.03 4,901 9.72015: Jan.-Mar. 682.11 2,720 *** *** *** 673.65 4,291 1.2 Apr.-Jun. 602.55 1,680 *** *** *** 666.73 938 (10.7)
Period
India Japan
Price (per short ton)
Quantity (short tons)
Margin (percent)
Price (per short ton)
Quantity (short tons)
Margin (percent)
2012: Jan.-Mar. -- -- -- -- -- -- Apr.-Jun. -- -- -- -- -- -- Jul.-Sep. -- -- -- -- -- -- Oct.-Dec. -- -- -- -- -- --2013: Jan.-Mar. -- -- -- -- -- -- Apr.-Jun. -- -- -- -- -- -- Jul.-Sep. -- -- -- -- -- -- Oct.-Dec. *** *** *** -- -- --2014: Jan.-Mar. *** *** *** -- -- -- Apr.-Jun. *** *** *** -- -- -- Jul.-Sep. *** *** *** -- -- -- Oct.-Dec. *** *** *** -- -- --2015: Jan.-Mar. *** *** *** -- -- -- Apr.-Jun. *** *** *** -- -- --1 Product 1: Cold-rolled carbon steel sheet, in coils, commercial quality (ASTM A-1008), not interstitial free, not painted, box annealed and temper rolled, 24” to 48” in width, 0.0120” to 0.0219” in thickness. Non-contract sales (i.e. sales not pursuant to annual or longer-term contracts). Table continued on next page.

V‐11
Table V-4 Continued Cold-rolled steel: Weighted-average f.o.b. prices and quantities of domestic and imported product 11 and margins of underselling/(overselling), by quarters, January 2012-June 2015
Period
United States Korea Netherlands Price
(per short ton)
Quantity (short tons)
Price (per short
ton)
Quantity (short tons)
Margin (percent)
Price (per short
ton) Quantity
(short tons) Margin
(percent) 2012: Jan.-Mar. 826.67 3,618 *** *** *** -- -- -- Apr.-Jun. 823.17 5,094 *** *** *** -- -- -- Jul.-Sep. 756.91 4,586 *** *** *** -- -- -- Oct.-Dec. 744.95 4,713 -- -- -- -- -- --2013: Jan.-Mar. 744.22 2,571 *** *** *** -- -- -- Apr.-Jun. 745.85 3,224 *** *** *** -- -- -- Jul.-Sep. 736.00 2,438 -- -- -- -- -- -- Oct.-Dec. 722.34 3,789 -- -- -- -- -- --2014: Jan.-Mar. 801.98 2,319 *** *** *** -- -- -- Apr.-Jun. 746.23 2,656 *** *** *** -- -- -- Jul.-Sep. *** *** *** *** *** -- -- -- Oct.-Dec. 781.77 1,896 *** *** *** -- -- --2015: Jan.-Mar. 682.11 2,720 *** *** *** -- -- -- Apr.-Jun. 602.55 1,680 *** *** *** -- -- --
Period
Russia United Kingdom
Price (per short ton)
Quantity (short tons)
Margin (percent)
Price (per short ton)
Quantity (short tons)
Margin (percent)
2012: Jan.-Mar. -- -- -- -- -- -- Apr.-Jun. -- -- -- -- -- -- Jul.-Sep. -- -- -- -- -- -- Oct.-Dec. -- -- -- -- -- --2013: Jan.-Mar. -- -- -- -- -- -- Apr.-Jun. -- -- -- -- -- -- Jul.-Sep. -- -- -- -- -- -- Oct.-Dec. -- -- -- -- -- --2014: Jan.-Mar. -- -- -- -- -- -- Apr.-Jun. -- -- -- -- -- -- Jul.-Sep. -- -- -- -- -- -- Oct.-Dec. -- -- -- -- -- --2015: Jan.-Mar. -- -- -- -- -- -- Apr.-Jun. *** *** *** -- -- --1 Product 1: Cold-rolled carbon steel sheet, in coils, commercial quality (ASTM A-1008), not interstitial free, not painted, box annealed and temper rolled, 24” to 48” in width, 0.0120” to 0.0219” in thickness. Non-contract sales (i.e. sales not pursuant to annual or longer-term contracts). Source: Compiled from data submitted in response to Commission questionnaires.

V‐12
Table V-5 Cold-rolled steel: Weighted-average f.o.b. prices and quantities of domestic and imported product 21 and margins of underselling/(overselling), by quarters, January 2012-June 2015
Period
United States Brazil China Price
(per short ton)
Quantity (short tons)
Price (per short
ton)
Quantity (short tons)
Margin (percent)
Price (per short
ton) Quantity
(short tons) Margin
(percent) 2012: Jan.-Mar. 773.21 195,505 *** *** *** 725.70 20,404 6.1 Apr.-Jun. 772.77 173,210 *** *** *** 725.12 40,187 6.2 Jul.-Sep. 719.08 174,999 *** *** *** 722.04 31,814 (0.4) Oct.-Dec. 700.84 162,616 *** *** *** 668.12 29,829 4.72013: Jan.-Mar. 708.71 142,112 *** *** *** 654.90 57,805 7.6 Apr.-Jun. 696.68 135,656 700.15 9,435 (0.5) 676.93 32,261 2.8 Jul.-Sep. 691.17 149,596 *** *** *** 672.18 31,127 2.7 Oct.-Dec. 715.33 152,703 *** *** *** 655.02 50,734 8.42014: Jan.-Mar. 749.75 158,034 *** *** *** 678.56 58,723 9.5 Apr.-Jun. 757.94 156,029 *** *** *** 684.49 110,632 9.7 Jul.-Sep. 767.37 128,860 *** *** *** 665.41 128,600 13.3 Oct.-Dec. 757.80 118,650 *** *** *** 671.44 134,581 11.42015: Jan.-Mar. 697.38 89,518 *** *** *** 649.90 82,452 6.8 Apr.-Jun. 603.29 104,825 *** *** *** 634.57 85,278 (5.2)
Period
India Japan
Price (per short ton)
Quantity (short tons)
Margin (percent)
Price (per short ton)
Quantity (short tons)
Margin (percent)
2012: Jan.-Mar. -- -- -- -- -- -- Apr.-Jun. *** *** *** -- -- -- Jul.-Sep. -- -- -- -- -- -- Oct.-Dec. -- -- -- -- -- --2013: Jan.-Mar. -- -- -- -- -- -- Apr.-Jun. -- -- -- *** *** *** Jul.-Sep. -- -- -- *** *** *** Oct.-Dec. 705.07 602 1.4 -- -- --2014: Jan.-Mar. 681.45 7,919 9.1 *** *** *** Apr.-Jun. 690.67 5,958 8.9 -- -- -- Jul.-Sep. 703.25 6,233 8.4 *** *** *** Oct.-Dec. *** *** *** -- -- --2015: Jan.-Mar. 693.76 7,397 0.5 -- -- -- Apr.-Jun. *** *** *** *** *** ***1 Product 2: Cold-rolled carbon steel sheet, in coils, commercial quality (ASTM A-1008), not interstitial free, not painted, box annealed and temper rolled, 34” to 72” in width, 0.0220” to 0.0849” in thickness. Non-contract sales (i.e. sales not pursuant to annual or longer-term contracts). Table continued on next page.

V‐13
Table V-5 Continued Cold-rolled steel: Weighted-average f.o.b. prices and quantities of domestic and imported product 21 and margins of underselling/(overselling), by quarters, January 2012-June 2015
Period
United States Korea Netherlands Price
(per short ton)
Quantity (short tons)
Price (per short
ton)
Quantity (short tons)
Margin (percent)
Price (per short
ton) Quantity
(short tons) Margin
(percent) 2012: Jan.-Mar. 773.21 195,505 *** *** *** *** *** *** Apr.-Jun. 772.77 173,210 *** *** *** *** *** *** Jul.-Sep. 719.08 174,999 -- -- -- -- -- -- Oct.-Dec. 700.84 162,616 -- -- -- -- -- --2013: Jan.-Mar. 708.71 142,112 -- -- -- *** *** *** Apr.-Jun. 696.68 135,656 -- -- -- *** *** *** Jul.-Sep. 691.17 149,596 -- -- -- -- -- -- Oct.-Dec. 715.33 152,703 -- -- -- -- -- --2014: Jan.-Mar. 749.75 158,034 *** *** *** *** *** *** Apr.-Jun. 757.94 156,029 *** *** *** *** *** *** Jul.-Sep. 767.37 128,860 *** *** *** *** *** *** Oct.-Dec. 757.80 118,650 *** *** *** *** *** ***2015: Jan.-Mar. 697.38 89,518 *** *** *** *** *** *** Apr.-Jun. 603.29 104,825 *** *** *** -- -- --
Period
Russia United Kingdom
Price (per short ton)
Quantity (short tons)
Margin (percent)
Price (per short ton)
Quantity (short tons)
Margin (percent)
2012: Jan.-Mar. -- -- -- -- -- -- Apr.-Jun. -- -- -- -- -- -- Jul.-Sep. -- -- -- -- -- -- Oct.-Dec. -- -- -- -- -- --2013: Jan.-Mar. -- -- -- -- -- -- Apr.-Jun. -- -- -- -- -- -- Jul.-Sep. -- -- -- -- -- -- Oct.-Dec. *** *** *** -- -- --2014: Jan.-Mar. *** *** *** -- -- -- Apr.-Jun. *** *** *** -- -- -- Jul.-Sep. 719.93 3,646 6.2 -- -- -- Oct.-Dec. *** *** *** -- -- --2015: Jan.-Mar. *** *** *** -- -- -- Apr.-Jun. 607.87 2,523 (0.8) -- -- --1 Product 2: Cold-rolled carbon steel sheet, in coils, commercial quality (ASTM A-1008), not interstitial free, not painted, box annealed and temper rolled, 34” to 72” in width, 0.0220” to 0.0849” in thickness. Non-contract sales (i.e. sales not pursuant to annual or longer-term contracts). Source: Compiled from data submitted in response to Commission questionnaires.

V‐14
Table V-6 Cold-rolled steel: Weighted-average f.o.b. prices and quantities of domestic and imported product 31 and margins of underselling/(overselling), by quarters, January 2012-June 2015
Period
United States Brazil China Price
(per short ton)
Quantity (short tons)
Price (per short
ton)
Quantity (short tons)
Margin (percent)
Price (per short
ton) Quantity
(short tons) Margin
(percent) 2012: Jan.-Mar. 768.54 270,778 -- -- -- *** *** *** Apr.-Jun. 792.15 218,661 -- -- -- *** *** *** Jul.-Sep. 749.71 198,092 -- -- -- *** *** *** Oct.-Dec. 752.06 173,112 -- -- -- *** *** ***2013: Jan.-Mar. 710.08 293,219 -- -- -- *** *** *** Apr.-Jun. 707.80 217,891 -- -- -- *** *** *** Jul.-Sep. 705.66 266,447 -- -- -- *** *** *** Oct.-Dec. 723.69 258,448 -- -- -- *** *** ***2014: Jan.-Mar. 755.06 307,665 -- -- -- *** *** *** Apr.-Jun. 761.25 243,309 -- -- -- *** *** *** Jul.-Sep. 776.00 257,110 -- -- -- *** *** *** Oct.-Dec. 768.88 224,747 -- -- -- *** *** ***2015: Jan.-Mar. 722.37 222,853 -- -- -- *** *** *** Apr.-Jun. 657.71 228,643 -- -- -- *** *** ***
Period
India Japan
Price (per short ton)
Quantity (short tons)
Margin (percent)
Price (per short ton)
Quantity (short tons)
Margin (percent)
2012: Jan.-Mar. -- -- -- -- -- -- Apr.-Jun. -- -- -- -- -- -- Jul.-Sep. -- -- -- -- -- -- Oct.-Dec. -- -- -- -- -- --2013: Jan.-Mar. -- -- -- -- -- -- Apr.-Jun. -- -- -- -- -- -- Jul.-Sep. -- -- -- -- -- -- Oct.-Dec. -- -- -- -- -- --2014: Jan.-Mar. *** *** *** -- -- -- Apr.-Jun. *** *** *** -- -- -- Jul.-Sep. *** *** *** -- -- -- Oct.-Dec. *** *** *** -- -- --2015: Jan.-Mar. *** *** *** -- -- -- Apr.-Jun. *** *** *** *** *** ***1 Product 3: Cold-rolled carbon steel sheet, in coils, commercial quality (ASTM A-1008), not interstitial free, not painted, box annealed and temper rolled, 34” to 72” in width, 0.0220” to 0.0849” in thickness. Contract sales (i.e. sales pursuant to annual or longer-term contracts). Table continued on next page.

V‐15
Table V-6 Continued Cold-rolled steel: Weighted-average f.o.b. prices and quantities of domestic and imported product 31 and margins of underselling/(overselling), by quarters, January 2012-June 2015
Period
United States Korea Netherlands Price
(per short ton)
Quantity (short tons)
Price (per short
ton)
Quantity (short tons)
Margin (percent)
Price (per short
ton) Quantity
(short tons) Margin
(percent) 2012: Jan.-Mar. 768.54 270,778 -- -- -- *** *** *** Apr.-Jun. 792.15 218,661 -- -- -- *** *** *** Jul.-Sep. 749.71 198,092 -- -- -- *** *** *** Oct.-Dec. 752.06 173,112 -- -- -- *** *** ***2013: Jan.-Mar. 710.08 293,219 -- -- -- *** *** *** Apr.-Jun. 707.80 217,891 -- -- -- *** *** *** Jul.-Sep. 705.66 266,447 -- -- -- *** *** *** Oct.-Dec. 723.69 258,448 -- -- -- *** *** ***2014: Jan.-Mar. 755.06 307,665 -- -- -- *** *** *** Apr.-Jun. 761.25 243,309 -- -- -- *** *** *** Jul.-Sep. 776.00 257,110 -- -- -- *** *** *** Oct.-Dec. 768.88 224,747 -- -- -- *** *** ***2015: Jan.-Mar. 722.37 222,853 -- -- -- *** *** *** Apr.-Jun. 657.71 228,643 -- -- -- *** *** ***
Period
Russia United Kingdom
Price (per short ton)
Quantity (short tons)
Margin (percent)
Price (per short ton)
Quantity (short tons)
Margin (percent)
2012: Jan.-Mar. -- -- -- -- -- -- Apr.-Jun. -- -- -- -- -- -- Jul.-Sep. -- -- -- -- -- -- Oct.-Dec. -- -- -- -- -- --2013: Jan.-Mar. -- -- -- -- -- -- Apr.-Jun. -- -- -- -- -- -- Jul.-Sep. -- -- -- -- -- -- Oct.-Dec. -- -- -- -- -- --2014: Jan.-Mar. -- -- -- -- -- -- Apr.-Jun. *** *** *** -- -- -- Jul.-Sep. *** *** *** -- -- -- Oct.-Dec. -- -- -- -- -- --2015: Jan.-Mar. -- -- -- -- -- -- Apr.-Jun. *** *** *** -- -- --1 Product 3: Cold-rolled carbon steel sheet, in coils, commercial quality (ASTM A-1008), not interstitial free, not painted, box annealed and temper rolled, 34” to 72” in width, 0.0220” to 0.0849” in thickness. Contract sales (i.e. sales pursuant to annual or longer-term contracts). Source: Compiled from data submitted in response to Commission questionnaires.

V‐16
Table V-7 Cold-rolled steel: Weighted-average f.o.b. prices and quantities of domestic and imported product 41 and margins of underselling/(overselling), by quarters, January 2012-June 2015
Period
United States Brazil China Price
(per short ton)
Quantity (short tons)
Price (per short
ton)
Quantity (short tons)
Margin (percent)
Price (per short
ton) Quantity
(short tons) Margin
(percent) 2012: Jan.-Mar. 793.90 23,551 *** *** *** 799.05 1,940 (0.6) Apr.-Jun. 798.33 17,419 *** *** *** 801.79 3,476 (0.4) Jul.-Sep. 739.38 17,906 *** *** *** 775.56 1,731 (4.9) Oct.-Dec. 715.22 18,386 *** *** *** 788.52 1,696 (10.2)2013: Jan.-Mar. 720.04 16,708 *** *** *** 695.21 1,867 3.4 Apr.-Jun. 709.14 13,149 *** *** *** 697.31 1,427 1.7 Jul.-Sep. 709.83 14,041 *** *** *** 683.94 910 3.6 Oct.-Dec. 719.44 18,924 *** *** *** 671.72 2,207 6.62014: Jan.-Mar. 759.05 17,378 *** *** *** 672.86 2,931 11.4 Apr.-Jun. 768.30 18,119 *** *** *** 699.90 5,186 8.9 Jul.-Sep. 771.75 18,542 *** *** *** 661.92 4,992 14.2 Oct.-Dec. 772.68 13,987 *** *** *** 688.48 4,151 10.92015: Jan.-Mar. 716.71 10,487 *** *** *** *** *** *** Apr.-Jun. 614.50 15,253 *** *** *** 652.02 1,958 (6.1)
Period
India Japan
Price (per short ton)
Quantity (short tons)
Margin (percent)
Price (per short ton)
Quantity (short tons)
Margin (percent)
2012: Jan.-Mar. -- -- -- -- -- -- Apr.-Jun. -- -- -- -- -- -- Jul.-Sep. -- -- -- -- -- -- Oct.-Dec. -- -- -- -- -- --2013: Jan.-Mar. -- -- -- -- -- -- Apr.-Jun. -- -- -- -- -- -- Jul.-Sep. -- -- -- -- -- -- Oct.-Dec. *** *** *** -- -- --2014: Jan.-Mar. *** *** *** -- -- -- Apr.-Jun. *** *** *** -- -- -- Jul.-Sep. *** *** *** -- -- -- Oct.-Dec. *** *** *** -- -- --2015: Jan.-Mar. *** *** *** -- -- -- Apr.-Jun. *** *** *** -- -- --1 Product 4: Cold-rolled carbon steel sheet, in coils, commercial quality (ASTM A-1008), not interstitial free, not painted, box annealed and temper rolled, 34” to 72” in width, 0.0850” to 0.1350” in thickness. Non-contract sales (i.e. sales not pursuant to annual or longer-term contracts). Table continued on next page.

V‐17
Table V-7 Continued Cold-rolled steel: Weighted-average f.o.b. prices and quantities of domestic and imported product 41 and margins of underselling/(overselling), by quarters, January 2012-June 2015
Period
United States Korea Netherlands Price
(per short ton)
Quantity (short tons)
Price (per short
ton)
Quantity (short tons)
Margin (percent)
Price (per short
ton) Quantity
(short tons) Margin
(percent) 2012: Jan.-Mar. 793.90 23,551 -- -- -- -- -- -- Apr.-Jun. 798.33 17,419 -- -- -- -- -- -- Jul.-Sep. 739.38 17,906 -- -- -- -- -- -- Oct.-Dec. 715.22 18,386 -- -- -- -- -- --2013: Jan.-Mar. 720.04 16,708 -- -- -- -- -- -- Apr.-Jun. 709.14 13,149 -- -- -- -- -- -- Jul.-Sep. 709.83 14,041 -- -- -- -- -- -- Oct.-Dec. 719.44 18,924 -- -- -- *** *** ***2014: Jan.-Mar. 759.05 17,378 -- -- -- -- -- -- Apr.-Jun. 768.30 18,119 -- -- -- *** *** *** Jul.-Sep. 771.75 18,542 -- -- -- -- -- -- Oct.-Dec. 772.68 13,987 -- -- -- *** *** ***2015: Jan.-Mar. 716.71 10,487 -- -- -- *** *** *** Apr.-Jun. 614.50 15,253 -- -- -- *** *** ***
Period
Russia United Kingdom
Price (per short ton)
Quantity (short tons)
Margin (percent)
Price (per short ton)
Quantity (short tons)
Margin (percent)
2012: Jan.-Mar. -- -- -- -- -- -- Apr.-Jun. -- -- -- -- -- -- Jul.-Sep. -- -- -- -- -- -- Oct.-Dec. -- -- -- -- -- --2013: Jan.-Mar. -- -- -- -- -- -- Apr.-Jun. -- -- -- -- -- -- Jul.-Sep. -- -- -- -- -- -- Oct.-Dec. *** *** *** -- -- --2014: Jan.-Mar. *** *** *** -- -- -- Apr.-Jun. *** *** *** -- -- -- Jul.-Sep. *** *** *** -- -- -- Oct.-Dec. -- -- -- -- -- --2015: Jan.-Mar. -- -- -- -- -- -- Apr.-Jun. *** *** *** -- -- --1 Product 4: Cold-rolled carbon steel sheet, in coils, commercial quality (ASTM A-1008), not interstitial free, not painted, box annealed and temper rolled, 34” to 72” in width, 0.0850” to 0.1350” in thickness. Non-contract sales (i.e. sales not pursuant to annual or longer-term contracts). Source: Compiled from data submitted in response to Commission questionnaires.

V‐18
Figure V-4 Cold-rolled steel: Weighted-average prices and quantities of domestic and imported product 1, by quarter, January 2012-June 2015
* * * * * * * Figure V-5 Cold-rolled steel: Weighted-average prices and quantities of domestic and imported product 2, by quarter, January 2012-June 2015
* * * * * * * Figure V-6 Cold-rolled steel: Weighted-average prices and quantities of domestic and imported product 3, by quarter, January 2012-June 2015
* * * * * * * Figure V-7 Cold-rolled steel: Weighted-average prices and quantities of domestic and imported product 4, by quarter, January 2012-June 2015
* * * * * * *
Price trends
Overall, prices decreased during January 2012‐June 2015. Table V‐8 summarizes the price trends, by country and by product. Domestic price decreases ranged from 14.4 percent to 27.1 percent during January 2012‐June 2015.13 Import price decreases ranged from 5.4 percent to 30.4 percent.14
According to respondents, the decrease in cold‐rolled steel prices is due to the decline in raw material costs,15 as well as the strengthening of the U.S. dollar since January 2012.16 Korean
13 The smallest decline in domestic prices was for product 3 – the only price item requesting contract sales data.
14 The Commission did not receive import pricing data for the first and last quarters of the period of investigation (January‐March 2012 and April‐June 2015) for all products and all subject countries. In the cases where the Commission received data for interim periods only, these date ranges and pricing trends are detailed in the footnotes to table V‐8.
15 Conference transcript, pp. 32 (Cameron), 168 and 171 (Maleshevich), 174‐175 (Dougan), 186‐187 (Weiner), and 190‐191 (Hori) ; CSN’s postconference brief, p. 14; Tata UK’s postconference brief, exhibit
(continued...)

V‐19
producers also contend that the domestic price declines for cold‐rolled steel were not the result of any subject imports, but due rather to competition within the domestic industry.17
Petitioners argue that the decline in raw material costs was not the primary driver of the drop in domestic prices for cold‐rolled steel, but that the price decline was the result of the increased level of imported subject product and the global oversupply – primarily from Chinese producers – of cold‐rolled steel.18 Petitioners also argue that the recent devaluation of the Chinese RMB and subsequent price cuts by Chinese producers of cold‐rolled steel have put pressure on other exporters to reduce their prices in order to compete and threaten to have a negative impact on domestic prices.19 Table V-8 Cold-rolled steel: Summary of weighted-average f.o.b. prices for products 1-4 from the United States and subject countries
Item Number of quarters
Low price(per short ton)
High price (per short ton)
Change in price1
(percent) Product 1 (non-contract)2
United States 14 602.55 826.67 (27.1)Brazil 14 *** *** ***China 14 666.73 *** ***India 7 *** *** ---Japan --- --- --- ---Korea 11 *** *** ***Netherlands --- --- --- ---Russia 1 *** *** ---
1 Percentage change from the first quarter of 2012 to the second quarter of 2015. 2 For product 1, prices for imports from India ***. Table continued on next page.
(…continued) 1 pp. 6‐7, and attachment 1 pp. 4‐6; Korean producers postconference brief, pp. 18, 21, 35, and exhibit 6.
16 Conference transcript, pp. 171 (Maleshevich), 186‐187 (Weiner), and 190‐191 (Hori); Japanese mills’ postconference brief, p. 14).
17 Korean producers’ postconference brief, p. 20. 18 Conference transcript, pp. 28‐29 (Rosenthal), 132 (Mull), 133 (Price), and 153‐154 (Kopf); Nucor’s
postconference brief, pp. 9 and 32. AK Steel’s postconference brief, pp. 30‐31; U.S. Steel’s postconference brief, pp. 31‐32 and exhibit 26; ArcelorMittal’s postconference brief, pp. 41‐43 and exhibit 24. These and other firms also argue that the price of cold‐rolled steel declined more rapidly and fell further than raw material price cost declines. Conference transcript, pp. 129‐130 (Schagrin), 131 and 153 (Blume); USS‐POSCO’s postconference brief, p. 10; Nucor’s postconference brief, pp. 15‐16 and 32‐36; ArcelorMittal’s postconference brief, pp. 9 and 14.
19 Conference transcript, pp. 43, 122‐124 (Price), and 124‐125 (Cannon); Nucor’s postconference brief, exhibit 1 pp. 31‐32, and exhibits 2K‐2U; ArcelorMittal’s postconference brief, p. 38 and exhibit 1.
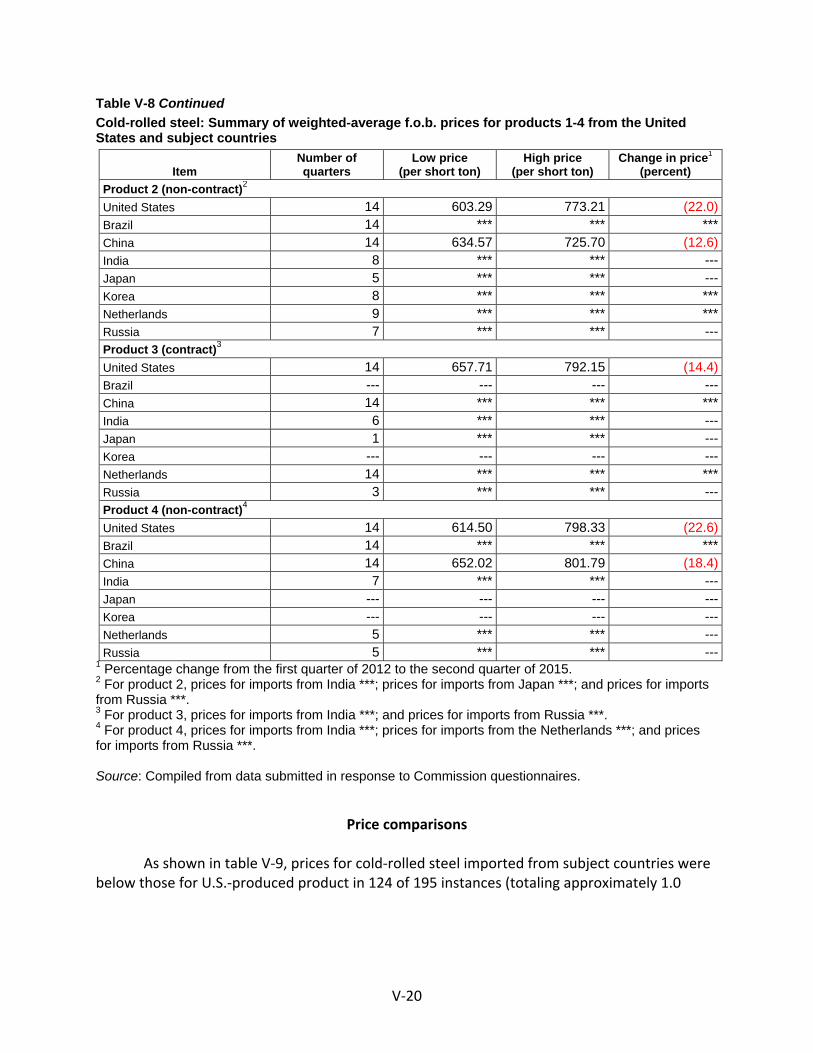
V‐20
Table V-8 Continued
Cold-rolled steel: Summary of weighted-average f.o.b. prices for products 1-4 from the United States and subject countries
Item Number of quarters
Low price(per short ton)
High price (per short ton)
Change in price1
(percent) Product 2 (non-contract)2
United States 14 603.29 773.21 (22.0)Brazil 14 *** *** ***China 14 634.57 725.70 (12.6)India 8 *** *** ---Japan 5 *** *** ---Korea 8 *** *** ***Netherlands 9 *** *** ***Russia 7 *** *** ---Product 3 (contract)3
United States 14 657.71 792.15 (14.4)Brazil --- --- --- ---China 14 *** *** ***India 6 *** *** ---Japan 1 *** *** ---Korea --- --- --- ---Netherlands 14 *** *** ***Russia 3 *** *** ---Product 4 (non-contract)4
United States 14 614.50 798.33 (22.6)Brazil 14 *** *** ***China 14 652.02 801.79 (18.4)India 7 *** *** ---Japan --- --- --- ---Korea --- --- --- ---Netherlands 5 *** *** ---Russia 5 *** *** ---
1 Percentage change from the first quarter of 2012 to the second quarter of 2015. 2 For product 2, prices for imports from India ***; prices for imports from Japan ***; and prices for imports from Russia ***. 3 For product 3, prices for imports from India ***; and prices for imports from Russia ***. 4 For product 4, prices for imports from India ***; prices for imports from the Netherlands ***; and prices for imports from Russia ***. Source: Compiled from data submitted in response to Commission questionnaires.
Price comparisons
As shown in table V‐9, prices for cold‐rolled steel imported from subject countries were below those for U.S.‐produced product in 124 of 195 instances (totaling approximately 1.0

V‐21
million short tons); margins of underselling ranged from 0.1 to 18.9 percent. In the remaining 71 instances (totaling approximately 0.3 million short tons), prices for cold‐rolled steel from subject countries were between 0.03 and 48.1 percent above prices for the domestic product.20
The greatest number of instances of underselling occurred during 2014. By year, prices for subject country product was below U.S.‐produced product in 13 instances during 2012, 31 instances during 2013, 66 instances during 2014, and 14 instances during the first two quarters of 2015.21 Table V-9 Cold-rolled steel: Instances of underselling/overselling and the range and average of margins, by country, January 2012-June 20151
Source
Underselling
Number of quarters
Quantity2 (units)
Average margin
(percent)
Margin range (percent)
Min Max Brazil 22 *** *** *** *** China 34 *** *** *** *** India 19 *** *** *** *** Japan 4 *** *** *** *** Korea 7 *** *** *** *** Netherlands 24 *** *** *** *** Russia 14 *** *** *** *** Total 124 1,032,589 6.2 0.1 18.9
Source
(Overselling)
Number of quarters
Quantity2 (units)
Average margin
(percent)
Margin range (percent)
Min Max Brazil 20 *** *** *** ***China 22 *** *** *** ***India 9 *** *** *** ***Japan 2 *** *** *** ***Korea 12 *** *** *** ***Netherlands 4 *** *** *** ***Russia 2 *** *** *** *** Total 71 282,847 (7.2) (0.03) (48.1)
1 As noted above, staff received revisions from some but not all firms. Accordingly, some of these pricing data may include both commercial and higher quality steel. 2 These data include only quarters in which there is a comparison between the U.S. and subject product. Source: Compiled from data submitted in response to Commission questionnaires.
20 Excluding the Netherlands, prices for cold‐rolled steel imported from subject countries were below those for U.S.‐produced product in 100 of 167 instances; the ranges of both underselling and overselling margins remain unchanged.
21 Excluding the Netherlands, prices for subject country product was below U.S.‐produced product in 8 instances during 2012, 24 instances during 2013, 57 instances during 2014, and 11 instances during the first two quarters of 2015.
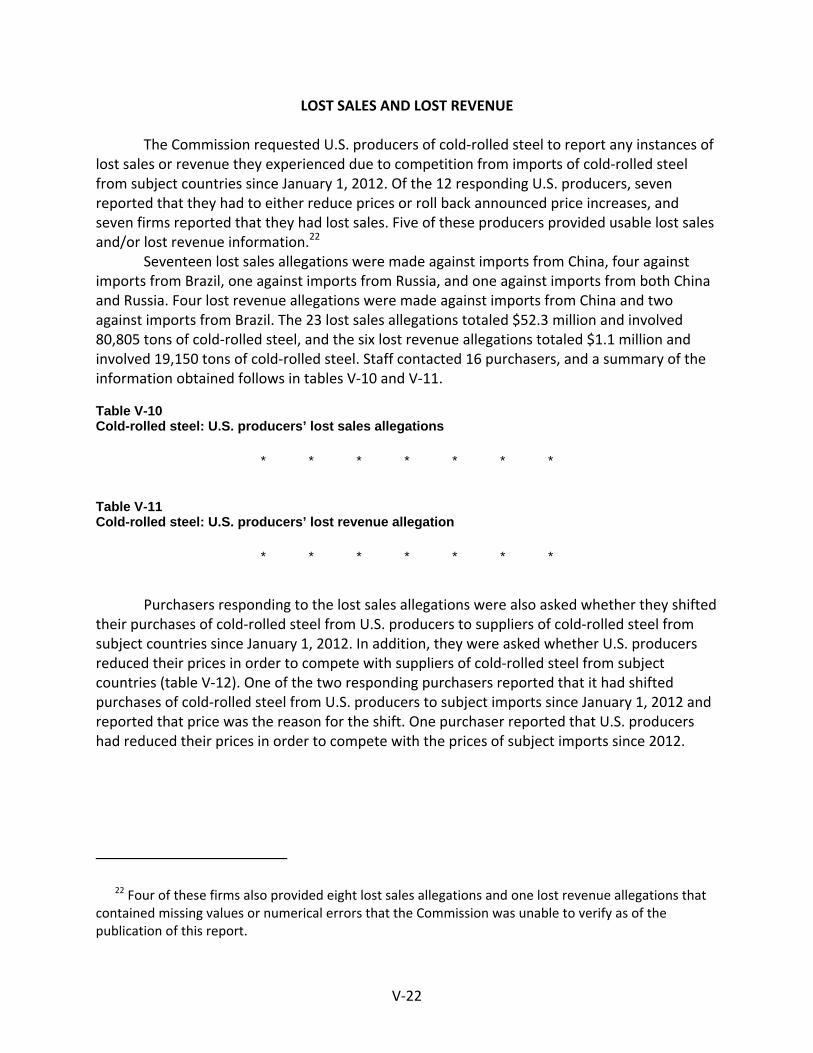
V‐22
LOST SALES AND LOST REVENUE
The Commission requested U.S. producers of cold‐rolled steel to report any instances of lost sales or revenue they experienced due to competition from imports of cold‐rolled steel from subject countries since January 1, 2012. Of the 12 responding U.S. producers, seven reported that they had to either reduce prices or roll back announced price increases, and seven firms reported that they had lost sales. Five of these producers provided usable lost sales and/or lost revenue information.22
Seventeen lost sales allegations were made against imports from China, four against imports from Brazil, one against imports from Russia, and one against imports from both China and Russia. Four lost revenue allegations were made against imports from China and two against imports from Brazil. The 23 lost sales allegations totaled $52.3 million and involved 80,805 tons of cold‐rolled steel, and the six lost revenue allegations totaled $1.1 million and involved 19,150 tons of cold‐rolled steel. Staff contacted 16 purchasers, and a summary of the information obtained follows in tables V‐10 and V‐11. Table V-10 Cold-rolled steel: U.S. producers’ lost sales allegations
* * * * * * * Table V-11 Cold-rolled steel: U.S. producers’ lost revenue allegation
* * * * * * *
Purchasers responding to the lost sales allegations were also asked whether they shifted their purchases of cold‐rolled steel from U.S. producers to suppliers of cold‐rolled steel from subject countries since January 1, 2012. In addition, they were asked whether U.S. producers reduced their prices in order to compete with suppliers of cold‐rolled steel from subject countries (table V‐12). One of the two responding purchasers reported that it had shifted purchases of cold‐rolled steel from U.S. producers to subject imports since January 1, 2012 and reported that price was the reason for the shift. One purchaser reported that U.S. producers had reduced their prices in order to compete with the prices of subject imports since 2012.
22 Four of these firms also provided eight lost sales allegations and one lost revenue allegations that contained missing values or numerical errors that the Commission was unable to verify as of the publication of this report.

V‐23
Table V-12 Product: Purchasers’ responses regarding shifting supply and price reductions
* * * * * * *
*** “***.” “***.”
*** “***.” “***.”


VI‐1
PART VI: FINANCIAL EXPERIENCE OF U.S. PRODUCERS
BACKGROUND
Twelve firms reported usable financial data on cold‐rolled steel, which are presented in this section of the report.1 As discussed earlier in Part III, these firms either internally consumed or transferred to related parties a substantial portion of their cold‐rolled steel to produce further manufactured products, such as types of corrosion‐resistant steel or tin‐ and chromium‐coated steel sheet. A majority of overall operations is composed of U.S. producers that manufacture and further process their own steel, while a smaller share reflects operations in which the underlying steel was purchased from related and/or unrelated sources.2 On a value basis in 2014, internal consumption accounted for approximately *** percent of total sales, commercial sales of cold‐rolled steel products accounted for approximately 41 percent of total sales in 2014, and the small amount of transfers to related firms, which are generally coating lines, accounted for less than *** percent (based on table VI‐1).
Three firms, *** accounted for approximately two‐thirds of the quantity and value, of total sales of cold‐rolled steel (based on table VI‐1) in 2014. Four U.S. producers purchased the plant and equipment of other firms in 2014 and 2015: ArcelorMittal USA purchased the assets of the Calvert, Alabama mill from ThyssenKrupp, forming a joint venture with Nippon Steel and Sumitomo; AK Steel purchased the Dearborn, Michigan mill from Severstal; SDI purchased the Columbus, Mississippi mill from Severstal. These acquisitions occurred in 2014 and ThyssenKrupp and Severstal exited the U.S. steel industry. Finally, Worthington acquired an independent processor of cold‐rolled steel, Rome Strip Steel, in Rome, New York, in January 2015. These investments are discussed later.
OPERATIONS ON COLD‐ROLLED STEEL
Tables VI‐1, VI‐2, and VI‐3 present aggregated data on U.S. producers’ operations in relation to cold‐rolled steel. Each of the three tables provides information on sales and costs of the reporting firm’s commercial sales, and the data for quantity and value of commercial sales are the same in each table. Besides the data for commercial sales, tables VI‐1 and VI‐2 provide data for internal consumption and transfers to related firms but differ in how U.S. producers were asked to estimate the value of those two categories of sales. Table VI‐1 presents data with internal consumption and transfers to related parties valued based upon constructed fair
1 With the exception of Steelscape, which reported on the basis of International Financial Reporting Standards (“IFRS”), U.S. producers reported their financial results on the basis of accounting principles generally accepted in the United States (“GAAP”). The majority of annual financial results were also reported on a calendar‐year (“CY”) basis. ***.
2 Purchased/transferred‐in steel reflects primarily hot‐rolled steel.

VI‐2
market value.3 Table VI‐2 presents data for cold‐rolled steel with internal consumption and transfers to related parties valued based upon a share of the gross profit of the downstream product (cost plus share of downstream profit).4 While the data for quantity of sales and the costs are the same in tables VI‐1 and VI‐2, the value of internal consumption and transfers differs. Finally, table VI‐3 presents data on only commercial sales (including exports) and costs (so‐called “merchant market” or “open market”) aggregated for the industry.
3 The Commission’s questionnaire asked U.S. producers to report the value of internal consumption and transfers to related firms at the same per‐unit values as the firm’s commercial sales. Firms were instructed to adjust the per‐unit‐values if their internal consumption and transfers differed from their commercial sales because of factors like product mix, or physical, or quality differences. This adjustment for differences in value was labeled “operations on cold‐rolled steel with internal consumption and transfers to related parties valued based upon differences in cost (constructed fair market value).” See section III‐9 of the U.S. producers’ questionnaire.
4 The Commission’s questionnaire asked U.S. producers to report the value of internal consumption and transfers to related firms based upon a calculation using the gross profit margin of the downstream product (e.g., coated steel), adjusted for the percentage of relative costs of producing cold‐rolled steel and the downstream product. This adjustment for differences in value was labeled “operations on cold‐rolled steel with internal consumption and transfers to related parties based upon the gross profit of the downstream product (cost plus share of downstream profit).” See section III‐10 of the U.S. producers’ questionnaire.

VI‐3
Table VI-1 Cold-rolled steel: Results of operations of U.S. producers with internal consumption and transfers valued at constructed fair market value, 2012-14, January-June 2014, and January-June 2015
Item Fiscal year January-June
2012 2013 2014 2014 2015 Quantity (short tons) Commercial sales 11,309,745 11,106,450 10,646,771 5,494,644 4,917,078 Internal consumption *** *** *** *** ***Transfers to related firms *** *** *** *** *** Total net sales 26,917,521 27,008,406 27,202,517 13,858,154 12,591,423 Value (1,000 dollars) Commercial sales 8,926,786 8,370,066 8,442,724 4,356,989 3,569,554 Internal consumption *** *** *** *** ***Transfers to related firms *** *** *** *** *** Total net sales 20,462,831 19,598,764 20,735,965 10,571,243 8,739,916 Cost of goods sold.-- Raw materials 14,185,668 12,816,375 12,971,236 6,563,225 5,149,271
Direct labor 1,746,624 1,789,412 1,831,266 915,086 896,324 Other factory costs 4,201,791 4,760,407 5,048,980 2,849,989 2,566,791
Total COGS 20,134,083 19,366,194 19,851,482 10,328,300 8,612,386 Gross profit 328,748 232,570 884,483 242,943 127,530 SG&A expense 524,206 537,670 629,379 328,014 317,558 Operating income or (loss) (195,458) (305,100) 255,104 (85,071) (190,028)Other expense or (income), net 351,657 208,515 232,268 114,312 200,141 Net income or (loss) (547,115) (513,615) 22,836 (199,383) (390,169)Depreciation/amortization 459,669 454,009 401,150 210,635 211,270 Cash flow (87,446) (59,606) 423,986 11,252 (178,899)
Table continued on the next page.

VI‐4
Table VI-1--Continued Cold-rolled steel: Results of operations of U.S. producers with internal consumption and transfers valued at constructed fair market value, 2012-14, January-June 2014, and January-June 2015
Item Fiscal year January-June
2012 2013 2014 2014 2015 Ratio to total net sales (percent) Cost of goods sold.-- Raw materials 69.3 65.4 62.6 62.1 58.9
Direct labor 8.5 9.1 8.8 8.7 10.3 Other factory costs 20.5 24.3 24.3 27.0 29.4
Average COGS 98.4 98.8 95.7 97.7 98.5 Gross profit 1.6 1.2 4.3 2.3 1.5 SG&A expense 2.6 2.7 3.0 3.1 3.6 Operating income or (loss) (1.0) (1.6) 1.2 (0.8) (2.2)Net income or (loss) (2.7) (2.6) 0.1 (1.9) (4.5) Ratio to total COGS (percent) Raw materials 70.5 66.2 65.3 63.5 59.8 Direct labor 8.7 9.2 9.2 8.9 10.4 Other factory costs 20.9 24.6 25.4 27.6 29.8
Average unit value (dollars per short ton) Commercial sales 789 754 793 793 726 Internal consumption *** *** *** *** ***Transfers to related firms *** *** *** *** *** Total net sales 760 726 762 763 694 Cost of goods sold.-- Raw materials 527 475 477 474 409
Direct labor 65 66 67 66 71 Other factory costs 156 176 186 206 204
Average COGS 748 717 730 745 684 Gross profit 12 9 33 18 10 SG&A expense 19 20 23 24 25 Operating income or (loss) (7) (11) 9 (6) (15)Net income or (loss) (20) (19) 1 (14) (31) Number of firms reporting Operating losses 6 5 3 2 5 Net losses 6 6 3 3 7 Data 12 12 12 12 12
Note.—Firm-by-firm financial data are in appendix E. Source: Compiled from data submitted in response to Commission questionnaires.

VI‐5
Table VI-2 Cold-rolled steel: Results of operations of U.S. producers with internal consumption and transfers valued at cost plus share of downstream profit, 2012-14, January-June 2014, and January-June 2015
Item Fiscal year January-June
2012 2013 2014 2014 2015 Quantity (short tons) Commercial sales 11,309,745 11,106,450 10,646,771 5,494,644 4,917,078 Internal consumption *** *** *** *** ***Transfers to related firms *** *** *** *** *** Total net sales1 26,917,521 27,008,406 27,202,517 13,858,154 12,591,423 Value (1,000 dollars) Commercial sales 8,926,786 8,370,066 8,442,724 4,356,989 3,569,554 Internal consumption *** *** *** *** ***Transfers to related firms *** *** *** *** *** Total net sales1 20,967,337 20,347,168 21,136,392 10,799,154 8,937,502 Cost of goods sold.-- Raw materials 14,185,668 12,816,375 12,971,236 6,563,225 5,149,271
Direct labor 1,746,624 1,789,412 1,831,266 915,086 896,242 Other factory costs 4,201,790 4,760,407 5,048,980 2,850,337 2,566,792
Total COGS 20,134,082 19,366,194 19,851,482 10,328,648 8,612,305 Gross profit 833,255 980,974 1,284,910 470,506 325,197 SG&A expense 524,206 537,671 629,379 328,015 317,557 Operating income 309,049 443,303 655,531 142,491 7,640 Other expense or (income), net 351,297 208,515 232,269 114,311 197,825 Net income or (loss) (42,248) 234,788 423,262 28,180 (190,185)Depreciation/amortization 459,668 454,009 401,150 210,635 211,270 Cash flow 417,420 688,797 824,412 238,815 21,085 Ratio to total net sales (percent) Cost of goods sold.-- Raw materials 67.7 63.0 61.4 60.8 57.6
Direct labor 8.3 8.8 8.7 8.5 10.0 Other factory costs 20.0 23.4 23.9 26.4 28.7
Average COGS 96.0 95.2 93.9 95.6 96.4 Gross profit 4.0 4.8 6.1 4.4 3.6 SG&A expense 2.5 2.6 3.0 3.0 3.6 Operating income 1.5 2.2 3.1 1.3 0.1 Net income or (loss) (0.2) 1.2 2.0 0.3 (2.1)
Table continued on the next page.

VI‐6
Table VI-2--Continued Cold-rolled steel: Results of operations of U.S. producers with internal consumption and transfers valued at cost plus share of downstream profit, 2012-14, January-June 2014, and January-June 2015
Item Fiscal year January-June
2012 2013 2014 2014 2015 Ratio to total COGS (percent) Raw materials 70.5 66.2 65.3 63.5 59.8 Direct labor 8.7 9.2 9.2 8.9 10.4 Other factory costs 20.9 24.6 25.4 27.6 29.8
Average unit value (dollars per short ton) Commercial sales 789 754 793 793 726 Internal consumption *** *** *** *** ***Transfers to related firms *** *** *** *** *** Total net sales1 779 753 777 779 710 Cost of goods sold.-- Raw materials 527 475 477 474 409
Direct labor 65 66 67 66 71 Other factory costs 156 176 186 206 204
Average COGS 748 717 730 745 684 Gross profit 31 36 47 34 26 SG&A expense 19 20 23 24 25 Operating income 11 16 24 10 1 Net income or (loss) (2) 9 16 2 (15) Number of firms reporting Operating losses 5 3 4 2 5 Net losses 6 4 4 2 6 Data 12 12 12 12 12
Note.—Firm-by-firm financial data are in appendix E. Source: Compiled from data submitted in response to Commission questionnaires.

VI‐7
Table VI-3 Cold-rolled steel: Results of commercial operations only of U.S. producers, 2012-14, January-June 2014, and January-June 2015
Item Fiscal year January-June
2012 2013 2014 2014 2015 Quantity (short tons) Total net sales 11,309,745 11,106,450 10,646,771 5,494,644 4,917,078 Value (1,000 dollars) Total net sales 8,926,786 8,370,066 8,442,724 4,356,989 3,569,554 Cost of goods sold.-- Raw materials 5,945,661 5,246,289 4,978,066 2,544,446 1,950,335
Direct labor 797,013 798,394 790,585 402,037 404,649 Other factory costs 1,860,130 2,033,213 2,062,369 1,197,941 1,068,504
Total COGS 8,602,804 8,077,896 7,831,020 4,144,424 3,423,488 Gross profit 323,982 292,170 611,704 212,565 146,066 SG&A expense 243,284 237,554 262,221 136,046 130,836 Operating income 80,698 54,616 349,483 76,519 15,230 Other expense or (income), net 175,667 83,891 72,513 43,961 82,175 Net income or (loss) (94,969) (29,275) 276,970 32,558 (66,945)Depreciation/amortization 198,295 196,004 165,699 88,051 87,207 Cash flow 103,326 166,729 442,669 120,609 20,262 Ratio to net sales (percent) Cost of goods sold.-- Raw materials 66.6 62.7 59.0 58.4 54.6
Direct labor 8.9 9.5 9.4 9.2 11.3 Other factory costs 20.8 24.3 24.4 27.5 29.9
Average COGS 96.4 96.5 92.8 95.1 95.9 Gross profit 3.6 3.5 7.2 4.9 4.1 SG&A expense 2.7 2.8 3.1 3.1 3.7 Operating income 0.9 0.7 4.1 1.8 0.4 Net income or (loss) (1.1) (0.3) 3.3 0.7 (1.9)
Table continued on the next page.
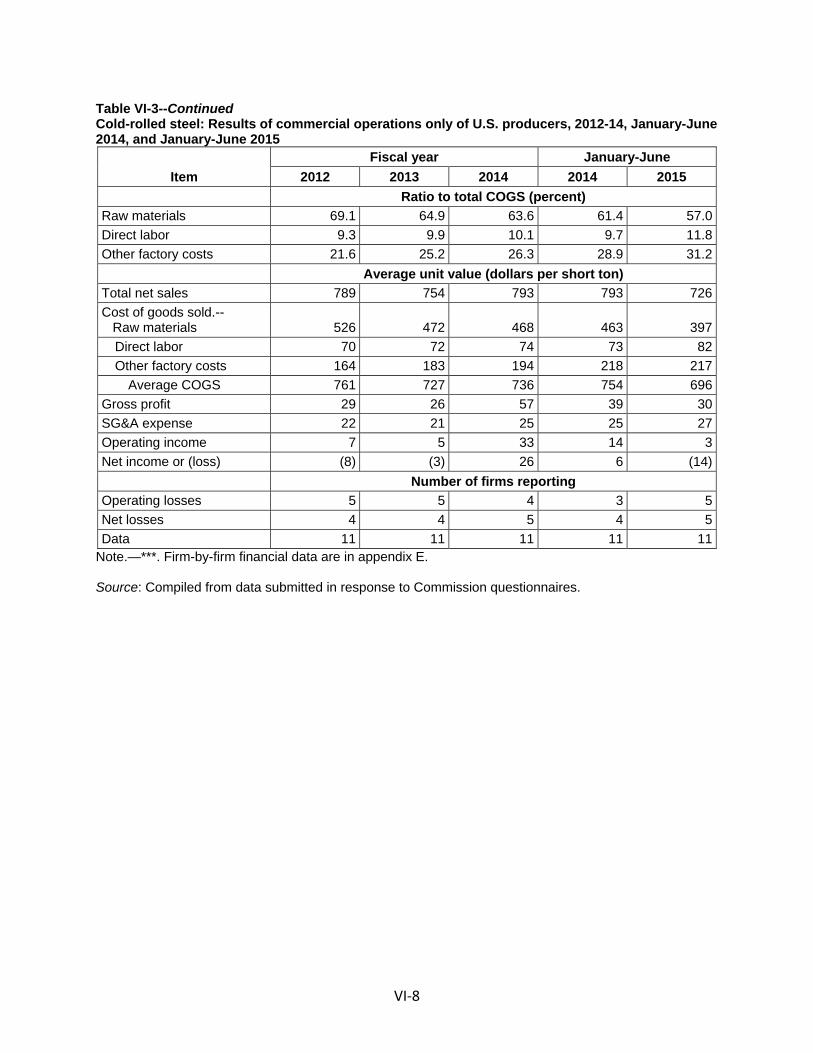
VI‐8
Table VI-3--Continued Cold-rolled steel: Results of commercial operations only of U.S. producers, 2012-14, January-June 2014, and January-June 2015
Item Fiscal year January-June
2012 2013 2014 2014 2015 Ratio to total COGS (percent) Raw materials 69.1 64.9 63.6 61.4 57.0 Direct labor 9.3 9.9 10.1 9.7 11.8 Other factory costs 21.6 25.2 26.3 28.9 31.2
Average unit value (dollars per short ton) Total net sales 789 754 793 793 726 Cost of goods sold.-- Raw materials 526 472 468 463 397
Direct labor 70 72 74 73 82 Other factory costs 164 183 194 218 217
Average COGS 761 727 736 754 696 Gross profit 29 26 57 39 30 SG&A expense 22 21 25 25 27 Operating income 7 5 33 14 3 Net income or (loss) (8) (3) 26 6 (14) Number of firms reporting Operating losses 5 5 4 3 5 Net losses 4 4 5 4 5 Data 11 11 11 11 11
Note.—***. Firm-by-firm financial data are in appendix E. Source: Compiled from data submitted in response to Commission questionnaires.

VI‐9
Net sales quantity and value
As the data in tables VI‐1 and VI‐2 indicate, total sales increased between 2012 and 2014 and were lower in January‐June 2015 than in January‐June 2014 on a quantity and value basis. The increase between 2012 and 2014 was primarily attributable to the higher quantity and value of reported internal consumption of cold‐rolled steel by five reporting firms. ***.5 Commercial sales declined between 2012 and 2014 on a quantity and value basis, and lower sales reported by ***. Commercial sales, internal consumption, and transfers to related firms were each lower in January‐June 2015 than in the same period one year earlier. Average unit values of commercial sales (table VI‐3) and internal consumption (table VI‐1) increased *** irregularly between 2012 and 2014, while those of transfers fell. The average unit values of each category were *** lower in January‐June 2015 compared with January‐June 2014. Operating costs and expenses
Raw material costs represent the single largest component of overall COGS, accounting for 60 percent or more of total COGS, but declined between 2012 and 2014, and into 2015. Raw material costs also represent approximately 60 percent of net sales value, but declined over the same period. Raw material costs fell between 2012 and 2014 on a dollar basis and were lower in January‐June 2015 than in January‐June 2014; likewise, the average unit value of raw material costs fell from 2012 to 2014 and were lower in January‐June 2015 than in the same period one year earlier. With respect to their U.S. operations, several producers reported that they purchase inputs from related parties: AK Steel ***; ArcelorMittal ***; CSI ***; CSN ***; Nucor ***;6 Steel Dynamics ***; Steelscape ***; U.S. Steel ***; and USS‐POSCO ***. 7
Other factory costs are the second largest component of total COGS and consist of many allocated variable costs as well as fixed costs of production. These costs increased on a dollar basis, as a share of total COGS and as a percentage of total net sales, and on per‐unit basis from 2012 to 2014. The changes were ***. Other factory costs were lower in January‐June 2015 than in January‐June 2014 on a dollar basis and slightly lower or flat on a per‐unit basis. These changes were ***.8
5 Financial information on a firm‐by‐firm basis is shown in app. E. 6 See Nucor’s postconference brief, exh. 1, answers to staff questions, p. 33 for additional
information about Nucor’s ***. 7 The Commission’s current practice requires that relevant cost information associated with input
purchases from related suppliers correspond to the manner in which this information is reported in the U.S. producer’s own accounting books and records. See 1,1,1,2‐Tetrafluoroethane from China, Inv. Nos. 701‐TA‐509 and 731‐TA‐1244 (Final), USITC Publication 4503, December 2014, pp. 23 and 37.
8 *** reported prolonged shutdowns or curtailment of operations in their questionnaire responses and the industry as a whole reported lower capacity utilization when produced cold‐rolled steel. See tables III‐3 and III‐4, presented earlier. Reduced production or idled capacity typically leads to higher fixed costs per unit produced. This is true as well in a multi‐product plant as fixed costs are spread over a smaller base. As stated at the staff conference, “production of cold‐rolled steel involves significant fixed
(continued...)

VI‐10
Total SG&A expenses, which are composed of both variable and fixed company overhead costs increased on a dollar basis from 2012 to 2014 and were lower in January‐June 2015 than in January‐June 2014. These expenses increased as a ratio to total net sales and on a per‐unit of sales basis from 2012 to 2014 and were higher in January‐June 2015 than in the same period one year earlier.9
*** firms reported non‐recurring charges at the operating level, classified in either other factory costs within COGS or within general and administrative (G&A) expenses. These charges included inventory adjustments, impairment charges to the value of plant and equipment (including closure charges), pensions, and “idle plant costs.” *** in the category of other factory costs. Classified in general and administrative expenses, ***. Profitability
Tables VI‐1, VI‐2, and VI‐3 show that the industry’s gross profit, on an absolute and relative basis, was at its highest level in 2014. Notwithstanding variability in average direct labor and other factory costs, changes in the industry’s gross profit margin primarily reflect the extent to which changes in average raw material costs were or were not offset by corresponding changes in average sales value. Like gross profit, operating income rose substantially from 2012 to 2014 (table VI‐1 shows the operating loss increasing from 2012 to 2013 but becoming a positive number in 2014; tables VI‐2 and VI‐3 depict an increase in operating income during 2012‐14). In each table operating income is substantially lower in January‐June 2015 compared with the same period one year earlier. These trends are the same when operating income/(loss) is calculated as a ratio to sales or on a per‐unit basis. The number of firms reporting operating losses was lower in 2014 than in 2012 but greater in January‐June 2015 than in January‐June 2014.10 ***.
Classified below the operating income level are interest expense, other expense, and other income, which are usually allocated to the product line from high levels in the corporation. In each of the three preceding tables, these items are aggregated and only the net amount is shown. Based on the data reported for table VI‐1, interest charges ranged from $***. The category of other expense includes certain non‐recurring charges that are not part of operating expenses, which were reported by ***.11 In addition, ***. Other income was insubstantial in any period, ranging from ***. (…continued) costs.” Conference transcript, p. 45 (Matthews). Also, see discussion of non‐recurring charges in this section of the report.
9 Commission staff notes that very few firms maintain records for SG&A expenses on a product‐line basis and that the data reported in questionnaire responses usually represents an allocation of these costs to a subset of the firm’s overall operations.
10 Two firms, ***. Three firms, *** reported operating profits in each of the periods. 11 Lawsuits were filed in 2007‐08 and in 2010. Details concerning the court‐approved settlement in
October 2014 of the “Standard Iron Works” litigation are provided in ArcelorMittal’s Annual Report for 2014, p. 149. Reportedly, eight U.S. steelmakers were named by plaintiffs, who alleged that the named steelmakers engaged in anticompetitive activities with respect to the production and sale of steel. Five
(continued...)

VI‐11
As may be seen from the data in the three tables, net income and cash flow (net income plus depreciation expenses) followed the trend of operating income.
Variance analysis
A variance analysis for the operations of U.S. producers of cold‐rolled steel is presented in tables VI‐4, VI‐5, and VI‐6.12 The information for these variance analyses is derived from tables VI‐1, VI‐2, and VI‐3, respectively. The analysis in table VI‐4 (constructed fair market value) indicates that from 2012 to 2014, operating income rose by approximately $450.6 million (from a loss to income) because of favorable variances on price and net cost/expense (unit prices rose while unit costs/expenses declined), while net income increased due to decreased financial expenses. Lower operating income in January‐June 2015 relative to January‐June 2014 was due to an unfavorable variance on price (unit sales values fell) that overwhelmed a favorable net cost/expense variance. Calculated variance at the net income level reflects the same dynamic. The variance analyses in table VI‐5 (cost plus a share of gross profit) and VI‐6 (merchant market) are similar that those of table VI‐4.
(…continued) of the eight defendants have reached court‐approved settlements with plaintiffs. According to Nucor’s 2014 Form 10‐K, Nucor has not reached a settlement, nor has it recorded any reserves or contingencies related to this legal matter. Nucor’s 2014 Form 10‐K, p. 15. Although U.S. Steel refers to its settlement in these cases and a payment of $58 million in June 2014, ***. U.S. Steel’s 2014 Form 10‐K, pp. F‐57‐58 (as filed). Although AK Steel refers to its settlement in these cases and a payment of $5.8 million in settlement, ***. AK Steel Holding Co., 2014 Form 10‐K, p. 71 (as filed).
12 The Commission’s variance analysis is calculated in three parts: Sales variance, cost of sales variance (COGS variance), and SG&A expense variance. Each part consists of a price variance (in the case of the sales variance) or a cost or expense variance (in the case of the COGS and SG&A expense variance), and a volume variance. The sales or cost/expense variance is calculated as the change in unit price or per‐unit cost/expense times the new volume, while the volume variance is calculated as the change in volume times the old unit price or per‐unit cost/expense. As summarized at the bottom of the table, the price variance is from sales, the cost/expense variance is the sum of those items from COGS and SG&A variances, respectively, and the volume variance is the sum of the volume components of the net sales, COGS, and SG&A expense variances. The overall volume component of the variance analysis is generally small.

VI‐12
Table VI-4 Cold-rolled steel: Variance analysis on the operations of U.S. producers, with internal consumption and transfers valued at constructed fair market value, 2012-14, January-June 2014, and January-June 2015
Item Between fiscal years January-Jun
2012-14 2012-13 2013-14 2014-15 Commercial sales: Price variance 39,224 (396,259) 419,082 (329,453)Volume variance (523,286) (160,461) (346,424) (457,982)Commercial sales variance (484,062) (556,720) 72,658 (787,435)Internal consumption: Price variance *** *** *** *** Volume variance *** *** *** ***Internal consumption variance *** *** *** ***Transfers to related firms: Price variance *** *** *** *** Volume variance *** *** *** ***Transfers to related firms variance *** *** *** ***Net sales: Price variance 56,479 (933,158) 996,344 (865,042) Volume variance 216,655 69,091 140,857 (966,285)Net sales variance 273,134 (864,067) 1,137,201 (1,831,327)COGS: Price variance 495,776 835,870 (346,102) 771,836 Volume variance (213,175) (67,981) (139,186) 944,078 COGS variance 282,601 767,889 (485,288) 1,715,914 Gross profit variance 555,735 (96,178) 651,913 (115,413)SG&A expenses: Cost/expense variance (99,623) (11,694) (87,845) (19,527) Volume variance (5,550) (1,770) (3,864) 29,983 Total SG&A expense variance (105,173) (13,464) (91,709) 10,456 Operating income variance 450,562 (109,642) 560,204 (104,957)Operating income summarized as: Price variance 56,479 (933,158) 996,344 (865,042)Net cost/expense variance 396,153 824,176 (433,947) 752,309 Net volume variance (2,069) (660) (2,193) 7,776 Financial expenses: Cost/expense variance 123,112 144,329 (22,254) (96,278)Volume variance (3,723) (1,187) (1,499) 10,449 Total SG&A expense variance 119,389 143,142 (23,753) (85,829)Net income variance 569,951 33,500 536,451 (190,786)Net income summarized as: Price variance 56,479 (933,158) 996,344 (865,042)Net cost/expense variance 519,265 968,506 (456,201) 656,031 Net volume variance (5,793) (1,847) (3,691) 18,225 Note.—The variance analysis shown here is consistent with the data in table VI-1. Unfavorable variances are shown in parentheses, all others are favorable. Source: Compiled from data submitted in response to Commission questionnaires.

VI‐13
Table VI-5 Cold-rolled steel: Variance analysis on the operations of U.S. producers with internal consumption and transfers to related firms valued at share of gross profit, 2012-14, January-June 2014, and January-June 2015
Item Between fiscal years January-Jun
2012-14 2012-13 2013-14 2014-15 Commercial sales: Price variance 39,224 (396,259) 419,082 (329,453)Volume variance (523,286) (160,461) (346,424) (457,982)Commercial sales variance (484,062) (556,720) 72,658 (787,435)Internal consumption: Price variance *** *** *** *** Volume variance *** *** *** ***Internal consumption variance *** *** *** ***Transfers to related firms: Price variance *** *** *** *** Volume variance *** *** *** ***Transfers to related firms variance *** *** *** ***Net sales: Price variance (52,942) (690,964) 642,988 (874,535) Volume variance 221,997 70,795 146,236 (987,117)Net sales variance 169,055 (620,169) 789,224 (1,861,652)COGS: Price variance 495,775 835,869 (346,102) 772,233 Volume variance (213,175) (67,981) (139,186) 944,110 COGS variance 282,600 767,888 (485,288) 1,716,343 Gross profit variance 451,655 147,719 303,936 (145,309)SG&A expenses: Cost/expense variance (99,623) (11,695) (87,844) (19,525) Volume variance (5,550) (1,770) (3,864) 29,983 Total SG&A expense variance (105,173) (13,465) (91,708) 10,458 Operating income variance 346,482 134,254 212,228 (134,851)Operating income summarized as: Price variance (52,942) (690,964) 642,988 (874,535)Net cost/expense variance 396,152 824,174 (433,946) 752,708 Net volume variance 3,272 1,043 3,186 (13,025)Financial expenses: Cost/expense variance 122,747 143,968 (22,255) (93,963)Volume variance (3,719) (1,186) (1,499) 10,449 Total SG&A expense variance 119,028 142,782 (23,754) (83,514)Net income variance 465,510 277,036 188,474 (218,365)Net income summarized as: Price variance (52,942) (690,964) 642,988 (874,535)Net cost/expense variance 518,899 968,142 (456,201) 658,746 Net volume variance (447) (143) 1,687 (2,576)Note.—The variance analysis shown here is consistent with the data in table VI-2. Unfavorable variances are shown in parentheses, all others are favorable. Source: Compiled from data submitted in response to Commission questionnaires.

VI‐14
Table VI-6 Cold-rolled steel: Variance analysis on the open market operations of U.S. producers, 2012-14, January-June 2014, and January-June 2015
Item Between fiscal years January-Jun
2012-14 2012-13 2013-14 2014-15 Commercial sales: Price variance 39,224 (396,259) 419,082 (329,453)Volume variance (523,286) (160,461) (346,424) (457,982)Commercial sales variance (484,062) (556,720) 72,658 (787,435)COGS: Price variance 267,490 370,271 (87,456) 285,298 Volume variance 504,294 154,637 334,332 435,638 COGS variance 771,784 524,908 246,876 720,936 Gross profit variance 287,722 (31,812) 319,534 (66,499)SG&A expenses: Cost/expense variance (33,198) 1,357 (34,499) (9,090) Volume variance 14,261 4,373 9,832 14,300 Total SG&A expense variance (18,937) 5,730 (24,667) 5,210 Operating income variance 268,785 (26,082) 294,867 (61,289)Operating income summarized as: Price variance 39,224 (396,259) 419,082 (329,453)Net cost/expense variance 234,292 371,628 (121,955) 276,207 Net volume variance (4,730) (1,451) (2,260) (8,043)Financial expenses: Cost/expense variance 92,856 88,618 7,906 (42,835)Volume variance 10,298 3,158 3,472 4,621 Total SG&A expense variance 103,154 91,776 11,378 (38,214)Net income variance 371,939 65,694 306,245 (99,503)Net income summarized as: Price variance 39,224 (396,259) 419,082 (329,453)Net cost/expense variance 327,148 460,246 (114,049) 233,372 Net volume variance 5,567 1,707 1,212 (3,422)Note.—The variance analysis shown here is consistent with the data in table VI-3. Unfavorable variances are shown in parentheses, all others are favorable. Source: Compiled from data submitted in response to Commission questionnaires.

VI‐15
CAPITAL EXPENDITURES AND RESEARCH AND DEVELOPMENT (R&D) EXPENSES
Capital expenditures and acquisitions (discussed next in assets and return on investment) are among the largest single items in the section “cash flows from investing activities” in the statement of cash flows of a firm. In accounting terms, both capital expenditures and acquisitions increase the value of specific plant and equipment and total assets, while charges for depreciation and amortization (in the case of intangible assets), impairments, and divestitures decrease the value of assets. Capital expenditures are made and R&D expenses are incurred to achieve improvements in equipment and the quality of products produced. Acquisitions are typically made to expand a company’s production of an existing product, enter into a new product line, access technology, and the like.13
Six firms responded to the question concerning the nature or focus of their capital expenditures. ArcelorMittal USA reported capital expenditures ***.14 Blair stated that the firm***. CSN stated that it invested to ***. Nucor stated that its capital expenditures were with respect to a ***. Steel Dynamics indicated that it invested to ***. Finally, USS‐POSCO stated that ***. In addition, AK Steel stated that ***.15 16 Nucor also listed ***. 17
Table VI‐7 presents capital expenditures and R&D expenses by firm. Total capital expenditures were less than reported total depreciation in 2013 (by $144.0 million) and 2014 (by $90.6 million) and in both interim periods (by $88.8 million and $26.0 million in January‐June 2014 and January‐June 2015, respectively). On a firm‐by‐firm basis, capital expenditures were less than depreciation charges for the majority of reporting firms; exceptions were ***. As shown in table VI‐4, ***.
13 Nucor notes that it may be the sole U.S. steelmaker whose debt is considered investment‐grade, which means that the firm has greater access to investment capital, enjoys lower interest rates on its borrowing, and its stock price is higher.
14 Email from ***, August 19, 2015. 15 Postconference brief of AK Steel, Answers to questions, p. 4. 16 ArcelorMittal USA stated ***. ArcelorMittal USA’s postconference brief, exh. 1, answers to
questions, p. 7 and exh. 7 (Declaration of ***). 17 These are ***. Nucor’s postconference brief, exh. 1, answers to staff questions, p. 28.

VI‐16
Table VI-7 Cold-rolled steel: Capital expenditures and R&D expenses of U.S. producers, 2012-14, January-June 2014, and January-June 2015
Item
Fiscal year January-June 2012 2013 2014 2014 2015
Capital expenditures (1,000 dollars) AK Steel *** *** *** *** ***ArcelorMittal USA *** *** *** *** ***Blair *** *** *** *** ***CSI *** *** *** *** ***CSN *** *** *** *** ***Nucor *** *** *** *** ***Steel Dynamics *** *** *** *** ***Steelscape *** *** *** *** ***Thomas *** *** *** *** ***U.S. Steel *** *** *** *** ***USS-POSCO *** *** *** *** ***Worthington Steel *** *** *** *** *** Total 528,326 314,950 314,677 123,970 187,648
R & D expenses (1,000 dollars) AK Steel *** *** *** *** ***ArcelorMittal USA *** *** *** *** ***Blair *** *** *** *** ***CSI *** *** *** *** ***CSN *** *** *** *** ***Nucor *** *** *** *** ***Steel Dynamics *** *** *** *** ***Steelscape *** *** *** *** ***Thomas *** *** *** *** ***U.S. Steel *** *** *** *** ***USS-POSCO *** *** *** *** ***Worthington Steel *** *** *** *** *** Total *** *** *** *** ***
Source: Compiled from data submitted in response to Commission questionnaires.
ASSETS AND RETURN ON ASSETS
Table VI‐8 presents data on the U.S. producers’ total assets18 and the ratio of operating income or (loss) and net income or (loss) to assets. As reported by the U.S. industry, total assets decreased from $11.3 billion in 2012 to $9.3 billion in 2014.
18 With respect to a company’s overall operations, staff notes that a total asset value (i.e., the bottom line number on the asset side of a company’s balance sheet) reflects an aggregation of a number of assets which are generally not product specific. Accordingly, high‐level allocation factors were required in order to report a total asset value for cold‐rolled steel.

VI‐17
In addition to the capital expenditures for plant modernization, health and safety, and maintenance that were described earlier, four firms purchased the plant and equipment of other firms during 2012‐15. These included: Steel Dynamics, which bought the mill at Columbus, Mississippi in September 2014 from Severstal for $1.625 billion (the allocated value of the facilities producing cold‐rolled steel are ***.19 ArcelorMittal USA, which completed the purchase of the Calvert, Alabama mill from ThyssenKrupp Steel USA in February 2014 and formed a 50/50 joint venture with Nippon Steel and Sumitomo Metal Corp. to operate the plant; the total cost was $1.55 billion and the allocated value of the facility that produces cold‐rolled steel was $***.20 AK Steel, which acquired the Dearborn, Michigan integrated steel production facility from Severstal in July 2014. The overall purchase price, financed by debt and equity offering, was $690 million, of which $*** was estimated to be the value of the purchased cold‐rolled steel assets.21 22 23 Finally, Worthington, finalized the purchase of Rome Strip Steel, IN Rome, New York, in January 2015 for a reported purchase price of $54.5 million.24
In contrast to these acquisitions, U.S. Steel recently decided to permanently close its cold‐rolled steel operations at Fairfield, Alabama on or after November 17, 2015. A press release issued by U.S. Steel indicated that facilities to be closed at the Fairfield, Alabama mill included the blast furnace and BOF, hot‐strip mill, pickle line, cold mill, annealing facility, and the stretch and temper line.25 As noted earlier, U.S. Steel recorded $***. The value of U.S. Steel’s assets allocated to cold‐rolled steel ***.
19 Emails from ***; SDI’s and CSI’s postconference brief, exh. 1, response to question at staff conference, ***.
20 Email from ***, August 19, 2015. Also, ArcelorMittal USA’s postconference brief, exh. 1, answers to questions, pp. 9‐10 ***.
21 Email from ***, August 19, 2015. 22 In its postconference brief, AK Steel stated that ***. AK Steel’s postconference brief, answers to
questions, p. 4. U.S. Steel stated that “in a domestic industry with significant fixed costs . . .it is vital for producers to obtain a strong rate of return during periods of favorable demand in order to make up for difficulties resulting from inevitable downturns.” U.S. Steel’s postconference brief, p. 18.
23 Reportedly, ThyssenKrupp recorded impairment charges of €3.6 billion (approximately US$4.0 billion at current exchange rates) in connection with the sale of its Calvert, Alabama mill in 2013; similarly, Severstal sold its Dearborn, Michigan plant for approximately half of what it had invested for renovation two years earlier. Nucor’s postconference brief, p. 20, footnote 79 (examples of plant being sold by firms exiting the industry for “pennies on the dollar”).
24 Worthington Industries, Annual Report, p. 2. 25 U.S. Steel’s postconference brief, response to questions from Commission staff, p. 1 and exh. 35
(declaration by Douglas Matthews). Reportedly, the decision to close the blast furnace, associated steelmaking operations, and certain finishing operations does not affect the pipe and tube operations at the mill in Fairfield, Alabama, the electric arc furnace (EAF) construction project a that mill (which is to replace the current steelmaking furnace), or the coating lines and Double G hot‐dip galvanizing joint venture in Jackson, Mississippi. U.S. Steel’s press release of August 17, 2015.

VI‐18
Table VI-8 Cold-rolled steel: U.S. producers’ total assets and ratio of operating income or (loss) to total assets, by firm, fiscal years 2012-14
Firm Fiscal years
2012 2013 2014 Total net assets (1,000 dollars) AK Steel *** *** *** ArcelorMittal, USA *** *** *** Blair *** *** *** CSI *** *** *** CSN *** *** *** Nucor *** *** *** Steel Dynamics *** *** *** Steelscape *** *** *** Thomas *** *** *** U.S. Steel *** *** *** USS-POSCO *** *** *** Worthington Steel *** *** ***
Total 11,295,733 10,803,876 9,323,742 Ratio of operating income or (loss) to assets (percent) AK Steel *** *** *** ArcelorMittal, USA *** *** *** Blair *** *** *** CSI *** *** *** CSN *** *** *** Nucor *** *** *** Steel Dynamics *** *** *** Steelscape *** *** *** Thomas *** *** *** U.S. Steel *** *** *** USS-POSCO *** *** *** Worthington Steel *** *** ***
Average (1.7) (2.8) 2.7 Ratio of net income or (loss) to assets (percent) AK Steel *** *** *** ArcelorMittal, USA *** *** *** Blair *** *** *** CSI *** *** *** CSN *** *** *** Nucor *** *** *** Steel Dynamics *** *** *** Steelscape *** *** *** Thomas *** *** *** U.S. Steel *** *** *** USS-POSCO *** *** *** Worthington Steel *** *** ***
Average (4.8) (4.8) 0.2 Note.—Data for operating income and net income are from table VI-1 (constructed fair value). Source: Compiled from data submitted in response to Commission questionnaires.
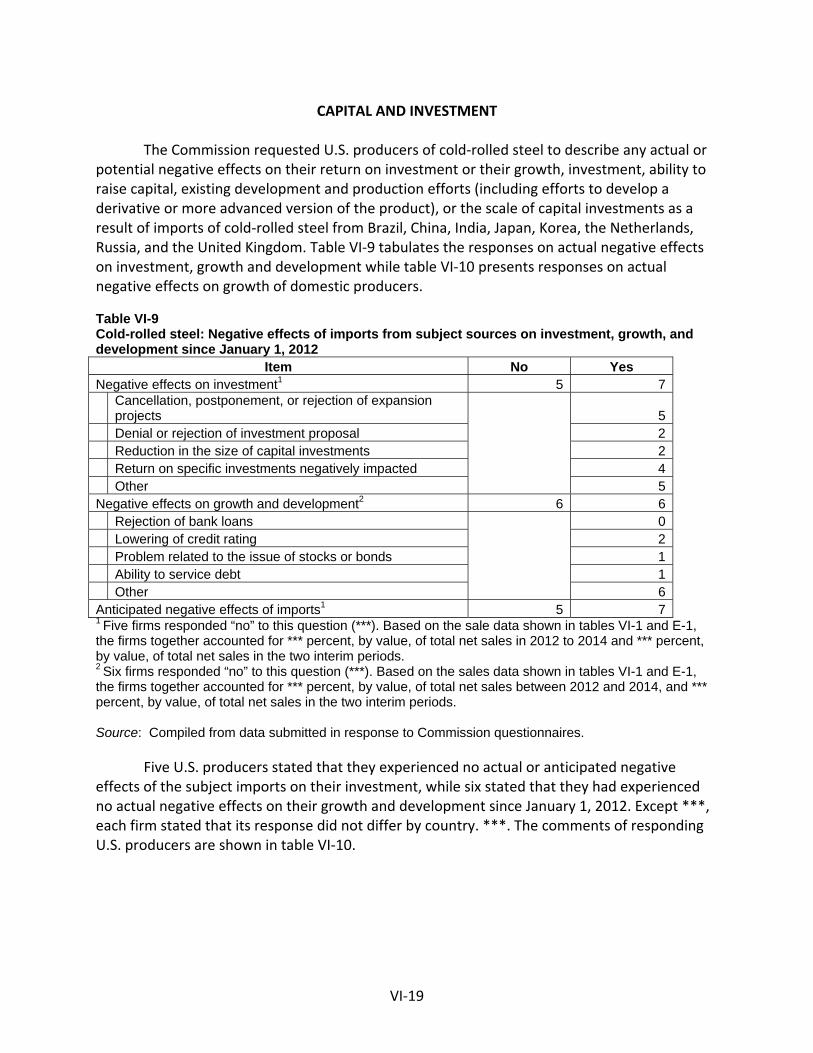
VI‐19
CAPITAL AND INVESTMENT
The Commission requested U.S. producers of cold‐rolled steel to describe any actual or potential negative effects on their return on investment or their growth, investment, ability to raise capital, existing development and production efforts (including efforts to develop a derivative or more advanced version of the product), or the scale of capital investments as a result of imports of cold‐rolled steel from Brazil, China, India, Japan, Korea, the Netherlands, Russia, and the United Kingdom. Table VI‐9 tabulates the responses on actual negative effects on investment, growth and development while table VI‐10 presents responses on actual negative effects on growth of domestic producers. Table VI-9 Cold-rolled steel: Negative effects of imports from subject sources on investment, growth, and development since January 1, 2012
Item No Yes Negative effects on investment1 5 7
Cancellation, postponement, or rejection of expansion projects
5 Denial or rejection of investment proposal 2 Reduction in the size of capital investments 2 Return on specific investments negatively impacted 4 Other 5 Negative effects on growth and development2 6 6 Rejection of bank loans
0 Lowering of credit rating 2 Problem related to the issue of stocks or bonds 1 Ability to service debt 1 Other 6 Anticipated negative effects of imports1 5 71 Five firms responded “no” to this question (***). Based on the sale data shown in tables VI-1 and E-1, the firms together accounted for *** percent, by value, of total net sales in 2012 to 2014 and *** percent, by value, of total net sales in the two interim periods. 2 Six firms responded “no” to this question (***). Based on the sales data shown in tables VI-1 and E-1, the firms together accounted for *** percent, by value, of total net sales between 2012 and 2014, and *** percent, by value, of total net sales in the two interim periods. Source: Compiled from data submitted in response to Commission questionnaires.
Five U.S. producers stated that they experienced no actual or anticipated negative effects of the subject imports on their investment, while six stated that they had experienced no actual negative effects on their growth and development since January 1, 2012. Except ***, each firm stated that its response did not differ by country. ***. The comments of responding U.S. producers are shown in table VI‐10.

VI‐20
Table VI-10 Cold-rolled steel: Narrative responses by U.S. producers regarding actual and anticipated negative effects of imports from subject sources on investment, growth, and development since January 1, 2012
Effect / Firm Narrative Cancellation, postponement, or rejection of expansion projects:
*** *** *** *** *** ***
Denial or rejection of investment proposal: *** ***
Reduction in the size of capital investments: *** ***
Return on specific investments negatively impacted: *** *** *** *** *** ***
Other negative impact on investments: *** *** *** *** *** *** *** *** *** ***
Lowering of credit rating: *** ***
Problem related to the issue of stocks or bond: *** ***
Ability to service debt: *** ***
Other negative impact on growth and development activities: *** *** *** *** *** *** *** *** *** *** *** ***
Anticipated effects of imports: *** *** *** ***
Anticipated effected of imports: *** *** *** *** *** *** *** *** *** ***.
Source: Compiled from data submitted in response to Commission questionnaires.

VII-1
PART VII: THREAT CONSIDERATIONS AND INFORMATION ON
NONSUBJECT COUNTRIES
Section 771(7)(F)(i) of the Act (19 U.S.C. § 1677(7)(F)(i)) provides that—
In determining whether an industry in the United States is threatened with material injury by reason of imports (or sales for importation) of the subject merchandise, the Commission shall consider, among other relevant economic factors1-- (I) if a countervailable subsidy is involved, such information as may
be presented to it by the administering authority as to the nature of the subsidy (particularly as to whether the countervailable subsidy is a subsidy described in Article 3 or 6.1 of the Subsidies Agreement), and whether imports of the subject merchandise are likely to increase,
(II) any existing unused production capacity or imminent, substantial increase in production capacity in the exporting country indicating the likelihood of substantially increased imports of the subject merchandise into the United States, taking into account the availability of other export markets to absorb any additional exports,
(III) a significant rate of increase of the volume or market penetration of imports of the subject merchandise indicating the likelihood of substantially increased imports,
(IV) whether imports of the subject merchandise are entering at prices that are likely to have a significant depressing or suppressing effect on domestic prices, and are likely to increase demand for further imports,
1 Section 771(7)(F)(ii) of the Act (19 U.S.C. § 1677(7)(F)(ii)) provides that “The Commission shall consider {these factors} . . . as a whole in making a determination of whether further dumped or subsidized imports are imminent and whether material injury by reason of imports would occur unless an order is issued or a suspension agreement is accepted under this title. The presence or absence of any factor which the Commission is required to consider . . . shall not necessarily give decisive guidance with respect to the determination. Such a determination may not be made on the basis of mere conjecture or supposition.”

VII-2
(V) inventories of the subject merchandise,
(VI) the potential for product-shifting if production facilities in the foreign country, which can be used to produce the subject merchandise, are currently being used to produce other products,
(VII) in any investigation under this title which involves imports of both a raw agricultural product (within the meaning of paragraph (4)(E)(iv)) and any product processed from such raw agricultural product, the likelihood that there will be increased imports, by reason of product shifting, if there is an affirmative determination by the Commission under section 705(b)(1) or 735(b)(1) with respect to either the raw agricultural product or the processed agricultural product (but not both),
(VIII) the actual and potential negative effects on the existing development and production efforts of the domestic industry, including efforts to develop a derivative or more advanced version of the domestic like product, and
(IX) any other demonstrable adverse trends that indicate the probability that there is likely to be material injury by reason of imports (or sale for importation) of the subject merchandise (whether or not it is actually being imported at the time).2
Information on the nature of the alleged subsidies was presented earlier in this report; information on the volume and pricing of imports of the subject merchandise is presented in Parts IV and V; and information on the effects of imports of the subject merchandise on U.S. producers’ existing development and production efforts is presented in Part VI. Information on inventories of the subject merchandise; foreign producers’ operations, including the potential for “product-shifting;” any other threat indicators, if applicable; and any dumping in third-country markets, follows.3 Also presented in this section of the report is information obtained for consideration by the Commission on nonsubject countries.
2 Section 771(7)(F)(iii) of the Act (19 U.S.C. § 1677(7)(F)(iii)) further provides that, in antidumping investigations, “. . . the Commission shall consider whether dumping in the markets of foreign countries (as evidenced by dumping findings or antidumping remedies in other WTO member markets against the same class or kind of merchandise manufactured or exported by the same party as under investigation) suggests a threat of material injury to the domestic industry.”
3 Staff calculated industry coverage in the subject countries by comparing the responding mills’ cold-rolling capacity as estimated by *** to ***’s estimate for total cold-rolled steel capacity in each country. Staff notes that the country-wide and mill-specific estimates aligned more closely with reported data for some industries than for others. ***’s estimates of cold-rolling capacity in the subject countries are as
(continued...)
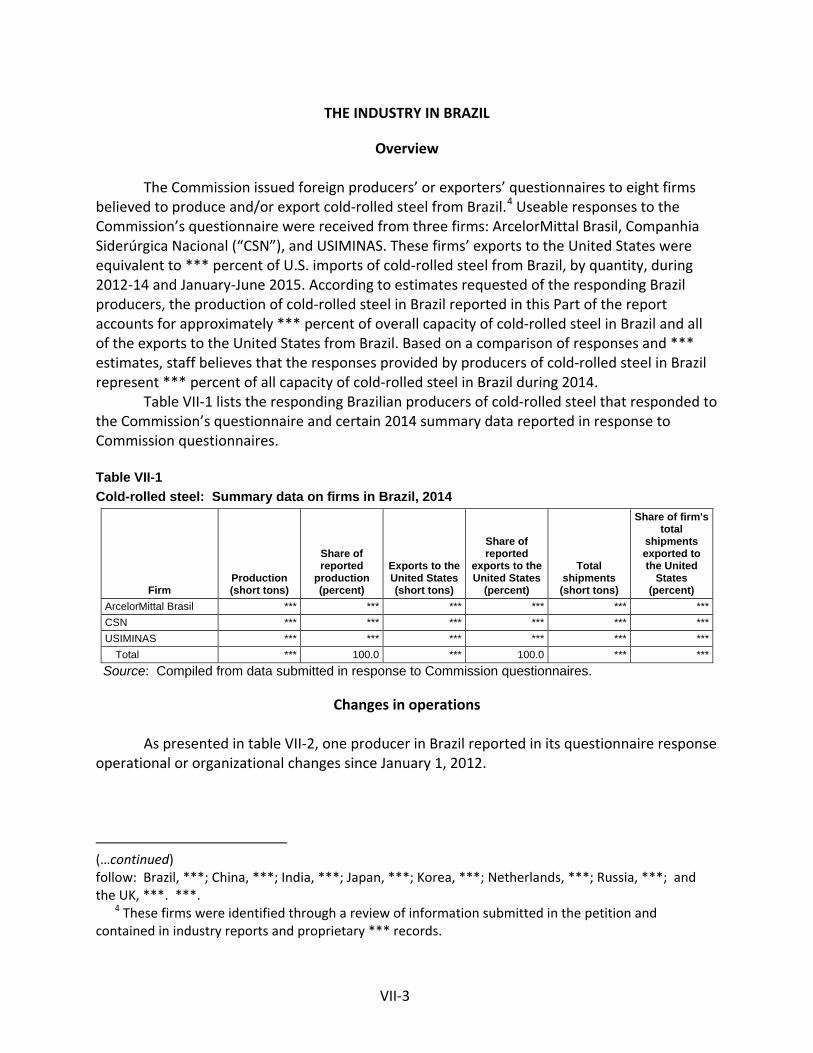
VII-3
THE INDUSTRY IN BRAZIL
Overview
The Commission issued foreign producers’ or exporters’ questionnaires to eight firms believed to produce and/or export cold-rolled steel from Brazil.4 Useable responses to the Commission’s questionnaire were received from three firms: ArcelorMittal Brasil, Companhia Siderúrgica Nacional (“CSN”), and USIMINAS. These firms’ exports to the United States were equivalent to *** percent of U.S. imports of cold-rolled steel from Brazil, by quantity, during 2012-14 and January-June 2015. According to estimates requested of the responding Brazil producers, the production of cold-rolled steel in Brazil reported in this Part of the report accounts for approximately *** percent of overall capacity of cold-rolled steel in Brazil and all of the exports to the United States from Brazil. Based on a comparison of responses and *** estimates, staff believes that the responses provided by producers of cold-rolled steel in Brazil represent *** percent of all capacity of cold-rolled steel in Brazil during 2014.
Table VII-1 lists the responding Brazilian producers of cold-rolled steel that responded to the Commission’s questionnaire and certain 2014 summary data reported in response to Commission questionnaires.
Table VII-1 Cold-rolled steel: Summary data on firms in Brazil, 2014
Firm Production (short tons)
Share of reported
production (percent)
Exports to the United States (short tons)
Share of reported
exports to the United States
(percent)
Total shipments
(short tons)
Share of firm's total
shipments exported to the United
States (percent)
ArcelorMittal Brasil *** *** *** *** *** *** CSN *** *** *** *** *** *** USIMINAS *** *** *** *** *** ***
Total *** 100.0 *** 100.0 *** *** Source: Compiled from data submitted in response to Commission questionnaires.
Changes in operations
As presented in table VII-2, one producer in Brazil reported in its questionnaire response operational or organizational changes since January 1, 2012.
(…continued) follow: Brazil, ***; China, ***; India, ***; Japan, ***; Korea, ***; Netherlands, ***; Russia, ***; and the UK, ***. ***.
4 These firms were identified through a review of information submitted in the petition and contained in industry reports and proprietary *** records.

VII-4
Table VII-2 Cold-rolled steel: Reported changes in operations by firms in Brazil
* * * * * * *
Operations on cold-rolled steel
Table VII-3 presents information on the cold-rolled steel operations of the responding producers and exporters in Brazil. Brazilian capacity increased by *** percent between 2012-14, while production declined by *** percent over the same period. Home market shipments and exports to all other markets declined by *** percent and by *** percent, respectively, while exports to the United States increased by *** percent between 2012 and 2014. Home markets shipments were lower while exports to both the United States and all other markets were higher in interim 2015 compared with interim 2014.
Home market sales accounted for the majority of total shipments by Brazilian producers, declined by *** percent in 2012 to *** percent in 2014, and were *** percentage points lower in interim 2015 compared with interim 2014. Exports to the United States, as a share of total shipments, increased from *** percent in 2012 to *** percent in 2014, and was *** percent in interim 2015 and *** percent in interim 2014. Exports to markets other than the United States declined from *** percent in 2012 to *** percent in 2014.5
5 ***. Brazilian respondents noted that ArcelorMittal enforces a corporate policy that constrains exports to the United States from its Brazilian facility. In other proceedings, ArcelorMittal has stated that as a commercial policy the chief commercial officer in a region (such as the United States) has the control over any product that would be coming in from any of its affiliates, from a pricing and availability standpoint. Conference transcript, p. 191 (Lewis), and conference on Certain Hot-Rolled Steel Flat Products from Australia, Brazil, Japan, Korea, the Netherlands, Turkey, and the United Kingdom transcript, p 116 (Mull).

VII-5
Table VII-3 Cold-rolled steel: Data for producers in Brazil, 2012-14, January-June 2014, and January-June 2015
* * * * * * *
Alternative products
As shown in table VII-4, slightly less than half of the reported production on the same equipment as used in the production of cold-rolled steel by producers in Brazil is subject merchandise. *** reported producing hot-rolled steel and *** reported production of other products, namely slabs, non-oriented electrical steel, and nonsubject cold-rolled steel.6 Table VII-4 Cold-rolled steel: Brazil producers' overall capacity and production on the same equipment as subject production, 2012-14, January-June 2014, and January-June 2015
* * * * * * *
Exports
According to Global Trade Atlas (“GTA”), the top export market for cold-rolled steel from Brazil are largely South American countries (table VII-5). In 2014, the United States became the largest export destination for the Brazilian product (46.1 percent), followed by Columbia, the largest export destination in 2012 and 2013.
6 *** reported total production greater than overall production capacity and allocated all of its capacity to cold-rolled steel. As the firm did not respond to inquiries regarding the overcapacity utilization, Staff used overall capacity as reported by the *** in the proceeding on Hot-Rolled Steel Flat Products from Australia, Brazil, Japan, Korea, the Netherlands, Turkey, and the United Kingdom (Inv. Nos. 701-TA-545-547 and 731-TA-1291-1297).

VII-6
Table VII-5 Cold-rolled steel: Total exports from Brazil to top destination markets and the United States, 2012-14
Destination Calendar year
2012 2013 2014 Quantity (short tons) Brazil's exports to the United States 58,554 33,332 113,299 Brazil's exports to other top destination markets.-- Colombia 108,173 40,731 49,499
Venezuela 36,592 26,203 30,576 Chile 36,877 38,932 19,854 Argentina 18,274 17,683 17,934 Taiwan 2,070 5,433 3,249 Costa Rica 1,557 2,972 2,908 Germany 16,107 1,323 2,299 Mexico 2,198 3,031 2,006 Bolivia 3,663 822 1,160
All other destination markets 28,438 9,491 3,061 Total Brazil exports 312,503 179,952 245,844
Share of quantity (percent) Brazil's exports to the United States 18.7 18.5 46.1 Brazil's exports to other top destination markets.-- Colombia 34.6 22.6 20.1
Venezuela 11.7 14.6 12.4 Chile 11.8 21.6 8.1 Argentina 5.8 9.8 7.3 Taiwan 0.7 3.0 1.3 Costa Rica 0.5 1.7 1.2 Germany 5.2 0.7 0.9 Mexico 0.7 1.7 0.8 Bolivia 1.2 0.5 0.5
All other destination markets 9.1 5.3 1.2 Total Brazil exports 100.0 100.0 100.0
Source: Official exports statistics as reported by SECEX – Foreign Trade Secretariat (Brazil) in the GTIS/GTA database using HTS subheadings 7209.15, 7209.16, 7209.17, 7209.25, 7209.26, 7209.27, 7209.28 ,7209.90, 7210.70, 7211.23, 7211.29, 7211.90, 7212.40, 7219.18, 7225.50, and 7226.92 accessed August 6, 2015.

VII-7
THE INDUSTRY IN CHINA
Overview
The Commission issued foreign producers’ or exporters’ questionnaires to 235 firms believed to produce and/or export cold-rolled steel from China.7 No useable responses to the Commission’s questionnaire were received from any firms.
China, the world’s largest cold-rolled steel producer has a production capacity of about *** short tons with about *** entities producing cold-rolled steel. The great majority of firms have ***. The 10 largest firms accounted for *** percent of cold-rolled capacity in 2014 China (table IV-6). *** has the largest cold-rolled steel capacity which is about *** percent larger than the second largest company ***. Total capacity in China *** short tons (*** percent) during 2012-14 with the top 10 companies accounting for *** percent of the ***. While capacity at *** *** during 2012-14, several of the top ten companies had *** with *** out of top ten ***; ***. Table VII-6 Cold-rolled steel: Capacity of 10 top firms in China, 2012-14
* * * * * * *
Data on production and consumption in China are presented in table VII-7. During 2012-
14, production of cold-rolled steel ***, gross consumption increased by *** and net consumption increased by ***. The *** in gross consumption compared with net consumption indicates that consumption of downstream products such as coated sheet steel is *** that that of cold-rolled steel and that demand for cold-rolled steel was *** during the 2012-14 period. Downstream processing accounted for *** percent of gross consumption in 2012, *** percent in 2013, and *** percent in 2014. Table VII-7 Cold-rolled steel: Production and consumption in China, 2012-14
* * * * * * *
Exports
According to GTA, the top export market for cold-rolled steel from China is Korea (table VII-8). During 2014, Korea was the top export market for cold-rolled steel from China, accounting for 20.3 percent, followed by the United States, accounting for 8.7 percent.
7 These firms were identified through a review of information submitted in the petition and contained in industry reports and proprietary *** records.

VII-8
Table VII-8 Cold-rolled steel: Total exports from China to top destination markets and the United States, 2012-14
Destination Calendar year
2012 2013 2014 Quantity (short tons) China's exports to the United States 400,490 362,299 1,035,348 China's exports to other top destination markets.-- Korea 2,171,118 1,674,431 2,420,045
Brazil 374,162 368,970 526,154 Belgium 380,910 337,038 522,007 India 370,688 201,707 485,098 Philippines 255,281 356,434 419,567 Russia 467,821 367,319 412,583 Vietnam 181,672 263,738 285,174 Colombia 128,226 181,760 269,889 Saudi Arabia 134,862 125,393 264,338
All other destination markets 4,203,586 3,973,380 5,253,152 Total China exports 9,068,816 8,212,468 11,893,356
Share of quantity (percent) China's exports to the United States 4.4 4.4 8.7 China's exports to other top destination markets.-- Korea 23.9 20.4 20.3
Brazil 4.1 4.5 4.4 Belgium 4.2 4.1 4.4 India 4.1 2.5 4.1 Philippines 2.8 4.3 3.5 Russia 5.2 4.5 3.5 Vietnam 2.0 3.2 2.4 Colombia 1.4 2.2 2.3 Saudi Arabia 1.5 1.5 2.2
All other destination markets 46.4 48.4 44.2 Total China exports 100.0 100.0 100.0
Source: Official exports statistics as reported by China Customs in the GTIS/GTA database using HTS subheadings 7209.15, 7209.16, 7209.17, 7209.25, 7209.26, 7209.27, 7209.28, 7209.90, 7210.70, 7211.23, 7211.29, 7211.90, 7212.40, 7219.18, 7225.50, and 7226.92 accessed August 6, 2015.

VII-9
THE INDUSTRY IN INDIA
Overview
The Commission issued foreign producers’ or exporters’ questionnaires to 45 firms believed to produce and/or export cold-rolled steel from India.8 Useable responses to the Commission’s questionnaire were received from one firm: JSW Steel. These firms’ exports to the United States were equivalent to *** percent of U.S. imports of cold-rolled steel from India, by quantity, during 2012-14 and January-June 2015. According to estimates requested of the responding India producer, the production of cold-rolled steel in India reported in this Part of the report accounts for approximately *** percent of overall production of cold-rolled steel in India and *** percent of the exports to the United States from India. Based on a comparison of responses and *** estimates, staff believes that the responses provided by producers of cold-rolled steel in India represent *** percent of all capacity of cold-rolled steel in India during 2014.
Table VII-9 lists the responding Indian producer of cold-rolled steel that responded to the Commission’s questionnaire and certain 2014 summary data reported in response to Commission questionnaires.
Table VII-9 Cold-rolled steel: Summary data on firms in India, 2014
* * * * * * *
Changes in operations
As presented in table VII-10, JSW Steel reported in its questionnaire responses several operational or organizational changes since January 1, 2012
Table VII-10 Cold-rolled steel: Reported changes in operations by firms in India
* * * * * * *
Operations on cold-rolled steel
Table VII-11 presents information on the cold-rolled steel operations of the responding Indian producer, JSW Steel. JSW Steel’s capacity, production, home market shipments, exports to United States, and exports to all other markets increased from 2012 to 2014, and were higher in interim 2015 compared with interim 2014.
8 These firms were identified through a review of information submitted in the petition and contained in industry reports and proprietary *** records.

VII-10
Table VII-11 Cold-rolled steel: Data for producers in India, 2012-14, January-June 2014, and January-June 2015
* * * * * * *
JSW Steel’s cold-rolled steel capacity increased by *** percent between 2012 and 2014
and was *** higher in interim 2015 compared with 2014, but is projected to *** in 2015 and 2016. JSW Steel ***. In addition, ***.9 Similarly, production increased by *** percent from 2012 to 2014, and was *** percent higher in interim 2015 compare with interim 2014, and is projected to increase *** and *** percent in 2015 and 2016. Production did not increase as quickly as capacity, resulting in declining capacity utilization from *** percent in 2012 to *** percent in 2014.
While home markets shipments, both internal consumption/transfers to related firms and commercial shipments, increased *** in terms of volume, the share of total shipments represented by home market shipments (due to ***) declined *** percentage points from 2012 to 2014. In contrast, exports to the United States, ***, increased by *** percentage points, and exports to all other markets increased by *** percentage points over the same period. JSW reported that this increase in exports to the United States was due to ***. The projected decline in exports to the United States in 2015 and 2016 is due to ***.10
Alternative products
As shown in table VII-12, *** reported cold-rolled steel production by JSW Steel is subject merchandise.
Table VII-12 Cold-rolled steel: India producers' overall capacity and production on the same equipment as subject production, 2012-14, January-June 2014, and January-June 2015
* * * * * * *
Exports
According to GTA, the top export market for cold-rolled steel from India are largely European countries (table VII-13). During 2014, the United States was the largest export destination for India cold-rolled steel, accounting for 14.3 percent of total exports, followed by Italy, accounting for 12.1 percent, and Spain, accounting for 8.3 percent.
9 Email from ***, August 26, 2015. 10 Email from ***, August 26, 2015.

VII-11
Table VII-13 Cold-rolled steel: Total exports from India to top destination markets and the United States, 2012-14
Destination Calendar year
2012 2013 2014 Quantity (short tons) India's exports to the United States 30,394 50,336 116,525 India's exports to other top destination markets.-- Italy 27,411 70,063 98,554
Spain 5,189 23,597 67,333 United Arab Emirates 27,612 79,615 65,109 Belgium 34,086 59,183 49,157 Thailand 12,580 42,330 46,951 Poland 721 11,505 41,429 Romania 8,471 19,634 31,817 Sri Lanka 14,611 22,135 29,153 Portugal 5,564 4,392 28,708
All other destination markets 237,124 304,643 238,760 Total India exports 403,764 687,433 813,497
Share of quantity (percent) India's exports to the United States 7.5 7.3 14.3 India's exports to other top destination markets.-- Italy 6.8 10.2 12.1
Spain 1.3 3.4 8.3 United Arab Emirates 6.8 11.6 8.0 Belgium 8.4 8.6 6.0 Thailand 3.1 6.2 5.8 Poland 0.2 1.7 5.1 Romania 2.1 2.9 3.9 Sri Lanka 3.6 3.2 3.6 Portugal 1.4 0.6 3.5
All other destination markets 58.7 44.3 29.3 Total India exports 100.0 100.0 100.0
Source: Official exports statistics as reported by Ministry of Commerce (India) in the GTIS/GTA database using HTS subheadings 7209.15, 7209.16, 7209.17, 7209.25, 7209.26, 7209.27, 7209.28, 7209.90, 7210.70, 7211.23, 7211.29, 7211.90, 7212.40, 7219.18, 7225.50, and 7226.92 accessed August 6, 2015.

VII-12
THE INDUSTRY IN JAPAN
Overview
The Commission issued foreign producers’ or exporters’ questionnaires to 14 firms believed to produce and/or export cold-rolled steel from Japan.11 Useable responses to the Commission’s questionnaire were received from five firms: Hitachi Metals, JFE Steel, Kobe Steel, Nisshin Steel, and Nippon Steel & Sumitomo Metal Corporation (“NSSMC”). These firms’ exports to the United States were equivalent to *** percent of U.S. imports of cold-rolled steel from Japan, by quantity, during 2012-14 and January-June 2015. According to estimates requested of the responding Japan producers, the production of cold-rolled steel in Japan reported in this Part of the report accounts for approximately 89 percent of overall production of cold-rolled steel in Japan and 74 percent of the exports to the United States from Japan. Based on a comparison of responses and *** estimates, staff believes that the responses provided by producers of cold-rolled steel in Japan represent *** percent of all capacity of cold-rolled steel in Japan during 2014.
Table VII-14 lists the responding Japanese producers of cold-rolled steel that responded to the Commission’s questionnaire and certain 2014 summary data reported in response to Commission questionnaires.
Table VII-14 Cold-rolled steel: Summary data on firms in Japan, 2014
Firm Production (short tons)
Share of reported
production (percent)
Exports to the United
States (short tons)
Share of reported
exports to the United States
(percent)
Total shipments (short tons)
Share of firm's total shipments exported to the United
States (percent)
Hitachi Metals *** *** *** *** *** *** JFE Steel *** *** *** *** *** *** Kobe Steel *** *** *** *** *** *** Nisshin Steel *** *** *** *** *** *** NSSMC *** *** *** *** *** ***
Total 22,472,815 100.0 107,536 100.0 *** *** Source: Compiled from data submitted in response to Commission questionnaires.
11 These firms were identified through a review of information submitted in the petition and contained in industry reports and proprietary *** records.

VII-13
Changes in operations
As presented in table VII-15, one Japanese producer reported in its questionnaire response operational or organizational changes since January 1, 2012. Table VII-15 Cold-rolled steel: Reported changes in operations by firms in Japan
* * * * * * *
Operations on cold-rolled steel
Table VII-16 presents information on the cold-rolled steel operations of the responding producers and exporters in Japan. Japanese production, capacity utilization, inventories, home market commercial shipments increased from 2012 to 2014, whereas capacity, internal consumption, exports to the United States, and exports to other markets declined. Inventories and exports to the United States were higher in interim 2015 compared with interim 2014, whereas capacity, production, internal consumption, home market commercial shipments, and exports to all other markets were lower.
Home market shipments, mainly internal consumption/transfers to related parties, accounted for *** percent to total shipments by the producers in Japan during 2014 and exports to markets other than the United States accounted for *** percent, while exports to the United States accounted for the remaining *** percent. These shares of total shipments are projected to remain roughly the same in 2015 and 2016. Exports to United States were primarily by ***. *** which represented ***, reported that the firm’s trend in exports follow trends in U.S. demand.

VII-14
Table VII-16 Cold-rolled steel: Data for producers in Japan, 2012-14, January-June 2014, and January-June 2015
Item
Actual experience Projections Calendar year January - June Calendar year
2012 2013 2014 2014 2015 2015 2016 Quantity (short tons) Capacity 27,709,680 26,715,294 26,449,793 13,309,289 12,671,787 25,178,790 24,945,659 Production 22,366,085 22,298,039 22,472,815 11,522,060 10,546,384 21,546,802 21,598,834 End-of-period inventories 538,188 566,492 583,526 564,723 609,833 596,466 651,466 Shipments: Home market shipments: Internal consumption/ transfers 13,381,889 13,214,733 13,224,412 6,839,096 6,245,719 12,795,755 12,866,928
Commercial shipments 4,861,262 4,783,828 5,406,490 2,723,272 2,486,737 5,089,177 5,059,177 Subtotal, home market
shipments 18,243,151 17,998,561 18,630,902 9,562,368 8,732,456 17,884,932 17,926,105 Export shipments to:
United States 117,942 97,005 107,536 54,294 74,579 108,166 98,466 All other markets *** *** *** *** *** *** ***
Total exports *** *** *** *** *** *** *** Total shipments *** *** *** *** *** *** ***
Ratios and shares (percent) Capacity utilization 80.7 83.5 85.0 86.6 83.2 85.6 86.6 Inventories/production 2.4 2.5 2.6 2.5 2.9 2.8 3.0 Inventories/total shipments *** *** *** *** *** *** *** Share of shipments: Home market shipments: Internal consumption/ transfers *** *** *** *** *** *** ***
Commercial shipments *** *** *** *** *** *** *** Subtotal, home market
shipments *** *** *** *** *** *** *** Export shipments to:
United States *** *** *** *** *** *** *** All other markets *** *** *** *** *** *** ***
Total exports *** *** *** *** *** *** *** Total shipments *** *** *** *** *** *** ***
Source: Compiled from data submitted in response to Commission questionnaires.
Alternative products
As shown in table VII-17, the vast majority reported cold-rolled steel production by Japan producers is subject merchandise. *** produced other products, namely ***.
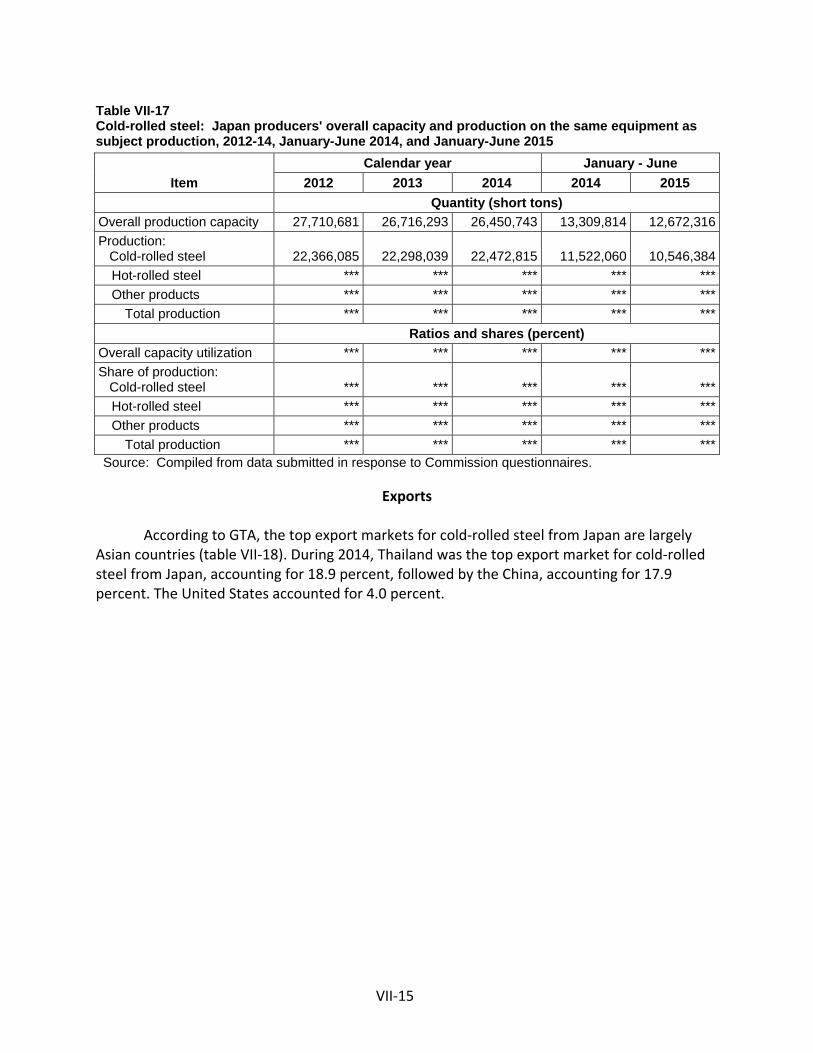
VII-15
Table VII-17 Cold-rolled steel: Japan producers' overall capacity and production on the same equipment as subject production, 2012-14, January-June 2014, and January-June 2015
Item Calendar year January - June
2012 2013 2014 2014 2015 Quantity (short tons) Overall production capacity 27,710,681 26,716,293 26,450,743 13,309,814 12,672,316 Production: Cold-rolled steel 22,366,085 22,298,039 22,472,815 11,522,060 10,546,384
Hot-rolled steel *** *** *** *** *** Other products *** *** *** *** ***
Total production *** *** *** *** *** Ratios and shares (percent) Overall capacity utilization *** *** *** *** *** Share of production: Cold-rolled steel *** *** *** *** ***
Hot-rolled steel *** *** *** *** *** Other products *** *** *** *** ***
Total production *** *** *** *** *** Source: Compiled from data submitted in response to Commission questionnaires.
Exports
According to GTA, the top export markets for cold-rolled steel from Japan are largely Asian countries (table VII-18). During 2014, Thailand was the top export market for cold-rolled steel from Japan, accounting for 18.9 percent, followed by the China, accounting for 17.9 percent. The United States accounted for 4.0 percent.

VII-16
Table VII-18 Cold-rolled steel: Total exports from Japan to top destination markets and the United States, 2012-14
Destination Calendar year
2012 2013 2014 Quantity (short tons) Japan's exports to the United States 103,343 120,546 118,661 Japan's exports to other top destination markets.-- Thailand 356,881 463,220 556,264
China 840,075 671,931 525,777 Indonesia 399,208 409,294 345,141 Mexico 152,714 188,411 313,249 India 279,046 335,419 247,525 Malaysia 166,453 150,628 204,553 Vietnam 103,092 134,388 132,589 Korea 260,528 177,372 115,711 Singapore 49,678 65,104 79,605
All other destination markets 301,734 408,970 298,472 Total Japan exports 3,012,751 3,125,284 2,937,547
Share of quantity (percent) Japan's exports to the United States 3.4 3.9 4.0 Japan's exports to other top destination markets.-- Thailand 11.8 14.8 18.9
China 27.9 21.5 17.9 Indonesia 13.3 13.1 11.7 Mexico 5.1 6.0 10.7 India 9.3 10.7 8.4 Malaysia 5.5 4.8 7.0 Vietnam 3.4 4.3 4.5 Korea 8.6 5.7 3.9 Singapore 1.6 2.1 2.7
All other destination markets 10.0 13.1 10.2 Total Japan exports 100.0 100.0 100.0
Source: Official exports statistics as reported by Ministry of Finance (Japan) in the GTIS/GTA database using HTS subheadings 7209.15, 7209.16, 7209.17, 7209.25, 7209.26, 7209.27, 7209.28, 7209.90, 7210.70, 7211.23, 7211.29, 7211.90, 7212.40, 7219.18, 7225.50, and 7226.92 accessed August 6, 2015.

VII-17
THE INDUSTRY IN KOREA
Overview
The Commission issued foreign producers’ or exporters’ questionnaires to ten firms believed to produce and/or export cold-rolled steel from Korea.12 Useable responses to the Commission’s questionnaire were received from four firms: Dongbu Steel, Dongkuk Steel Mill Co., Ltd. (“Dongkuk Steel”) (merged with Union Steel on January 1, 2015),13 Hyundai Steel, and POSCO. These firms’ exports to the United States were equivalent to *** percent of U.S. imports of cold-rolled steel from Korea, by quantity, during 2012-14 and January-June 2015. According to estimates requested of the responding Korea producers, the production of cold-rolled steel in Korea reported in this Part of the report accounts for approximately *** percent of overall production of cold-rolled steel in Korea and *** of the exports to the United States from Korea. Based on a comparison of responses and *** estimates, staff believes that the responses provided by producers of cold-rolled steel in Korea represent *** percent of all capacity of cold-rolled steel in Korea during 2014.
Table VII-20 lists the responding Korean producers of cold-rolled steel that responded to the Commission’s questionnaire and certain 2014 summary data reported in response to Commission questionnaires.
Table VII-20 Cold-rolled steel: Summary data on firms in Korea, 2014
Firm Production (short tons)
Share of reported
production (percent)
Exports to the United
States (short tons)
Share of reported
exports to the United
States (percent)
Total shipments (short tons)
Share of firm's total shipments exported to the United
States (percent)
Dongbu Steel *** *** *** *** *** *** Dongkuk Steel *** *** *** *** *** *** Hyundai Steel *** *** *** *** *** *** POSCO *** *** *** *** *** ***
Total *** 100.0 *** 100.0 *** *** Source: Compiled from data submitted in response to Commission questionnaires.
12 These firms were identified through a review of information submitted in the petition and contained in industry reports and proprietary *** records.
13 “Dongkuk Steel to merge with Union Steel in January 2015,” Korea Joogang Daily, found at http://koreajoongangdaily.joins.com/news/article/Article.aspx?aid=2996011, retrieved on August 27, 2015.

VII-18
Changes in operations
As presented in table VII-21, two producers in Korea reported in their questionnaire responses several operational or organizational changes since January 1, 2012. Table VII-21 Cold-rolled steel: Reported changes in operations by firms in Korea
* * * * * * *
Operations on cold-rolled steel
Table VII-22 presents information on the cold-rolled steel operations of the responding producers and exporters in Korea. Korean capacity, production, capacity utilization, inventories, exports to the United States and exports to other market increased from 2012 to 2014, whereas internal consumption, home market commercial shipments declined. Capacity, production, capacity utilization, inventories, internal consumption, home market commercial shipments, and exports to other market were lower in interim 2015 compared with interim 2014, whereas exports to the United States were higher.
Korean producers’ capacity increased by *** percent from 2012 to 2014, largely due to ***. Capacity was *** percent lower in interim 2015 compared with interim 2014, and is projected to decline by *** percent from 2014 to 2015 and by *** percent in 2016. This decline in capacity was solely due to ***.14
Home market shipments, mainly internal consumption/transfers to related parties, accounted for *** percent to total shipments by the producers in Korea during 2014 and exports to markets other than the United States accounted for *** percent, while exports to the United States accounted for the remaining *** percent. These shares of total shipments are projected to remain roughly the same in 2015 and 2016. Exports to United States were primarily by two firms, ***. *** reported that ***.15 *** states that ***.16
14 Email from ***, August 17, 2015. 15 Email from ***, August 18, 2015. 16 Email from ***, August 17, 2015.

VII-19
Table VII-22 Cold-rolled steel: Data for producers in Korea, 2012-14, January-June 2014, and January-June 2015
* * * * * * *
Alternative products
As shown in table VII-23, the vast majority of reported cold-rolled steel production by Korea producers is subject merchandise. Two firms (***) produced hot-rolled steel, and two firms (***) produced other products (including electrolytic galvanized steel, and galvanealed steel) on the same equipment and machinery used to produce cold-rolled steel.17 Table VII-23 Cold-rolled steel: Korea producers' overall capacity and production on the same equipment as subject production, 2012-14, January-June 2014, and January-June 2015
* * * * * * *
Exports
According to GTA, the top export markets for cold-rolled steel from Korea are largely Asian countries (table VII-24). During 2014, China was the top export market for cold-rolled steel from Korea, accounting for 20.6 percent, followed by the India, accounting for 15.0 percent. The United States accounted for 3.2 percent.
17 ***, which accounted for the majority of reported production of other products, did not respond to Staff inquiries regarding this above average production of other products.

VII-20
Table VII-24 Cold-rolled steel: Total exports from Korea to top destination markets and the United States, 2012-14
Destination Calendar year
2012 2013 2014 Quantity (short tons) Korea's exports to the United States 135,876 161,897 206,925 Korea's exports to other top destination markets.-- China 1,116,156 1,322,992 1,314,751
India 683,662 739,738 960,443 Japan 759,245 763,614 813,096 Mexico 632,070 559,016 617,655 Indonesia 339,528 361,668 389,262 Thailand 235,056 304,343 283,576 Malaysia 263,651 180,490 187,093 Iran 174,147 40,224 143,830 Russia 154,606 165,860 127,091
All other destination markets 1,205,623 1,301,810 1,351,958 Total Korea exports 5,699,620 5,901,653 6,395,681
Share of quantity (percent) Korea's exports to the United States 2.4 2.7 3.2 Korea's exports to other top destination markets.-- China 19.6 22.4 20.6
India 12.0 12.5 15.0 Japan 13.3 12.9 12.7 Mexico 11.1 9.5 9.7 Indonesia 6.0 6.1 6.1 Thailand 4.1 5.2 4.4 Malaysia 4.6 3.1 2.9 Iran 3.1 0.7 2.2 Russia 2.7 2.8 2.0
All other destination markets 21.2 22.1 21.1 Total Korea exports 100.0 100.0 100.0
Source: Official exports statistics as reported by Customs and Trade Development Institution (Korea) in the GTIS/GTA database using HTS subheadings 7209.15, 7209.16, 7209.17, 7209.25, 7209.26, 7209.27, 7209.28 ,7209.90, 7210.70, 7211.23, 7211.29, 7211.90, 7212.40, 7219.18, 7225.50, and 7226.92 accessed August 6, 2015.

VII-21
THE INDUSTRY IN THE NETHERLANDS
Overview
The Commission issued foreign producers’ or exporters’ questionnaires to one firm believed to produce and/or export cold-rolled steel from the Netherlands.18 Useable responses to the Commission’s questionnaire were received from one firm: Tata Steel Ijmuiden. These firms’ exports to the United States were equivalent to *** percent of U.S. imports of cold-rolled steel from the Netherlands, by quantity, during 2012-14 and January-June 2015. According to estimates requested of the responding producer in the Netherlands, the production of cold-rolled steel in the Netherlands reported in this Part of the report accounts for *** of the overall production of cold-rolled steel in the Netherlands and *** of the exports to the United States from Netherlands. Based on a comparison of responses and *** estimates, staff believes that the responses provided by producers of cold-rolled steel in the Netherlands represent *** percent of all capacity of cold-rolled steel in the Netherlands during 2014.
Table VII-25 lists the responding the producers in the Netherlands of cold-rolled steel that responded to the Commission’s questionnaire and certain 2014 summary data reported in response to Commission questionnaires. Table VII-25 Cold-rolled steel: Summary data on Tata Steel Ijmuiden, 2014
Firm Production (short tons)
Share of reported
production (percent)
Exports to the United States (short tons)
Share of reported
exports to the United States
(percent)
Total shipments
(short tons)
Share of firm's total
shipments exported to the United
States (percent)
Tata Steel IJmuiden *** *** *** *** *** *** Total *** *** *** *** *** ***
Source: Compiled from data submitted in response to Commission questionnaires.
Changes in operations
As presented in table VII-26, Tata Steel Ijmuiden reported in its questionnaire response operational or organizational changes since January 1, 2012. Table VII-26 Cold-rolled steel: Reported changes in operations by Tata Steel Ijmuiden
* * * * * * *
18 This firm was identified through a review of information submitted in the petition and contained in industry reports and proprietary *** records.

VII-22
Operations on cold-rolled steel
Table VII-27 presents information on the cold-rolled steel operations of Tata Steel Ijmuiden. The firm’s, production, capacity utilization, internal consumption, exports to the United States, and exports to other market increased from 2012 to 2014, whereas capacity, inventories, and home market commercial shipments declined. Capacity, production, home market commercial shipments, exports to the United States, and exports to other market were higher in interim 2015 compared with interim 2014, whereas capacity utilization, inventories, internal consumption were lower.
From 2012 to 2014 Tata Steel Ijmuiden’s total shipments increased by *** percent, largely due to ***. Tata Steel Ijmuiden reported that ***. In addition, the firm contends that ***.19
Table VII-27 Cold-rolled steel: Data for Tata Steel Ijmuiden, 2012-14, January-June 2014, and January-June 2015
* * * * * * *
Alternative products
As shown in table VII-28, *** reported cold-rolled steel production by Tata Steel Ijmuiden is subject merchandise. Table VII-28 Cold-rolled steel: Tata Steel Ijmuiden's overall capacity and production on the same equipment as subject production, 2012-14, January-June 2014, and January-June 2015
* * * * * * *
Exports
According to GTA, the top export markets for cold-rolled steel from the Netherlands are largely European countries (table VII-29). During 2014, Belgium was the top export market for cold-rolled steel from the Netherlands, accounting for 44.1 percent, followed by the Germany, accounting for 23.8 percent. The United States accounted for 8.2 percent.
19 Email from ***, August 19, 2015.

VII-23
Table VII-29 Cold-rolled steel: Total exports from the Netherlands to top destination markets and the United States, 2012-14
Destination Calendar year
2012 2013 2014 Quantity (short tons) Netherlands's exports to the United States 75,270 95,478 127,617 Netherlands's exports to other top destination markets.-- Belgium 623,426 649,060 689,760
Germany 265,675 340,553 371,755 France 48,578 58,401 57,976 Sweden 37,335 34,811 39,158 Turkey 20,449 19,094 27,559 Spain 20,526 30,723 27,235 India 8,023 11,769 25,978 Switzerland 26,627 25,706 23,592 United Kingdom 25,476 22,801 22,871
All other destination markets 182,020 131,319 150,846 Total Netherlands exports 1,333,405 1,419,714 1,564,347
Share of quantity (percent) Netherlands's exports to the United States 5.6 6.7 8.2 Netherlands's exports to other top destination markets.-- Belgium 46.8 45.7 44.1
Germany 19.9 24.0 23.8 France 3.6 4.1 3.7 Sweden 2.8 2.5 2.5 Turkey 1.5 1.3 1.8 Spain 1.5 2.2 1.7 India 0.6 0.8 1.7 Switzerland 2.0 1.8 1.5 United Kingdom 1.9 1.6 1.5
All other destination markets 13.7 9.2 9.6 Total Netherlands exports 100.0 100.0 100.0
Source: Official exports statistics as reported by Eurostat (European Union--Netherlands) in the GTIS/GTA database using HTS subheadings 7209.15, 7209.16, 7209.17, 7209.25, 7209.26, 7209.27, 7209.28 ,7209.90, 7210.70, 7211.23, 7211.29, 7211.90, 7212.40, 7219.18, 7225.50, and 7226.92 accessed August 6, 2015.
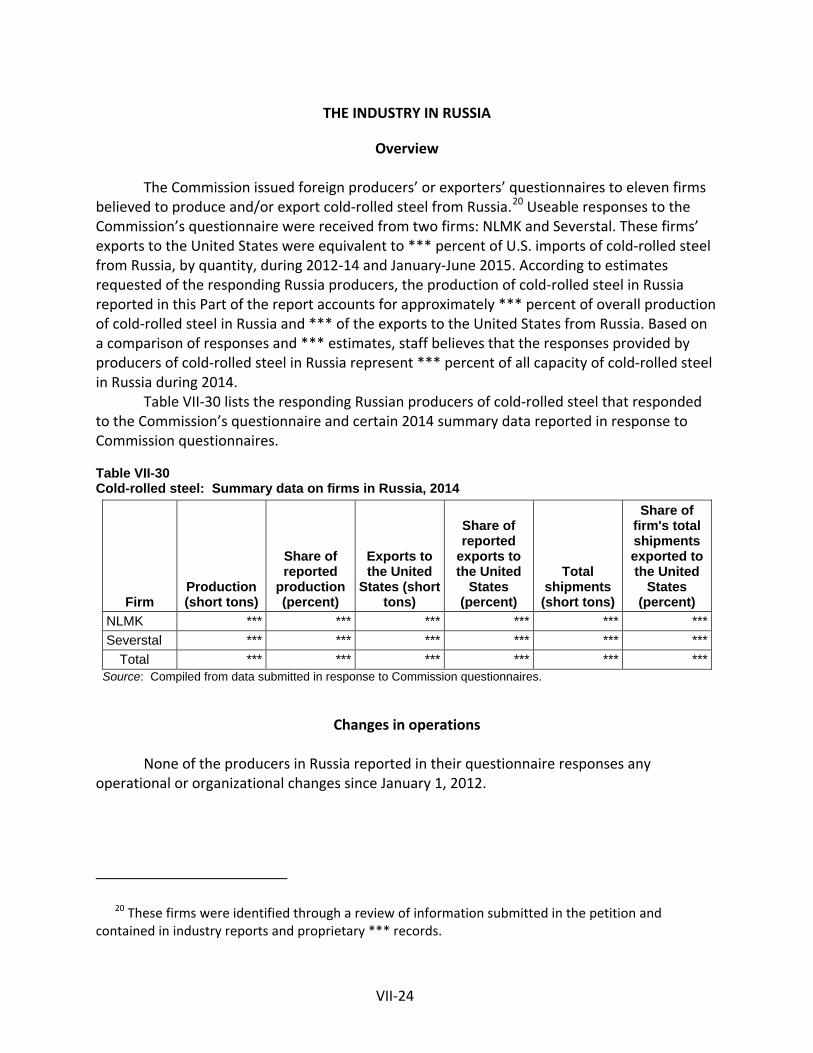
VII-24
THE INDUSTRY IN RUSSIA
Overview
The Commission issued foreign producers’ or exporters’ questionnaires to eleven firms believed to produce and/or export cold-rolled steel from Russia.20 Useable responses to the Commission’s questionnaire were received from two firms: NLMK and Severstal. These firms’ exports to the United States were equivalent to *** percent of U.S. imports of cold-rolled steel from Russia, by quantity, during 2012-14 and January-June 2015. According to estimates requested of the responding Russia producers, the production of cold-rolled steel in Russia reported in this Part of the report accounts for approximately *** percent of overall production of cold-rolled steel in Russia and *** of the exports to the United States from Russia. Based on a comparison of responses and *** estimates, staff believes that the responses provided by producers of cold-rolled steel in Russia represent *** percent of all capacity of cold-rolled steel in Russia during 2014.
Table VII-30 lists the responding Russian producers of cold-rolled steel that responded to the Commission’s questionnaire and certain 2014 summary data reported in response to Commission questionnaires.
Table VII-30 Cold-rolled steel: Summary data on firms in Russia, 2014
Firm Production (short tons)
Share of reported
production (percent)
Exports to the United
States (short tons)
Share of reported
exports to the United
States (percent)
Total shipments (short tons)
Share of firm's total shipments exported to the United
States (percent)
NLMK *** *** *** *** *** *** Severstal *** *** *** *** *** ***
Total *** *** *** *** *** *** Source: Compiled from data submitted in response to Commission questionnaires.
Changes in operations
None of the producers in Russia reported in their questionnaire responses any operational or organizational changes since January 1, 2012.
20 These firms were identified through a review of information submitted in the petition and contained in industry reports and proprietary *** records.

VII-25
Operations on cold-rolled steel
Table VII-31 presents information on the cold-rolled steel operations of the responding producers and exporters in Russia. Russian producers’ capacity, production, exports to the United States, and exports to other market increased from 2012 to 2014, whereas capacity utilization, inventories, internal consumption, and home market commercial shipments declined. Capacity, inventories, internal consumption, and exports to other market were higher in interim 2015 compared with interim 2014, whereas production, capacity utilization, home market commercial shipments, and exports to the United States were lower.
Capacity and production of cold-rolled steel in Russia increased by *** and *** percent, respectively, from 2012 to 2014, and production was projected to increase by *** and *** percent in 2015 and 2016, respectively. Home market shipments, which accounted for *** percent in 2014, declined by *** percent from 2012 to 2014, and were projected to decline by *** percent in 2015 and increase by *** percent in 2016. Exports to markets other than the United States, which accounted for *** percent in 2014, increased by *** percent from 2012 to 2014, and are projected to increase by *** percent in 2015 and by *** percent in 2016. Exports to the United States increased from *** in 2012 to accounting for *** percent of total shipments in 2014, and are projected to decline by *** percent in 2015 and by *** percent in 2016. *** stated that ***. The firm noted that ***.21 *** stated that ***.22 Table VII-31 Cold-rolled steel: Data for producers in Russia, 2012-14, January-June 2014, and January-June 2015
* * * * * * *
Alternative products
As shown in table VII-32, approximately *** of the reported cold-rolled steel production by the producers in Russia is subject merchandise. One firm, *** produced other products on the same equipment and machinery used to produce cold-rolled steel.23 Table VII-32 Russia Cold-rolled steel: Russia producers' overall capacity and production on the same equipment as subject production, 2012-14, January-June 2014, and January-June 2015
* * * * * * *
21 Email from ***, August 18, 2015. 22 Email from ***, August 19, 2015. 23 These products included ***.

VII-26
Exports
According to GTA, the top export markets for cold-rolled steel from Russia are largely European countries (table VII-33). During 2014, Turkey was the top export market for cold-rolled steel from Russia, accounting for 27.5 percent, followed by Germany, accounting for 13.1 percent, and Belarus, accounting for 12.9 percent. The United States accounted for 2.3 percent. Table VII-34 Cold-rolled steel: Total exports from Russia to top destination markets and the United States, 2012-14
Destination Calendar year
2012 2013 2014 Quantity (short tons) Russia's exports to the United States 1,237 440 48,023 Russia's exports to other top destination markets.-- Turkey 189,457 241,600 565,209
Germany 192,473 272,407 269,681 Belarus 0 281,862 265,169 Poland 97,108 100,362 102,463 Latvia 59,841 83,210 99,083 Uzbekistan 115,971 96,056 88,834 Italy 352,532 415,603 87,699 Ukraine 82,826 93,786 85,745 Brazil 58,230 29,927 81,605
All other destination markets 301,976 339,928 364,420 Total Russia exports 1,451,651 1,955,179 2,057,930
Share of quantity (percent) Russia's exports to the United States 0.1 0.0 2.3 Russia's exports to other top destination markets.-- Turkey 13.1 12.4 27.5
Germany 13.3 13.9 13.1 Belarus 0.0 14.4 12.9 Poland 6.7 5.1 5.0 Latvia 4.1 4.3 4.8 Uzbekistan 8.0 4.9 4.3 Italy 24.3 21.3 4.3 Ukraine 5.7 4.8 4.2 Brazil 4.0 1.5 4.0
All other destination markets 20.8 17.4 17.7 Total Russia exports 100.0 100.0 100.0
Source: Official exports statistics as reported by Customs Committee (Russia) in the GTIS/GTA database using HTS subheadings 7209.15, 7209.16, 7209.17, 7209.25, 7209.26, 7209.27, 7209.28 ,7209.90, 7210.70, 7211.23, 7211.29, 7211.90, 7212.40, 7219.18, 7225.50, and 7226.92 accessed August 6, 2015.

VII-27
THE INDUSTRY IN THE UNITED KINGDOM
Overview
The Commission issued foreign producers’ or exporters’ questionnaires to seven firms believed to produce and/or export cold-rolled steel from the United Kingdom.24 Useable responses to the Commission’s questionnaire were received from one firm: Tata Steel UK. These firms’ exports to the United States were equivalent to *** percent of U.S. imports of cold-rolled steel from the United Kingdom, by quantity, during 2012-14 and January-June 2015. According to estimates requested of the responding the United Kingdom producers, the production of cold-rolled steel in the United Kingdom reported in this Part of the report accounts for approximately *** percent of overall production of cold-rolled steel in the United Kingdom and *** percent of the exports to the United States from United Kingdom. Based on a comparison of responses and *** estimates, staff believes that the responses provided by producers of cold-rolled steel in the United Kingdom represent *** percent of all capacity of cold-rolled steel in the United Kingdom during 2014.
Table VII-35 lists the responding the producer in the United Kingdom of cold-rolled steel that responded to the Commission’s questionnaire and certain 2014 summary data reported in response to Commission questionnaires. Table VII-35 Cold-rolled steel: Summary data on firms in the United Kingdom, 2014
Firm Production (short tons)
Share of reported
production (percent)
Exports to the United
States (short tons)
Share of reported
exports to the United States
(percent)
Total shipments
(short tons)
Share of firm's total shipments exported to the United States
(percent) Tata Steel UK *** *** *** *** *** ***
Total *** *** *** *** *** *** Source: Compiled from data submitted in response to Commission questionnaires.
Changes in operations
As presented in table VII-36, Tata Steel UK reported in its questionnaire response operational or organizational changes since January 1, 2012.
Table VII-36 Cold-rolled steel: Reported changes in operations by Tata Steel UK
* * * * * * *
24 These firms were identified through a review of information submitted in the petition and contained in industry reports and proprietary *** records.

VII-28
Operations on cold-rolled steel
Table VII-37 presents information on the cold-rolled steel operations of Tata Steel UK. Tata Steel UK’s production, capacity utilization, inventories, internal consumption, exports to the United States, and exports to other market increased from 2012 to 2014, whereas capacity and home market commercial shipments declined. Capacity and exports to the United States were higher in interim 2015 compared with interim 2014, whereas production, capacity utilization, inventories, internal consumption, home market commercial shipments, and exports to other market production were lower.
Table VII-37 Cold-rolled steel: Data for Tata Steel UK, 2012-14, January-June 2014, and January-June 2015
* * * * * * *
Tata Steel UK’s production increased by *** percent from 2012 to 2014 while capacity
***, resulting in increased capacity utilization from *** percent to *** percent over the same period. Tata Steel UK ***.25
Tata Steek UK’s total shipments increased by *** percent, partially due to ***. The share of total shipments represented by home market commercial shipments declined from *** percent in 2012 to *** percent in 2014, or by *** percentage points. In contrast, exports to markets other than the United States increased by *** percentage points, from *** percent of total shipments in 2012 to *** percent in 2014, and were projected to increase *** percentage points in 2015, falling in 2016 to *** percent. This increase is primarily due to ***. Similarly, exports to the United States increased by *** percentage points, accounting for *** percent of total shipments in 2014. Tata Steel UK reported that ***. Exports to the United States are projected to decline in 2015 due to ***.26
Alternative products
As shown in table VII-38, *** reported production by Tata Steel UK is subject merchandise. Table VII-38 Cold-rolled steel: Tata Steel UK's overall capacity and production on the same equipment as subject production, 2012-14, January-June 2014, and January-June 2015
* * * * * * *
25 Email from ***, August 19, 2015. 26 Email from ***, August 19, 2015.

VII-29
Exports
According to GTA, the top export markets for cold-rolled steel from the United Kingdom are largely European countries (table VII-39). During 2014, France was the top export market for cold-rolled steel from the United Kingdom, accounting for 22.7 percent, followed by the Netherlands, accounting for 21.1 percent. The United States accounted for 10.7 percent. Table VII-39 Cold-rolled steel: Total exports from the United Kingdom to top destination markets and the United States, 2012-14
Destination Calendar year
2012 2013 2014 Quantity (short tons) United Kingdom's exports to the United States 5,903 9,666 73,293 United Kingdom's exports to other top destination markets.-- France 96,245 157,344 155,901
Netherlands 102,405 163,120 145,083 Germany 55,143 87,001 73,271 Spain 10,754 44,684 48,717 Belgium 45,844 41,133 41,945 Ireland 37,725 32,345 33,044 Russia 15,529 18,396 15,518 Poland 10,831 22,351 15,487 Turkey 5,446 7,806 10,607
All other destination markets 67,097 61,778 73,530 Total United Kingdom exports 452,921 645,624 686,396
Share of quantity (percent) United Kingdom's exports to the United States 1.3 1.5 10.7 United Kingdom's exports to other top destination markets.-- France 21.2 24.4 22.7
Netherlands 22.6 25.3 21.1 Germany 12.2 13.5 10.7 Spain 2.4 6.9 7.1 Belgium 10.1 6.4 6.1 Ireland 8.3 5.0 4.8 Russia 3.4 2.8 2.3 Poland 2.4 3.5 2.3 Turkey 1.2 1.2 1.5
All other destination markets 14.8 9.6 10.7 Total United Kingdom exports 100.0 100.0 100.0
Source: Official exports statistics as reported by Eurostat (European Union--United Kingdom) in the GTIS/GTA database using HTS subheadings 7209.15, 7209.16, 7209.17, 7209.25, 7209.26, 7209.27, 7209.28 ,7209.90, 7210.70, 7211.23, 7211.29, 7211.90, 7212.40, 7219.18, 7225.50, and 7226.92 accessed August 6, 2015.

VII-30
THE INDUSTRIES IN THE SUBJECT COUNTRIES Table VII-40 presents information on the cold-rolled steel operations of the responding
producers and exporters in all seven responding subject countries combined for 2012-14, January-June 2014, and January-June 2015, as well as projections for 2015-16. The data reported below do not include data for the industry in China. Table VII-40 Cold-rolled steel: Data on the industry in the subject countries, 2012-14, January-June 2014, January-June 2015, and calendar year projections 2015 and 2016
Item
Actual experience Projections Calendar year January - June Calendar year
2012 2013 2014 2014 2015 2015 2016 Quantity (short tons) Capacity 71,418,526 70,753,421 73,469,164 36,741,263 35,421,332 71,231,518 70,476,253 Production 57,261,166 58,293,859 59,517,025 30,337,640 27,913,191 59,258,430 59,753,410 End-of-period inventories 1,290,877 1,371,866 1,450,792 1,428,971 1,435,136 1,419,996 1,546,768 Shipments: Home market shipments: Internal consumption/ transfers 31,827,546 32,244,013 32,549,637 16,704,206 15,134,127 32,959,201 33,021,078
Commercial shipments 14,273,056 14,253,865 14,863,347 7,515,993 7,012,287 14,525,449 14,731,261 Subtotal, home market
shipments 46,100,602 46,497,878 47,412,984 24,220,199 22,146,414 47,484,650 47,752,339 Export shipments to:
United States 350,615 353,349 772,177 296,130 384,210 675,977 479,443 All other markets 10,691,663 11,261,256 11,178,313 5,718,066 5,380,524 10,996,018 11,338,858
Total exports 11,042,278 11,614,605 11,950,490 6,014,196 5,764,734 11,671,995 11,818,301 Total shipments 57,142,880 58,112,483 59,363,474 30,234,395 27,911,148 59,156,645 59,570,640
Ratios and shares (percent) Capacity utilization 80.2 82.4 81.0 82.6 78.8 83.2 84.8 Inventories/production 2.3 2.4 2.4 2.4 2.6 2.4 2.6 Inventories/total shipments 2.3 2.4 2.4 2.4 2.6 2.4 2.6 Share of shipments: Home market shipments: Internal consumption/ transfers 55.7 55.5 54.8 55.2 54.2 55.7 55.4
Commercial shipments 25.0 24.5 25.0 24.9 25.1 24.6 24.7 Subtotal, home market
shipments 80.7 80.0 79.9 80.1 79.3 80.3 80.2 Export shipments to:
United States 0.6 0.6 1.3 1.0 1.4 1.1 0.8 All other markets 18.7 19.4 18.8 18.9 19.3 18.6 19.0
Total exports 19.3 20.0 20.1 19.9 20.7 19.7 19.8 Total shipments 100.0 100.0 100.0 100.0 100.0 100.0 100.0
Source: Compiled from data submitted in response to Commission questionnaires.

VII-31
Table VII-41 presents information on the cold-rolled steel operations of the responding producers and exporters in the responding subject countries combined, excluding data for the Netherlands, for 2012-14, January-June 2014, and January-June 2015, as well as projections for 2015-16. The data reported below do not include data for the industry in China. Table VII-41 Cold-rolled steel: Data on the industry in the subject countries excluding the Netherlands, 2012-14, January-June 2014, January-June 2015, and calendar year projections 2015 and 2016
* * * * * * *
U.S. INVENTORIES OF IMPORTED MERCHANDISE
Table VII-42 presents data on U.S. importers’ reported inventories of cold-rolled steel. Inventories of imports from each subject source, except from Japan and the Netherlands, increased from 2012 to 2014, and were higher in interim 2015 compared with interim 2014. Table VII-42 Cold-rolled steel: U.S. importers’ inventories, 2012-14, January-June 2014, and January-June 2015
* * * * * * *
U.S. IMPORTERS’ OUTSTANDING ORDERS
The Commission requested importers to indicate whether they imported or arranged for the importation of Cold-rolled steel from Brazil, China, India, Korea, and Russia after June 30, 2015. Forty-one firms reported data concerning such imports or arrangements of imports, 34 of which reported imports from the subject countries. Data concerning U.S. imports subsequent to June 30, 2015 are presented in table VII-43. Table VII-43 Cold-rolled steel: U.S. imports subsequent to June 30, 2015
* * * * * * *
ANTIDUMPING OR COUNTERVAILING DUTY ORDERS IN THIRD-COUNTRY MARKETS The Commission asked questionnaire recipients to identify whether the products
subject to this proceeding have been the subject of any other import relief proceedings in the United States or in any other countries. Information obtained from such requests are presented in table VII-44.

VII-32
Table VII-44 Cold-rolled steel: Import relief proceedings in third-country markets Export market Subject country Date/measure
European Union China Russia May 2015: AD investigation initiated.
India All countries August 2015: Increased tariff on alloy steel flat products from 7.5 percent to 10 percent and 12.5 percent on non-alloy fiat products.
Indonesia
China (13.6-43.5%) Japan (18.6 - 55,6%) Korea (10.1- 11.0%) March 2013: AD duties on non-alloy cold-rolled coil/sheet.
Indonesia All MFN countries May 2015: Increased tariffs on cold-rolled steel to 15 percent (from 7.5-10 percent).
Iran All countries
March 2015: Increased import duties on cold-rolled coils from 10 percent to 15 percent; Proposal to increase import duty to 40 percent
Mexico
China (65.99- 103.41%) Russia (15%) ***
June 2015: AD duties on cold-rolled sheet and coil products imposed against China. AD duties on cold-rolled sheet and coil against Russia since 1999. ***.
Morocco China, Japan, Netherlands, Russia, UK
May 2015: Safeguard measure on cold-rolled sheets. 22 percent duty on all imports of cold-rolled coils through Dec. 31,
2015; 20 percent during 2016; 18 percent for 2017; 16 percent for 2018; 0 percent by 2019.
Pakistan All countries January 2015: 5 percent duty on cold-rolled coils.
Russia China 2012: AD duties on cold-rolled flat steel products with polymer coating; 8-22.6 percent
Thailand China February 2014: AD duties on cold reduced carbon steel in coils and not in coils since; 9.24 – 20.11 percent
Source: Compiled from data submitted in response to Commission questionnaires; ArcelorMittal USA’s postconference brief, exh. 26.
INFORMATION ON NONSUBJECT COUNTRIES
In assessing whether the domestic industry is materially injured or threatened with material injury “by reason of subject imports,” the legislative history states “that the Commission must examine all relevant evidence, including any known factors, other than the dumped or subsidized imports, that may be injuring the domestic industry, and that the Commission must examine those other factors (including non-subject imports) ‘to ensure that it is not attributing injury from other sources to the subject imports.’”27
Table VII-45 presents data on global production. Although production increased by *** short tons (*** percent) globally during 2012-14, production did not increase in all countries. Most of the global increase during 2012-14 was accounted for by China which increased
27 Mittal Steel Point Lisas Ltd. v. United States, Slip Op. 2007-1552 at 17 (Fed. Cir. Sept. 18, 2008), quoting from Statement of Administrative Action on Uruguay Round Agreements Act, H.R. Rep. 103-316, Vol. I at 851-52; see also Bratsk Aluminum Smelter v. United States, 444 F.3d 1369 (Fed. Cir. 2006).

VII-33
production by *** short tons (*** percent). Production increased during this period for nonsubject countries other than Canada by *** short tons (*** percent) while production in Canada decreased by *** short tons (*** percent). Table VII-45 Cold-rolled steel: Production, global by country and region, 2012-14
* * * * * * *
Table VII-46 presents data on global consumption. Gross consumption increased globally
by *** short tons (*** percent). Most of the increase is accounted for by the subject countries, especially China where gross consumption increased by *** short tons (*** percent). Gross consumption in Canada decreased by *** short tons during 2012-14 but increased in the other nonsubject countries by *** short tons (*** percent). Downstream processing accounted for the larger share of gross consumption – *** percent in 2014.
Table VII-46 Cold-rolled steel: Consumption, global by country and region, 2012-14
* * * * * * *
Table VII-47 presents data on global exports of cold-rolled steel.

VII-34
Table VII-47 Cold-rolled steel: Global total exports by countries subject to this proceeding and other top exporters, 2012-14
Reporting country Calendar year
2012 2013 2014 Quantity (short tons) United States 1,354,322 1,193,031 1,072,752 Subject countries.-- Brazil 312,503 179,952 245,844
China 9,068,816 8,212,468 11,893,356 India 403,764 687,433 813,497 Japan 3,012,751 3,125,284 2,937,547 Korea 5,699,620 5,901,653 6,395,681 Netherlands 1,333,405 1,419,714 1,564,347 Russia 1,451,651 1,955,179 2,057,930 United Kingdom 452,921 645,624 686,396
Exports by subject countries 21,735,431 22,127,308 26,594,598 Other top exporting countries.-- Belgium 2,843,319 3,013,643 3,022,609
Germany 2,405,145 2,328,495 2,335,278 Taiwan 1,507,482 1,478,930 1,572,777 Italy 1,465,450 1,366,686 1,440,032 France 1,199,922 1,293,881 1,371,299 Austria 1,170,830 1,173,514 1,210,366 Ukraine 980,042 999,494 1,033,497 Slovakia 631,353 656,370 683,230 Sweden 553,019 572,810 572,365 Spain 321,729 332,328 540,452
All other exporting countries 3,717,181 3,867,573 3,678,105
Total global exports 39,885,223 40,404,061 45,127,362 Table continued on next page.
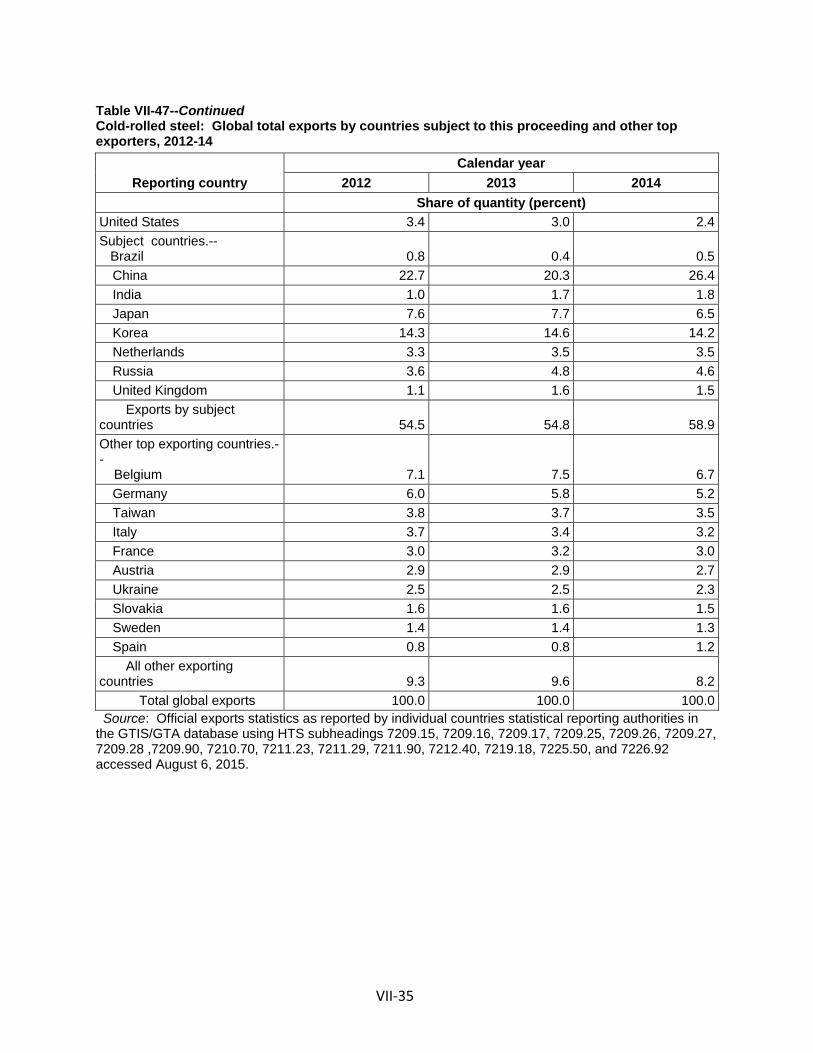
VII-35
Table VII-47--Continued Cold-rolled steel: Global total exports by countries subject to this proceeding and other top exporters, 2012-14
Reporting country Calendar year
2012 2013 2014 Share of quantity (percent) United States 3.4 3.0 2.4 Subject countries.-- Brazil 0.8 0.4 0.5
China 22.7 20.3 26.4 India 1.0 1.7 1.8 Japan 7.6 7.7 6.5 Korea 14.3 14.6 14.2 Netherlands 3.3 3.5 3.5 Russia 3.6 4.8 4.6 United Kingdom 1.1 1.6 1.5
Exports by subject countries 54.5 54.8 58.9 Other top exporting countries.-- Belgium 7.1 7.5 6.7
Germany 6.0 5.8 5.2 Taiwan 3.8 3.7 3.5 Italy 3.7 3.4 3.2 France 3.0 3.2 3.0 Austria 2.9 2.9 2.7 Ukraine 2.5 2.5 2.3 Slovakia 1.6 1.6 1.5 Sweden 1.4 1.4 1.3 Spain 0.8 0.8 1.2
All other exporting countries 9.3 9.6 8.2
Total global exports 100.0 100.0 100.0 Source: Official exports statistics as reported by individual countries statistical reporting authorities in the GTIS/GTA database using HTS subheadings 7209.15, 7209.16, 7209.17, 7209.25, 7209.26, 7209.27, 7209.28 ,7209.90, 7210.70, 7211.23, 7211.29, 7211.90, 7212.40, 7219.18, 7225.50, and 7226.92 accessed August 6, 2015.


A-1
APPENDIX A
FEDERAL REGISTER NOTICES

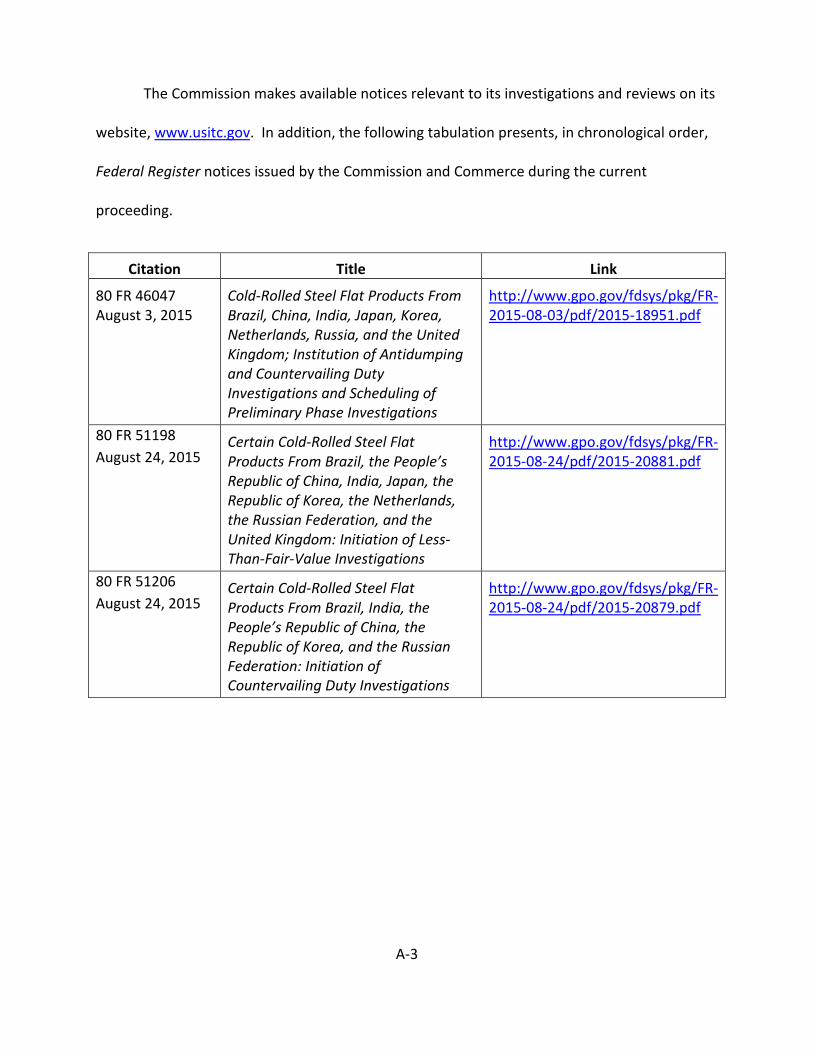
A-3
The Commission makes available notices relevant to its investigations and reviews on its
website, www.usitc.gov. In addition, the following tabulation presents, in chronological order,
Federal Register notices issued by the Commission and Commerce during the current
proceeding.
Citation Title Link
80 FR 46047 August 3, 2015
Cold-Rolled Steel Flat Products From Brazil, China, India, Japan, Korea, Netherlands, Russia, and the United Kingdom; Institution of Antidumping and Countervailing Duty Investigations and Scheduling of Preliminary Phase Investigations
http://www.gpo.gov/fdsys/pkg/FR-2015-08-03/pdf/2015-18951.pdf
80 FR 51198 August 24, 2015
Certain Cold-Rolled Steel Flat Products From Brazil, the People’s Republic of China, India, Japan, the Republic of Korea, the Netherlands, the Russian Federation, and the United Kingdom: Initiation of Less-Than-Fair-Value Investigations
http://www.gpo.gov/fdsys/pkg/FR-2015-08-24/pdf/2015-20881.pdf
80 FR 51206 August 24, 2015
Certain Cold-Rolled Steel Flat Products From Brazil, India, the People’s Republic of China, the Republic of Korea, and the Russian Federation: Initiation of Countervailing Duty Investigations
http://www.gpo.gov/fdsys/pkg/FR-2015-08-24/pdf/2015-20879.pdf


B-1
APPENDIX B
CALENDAR OF THE PUBLIC STAFF CONFERENCE


B-3
CALENDAR OF PUBLIC PRELIMINARY CONFERENCE
Those listed below appeared as witnesses at the United States International Trade Commission’s preliminary conference:
Subject: Cold-Rolled Steel Flat Products from Brazil, China, India, Japan, Korea, Netherlands, Russia, and the United Kingdom
Inv. Nos.: 701-TA-540-544 and 731-TA-1283-1290 (Preliminary)
Date and Time: August 18, 2015 - 9:30 am
Sessions were held in connection with these preliminary investigations in the ALJ
Courtroom B (Room 111), 500 E Street, S.W., Washington, DC.
EMBASSY WITNESS: Embassy of Brazil Washington, D.C.
Carlos Henrique Angrisani, Secretary
Embassy of the Russian Federation Washington, D.C. Alexander Zhmykhov, Deputy Head of Economic Section
OPENING REMARKS: Petitioners (Paul C. Rosenthal, Kelley Drye & Warren) Respondents (Donald B. Cameron, Morris Manning & Martin LLP)

B-4
In Support of the Imposition of Antidumping and Countervailing Duty Orders:
King & Spalding LLP Washington, DC on behalf of AK Steel Corporation Scott M. Lauschke, Vice President, Sales and Customer Service, AK Steel Corporation J. B. Chronister, General Manager, Products, AK Steel Corporation Joseph W. Dorn ) ) – OF COUNSEL Stephen A. Jones ) Kelley Drye & Warren Washington, DC on behalf of ArcelorMittal USA LLC (“AMUSA”) Daniel Mull, Executive Vice President of Sales and Marketing, ArcelorMittal USA Gordon O’Neill, Director, Product Control, Cold-Rolled Steel, ArcelorMittal USA Holly Hart, Assistant to the International President and Legislative
Director, United Steelworkers Brad Hudgens, Economist, Georgetown Economic Services, LLC Paul C. Rosenthal ) Kathleen W. Cannon ) – OF COUNSEL R. Alan Luberda )
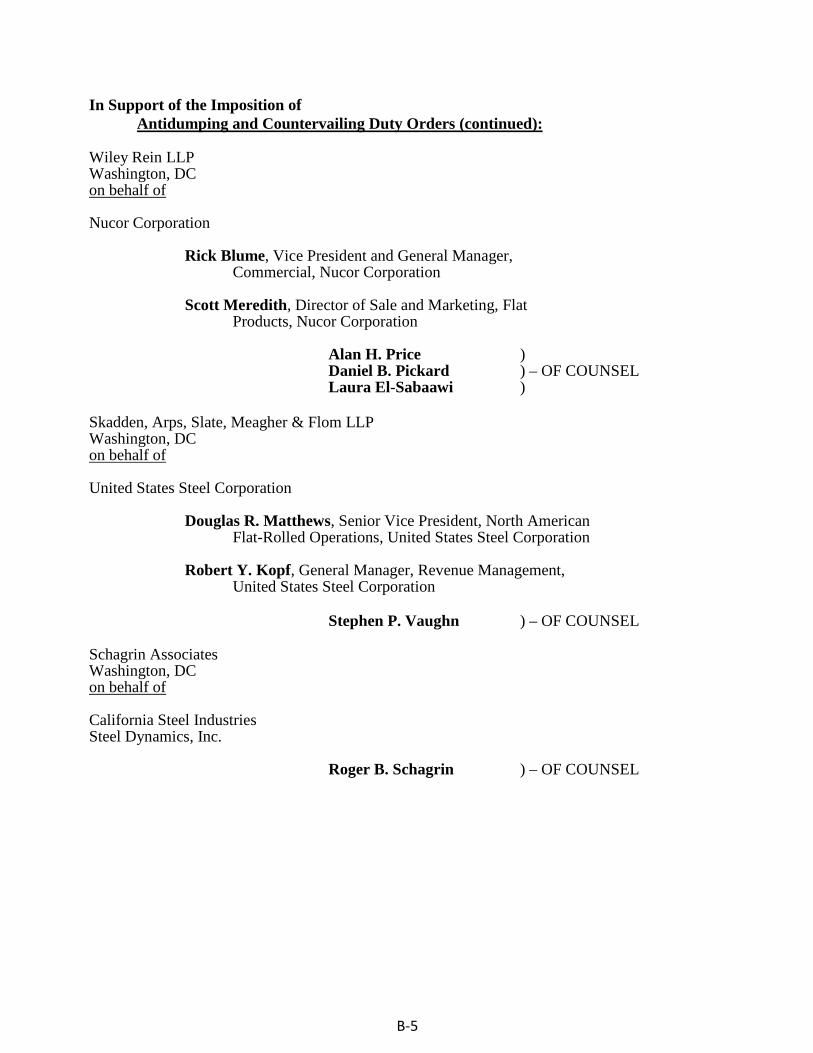
B-5
In Support of the Imposition of Antidumping and Countervailing Duty Orders (continued):
Wiley Rein LLP Washington, DC on behalf of Nucor Corporation Rick Blume, Vice President and General Manager,
Commercial, Nucor Corporation Scott Meredith, Director of Sale and Marketing, Flat Products, Nucor Corporation Alan H. Price ) Daniel B. Pickard ) – OF COUNSEL Laura El-Sabaawi ) Skadden, Arps, Slate, Meagher & Flom LLP Washington, DC on behalf of United States Steel Corporation Douglas R. Matthews, Senior Vice President, North American Flat-Rolled Operations, United States Steel Corporation Robert Y. Kopf, General Manager, Revenue Management, United States Steel Corporation
Stephen P. Vaughn ) – OF COUNSEL Schagrin Associates Washington, DC on behalf of California Steel Industries Steel Dynamics, Inc.
Roger B. Schagrin ) – OF COUNSEL

B-6
In Opposition to the Imposition of Antidumping and Countervailing Duty Orders:
Morris Manning & Martin LLP Washington, DC on behalf of Korea Iron and Steel Association Hyundai Steel Co., Ltd. POSCO (collectively “Korean Producers”) Hyun Taik Lee, Manager, Steel Business Strategy Department, International Trade Affairs Group, POSCO James A. Tennant, Chief Executive Officer, Ohio Coatings Company Yong Sig Bin, Executive Vice President, Ohio Coatings Company James Dougan, Vice President, Economic Consulting Services, LLC
Donald B. Cameron ) ) – OF COUNSEL
Mary S. Hodgins ) Steptoe & Johnson LLP Washington, DC on behalf of Tata Steel IJmuiden BV Tata Steel UK Ltd. Bruce Malashevich, President, Economic Consulting Services, LLC Richard O. Cunningham ) ) – OF COUNSEL Joel D. Kaufman )

B-7
In Opposition to the Imposition of Antidumping and Countervailing Duty Orders (continued): Sidley Austin LLP Washington, DC on behalf of Nippon Steel & Sumitomo Metal; JFE Steel Corporation; Kobe Steel Ltd. and Nisshin Steel Co., Ltd.
(collectively “Japanese Mills”) Yoshiro Hori, Executive Vice President and General Manager, Nippon Steel & Sumitomo Metal U.S.A, Inc. Tadaaki Yamaguchi, President, JFE Steel Americas, Inc. Scott Davidson, Vice President, Nippon Steel & Sumikin Bussan Americas, Inc. Richard Weiner ) Neil R. Ellis ) Brenda A. Jacobs ) – OF COUNSEL Rajib Pal ) Justin Becker ) Hogan Lovells US LLP Washington, DC on behalf of Companhia Siderurgica CSN LLC Craig A. Lewis ) ) – OF COUNSEL Jonathan T. Stoel ) Davis & Leiman P.C. Washington, DC on behalf of JSW Steel Ltd. JSW Steel Coated Products Ltd. James Dougan, Vice President, Economic Consulting Services, LLC

B-8
REBUTTAL/CLOSING REMARKS: Petitioners (Stephen P. Vaughn, Skadden, Arps, Slate,
Meagher & Flom LLP and Joseph W. Dorn, King & Spalding LLP) Respondents (Richard O. Cunningham, Steptoe & Johnson LLP and
Donald B. Cameron, Morris Manning & Martin LLP))

C-1
APPENDIX C
SUMMARY DATA


Table C-1Cold-rolled steel: Summary data concerning the U.S. market, 2012-14, January - June 2014, and January - June 2015
Jan-Jun2012 2013 2014 2014 2015 2012-14 2012-13 2013-14 2014-15
U.S. consumption quantity:Amount....................................................... 27,523,520 27,623,530 29,313,579 14,699,313 13,596,335 6.5 0.4 6.1 (7.5)Producers' share (fn1)................................ 95.4 95.6 91.1 92.5 90.7 (4.2) 0.2 (4.4) (1.8)Importers' share (fn1):
Brazil....................................................... 0.4 0.1 0.3 0.2 0.9 (0.0) (0.2) 0.2 0.7 China....................................................... 1.0 1.0 3.0 2.2 2.7 1.9 (0.0) 2.0 0.5 India......................................................... 0.0 0.1 0.3 0.3 0.5 0.3 0.0 0.2 0.2 Japan....................................................... 0.4 0.5 0.4 0.5 0.5 0.0 0.0 (0.0) 0.1 Korea....................................................... *** *** *** *** *** *** *** *** ***Russia..................................................... 0.0 0.0 0.3 0.2 0.3 0.3 0.0 0.3 0.1 United Kingdom....................................... *** *** *** *** *** *** *** *** ***
Subtotal *** *** *** *** *** *** *** *** ***Netherlands............................................. *** *** *** *** *** *** *** *** ***
Subtotal, all subject sources................ 2.5 2.3 5.7 4.4 6.4 3.2 (0.2) 3.4 2.0 Canada.................................................... *** *** *** *** *** *** *** *** ***All other sources..................................... *** *** *** *** *** *** *** *** ***
Subtotal, nonsubject sources............... 2.2 2.2 3.2 3.1 2.9 1.0 0.0 1.0 (0.2)Total U.S. imports............................. 4.6 4.4 8.9 7.5 9.3 4.2 (0.2) 4.4 1.8
U.S. consumption value:Amount....................................................... 20,760,642 19,818,151 21,890,391 11,042,018 9,237,079 5.4 (4.5) 10.5 (16.3)Producers' share (fn1)................................ 94.6 94.9 90.7 92.0 90.1 (3.9) 0.3 (4.2) (1.9)Importers' share (fn1):
Brazil....................................................... 0.3 0.1 0.3 0.2 0.8 (0.0) (0.2) 0.2 0.6 China....................................................... 0.9 0.8 2.5 1.9 2.3 1.6 (0.1) 1.7 0.4 India......................................................... 0.0 0.1 0.3 0.3 0.4 0.2 0.0 0.2 0.1 Japan....................................................... 0.6 0.7 0.6 0.7 0.8 (0.0) 0.1 (0.1) 0.1 Korea....................................................... *** *** *** *** *** *** *** *** ***Russia..................................................... 0.0 0.0 0.3 0.2 0.2 0.3 0.0 0.3 0.1 United Kingdom....................................... *** *** *** *** *** *** *** *** ***
Subtotal *** *** *** *** *** *** *** *** ***Netherlands............................................. *** *** *** *** *** *** *** *** ***
Subtotal, all subject sources................ 2.7 2.5 5.5 4.4 6.3 2.7 (0.3) 3.0 1.9 Canada.................................................... *** *** *** *** *** *** *** *** ***All other sources..................................... *** *** *** *** *** *** *** *** ***
Subtotal, nonsubject sources............... 2.6 2.6 3.8 3.6 3.6 1.1 (0.0) 1.2 (0.0)Total U.S. imports............................. 5.4 5.1 9.3 8.0 9.9 3.9 (0.3) 4.2 1.9
U.S. imports from:Brazil:
Quantity................................................... 97,559 32,953 98,755 29,928 125,335 1.2 (66.2) 199.7 318.8 Value....................................................... 66,430 20,925 68,100 19,878 70,526 2.5 (68.5) 225.4 254.8 Unit value................................................ $681 $635 $690 $664 $563 1.3 (6.7) 8.6 (15.3)Ending inventory quantity........................ *** *** *** *** *** *** *** *** ***
China:Quantity................................................... 277,087 266,627 865,816 322,093 371,638 212.5 (3.8) 224.7 15.4 Value....................................................... 191,993 166,752 545,679 206,656 214,386 184.2 (13.1) 227.2 3.7 Unit value................................................ $693 $625 $630 $642 $577 (9.0) (9.7) 0.8 (10.1)Ending inventory quantity........................ *** *** *** *** *** *** *** *** ***
India:Quantity................................................... 7,656 17,537 85,640 46,655 64,530 1,018.6 129.1 388.3 38.3 Value....................................................... 9,420 15,066 61,803 33,998 41,477 556.0 59.9 310.2 22.0 Unit value................................................ $1,230 $859 $722 $729 $643 (41.4) (30.2) (16.0) (11.8)Ending inventory quantity........................ *** *** *** *** *** *** *** *** ***
Japan:Quantity................................................... 119,576 133,537 129,907 69,085 74,561 8.6 11.7 (2.7) 7.9 Value....................................................... 129,691 134,843 135,558 73,831 71,462 4.5 4.0 0.5 (3.2)Unit value................................................ $1,085 $1,010 $1,044 $1,069 $958 (3.8) (6.9) 3.3 (10.3)Ending inventory quantity........................ *** *** *** *** *** *** *** *** ***
Korea:Quantity................................................... *** *** *** *** *** *** *** *** ***Value....................................................... *** *** *** *** *** *** *** *** ***Unit value................................................ *** *** *** *** *** *** *** *** ***Ending inventory quantity........................ *** *** *** *** *** *** *** *** ***
Russia:Quantity................................................... 0 222 89,385 28,851 34,759 fn2 fn2 40,163.5 20.5 Value....................................................... 0 127 58,969 19,902 22,114 fn2 fn2 46,224.8 11.1 Unit value................................................ $0 $573 $660 $690 $636 fn2 fn2 15.1 (7.8)Ending inventory quantity........................ *** *** *** *** *** *** *** *** ***
United Kingdom:Quantity................................................... *** *** *** *** *** *** *** *** ***Value....................................................... *** *** *** *** *** *** *** *** ***Unit value................................................ *** *** *** *** *** *** *** *** ***Ending inventory quantity........................ *** *** *** *** *** *** *** *** ***
SubtotalQuantity................................................... *** *** *** *** *** *** *** *** ***Value....................................................... *** *** *** *** *** *** *** *** ***Unit value................................................ *** *** *** *** *** *** *** *** ***Ending inventory quantity........................ *** *** *** *** *** *** *** *** ***
Netherlands:Quantity................................................... *** *** *** *** *** *** *** *** ***Value....................................................... *** *** *** *** *** *** *** *** ***Unit value................................................ *** *** *** *** *** *** *** *** ***Ending inventory quantity........................ *** *** *** *** *** *** *** *** ***
Subtotal, all subject sourcesQuantity................................................... 680,133 621,823 1,665,149 650,307 872,914 144.8 (8.6) 167.8 34.2 Value....................................................... 568,088 491,766 1,198,908 485,532 578,314 111.0 (13.4) 143.8 19.1 Unit value................................................ $835 $791 $720 $747 $663 (13.8) (5.3) (9.0) (11.3)Ending inventory quantity........................ *** *** *** *** *** *** *** *** ***
Table continued on next page
C-3
(Quantity=short tons; Value=1,000 dollars; Unit values, unit labor costs, and unit expenses=dollars per short ton; Period changes=percent--exceptions noted)
Calendar year Calendar yearReport data
January to JunePeriod changes

Table C-1--ContinuedCold-rolled steel: Summary data concerning the U.S. market, 2012-14, January - June 2014, and January - June 2015
Jan-Jun2012 2013 2014 2014 2015 2012-14 2012-13 2013-14 2014-15
U.S. imports from:Canada:
Quantity................................................... *** *** *** *** *** *** *** *** ***Value....................................................... *** *** *** *** *** *** *** *** ***Unit value................................................ *** *** *** *** *** *** *** *** ***Ending inventory quantity........................ *** *** *** *** *** *** *** *** ***
All other souces:Quantity................................................... *** *** *** *** *** *** *** *** ***Value....................................................... *** *** *** *** *** *** *** *** ***Unit value................................................ *** *** *** *** *** *** *** *** ***Ending inventory quantity........................ *** *** *** *** *** *** *** *** ***
Subtotal, nonsubject sources:Quantity................................................... 594,565 600,001 933,254 450,482 393,641 57.0 0.9 55.5 (12.6)Value....................................................... 548,223 519,352 827,353 397,884 332,790 50.9 (5.3) 59.3 (16.4)Unit value................................................ $922 $866 $887 $883 $845 (3.9) (6.1) 2.4 (4.3)Ending inventory quantity........................ *** *** *** *** *** *** *** *** ***
Total U.S. imports:Quantity................................................... 1,274,698 1,221,823 2,598,403 1,100,789 1,266,555 103.8 (4.1) 112.7 15.1 Value....................................................... 1,116,311 1,011,118 2,026,262 883,416 911,104 81.5 (9.4) 100.4 3.1 Unit value................................................ $876 $828 $780 $803 $719 (11.0) (5.5) (5.8) (10.4)Ending inventory quantity........................ *** *** *** *** *** *** *** *** ***
U.S. producers':Average capacity quantity.......................... 39,514,662 39,961,225 39,510,948 19,802,264 19,738,901 (0.0) 1.1 (1.1) (0.3)Production quantity..................................... 26,925,495 26,969,346 27,205,722 13,752,234 12,517,060 1.0 0.2 0.9 (9.0)Capacity utilization (fn1)............................. 68.1 67.5 68.9 69.4 63.4 0.7 (0.7) 1.4 (6.0)U.S. shipments:
Quantity................................................... 26,248,822 26,401,707 26,715,176 13,598,524 12,329,780 1.8 0.6 1.2 (9.3)Value....................................................... 19,644,331 18,807,033 19,864,129 10,158,602 8,325,975 1.1 (4.3) 5.6 (18.0)Unit value................................................ $748 $712 $744 $747 $675 (0.6) (4.8) 4.4 (9.6)
Export shipments:Quantity................................................... 677,934 596,852 480,642 256,403 259,720 (29.1) (12.0) (19.5) 1.3 Value....................................................... 601,889 520,701 443,052 234,801 222,024 (26.4) (13.5) (14.9) (5.4)Unit value................................................ $888 $872 $922 $916 $855 3.8 (1.7) 5.7 (6.6)
Ending inventory quantity........................... 1,193,312 1,163,147 1,169,857 1,059,422 1,096,561 (2.0) (2.5) 0.6 3.5 Inventories/total shipments (fn1)................ 4.4 4.3 4.3 3.8 4.4 (0.1) (0.1) (0.0) 0.5 Production workers.................................... 11,193 11,108 10,935 11,119 10,794 (2.3) (0.8) (1.6) (2.9)Hours worked (1,000s)............................... 25,075 25,086 24,699 12,820 12,084 (1.5) 0.0 (1.5) (5.7)Wages paid ($1,000).................................. 933,381 937,883 964,280 498,185 465,967 3.3 0.5 2.8 (6.5)Hourly wages (dollars)............................... $37.22 $37.39 $39.04 $38.86 $38.56 4.9 0.4 4.4 (0.8)Productivity (short tons per hour)............... 1,073.8 1,075.1 1,101.5 1,072.7 1,035.8 2.6 0.1 2.5 (3.4)Unit labor costs.......................................... $34.67 $34.78 $35.44 $36.23 $37.23 2.2 0.3 1.9 2.8
Financial experience: constructed fair market value (fn3):Net Sales:
Quantity................................................... 26,917,521 27,008,406 27,202,517 13,858,154 12,591,423 1.1 0.3 0.7 (9.1)Value....................................................... 20,462,831 19,598,764 20,735,965 10,571,243 8,739,916 1.3 (4.2) 5.8 (17.3)Unit value................................................ $760 $726 $762 $763 $694 0.3 (4.5) 5.0 (9.0)
Cost of goods sold (COGS)....................... 20,134,083 19,366,194 19,851,482 10,328,300 8,612,386 (1.4) (3.8) 2.5 (16.6)Gross profit or (loss).................................. 328,748 232,570 884,483 242,943 127,530 169.0 (29.3) 280.3 (47.5)SG&A expenses......................................... 524,206 537,670 629,379 328,014 317,558 20.1 2.6 17.1 (3.2)Operating income or (loss)........................ (195,458) (305,100) 255,104 (85,071) (190,028) fn2 56.1 fn2 123.4 Net income or (loss)................................... (547,115) (513,615) 22,836 (199,383) (390,169) fn2 (6.1) fn2 95.7 Capital expenditures.................................. 528,326 314,950 314,677 123,970 187,648 (40.4) (40.4) (0.1) 51.4 Unit COGS................................................. $748 $717 $730 $745 $684 (2.4) (4.1) 1.8 (8.2)Unit SG&A expenses................................. $19 $20 $23 $24 $25 18.8 2.2 16.2 6.6 Unit operating income or (loss).................. $(7) $(11) $9 $(6) $(15) fn2 55.6 fn2 145.8 Unit net income or (loss)............................ $(20) $(19) $1 $(14) $(31) fn2 (6.4) fn2 115.4 COGS/sales (fn1)....................................... 98.4 98.8 95.7 97.7 98.5 (2.7) 0.4 (3.1) 0.8 Operating income or (loss)/sales (fn1)...... (1.0) (1.6) 1.2 (0.8) (2.2) 2.2 (0.6) 2.8 (1.4)Net income or (loss)/sales (fn1)................. (2.7) (2.6) 0.1 (1.9) (4.5) 2.8 0.1 2.7 (2.6)
Financial experience: cost plus share of downstream profit (fn4):Net Sales:
Quantity................................................... 26,917,521 27,008,406 27,202,517 13,858,154 12,591,423 1.1 0.3 0.7 (9.1)Value....................................................... 20,967,337 20,347,168 21,136,392 10,799,154 8,937,502 0.8 (3.0) 3.9 (17.2)Unit value................................................ $779 $753 $777 $779 $710 (0.2) (3.3) 3.1 (8.9)
Cost of goods sold (COGS)....................... 20,134,082 19,366,194 19,851,482 10,328,648 8,612,305 (1.4) (3.8) 2.5 (16.6)Gross profit of (loss).................................. 833,255 980,974 1,284,910 470,506 325,197 54.2 17.7 31.0 (30.9)SG&A expenses......................................... 524,206 537,671 629,379 328,015 317,557 20.1 2.6 17.1 (3.2)Operating income or (loss)........................ 309,049 443,303 655,531 142,491 7,640 112.1 43.4 47.9 (94.6)Net income or (loss)................................... (42,248) 234,788 423,262 28,180 (190,185) fn2 fn2 80.3 fn2 Capital expenditures.................................. 528,326 314,950 314,677 123,970 187,648 (40.4) (40.4) (0.1) 51.4 Unit COGS................................................. $748 $717 $730 $745 $684 (2.4) (4.1) 1.8 (8.2)Unit SG&A expenses................................. $19 $20 $23 $24 $25 18.8 2.2 16.2 6.6 Unit operating income or (loss).................. $11 $16 $24 $10 $1 109.9 43.0 46.8 (94.1)Unit net income or (loss)............................ $(2) $9 $16 $2 $(15) fn2 fn2 79.0 fn2 COGS/sales (fn1)....................................... 96.0 95.2 93.9 95.6 96.4 (2.1) (0.8) (1.3) 0.7 Operating income or (loss)/sales (fn1)...... 1.5 2.2 3.1 1.3 0.1 1.6 0.7 0.9 (1.2)Net income or (loss)/sales (fn1)................. (0.2) 1.2 2.0 0.3 (2.1) 2.2 1.4 0.8 (2.4)
Notes:
fn1.--Report data are in percent and period changes are in percentage points.fn2.--Undefined. fn3.--U.S. producers' financial experience valuing internal consumption and transfers to related firms at constructed fair market value. See part VI for details.fn4.--U.S. producers' financial experience valuing internal consumption and transfers at cost plus a portion of the share of downstream profit. See part VI for details.
Source: Compiled from data submitted in response to Commission questionnaire and adjusted official U.S. import statistics. See Part IV for details.
Report data Period changesJanuary to June
(Quantity=short tons; Value=1,000 dollars; Unit values, unit labor costs, and unit expenses=dollars per short ton; Period changes=percent--exceptions noted)
Calendar year Calendar year
C-4

Table C-2Cold-rolled steel: Summary data concerning the U.S. merchant market, 2012-14, January - June 2014, and January - June 2015
Jan-Jun2012 2013 2014 2014 2015 2012-14 2012-13 2013-14 2014-15
U.S. consumption quantity:Amount....................................................... 11,901,198 11,721,574 12,757,833 6,335,804 5,921,991 7.2 (1.5) 8.8 (6.5)Producers' share (fn1)................................ 89.3 89.6 79.6 82.6 78.6 (9.7) 0.3 (9.9) (4.0)Importers' share (fn1):
Brazil....................................................... 0.8 0.3 0.8 0.5 2.1 (0.0) (0.5) 0.5 1.6 China....................................................... 2.3 2.3 6.8 5.1 6.3 4.5 (0.1) 4.5 1.2 India......................................................... 0.1 0.1 0.7 0.7 1.1 0.6 0.1 0.5 0.4 Japan....................................................... 1.0 1.1 1.0 1.1 1.3 0.0 0.1 (0.1) 0.2 Korea....................................................... *** *** *** *** *** *** *** *** ***Russia..................................................... 0.0 0.0 0.7 0.5 0.6 0.7 0.0 0.7 0.1 United Kingdom....................................... *** *** *** *** *** *** *** *** ***
Subtotal *** *** *** *** *** *** *** *** ***Netherlands............................................. *** *** *** *** *** *** *** *** ***
Subtotal, all subject sources................ 5.7 5.3 13.1 10.3 14.7 7.3 (0.4) 7.7 4.5 Canada.................................................... *** *** *** *** *** *** *** *** ***All other sources..................................... *** *** *** *** *** *** *** *** ***
Subtotal, nonsubject sources............... 5.0 5.1 7.3 7.1 6.6 2.3 0.1 2.2 (0.5)Total U.S. imports............................. 10.7 10.4 20.4 17.4 21.4 9.7 (0.3) 9.9 4.0
U.S. consumption value:Amount....................................................... 9,423,984 8,843,496 10,006,559 4,995,700 4,255,622 6.2 (6.2) 13.2 (14.8)Producers' share (fn1)................................ 88.2 88.6 79.8 82.3 78.6 (8.4) 0.4 (8.8) (3.7)Importers' share (fn1):
Brazil....................................................... 0.7 0.2 0.7 0.4 1.7 (0.0) (0.5) 0.4 1.3 China....................................................... 2.0 1.9 5.5 4.1 5.0 3.4 (0.2) 3.6 0.9 India......................................................... 0.1 0.2 0.6 0.7 1.0 0.5 0.1 0.4 0.3 Japan....................................................... 1.4 1.5 1.4 1.5 1.7 (0.0) 0.1 (0.2) 0.2 Korea....................................................... *** *** *** *** *** *** *** *** ***Russia..................................................... 0.0 0.0 0.6 0.4 0.5 0.6 0.0 0.6 0.1 United Kingdom....................................... *** *** *** *** *** *** *** *** ***
Subtotal *** *** *** *** *** *** *** *** ***Netherlands............................................. *** *** *** *** *** *** *** *** ***
Subtotal, all subject sources................ 6.0 5.6 12.0 9.7 13.6 6.0 (0.5) 6.4 3.9 Canada.................................................... *** *** *** *** *** *** *** *** ***All other sources..................................... *** *** *** *** *** *** *** *** ***
Subtotal, nonsubject sources............... 5.8 5.9 8.3 8.0 7.8 2.5 0.1 2.4 (0.1)Total U.S. imports............................. 11.8 11.4 20.2 17.7 21.4 8.4 (0.4) 8.8 3.7
U.S. imports from:Brazil:
Quantity................................................... 97,559 32,953 98,755 29,928 125,335 1.2 (66.2) 199.7 318.8 Value....................................................... 66,430 20,925 68,100 19,878 70,526 2.5 (68.5) 225.4 254.8 Unit value................................................ $681 $635 $690 $664 $563 1.3 (6.7) 8.6 (15.3)Ending inventory quantity........................ *** *** *** *** *** *** *** *** ***
China:Quantity................................................... 277,087 266,627 865,816 322,093 371,638 212.5 (3.8) 224.7 15.4 Value....................................................... 191,993 166,752 545,679 206,656 214,386 184.2 (13.1) 227.2 3.7 Unit value................................................ $693 $625 $630 $642 $577 (9.0) (9.7) 0.8 (10.1)Ending inventory quantity........................ *** *** *** *** *** *** *** *** ***
India:Quantity................................................... 7,656 17,537 85,640 46,655 64,530 1,018.6 129.1 388.3 38.3 Value....................................................... 9,420 15,066 61,803 33,998 41,477 556.0 59.9 310.2 22.0 Unit value................................................ $1,230 $859 $722 $729 $643 (41.4) (30.2) (16.0) (11.8)Ending inventory quantity........................ *** *** *** *** *** *** *** *** ***
Japan:Quantity................................................... 119,576 133,537 129,907 69,085 74,561 8.6 11.7 (2.7) 7.9 Value....................................................... 129,691 134,843 135,558 73,831 71,462 4.5 4.0 0.5 (3.2)Unit value................................................ $1,085 $1,010 $1,044 $1,069 $958 (3.8) (6.9) 3.3 (10.3)Ending inventory quantity........................ *** *** *** *** *** *** *** *** ***
Korea:Quantity................................................... *** *** *** *** *** *** *** *** ***Value....................................................... *** *** *** *** *** *** *** *** ***Unit value................................................ *** *** *** *** *** *** *** *** ***Ending inventory quantity........................ *** *** *** *** *** *** *** *** ***
Russia:Quantity................................................... 0 222 89,385 28,851 34,759 *** *** 40,163.5 20.5 Value....................................................... 0 127 58,969 19,902 22,114 *** *** 46,224.8 11.1 Unit value................................................ $0 $573 $660 $690 $636 *** *** 15.1 (7.8)Ending inventory quantity........................ *** *** *** *** *** *** *** *** ***
United Kingdom:Quantity................................................... *** *** *** *** *** *** *** *** ***Value....................................................... *** *** *** *** *** *** *** *** ***Unit value................................................ *** *** *** *** *** *** *** *** ***Ending inventory quantity........................ *** *** *** *** *** *** *** *** ***
SubtotalQuantity................................................... *** *** *** *** *** *** *** *** ***Value....................................................... *** *** *** *** *** *** *** *** ***Unit value................................................ *** *** *** *** *** *** *** *** ***Ending inventory quantity........................ *** *** *** *** *** *** *** *** ***
NetherlandsQuantity................................................... *** *** *** *** *** *** *** *** ***Value....................................................... *** *** *** *** *** *** *** *** ***Unit value................................................ *** *** *** *** *** *** *** *** ***Ending inventory quantity........................ *** *** *** *** *** *** *** *** ***
Subtotal, all subject sources......................Quantity................................................... 680,133 621,823 1,665,149 650,307 872,914 144.8 (8.6) 167.8 34.2 Value....................................................... 568,088 491,766 1,198,908 485,532 578,314 111.0 (13.4) 143.8 19.1 Unit value................................................ $835 $791 $720 $747 $663 (13.8) (5.3) (9.0) (11.3)Ending inventory quantity........................ *** *** *** *** *** *** *** *** ***
Table continued on next page
C-5
(Quantity=short tons; Value=1,000 dollars; Unit values, unit labor costs, and unit expenses=dollars per short ton; Period changes=percent--exceptions noted)
Report data Period changesCalendar year January to June Calendar year

Table C-2--ContinuedCold-rolled steel: Summary data concerning the U.S. merchant market, 2012-14, January - June 2014, and January - June 2015
Jan-Jun2012 2013 2014 2014 2015 2012-14 2012-13 2013-14 2014-15
U.S. imports from:Canada:
Quantity................................................... *** *** *** *** *** *** *** *** ***Value....................................................... *** *** *** *** *** *** *** *** ***Unit value................................................ *** *** *** *** *** *** *** *** ***Ending inventory quantity........................ *** *** *** *** *** *** *** *** ***
All other souces:Quantity................................................... *** *** *** *** *** *** *** *** ***Value....................................................... *** *** *** *** *** *** *** *** ***Unit value................................................ *** *** *** *** *** *** *** *** ***Ending inventory quantity........................ *** *** *** *** *** *** *** *** ***
Subtotal, nonsubject sources:Quantity................................................... 594,565 600,001 933,254 450,482 393,641 57.0 0.9 55.5 (12.6)Value....................................................... 548,223 519,352 827,353 397,884 332,790 50.9 (5.3) 59.3 (16.4)Unit value................................................ $922 $866 $887 $883 $845 (3.9) (6.1) 2.4 (4.3)Ending inventory quantity........................ *** *** *** *** *** *** *** *** ***
Total U.S. imports:Quantity................................................... 1,274,698 1,221,823 2,598,403 1,100,789 1,266,555 103.8 (4.1) 112.7 15.1 Value....................................................... 1,116,311 1,011,118 2,026,262 883,416 911,104 81.5 (9.4) 100.4 3.1 Unit value................................................ $876 $828 $780 $803 $719 (11.0) (5.5) (5.8) (10.4)Ending inventory quantity........................ *** *** *** *** *** *** *** *** ***
U.S. producers':U.S. commercial shipments:
Quantity................................................... 10,626,500 10,499,751 10,159,430 5,235,015 4,655,436 (4.4) (1.2) (3.2) (11.1)Value....................................................... 8,307,673 7,832,378 7,980,297 4,112,284 3,344,518 (3.9) (5.7) 1.9 (18.7)Unit value................................................ $782 $746 $786 $786 $718 0.5 (4.6) 5.3 (8.5)
Financial experience: Merchant market operationsCommerical sales:
Quantity................................................... 11,309,745 11,106,450 10,646,771 5,494,644 4,917,078 (5.9) (1.8) (4.1) (10.5)Value....................................................... 8,926,786 8,370,066 8,442,724 4,356,989 3,569,554 (5.4) (6.2) 0.9 (18.1)Unit value................................................ $789 $754 $793 $793 $726 0.5 (4.5) 5.2 (8.4)
Cost of goods sold (COGS)....................... 8,602,804 8,077,896 7,831,020 4,144,424 3,423,488 (9.0) (6.1) (3.1) (17.4)Gross profit or (loss).................................. 323,982 292,170 611,704 212,565 146,066 88.8 (9.8) 109.4 (31.3)SG&A expenses......................................... 243,284 237,554 262,221 136,046 130,836 7.8 (2.4) 10.4 (3.8)Operating income or (loss)........................ 80,698 54,616 349,483 76,519 15,230 333.1 (32.3) 539.9 (80.1)Net income or (loss)................................... (94,969) (29,275) 276,970 32,558 (66,945) (fn2) (69.2) (fn2) (fn2)Unit COGS................................................. $761 $727 $736 $754 $696 (3.3) (4.4) 1.1 (7.7)Unit SG&A expenses................................. $22 $21 $25 $25 $27 14.5 (0.6) 15.1 7.5 Unit operating income or (loss).................. $7 $5 $33 $14 $3 360.0 (31.1) 567.5 (77.8)Unit net income or (loss)............................ $(8) $(3) $26 $6 $(14) (fn2) (68.6) (fn2) (fn2)COGS/sales (fn1)....................................... 96.4 96.5 92.8 95.1 95.9 (3.6) 0.1 (3.8) 0.8 Operating income or (loss)/sales (fn1)...... 0.9 0.7 4.1 1.8 0.4 3.2 (0.3) 3.5 (1.3)Net income or (loss)/sales (fn1)................. (1.1) (0.3) 3.3 0.7 (1.9) 4.3 0.7 3.6 (2.6)
Notes:
fn1.--Report data are in percent and period changes are in percentage points.fn2.--Undefined.
C-6
Calendar year January to June Calendar year
(Quantity=short tons; Value=1,000 dollars; Unit values, unit labor costs, and unit expenses=dollars per short ton; Period changes=percent--exceptions noted)
Report data Period changes

D‐1
APPENDIX D
NONSUBJECT COUNTRY PRICE DATA


D‐3
Two importers reported price data for nonsubject country Canada for cold‐rolled steel. Price data reported by these firms accounted for *** percent of U.S. imports from Canada during January 2012‐June 2015. These pricing items and accompanying data are comparable to those presented in tables V‐4 to V‐7. Price and quantity data for Canada are shown in table D‐1 and in figures D‐1 to D‐4 (along with domestic and subject source data).
In comparing nonsubject country pricing data with U.S. producer pricing data, prices for product imported from Canada were lower than prices for U.S.‐produced product in 14 instances and higher in 40 instances. In comparing nonsubject country pricing data with subject country pricing data, prices for product imported from Canada were lower than prices for product imported from subject countries in 42 instances and higher in 147 instances. A summary of price differentials is presented in table D‐2.
Table D-1 Cold-rolled steel: Weighted-average f.o.b. prices and quantities of imported products 1, 2, 3, and 41 from Canada, by quarters, January 2012-June 2015
* * * * * * *
Figure D-1 Cold-rolled steel: Weighted-average f.o.b. prices and quantities of domestic and imported product 1, by quarters, January 2012-June 2015
* * * * * * *
Figure D-2 Cold-rolled steel: Weighted-average f.o.b. prices and quantities of domestic and imported product 2, by quarters, January 2012-June 2015
* * * * * * *
Figure D-3 Cold-rolled steel: Weighted-average f.o.b. prices and quantities of domestic and imported product 3, by quarters, January 2012-June 2015
* * * * * * *
Figure D-4 Cold-rolled steel: Weighted-average f.o.b. prices and quantities of domestic and imported product 4, by quarters, January 2012-June 2015

D‐4
Table D-2 Cold-rolled steel: Summary of price differentials, by country, January 2012-June 20151
Countries Number of
comparisons Lower Higher Canada vs. United States 54 14 40Canada vs. Brazil 40 13 27Canada vs. China 54 7 47Canada vs. India 27 6 21Canada vs. Japan 6 3 3Canada vs. Korea 18 8 10Canada vs. Netherlands 28 5 23Canada vs. Russia 16 0 16Canada vs. United Kingdom --- --- ---
1 As noted in Part V, staff received revisions from some but not all firms. Accordingly, some of these pricing data may include both commercial and higher quality steel.
Source: Compiled from data submitted in response to Commission questionnaires.

E‐1
APPENDIX E
FINANCIAL DATA OF U.S. PRODUCERS


E‐3
This section presents selected financial information of U.S. producers. Each of the three tables provides information on sales and costs of the reporting firm’s commercial sales and the data for quantity and value of commercial sales are the same in each table. Besides the data for commercial sales, tables E‐1 and E‐2 provide data for internal consumption and transfers to related firms but differ in how firms were requested to report the values of internal consumption and transfers. Table E‐1, which corresponds to table VI‐1, provides information with the values of internal consumption and transfers to related firms based on constructed fair market value (“constructed fair market value”).1 Table E‐2, which corresponds to table VI‐2, provides information the values for internal consumption and transfers based upon a share of the gross profit of the downstream product (“gross profit share”). While the data for quantity of sales, costs and expenses in table E‐2 are the same as those reported in table E‐1, the value of internal consumption and transfers differs.2 Table E‐3, which corresponds to table VI‐3, provides data only on open market sales and costs of U.S. producers (“open market”).
1 The Commission’s questionnaire asked U.S. producers to report the value of internal consumption and transfers to related firms at the same per‐unit values as the firm’s commercial sales. Firms were instructed to adjust the per‐unit‐values if their internal consumption and transfers differed from their commercial sales because of factors like product mix, or physical, or quality differences. This adjustment for differences in value was labeled “operations on cold‐rolled steel with internal consumption and transfers to related parties valued based upon differences in cost (constructed fair market value).” See section III‐9 of the U.S. producers’ questionnaire. 2 The Commission’s questionnaire asked U.S. producers to report the value of internal consumption and transfers to related firms based upon a calculation using the gross profit margin of the downstream product (e.g., coated steel), adjusted for the percentage of relative costs of producing cold‐rolled steel and the downstream product. This adjustment for differences in sales value was labeled “operations on cold‐rolled steel with internal consumption and transfers to related parties based upon the gross profit of the downstream product (cost plus share of downstream profit).” See section III‐10 of the U.S. producers’ questionnaire.

E‐4
Table E-1 Cold-rolled steel: Results of operations of U.S. producers at constructed fair market value, by firm, 2012-14, January-June 2014, and January-June 2015
Item Fiscal year January-June
2012 2013 2014 2014 2015 Commercial sales quantity (short tons) AK Steel *** *** *** *** *** ArcelorMittal USA *** *** *** *** *** Blair *** *** *** *** *** CSI *** *** *** *** *** CSN *** *** *** *** *** Nucor *** *** *** *** *** Steel Dynamics *** *** *** *** *** Steelscape *** *** *** *** *** Thomas *** *** *** *** *** U.S. Steel *** *** *** *** *** USS-POSCO *** *** *** *** *** Worthington Steel *** *** *** *** ***
Total 11,309,745 11,106,450 10,646,771 5,494,644 4,917,078 Internal consumption quantity (short tons) AK Steel *** *** *** *** *** ArcelorMittal USA *** *** *** *** *** Blair *** *** *** *** *** CSI *** *** *** *** *** CSN *** *** *** *** *** Nucor *** *** *** *** *** Steel Dynamics *** *** *** *** *** Steelscape *** *** *** *** *** Thomas *** *** *** *** *** U.S. Steel *** *** *** *** *** USS-POSCO *** *** *** *** *** Worthington Steel *** *** *** *** ***
Total *** *** *** *** *** Transfers quantity (short tons) AK Steel *** *** *** *** *** ArcelorMittal USA *** *** *** *** *** Blair *** *** *** *** *** CSI *** *** *** *** *** CSN *** *** *** *** *** Nucor *** *** *** *** *** Steel Dynamics *** *** *** *** *** Steelscape *** *** *** *** *** Thomas *** *** *** *** *** U.S. Steel *** *** *** *** *** USS-POSCO *** *** *** *** *** Worthington Steel *** *** *** *** ***
Total *** *** *** *** *** Table continued on the next page.

E‐5
Table E-1--Continued Cold-rolled steel: Results of operations of U.S. producers at constructed fair market value, by firm, 2012-14, January-June 2014, and January-June 2015
Item Fiscal year January-June
2012 2013 2014 2014 2015 Total net sales quantity (short tons) AK Steel *** *** *** *** *** ArcelorMittal USA *** *** *** *** *** Blair *** *** *** *** *** CSI *** *** *** *** *** CSN *** *** *** *** *** Nucor *** *** *** *** *** Steel Dynamics *** *** *** *** *** Steelscape *** *** *** *** *** Thomas *** *** *** *** *** U.S. Steel *** *** *** *** *** USS-POSCO *** *** *** *** *** Worthington Steel *** *** *** *** ***
Total 26,917,521 27,008,406 27,202,517 13,858,154 12,591,423 Commercial sales value (1,000 dollars) AK Steel *** *** *** *** *** ArcelorMittal USA *** *** *** *** *** Blair *** *** *** *** *** CSI *** *** *** *** *** CSN *** *** *** *** *** Nucor *** *** *** *** *** Steel Dynamics *** *** *** *** *** Steelscape *** *** *** *** *** Thomas *** *** *** *** *** U.S. Steel *** *** *** *** *** USS-POSCO *** *** *** *** *** Worthington Steel *** *** *** *** ***
Total 8,926,786 8,370,066 8,442,724 4,356,989 3,569,554 Internal consumption value(1,000 dollars) AK Steel *** *** *** *** *** ArcelorMittal USA *** *** *** *** *** Blair *** *** *** *** *** CSI *** *** *** *** *** CSN *** *** *** *** *** Nucor *** *** *** *** *** Steel Dynamics *** *** *** *** *** Steelscape *** *** *** *** *** Thomas *** *** *** *** *** U.S. Steel *** *** *** *** *** USS-POSCO *** *** *** *** *** Worthington Steel *** *** *** *** ***
Total *** *** *** *** *** Table continued on the next page.

E‐6
Table E-1--Continued Cold-rolled steel: Results of operations of U.S. producers at constructed fair market value, by firm, 2012-14, January-June 2014, and January-June 2015
Item Fiscal year January to June
2012 2013 2014 2014 2015 Transfer value (1,000 dollars) AK Steel *** *** *** *** *** ArcelorMittal USA *** *** *** *** *** Blair *** *** *** *** *** CSI *** *** *** *** *** CSN *** *** *** *** *** Nucor *** *** *** *** *** Steel Dynamics *** *** *** *** *** Steelscape *** *** *** *** *** Thomas *** *** *** *** *** U.S. Steel *** *** *** *** *** USS-POSCO *** *** *** *** *** Worthington Steel *** *** *** *** ***
Total *** *** *** *** *** Total net sales value (1,000 dollars) AK Steel *** *** *** *** *** ArcelorMittal USA *** *** *** *** *** Blair *** *** *** *** *** CSI *** *** *** *** *** CSN *** *** *** *** *** Nucor *** *** *** *** *** Steel Dynamics *** *** *** *** *** Steelscape *** *** *** *** *** Thomas *** *** *** *** *** U.S. Steel *** *** *** *** *** USS-POSCO *** *** *** *** *** Worthington Steel *** *** *** *** ***
Total 20,462,831 19,598,764 20,735,965 10,571,243 8,739,916 Total COGS value (1,000 dollars) AK Steel *** *** *** *** *** ArcelorMittal USA *** *** *** *** *** Blair *** *** *** *** *** CSI *** *** *** *** *** CSN *** *** *** *** *** Nucor *** *** *** *** *** Steel Dynamics *** *** *** *** *** Steelscape *** *** *** *** *** Thomas *** *** *** *** *** U.S. Steel *** *** *** *** *** USS-POSCO *** *** *** *** *** Worthington Steel *** *** *** *** ***
Total 20,134,083 19,366,194 19,851,482 10,328,300 8,612,386 Table continued on the next page.

E‐7
Table E-1--Continued Cold-rolled steel: Results of operations of U.S. producers at constructed fair market value, by firm, 2012-14, January-June 2014, and January-June 2015
Item Fiscal year January-June
2012 2013 2014 2014 2015 Gross profit or (loss) value(1,000 dollars) AK Steel *** *** *** *** *** ArcelorMittal USA *** *** *** *** *** Blair *** *** *** *** *** CSI *** *** *** *** *** CSN *** *** *** *** *** Nucor *** *** *** *** *** Steel Dynamics *** *** *** *** *** Steelscape *** *** *** *** *** Thomas *** *** *** *** *** U.S. Steel *** *** *** *** *** USS-POSCO *** *** *** *** *** Worthington Steel *** *** *** *** ***
Total 328,748 232,570 884,483 242,943 127,530 Total SG&A expenses value (1,000 dollars) AK Steel *** *** *** *** *** ArcelorMittal USA *** *** *** *** *** Blair *** *** *** *** *** CSI *** *** *** *** *** CSN *** *** *** *** *** Nucor *** *** *** *** *** Steel Dynamics *** *** *** *** *** Steelscape *** *** *** *** *** Thomas *** *** *** *** *** U.S. Steel *** *** *** *** *** USS-POSCO *** *** *** *** *** Worthington Steel *** *** *** *** ***
Total 524,206 537,670 629,379 328,014 317,558 Operating income or (loss) value (1,000 dollars) AK Steel *** *** *** *** *** ArcelorMittal USA *** *** *** *** *** Blair *** *** *** *** *** CSI *** *** *** *** *** CSN *** *** *** *** *** Nucor *** *** *** *** *** Steel Dynamics *** *** *** *** *** Steelscape *** *** *** *** *** Thomas *** *** *** *** *** U.S. Steel *** *** *** *** *** USS-POSCO *** *** *** *** *** Worthington Steel *** *** *** *** ***
Total (195,458) (305,100) 255,104 (85,071) (190,028) Table continued on the next page.

E‐8
Table E-1--Continued Cold-rolled steel: Results of operations of U.S. producers at constructed fair market value, by firm, 2012-14, January-June 2014, and January-June 2015
Item Fiscal year January-June
2012 2013 2014 2014 2015 Net income or (loss) value (1,000 dollars) AK Steel *** *** *** *** *** ArcelorMittal USA *** *** *** *** *** Blair *** *** *** *** *** CSI *** *** *** *** *** CSN *** *** *** *** *** Nucor *** *** *** *** *** Steel Dynamics *** *** *** *** *** Steelscape *** *** *** *** *** Thomas *** *** *** *** *** U.S. Steel *** *** *** *** *** USS-POSCO *** *** *** *** *** Worthington Steel *** *** *** *** ***
Total (547,115) (513,615) 22,836 (199,383) (390,169) Ratio of total COGS to sales (percent) AK Steel *** *** *** *** *** ArcelorMittal USA *** *** *** *** *** Blair *** *** *** *** *** CSI *** *** *** *** *** CSN *** *** *** *** *** Nucor *** *** *** *** *** Steel Dynamics *** *** *** *** *** Steelscape *** *** *** *** *** Thomas *** *** *** *** *** U.S. Steel *** *** *** *** *** USS-POSCO *** *** *** *** *** Worthington Steel *** *** *** *** ***
Average 98.4 98.8 95.7 97.7 98.5 Ratio of gross profit or (loss) to sales (percent) AK Steel *** *** *** *** *** ArcelorMittal USA *** *** *** *** *** Blair *** *** *** *** *** CSI *** *** *** *** *** CSN *** *** *** *** *** Nucor *** *** *** *** *** Steel Dynamics *** *** *** *** *** Steelscape *** *** *** *** *** Thomas *** *** *** *** *** U.S. Steel *** *** *** *** *** USS-POSCO *** *** *** *** *** Worthington Steel *** *** *** *** ***
Average 1.6 1.2 4.3 2.3 1.5 Table continued on the next page.

E‐9
Table E-1--Continued Cold-rolled steel: Results of operations of U.S. producers at constructed fair market value, by firm, 2012-14, January-June 2014, and January-June 2015
Item Fiscal year January-June
2012 2013 2014 2014 2015 Ratio of total SG&A expense to sales (percent) AK Steel *** *** *** *** *** ArcelorMittal USA *** *** *** *** *** Blair *** *** *** *** *** CSI *** *** *** *** *** CSN *** *** *** *** *** Nucor *** *** *** *** *** Steel Dynamics *** *** *** *** *** Steelscape *** *** *** *** *** Thomas *** *** *** *** *** U.S. Steel *** *** *** *** *** USS-POSCO *** *** *** *** *** Worthington Steel *** *** *** *** ***
Average 2.6 2.7 3.0 3.1 3.6 Ratio of operating income or (loss) to sales (percent) AK Steel *** *** *** *** *** ArcelorMittal USA *** *** *** *** *** Blair *** *** *** *** *** CSI *** *** *** *** *** CSN *** *** *** *** *** Nucor *** *** *** *** *** Steel Dynamics *** *** *** *** *** Steelscape *** *** *** *** *** Thomas *** *** *** *** *** U.S. Steel *** *** *** *** *** USS-POSCO *** *** *** *** *** Worthington Steel *** *** *** *** ***
Average (1.0) (1.6) 1.2 (0.8) (2.2) Ratio of net income or (loss) to sales (percent) AK Steel *** *** *** *** *** ArcelorMittal USA *** *** *** *** *** Blair *** *** *** *** *** CSI *** *** *** *** *** CSN *** *** *** *** *** Nucor *** *** *** *** *** Steel Dynamics *** *** *** *** *** Steelscape *** *** *** *** *** Thomas *** *** *** *** *** U.S. Steel *** *** *** *** *** USS-POSCO *** *** *** *** *** Worthington Steel *** *** *** *** ***
Average (2.7) (2.6) 0.1 (1.9) (4.5) Table continued on the next page.

E‐10
Table E-1--Continued Cold-rolled steel: Results of operations of U.S. producers at constructed fair market value, by firm, 2012-14, January-June 2014, and January-June 2015
Item Fiscal year January-June
2012 2013 2014 2014 2015 Unit value of commercial sales (dollars per short ton)
AK Steel *** *** *** *** *** ArcelorMittal USA *** *** *** *** *** Blair *** *** *** *** *** CSI *** *** *** *** *** CSN *** *** *** *** *** Nucor *** *** *** *** *** Steel Dynamics *** *** *** *** *** Steelscape *** *** *** *** *** Thomas *** *** *** *** *** U.S. Steel *** *** *** *** *** USS-POSCO *** *** *** *** *** Worthington Steel *** *** *** *** ***
Average 789.30 753.62 792.98 792.95 725.95 Unit value of internal consumption (dollars per short ton)
AK Steel *** *** *** *** *** ArcelorMittal USA *** *** *** *** *** Blair *** *** *** *** *** CSI *** *** *** *** *** CSN *** *** *** *** *** Nucor *** *** *** *** *** Steel Dynamics *** *** *** *** *** Steelscape *** *** *** *** *** Thomas *** *** *** *** *** U.S. Steel *** *** *** *** *** USS-POSCO *** *** *** *** *** Worthington Steel *** *** *** *** ***
Average *** *** *** *** *** Unit value of transfers (dollars per short ton)
AK Steel *** *** *** *** *** ArcelorMittal USA *** *** *** *** *** Blair *** *** *** *** *** CSI *** *** *** *** *** CSN *** *** *** *** *** Nucor *** *** *** *** *** Steel Dynamics *** *** *** *** *** Steelscape *** *** *** *** *** Thomas *** *** *** *** *** U.S. Steel *** *** *** *** *** USS-POSCO *** *** *** *** *** Worthington Steel *** *** *** *** ***
Average *** *** *** *** *** Table continued on the next page.
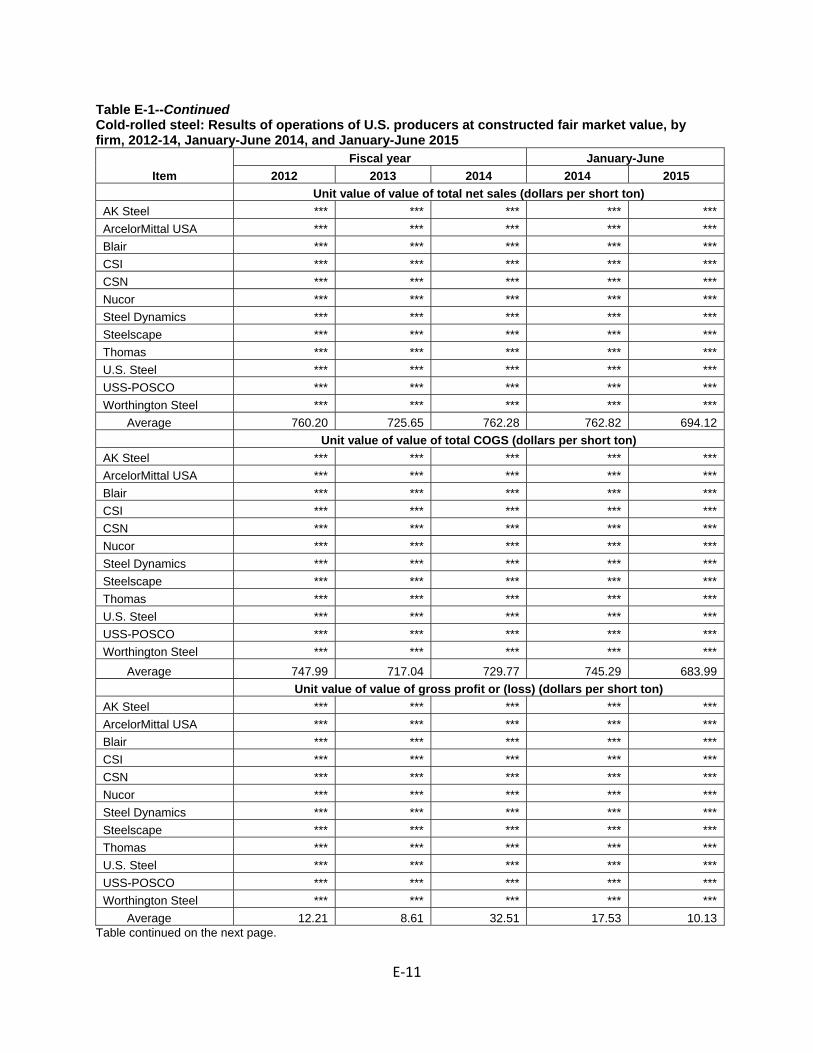
E‐11
Table E-1--Continued Cold-rolled steel: Results of operations of U.S. producers at constructed fair market value, by firm, 2012-14, January-June 2014, and January-June 2015
Item Fiscal year January-June
2012 2013 2014 2014 2015 Unit value of value of total net sales (dollars per short ton) AK Steel *** *** *** *** *** ArcelorMittal USA *** *** *** *** *** Blair *** *** *** *** *** CSI *** *** *** *** *** CSN *** *** *** *** *** Nucor *** *** *** *** *** Steel Dynamics *** *** *** *** *** Steelscape *** *** *** *** *** Thomas *** *** *** *** *** U.S. Steel *** *** *** *** *** USS-POSCO *** *** *** *** *** Worthington Steel *** *** *** *** ***
Average 760.20 725.65 762.28 762.82 694.12 Unit value of value of total COGS (dollars per short ton) AK Steel *** *** *** *** *** ArcelorMittal USA *** *** *** *** *** Blair *** *** *** *** *** CSI *** *** *** *** *** CSN *** *** *** *** *** Nucor *** *** *** *** *** Steel Dynamics *** *** *** *** *** Steelscape *** *** *** *** *** Thomas *** *** *** *** *** U.S. Steel *** *** *** *** *** USS-POSCO *** *** *** *** *** Worthington Steel *** *** *** *** ***
Average 747.99 717.04 729.77 745.29 683.99 Unit value of value of gross profit or (loss) (dollars per short ton) AK Steel *** *** *** *** *** ArcelorMittal USA *** *** *** *** *** Blair *** *** *** *** *** CSI *** *** *** *** *** CSN *** *** *** *** *** Nucor *** *** *** *** *** Steel Dynamics *** *** *** *** *** Steelscape *** *** *** *** *** Thomas *** *** *** *** *** U.S. Steel *** *** *** *** *** USS-POSCO *** *** *** *** *** Worthington Steel *** *** *** *** ***
Average 12.21 8.61 32.51 17.53 10.13 Table continued on the next page.

E‐12
Table E-1--Continued Cold-rolled steel: Results of operations of U.S. producers at constructed fair market value, by firm, 2012-14, January-June 2014, and January-June 2015
Item Fiscal year January-June
2012 2013 2014 2014 2015 Unit value of SG&A expense (dollars per short ton) AK Steel *** *** *** *** *** ArcelorMittal USA *** *** *** *** *** Blair *** *** *** *** *** CSI *** *** *** *** *** CSN *** *** *** *** *** Nucor *** *** *** *** *** Steel Dynamics *** *** *** *** *** Steelscape *** *** *** *** *** Thomas *** *** *** *** *** U.S. Steel *** *** *** *** *** USS-POSCO *** *** *** *** *** Worthington Steel *** *** *** *** *** Average 19.47 19.91 23.14 23.67 25.22 Unit value of operating income or (loss) (dollars per short ton) AK Steel *** *** *** *** *** ArcelorMittal USA *** *** *** *** *** Blair *** *** *** *** *** CSI *** *** *** *** *** CSN *** *** *** *** *** Nucor *** *** *** *** *** Steel Dynamics *** *** *** *** *** Steelscape *** *** *** *** *** Thomas *** *** *** *** *** U.S. Steel *** *** *** *** *** USS-POSCO *** *** *** *** *** Worthington Steel *** *** *** *** ***
Average (7.26) (11.30) 9.38 (6.14) (15.09) Unit value of net income or (loss) (dollars per short ton) AK Steel *** *** *** *** *** ArcelorMittal USA *** *** *** *** *** Blair *** *** *** *** *** CSI *** *** *** *** *** CSN *** *** *** *** *** Nucor *** *** *** *** *** Steel Dynamics *** *** *** *** *** Steelscape *** *** *** *** *** Thomas *** *** *** *** *** U.S. Steel *** *** *** *** *** USS-POSCO *** *** *** *** *** Worthington Steel *** *** *** *** ***
Average (20.33) (19.02) 0.84 (14.39) (30.99) Source: Compiled from data submitted in response to Commission questionnaires..

E‐13
Table E-2 Cold-rolled steel: Results of operations of U.S. producers at gross profit share, by firm, 2012-14, January-June 2014, and January-June 2015
Item Fiscal year January-June
2012 2013 2014 2014 2015 Commercial sales quantity (short tons) AK Steel *** *** *** *** *** ArcelorMittal USA *** *** *** *** *** Blair *** *** *** *** *** CSI *** *** *** *** *** CSN *** *** *** *** *** Nucor *** *** *** *** *** Steel Dynamics *** *** *** *** *** Steelscape *** *** *** *** *** Thomas *** *** *** *** *** U.S. Steel *** *** *** *** *** USS-POSCO *** *** *** *** *** Worthington Steel *** *** *** *** ***
Total 11,309,745 11,106,450 10,646,771 5,494,644 4,917,078 Internal consumption quantity (short tons) AK Steel *** *** *** *** *** ArcelorMittal USA *** *** *** *** *** Blair *** *** *** *** *** CSI *** *** *** *** *** CSN *** *** *** *** *** Nucor *** *** *** *** *** Steel Dynamics *** *** *** *** *** Steelscape *** *** *** *** *** Thomas *** *** *** *** *** U.S. Steel *** *** *** *** *** USS-POSCO *** *** *** *** *** Worthington Steel *** *** *** *** ***
Total *** *** *** *** *** Transfers quantity (short tons) AK Steel *** *** *** *** *** ArcelorMittal USA *** *** *** *** *** Blair *** *** *** *** *** CSI *** *** *** *** *** CSN *** *** *** *** *** Nucor *** *** *** *** *** Steel Dynamics *** *** *** *** *** Steelscape *** *** *** *** *** Thomas *** *** *** *** *** U.S. Steel *** *** *** *** *** USS-POSCO *** *** *** *** *** Worthington Steel *** *** *** *** ***
Total *** *** *** *** *** Table continued on the next page.

E‐14
Table E-2--Continued Cold-rolled steel: Results of operations of U.S. producers at gross profit share, by firm, 2012-14, January-June 2014, and January-June 2015
Item Fiscal year January-June
2012 2013 2014 2014 2015 Total net sales quantity (short tons) AK Steel *** *** *** *** *** ArcelorMittal USA *** *** *** *** *** Blair *** *** *** *** *** CSI *** *** *** *** *** CSN *** *** *** *** *** Nucor *** *** *** *** *** Steel Dynamics *** *** *** *** *** Steelscape *** *** *** *** *** Thomas *** *** *** *** *** U.S. Steel *** *** *** *** *** USS-POSCO *** *** *** *** *** Worthington Steel *** *** *** *** ***
Total 26,917,521 27,008,406 27,202,517 13,858,154 12,591,423 Commercial sales value (1,000 dollars) AK Steel *** *** *** *** *** ArcelorMittal USA *** *** *** *** *** Blair *** *** *** *** *** CSI *** *** *** *** *** CSN *** *** *** *** *** Nucor *** *** *** *** *** Steel Dynamics *** *** *** *** *** Steelscape *** *** *** *** *** Thomas *** *** *** *** *** U.S. Steel *** *** *** *** *** USS-POSCO *** *** *** *** *** Worthington Steel *** *** *** *** ***
Total 8,926,786 8,370,066 8,442,724 4,356,989 3,569,554 Internal consumption value (1,000 dollars) AK Steel *** *** *** *** *** ArcelorMittal USA *** *** *** *** *** Blair *** *** *** *** *** CSI *** *** *** *** *** CSN *** *** *** *** *** Nucor *** *** *** *** *** Steel Dynamics *** *** *** *** *** Steelscape *** *** *** *** *** Thomas *** *** *** *** *** U.S. Steel *** *** *** *** *** USS-POSCO *** *** *** *** *** Worthington Steel *** *** *** *** ***
Total *** *** *** *** *** Table continued on the next page.

E‐15
Table E-2--Continued Cold-rolled steel: Results of operations of U.S. producers at gross profit share, by firm, 2012-14, January-June 2014, and January-June 2015
Item Fiscal year January-June
2012 2013 2014 2014 2015 Transfers to related firms value (1,000 dollars) AK Steel *** *** *** *** *** ArcelorMittal USA *** *** *** *** *** Blair *** *** *** *** *** CSI *** *** *** *** *** CSN *** *** *** *** *** Nucor *** *** *** *** *** Steel Dynamics *** *** *** *** *** Steelscape *** *** *** *** *** Thomas *** *** *** *** *** U.S. Steel *** *** *** *** *** USS-POSCO *** *** *** *** *** Worthington Steel *** *** *** *** ***
Total *** *** *** *** *** Total net sales value (1,000 dollars) AK Steel *** *** *** *** *** ArcelorMittal USA *** *** *** *** *** Blair *** *** *** *** *** CSI *** *** *** *** *** CSN *** *** *** *** *** Nucor *** *** *** *** *** Steel Dynamics *** *** *** *** *** Steelscape *** *** *** *** *** Thomas *** *** *** *** *** U.S. Steel *** *** *** *** *** USS-POSCO *** *** *** *** *** Worthington Steel *** *** *** *** ***
Total 20,967,337 20,347,168 21,136,392 10,799,154 8,937,502 Total COGS value (1,000 dollars) AK Steel *** *** *** *** *** ArcelorMittal USA *** *** *** *** *** Blair *** *** *** *** *** CSI *** *** *** *** *** CSN *** *** *** *** *** Nucor *** *** *** *** *** Steel Dynamics *** *** *** *** *** Steelscape *** *** *** *** *** Thomas *** *** *** *** *** U.S. Steel *** *** *** *** *** USS-POSCO *** *** *** *** *** Worthington Steel *** *** *** *** ***
Total 20,134,082 19,366,194 19,851,482 10,328,648 8,612,305 Table continued on the next page.

E‐16
Table E-2--Continued Cold-rolled steel: Results of operations of U.S. producers at gross profit share, by firm, 2012-14, January-June 2014, and January-June 2015-
Item Fiscal year January-June
2012 2013 2014 2014 2015 Gross profit or (loss) value (1,000 dollars) AK Steel *** *** *** *** *** ArcelorMittal USA *** *** *** *** *** Blair *** *** *** *** *** CSI *** *** *** *** *** CSN *** *** *** *** *** Nucor *** *** *** *** *** Steel Dynamics *** *** *** *** *** Steelscape *** *** *** *** *** Thomas *** *** *** *** *** U.S. Steel *** *** *** *** *** USS-POSCO *** *** *** *** *** Worthington Steel *** *** *** *** ***
Total 833,255 980,974 1,284,910 470,506 325,197 Total SG&A expenses value (1,000 dollars) AK Steel *** *** *** *** *** ArcelorMittal USA *** *** *** *** *** Blair *** *** *** *** *** CSI *** *** *** *** *** CSN *** *** *** *** *** Nucor *** *** *** *** *** Steel Dynamics *** *** *** *** *** Steelscape *** *** *** *** *** Thomas *** *** *** *** *** U.S. Steel *** *** *** *** *** USS-POSCO *** *** *** *** *** Worthington Steel *** *** *** *** ***
Total 524,206 537,671 629,379 328,015 317,557 Operating income or (loss) value (1,000 dollars) AK Steel *** *** *** *** *** ArcelorMittal USA *** *** *** *** *** Blair *** *** *** *** *** CSI *** *** *** *** *** CSN *** *** *** *** *** Nucor *** *** *** *** *** Steel Dynamics *** *** *** *** *** Steelscape *** *** *** *** *** Thomas *** *** *** *** *** U.S. Steel *** *** *** *** *** USS-POSCO *** *** *** *** *** Worthington Steel *** *** *** *** ***
Total 309,049 443,303 655,531 142,491 7,640 Table continued on the next page.

E‐17
Table E-2--Continued Cold-rolled steel: Results of operations of U.S. producers at gross profit share, by firm, 2012-14, January-June 2014, and January-June 2015
Item Fiscal year January-June
2012 2013 2014 2014 2015 Net income or (loss) value (1,000 dollars) AK Steel *** *** *** *** *** ArcelorMittal USA *** *** *** *** *** Blair *** *** *** *** *** CSI *** *** *** *** *** CSN *** *** *** *** *** Nucor *** *** *** *** *** Steel Dynamics *** *** *** *** *** Steelscape *** *** *** *** *** Thomas *** *** *** *** *** U.S. Steel *** *** *** *** *** USS-POSCO *** *** *** *** *** Worthington Steel *** *** *** *** ***
Total (42,248) 234,788 423,262 28,180 (190,185) Ratio of total COGS to sales (percent) AK Steel *** *** *** *** *** ArcelorMittal USA *** *** *** *** *** Blair *** *** *** *** *** CSI *** *** *** *** *** CSN *** *** *** *** *** Nucor *** *** *** *** *** Steel Dynamics *** *** *** *** *** Steelscape *** *** *** *** *** Thomas *** *** *** *** *** U.S. Steel *** *** *** *** *** USS-POSCO *** *** *** *** *** Worthington Steel *** *** *** *** ***
Average 96.0 95.2 93.9 95.6 96.4 Ratio of gross profit or (loss) to sales (percent) AK Steel *** *** *** *** *** ArcelorMittal USA *** *** *** *** *** Blair *** *** *** *** *** CSI *** *** *** *** *** CSN *** *** *** *** *** Nucor *** *** *** *** *** Steel Dynamics *** *** *** *** *** Steelscape *** *** *** *** *** Thomas *** *** *** *** *** U.S. Steel *** *** *** *** *** USS-POSCO *** *** *** *** *** Worthington Steel *** *** *** *** ***
Average 4.0 4.8 6.1 4.4 3.6 Table continued on the next page.
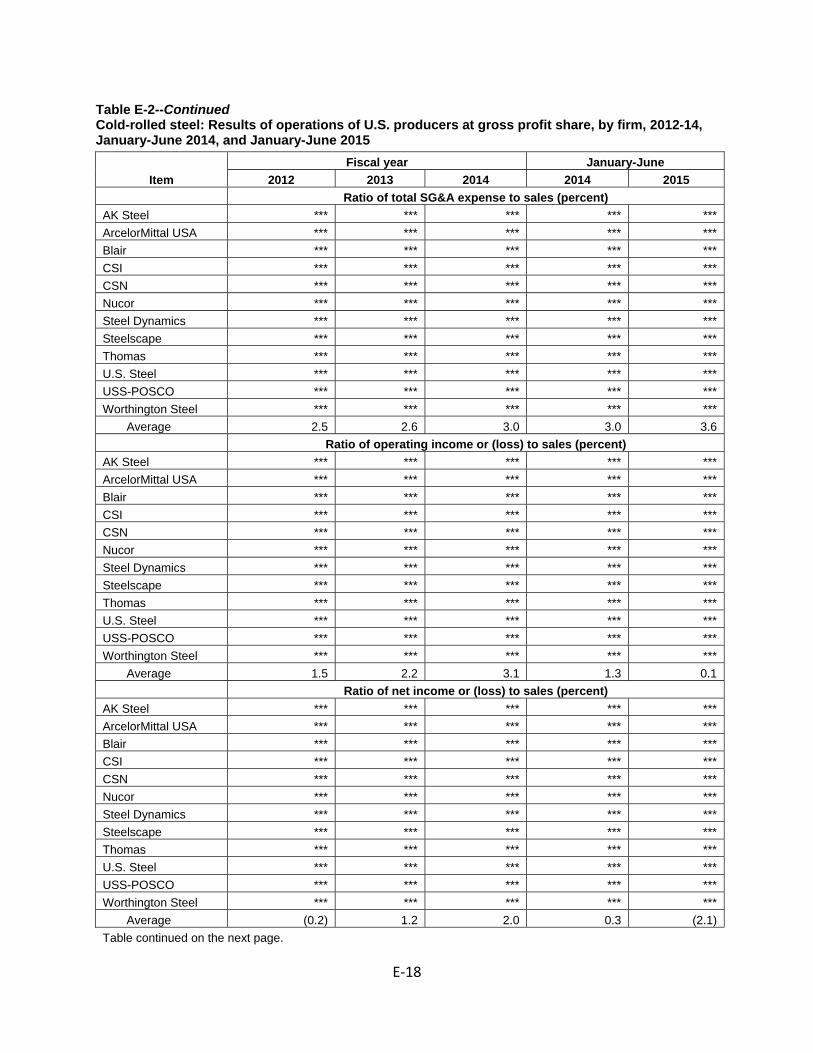
E‐18
Table E-2--Continued Cold-rolled steel: Results of operations of U.S. producers at gross profit share, by firm, 2012-14, January-June 2014, and January-June 2015
Item Fiscal year January-June
2012 2013 2014 2014 2015 Ratio of total SG&A expense to sales (percent) AK Steel *** *** *** *** *** ArcelorMittal USA *** *** *** *** *** Blair *** *** *** *** *** CSI *** *** *** *** *** CSN *** *** *** *** *** Nucor *** *** *** *** *** Steel Dynamics *** *** *** *** *** Steelscape *** *** *** *** *** Thomas *** *** *** *** *** U.S. Steel *** *** *** *** *** USS-POSCO *** *** *** *** *** Worthington Steel *** *** *** *** ***
Average 2.5 2.6 3.0 3.0 3.6 Ratio of operating income or (loss) to sales (percent) AK Steel *** *** *** *** *** ArcelorMittal USA *** *** *** *** *** Blair *** *** *** *** *** CSI *** *** *** *** *** CSN *** *** *** *** *** Nucor *** *** *** *** *** Steel Dynamics *** *** *** *** *** Steelscape *** *** *** *** *** Thomas *** *** *** *** *** U.S. Steel *** *** *** *** *** USS-POSCO *** *** *** *** *** Worthington Steel *** *** *** *** ***
Average 1.5 2.2 3.1 1.3 0.1 Ratio of net income or (loss) to sales (percent) AK Steel *** *** *** *** *** ArcelorMittal USA *** *** *** *** *** Blair *** *** *** *** *** CSI *** *** *** *** *** CSN *** *** *** *** *** Nucor *** *** *** *** *** Steel Dynamics *** *** *** *** *** Steelscape *** *** *** *** *** Thomas *** *** *** *** *** U.S. Steel *** *** *** *** *** USS-POSCO *** *** *** *** *** Worthington Steel *** *** *** *** ***
Average (0.2) 1.2 2.0 0.3 (2.1) Table continued on the next page.

E‐19
Table E-2--Continued Cold-rolled steel: Results of operations of U.S. producers at gross profit share, by firm, 2012-14, January-June 2014, and January-June 2015
Item Fiscal year January-June
2012 2013 2014 2014 2015 Unit value of commercial sales (dollars per short ton) AK Steel *** *** *** *** *** ArcelorMittal USA *** *** *** *** *** Blair *** *** *** *** *** CSI *** *** *** *** *** CSN *** *** *** *** *** Nucor *** *** *** *** *** Steel Dynamics *** *** *** *** *** Steelscape *** *** *** *** *** Thomas *** *** *** *** *** U.S. Steel *** *** *** *** *** USS-POSCO *** *** *** *** *** Worthington Steel *** *** *** *** ***
Average 789.30 753.62 792.98 792.95 725.95 Unit value of internal consumption (dollars per short ton) AK Steel *** *** *** *** *** ArcelorMittal USA *** *** *** *** *** Blair *** *** *** *** *** CSI *** *** *** *** *** CSN *** *** *** *** *** Nucor *** *** *** *** *** Steel Dynamics *** *** *** *** *** Steelscape *** *** *** *** *** Thomas *** *** *** *** *** U.S. Steel *** *** *** *** *** USS-POSCO *** *** *** *** *** Worthington Steel *** *** *** *** ***
Average *** *** *** *** *** Unit value of transfers (dollars per short ton) AK Steel *** *** *** *** *** ArcelorMittal USA *** *** *** *** *** Blair *** *** *** *** *** CSI *** *** *** *** *** CSN *** *** *** *** *** Nucor *** *** *** *** *** Steel Dynamics *** *** *** *** *** Steelscape *** *** *** *** *** Thomas *** *** *** *** *** U.S. Steel *** *** *** *** *** USS-POSCO *** *** *** *** *** Worthington Steel *** *** *** *** ***
Average *** *** *** *** *** Table continued on the next page.

E‐20
Table E-2--Continued Cold-rolled steel: Results of operations of U.S. producers at gross profit share, by firm, 2012-14, January-June 2014, and January-June 2015
Item Fiscal year January-June
2012 2013 2014 2014 2015 Unit value of total net sales (dollars per short ton) AK Steel *** *** *** *** *** ArcelorMittal USA *** *** *** *** *** Blair *** *** *** *** *** CSI *** *** *** *** *** CSN *** *** *** *** *** Nucor *** *** *** *** *** Steel Dynamics *** *** *** *** *** Steelscape *** *** *** *** *** Thomas *** *** *** *** *** U.S. Steel *** *** *** *** *** USS-POSCO *** *** *** *** *** Worthington Steel *** *** *** *** ***
Average 778.95 753.36 777.00 779.26 709.81 Unit value of COGS (dollars per short ton) AK Steel *** *** *** *** *** ArcelorMittal USA *** *** *** *** *** Blair *** *** *** *** *** CSI *** *** *** *** *** CSN *** *** *** *** *** Nucor *** *** *** *** *** Steel Dynamics *** *** *** *** *** Steelscape *** *** *** *** *** Thomas *** *** *** *** *** U.S. Steel *** *** *** *** *** USS-POSCO *** *** *** *** *** Worthington Steel *** *** *** *** ***
Average 747.99 717.04 729.77 745.31 683.98 Unit value of gross profit or (loss) (dollars per short ton) AK Steel *** *** *** *** *** ArcelorMittal USA *** *** *** *** *** Blair *** *** *** *** *** CSI *** *** *** *** *** CSN *** *** *** *** *** Nucor *** *** *** *** *** Steel Dynamics *** *** *** *** *** Steelscape *** *** *** *** *** Thomas *** *** *** *** *** U.S. Steel *** *** *** *** *** USS-POSCO *** *** *** *** *** Worthington Steel *** *** *** *** ***
Average 30.96 36.32 47.23 33.95 25.83 Table continued on the next page.

E‐21
Table E-2--Continued Cold-rolled steel: Results of operations of U.S. producers with internal consumption and transfers valued at cost plus share of downstream profit, by firm, 2012-14, January-June 2014, and January-
Item Fiscal year January-June
2012 2013 2014 2014 2015 Unit value of SG&A expense (dollars per short ton) AK Steel *** *** *** *** *** ArcelorMittal USA *** *** *** *** *** Blair *** *** *** *** *** CSI *** *** *** *** *** CSN *** *** *** *** *** Nucor *** *** *** *** *** Steel Dynamics *** *** *** *** *** Steelscape *** *** *** *** *** Thomas *** *** *** *** *** U.S. Steel *** *** *** *** *** USS-POSCO *** *** *** *** *** Worthington Steel *** *** *** *** ***
Average 19.47 19.91 23.14 23.67 25.22 Unit value of operating income or (loss) (dollars per short ton) AK Steel *** *** *** *** *** ArcelorMittal USA *** *** *** *** *** Blair *** *** *** *** *** CSI *** *** *** *** *** CSN *** *** *** *** *** Nucor *** *** *** *** *** Steel Dynamics *** *** *** *** *** Steelscape *** *** *** *** *** Thomas *** *** *** *** *** U.S. Steel *** *** *** *** *** USS-POSCO *** *** *** *** *** Worthington Steel *** *** *** *** ***
Average 11.48 16.41 24.10 10.28 0.61 Unit value of net income or (loss) (dollars per short ton) AK Steel *** *** *** *** *** ArcelorMittal USA *** *** *** *** *** Blair *** *** *** *** *** CSI *** *** *** *** *** CSN *** *** *** *** *** Nucor *** *** *** *** *** Steel Dynamics *** *** *** *** *** Steelscape *** *** *** *** *** Thomas *** *** *** *** *** U.S. Steel *** *** *** *** *** USS-POSCO *** *** *** *** *** Worthington Steel *** *** *** *** ***
Average (1.57) 8.69 15.56 2.03 (15.10) Source: Compiled from data submitted in response to Commission questionnaires.

E‐22
Table E-3 Cold-rolled steel: Results of of U.S. producers on open market operatons by firm, 2012-14, January-June 2014, and January-June 2015
Item Fiscal year January-June
2012 2013 2014 2014 2015 Commercial shipments quantity (short tons) AK Steel *** *** *** *** *** ArcelorMittal USA *** *** *** *** *** Blair *** *** *** *** *** CSI *** *** *** *** *** CSN *** *** *** *** *** Nucor *** *** *** *** *** Steel Dynamics *** *** *** *** *** Thomas *** *** *** *** *** U.S. Steel *** *** *** *** *** USS-POSCO *** *** *** *** *** Worthington Steel *** *** *** *** ***
Average 11,309,745 11,106,450 10,646,771 5,494,644 4,917,078 Commercial shipments value (1,000 dollars) AK Steel *** *** *** *** *** ArcelorMittal USA *** *** *** *** *** Blair *** *** *** *** *** CSI *** *** *** *** *** CSN *** *** *** *** *** Nucor *** *** *** *** *** Steel Dynamics *** *** *** *** *** Thomas *** *** *** *** *** U.S. Steel *** *** *** *** *** USS-POSCO *** *** *** *** *** Worthington Steel *** *** *** *** ***
Total 8,926,786 8,370,066 8,442,724 4,356,989 3,569,554 Total COGS value (1,000 dollars) AK Steel *** *** *** *** *** ArcelorMittal USA *** *** *** *** *** Blair *** *** *** *** *** CSI *** *** *** *** *** CSN *** *** *** *** *** Nucor *** *** *** *** *** Steel Dynamics *** *** *** *** *** Thomas *** *** *** *** *** U.S. Steel *** *** *** *** *** USS-POSCO *** *** *** *** *** Worthington Steel *** *** *** *** ***
Total 8,602,804 8,077,896 7,831,020 4,144,424 3,423,488 Table continued on the next page.

E‐23
Table E-3--Continued Cold-rolled steel: Results of of U.S. producers on open market operations by firm, 2012-14, January-June 2014, and January-June 2015
Item Fiscal year January-June
2012 2013 2014 2014 2015 Gross profit or (loss) value (1,000 dollars) AK Steel *** *** *** *** *** ArcelorMittal USA *** *** *** *** *** Blair *** *** *** *** *** CSI *** *** *** *** *** CSN *** *** *** *** *** Nucor *** *** *** *** *** Steel Dynamics *** *** *** *** *** Thomas *** *** *** *** *** U.S. Steel *** *** *** *** *** USS-POSCO *** *** *** *** *** Worthington Steel *** *** *** *** ***
Total 323,982 292,170 611,704 212,565 146,066 Total SG&A expenses value (1,000 dollars) AK Steel *** *** *** *** *** ArcelorMittal USA *** *** *** *** *** Blair *** *** *** *** *** CSI *** *** *** *** *** CSN *** *** *** *** *** Nucor *** *** *** *** *** Steel Dynamics *** *** *** *** *** Thomas *** *** *** *** *** U.S. Steel *** *** *** *** *** USS-POSCO *** *** *** *** *** Worthington Steel *** *** *** *** ***
Total 243,284 237,554 262,221 136,046 130,836 Operating income or (loss) value (1,000 dollars) AK Steel *** *** *** *** *** ArcelorMittal USA *** *** *** *** *** Blair *** *** *** *** *** CSI *** *** *** *** *** CSN *** *** *** *** *** Nucor *** *** *** *** *** Steel Dynamics *** *** *** *** *** Thomas *** *** *** *** *** U.S. Steel *** *** *** *** *** USS-POSCO *** *** *** *** *** Worthington Steel *** *** *** *** ***
Total 80,698 54,616 349,483 76,519 15,230 Table continued on the next page.

E‐24
Table E-3--Continued Cold-rolled steel: Results of of U.S. producers on open market operations by firm, 2012-14, January-June 2014, and January-June 2015
Item Fiscal year January-June
2012 2013 2014 2014 2015 Net income or (loss) value (1,000 dollars) AK Steel *** *** *** *** ***ArcelorMittal USA *** *** *** *** ***Blair *** *** *** *** ***CSI *** *** *** *** ***CSN *** *** *** *** ***Nucor *** *** *** *** ***Steel Dynamics *** *** *** *** ***Thomas *** *** *** *** ***U.S. Steel *** *** *** *** ***USS-POSCO *** *** *** *** ***Worthington Steel *** *** *** *** ***
Total (94,969) (29,275) 276,970 32,558 (66,945) Ratio of total COGS to sales (percent) AK Steel *** *** *** *** ***ArcelorMittal USA *** *** *** *** ***Blair *** *** *** *** ***CSI *** *** *** *** ***CSN *** *** *** *** ***Nucor *** *** *** *** ***Steel Dynamics *** *** *** *** ***Thomas *** *** *** *** ***U.S. Steel *** *** *** *** ***USS-POSCO *** *** *** *** ***Worthington Steel *** *** *** *** ***
Average 96.4 96.5 92.8 95.1 95.9 Ratio of gross profit or (loss) to sales (percent) AK Steel *** *** *** *** ***ArcelorMittal USA *** *** *** *** ***Blair *** *** *** *** ***CSI *** *** *** *** ***CSN *** *** *** *** ***Nucor *** *** *** *** ***Steel Dynamics *** *** *** *** ***Thomas *** *** *** *** ***U.S. Steel *** *** *** *** ***USS-POSCO *** *** *** *** ***Worthington Steel *** *** *** *** ***
Average 3.6 3.5 7.2 4.9 4.1 Table continued on the next page.

E‐25
Table E-3--Continued Cold-rolled steel: Results of of U.S. producers on open market operations by firm, 2012-14, January-June 2014, and January-June 2015
Item Fiscal year January-June
2012 2013 2014 2014 2015 Ratio of total SG&A expenses to sales (percent) AK Steel *** *** *** *** *** ArcelorMittal USA *** *** *** *** *** Blair *** *** *** *** *** CSI *** *** *** *** *** CSN *** *** *** *** *** Nucor *** *** *** *** *** Steel Dynamics *** *** *** *** *** Thomas *** *** *** *** *** U.S. Steel *** *** *** *** *** USS-POSCO *** *** *** *** *** Worthington Steel *** *** *** *** ***
Average 2.7 2.8 3.1 3.1 3.7 Ratio of operating income or (loss) to sales (percent) AK Steel *** *** *** *** *** ArcelorMittal USA *** *** *** *** *** Blair *** *** *** *** *** CSI *** *** *** *** *** CSN *** *** *** *** *** Nucor *** *** *** *** *** Steel Dynamics *** *** *** *** *** Thomas *** *** *** *** *** U.S. Steel *** *** *** *** *** USS-POSCO *** *** *** *** *** Worthington Steel *** *** *** *** ***
Average 0.9 0.7 4.1 1.8 0.4 Ratio of net income or (loss) to sales (percent) AK Steel *** *** *** *** *** ArcelorMittal USA *** *** *** *** *** Blair *** *** *** *** *** CSI *** *** *** *** *** CSN *** *** *** *** *** Nucor *** *** *** *** *** Steel Dynamics *** *** *** *** *** Thomas *** *** *** *** *** U.S. Steel *** *** *** *** *** USS-POSCO *** *** *** *** *** Worthington Steel *** *** *** *** ***
Average (1.1) (0.3) 3.3 0.7 (1.9) Table continued on the next page.
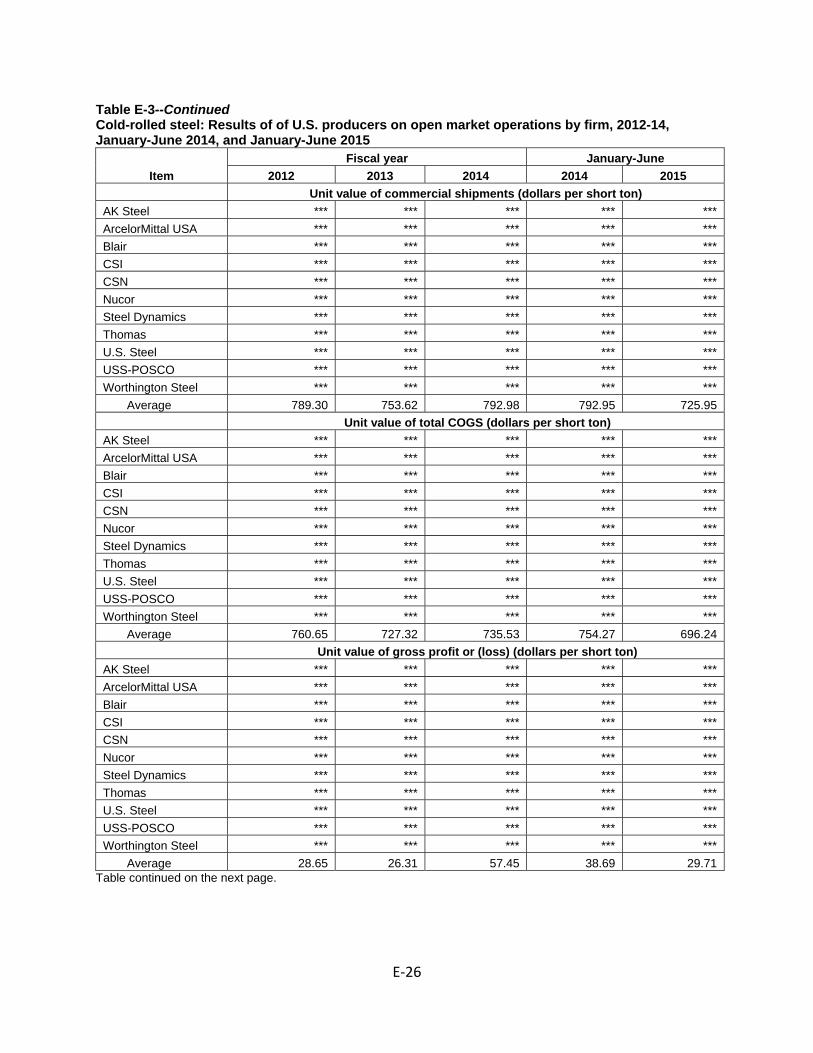
E‐26
Table E-3--Continued Cold-rolled steel: Results of of U.S. producers on open market operations by firm, 2012-14, January-June 2014, and January-June 2015
Item Fiscal year January-June
2012 2013 2014 2014 2015 Unit value of commercial shipments (dollars per short ton) AK Steel *** *** *** *** *** ArcelorMittal USA *** *** *** *** *** Blair *** *** *** *** *** CSI *** *** *** *** *** CSN *** *** *** *** *** Nucor *** *** *** *** *** Steel Dynamics *** *** *** *** *** Thomas *** *** *** *** *** U.S. Steel *** *** *** *** *** USS-POSCO *** *** *** *** *** Worthington Steel *** *** *** *** ***
Average 789.30 753.62 792.98 792.95 725.95 Unit value of total COGS (dollars per short ton) AK Steel *** *** *** *** *** ArcelorMittal USA *** *** *** *** *** Blair *** *** *** *** *** CSI *** *** *** *** *** CSN *** *** *** *** *** Nucor *** *** *** *** *** Steel Dynamics *** *** *** *** *** Thomas *** *** *** *** *** U.S. Steel *** *** *** *** *** USS-POSCO *** *** *** *** *** Worthington Steel *** *** *** *** ***
Average 760.65 727.32 735.53 754.27 696.24 Unit value of gross profit or (loss) (dollars per short ton) AK Steel *** *** *** *** *** ArcelorMittal USA *** *** *** *** *** Blair *** *** *** *** *** CSI *** *** *** *** *** CSN *** *** *** *** *** Nucor *** *** *** *** *** Steel Dynamics *** *** *** *** *** Thomas *** *** *** *** *** U.S. Steel *** *** *** *** *** USS-POSCO *** *** *** *** *** Worthington Steel *** *** *** *** ***
Average 28.65 26.31 57.45 38.69 29.71 Table continued on the next page.

E‐27
Table E-3--Continued Cold-rolled steel: Results of of U.S. producers on open market operations by firm, 2012-14, January-June 2014, and January-June 2015
Item Fiscal year January-June
2012 2013 2014 2014 2015 Unit value of SG&A expense (dollars per short ton) AK Steel *** *** *** *** *** ArcelorMittal USA *** *** *** *** *** Blair *** *** *** *** *** CSI *** *** *** *** *** CSN *** *** *** *** *** Nucor *** *** *** *** *** Steel Dynamics *** *** *** *** *** Thomas *** *** *** *** *** U.S. Steel *** *** *** *** *** USS-POSCO *** *** *** *** *** Worthington Steel *** *** *** *** ***
Average 21.51 21.39 24.63 24.76 26.61 Unit value of operating income or (loss) (dollars per short ton) AK Steel *** *** *** *** *** ArcelorMittal USA *** *** *** *** *** Blair *** *** *** *** *** CSI *** *** *** *** *** CSN *** *** *** *** *** Nucor *** *** *** *** *** Steel Dynamics *** *** *** *** *** Thomas *** *** *** *** *** U.S. Steel *** *** *** *** *** USS-POSCO *** *** *** *** *** Worthington Steel *** *** *** *** ***
Average 7.14 4.92 32.83 13.93 3.10 Unit value of net income or (loss) (dollars per short ton) AK Steel *** *** *** *** *** ArcelorMittal USA *** *** *** *** *** Blair *** *** *** *** *** CSI *** *** *** *** *** CSN *** *** *** *** *** Nucor *** *** *** *** *** Steel Dynamics *** *** *** *** *** Thomas *** *** *** *** *** U.S. Steel *** *** *** *** *** USS-POSCO *** *** *** *** *** Worthington Steel *** *** *** *** ***
Average (8.40) (2.64) 26.01 5.93 (13.61) Source: Compiled from data submitted in response to Commission questionnaires.


F-1
APPENDIX F
MONTHLY IMPORT DATA

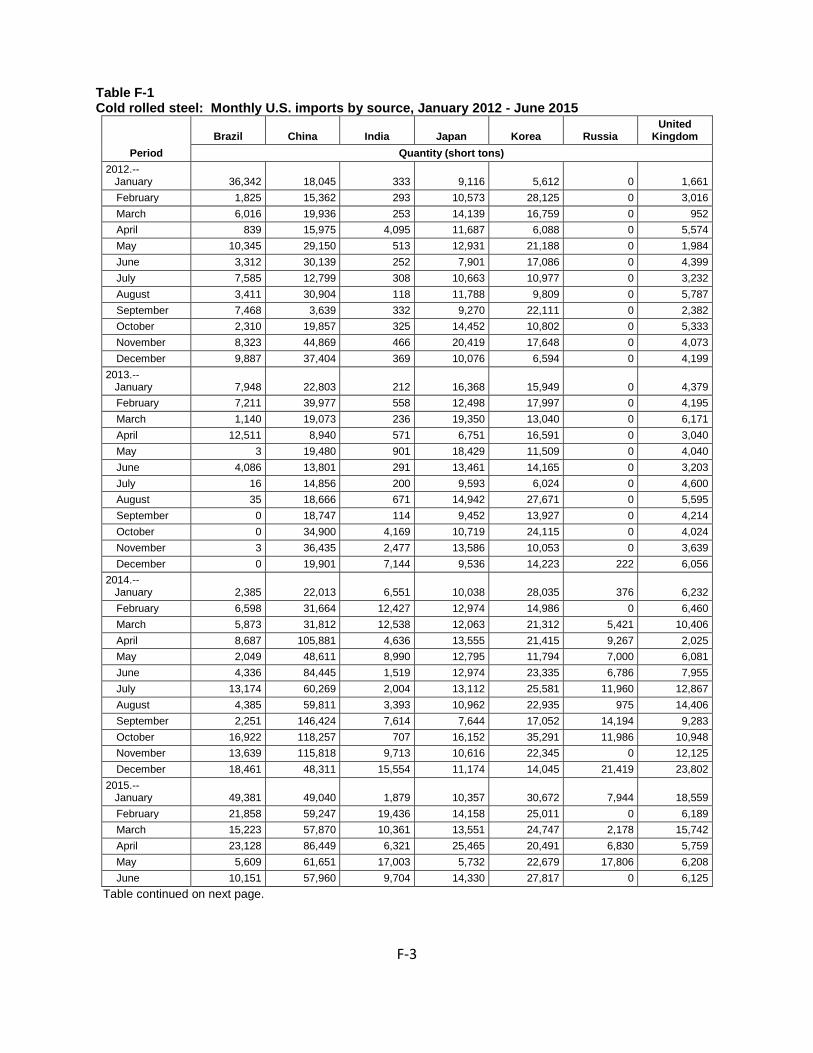
F-3
Table F-1 Cold rolled steel: Monthly U.S. imports by source, January 2012 - June 2015
Period Brazil China India Japan Korea Russia
United Kingdom
Quantity (short tons) 2012.-- January 36,342 18,045 333 9,116 5,612 0 1,661
February 1,825 15,362 293 10,573 28,125 0 3,016 March 6,016 19,936 253 14,139 16,759 0 952 April 839 15,975 4,095 11,687 6,088 0 5,574 May 10,345 29,150 513 12,931 21,188 0 1,984 June 3,312 30,139 252 7,901 17,086 0 4,399 July 7,585 12,799 308 10,663 10,977 0 3,232 August 3,411 30,904 118 11,788 9,809 0 5,787 September 7,468 3,639 332 9,270 22,111 0 2,382 October 2,310 19,857 325 14,452 10,802 0 5,333 November 8,323 44,869 466 20,419 17,648 0 4,073 December 9,887 37,404 369 10,076 6,594 0 4,199
2013.-- January 7,948 22,803 212 16,368 15,949 0 4,379
February 7,211 39,977 558 12,498 17,997 0 4,195 March 1,140 19,073 236 19,350 13,040 0 6,171 April 12,511 8,940 571 6,751 16,591 0 3,040 May 3 19,480 901 18,429 11,509 0 4,040 June 4,086 13,801 291 13,461 14,165 0 3,203 July 16 14,856 200 9,593 6,024 0 4,600 August 35 18,666 671 14,942 27,671 0 5,595 September 0 18,747 114 9,452 13,927 0 4,214 October 0 34,900 4,169 10,719 24,115 0 4,024 November 3 36,435 2,477 13,586 10,053 0 3,639 December 0 19,901 7,144 9,536 14,223 222 6,056
2014.-- January 2,385 22,013 6,551 10,038 28,035 376 6,232
February 6,598 31,664 12,427 12,974 14,986 0 6,460 March 5,873 31,812 12,538 12,063 21,312 5,421 10,406 April 8,687 105,881 4,636 13,555 21,415 9,267 2,025 May 2,049 48,611 8,990 12,795 11,794 7,000 6,081 June 4,336 84,445 1,519 12,974 23,335 6,786 7,955 July 13,174 60,269 2,004 13,112 25,581 11,960 12,867 August 4,385 59,811 3,393 10,962 22,935 975 14,406 September 2,251 146,424 7,614 7,644 17,052 14,194 9,283 October 16,922 118,257 707 16,152 35,291 11,986 10,948 November 13,639 115,818 9,713 10,616 22,345 0 12,125 December 18,461 48,311 15,554 11,174 14,045 21,419 23,802
2015.-- January 49,381 49,040 1,879 10,357 30,672 7,944 18,559
February 21,858 59,247 19,436 14,158 25,011 0 6,189 March 15,223 57,870 10,361 13,551 24,747 2,178 15,742 April 23,128 86,449 6,321 25,465 20,491 6,830 5,759 May 5,609 61,651 17,003 5,732 22,679 17,806 6,208 June 10,151 57,960 9,704 14,330 27,817 0 6,125
Table continued on next page.

F-4
Table F-1--Continued Cold rolled steel: Monthly U.S. imports by source, January 2012 - June 2015
Period
Subtotal, subject less Netherlands Netherlands
Subtotal, all subject sources Canada
All other sources Nonsubject
Total imports
Quantity (short tons) 2012.-- January 71,109 2,302 73,411 24,086 44,991 69,077 142,488
February 59,193 3,225 62,418 24,224 23,083 47,307 109,725 March 58,055 1,862 59,917 24,990 35,636 60,626 120,543 April 44,256 2,478 46,735 22,521 21,178 43,699 90,434 May 76,112 2,003 78,116 20,302 30,856 51,158 129,274 June 63,089 5,812 68,901 22,350 23,718 46,068 114,969 July 45,564 4,340 49,903 17,975 33,471 51,446 101,349 August 61,817 6,560 68,377 21,650 30,216 51,866 120,242 September 45,201 3,649 48,851 22,375 42,174 64,549 113,399 October 53,078 7,082 60,160 23,389 35,478 58,867 119,027 November 95,799 6,830 102,629 23,597 42,636 66,234 168,863 December 68,529 10,017 78,545 19,069 38,754 57,824 136,369
2013.-- January 67,659 2,307 69,966 23,727 33,263 56,991 126,957
February 82,437 1,634 84,070 19,802 30,302 50,104 134,174 March 59,010 1,283 60,293 26,588 34,921 61,509 121,802 April 48,405 2,677 51,082 26,701 35,197 61,897 112,979 May 54,361 7,126 61,487 20,791 29,693 50,483 111,971 June 49,007 5,706 54,713 20,861 30,812 51,673 106,385 July 35,288 4,775 40,063 20,359 37,554 57,913 97,976 August 67,581 4,713 72,294 22,316 33,245 55,561 127,855 September 46,453 8,287 54,741 24,945 40,279 65,223 119,964 October 77,927 5,594 83,521 27,087 41,321 68,408 151,929 November 66,193 12,277 78,470 23,916 41,950 65,867 144,337 December 57,081 5,033 62,113 22,856 36,058 58,914 121,027
2014.-- January 75,632 5,510 81,142 31,335 40,314 71,649 152,791
February 85,109 2,867 87,976 31,435 29,095 60,530 148,506 March 99,423 5,284 104,708 51,894 40,173 92,067 196,775 April 165,466 4,763 170,229 42,040 40,231 82,271 252,500 May 97,319 7,467 104,786 38,112 47,091 85,203 189,989 June 141,352 9,181 150,533 50,886 48,928 99,814 250,348 July 138,966 6,438 145,405 46,625 45,838 92,463 237,868 August 116,866 6,351 123,217 47,200 52,532 99,732 222,949 September 204,462 8,091 212,553 44,618 41,559 86,177 298,730 October 210,263 5,875 216,139 44,922 47,396 92,317 308,456 November 184,257 9,692 193,949 35,401 44,396 79,797 273,746 December 152,766 12,051 164,817 31,488 57,795 89,283 254,100
2015.-- January 167,834 5,766 173,600 34,923 43,532 78,455 252,055
February 145,900 4,673 150,572 38,774 50,411 89,185 239,757 March 139,672 2,546 142,218 35,385 39,430 74,815 217,032 April 174,444 3,674 178,118 37,850 38,788 76,638 254,756 May 136,689 9,172 145,861 27,909 39,360 67,269 213,130 June 126,086 5,888 131,975 35,262 37,332 72,594 204,569

F‐5
Note.— Official import statistics are for nonalloy and alloy cold-rolled steel, and are unadjusted. However, certain HTS statistical reporting numbers for alloy cold-rolled steel are overstated, either because of the inclusion of high-alloy steel or in some instances because of the inclusion of products other than cold-rolled steel. For example, Tata Steel Ijmuiden reported that ***. Tata Steel Ijmuiden’s postconference brief, Attachment 1. Source: Official U.S. import statistics using HTS statistical reporting numbers (for alloy and non-alloy cold-rolled steel): 7209.15.0000, 7209.16.0030, 7209.16.0060, 7209.16.0070, 7209.16.0091, 7209.17.0030, 7209.17.0060, 7209.17.0070, 7209.17.0091, 7209.18.1530, 7209.18.1560, 7209.18.2510, 7209.18.2520, 7209.18.2580, 7209.18.6020, 7209.18.6090, 7209.25.0000, 7209.26.0000, 7209.27.0000, 7209.28.0000, 7209.90.0000, 7210.70.3000, 7211.23.1500, 7211.23.2000, 7211.23.3000, 7211.23.4500, 7211.23.6030, 7211.23.6060, 7211.23.6085, 7211.29.2030, 7211.29.2090, 7211.29.4500, 7211.29.6030, 7211.29.6080, 7211.90.0000, 7212.40.1000, 7212.40.5000, 7225.50.6000, 7225.50.8085, 7225.99.0090, 7226.92.5000, 7226.92.7050, and 7226.92.8050.
