coke report
DESCRIPTION
Coke report Khi nghi ve doi nguoi toi thuong nho ve rung cay khi nghi ve rung cay toi thuong nho ve nhieu nguoiTRANSCRIPT

20FEB200902055832
UNITED STATESSECURITIES AND EXCHANGE COMMISSION
Washington, D.C. 20549
FORM 10-K� ANNUAL REPORT PURSUANT TO SECTION 13 OR 15(d) OF THE SECURITIES
EXCHANGE ACT OF 1934For the fiscal year ended December 31, 2012
OR
� TRANSITION REPORT PURSUANT TO SECTION 13 OR 15(d) OF THE SECURITIESEXCHANGE ACT OF 1934
For the transition period from to Commission File No. 001-02217
(Exact name of Registrant as specified in its charter)
DELAWARE 58-0628465(State or other jurisdiction of (IRS Employerincorporation or organization) Identification No.)
One Coca-Cola PlazaAtlanta, Georgia 30313
(Address of principal executive offices) (Zip Code)Registrant’s telephone number, including area code: (404) 676-2121
Securities registered pursuant to Section 12(b) of the Act:Title of each class Name of each exchange on which registered
COMMON STOCK, $0.25 PAR VALUE NEW YORK STOCK EXCHANGESecurities registered pursuant to Section 12(g) of the Act: None
Indicate by check mark if the Registrant is a well-known seasoned issuer, as defined in Rule 405 of the Securities Act.Yes � No �Indicate by check mark if the Registrant is not required to file reports pursuant to Section 13 or Section 15(d) of theExchange Act. Yes � No �Indicate by check mark whether the Registrant (1) has filed all reports required to be filed by Section 13 or 15(d) of theSecurities Exchange Act of 1934 during the preceding 12 months and (2) has been subject to such filing requirements for thepast 90 days. Yes � No �Indicate by check mark whether the Registrant has submitted electronically and posted on its corporate Web site, if any, everyInteractive Data File required to be submitted and posted pursuant to Rule 405 of Regulation S-T (§ 232.405 of this chapter)during the preceding 12 months (or for such shorter period that the Registrant was required to submit and post such files).Yes � No �Indicate by check mark if disclosure of delinquent filers pursuant to Item 405 of Regulation S-K (§ 229.405 of this chapter) isnot contained herein, and will not be contained, to the best of Registrant’s knowledge, in definitive proxy or informationstatements incorporated by reference in Part III of this Form 10-K or any amendment to this Form 10-K. �Indicate by check mark whether the Registrant is a large accelerated filer, an accelerated filer, a non-accelerated filer, or asmaller reporting company. See the definitions of ‘‘large accelerated filer,’’ ‘‘accelerated filer’’ and ‘‘smaller reportingcompany’’ in Rule 12b-2 of the Exchange Act. (Check one):
Large accelerated filer � Accelerated filer � Non-accelerated filer � Smaller reporting company �(Do not check if a smaller reporting company)
Indicate by check mark if the Registrant is a shell company (as defined in Rule 12b-2 of the Exchange Act). Yes � No �The aggregate market value of the common equity held by non-affiliates of the Registrant (assuming for these purposes, butwithout conceding, that all executive officers and Directors are ‘‘affiliates’’ of the Registrant) as of June 29, 2012, the lastbusiness day of the Registrant’s most recently completed second fiscal quarter, was $167,103,981,811 (based on the closing saleprice of the Registrant’s Common Stock on that date as reported on the New York Stock Exchange).The number of shares outstanding of the Registrant’s Common Stock as of February 25, 2013, was 4,456,717,996.
DOCUMENTS INCORPORATED BY REFERENCEPortions of the Company’s Proxy Statement for the Annual Meeting of Shareowners to be held on April 24, 2013, areincorporated by reference in Part III.

Table of Contents
Page
Forward-Looking Statements . . . . . . . . . . . . . . . . . . . . . . . . . . . . . . . . . . . . . . . . . . . . . . . . . . . . . . . . . . 1
Part I
Item 1. Business . . . . . . . . . . . . . . . . . . . . . . . . . . . . . . . . . . . . . . . . . . . . . . . . . . . . . . . . . . . . . . . . . . . . . . . . 1Item 1A. Risk Factors . . . . . . . . . . . . . . . . . . . . . . . . . . . . . . . . . . . . . . . . . . . . . . . . . . . . . . . . . . . . . . . . . . . . . 11Item 1B. Unresolved Staff Comments . . . . . . . . . . . . . . . . . . . . . . . . . . . . . . . . . . . . . . . . . . . . . . . . . . . . . . . . . . 20Item 2. Properties . . . . . . . . . . . . . . . . . . . . . . . . . . . . . . . . . . . . . . . . . . . . . . . . . . . . . . . . . . . . . . . . . . . . . . . 20Item 3. Legal Proceedings . . . . . . . . . . . . . . . . . . . . . . . . . . . . . . . . . . . . . . . . . . . . . . . . . . . . . . . . . . . . . . . . . 21Item 4. Mine Safety Disclosures . . . . . . . . . . . . . . . . . . . . . . . . . . . . . . . . . . . . . . . . . . . . . . . . . . . . . . . . . . . . . 23Item X. Executive Officers of the Company . . . . . . . . . . . . . . . . . . . . . . . . . . . . . . . . . . . . . . . . . . . . . . . . . . . . . 23
Part II
Item 5. Market for Registrant’s Common Equity, Related Stockholder Matters andIssuer Purchases of Equity Securities . . . . . . . . . . . . . . . . . . . . . . . . . . . . . . . . . . . . . . . . . . . . . . . . . . . 26
Item 6. Selected Financial Data . . . . . . . . . . . . . . . . . . . . . . . . . . . . . . . . . . . . . . . . . . . . . . . . . . . . . . . . . . . . . 29Item 7. Management’s Discussion and Analysis of Financial Condition and Results of Operations . . . . . . . . . . . . . . . . 29Item 7A. Quantitative and Qualitative Disclosures About Market Risk . . . . . . . . . . . . . . . . . . . . . . . . . . . . . . . . . . . . 76Item 8. Financial Statements and Supplementary Data . . . . . . . . . . . . . . . . . . . . . . . . . . . . . . . . . . . . . . . . . . . . . . 78Item 9. Changes in and Disagreements with Accountants on Accounting and Financial Disclosure . . . . . . . . . . . . . . . . 158Item 9A. Controls and Procedures . . . . . . . . . . . . . . . . . . . . . . . . . . . . . . . . . . . . . . . . . . . . . . . . . . . . . . . . . . . . . 158Item 9B. Other Information . . . . . . . . . . . . . . . . . . . . . . . . . . . . . . . . . . . . . . . . . . . . . . . . . . . . . . . . . . . . . . . . . 158
Part III
Item 10. Directors, Executive Officers and Corporate Governance . . . . . . . . . . . . . . . . . . . . . . . . . . . . . . . . . . . . . . 158Item 11. Executive Compensation . . . . . . . . . . . . . . . . . . . . . . . . . . . . . . . . . . . . . . . . . . . . . . . . . . . . . . . . . . . . . 158Item 12. Security Ownership of Certain Beneficial Owners and Management and Related Stockholder Matters . . . . . . . 158Item 13. Certain Relationships and Related Transactions, and Director Independence . . . . . . . . . . . . . . . . . . . . . . . . . 158Item 14. Principal Accountant Fees and Services . . . . . . . . . . . . . . . . . . . . . . . . . . . . . . . . . . . . . . . . . . . . . . . . . . 159
Part IV
Item 15. Exhibits and Financial Statement Schedules . . . . . . . . . . . . . . . . . . . . . . . . . . . . . . . . . . . . . . . . . . . . . . . 159Signatures . . . . . . . . . . . . . . . . . . . . . . . . . . . . . . . . . . . . . . . . . . . . . . . . . . . . . . . . . . . . . . . . . . . . . . . 169

FORWARD-LOOKING STATEMENTS
This report contains information that may constitute ‘‘forward-looking statements.’’ Generally, the words ‘‘believe,’’ ‘‘expect,’’ ‘‘intend,’’‘‘estimate,’’ ‘‘anticipate,’’ ‘‘project,’’ ‘‘will’’ and similar expressions identify forward-looking statements, which generally are not historicalin nature. However, the absence of these words or similar expressions does not mean that a statement is not forward-looking. Allstatements that address operating performance, events or developments that we expect or anticipate will occur in the future — includingstatements relating to volume growth, share of sales and earnings per share growth, and statements expressing general views about futureoperating results — are forward-looking statements. Management believes that these forward-looking statements are reasonable as andwhen made. However, caution should be taken not to place undue reliance on any such forward-looking statements because suchstatements speak only as of the date when made. Our Company undertakes no obligation to publicly update or revise any forward-looking statements, whether as a result of new information, future events or otherwise, except as required by law. In addition, forward-looking statements are subject to certain risks and uncertainties that could cause actual results to differ materially from our Company’shistorical experience and our present expectations or projections. These risks and uncertainties include, but are not limited to, thosedescribed in Part I, ‘‘Item 1A. Risk Factors’’ and elsewhere in this report and those described from time to time in our future reportsfiled with the Securities and Exchange Commission.
PART I
ITEM 1. BUSINESS
In this report, the terms ‘‘The Coca-Cola Company,’’ ‘‘Company,’’ ‘‘we,’’ ‘‘us’’ and ‘‘our’’ mean The Coca-Cola Company and allentities included in our consolidated financial statements.
General
The Coca-Cola Company is the world’s largest beverage company. We own or license and market more than 500 nonalcoholicbeverage brands, primarily sparkling beverages but also a variety of still beverages such as waters, enhanced waters, juices andjuice drinks, ready-to-drink teas and coffees, and energy and sports drinks. We own and market four of the world’s top fivenonalcoholic sparkling beverage brands: Coca-Cola, Diet Coke, Fanta and Sprite. Finished beverage products bearing ourtrademarks, sold in the United States since 1886, are now sold in more than 200 countries.
We make our branded beverage products available to consumers throughout the world through our network of Company-ownedor -controlled bottling and distribution operations as well as independent bottling partners, distributors, wholesalers andretailers — the world’s largest beverage distribution system. Of the approximately 57 billion beverage servings of all typesconsumed worldwide every day, beverages bearing trademarks owned by or licensed to us account for more than 1.8 billionservings.
We believe that our success depends on our ability to connect with consumers by providing them with a wide variety of options tomeet their desires, needs and lifestyle choices. Our success further depends on the ability of our people to execute effectively,every day.
Our goal is to use our Company’s assets — our brands, financial strength, unrivaled distribution system, global reach, and thetalent and strong commitment of our management and associates — to become more competitive and to accelerate growth in amanner that creates value for our shareowners.
We were incorporated in September 1919 under the laws of the State of Delaware and succeeded to the business of a Georgiacorporation with the same name that had been organized in 1892.
1

Acquisition of Coca-Cola Enterprises Inc.’s Former North America Business and Related Transactions
On October 2, 2010, we acquired the former North America business of Coca-Cola Enterprises Inc. (‘‘CCE’’), one of our majorbottlers, consisting of CCE’s production, sales and distribution operations in the United States, Canada, the British Virgin Islands,the United States Virgin Islands and the Cayman Islands, and a substantial majority of CCE’s corporate segment. CCEshareowners other than the Company exchanged their CCE common stock for common stock in a new entity named Coca-ColaEnterprises, Inc. (‘‘New CCE’’), which, after the closing of the transaction, continued to hold the European operations that hadbeen held by CCE prior to the acquisition. The Company does not have any ownership interest in New CCE. Upon completion ofthe CCE transaction, we combined the management of the acquired North America business with the management of our existingfoodservice business; Minute Maid and Odwalla juice businesses; North America supply chain operations; and Company-ownedbottling operations in Philadelphia, Pennsylvania, into a unified bottling and customer service organization called Coca-ColaRefreshments (‘‘CCR’’). In addition, we reshaped our remaining Coca-Cola North America (‘‘CCNA’’) operations into anorganization that primarily provides franchise leadership and consumer marketing and innovation for the North American market.As a result of the transaction and related reorganization, our North American businesses operate as aligned and agileorganizations with distinct capabilities, responsibilities and strengths.
In contemplation of the closing of our acquisition of CCE’s former North America business, we reached an agreement withDr Pepper Snapple Group, Inc. (‘‘DPS’’) to distribute certain DPS brands in territories where DPS brands had been distributed byCCE prior to the CCE transaction. Under the terms of our agreement with DPS, concurrently with the closing of the CCEtransaction, we entered into license agreements with DPS to distribute Dr Pepper trademark brands in the United States, CanadaDry in the Northeastern United States, and Canada Dry and C’ Plus in Canada, and we made a net one-time cash payment of$715 million to DPS. Under the license agreements, the Company agreed to meet certain performance obligations to distributeDPS products in retail and foodservice accounts and vending machines. The license agreements have initial terms of 20 years, withautomatic 20-year renewal periods unless otherwise terminated under the terms of the agreements. The license agreementsreplaced agreements between DPS and CCE existing immediately prior to the completion of the CCE transaction. In addition, weentered into an agreement with DPS to include Dr Pepper and Diet Dr Pepper in our Coca-Cola Freestyle fountain dispensers incertain outlets throughout the United States. The Coca-Cola Freestyle agreement has a term of 20 years.
On October 2, 2010, we sold all of our ownership interests in Coca-Cola Drikker AS (the ‘‘Norwegian bottling operation’’) andCoca-Cola Drycker Sverige AB (the ‘‘Swedish bottling operation’’) to New CCE for $0.9 billion in cash. In addition, in connectionwith the acquisition of CCE’s former North America business, we granted to New CCE the right to negotiate the acquisition ofour majority interest in our German bottler at any time from 18 to 39 months after February 25, 2010, at the then current fairvalue and subject to terms and conditions as mutually agreed.
Operating Segments
The Company’s operating structure is the basis for our internal financial reporting. As of December 31, 2012, our operatingstructure included the following operating segments, the first six of which are sometimes referred to as ‘‘operating groups’’ or‘‘groups’’:
• Eurasia and Africa
• Europe
• Latin America
• North America
• Pacific
• Bottling Investments
• Corporate
Our North America operating segment includes CCE’s former North America business we acquired on October 2, 2010. EffectiveJanuary 1, 2013, we transferred our India and Southwest Asia business unit from the Eurasia and Africa operating segment to thePacific operating segment.
Except to the extent that differences among operating segments are material to an understanding of our business taken as awhole, the description of our business in this report is presented on a consolidated basis.
For financial information about our operating segments and geographic areas, refer to Note 19 of Notes to Consolidated FinancialStatements set forth in Part II, ‘‘Item 8. Financial Statements and Supplementary Data’’ of this report, incorporated herein byreference. For certain risks attendant to our non-U.S. operations, refer to ‘‘Item 1A. Risk Factors’’ below.
2

Products and Brands
As used in this report:
• ‘‘concentrates’’ means flavoring ingredients and, depending on the product, sweeteners used to prepare syrups or finishedbeverages, and includes powders for purified water products such as Dasani;
• ‘‘syrups’’ means beverage ingredients produced by combining concentrates and, depending on the product, sweeteners andadded water;
• ‘‘fountain syrups’’ means syrups that are sold to fountain retailers, such as restaurants and convenience stores, which usedispensing equipment to mix the syrups with sparkling or still water at the time of purchase to produce finished beveragesthat are served in cups or glasses for immediate consumption;
• ‘‘sparkling beverages’’ means nonalcoholic ready-to-drink beverages with carbonation, including carbonated energy drinksand carbonated waters and flavored waters;
• ‘‘still beverages’’ means nonalcoholic beverages without carbonation, including noncarbonated waters, flavored waters andenhanced waters, noncarbonated energy drinks, juices and juice drinks, ready-to-drink teas and coffees, and sports drinks;
• ‘‘Company Trademark Beverages’’ means beverages bearing our trademarks and certain other beverage products bearingtrademarks licensed to us by third parties for which we provide marketing support and from the sale of which we deriveeconomic benefit; and
• ‘‘Trademark Coca-Cola Beverages’’ or ‘‘Trademark Coca-Cola’’ means beverages bearing the trademark Coca-Cola or anytrademark that includes Coca-Cola or Coke (that is, Coca-Cola, Diet Coke and Coca-Cola Zero and all their variations andline extensions, including Coca-Cola Light, caffeine free Diet Coke, Cherry Coke, etc.). Likewise, when we use thecapitalized word ‘‘Trademark’’ together with the name of one of our other beverage products (such as ‘‘Trademark Fanta,’’‘‘Trademark Sprite’’ or ‘‘Trademark Simply’’), we mean beverages bearing the indicated trademark (that is, Fanta, Sprite orSimply, respectively) and all its variations and line extensions (such that ‘‘Trademark Fanta’’ includes Fanta Orange, FantaZero Orange, Fanta Apple, etc.; ‘‘Trademark Sprite’’ includes Sprite, Diet Sprite, Sprite Zero, Sprite Light, etc.; and‘‘Trademark Simply’’ includes Simply Orange, Simply Apple, Simply Grapefruit, etc.).
Our Company markets, manufactures and sells:
• beverage concentrates, sometimes referred to as ‘‘beverage bases,’’ and syrups, including fountain syrups (we refer to thispart of our business as our ‘‘concentrate business’’ or ‘‘concentrate operations’’); and
• finished sparkling and still beverages (we refer to this part of our business as our ‘‘finished product business’’ or ‘‘finishedproduct operations’’).
Generally, finished product operations generate higher net operating revenues but lower gross profit margins than concentrateoperations.
In our concentrate operations, we typically generate net operating revenues by selling concentrates and syrups to authorizedbottling and canning operations (to which we typically refer as our ‘‘bottlers’’ or our ‘‘bottling partners’’). Our bottling partnerseither combine the concentrates with sweeteners (depending on the product), still water and/or sparkling water, or combine thesyrups with sparkling water to produce finished beverages. The finished beverages are packaged in authorized containers bearingour trademarks or trademarks licensed to us — such as cans and refillable and nonrefillable glass and plastic bottles — and arethen sold to retailers directly or, in some cases, through wholesalers or other bottlers. Outside the United States, we also sellconcentrates for fountain beverages to our bottling partners who are typically authorized to manufacture fountain syrups, whichthey sell to fountain retailers such as restaurants and convenience stores which use the fountain syrups to produce beverages forimmediate consumption, or to fountain wholesalers who in turn sell and distribute the fountain syrups to fountain retailers.
Our finished product operations consist primarily of the production, sales and distribution operations managed by CCR and ourCompany-owned or -controlled bottling and distribution operations. CCR is included in our North America operating segment,and our Company-owned or -controlled bottling and distribution operations are included in our Bottling Investments operatingsegment. Our finished product operations generate net operating revenues by selling sparkling beverages and a variety of stillbeverages, such as juices and juice drinks, energy and sports drinks, ready-to-drink teas and coffees, and certain water products,to retailers or to distributors, wholesalers and bottling partners who distribute them to retailers. In addition, in the UnitedStates, we manufacture fountain syrups and sell them to fountain retailers, such as restaurants and convenience stores who usethe fountain syrups to produce beverages for immediate consumption, or to authorized fountain wholesalers or bottling partners
3

who resell the fountain syrups to fountain retailers. In the United States, we authorize wholesalers to resell our fountain syrupsthrough nonexclusive appointments that neither restrict us in setting the prices at which we sell fountain syrups to the wholesalersnor restrict the territories in which the wholesalers may resell in the United States.
For information about net operating revenues and unit case volume related to our concentrate operations and finished productoperations, respectively, refer to the heading ‘‘Our Business — General’’ in Part II, ‘‘Item 7. Management’s Discussion andAnalysis of Financial Condition and Results of Operations’’ of this report, which is incorporated herein by reference.
Most of our branded beverage products, particularly outside of North America, are manufactured, sold and distributed byindependent bottling partners. However, from time to time we acquire or take control of bottling or canning operations, often inunderperforming markets where we believe we can use our resources and expertise to improve performance. Owning such acontrolling interest enables us to compensate for limited local resources; help focus the bottler’s sales and marketing programs;assist in the development of the bottler’s business and information systems; and establish an appropriate capital structure for thebottler. The Company-owned or -controlled bottling operations, other than those managed by CCR, are included in our BottlingInvestments group.
In line with our long-term bottling strategy, we may periodically consider options for reducing our ownership interest in a BottlingInvestments group bottler. One such option is to combine our bottling interests with the bottling interests of others to formstrategic business alliances. Another option is to sell our interest in a bottling operation to one of our other bottling partners inwhich we have an equity method investment. In both of these situations, our Company continues to participate in the bottler’sresults of operations through our share of the strategic business alliance’s or equity method investee’s earnings or losses.
The following are our most significant brands:
Coca-Cola Fanta Dasani Minute Maid PulpyDiet Coke/Coca-Cola Light Minute Maid Glaceau Vitaminwater Del Valle3
Coca-Cola Zero Powerade Georgia1 Ayataka4
Sprite Aquarius Simply2 I Lohas5
1 Georgia is primarily a coffee brand sold mainly in Japan.2 Simply is a juice and juice drink brand sold in North America.3 The Company manufactures, markets and sells juices and juice drinks under the Del Valle trademark through joint ventures with our bottling
partners in Mexico and Brazil.4 Ayataka is a green tea brand sold in Japan.5 I Lohas is a water brand sold in Japan.
In addition, pursuant to master distribution and coordination agreements with Monster Beverage Corporation (‘‘Monster’’), wedistribute certain Monster brands, primarily Monster Energy beverages, in designated territories in the United States and Canada,and certain of our bottlers distribute such Monster brands in designated U.S. and international territories. Pursuant to licenseagreements with DPS, we distribute certain DPS brands in designated territories in the United States and Canada. Prior to andduring 2012, we also distributed Nestea products in the United States under a sublicense from a subsidiary of Nestle S.A.(‘‘Nestle’’), and in various other markets worldwide through Beverage Partners Worldwide (‘‘BPW’’), the Company’s joint venturewith Nestle. The Nestea trademark is owned by Societe des Produits Nestle S.A. The Company and Nestle terminated thesublicense agreement for Nestea in the United States and phased out the BPW joint venture in all territories other than marketsin Europe, Canada, Australia, Hong Kong, Macau and Taiwan by the end of 2012.
In 2012, the Company invested in the beverage business of Aujan Industries Company J.S.C. (‘‘Aujan’’), one of the largestindependent beverage companies in the Middle East. As a result of this transaction, the Company acquired 50 percent of theAujan entity that holds the rights to Aujan-owned brands, including Rani, a juice brand, and Barbican, a flavored malt beveragebrand, in certain territories.
Consumer demand determines the optimal menu of Company product offerings. Consumer demand can vary from one locale toanother and can change over time within a single locale. Employing our business strategy, and with special focus on core brands,our Company seeks to build its existing brands and, at the same time, to broaden its historical family of brands, products andservices in order to create and satisfy consumer demand locale by locale.
During 2012, our Company introduced a variety of new brands, brand extensions and new beverage products. The Companylaunched Fuze Tea, a new international tea brand, in 24 countries. In the Latin America group, leveraging our existing portfolio,we launched Andina Del Valle Sabores Caseros, a juice nectar targeted to capture the homemade juice category, in Chile and
4

two extension flavors of Del Valle juice (Del Valle Maracuya & Nada and Del Valle Limon & Nada) in Brazil. The introductionof the new Fuze Tea brand in the Latin America group was successful, and we captured consumer brand preference in keycountries such as Chile, Mexico, Costa Rica, Colombia, Ecuador and El Salvador. In addition, we launched Glaceau Vitaminwaterin Chile and Colombia, and launched Blak Coffee in Costa Rica and Colombia. In the Pacific group, we launched Fuze Tea, afruit-flavored black tea beverage, in Korea and Mongolia. In China, we introduced a new 300 mL PET pack for Coca-Cola, Fantaand Sprite sparkling beverages, and Guo Qing Xin, a fruit-flavored beverage, under the Minute Maid brand. In Japan, weintroduced Mate Cha, a mate tea inspired by the traditional South American tea drink. In the Europe group, we were very activeon product launches containing stevia, a non-nutritive sweetener. Numerous tea formulations under the Nestea brand were rolledout across the European continent, while in France and Switzerland a new Sprite containing 30 percent less sugar was madepossible through the use of stevia.
In furtherance of our commitments to sustainability and innovation, our PlantBottle� packaging technology, which is PET plasticthat contains up to 30 percent renewable material from plants, is becoming more widely used around the world. By the end of2012, we had distributed nearly 13 billion PlantBottle packages in 24 countries. Also, in 2012, we continued expansion ofCoca-Cola Freestyle, our revolutionary fountain dispenser that offers over 100 drink choices at the touch of a button, to thousandsof outlets across the United States and internationally.
We measure the volume of Company beverage products sold in two ways: (1) unit cases of finished products and (2) concentratesales. As used in this report, ‘‘unit case’’ means a unit of measurement equal to 192 U.S. fluid ounces of finished beverage(24 eight-ounce servings); and ‘‘unit case volume’’ means the number of unit cases (or unit case equivalents) of Company beverageproducts directly or indirectly sold by the Company and its bottling partners (the ‘‘Coca-Cola system’’) to customers. Unit casevolume primarily consists of beverage products bearing Company trademarks. Also included in unit case volume are certainproducts licensed to, or distributed by, our Company, and brands owned by Coca-Cola system bottlers for which our Companyprovides marketing support and from the sale of which we derive economic benefit. In addition, unit case volume includes sales byjoint ventures in which the Company has an equity interest. We believe unit case volume is one of the measures of the underlyingstrength of the Coca-Cola system because it measures trends at the consumer level. The unit case volume numbers used in thisreport are derived based on estimates received by the Company from its bottling partners and distributors. Concentrate salesvolume represents the amount of concentrates and syrups (in all cases expressed in equivalent unit cases) sold by, or used infinished beverages sold by, the Company to its bottling partners or other customers. Unit case volume and concentrate salesvolume growth rates are not necessarily equal during any given period. Factors such as seasonality, bottlers’ inventory practices,supply point changes, timing of price increases, new product introductions and changes in product mix can impact unit casevolume and concentrate sales volume and can create differences between unit case volume and concentrate sales volume growthrates. In addition to the items mentioned above, the impact of unit case volume from certain joint ventures, in which theCompany has an equity interest, but to which the Company does not sell concentrates or syrups, may give rise to differencesbetween unit case volume and concentrate sales volume growth rates.
Distribution System and Bottler’s Agreements
We make our branded beverage products available to consumers in more than 200 countries through our network of Company-owned or -controlled bottling and distribution operations as well as independent bottling partners, distributors, wholesalers andretailers — the world’s largest beverage distribution system. Consumers enjoy finished beverage products bearing our trademarksat a rate of more than 1.8 billion servings each day. We continue to expand our marketing presence and increase our unit casevolume in developed, developing and emerging markets. Our strong and stable system helps us to capture growth bymanufacturing, distributing and marketing existing, enhanced and new innovative products to our consumers throughout the world.
The Coca-Cola system sold approximately 27.7 billion, 26.7 billion and 25.5 billion unit cases of our products in 2012, 2011 and2010, respectively. The number of unit cases sold in 2012 does not include BPW unit case volume for those countries in whichBPW was phased out in 2012, nor does it include unit case volume of products distributed in the United States under a sublicensefrom a subsidiary of Nestle which terminated at the end of 2012. Sparkling beverages represented approximately 75 percent,75 percent and 76 percent of our worldwide unit case volume for 2012, 2011 and 2010, respectively. Trademark Coca-ColaBeverages accounted for approximately 48 percent, 49 percent and 50 percent of our worldwide unit case volume for 2012, 2011and 2010, respectively.
In 2012, unit case volume in the United States (‘‘U.S. unit case volume’’) represented approximately 19 percent of the Company’sworldwide unit case volume. Of the U.S. unit case volume for 2012, approximately 70 percent was attributable to sparklingbeverages and approximately 30 percent to still beverages. Trademark Coca-Cola Beverages accounted for approximately48 percent of U.S. unit case volume for 2012.
5
Unit case volume outside the United States represented approximately 81 percent of the Company’s worldwide unit case volumefor 2012. The countries outside the United States in which our unit case volumes were the largest in 2012 were Mexico, China,Brazil and Japan, which together accounted for approximately 31 percent of our worldwide unit case volume. Of the non-U.S. unitcase volume for 2012, approximately 76 percent was attributable to sparkling beverages and approximately 24 percent to stillbeverages. Trademark Coca-Cola Beverages accounted for approximately 48 percent of non-U.S. unit case volume for 2012.
In our concentrate operations, we typically sell concentrates and syrups to our bottling partners, who use the concentrate tomanufacture finished products which they sell to distributors and other customers. Separate contracts (‘‘Bottler’s Agreements’’)exist between our Company and each of our bottling partners regarding the manufacture and sale of Company products. Subjectto specified terms and conditions and certain variations, the Bottler’s Agreements generally authorize the bottlers to preparespecified Company Trademark Beverages, to package the same in authorized containers, and to distribute and sell the same in(but, subject to applicable local law, generally only in) an identified territory. The bottler is obligated to purchase its entirerequirement of concentrates or syrups for the designated Company Trademark Beverages from the Company or Company-authorized suppliers. We typically agree to refrain from selling or distributing, or from authorizing third parties to sell ordistribute, the designated Company Trademark Beverages throughout the identified territory in the particular authorizedcontainers; however, we typically reserve for ourselves or our designee the right (1) to prepare and package such beverages insuch containers in the territory for sale outside the territory, and (2) to prepare, package, distribute and sell such beverages in theterritory in any other manner or form. Territorial restrictions on bottlers vary in some cases in accordance with local law.
Being a bottler does not create a legal partnership or joint venture between us and our bottlers. Our bottlers are independentcontractors and are not our agents.
While, as described below, under most of our Bottler’s Agreements we generally have complete flexibility to determine the priceand other terms of sale of the concentrates and syrups we sell to our bottlers, as a practical matter, our Company’s ability toexercise its contractual flexibility to determine the price and other terms of sale of its syrups, concentrates and finished beveragesis subject, both outside and within the United States, to competitive market conditions.
Bottler’s Agreements Outside the United States
The Bottler’s Agreements between us and our authorized bottlers outside the United States generally are of stated duration,subject in some cases to possible extensions or renewals of the term of the contract. Generally, these contracts are subject totermination by the Company following the occurrence of certain designated events. These events include defined events of defaultand certain changes in ownership or control of the bottler.
In certain parts of the world outside the United States, we have not granted comprehensive beverage production rights to thebottlers. In such instances, we or our authorized suppliers sell Company Trademark Beverages to the bottlers for sale anddistribution throughout the designated territory, often on a nonexclusive basis. Most of the Bottler’s Agreements in force betweenus and bottlers outside the United States authorize the bottlers to manufacture and distribute fountain syrups, usually on anonexclusive basis.
Our Company generally has complete flexibility to determine the price and other terms of sale of the concentrates and syrups wesell to bottlers outside the United States. In some instances, however, we have agreed or may in the future agree with a bottlerwith respect to concentrate pricing on a prospective basis for specified time periods. In some markets, in an effort to allow ourCompany and our bottling partners to grow together through shared value, aligned incentives and the flexibility necessary to meetconsumers’ always changing needs and tastes, we worked with our bottling partners to develop and implement an incidence-basedpricing model for sparkling and still beverages. Under this model, the concentrate price we charge is impacted by a number offactors, including, but not limited to, bottler pricing, the channels in which the finished products are sold and package mix.Outside the United States, in most cases, we have no obligation to provide marketing support to the bottlers. Nevertheless, wemay, at our discretion, contribute toward bottler expenditures for advertising and marketing. We may also elect to undertakeindependent or cooperative advertising and marketing activities.
6
Bottler’s Agreements Within the United States
During the year ended December 31, 2012, CCR, our bottling and customer service organization for North America,manufactured, sold and distributed approximately 88 percent of our unit case volume in the United States. The discussion belowregarding the terms of Bottler’s Agreements and other contracts relates to Bottler’s Agreements and contracts for territories inthe United States that are not covered by CCR.
In the United States, with certain very limited exceptions, the Bottler’s Agreements for Trademark Coca-Cola Beverages and othercola-flavored beverages have no stated expiration date. Our standard contracts for other sparkling beverage flavors and for stillbeverages are of stated duration, subject to bottler renewal rights. The Bottler’s Agreements in the United States are subject totermination by the Company for nonperformance or upon the occurrence of certain defined events of default that may vary fromcontract to contract.
Under the terms of the Bottler’s Agreements, bottlers in the United States are authorized to manufacture and distribute CompanyTrademark Beverages in bottles and cans. However, these bottlers generally are not authorized to manufacture fountain syrups.Rather, in the United States, our Company manufactures and sells fountain syrups to authorized fountain wholesalers (includingcertain authorized bottlers) and some fountain retailers. These wholesalers in turn sell the syrups or deliver them on our behalf torestaurants and other retailers.
Certain of the Bottler’s Agreements for cola-flavored sparkling beverages in effect in the United States give us complete flexibilityto determine the price and other terms of sale of concentrates and syrups for Company Trademark Beverages. In some instances,we have agreed or may in the future agree with a bottler with respect to concentrate pricing on a prospective basis for specifiedtime periods. Certain Bottler’s Agreements, entered into prior to 1987, provide for concentrates or syrups for certain TrademarkCoca-Cola Beverages and other cola-flavored Company Trademark Beverages to be priced pursuant to a stated formula. Bottlersthat accounted for approximately 5.6 percent of total unit case volume in the United States in 2012 have contracts for certainTrademark Coca-Cola Beverages and other cola-flavored Company Trademark Beverages with pricing formulas that generallyprovide for a baseline price. This baseline price may be adjusted periodically by the Company, up to a maximum indexed ceilingprice, and is adjusted quarterly based upon changes in certain sugar or sweetener prices, as applicable. Bottlers that accounted forapproximately 0.3 percent of total unit case volume in the United States in 2012 operate under our oldest form of contract, whichprovides for a fixed price for Coca-Cola syrup used in bottles and cans. This price is subject to quarterly adjustments to reflectchanges in the quoted price of sugar.
We have standard contracts with bottlers in the United States for the sale of concentrates and syrups for non-cola-flavoredsparkling beverages and certain still beverages in bottles and cans, and, in certain cases, for the sale of finished still beverages inbottles and cans. All of these standard contracts give the Company complete flexibility to determine the price and other terms ofsale.
In an effort to allow our Company and our bottling partners to grow together through shared value, aligned incentives and theflexibility necessary to meet consumers’ always changing needs and tastes, we worked with bottling partners that produce anddistribute most of our non-CCR unit case volume in the United States to develop and implement an incidence-based pricingmodel, primarily for sparkling beverages. Under this model, the concentrate price we charge is impacted by a number of factors,including, but not limited to, bottler pricing, the channels in which the finished products are sold and package mix. We expect touse an incidence-based pricing model in 2013 with bottlers that produce and distribute most of our non-CCR unit case volume inthe United States.
Under most of our Bottler’s Agreements and other standard beverage contracts with bottlers in the United States, our Companyhas no obligation to participate with bottlers in expenditures for advertising and marketing. Nevertheless, at our discretion, wemay contribute toward such expenditures and undertake independent or cooperative advertising and marketing activities. SomeU.S. Bottler’s Agreements entered into prior to 1987 impose certain marketing obligations on us with respect to certain CompanyTrademark Beverages.
7

Promotions and Marketing Programs
In addition to conducting our own independent advertising and marketing activities, we may provide promotional and marketingservices or funds to our bottlers. In most cases, we do this on a discretionary basis under the terms of commitment letters oragreements, even though we are not obligated to do so under the terms of the bottling or distribution agreements between ourCompany and the bottlers. Also, on a discretionary basis in most cases, our Company may develop and introduce new products,packages and equipment to assist the bottlers. Likewise, in many instances, we provide promotional and marketing services and/orfunds and/or dispensing equipment and repair services to fountain and bottle/can retailers, typically pursuant to marketingagreements. The aggregate amount of funds provided by our Company to bottlers, resellers or other customers of our Company’sproducts, principally for participation in promotional and marketing programs, was $6.1 billion in 2012.
Significant Equity Method Investments
We make equity investments in selected bottling operations with the intention of maximizing the strength and efficiency of theCoca-Cola system’s production, distribution and marketing capabilities around the world. These investments are intended to resultin increases in unit case volume, net revenues and profits at the bottler level, which in turn generate increased concentrate salesfor our Company’s concentrate and syrup business. When this occurs, both we and our bottling partners benefit from long-termgrowth in volume, improved cash flows and increased shareowner value. In cases where our investments in bottlers representnoncontrolling interests, our intention is to provide expertise and resources to strengthen those businesses. When our equityinvestment provides us with the ability to exercise significant influence over the investee bottler’s operating and financial policies,we account for the investment under the equity method, and we sometimes refer to such a bottler as an ‘‘equity method investeebottler’’ or ‘‘equity method investee.’’
Our significant equity method investee bottlers include the following:
• Coca-Cola Hellenic Bottling Company S.A. (‘‘Coca-Cola Hellenic’’)
• Coca-Cola FEMSA, S.A.B. de C.V. (‘‘Coca-Cola FEMSA’’)
• Coca-Cola Amatil Limited (‘‘Coca-Cola Amatil’’)
Our ownership interest in Coca-Cola Hellenic was 23 percent as of December 31, 2012. Coca-Cola Hellenic has bottling anddistribution rights, through direct ownership or joint ventures, in Armenia, Austria, Belarus, Bosnia-Herzegovina, Bulgaria,Croatia, Cyprus, the Czech Republic, Estonia, the Former Yugoslav Republic of Macedonia, Greece, Hungary, Italy, Latvia,Lithuania, Moldova, Montenegro, Nigeria, Northern Ireland, Poland, Republic of Ireland, Romania, Russia, Serbia, Slovakia,Slovenia, Switzerland and Ukraine. Coca-Cola Hellenic estimates that the area in these 28 countries which it serves through itsbottling and distribution rights has a combined population of 581 million people. In 2012, 47 percent of the unit case volume ofCoca-Cola Hellenic consisted of Trademark Coca-Cola Beverages; 50 percent of its unit case volume consisted of other CompanyTrademark Beverages; and 3 percent of its unit case volume consisted of beverage products of Coca-Cola Hellenic or othercompanies.
Our ownership interest in Coca-Cola FEMSA was 29 percent as of December 31, 2012. Coca-Cola FEMSA is a Mexican holdingcompany with bottling subsidiaries in a substantial part of central Mexico, including Mexico City and the southeast and northeastparts of Mexico; greater Sao Paulo, Campinas, Santos, the state of Matto Grosso do Sul, part of the state of Minas Gerais andpart of the state of Goias in Brazil; central Guatemala; most of Colombia; all of Costa Rica, Nicaragua, Panama and Venezuela;and greater Buenos Aires, Argentina. Coca-Cola FEMSA estimates that the territories in which it markets beverage productscontain 55 percent of the population of Mexico, 22 percent of the population of Brazil, 99 percent of the population of Colombia,35 percent of the population of Guatemala, 100 percent of the populations of Costa Rica, Nicaragua, Panama and Venezuela, and32 percent of the population of Argentina. In 2012, 60 percent of the unit case volume of Coca-Cola FEMSA consisted ofTrademark Coca-Cola Beverages and 40 percent of its unit case volume consisted of other Company Trademark Beverages.
Our ownership interest in Coca-Cola Amatil was 29 percent as of December 31, 2012. Coca-Cola Amatil has bottling anddistribution rights, through direct ownership or joint ventures, in Australia, New Zealand, Fiji, Papua New Guinea and Indonesia.Coca-Cola Amatil estimates that the territories in which it markets beverage products contain 100 percent of the populations ofAustralia, New Zealand, Fiji and Papua New Guinea, and 98 percent of the population of Indonesia. In 2012, 44 percent of theunit case volume of Coca-Cola Amatil consisted of Trademark Coca-Cola Beverages; 42 percent of its unit case volume consistedof other Company Trademark Beverages; and 14 percent of its unit case volume consisted of beverage products of Coca-ColaAmatil or other companies.
8
Seasonality
Sales of our nonalcoholic ready-to-drink beverages are somewhat seasonal, with the second and third calendar quarters accountingfor the highest sales volumes. The volume of sales in the beverage business may be affected by weather conditions.
Competition
Our Company competes in the nonalcoholic beverage segment of the commercial beverage industry. The nonalcoholic beveragesegment of the commercial beverage industry is highly competitive, consisting of numerous companies. These include companiesthat, like our Company, compete in multiple geographic areas, as well as businesses that are primarily regional or local inoperation. Competitive products include numerous nonalcoholic sparkling beverages; various water products, including packaged,flavored and enhanced waters; juices and nectars; fruit drinks and dilutables (including syrups and powdered drinks); coffees andteas; energy and sports and other performance-enhancing drinks; dairy-based drinks; functional beverages; and various othernonalcoholic beverages. These competitive beverages are sold to consumers in both ready-to-drink and other than ready-to-drinkform. In many of the countries in which we do business, including the United States, PepsiCo, Inc. is one of our primarycompetitors. Other significant competitors include, but are not limited to, Nestle, DPS, Groupe Danone, Kraft Foods Group, Inc.,and Unilever. In certain markets, our competition includes beer companies. We also compete against numerous regional and localcompanies and, in some markets, against retailers that have developed their own store or private label beverage brands.
Competitive factors impacting our business include, but are not limited to, pricing, advertising, sales promotion programs, productinnovation, increased efficiency in production techniques, the introduction of new packaging, new vending and dispensingequipment, and brand and trademark development and protection.
Our competitive strengths include leading brands with high levels of consumer acceptance; a worldwide network of bottlers anddistributors of Company products; sophisticated marketing capabilities; and a talented group of dedicated associates. Ourcompetitive challenges include strong competition in all geographic regions and, in many countries, a concentrated retail sectorwith powerful buyers able to freely choose among Company products, products of competitive beverage suppliers and individualretailers’ own store or private label beverage brands.
Raw Materials
Water is a main ingredient in substantially all of our products. While historically we have not experienced significant water supplydifficulties, water is a limited natural resource in many parts of the world, and our Company recognizes water availability, qualityand sustainability, for both our operations and also the communities where we operate, as one of the key challenges facing ourbusiness.
In addition to water, the principal raw materials used in our business are nutritive and non-nutritive sweeteners. In the UnitedStates, the principal nutritive sweetener is high fructose corn syrup (‘‘HFCS’’), a form of sugar, which is available from numerousdomestic sources and is historically subject to fluctuations in its market price. The principal nutritive sweetener used by ourbusiness outside the United States is sucrose, another form of sugar, which is also available from numerous sources and ishistorically subject to fluctuations in its market price. Our Company generally has not experienced any difficulties in obtaining itsrequirements for nutritive sweeteners. In the United States, we purchase HFCS to meet our and our bottlers’ requirements withthe assistance of Coca-Cola Bottlers’ Sales & Services Company LLC (‘‘CCBSS’’). CCBSS is a limited liability company that isowned by authorized Coca-Cola bottlers doing business in the United States. Among other things, CCBSS provides procurementservices to our Company for the purchase of various goods and services in the United States, including HFCS.
The principal non-nutritive sweeteners we use in our business are aspartame, acesulfame potassium, saccharin, cyclamate andsucralose. Generally, these raw materials are readily available from numerous sources. However, our Company purchasesaspartame, an important non-nutritive sweetener that is used alone or in combination with other important non-nutritivesweeteners such as saccharin or acesulfame potassium in our low-calorie sparkling beverage products, primarily from TheNutraSweet Company and Ajinomoto Co., Inc., which we consider to be our primary sources for the supply of this product. Wecurrently purchase acesulfame potassium from Nutrinova Nutrition Specialties & Food Ingredients GmbH, which we consider tobe our primary source for the supply of this product, and from one additional supplier. Our Company generally has notexperienced any difficulties in obtaining its requirements for non-nutritive sweeteners.
Our Company sells a number of products sweetened with sucralose, a non-nutritive sweetener. We work closely with Tate &Lyle PLC, our primary sucralose supplier, to maintain continuity of supply, and we do not anticipate difficulties in obtaining ourrequirements. We also sell beverage products sweetened with a non-nutritive sweetener derived from the stevia plant. We do notanticipate difficulties sourcing stevia-based ingredients.
9
With regard to juice and juice drink products, juice and juice concentrate from various fruits, particularly orange juice and orangejuice concentrate, are our principal raw materials. The citrus industry is subject to the variability of weather conditions. Inparticular, freezing weather or hurricanes in central Florida may result in shortages and higher prices for orange juice and orangejuice concentrate throughout the industry. We source our orange juice and orange juice concentrate primarily from Florida andthe Southern Hemisphere (particularly Brazil). Therefore, we typically have an adequate supply of orange juice and orange juiceconcentrate that meets our Company’s standards.
Our Company-owned or consolidated bottling and canning operations and our finished product business also purchase variousother raw materials including, but not limited to, PET resin, preforms and bottles; glass and aluminum bottles; aluminum andsteel cans; plastic closures; aseptic fiber packaging; labels; cartons; cases; post-mix packaging; and carbon dioxide. We generallypurchase these raw materials from multiple suppliers and historically have not experienced material shortages.
Patents, Copyrights, Trade Secrets and Trademarks
Our Company owns numerous patents, copyrights and trade secrets, as well as substantial know-how and technology, which wecollectively refer to in this report as ‘‘technology.’’ This technology generally relates to our Company’s products and the processesfor their production; the packages used for our products; the design and operation of various processes and equipment used inour business; and certain quality assurance software. Some of the technology is licensed to suppliers and other parties. Oursparkling beverage and other beverage formulae are among the important trade secrets of our Company.
We own numerous trademarks that are very important to our business. Depending upon the jurisdiction, trademarks are valid aslong as they are in use and/or their registrations are properly maintained. Pursuant to our Bottler’s Agreements, we authorize ourbottlers to use applicable Company trademarks in connection with their manufacture, sale and distribution of Company products.In addition, we grant licenses to third parties from time to time to use certain of our trademarks in conjunction with certainmerchandise and food products.
Governmental Regulation
Our Company is required to comply, and it is our policy to comply, with all applicable laws in the numerous countries throughoutthe world in which we do business. In many jurisdictions, compliance with competition laws is of special importance to us, and ouroperations may come under special scrutiny by competition law authorities due to our competitive position in those jurisdictions.
In the United States, the safety, production, transportation, distribution, advertising, labeling and sale of many of our Company’sproducts and their ingredients are subject to the Federal Food, Drug, and Cosmetic Act; the Federal Trade Commission Act; theLanham Act; state consumer protection laws; competition laws; federal, state and local workplace health and safety laws; variousfederal, state and local environmental protection laws; and various other federal, state and local statutes and regulations. Outsidethe United States, our business is subject to numerous similar statutes and regulations, as well as other legal and regulatoryrequirements.
A California law known as Proposition 65 requires that a warning appear on any product sold in California that contains asubstance that, in the view of the state, causes cancer or birth defects. The state maintains lists of these substances andperiodically adds other substances to these lists. Proposition 65 exposes all food and beverage producers to the possibility ofhaving to provide warnings on their products in California because it does not provide for any generally applicable quantitativethreshold below which the presence of a listed substance is exempt from the warning requirement. Consequently, the detection ofeven a trace amount of a listed substance can subject an affected product to the requirement of a warning label. However,Proposition 65 does not require a warning if the manufacturer of a product can demonstrate that the use of that product exposesconsumers to a daily quantity of a listed substance that is:
• below a ‘‘safe harbor’’ threshold that may be established;
• naturally occurring;
• the result of necessary cooking; or
• subject to another applicable exemption.
One or more substances that are currently on the Proposition 65 lists, or that may be added in the future, can be detected inCompany products at low levels that are safe. With respect to substances that have not yet been listed under Proposition 65, theCompany takes the position that listing is not scientifically justified. With respect to substances that are already listed, theCompany takes the position that the presence of each such substance in Company products is subject to an applicable exemptionfrom the warning requirement. The State of California or other parties, however, may take a contrary position.
10

Bottlers of our beverage products presently offer and use nonrefillable, recyclable containers in the United States and variousother markets around the world. Some of these bottlers also offer and use refillable containers, which are also recyclable. Legalrequirements apply in various jurisdictions in the United States and overseas requiring that deposits or certain ecotaxes or fees becharged for the sale, marketing and use of certain nonrefillable beverage containers. The precise requirements imposed by thesemeasures vary. Other types of statutes and regulations relating to beverage container deposits, recycling, ecotaxes and/or productstewardship also apply in various jurisdictions in the United States and overseas. We anticipate that additional, similar legalrequirements may be proposed or enacted in the future at local, state and federal levels, both in the United States and elsewhere.
All of our Company’s facilities and other operations in the United States and elsewhere around the world are subject to variousenvironmental protection statutes and regulations, including those relating to the use of water resources and the discharge ofwastewater. Our policy is to comply with all such legal requirements. Compliance with these provisions has not had, and we donot expect such compliance to have, any material adverse effect on our Company’s capital expenditures, net income or competitiveposition.
Employees
As of December 31, 2012 and 2011, our Company had approximately 150,900 and 146,200 employees, respectively, of whichapproximately 4,400 and 4,700, respectively, were employed by consolidated variable interest entities (‘‘VIEs’’). The increase in thetotal number of employees in 2012 was primarily due to the acquisition of bottling operations in Vietnam, Cambodia, Guatemalaand the United States. As of December 31, 2012 and 2011, our Company had approximately 68,300 and 67,400 employees,respectively, located in the United States, of which approximately 500 and 600, respectively, were employed by consolidated VIEs.
Our Company, through its divisions and subsidiaries, is a party to numerous collective bargaining agreements. As of December 31,2012, approximately 17,900 employees in North America were covered by collective bargaining agreements. These agreementstypically have terms of three to five years. We currently expect that we will be able to renegotiate such agreements on satisfactoryterms when they expire.
The Company believes that its relations with its employees are generally satisfactory.
Securities Exchange Act Reports
The Company maintains a website at the following address: www.coca-colacompany.com. The information on the Company’swebsite is not incorporated by reference in this annual report on Form 10-K.
We make available on or through our website certain reports and amendments to those reports that we file with or furnish to theSecurities and Exchange Commission (the ‘‘SEC’’) in accordance with the Securities Exchange Act of 1934, as amended (the‘‘Exchange Act’’). These include our annual reports on Form 10-K, our quarterly reports on Form 10-Q and our current reportson Form 8-K. We make this information available on our website free of charge as soon as reasonably practicable after weelectronically file the information with, or furnish it to, the SEC.
ITEM 1A. RISK FACTORS
In addition to the other information set forth in this report, you should carefully consider the following factors, which couldmaterially affect our business, financial condition or results of operations in future periods. The risks described below are not theonly risks facing our Company. Additional risks not currently known to us or that we currently deem to be immaterial also maymaterially adversely affect our business, financial condition or results of operations in future periods.
Obesity and other health concerns may reduce demand for some of our products.
Consumers, public health officials and government officials are highly concerned about the public health consequences associatedwith obesity, particularly among young people. In addition, some researchers, health advocates and dietary guidelines areencouraging consumers to reduce consumption of sugar-sweetened beverages, including those sweetened with HFCS or othernutritive sweeteners. Increasing public concern about these issues; possible new taxes on sugar-sweetened beverages; additionalgovernmental regulations concerning the marketing, labeling, packaging or sale of our beverages; and negative publicity resultingfrom actual or threatened legal actions against us or other companies in our industry relating to the marketing, labeling or sale ofsugar-sweetened beverages may reduce demand for our beverages, which could adversely affect our profitability.
11
Water scarcity and poor quality could negatively impact the Coca-Cola system’s production costs and capacity.
Water is the main ingredient in substantially all of our products and is needed to produce the agricultural ingredients on whichour business relies. It is also a limited resource in many parts of the world, facing unprecedented challenges from overexploitation,increasing pollution, poor management and climate change. As demand for water continues to increase around the world, and aswater becomes scarcer and the quality of available water deteriorates, our system may incur increasing production costs or facecapacity constraints that could adversely affect our profitability or net operating revenues in the long run.
Changes in the nonalcoholic beverage business environment and retail landscape could impact our financial results.
The nonalcoholic beverage business environment is rapidly evolving as a result of, among other things, changes in consumerpreferences, including changes based on health and nutrition considerations and obesity concerns; shifting consumer tastes andneeds; changes in consumer lifestyles; and competitive product and pricing pressures. In addition, the nonalcoholic beverage retaillandscape is very dynamic and constantly evolving, not only in emerging and developing markets, where modern trade is growingat a faster pace than traditional trade outlets, but also in developed markets, where discounters and value stores, as well as thevolume of transactions through e-commerce, are growing at a rapid pace. If we are unable to successfully adapt to the rapidlychanging environment and retail landscape, our share of sales, volume growth and overall financial results could be negativelyaffected.
Increased competition could hurt our business.
The nonalcoholic beverage segment of the commercial beverage industry is highly competitive. We compete with majorinternational beverage companies that, like our Company, operate in multiple geographic areas, as well as numerous companiesthat are primarily local in operation. In many countries in which we do business, including the United States, PepsiCo, Inc. is aprimary competitor. Other significant competitors include, but are not limited to, Nestle, DPS, Groupe Danone, Kraft FoodsGroup, Inc., and Unilever. In certain markets, our competition includes major beer companies. Our beverage products alsocompete against local or regional brands as well as against private label brands developed by retailers, some of which areCoca-Cola system customers. Our ability to gain or maintain share of sales in the global market or in various local markets maybe limited as a result of actions by competitors.
Increased demand for food products and decreased agricultural productivity as a result of changing weather patterns may negativelyaffect our business.
We and our bottling partners use a number of key ingredients that are derived from agricultural commodities such as sugarcane,corn, beets, citrus, coffee and tea in the manufacture of beverage products. Increased demand for food products and decreasedagricultural productivity in certain regions of the world as a result of changing weather patterns may limit the availability orincrease the cost of such agricultural commodities, which in turn may negatively affect the affordability of our products andultimately our business and results of operations.
Consolidation in the retail channel or the loss of key retail or foodservice customers could adversely affect our financial performance.
Our industry is being affected by the trend toward consolidation in the retail channel, particularly in Europe and the UnitedStates. Larger retailers may seek lower prices from us and our bottling partners, may demand increased marketing or promotionalexpenditures, and may be more likely to use their distribution networks to introduce and develop private label brands, any ofwhich could negatively affect the Coca-Cola system’s profitability. In addition, our success depends in part on our ability tomaintain good relationships with key retail and foodservice customers. The loss of one or more of our key retail or foodservicecustomers could have an adverse effect on our financial performance.
If we are unable to expand our operations in developing and emerging markets, our growth rate could be negatively affected.
Our success depends in part on our ability to grow our business in developing and emerging markets, which in turn depends oneconomic and political conditions in those markets and on our ability to acquire bottling operations in those markets or to formstrategic business alliances with local bottlers and to make necessary infrastructure enhancements to production facilities,distribution networks, sales equipment and technology. Moreover, the supply of our products in developing and emerging marketsmust match consumers’ demand for those products. Due to product price, limited purchasing power and cultural differences, therecan be no assurance that our products will be accepted in any particular developing or emerging market.
12
Fluctuations in foreign currency exchange rates could affect our financial results.
We earn revenues, pay expenses, own assets and incur liabilities in countries using currencies other than the U.S. dollar, includingthe euro, the Japanese yen, the Brazilian real and the Mexican peso. In 2012, we used 80 functional currencies in addition to theU.S. dollar and derived $28.3 billion of net operating revenues from operations outside the United States. Because ourconsolidated financial statements are presented in U.S. dollars, we must translate revenues, income and expenses, as well as assetsand liabilities, into U.S. dollars at exchange rates in effect during or at the end of each reporting period. Therefore, increases ordecreases in the value of the U.S. dollar against other major currencies affect our net operating revenues, operating income andthe value of balance sheet items denominated in foreign currencies. In addition, unexpected and dramatic devaluations ofcurrencies in developing or emerging markets could negatively affect the value of our earnings from, and of the assets located in,those markets. Because of the geographic diversity of our operations, weaknesses in some currencies might be offset by strengthsin others over time. We also use derivative financial instruments to further reduce our net exposure to currency exchange ratefluctuations. However, we cannot assure you that fluctuations in foreign currency exchange rates, particularly the strengthening ofthe U.S. dollar against major currencies or the currencies of large developing countries, would not materially affect our financialresults.
If interest rates increase, our net income could be negatively affected.
We maintain levels of debt that we consider prudent based on our cash flows, interest coverage ratio and percentage of debt tocapital. We use debt financing to lower our cost of capital, which increases our return on shareowners’ equity. This exposes us toadverse changes in interest rates. When and to the extent appropriate, we use derivative financial instruments to reduce ourexposure to interest rate risks. We cannot assure you, however, that our financial risk management program will be successful inreducing the risks inherent in exposures to interest rate fluctuations. Our interest expense may also be affected by our creditratings. In assessing our credit strength, credit rating agencies consider our capital structure and financial policies as well as theconsolidated balance sheet and other financial information for the Company. In addition, some credit rating agencies also considerfinancial information of certain of our major bottlers. It is our expectation that the credit rating agencies will continue using thismethodology. If our credit ratings were to be downgraded as a result of changes in our capital structure; our major bottlers’financial performance; changes in the credit rating agencies’ methodology in assessing our credit strength; the credit agencies’perception of the impact of the continuing unfavorable credit conditions on our or our major bottlers’ current or future financialperformance and financial condition; or for any other reason, our cost of borrowing could increase. Additionally, if the creditratings of certain bottlers in which we have equity method investments were to be downgraded, such bottlers’ interest expensecould increase, which would reduce our equity income.
We rely on our bottling partners for a significant portion of our business. If we are unable to maintain good relationships with ourbottling partners, our business could suffer.
We generate a significant portion of our net operating revenues by selling concentrates and syrups to independent bottlingpartners. As independent companies, our bottling partners, some of which are publicly traded companies, make their own businessdecisions that may not always align with our interests. In addition, many of our bottling partners have the right to manufacture ordistribute their own products or certain products of other beverage companies. If we are unable to provide an appropriate mix ofincentives to our bottling partners through a combination of pricing and marketing and advertising support, or if our bottlingpartners are not satisfied with our brand innovation and development efforts, they may take actions that, while maximizing theirown short-term profits, may be detrimental to our Company or our brands, or they may devote more of their energy andresources to business opportunities or products other than those of the Company. Such actions could, in the long run, have anadverse effect on our profitability.
If our bottling partners’ financial condition deteriorates, our business and financial results could be affected.
We derive a significant portion of our net operating revenues from sales of concentrates and syrups to our bottling partners and,therefore, the success of our business depends on our bottling partners’ financial strength and profitability. While under ouragreements with our bottling partners we generally have the right to unilaterally change the prices we charge for ourconcentrates and syrups, our ability to do so may be materially limited by our bottling partners’ financial condition and theirability to pass price increases along to their customers. In addition, we have investments in certain of our bottling partners,which we account for under the equity method, and our operating results include our proportionate share of such bottlingpartners’ income or loss. Our bottling partners’ financial condition is affected in large part by conditions and events that arebeyond our and their control, including competitive and general market conditions in the territories in which they operate; theavailability of capital and other financing resources on reasonable terms; loss of major customers; or disruptions of bottlingoperations that may be caused by strikes, work stoppages, labor unrest or natural disasters. A deterioration of the financialcondition or results of operations of one or more of our major bottling partners could adversely affect our net operating
13

revenues from sales of concentrates and syrups; could result in a decrease in our equity income; and could negatively affect thecarrying values of our investments in bottling partners, resulting in asset write-offs.
Increases in income tax rates, changes in income tax laws or unfavorable resolution of tax matters could have a material adverseimpact on our financial results.
We are subject to income tax in the United States and in numerous other jurisdictions in which we generate net operatingrevenues. Increases in income tax rates could reduce our after-tax income from affected jurisdictions. We earn a substantialportion of our income in foreign countries. If our capital or financing needs in the United States require us to repatriate earningsfrom foreign jurisdictions above our current levels, our effective tax rates for the affected periods could be negatively impacted. Inaddition, there have been proposals to reform U.S. tax laws that could significantly impact how U.S. multinational corporationsare taxed on foreign earnings. Although we cannot predict whether or in what form these proposals will pass, several of theproposals being considered, if enacted into law, could have a material adverse impact on our income tax expense and cash flow.
Our annual tax rate is based on our income and the tax laws in the various jurisdictions in which we operate. Significant judgmentis required in determining our annual income tax expense and in evaluating our tax positions. Although we believe our taxestimates are reasonable, the final determination of tax audits and any related disputes could be materially different from ourhistorical income tax provisions and accruals. The results of audits or related disputes could have a material effect on our financialstatements for the period or periods for which the applicable final determinations are made.
Increased or new indirect taxes in the United States or in one or more of our other major markets could negatively affect ourbusiness.
Our business operations are subject to numerous duties or taxes that are not based on income, sometimes referred to as ‘‘indirecttaxes,’’ including import duties, excise taxes, sales or value-added taxes, property taxes and payroll taxes, in many of thejurisdictions in which we operate, including indirect taxes imposed by state and local governments. In addition, in the past, theUnited States Congress considered imposing a federal excise tax on beverages sweetened with sugar, HFCS or other nutritivesweeteners and may consider similar proposals in the future. As federal, state and local governments experience significant budgetdeficits, some lawmakers have proposed singling out beverages among a plethora of revenue-raising items. Increases in or theimposition of new indirect taxes on our business operations or products would increase the cost of products or, to the extentlevied directly on consumers, make our products less affordable, which may negatively impact our net operating revenues.
Increase in the cost, disruption of supply or shortage of energy or fuels could affect our profitability.
CCR, our North America bottling and customer service organization, and our Company-owned or -controlled bottlers operate alarge fleet of trucks and other motor vehicles to distribute and deliver beverage products to customers. In addition, we use asignificant amount of electricity, natural gas and other energy sources to operate our concentrate plants and the bottling plantsand distribution facilities operated by CCR and our Company-owned or -controlled bottlers. An increase in the price, disruptionof supply or shortage of fuel and other energy sources in North America, in other countries in which we have concentrate plants,or in any of the major markets in which our Company-owned or -controlled bottlers operate that may be caused by increasingdemand or by events such as natural disasters, power outages, or the like, would increase our operating costs and negativelyimpact our profitability.
Our bottling partners also operate large fleets of trucks and other motor vehicles to distribute and deliver beverage products totheir own customers and use a significant amount of electricity, natural gas and other energy sources to operate their own bottlingplants and distribution facilities. Increases in the price, disruption of supply or shortage of fuel and other energy sources in any ofthe major markets in which our bottling partners operate would increase the affected bottling partners’ operating costs and couldindirectly negatively impact our results of operations.
Increase in the cost, disruption of supply or shortage of ingredients, other raw materials or packaging materials could harm ourbusiness.
We and our bottling partners use various ingredients in our business, including HFCS, sucrose, aspartame, saccharin,acesulfame potassium, sucralose, ascorbic acid, citric acid, phosphoric acid and caramel color, other raw materials such asorange and other fruit juice and juice concentrates, as well as packaging materials such as PET for bottles and aluminum forcans. The prices for these ingredients, other raw materials and packaging materials fluctuate depending on market conditions.Substantial increases in the prices of our or our bottling partners’ ingredients, other raw materials and packaging materials, tothe extent they cannot be recouped through increases in the prices of finished beverage products, would increase our and theCoca-Cola system’s operating costs and could reduce our profitability. Increases in the prices of our finished products resulting
14

from a higher cost of ingredients, other raw materials and packaging materials could affect affordability in some markets andreduce Coca-Cola system sales. In addition, some of our ingredients, such as aspartame, acesulfame potassium, sucralose,saccharin and ascorbic acid, as well as some of the packaging containers, such as aluminum cans, are available from a limitednumber of suppliers, some of which are located in countries experiencing political or other risks. We cannot assure you that weand our bottling partners will be able to maintain favorable arrangements and relationships with these suppliers.
The citrus industry is subject to the variability of weather conditions, which affect the supply of orange juice and orange juiceconcentrate, which are important raw materials for our business. In particular, freezing weather or hurricanes in central Floridamay result in shortages and higher prices for orange juice and orange juice concentrate throughout the industry. In addition,adverse weather conditions may affect the supply of other agricultural commodities from which key ingredients for our productsare derived. For example, drought conditions in certain parts of the United States may negatively affect the supply of corn, whichin turn may result in shortages and higher prices for HFCS.
An increase in the cost, a sustained interruption in the supply, or a shortage of some of these ingredients, other raw materials,packaging materials or cans and other containers that may be caused by a deterioration of our or our bottling partners’relationships with suppliers; by supplier quality and reliability issues; or by events such as natural disasters, power outages, laborstrikes, political uncertainties or governmental instability, or the like, could negatively impact our net revenues and profits.
Changes in laws and regulations relating to beverage containers and packaging could increase our costs and reduce demand for ourproducts.
We and our bottlers currently offer nonrefillable, recyclable containers in the United States and in various other markets aroundthe world. Legal requirements have been enacted in various jurisdictions in the United States and overseas requiring that depositsor certain ecotaxes or fees be charged for the sale, marketing and use of certain nonrefillable beverage containers. Otherproposals relating to beverage container deposits, recycling, ecotax and/or product stewardship have been introduced in variousjurisdictions in the United States and overseas, and we anticipate that similar legislation or regulations may be proposed in thefuture at local, state and federal levels, both in the United States and elsewhere. Consumers’ increased concerns and changingattitudes about solid waste streams and environmental responsibility and the related publicity could result in the adoption of suchlegislation or regulations. If these types of requirements are adopted and implemented on a large scale in any of the majormarkets in which we operate, they could affect our costs or require changes in our distribution model, which could reduce our netoperating revenues or profitability.
Significant additional labeling or warning requirements or limitations on the availability of our products may inhibit sales of affectedproducts.
Various jurisdictions may seek to adopt significant additional product labeling or warning requirements or limitations on theavailability of our products relating to the content or perceived adverse health consequences of certain of our products. If thesetypes of requirements become applicable to one or more of our major products under current or future environmental or healthlaws or regulations, they may inhibit sales of such products. One such law, which is in effect in California and is known asProposition 65, requires that a warning appear on any product sold in California that contains a substance that, in the view of thestate, causes cancer or birth defects. The state maintains lists of these substances and periodically adds other substances to theselists. Proposition 65 exposes all food and beverage producers to the possibility of having to provide warnings on their products inCalifornia because it does not provide for any generally applicable quantitative threshold below which the presence of a listedsubstance is exempt from the warning requirement. Consequently, the detection of even a trace amount of a listed substance cansubject an affected product to the requirement of a warning label. However, Proposition 65 does not require a warning if themanufacturer of a product can demonstrate that the use of the product in question exposes consumers to a daily quantity of alisted substance that is below a ‘‘safe harbor’’ threshold that may be established, is naturally occurring, is the result of necessarycooking, or is subject to another applicable exception. One or more substances that are currently on the Proposition 65 lists, orthat may be added to the lists in the future, can be detected in Company products at low levels that are safe. With respect tosubstances that have not yet been listed under Proposition 65, the Company takes the position that listing is not scientificallyjustified. With respect to substances that are already listed, the Company takes the position that the presence of each suchsubstance in Company products is subject to an applicable exemption from the warning requirement. The State of California orother parties, however, may take a contrary position. If we were required to add Proposition 65 warnings on the labels of one ormore of our beverage products produced for sale in California, the resulting consumer reaction to the warnings and possibleadverse publicity could negatively affect our sales both in California and in other markets.
15

If we are unable to protect our information systems against service interruption, misappropriation of data or breaches of security, ouroperations could be disrupted and our reputation may be damaged.
We rely on networks and information systems and other technology (‘‘information systems’’), including the Internet and third-partyhosted services, to support a variety of business processes and activities, including procurement and supply chain, manufacturing,distribution, invoicing and collection of payments. We use information systems to process financial information and results ofoperations for internal reporting purposes and to comply with regulatory financial reporting, legal and tax requirements. Inaddition, we depend on information systems for digital marketing activities and electronic communications among our locationsaround the world and between Company personnel and our bottlers and other customers, suppliers and consumers. Becauseinformation systems are critical to many of the Company’s operating activities, our business processes may be impacted by systemshutdowns or service disruptions. These disruptions may be caused by failures during routine operations such as system upgradesor user errors, as well as network or hardware failures, malicious or disruptive software, computer hackers, geopolitical events,natural disasters, failures or impairments of telecommunications networks, or other catastrophic events. In addition, such eventscould result in unauthorized disclosure of material confidential information. If our information systems suffer severe damage,disruption or shutdown and our business continuity plans do not effectively resolve the issues in a timely manner, we couldexperience delays in reporting our financial results and we may lose revenue and profits as a result of our inability to timelymanufacture, distribute, invoice and collect payments for concentrate or finished products. Misuse, leakage or falsification ofinformation could result in a violation of data privacy laws and regulations and damage the reputation and credibility of theCompany and have a negative impact on net operating revenues. In addition, we may suffer financial and reputational damagebecause of lost or misappropriated confidential information belonging to us or to our bottling partners, other customers, suppliersor consumers. The Company could also be required to spend significant financial and other resources to remedy the damagecaused by a security breach or to repair or replace networks and information systems.
Like most major corporations, the Company’s information systems are a target of attacks. Although the disruptions to ourinformation systems that we have experienced to date have not had a material effect on our business, financial condition or resultsof operations, there can be no assurance that such disruptions will not have a material adverse effect on us in the future. In orderto address risks to our information systems, we continue to make investments in personnel, technologies, cyberinsurance andtraining of Company personnel, bottlers and third parties. The Company maintains an information risk management programwhich is supervised by information technology management and reviewed by a cross-functional committee. As part of thisprogram, reports which include analysis of emerging risks as well as the Company’s plans and strategies to address them areregularly prepared and presented to senior management.
Unfavorable general economic conditions in the United States could negatively impact our financial performance.
In 2012, our net operating revenues in the United States were $19.7 billion, or 41 percent of our total net operating revenues.Unfavorable general economic conditions, such as a recession or economic slowdown, in the United States could negatively affectthe affordability of, and consumer demand for, some of our beverages in our flagship market. Under difficult economic conditions,consumers may seek to reduce discretionary spending by forgoing purchases of our products or by shifting away from ourbeverages to lower-priced products offered by other companies, including private label brands. Softer consumer demand for ourbeverages in the United States could reduce our profitability and could negatively affect our overall financial performance.
Unfavorable economic and political conditions in international markets could hurt our business.
We derive a significant portion of our net operating revenues from sales of our products in international markets. In 2012, ouroperations outside the United States accounted for $28.3 billion, or 59 percent, of our total net operating revenues. Unfavorableeconomic conditions in our major international markets, the financial uncertainties in the eurozone and unstable politicalconditions, including civil unrest and governmental changes, in certain of our other international markets could undermine globalconsumer confidence and reduce consumers’ purchasing power, thereby reducing demand for our products. Product boycottsresulting from political activism could reduce demand for our products, while restrictions on our ability to transfer earnings orcapital across borders which may be imposed or expanded as a result of political and economic instability could impact ourprofitability. In addition, U.S. trade sanctions against countries such as Iran and Syria and/or financial institutions acceptingtransactions for commerce within such countries could increase significantly, which could make it impossible for us to continue tomake sales to bottlers in such countries. Without limiting the generality of the preceding sentences, the unfavorable businessenvironment in Venezuela; the current unstable economic and political conditions and civil unrest and political activism in theMiddle East, India, Pakistan or the Philippines; the civil unrest and instability in Egypt and other countries in North Africa; theunstable situation in Iraq; or the continuation or escalation of terrorist activities could adversely impact our international business.
16

Litigation or legal proceedings could expose us to significant liabilities and damage our reputation.
We are party to various litigation claims and legal proceedings. We evaluate these litigation claims and legal proceedings to assessthe likelihood of unfavorable outcomes and to estimate, if possible, the amount of potential losses. Based on these assessmentsand estimates, we establish reserves and/or disclose the relevant litigation claims or legal proceedings, as appropriate. Theseassessments and estimates are based on the information available to management at the time and involve a significant amount ofmanagement judgment. We caution you that actual outcomes or losses may differ materially from those envisioned by our currentassessments and estimates. In addition, we have bottling and other business operations in markets with high-risk legal complianceenvironments. Our policies and procedures require strict compliance by our associates and agents with all United States and locallaws and regulations and consent orders applicable to our business operations, including those prohibiting improper payments togovernment officials. Nonetheless, we cannot assure you that our policies, procedures and related training programs will alwaysensure full compliance by our associates and agents with all applicable legal requirements. Improper conduct by our associates oragents could damage our reputation in the United States and internationally or lead to litigation or legal proceedings that couldresult in civil or criminal penalties, including substantial monetary fines, as well as disgorgement of profits.
Adverse weather conditions could reduce the demand for our products.
The sales of our products are influenced to some extent by weather conditions in the markets in which we operate. Unusually coldor rainy weather during the summer months may have a temporary effect on the demand for our products and contribute to lowersales, which could have an adverse effect on our results of operations for such periods.
Climate change may have a long-term adverse impact on our business and results of operations.
There is increasing concern that a gradual increase in global average temperatures due to increased concentration of carbondioxide and other greenhouse gases in the atmosphere will cause significant changes in weather patterns around the globe and anincrease in the frequency and severity of natural disasters. Decreased agricultural productivity in certain regions of the world as aresult of changing weather patterns may limit availability or increase the cost of key agricultural commodities, such as sugarcane,corn, beets, citrus, coffee and tea, which are important sources of ingredients for our products, and could impact the food securityof communities around the world. Climate change may also exacerbate water scarcity and cause a further deterioration of waterquality in affected regions, which could limit water availability for our system’s bottling operations. Increased frequency orduration of extreme weather conditions could also impair production capabilities, disrupt our supply chain or impact demand forour products. As a result, the effects of climate change could have a long-term adverse impact on our business and results ofoperations.
If negative publicity related to product safety or quality, human and workplace rights, obesity or other issues, even if unwarranted,damages our brand image and corporate reputation, our business may suffer.
Our success depends on our ability to maintain consumer confidence in the safety and quality of our products. Our success alsodepends on our ability to maintain the brand image of our existing products, build up brand image for new products and brandextensions, and maintain our corporate reputation. We cannot assure you, however, that our commitment to product safety andquality and our continuing investment in advertising and marketing will have the desired impact on our products’ brand imageand on consumer preferences. Product safety or quality issues, actual or perceived, or allegations of product contamination,even when false or unfounded, could tarnish the image of the affected brands and may cause consumers to choose otherproducts. Allegations of product safety or quality issues or contamination, even if untrue, may require us from time to time torecall a beverage or other product from all of the markets in which the affected production was distributed. Such issues orrecalls could negatively affect our profitability and brand image. In some emerging markets, the production and sale ofcounterfeit or ‘‘spurious’’ products, which we and our bottling partners may not be able to fully combat, may damage the imageand reputation of our products. From time to time, we and our executives engage in public policy endeavors that are eitherdirectly related to our products and packaging or to our business operations and general economic climate affecting theCompany. These engagements in public policy debates can occasionally be the subject of backlash from advocacy groups thathave a differing point of view and could result in adverse media and consumer reaction, including product boycotts. In addition,campaigns by activists attempting to connect us or our bottling system with human and workplace rights issues in certainemerging markets could adversely impact our corporate image and reputation. For example, in June 2011, the United NationsHuman Rights Council endorsed the Guiding Principles on Business and Human Rights, which outlines how businesses shouldimplement the corporate responsibility to respect human rights principles included in the United Nations ‘‘Protect, Respect andRemedy’’ framework on human rights. Through our Human Rights Statement and Workplace Rights Policy and SupplierGuiding Principles, and our participation in the United Nations Global Compact and its LEAD program, as well as our activeparticipation in the Global Business Initiative on Human Rights and Global Business Coalition Against Human Trafficking, wemade a number of commitments to respect all human rights. Allegations that we are not respecting any of the 30 human rights
17
found in the United Nations Universal Declaration of Human Rights, even if untrue, could have a significant impact on ourcorporate reputation and long-term financial results. Also, adverse publicity surrounding obesity and health concerns related toour products, water usage, environmental concerns, labor relations, or the like could negatively affect our Company’s overallreputation and our products’ acceptance by consumers.
Changes in, or failure to comply with, the laws and regulations applicable to our products or our business operations could increaseour costs or reduce our net operating revenues.
Our Company’s business is subject to various laws and regulations in the numerous countries throughout the world in which we dobusiness, including laws and regulations relating to competition, product safety, advertising and labeling, container deposits,recycling or stewardship, the protection of the environment, and employment and labor practices. In the United States, theproduction, distribution and sale of many of our products are subject to, among others, the Federal Food, Drug, and CosmeticAct, the Federal Trade Commission Act, the Lanham Act, state consumer protection laws, the Occupational Safety and HealthAct, and various environmental statutes, as well as various state and local statutes and regulations. Outside the United States, theproduction, distribution, sale, advertising and labeling of many of our products are also subject to various laws and regulations.Changes in applicable laws or regulations or evolving interpretations thereof, including increased government regulations to limitcarbon dioxide and other greenhouse gas emissions as a result of concern over climate change, or regulations to limit or eliminatethe use of bisphenol-A, or BPA (an odorless, tasteless food-grade chemical commonly used in the food and beverage industries asa component in the coating of the interior of cans), may result in increased compliance costs, capital expenditures and otherfinancial obligations for us and our bottling partners, which could affect our profitability, or may impede the production ordistribution of our products, which could affect our net operating revenues. In addition, failure to comply with environmental,health or safety requirements and other applicable laws or regulations could result in the assessment of damages, the impositionof penalties, suspension of production, changes to equipment or processes, or a cessation of operations at our or our bottlingpartners’ facilities, as well as damage to our and the Coca-Cola system’s image and reputation, all of which could harm our andthe Coca-Cola system’s profitability.
Changes in accounting standards could affect our reported financial results.
New accounting standards or pronouncements that may become applicable to our Company from time to time, or changes in theinterpretation of existing standards and pronouncements, could have a significant effect on our reported results for the affectedperiods.
If we are not able to achieve our overall long-term goals, the value of an investment in our Company could be negatively affected.
We have established and publicly announced certain long-term growth objectives. These objectives were based on our evaluationof our growth prospects, which are generally driven by volume and sales potential of many product types, some of which are moreprofitable than others, and on an assessment of the potential price and product mix. There can be no assurance that we willachieve the required volume or revenue growth or the mix of products necessary to achieve our long-term growth objectives.
Continuing uncertainty in the global credit markets may adversely affect our financial performance.
Global credit market conditions continue to be uncertain in large part because of unfavorable economic environment conditions inmuch of the world and the unsustainable sovereign debt burden affecting various countries in the European Union. The cost andavailability of credit vary by market and are subject to changes in the global or regional economic environment. If the currentuncertain conditions in the credit markets continue or worsen, our bottling partners’ ability to access credit markets on favorableterms may be negatively affected, which could affect the Coca-Cola system’s profitability as well as our share of the income ofbottling partners in which we have equity method investments. The decrease in availability of consumer credit resulting fromuncertain credit market conditions, as well as general unfavorable economic conditions, may also cause consumers to reduce theirdiscretionary spending, which would reduce the demand for our beverages and negatively affect our net operating revenues andthe Coca-Cola system’s profitability.
18

If one or more of our counterparty financial institutions default on their obligations to us or fail, we may incur significant losses.
As part of our hedging activities, we enter into transactions involving derivative financial instruments, including forward contracts,commodity futures contracts, option contracts, collars and swaps, with various financial institutions. In addition, we have significantamounts of cash, cash equivalents and other investments on deposit or in accounts with banks or other financial institutions in theUnited States and abroad. As a result, we are exposed to the risk of default by or failure of counterparty financial institutions.The risk of counterparty default or failure may be heightened during economic downturns and periods of uncertainty in thefinancial markets. If one of our counterparties were to become insolvent or file for bankruptcy, our ability to recover lossesincurred as a result of default or our assets that are deposited or held in accounts with such counterparty may be limited by thecounterparty’s liquidity or the applicable laws governing the insolvency or bankruptcy proceedings. In the event of default orfailure of one or more of our counterparties, we could incur significant losses, which could negatively impact our results ofoperations and financial condition.
If we are unable to realize additional benefits targeted by our productivity and reinvestment program, our financial results could benegatively affected.
We believe that productivity gains are essential to achieving our long-term growth objectives and, therefore, a leading priority ofour Company is to design and implement the most effective and efficient business system possible. As part of our efforts tobecome more efficient, leaner and adaptive to changing market conditions, in February 2012 we announced a productivity andreinvestment program consisting of (i) a new productivity initiative focused on global supply chain optimization, global marketingand innovation effectiveness, operating expense leverage, operational excellence and data and information technology systemsstandardization; and (ii) an expansion of our initiative to capture CCR integration synergies in North America, focused primarilyon our North American product supply. We expect to incur significant costs to capture these savings and additional synergies. Weintend to invest the savings generated by this program to enhance ongoing systemwide brand-building initiatives and to mitigatepotential incremental near-term commodity costs. If we are unable to capture the savings and additional synergies targeted by ourproductivity and reinvestment program, our financial results could be negatively affected.
If we are unable to renew collective bargaining agreements on satisfactory terms, or we or our bottling partners experience strikes,work stoppages or labor unrest, our business could suffer.
Many of our associates at our key manufacturing locations and bottling plants are covered by collective bargaining agreements.While we generally have been able to renegotiate collective bargaining agreements on satisfactory terms when they expire andregard our relations with associates and their representatives as generally satisfactory, negotiations in the current environmentremain challenging, as the Company must have competitive cost structures in each market while meeting the compensation andbenefits needs of our associates. If we are unable to renew collective bargaining agreements on satisfactory terms, our labor costscould increase, which would affect our profit margins. In addition, many of our bottling partners’ employees are represented bylabor unions. Strikes, work stoppages or other forms of labor unrest at any of our major manufacturing facilities or at our or ourmajor bottlers’ plants could impair our ability to supply concentrates and syrups to our bottling partners or our bottlers’ ability tosupply finished beverages to customers, which would reduce our net operating revenues and could expose us to customer claims.
We may be required to recognize impairment charges that could materially affect our financial results.
We assess our goodwill, trademarks and other intangible assets as well as our other long-lived assets as and when required byaccounting principles generally accepted in the United States to determine whether they are impaired and, if they are, we recordappropriate impairment charges. Our equity method investees also perform impairment tests, and we record our proportionateshare of impairment charges recorded by them adjusted, as appropriate, for the impact of items such as basis differences, deferredtaxes and deferred gains. It is possible that we may be required to record significant impairment charges or our proportionateshare of significant charges recorded by equity method investees in the future and, if we do so, our operating or equity incomecould be materially adversely affected.
19

We may incur multi-employer plan withdrawal liabilities in the future, which could negatively impact our financial performance.
We participate in certain multi-employer pension plans in the United States. Our U.S. multi-employer pension plan expensetotaled $31 million in 2012. The U.S. multi-employer pension plans in which we currently participate have contractualarrangements that extend into 2017. If, in the future, we choose to withdraw from any of the multi-employer pension plans inwhich we participate, we will likely need to record withdrawal liabilities, which could negatively impact our financial performancein the applicable periods.
If we do not successfully integrate and manage our Company-owned or -controlled bottling operations, our results could suffer.
From time to time we acquire or take control of bottling operations, often in underperforming markets where we believe we canuse our resources and expertise to improve performance. We may incur unforeseen liabilities and obligations in connection withacquiring, taking control of or managing bottling operations and may encounter unexpected difficulties and costs in restructuringand integrating them into our Company’s operating and internal control structures. We may also experience delays in extendingour Company’s internal control over financial reporting to newly acquired or controlled bottling operations, which may increasethe risk of failure to prevent misstatements in such operations’ financial records and in our consolidated financial statements. Ourfinancial performance depends in large part on how well we can manage and improve the performance of Company-owned or-controlled bottling operations. We cannot assure you, however, that we will be able to achieve our strategic and financialobjectives for such bottling operations. If we are unable to achieve such objectives, our consolidated results could be negativelyaffected.
Global or regional catastrophic events could impact our operations and financial results.
Because of our global presence and worldwide operations, our business can be affected by large-scale terrorist acts, especiallythose directed against the United States or other major industrialized countries; the outbreak or escalation of armed hostilities;major natural disasters; or widespread outbreaks of infectious diseases. Such events could impair our ability to manage ourbusiness around the world, could disrupt our supply of raw materials and ingredients, and could impact production, transportationand delivery of concentrates, syrups and finished products. In addition, such events could cause disruption of regional or globaleconomic activity, which can affect consumers’ purchasing power in the affected areas and, therefore, reduce demand for ourproducts.
ITEM 1B. UNRESOLVED STAFF COMMENTS
Not applicable.
ITEM 2. PROPERTIES
Our worldwide headquarters is located on a 35-acre office complex in Atlanta, Georgia. The complex includes our 621,000 squarefoot headquarters building and an 870,000 square foot building in which our North America group’s main offices are located. Thecomplex also includes several other buildings, including our 264,000 square foot Coca-Cola Plaza building, technical andengineering facilities, a learning center and a reception center. We also own an office and retail building at 711 Fifth Avenue inNew York, New York. These properties, except for the North America group’s main offices, are included in the Corporateoperating segment.
We own or lease additional facilities, real estate and office space throughout the world which we use for administrative,manufacturing, processing, packaging, packing, storage, warehousing, distribution and retail operations. These properties aregenerally included in the geographic operating segment in which they are located.
In North America, as of December 31, 2012, we owned 69 beverage production facilities, 10 principal beverage concentrate and/orsyrup manufacturing plants, one facility that manufactures juice concentrates for foodservice use, two bottled water facilities andone container manufacturing facility; we leased one beverage production facility, one bottled water facility and four containermanufacturing facilities; and we operated 281 principal beverage distribution warehouses, of which 98 were leased and the restwere owned. Also included in the North America operating segment is a portion of the Atlanta office complex consisting of theNorth America group’s main offices.
Additionally, outside of North America, as of December 31, 2012, our Company owned and operated 18 principal beverageconcentrate manufacturing plants, of which four are included in the Eurasia and Africa operating segment, three are included inthe Europe operating segment, five are included in the Latin America operating segment, and six are included in the Pacific
20
operating segment; and owned a majority interest in and operated one beverage concentrate manufacturing plant included in thePacific operating segment.
We own or hold a majority interest in or otherwise consolidate under applicable accounting rules bottling operations that, as ofDecember 31, 2012, owned 105 principal beverage bottling and canning plants located throughout the world. These plants areincluded in the Bottling Investments operating segment.
Management believes that our Company’s facilities for the production of our products are suitable and adequate, that they arebeing appropriately utilized in line with past experience, and that they have sufficient production capacity for their presentintended purposes. The extent of utilization of such facilities varies based upon seasonal demand for our products. However,management believes that additional production can be obtained at the existing facilities by adding personnel and capitalequipment and, at some facilities, by adding shifts of personnel or expanding the facilities. We continuously review our anticipatedrequirements for facilities and, on the basis of that review, may from time to time acquire additional facilities and/or dispose ofexisting facilities.
ITEM 3. LEGAL PROCEEDINGS
The Company is involved in various legal proceedings, including the proceedings specifically discussed below. Managementbelieves that the total liabilities to the Company that may arise as a result of currently pending legal proceedings will not have amaterial adverse effect on the Company taken as a whole.
Aqua-Chem Litigation
On December 20, 2002, the Company filed a lawsuit (The Coca-Cola Company v. Aqua-Chem, Inc., Civil Action No. 2002CV631-50)in the Superior Court of Fulton County, Georgia (the ‘‘Georgia Case’’), seeking a declaratory judgment that the Company has noobligation to its former subsidiary, Aqua-Chem, Inc., now known as Cleaver-Brooks, Inc. (‘‘Aqua-Chem’’), for any past, present orfuture liabilities or expenses in connection with any claims or lawsuits against Aqua-Chem. Subsequent to the Company’s filing buton the same day, Aqua-Chem filed a lawsuit (Aqua-Chem, Inc. v. The Coca-Cola Company, Civil Action No. 02CV012179) in theCircuit Court, Civil Division of Milwaukee County, Wisconsin (the ‘‘Wisconsin Case’’). In the Wisconsin Case, Aqua-Chem sought adeclaratory judgment that the Company is responsible for all liabilities and expenses not covered by insurance in connection withcertain of Aqua-Chem’s general and product liability claims arising from occurrences prior to the Company’s sale of Aqua-Chem in1981, and a judgment for breach of contract in an amount exceeding $9 million for costs incurred by Aqua-Chem to date inconnection with such claims. The Wisconsin Case initially was stayed, pending final resolution of the Georgia Case, and later wasvoluntarily dismissed without prejudice by Aqua-Chem.
The Company owned Aqua-Chem from 1970 to 1981. During that time, the Company purchased over $400 million of insurancecoverage, which also insures Aqua-Chem for some of its prior and future costs for certain product liability and other claims. TheCompany sold Aqua-Chem to Lyonnaise American Holding, Inc., in 1981 under the terms of a stock sale agreement. The 1981agreement, and a subsequent 1983 settlement agreement, outlined the parties’ rights and obligations concerning past and futureclaims and lawsuits involving Aqua-Chem. Cleaver-Brooks, a division of Aqua-Chem, manufactured boilers, some of whichcontained asbestos gaskets. Aqua-Chem was first named as a defendant in asbestos lawsuits in or around 1985 and currently hasapproximately 40,000 active claims pending against it.
The parties agreed in 2004 to stay the Georgia Case pending the outcome of insurance coverage litigation filed by certainAqua-Chem insurers on March 26, 2004. In the coverage action, five plaintiff insurance companies filed suit (Century IndemnityCompany, et al. v. Aqua-Chem, Inc., The Coca-Cola Company, et al., Case No. 04CV002852) in the Circuit Court, Civil Division ofMilwaukee County, Wisconsin, against the Company, Aqua-Chem and 16 insurance companies. Several of the policies that werethe subject of the coverage action had been issued to the Company during the period (1970 to 1981) when the Company ownedAqua-Chem. The complaint sought a determination of the respective rights and obligations under the insurance policies issuedwith regard to asbestos-related claims against Aqua-Chem. The action also sought a monetary judgment reimbursing any amountspaid by the plaintiffs in excess of their obligations. Two of the insurers, one with a $15 million policy limit and one with a$25 million policy limit, asserted cross-claims against the Company, alleging that the Company and/or its insurers are responsiblefor Aqua-Chem’s asbestos liabilities before any obligation is triggered on the part of the cross-claimant insurers to pay for suchcosts under their policies.
Aqua-Chem and the Company filed and obtained a partial summary judgment determination in the coverage action that theinsurers for Aqua-Chem and the Company were jointly and severally liable for coverage amounts, but reserving judgment onother defenses that might apply. During the course of the Wisconsin insurance coverage litigation, Aqua-Chem and theCompany reached settlements with several of the insurers, including plaintiffs, who have paid or will pay funds into an escrowaccount for payment of costs arising from the asbestos claims against Aqua-Chem. On July 24, 2007, the Wisconsin trial courtentered a final declaratory judgment regarding the rights and obligations of the parties under the insurance policies issued by
21

the remaining defendant insurers, which judgment was not appealed. The judgment directs, among other things, that each insurerwhose policy is triggered is jointly and severally liable for 100 percent of Aqua-Chem’s losses up to policy limits. The court’sjudgment concluded the Wisconsin insurance coverage litigation.
The Company and Aqua-Chem continued to pursue and obtain coverage agreements for the asbestos-related claims againstAqua-Chem with those insurance companies that did not settle in the Wisconsin insurance coverage litigation. The Companyanticipated that a final settlement with three of those insurers (the ‘‘Chartis insurers’’) would be finalized in May 2011, but suchinsurers repudiated their settlement commitments and, as a result, Aqua-Chem and the Company filed suit against them inWisconsin state court to enforce the coverage-in-place settlement or, in the alternative, to obtain a declaratory judgment validatingAqua-Chem and the Company’s interpretation of the court’s judgment in the Wisconsin insurance coverage litigation.
In February 2012, the parties filed and argued a number of cross-motions for summary judgment related to the issues of theenforceability of the settlement agreement and the exhaustion of policies underlying those of the Chartis insurers. The courtgranted defendants’ motions for summary judgment that the 2011 Settlement Agreement and 2010 Term Sheet were not bindingcontracts, but denied their similar motions related to plaintiffs’ claims for promissory and/or equitable estoppel. On or aboutMay 15, 2012, the parties entered into a mutually agreeable settlement/stipulation resolving two major issues: exhaustion ofunderlying coverage and control of defense; and, on or about January 10, 2013, the parties reached a settlement of the remainingcoverage issues and the estoppel claims. The Chartis insurers have filed a notice of appeal with respect to certain issues that werethe subject of summary judgment orders earlier in the case. Whatever the outcome of that appeal, these three insurancecompanies will remain subject to the court’s judgment in the Wisconsin insurance coverage litigation.
The Georgia Case remains subject to the stay agreed to in 2004.
Chapman
On June 30, 2005, Maryann Chapman filed a purported shareholder derivative action (Chapman v. Isdell, et al.) in the SuperiorCourt of Fulton County, Georgia, alleging violations of state law by certain individual current and former members of the Boardof Directors of the Company and senior management, including breaches of fiduciary duties, abuse of control, grossmismanagement, waste of corporate assets and unjust enrichment, between January 2003 and the date of filing of the complaintthat have caused substantial losses to the Company and other damages, such as to its reputation and goodwill. The defendantsnamed in the lawsuit include Neville Isdell, Douglas Daft, Gary Fayard, Ronald Allen, Cathleen Black, Warren Buffett, HerbertAllen, Barry Diller, Donald McHenry, Sam Nunn, James Robinson, Peter Ueberroth, James Williams, Donald Keough, MariaLagomasino, Pedro Reinhard, Robert Nardelli and Susan Bennett King. The Company is also named a nominal defendant. Thecomplaint further alleges that the September 2004 earnings warning issued by the Company resulted from factors known by theindividual defendants as early as January 2003 that were not adequately disclosed to the investing public until the earningswarning. The factors cited in the complaint include (i) a flawed business strategy and a business model that was not working;(ii) a workforce so depleted by layoffs that it was unable to properly react to changing market conditions; (iii) impairedrelationships with key bottlers; and (iv) the fact that the foregoing conditions would lead to diminished earnings. The plaintiff,purportedly on behalf of the Company, seeks damages in an unspecified amount, extraordinary equitable and/or injunctive relief,restitution and disgorgement of profits, reimbursement for costs and disbursements of the action, and such other and further reliefas the Court deems just and proper. The Company’s motion to dismiss the complaint and the plaintiff’s response were filed andfully briefed. The Court heard oral argument on the Company’s motion to dismiss on June 6, 2006. Following the hearing, theCourt took the matter under advisement and the parties are awaiting a ruling. On March 30, 2012, the Court dismissed the casefor lack of prosecution.
Environmental Matters
The Company’s Atlanta Syrup Plant (‘‘ASP’’) discharges wastewater to a City of Atlanta wastewater treatment works pursuant to agovernment-issued permit under the U.S. Clean Water Act and related state and local laws and regulations. The Company becameaware that wastewater-related reports filed by ASP with regulators may contain certain inaccurate information and madeself-disclosure to the City of Atlanta regarding the matter as required by applicable law. As a result, regulatory authorities mayseek monetary and/or other sanctions against the Company, although the Company believes that any sanctions that may ultimatelybe imposed will not be material to its business, financial condition or results of operations.
The Company’s bottling plant in Suape, Brazil discharges wastewater to a local water body pursuant to a government-issuedpermit under Brazilian environmental law. The Company is working with environmental regulators in the State of Pernambuco toaddress certain compliance-related issues at the Suape facility, including with respect to the building of a new wastewatertreatment plant. The Brazilian regulatory authorities may pursue monetary and/or other sanctions against the Company as a resultof this matter, although the Company believes that if any sanctions are pursued they will not be material to its business, financialcondition or results of operations.
22

ITEM 4. MINE SAFETY DISCLOSURES
Not applicable.
ITEM X. EXECUTIVE OFFICERS OF THE COMPANY
The following are the executive officers of our Company as of February 25, 2013:
Ahmet C. Bozer, 52, is Executive Vice President of the Company and President of Coca-Cola International, which consists of theCompany’s Eurasia and Africa, Europe and Pacific operating groups. Mr. Bozer joined the Company in 1990 as a FinancialControl Manager. In 1992, he became the Region Finance Manager in Turkey. In 1994, he joined Coca-Cola Bottlers of Turkey(now Coca-Cola Icecek A.S.) as Finance Director and was named Managing Director in 1998. In 2000, Mr. Bozer rejoined theCompany as President of the Eurasia Division, which became the Eurasia and Middle East Division in 2003. In 2006, Mr. Bozerassumed the additional leadership responsibility for the Russia, Ukraine and Belarus Division. In 2007, with the addition of theIndia and South West Asia Division under his responsibilities, Mr. Bozer was named President of the Eurasia Group. From July 1,2008 until December 31, 2012, Mr. Bozer served as President of the Eurasia and Africa Group. He was appointed President ofCoca-Cola International effective January 1, 2013 and was elected Executive Vice President of the Company on February 21, 2013.
Steven A. Cahillane, 47, is Executive Vice President of the Company and President of Coca-Cola Americas, which consists of theCompany’s North America and Latin America operating groups. Mr. Cahillane joined the Company in October 2010 as Presidentand Chief Executive Officer of Coca-Cola Refreshments, the Company’s bottling and customer service organization for NorthAmerica, and served in this role until December 31, 2012. Before joining the Company, Mr. Cahillane served as President ofCoca-Cola Enterprises Inc.’s Europe Group until July 2008 and then as President of the North America Business Unit ofCoca-Cola Enterprises Inc. from July 2008 until October 2010. Prior to joining the Coca-Cola system, from 2003 until 2005,Mr. Cahillane served as the Chief Executive for Interbrew UK and Ireland, a division of InBev S.A. In 2005, he became ChiefCommercial Officer of InBev S.A. and served in that capacity until 2007. Mr. Cahillane was appointed President of Coca-ColaAmericas effective January 1, 2013 and was elected Executive Vice President of the Company on February 21, 2013.
Alexander B. Cummings, Jr., 56, is Executive Vice President and Chief Administrative Officer of the Company. Mr. Cummingsjoined the Company in 1997 as Deputy Region Manager, Nigeria. In 1998, Mr. Cummings was named Managing Director/RegionManager, Nigeria, and in 2000, he became President of the North West Africa Division based in Morocco. In 2001,Mr. Cummings became President of the Africa Group and served in this capacity until June 2008. Mr. Cummings was appointedChief Administrative Officer of the Company effective July 1, 2008, and was elected Executive Vice President of the Companyeffective October 15, 2008. Mr. Cummings began his career in 1982 with The Pillsbury Company and held various positions withinPillsbury, the last position being Vice President of Finance and Chief Financial Officer for all of Pillsbury’s internationalbusinesses.
J. Alexander M. Douglas, Jr., 51, is Senior Vice President and Global Chief Customer Officer of the Company. Mr. Douglas joinedthe Company in January 1988 as a District Sales Manager for the Foodservice Division of Coca-Cola USA. In May 1994, he wasnamed Vice President of Coca-Cola USA, initially assuming leadership of the CCE Sales and Marketing Group and eventuallyassuming leadership of the entire North American Field Sales and Marketing Groups. In 2000, Mr. Douglas was appointedPresident of the North American Division within the North America Group. He served as Senior Vice President and ChiefCustomer Officer of the Company from 2003 until 2006 and continued serving as Senior Vice President until April 2007.Mr. Douglas was President of the North America Group from August 2006 through December 31, 2012. He was appointed GlobalChief Customer Officer effective January 1, 2013 and was elected Senior Vice President of the Company on February 21, 2013.
Ceree Eberly, 50, is Senior Vice President and Chief People Officer of the Company, with responsibility for leading the Company’sglobal People Function (formerly Human Resources). Ms. Eberly joined the Company in 1990, serving in staffing, compensationand other roles supporting the Company’s business units around the world. From 1998 until 2003, she served as Human ResourcesDirector for the Latin Center Division. From 2003 until 2007, Ms. Eberly served as Vice President of the McDonald’s Division.She was appointed Group Human Resources Director for Europe in July 2007 and served in that capacity until she was appointedChief People Officer effective December 1, 2009. Ms. Eberly was elected Senior Vice President of the Company effectiveApril 1, 2010.
Gary P. Fayard, 60, is Executive Vice President and Chief Financial Officer of the Company. Mr. Fayard joined the Company in1994. In July 1994, he was elected Vice President and Controller. In December 1999, he was elected Senior Vice President andChief Financial Officer. Mr. Fayard was elected Executive Vice President of the Company in February 2003.
23

Irial Finan, 55, is Executive Vice President and President, Bottling Investments and Supply Chain. Mr. Finan joined the Companyand was named President, Bottling Investments in 2004. Mr. Finan joined the Coca-Cola system in 1981 with Coca-Cola BottlersIreland, Ltd., where for several years he held a variety of accounting positions. From 1987 until 1990, Mr. Finan served as FinanceDirector of Coca-Cola Bottlers Ireland, Ltd. From 1991 to 1993, he served as Managing Director of Coca-Cola BottlersUlster, Ltd. He was Managing Director of Coca-Cola bottlers in Romania and Bulgaria until late 1994. From 1995 to 1999, heserved as Managing Director of Molino Beverages, with responsibility for expanding markets, including the Republic of Ireland,Northern Ireland, Romania, Moldova, Russia and Nigeria. Mr. Finan served from 2001 until 2003 as Chief Executive Officer ofCoca-Cola Hellenic. He was elected Executive Vice President of the Company in October 2004.
Bernhard Goepelt, 50, is Senior Vice President, General Counsel and Chief Legal Counsel of the Company. Mr. Goepelt joinedthe Company in 1992 as Legal Counsel for the German Division. In 1997, he was appointed Legal Counsel for the Middle andFar East Group and in 1999 was promoted to Division Counsel, Southeast and West Asia Division, based in Thailand. In 2003,Mr. Goepelt was appointed Group Counsel for the Central Europe, Eurasia and Middle East Group. In 2005, he assumed theposition of General Counsel for Japan and China and in 2007, Mr. Goepelt was appointed General Counsel, Pacific Group. InApril 2010, he moved to Atlanta to become Associate General Counsel, Global Marketing, Commercial Leadership & Strategy. InSeptember 2010, Mr. Goepelt took on the additional responsibility of General Counsel for the Pacific Group. In addition to hisfunctional responsibilities, he also managed the administration of the Legal Division. Mr. Goepelt was elected Senior VicePresident, General Counsel and Chief Legal Counsel of the Company in December 2011.
Glenn G. Jordan S., 56, is President of the Pacific Group. Mr. Jordan joined the Company in 1978 as a field representative forCoca-Cola de Colombia where, for several years, he held various positions, including Region Manager from 1985 to 1989.Mr. Jordan served as Marketing Operations Manager, Pacific Group from 1989 to 1990 and as Vice President of Coca-ColaInternational and Executive Assistant to the Pacific Group President from 1990 to 1991. He served as Senior Vice President,Marketing and Operations, for the Brazil Division from 1991 to 1995; as President of the River Plate Division, which comprisedArgentina, Uruguay and Paraguay, from 1995 to 2000; and as President of the South Latin America Division, comprisingArgentina, Bolivia, Chile, Ecuador, Paraguay, Peru and Uruguay, from 2000 to 2003. In February 2003, Mr. Jordan was appointedExecutive Vice President and Director of Operations for the Latin America Group and served in that capacity until February2006. Mr. Jordan was appointed President of the East, South Asia and Pacific Rim Group in February 2006. The East, South Asiaand Pacific Rim Group was reconfigured and renamed the Pacific Group, effective January 1, 2007.
Nathan Kalumbu, 48, is President of the Eurasia and Africa Group. Mr. Kalumbu joined the Company in 1990 as the CentralAfrica region’s External Affairs Manager and served in numerous roles in marketing operations and country management inZimbabwe, Zambia and Malawi from 1992 to 1996. He held the role of Executive Assistant to the South Africa Division Presidentfrom 1997 to 1998 and Region Manager for Central Africa from 1998 to 2000 and for Nigeria from 2000 to 2004. In 2004,Mr. Kalumbu was appointed Business Planning Director and Executive Assistant to the Retail Division President, North America.He returned to the Africa Group as Director of Business Strategy & Planning for the East and Central Africa Division in 2006. In2007, he was named President of the Central, East and West Africa (CEWA) Business Unit, and served in that role until hisappointment to his current position effective January 1, 2013.
Muhtar Kent, 60, is Chairman of the Board of Directors, Chief Executive Officer and President of the Company. Mr. Kent joinedthe Company in 1978 and held a variety of marketing and operations roles throughout his career with the Company. In 1985, hewas appointed General Manager of Coca-Cola Turkey and Central Asia. From 1989 to 1995, Mr. Kent served as President of theEast Central Europe Division and Senior Vice President of Coca-Cola International. Between 1995 and 1998, he served asManaging Director of Coca-Cola Amatil-Europe, covering bottling operations in 12 countries, and from 1999 until 2005, he servedas President and Chief Executive Officer of Efes Beverage Group, a diversified beverage company with Coca-Cola and beeroperations across Southeast Europe, Turkey and Central Asia. Mr. Kent rejoined the Company in May 2005 as President andChief Operating Officer, North Asia, Eurasia and Middle East Group, an organization serving a broad and diverse region thatincluded China, Japan and Russia. He was appointed President, Coca-Cola International in January 2006 and was electedExecutive Vice President of the Company in February 2006. He was elected President and Chief Operating Officer of theCompany in December 2006 and was elected to the Board of Directors in April 2008. Mr. Kent was elected Chief ExecutiveOfficer of the Company effective July 1, 2008, and was elected Chairman of the Board of Directors of the Company in April 2009.
James Quincey, 48, is President of the Europe Group. Mr. Quincey joined the Company in 1996 as Director, Learning Strategy forthe Latin America Group. He moved to Mexico as Deputy to the Division President in 1999, and became Region Manager forArgentina & Uruguay in 2000, and then General Manager of the South Cone region (Argentina, Chile, Uruguay & Paraguay) in2003. Mr. Quincey was appointed President of the South Latin Division in December 2003, and President of the Mexico Divisionin December 2005. In October 2008, he was named President of the Northwest Europe and Nordics Business Unit, and served inthat role until his appointment to his current position effective January 1, 2013.
24

Jose Octavio Reyes, 60, is Vice Chairman, The Coca-Cola Export Corporation. Mr. Reyes began his career with the Company in1980 at Coca-Cola de Mexico as Manager of Strategic Planning. In 1987, he was appointed Manager of the Sprite and Diet Cokebrands at Corporate Headquarters. In 1990, he was appointed Marketing Director for the Brazil Division, and later becameMarketing and Operations Vice President for the Mexico Division. Mr. Reyes assumed the role of Deputy Division President forthe Mexico Division in 1996 and was named Division President for the Mexico Division later that year. From December 2002 untilDecember 31, 2012, Mr. Reyes served as President of the Latin America Group and served in that role until his appointment tohis current position effective January 1, 2013.
Brian Smith, 57, is President of the Latin America Group. Mr. Smith joined the Company in 1997 as Latin America GroupManager for Mergers and Acquisitions, a role he held until July 2001. From 2001 to 2002, he worked as Executive Assistant toBrian Dyson, then Chief Operating Officer and Vice Chairman of the Company. He served as President of the Brazil Divisionfrom 2002 to 2008 and President of the Mexico Business Unit from 2008 to 2011. Mr. Smith was appointed to his current positioneffective January 1, 2013.
Joseph V. Tripodi, 57, is Executive Vice President and Chief Marketing and Commercial Officer of the Company. Mr. Tripodijoined the Company as Chief Marketing and Commercial Officer effective September 2007 and was elected Senior Vice Presidentof the Company in October 2007, a capacity in which he served until July 2009, when he was elected Executive Vice President ofthe Company. Prior to joining the Company, Mr. Tripodi served as Senior Vice President and Chief Marketing Officer for AllstateInsurance Co. Prior to joining Allstate in 2003, Mr. Tripodi was Chief Marketing Officer for The Bank of New York. From 1999until 2002, he served as Chief Marketing Officer for Seagram Spirits & Wine Group. From 1989 to 1998, he was the ExecutiveVice President for Global Marketing, Products and Services for MasterCard International. Previously, Mr. Tripodi spent sevenyears with the Mobil Oil Corporation in roles of increasing responsibility in planning, marketing, business development andoperations in New York, Paris, Hong Kong and Guam.
Clyde C. Tuggle, 50, is Senior Vice President and Chief Public Affairs and Communications Officer of the Company. Mr. Tugglejoined the Company in 1989 in the Corporate Issues Communications Department. In 1992, he was named Executive Assistant toRoberto C. Goizueta, then Chairman and Chief Executive Officer of the Company, where he managed external affairs andcommunications for the Office of the Chairman. In 1998, Mr. Tuggle transferred to the Company’s Central European DivisionOffice in Vienna where he held a variety of positions, including Director of Operations Development, Deputy to the DivisionPresident and Region Manager for Austria. In 2000, Mr. Tuggle returned to Atlanta as Executive Assistant to then Chairman andChief Executive Officer Douglas N. Daft and was elected Vice President of the Company. In February 2003, he was elected SeniorVice President of the Company and appointed Director of Worldwide Public Affairs and Communications. From 2005 untilSeptember 2008, Mr. Tuggle served as President of the Russia, Ukraine and Belarus Division. In September 2008, he returned toAtlanta as Senior Vice President, Corporate Affairs and Productivity. In May 2009, Mr. Tuggle was named Senior Vice President,Global Public Affairs and Communications of the Company.
Glen Walter, 44, is President and Chief Operating Officer of Coca-Cola Refreshments, the Company’s bottling and customerservice organization for North America. Mr. Walter joined the Company in 2010 as Coca-Cola Refreshments’ Vice President ofRegion Sales, and served in this role until his appointment to his current role effective January 1, 2013. Before joining theCompany, Mr. Walter was Central Business Unit Vice President and General Manager for Coca-Cola Enterprises Inc. in NorthAmerica from November 2008 to October 2010. Prior to joining the Coca-Cola system, he served as President of InBev USA from2006 to 2008 and as Vice President of InBev USA from 2004 to 2006. Mr. Walter started his career in the beverage industry in1991 as a member of the E&J Gallo Management Development Program.
Guy Wollaert, 53, is Senior Vice President and Chief Technical Officer of the Company. Mr. Wollaert joined the Company in 1992in Brussels, Belgium as a Project Manager and has held various positions of increasing responsibility in the technical and supplychain fields. From 1997 to 1999, he served as Technical Director for the Indonesia region based in Jakarta. In 1999, Mr. Wollaertrelocated to Atlanta where he held the position of Value Chain Account Manager for the Asia Pacific region. In late 2000, hejoined Coca-Cola Tea Products Co. Ltd. (‘‘CCTPC’’), a Company subsidiary based in Tokyo. Mr. Wollaert became President ofCCTPC in January 2002. From 2003 to 2006, he was President of Coca-Cola National Beverages Ltd., a national supplymanagement Company subsidiary that managed the Company’s Japan supply business. In 2006, Mr. Wollaert returned to Atlantaas Vice President, Global Supply Chain Development, and from January 2008 until December 2010, he served as GeneralManager, Global Juice Center. Mr. Wollaert was appointed Chief Technical Officer effective January 2011 and was elected SeniorVice President of the Company in February 2011.
All executive officers serve at the pleasure of the Board of Directors. There is no family relationship between any of the Directorsor executive officers of the Company.
25

PART II
ITEM 5. MARKET FOR REGISTRANT’S COMMON EQUITY, RELATED STOCKHOLDER MATTERS AND ISSUERPURCHASES OF EQUITY SECURITIES
The principal United States market in which the Company’s common stock is listed and traded is the New York Stock Exchange.
The following table sets forth, for the quarterly periods indicated, the high and low market prices per share for the Company’scommon stock, as reported on the New York Stock Exchange composite tape, and dividend per share information:
Common StockMarket Prices
DividendsHigh Low Declared
2012Fourth quarter $ 38.83 $ 35.58 $ 0.255Third quarter 40.66 37.11 0.255Second quarter1 39.10 35.92 0.255First quarter1 37.20 33.29 0.255
2011 — As Adjusted1
Fourth quarter $ 35.15 $ 31.67 $ 0.235Third quarter 35.89 31.80 0.235Second quarter 34.39 32.22 0.235First quarter 33.74 30.65 0.235
1 On July 27, 2012, the Company’s certificate of incorporation was amended to increase the number of authorized shares of common stock from5.6 billion to 11.2 billion and effect a two-for-one stock split of the common stock. The record date for the stock split was July 27, 2012, and theadditional shares were distributed on August 10, 2012. Each shareowner of record on the close of business on the record date received oneadditional share of common stock for each share held. All per share data presented above reflects the impact of the stock split.
While we have historically paid dividends to holders of our common stock on a quarterly basis, the declaration and payment offuture dividends will depend on many factors, including, but not limited to, our earnings, financial condition, business developmentneeds and regulatory considerations, and is at the discretion of our Board of Directors.
As of February 25, 2013, there were 243,575 shareowner accounts of record. This figure does not include a substantially greaternumber of ‘‘street name’’ holders or beneficial holders of our common stock, whose shares are held of record by banks, brokersand other financial institutions.
The information under the principal heading ‘‘EQUITY COMPENSATION PLAN INFORMATION’’ in the Company’s definitiveProxy Statement for the Annual Meeting of Shareowners to be held on April 24, 2013, to be filed with the Securities andExchange Commission (the ‘‘Company’s 2013 Proxy Statement’’), is incorporated herein by reference.
During the fiscal year ended December 31, 2012, no equity securities of the Company were sold by the Company that were notregistered under the Securities Act of 1933, as amended.
26

The following table presents information with respect to purchases of common stock of the Company made during the threemonths ended December 31, 2012, by the Company or any ‘‘affiliated purchaser’’ of the Company as defined in Rule 10b-18(a)(3)under the Exchange Act.
Maximum Number ofTotal Number of Shares That May
Average Shares Purchased Yet Be PurchasedTotal Number of Price Paid as Part of Publicly Under the Publicly
Period Shares Purchased1 Per Share Announced Plans2 Announced Plans3
September 29, 2012 through October 26, 2012 4,241,041 $ 37.53 4,240,000 563,008,144October 27, 2012 through November 23, 2012 8,326,995 36.88 8,134,100 554,874,044November 24, 2012 through December 31, 2012 11,936,130 37.21 11,930,900 542,943,144
Total 24,504,166 $ 37.15 24,305,000
1 The total number of shares purchased includes: (i) shares purchased pursuant to the 2006 Plan described in footnote 2 below, and (ii) sharessurrendered to the Company to pay the exercise price and/or to satisfy tax withholding obligations in connection with so-called stock swap exercisesof employee stock options and/or the vesting of restricted stock issued to employees, totaling 1,041 shares, 192,895 shares and 5,230 shares for thefiscal months of October, November and December 2012, respectively.
2 On July 20, 2006, we publicly announced that our Board of Directors had authorized a plan (the ‘‘2006 Plan’’) for the Company to purchase up to300 million shares of our Company’s common stock. This column discloses the number of shares purchased pursuant to the 2006 Plan during theindicated time periods.
3 On October 18, 2012, the Company publicly announced that our Board of Directors had authorized a new plan (the ‘‘2012 Plan’’) for the Companyto purchase up to 500 million shares of our Company’s common stock. The 2012 Plan will allow the Company to continue repurchasing sharesfollowing the completion of the 2006 Plan. The maximum number of shares that may yet be purchased under the publicly announced plans reflectsthe combined total available under both the 2006 Plan and the 2012 Plan.
27
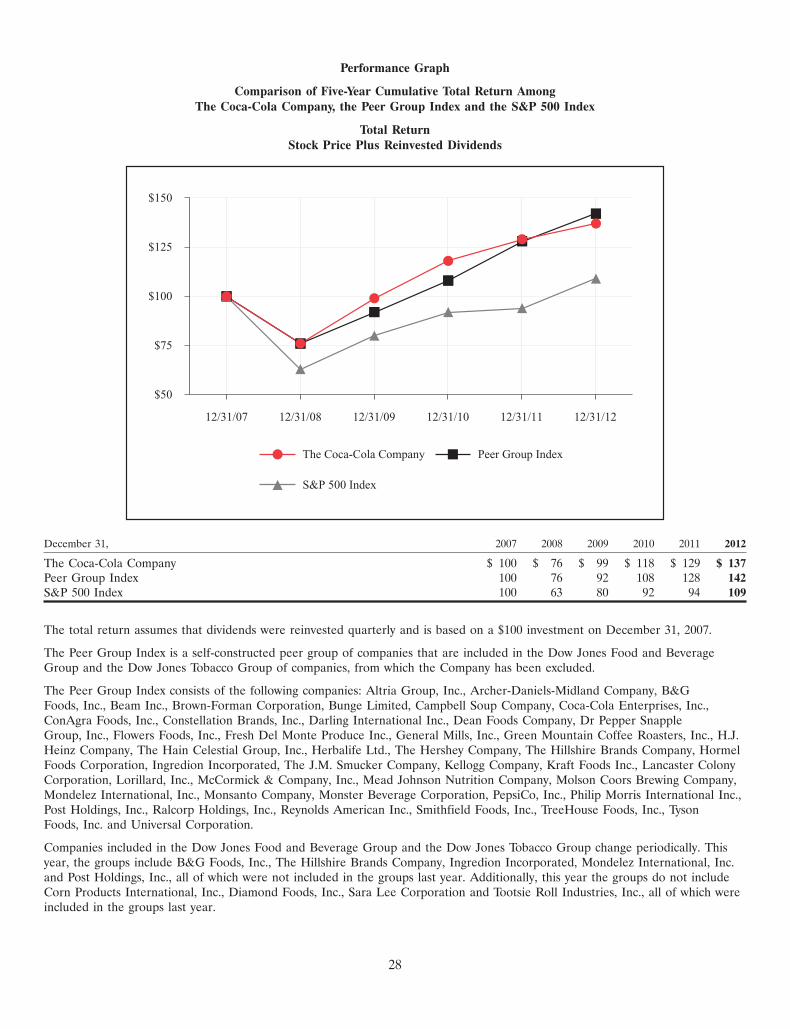
4MAR201317332708
Performance Graph
Comparison of Five-Year Cumulative Total Return AmongThe Coca-Cola Company, the Peer Group Index and the S&P 500 Index
Total ReturnStock Price Plus Reinvested Dividends
$50
$100
$125
$75
$150
12/31/07 12/31/08 12/31/09 12/31/10 12/31/11 12/31/12
Peer Group IndexThe Coca-Cola Company
S&P 500 Index
December 31, 2007 2008 2009 2010 2011 2012
The Coca-Cola Company $ 100 $ 76 $ 99 $ 118 $ 129 $ 137Peer Group Index 100 76 92 108 128 142S&P 500 Index 100 63 80 92 94 109
The total return assumes that dividends were reinvested quarterly and is based on a $100 investment on December 31, 2007.
The Peer Group Index is a self-constructed peer group of companies that are included in the Dow Jones Food and BeverageGroup and the Dow Jones Tobacco Group of companies, from which the Company has been excluded.
The Peer Group Index consists of the following companies: Altria Group, Inc., Archer-Daniels-Midland Company, B&GFoods, Inc., Beam Inc., Brown-Forman Corporation, Bunge Limited, Campbell Soup Company, Coca-Cola Enterprises, Inc.,ConAgra Foods, Inc., Constellation Brands, Inc., Darling International Inc., Dean Foods Company, Dr Pepper SnappleGroup, Inc., Flowers Foods, Inc., Fresh Del Monte Produce Inc., General Mills, Inc., Green Mountain Coffee Roasters, Inc., H.J.Heinz Company, The Hain Celestial Group, Inc., Herbalife Ltd., The Hershey Company, The Hillshire Brands Company, HormelFoods Corporation, Ingredion Incorporated, The J.M. Smucker Company, Kellogg Company, Kraft Foods Inc., Lancaster ColonyCorporation, Lorillard, Inc., McCormick & Company, Inc., Mead Johnson Nutrition Company, Molson Coors Brewing Company,Mondelez International, Inc., Monsanto Company, Monster Beverage Corporation, PepsiCo, Inc., Philip Morris International Inc.,Post Holdings, Inc., Ralcorp Holdings, Inc., Reynolds American Inc., Smithfield Foods, Inc., TreeHouse Foods, Inc., TysonFoods, Inc. and Universal Corporation.
Companies included in the Dow Jones Food and Beverage Group and the Dow Jones Tobacco Group change periodically. Thisyear, the groups include B&G Foods, Inc., The Hillshire Brands Company, Ingredion Incorporated, Mondelez International, Inc.and Post Holdings, Inc., all of which were not included in the groups last year. Additionally, this year the groups do not includeCorn Products International, Inc., Diamond Foods, Inc., Sara Lee Corporation and Tootsie Roll Industries, Inc., all of which wereincluded in the groups last year.
28
ITEM 6. SELECTED FINANCIAL DATA
The following selected financial data should be read in conjunction with ‘‘Item 7. Management’s Discussion and Analysis ofFinancial Condition and Results of Operations’’ and consolidated financial statements and notes thereto contained in ‘‘Item 8.Financial Statements and Supplementary Data’’ of this report.
Year Ended December 31, 2012 2011 20101 2009 2008(In millions except per share data) As Adjusted2,3
SUMMARY OF OPERATIONSNet operating revenues $ 48,017 $ 46,542 $ 35,119 $ 30,990 $ 31,944Net income attributable to shareowners of The Coca-Cola Company 9,019 8,584 11,787 6,797 5,819
PER SHARE DATABasic net income $ 2.00 $ 1.88 $ 2.55 $ 1.47 $ 1.26Diluted net income 1.97 1.85 2.53 1.46 1.25Cash dividends 1.02 0.94 0.88 0.82 0.76
BALANCE SHEET DATATotal assets $ 86,174 $ 79,974 $ 72,921 $ 48,671 $ 40,519Long-term debt 14,736 13,656 14,041 5,059 2,781
1 Includes the impact of the Company’s acquisition of CCE’s former North America business and the sale of our Norwegian and Swedish bottlingoperations to New CCE. Both of these transactions occurred on October 2, 2010. This information also includes the impact of the deconsolidationof certain entities, primarily bottling operations, on January 1, 2010, as a result of the Company’s adoption of new accounting guidance issued by theFinancial Accounting Standards Board (‘‘FASB’’). Refer to Note 1 and Note 2 of Notes to Consolidated Financial Statements.
2 Effective January 1, 2012, the Company elected to change our accounting methodology for determining the market-related value of assets for ourU.S. qualified defined benefit pension plans. The Company’s change in accounting methodology has been applied retrospectively, and we haveadjusted all prior period financial information presented herein as required.
3 On July 27, 2012, the Company’s certificate of incorporation was amended to increase the number of authorized shares of common stock from5.6 billion to 11.2 billion and effect a two-for-one stock split of the common stock. The record date for the stock split was July 27, 2012, and theadditional shares were distributed on August 10, 2012. Each shareowner of record on the close of business on the record date received oneadditional share of common stock for each share held. All share and per share data presented herein reflect the impact of the increase in authorizedshares and the stock split, as appropriate.
ITEM 7. MANAGEMENT’S DISCUSSION AND ANALYSIS OF FINANCIAL CONDITION AND RESULTS OFOPERATIONS
Overview
The following Management’s Discussion and Analysis of Financial Condition and Results of Operations (‘‘MD&A’’) is intended tohelp the reader understand The Coca-Cola Company, our operations and our present business environment. MD&A is providedas a supplement to — and should be read in conjunction with — our consolidated financial statements and the accompanyingnotes thereto contained in ‘‘Item 8. Financial Statements and Supplementary Data’’ of this report. This overview summarizes theMD&A, which includes the following sections:
• Our Business — a general description of our business and the nonalcoholic beverage segment of the commercial beverageindustry, our objective, our strategic priorities, our core capabilities, and challenges and risks of our business.
• Critical Accounting Policies and Estimates — a discussion of accounting policies that require critical judgments andestimates.
• Operations Review — an analysis of our Company’s consolidated results of operations for the three years presented in ourconsolidated financial statements. Except to the extent that differences among our operating segments are material to anunderstanding of our business as a whole, we present the discussion in the MD&A on a consolidated basis.
• Liquidity, Capital Resources and Financial Position — an analysis of cash flows; off-balance sheet arrangements andaggregate contractual obligations; foreign exchange; the impact of inflation and changing prices; and an overview offinancial position.
29

Our Business
General
The Coca-Cola Company is the world’s largest beverage company. We own or license and market more than 500 nonalcoholicbeverage brands, primarily sparkling beverages but also a variety of still beverages such as waters, enhanced waters, juices andjuice drinks, ready-to-drink teas and coffees, and energy and sports drinks. We own and market four of the world’s top fivenonalcoholic sparkling beverage brands: Coca-Cola, Diet Coke, Fanta and Sprite. Finished beverage products bearing ourtrademarks, sold in the United States since 1886, are now sold in more than 200 countries.
We make our branded beverage products available to consumers throughout the world through our network of Company-ownedor -controlled bottling and distribution operations as well as independent bottling partners, distributors, wholesalers andretailers — the world’s largest beverage distribution system. Of the approximately 57 billion beverage servings of all typesconsumed worldwide every day, beverages bearing trademarks owned by or licensed to us account for more than 1.8 billionservings.
We believe our success depends on our ability to connect with consumers by providing them with a wide variety of choices to meettheir desires, needs and lifestyle choices. Our success further depends on the ability of our people to execute effectively, every day.
Our goal is to use our Company’s assets — our brands, financial strength, unrivaled distribution system, global reach, and thetalent and strong commitment of our management and associates — to become more competitive and to accelerate growth in amanner that creates value for our shareowners.
Our Company markets, manufactures and sells:
• beverage concentrates, sometimes referred to as ‘‘beverage bases,’’ and syrups, including fountain syrups (we refer to thispart of our business as our ‘‘concentrate business’’ or ‘‘concentrate operations’’); and
• finished sparkling and still beverages (we refer to this part of our business as our ‘‘finished product business’’ or ‘‘finishedproduct operations’’).
Generally, finished product operations generate higher net operating revenues but lower gross profit margins than concentrateoperations.
In our concentrate operations, we typically generate net operating revenues by selling concentrates and syrups to authorizedbottling and canning operations (to which we typically refer as our ‘‘bottlers’’ or our ‘‘bottling partners’’). Our bottling partnerseither combine the concentrates with sweeteners (depending on the product), still water and/or sparkling water, or combine thesyrups with sparkling water to produce finished beverages. The finished beverages are packaged in authorized containers bearingour trademarks or trademarks licensed to us — such as cans and refillable and nonrefillable glass and plastic bottles — and arethen sold to retailers directly or, in some cases, through wholesalers or other bottlers. Outside the United States, we also sellconcentrates for fountain beverages to our bottling partners who are typically authorized to manufacture fountain syrups, whichthey sell to fountain retailers such as restaurants and convenience stores which use the fountain syrups to produce beverages forimmediate consumption, or to fountain wholesalers who in turn sell and distribute the fountain syrups to fountain retailers.
Our finished product operations consist primarily of the production, sales and distribution operations managed by CCR and ourCompany-owned or -controlled bottling and distribution operations. CCR is included in our North America operating segment,and our Company-owned or -controlled bottling and distribution operations are included in our Bottling Investments operatingsegment. Our finished product operations generate net operating revenues by selling sparkling beverages and a variety of stillbeverages, such as juices and juice drinks, energy and sports drinks, ready-to-drink teas and coffees, and certain water products, toretailers or to distributors, wholesalers and bottling partners who distribute them to retailers. In addition, in the United States, wemanufacture fountain syrups and sell them to fountain retailers such as restaurants and convenience stores who use the fountainsyrups to produce beverages for immediate consumption or to authorized fountain wholesalers or bottling partners who resell thefountain syrups to fountain retailers. In the United States, we authorize wholesalers to resell our fountain syrups throughnonexclusive appointments that neither restrict us in setting the prices at which we sell fountain syrups to the wholesalers norrestrict the territories in which the wholesalers may resell in the United States.
30

The following table sets forth the percentage of total net operating revenues related to concentrate operations and finishedproduct operations:
Year Ended December 31, 2012 2011 2010
Concentrate operations1 38% 39% 51%Finished product operations2,3 62 61 49
Net operating revenues 100% 100% 100%
1 Includes concentrates sold by the Company to authorized bottling partners for the manufacture of fountain syrups. The bottlers then typically sellthe fountain syrups to wholesalers or directly to fountain retailers.
2 Includes fountain syrups manufactured by the Company, including consolidated bottling operations, and sold to fountain retailers or to authorizedfountain wholesalers or bottling partners who resell the fountain syrups to fountain retailers.
3 Includes net operating revenues related to our acquisition of CCE’s former North America business for the full year in 2012 and 2011. In 2010, thepercentage includes net operating revenues from the date of the CCE acquisition on October 2, 2010.
The following table sets forth the percentage of total worldwide unit case volume related to concentrate operations and finishedproduct operations:
Year Ended December 31, 2012 2011 2010
Concentrate operations1 70% 70% 76%Finished product operations2,3 30 30 24
Total worldwide unit case volume 100% 100% 100%
1 Includes unit case volume related to concentrates sold by the Company to authorized bottling partners for the manufacture of fountain syrups. Thebottlers then typically sell the fountain syrups to wholesalers or directly to fountain retailers.
2 Includes unit case volume related to fountain syrups manufactured by the Company, including consolidated bottling operations, and sold to fountainretailers or to authorized fountain wholesalers or bottling partners who resell the fountain syrups to fountain retailers.
3 Includes unit case volume related to our acquisition of CCE’s former North America business for the full year in 2012 and 2011. In 2010, thepercentage includes unit case volume from the date of the CCE acquisition on October 2, 2010.
Acquisition of CCE’s Former North America Business and Related Transactions
Pursuant to the terms of the business separation and merger agreement entered into on February 25, 2010, as amended (the‘‘merger agreement’’), on October 2, 2010 (the ‘‘acquisition date’’), we acquired CCE’s former North America business, consistingof CCE’s production, sales and distribution operations in the United States, Canada, the British Virgin Islands, the United StatesVirgin Islands and the Cayman Islands, and a substantial majority of CCE’s corporate segment. We believe this acquisition willresult in an evolved franchise system that will enable us to better serve the unique needs of the North American market. Thecreation of a unified operating system will strategically position us to better market and distribute our nonalcoholic beveragebrands in North America.
Under the terms of the merger agreement, the Company acquired the 67 percent of CCE’s former North America business thatwas not already owned by the Company for consideration that included: (1) the Company’s 33 percent indirect ownership interestin CCE’s European operations; (2) cash consideration; and (3) replacement awards issued to certain current and formeremployees of CCE’s corporate operations and former North America business. At closing, CCE shareowners other than theCompany exchanged their CCE common stock for common stock in a new entity, which was renamed Coca-Cola Enterprises, Inc.(which is referred to herein as ‘‘New CCE’’) and which continues to hold the European operations held by CCE prior to theacquisition. At closing, New CCE became 100 percent owned by shareowners that held shares of common stock of CCEimmediately prior to the closing, other than the Company. As a result of this transaction, the Company does not own any interestin New CCE.
As of October 1, 2010, our Company owned 33 percent of the outstanding common stock of CCE. Based on the closing price ofCCE’s common stock on the last day of trading prior to the acquisition date, the fair value of our investment in CCE was$5,373 million, which reflected the fair value of our ownership in both CCE’s European operations and its former North Americabusiness. We remeasured our equity interest in CCE to fair value upon the close of the transaction. As a result, we recognized again of $4,978 million, which was classified in the line item other income (loss) — net in our consolidated statement of income.The gain included a $137 million reclassification adjustment related to foreign currency translation gains recognized upon thedisposal of our indirect investment in CCE’s European operations. The Company relinquished its indirect ownership interest inCCE’s European operations to New CCE as part of the consideration to acquire the 67 percent of CCE’s former North Americabusiness that was not already owned by the Company.
31
Although the CCE transaction was structured to be primarily cashless, under the terms of the merger agreement, we agreed toassume $8.9 billion of CCE debt. In the event the actual CCE debt on the acquisition date was less than the agreed amount, weagreed to make a cash payment to New CCE for the difference. As of the acquisition date, the debt assumed by the Company was$7.9 billion. The total cash consideration paid to New CCE as part of the transaction was $1.4 billion, which included $1.0 billionrelated to the debt shortfall.
In contemplation of the closing of our acquisition of CCE’s former North America business, we reached an agreement with DPSto distribute certain DPS brands in territories where DPS brands had been distributed by CCE prior to the CCE transaction.Under the terms of our agreement with DPS, concurrently with the closing of the CCE transaction, we entered into licenseagreements with DPS to distribute Dr Pepper trademark brands in the United States, Canada Dry in the Northeastern UnitedStates, and Canada Dry and C’ Plus in Canada, and we made a net one-time cash payment of $715 million to DPS. Under thelicense agreements, the Company agreed to meet certain performance obligations to distribute DPS products in retail andfoodservice accounts and vending machines. The license agreements have initial terms of 20 years, with automatic 20-year renewalperiods unless otherwise terminated under the terms of the agreements. The license agreements replaced agreements betweenDPS and CCE existing immediately prior to the completion of the CCE transaction. In addition, we entered into an agreementwith DPS to include Dr Pepper and Diet Dr Pepper in our Coca-Cola Freestyle fountain dispensers in certain outlets throughoutthe United States. The Coca-Cola Freestyle agreement has a term of 20 years.
On October 2, 2010, we sold all of our ownership interests in our Norwegian and Swedish bottling operations to New CCE for$0.9 billion in cash. In addition, in connection with the acquisition of CCE’s former North America business, we granted to NewCCE the right to negotiate the acquisition of our majority interest in our German bottler at any time from 18 to 39 months afterFebruary 25, 2010, at the then current fair value and subject to terms and conditions as mutually agreed.
The Nonalcoholic Beverage Segment of the Commercial Beverage Industry
We operate in the highly competitive nonalcoholic beverage segment of the commercial beverage industry. We face strongcompetition from numerous other general and specialty beverage companies. We, along with other beverage companies, areaffected by a number of factors, including, but not limited to, cost to manufacture and distribute products, consumer spending,economic conditions, availability and quality of water, consumer preferences, inflation, political climate, local and national lawsand regulations, foreign currency exchange fluctuations, fuel prices and weather patterns.
Our Objective
Our objective is to use our formidable assets — our brands, financial strength, unrivaled distribution system, global reach, and thetalent and strong commitment of our management and associates — to achieve long-term sustainable growth. Our vision forsustainable growth includes the following:
• People: Being a great place to work where people are inspired to be the best they can be.
• Portfolio: Bringing to the world a portfolio of beverage brands that anticipates and satisfies people’s desires and needs.
• Partners: Nurturing a winning network of partners and building mutual loyalty.
• Planet: Being a responsible global citizen that makes a difference.
• Profit: Maximizing return to shareowners while being mindful of our overall responsibilities.
• Productivity: Managing our people, time and money for greatest effectiveness.
Strategic Priorities
We have four strategic priorities designed to create long-term sustainable growth for our Company and the Coca-Cola system andvalue for our shareowners. These strategic priorities are driving global beverage leadership; accelerating innovation; leveraging ourbalanced geographic portfolio; and leading the Coca-Cola system for growth. To enable the entire Coca-Cola system so that wecan deliver on these strategic priorities, we must further enhance our core capabilities of consumer marketing; commercialleadership; franchise leadership; and bottling and distribution operations.
32
Core Capabilities
Consumer Marketing
Marketing investments are designed to enhance consumer awareness of, and increase consumer preference for, our brands. Thisproduces long-term growth in unit case volume, per capita consumption and our share of worldwide nonalcoholic beverage sales.Through our relationships with our bottling partners and those who sell our products in the marketplace, we create andimplement integrated marketing programs, both globally and locally, that are designed to heighten consumer awareness of andproduct appeal for our brands. In developing a strategy for a Company brand, we conduct product and packaging research,establish brand positioning, develop precise consumer communications and solicit consumer feedback. Our integrated marketingactivities include, but are not limited to, advertising, point-of-sale merchandising and sales promotions.
We have disciplined marketing strategies that focus on driving volume in emerging markets, increasing our brand value indeveloping markets and growing profit in our developed markets. In emerging markets, we are investing in infrastructureprograms that drive volume through increased access to consumers. In developing markets, where consumer access has largelybeen established, our focus is on differentiating our brands. In our developed markets, we continue to invest in brands andinfrastructure programs, but at a slower rate than revenue growth.
We are focused on affordability and ensuring we are communicating the appropriate message based on the current economicenvironment.
Commercial Leadership
The Coca-Cola system has millions of customers around the world who sell or serve our products directly to consumers. We focuson enhancing value for our customers and providing solutions to grow their beverage businesses. Our approach includesunderstanding each customer’s business and needs — whether that customer is a sophisticated retailer in a developed market or akiosk owner in an emerging market. We focus on ensuring that our customers have the right product and package offerings andthe right promotional tools to deliver enhanced value to themselves and the Company. We are constantly looking to build newbeverage consumption occasions in our customers’ outlets through unique and innovative consumer experiences, productavailability and delivery systems, and beverage merchandising and displays. We participate in joint brand-building initiatives withour customers in order to drive customer preference for our brands. Through our commercial leadership initiatives, we embedourselves further into our retail customers’ businesses while developing strategies for better execution at the point of sale.
Franchise Leadership
We must continue to improve our franchise leadership capabilities to give our Company and our bottling partners the ability togrow together through shared values, aligned incentives and a sense of urgency and flexibility that supports consumers’ alwayschanging needs and tastes. The financial health and success of our bottling partners are critical components of the Company’ssuccess. We work with our bottling partners to identify system requirements that enable us to quickly achieve scale andefficiencies, and we share best practices throughout the bottling system. Our system leadership allows us to leverage recentacquisitions to expand our volume base and enhance margins. With our bottling partners, we work to produce differentiatedbeverages and packages that are appropriate for the right channels and consumers. We also design business models for sparklingand still beverages in specific markets to ensure that we appropriately share the value created by these beverages with our bottlingpartners. We will continue to build a supply chain network that leverages the size and scale of the Coca-Cola system to gain acompetitive advantage.
Bottling and Distribution Operations
Most of our Company beverage products are manufactured, sold and distributed by independent bottling partners. However, overthe past several years the amount of Company beverage products that are manufactured, sold and distributed by consolidatedbottling and distribution operations has increased. We often acquire bottlers in underperforming markets where we believe we canuse our resources and expertise to improve performance. Owning such a controlling interest enables us to compensate for limitedlocal resources; help focus the bottler’s sales and marketing programs; assist in the development of the bottler’s business andinformation systems; and establish an appropriate capital structure for the bottler.
Our Company has a long history of providing world-class customer service, demonstrating leadership in the marketplace andleveraging the talent of our global workforce. In addition, we have an experienced bottler management team. All of these factorsare critical to build upon as we manage our growing bottling and distribution operations.
The Company has a deep commitment to continuously improving our business. This includes our efforts to develop innovativepackaging and merchandising solutions which help drive demand for our beverages and meet the growing needs of our consumers.As we further transform the way we go to market, the Company continues to seek out ways to be more efficient.
33

Challenges and Risks
Being global provides unique opportunities for our Company. Challenges and risks accompany those opportunities. Ourmanagement has identified certain challenges and risks that demand the attention of the nonalcoholic beverage segment of thecommercial beverage industry and our Company. Of these, five key challenges and risks are discussed below.
Obesity and Inactive Lifestyles
Increasing concern among consumers, public health professionals and government agencies of the potential health problemsassociated with obesity and inactive lifestyles represents a significant challenge to our industry. We recognize that obesity is acomplex public health problem and are committed to being a part of the solution. This commitment is reflected through ourbroad portfolio, with a beverage to suit every caloric and hydration need.
All of our beverages can be consumed as part of a balanced diet. Consumers who want to reduce the calories they consume frombeverages can choose from our continuously expanding portfolio of more than 800 low- and no-calorie beverages, nearly25 percent of our global portfolio, as well as our regular beverages in smaller portion sizes. We believe in the importance andpower of ‘‘informed choice,’’ and we continue to support the fact-based nutrition labeling and education initiatives that encouragepeople to live active, healthy lifestyles. Our commitment also includes creating and adhering to responsible policies in schools andin the marketplace; supporting programs to encourage physical activity and promote nutrition education; and continuously meetingchanging consumer needs through beverage innovation, choice and variety. We recognize the health of our business is interwovenwith the well-being of our consumers, our employees and the communities we serve, and we are working in cooperation withgovernments, educators and consumers.
Water Quality and Quantity
Water quality and quantity is an issue that increasingly requires our Company’s attention and collaboration with other companies,suppliers, governments, nongovernmental organizations and communities where we operate. Water is the main ingredient insubstantially all of our products and is needed to produce the agricultural ingredients on which our business relies. It also iscritical to the prosperity of the communities we serve. Today, water is a limited natural resource facing unprecedented challengesfrom overexploitation, flourishing food demand, increasing pollution, poor management and the effects of climate change.
Our Company has a robust water stewardship and management program and continues to work to improve water use efficiency,treat wastewater prior to discharge and to achieve our goal of replenishing the water that we and our bottling partners source anduse in our finished products. We regularly assess the specific water-related risks that we and many of our bottling partners faceand have implemented a formal water risk management program. We are actively collaborating with other companies,governments, nongovernmental organizations and communities to advocate for needed water policy reforms and action to protectwater availability and quality around the world. We are working with our global partners to develop sustainability-related waterprojects. We are encouraging improved water efficiency and conservation efforts throughout our system. Through these integratedprograms, we believe that our Company is in an excellent position to leverage the water-related knowledge we have developed inthe communities we serve — through source water availability assessments, water resource management, water treatment,wastewater treatment systems, and models for working with communities and partners in addressing water and sanitation needs.As demand for water continues to increase around the world, we expect commitment and continued action on our part will becrucial to the successful long-term stewardship of this critical natural resource.
Evolving Consumer Preferences
Consumers want more choices. We are impacted by shifting consumer demographics and needs, on-the-go lifestyles, agingpopulations in developed markets and consumers who are empowered with more information than ever. We are committed togenerating new avenues for growth through our core brands with a focus on diet and light products, innovative packaging, andingredient and packaging material education efforts. We are also committed to continuing to expand the variety of choices weprovide to consumers to meet their needs, desires and lifestyle choices.
Increased Competition and Capabilities in the Marketplace
Our Company is facing strong competition from some well-established global companies and many local participants. We mustcontinue to strengthen our capabilities in marketing and innovation in order to maintain our brand loyalty and market share whilewe selectively expand into other profitable segments of the nonalcoholic beverage segment of the commercial beverage industry.
34

Food Security
Increased demand for commodities and decreased agricultural productivity in certain regions of the world as a result of changingweather patterns may limit availability or increase the cost of key agricultural commodities, such as sugarcane, corn, beets, citrus,coffee and tea, which are important sources of ingredients for our products, and could impact the food security of communitiesaround the world. We are committed to implementing programs focused on economic opportunity and environmentalsustainability designed to help address these agricultural challenges. Through joint efforts with farmers, communities, bottlers,suppliers and key partners, as well as our increased and continued investment in sustainable agriculture, we can together helpmake a strategic impact on food security.
All of these challenges and risks — obesity and inactive lifestyles, water quality and quantity, evolving consumer preferences,increased competition and capabilities in the marketplace, and food security — have the potential to have a material adverseeffect on the nonalcoholic beverage segment of the commercial beverage industry and on our Company; however, we believe ourCompany is well positioned to appropriately address these challenges and risks.
See also ‘‘Item 1A. Risk Factors’’ in Part I of this report for additional information about risks and uncertainties facing ourCompany.
Critical Accounting Policies and Estimates
Our consolidated financial statements are prepared in accordance with accounting principles generally accepted in the UnitedStates, which require management to make estimates, judgments and assumptions that affect the amounts reported in ourconsolidated financial statements and accompanying notes. We believe our most critical accounting policies and estimates relate tothe following:
• Principles of Consolidation
• Purchase Accounting for Acquisitions
• Recoverability of Noncurrent Assets
• Pension Plan Valuations
• Revenue Recognition
• Income Taxes
Management has discussed the development, selection and disclosure of critical accounting policies and estimates with the AuditCommittee of the Company’s Board of Directors. While our estimates and assumptions are based on our knowledge of currentevents and actions we may undertake in the future, actual results may ultimately differ from these estimates and assumptions. Fora discussion of the Company’s significant accounting policies, refer to Note 1 of Notes to Consolidated Financial Statements.
Principles of Consolidation
Our Company consolidates all entities that we control by ownership of a majority voting interest as well as VIEs for which ourCompany is the primary beneficiary. Generally, we consolidate only business enterprises that we control by ownership of amajority voting interest. However, there are situations in which consolidation is required even though the usual condition ofconsolidation (ownership of a majority voting interest) does not apply. Generally, this occurs when an entity holds an interest inanother business enterprise that was achieved through arrangements that do not involve voting interests, which results in adisproportionate relationship between such entity’s voting interests in, and its exposure to the economic risks and potentialrewards of, the other business enterprise. This disproportionate relationship results in what is known as a variable interest, and theentity in which we have the variable interest is referred to as a ‘‘VIE.’’ An enterprise must consolidate a VIE if it is determined tobe the primary beneficiary of the VIE. The primary beneficiary has both (a) the power to direct the activities of the VIE thatmost significantly impact the entity’s economic performance, and (b) the obligation to absorb losses or the right to receive benefitsfrom the VIE that could potentially be significant to the VIE.
Our Company holds interests in certain VIEs, primarily bottling and container manufacturing operations, for which we werenot determined to be the primary beneficiary. Our variable interests in these VIEs primarily relate to profit guarantees orsubordinated financial support. Refer to Note 11 of Notes to Consolidated Financial Statements. Although these financialarrangements resulted in us holding variable interests in these entities, they did not empower us to direct the activities of theVIEs that most significantly impact the VIEs’ economic performance. Our Company’s investments, plus any loans andguarantees, related to these VIEs totaled $1,776 million and $1,183 million as of December 31, 2012 and 2011, respectively,
35

representing our maximum exposures to loss. The Company’s investments, plus any loans and guarantees, related to these VIEswere not significant to the Company’s consolidated financial statements.
In addition, our Company holds interests in certain VIEs, primarily bottling and container manufacturing operations, for which wewere determined to be the primary beneficiary. As a result, we have consolidated these entities. Our Company’s investments, plusany loans and guarantees, related to these VIEs totaled $234 million and $199 million as of December 31, 2012 and 2011,respectively, representing our maximum exposures to loss. The assets and liabilities of VIEs for which we are the primarybeneficiary were not significant to the Company’s consolidated financial statements.
Creditors of our VIEs do not have recourse against the general credit of the Company, regardless of whether they are accountedfor as consolidated entities.
Purchase Accounting for Acquisitions
The Company applies the acquisition method of accounting in a business combination. In general, this methodology requirescompanies to record assets acquired and liabilities assumed at their respective fair market values at the date of acquisition. Weestimate fair value using the exit price approach, which is defined as the price that would be received if we sold an asset or paidto transfer a liability in an orderly market. The value of an exit price is determined from the viewpoint of all market participantsas a whole and may result in the Company valuing assets at a fair value that is not reflective of our intended use of the assets.Any amount of the purchase price paid that is in excess of the estimated fair values of net assets acquired is recorded in the lineitem goodwill in our consolidated balance sheets. Management’s judgment is used to determine the estimated fair values assignedto assets acquired and liabilities assumed, as well as asset lives for property, plant and equipment and amortization periods forintangible assets, and can materially affect the Company’s results of operations.
Transaction costs, as well as costs to reorganize acquired companies, are expensed as incurred in the Company’s consolidatedstatements of income.
On October 2, 2010, the Company acquired CCE’s former North America business and recorded total assets of $22.2 billion as ofthe acquisition date. The assets we acquired included a material amount of intangible assets that were subject to the significantestimates described above. During our purchase accounting measurement period, which concluded during the third quarter of2011, the Company made adjustments to certain amounts that resulted in a final balance of $22.0 billion of total assets beingrecorded in our consolidated balance sheets related to the CCE acquisition. Refer to the heading ‘‘Recoverability of NoncurrentAssets’’ below and Note 2 of Notes to Consolidated Financial Statements for further information related to this acquisition.
Recoverability of Noncurrent Assets
We perform recoverability and impairment tests of noncurrent assets in accordance with accounting principles generally acceptedin the United States. For certain assets, recoverability and/or impairment tests are required only when conditions exist thatindicate the carrying value may not be recoverable. For other assets, impairment tests are required at least annually, or morefrequently, if events or circumstances indicate that an asset may be impaired.
Our equity method investees also perform such recoverability and/or impairment tests. If an impairment charge is recorded by oneof our equity method investees, the Company records its proportionate share of such charge as a reduction of equity income(loss) — net in our consolidated statements of income. However, the actual amount we record with respect to our proportionateshare of such charges may be impacted by items such as basis differences, deferred taxes and deferred gains.
Management’s assessments of the recoverability and impairment tests of noncurrent assets involve critical accounting estimates.These estimates require significant management judgment, include inherent uncertainties and are often interdependent; therefore,they do not change in isolation. Factors that management must estimate include, among others, the economic life of the asset,sales volume, pricing, cost of raw materials, delivery costs, inflation, cost of capital, marketing spending, foreign currency exchangerates, tax rates, capital spending and proceeds from the sale of assets. These factors are even more difficult to predict when globalfinancial markets are highly volatile. The estimates we use when assessing the recoverability of noncurrent assets are consistentwith those we use in our internal planning. When performing impairment tests, we estimate the fair values of the assets usingmanagement’s best assumptions, which we believe would be consistent with what a hypothetical marketplace participant would use.Estimates and assumptions used in these tests are evaluated and updated as appropriate. The variability of these factors dependson a number of conditions, including uncertainty about future events, and thus our accounting estimates may change from periodto period. If other assumptions and estimates had been used when these tests were performed, impairment charges could haveresulted. As mentioned above, these factors do not change in isolation and, therefore, we do not believe it is practicable ormeaningful to present the impact of changing a single factor. Furthermore, if management uses different assumptions or ifdifferent conditions occur in future periods, future impairment charges could result. Refer to the heading ‘‘Operations Review’’below for additional information related to our present business environment.
36

Certain factors discussed above are impacted by our current business environment and are discussed throughout this report, asappropriate.
Our Company faces many uncertainties and risks related to various economic, political and regulatory environments in thecountries in which we operate, particularly in developing or emerging markets. Refer to the heading ‘‘Our Business — Challengesand Risks’’ above and ‘‘Item 1A. Risk Factors’’ in Part I of this report. As a result, management must make numerousassumptions which involve a significant amount of judgment when completing recoverability and impairment tests of noncurrentassets in various regions around the world.
Investments in Equity and Debt Securities
The carrying values of our investments in equity securities are determined using the equity method, the cost method or the fairvalue method. We account for investments in companies that we do not control or account for under the equity method either atfair value or under the cost method, as applicable. Investments in equity securities are carried at fair value, if the fair value of thesecurity is readily determinable. Equity investments carried at fair value are classified as either trading or available-for-salesecurities. Realized and unrealized gains and losses on trading securities and realized gains and losses on available-for-salesecurities are included in net income. Unrealized gains and losses, net of deferred taxes, on available-for-sale securities areincluded in our consolidated balance sheets as a component of accumulated other comprehensive income (loss) (‘‘AOCI’’). Tradingsecurities are reported as either marketable securities or other assets in our consolidated balance sheets. Securities classified asavailable-for-sale are reported as either marketable securities or other investments in our consolidated balance sheets, dependingon the length of time we intend to hold the investment. Investments in equity securities that do not qualify for fair valueaccounting are accounted for under the cost method. In accordance with the cost method, our initial investment is recorded atcost and we record dividend income when applicable dividends are declared. Cost method investments are reported as otherinvestments in our consolidated balance sheets.
Our investments in debt securities are carried at either amortized cost or fair value. Investments in debt securities that theCompany has the positive intent and ability to hold to maturity are carried at amortized cost and classified as held-to-maturity.Investments in debt securities that are not classified as held-to-maturity are carried at fair value and classified as either trading oravailable-for-sale.
The following table presents the carrying values of our investments in equity and debt securities (in millions):
PercentageCarrying of Total
December 31, 2012 Value Assets
Equity method investments $ 9,216 11%Securities classified as available-for-sale 4,593 5Securities classified as trading 266 *Cost method investments 145 *
Total $ 14,220 17%
* Accounts for less than 1 percent of the Company’s total assets.
Investments classified as trading securities are not assessed for impairment, since they are carried at fair value with the change infair value included in net income. We review our investments in equity and debt securities that are accounted for using the equitymethod or cost method or that are classified as available-for-sale or held-to-maturity each reporting period to determine whethera significant event or change in circumstances has occurred that may have an adverse effect on the fair value of each investment.When such events or changes occur, we evaluate the fair value compared to our cost basis in the investment. We also perform thisevaluation every reporting period for each investment for which our cost basis has exceeded the fair value in the prior period. Thefair values of most of our Company’s investments in publicly traded companies are often readily available based on quoted marketprices. For investments in nonpublicly traded companies, management’s assessment of fair value is based on valuationmethodologies including discounted cash flows, estimates of sales proceeds and appraisals, as appropriate. We consider theassumptions that we believe hypothetical marketplace participants would use in evaluating estimated future cash flows whenemploying the discounted cash flow or estimates of sales proceeds valuation methodologies. The ability to accurately predict futurecash flows, especially in developing and emerging markets, may impact the determination of fair value.
In the event the fair value of an investment declines below our cost basis, management is required to determine if the decline infair value is other than temporary. If management determines the decline is other than temporary, an impairment charge isrecorded. Management’s assessment as to the nature of a decline in fair value is based on, among other things, the length of timeand the extent to which the market value has been less than our cost basis, the financial condition and near-term prospects
37

of the issuer, and our intent and ability to retain the investment for a period of time sufficient to allow for any anticipatedrecovery in market value.
In 2012, the Company recognized impairment charges of $16 million as a result of the other-than-temporary decline in the fairvalues of certain cost method investments. These impairment charges were recorded in the line item other income (loss) — net inour consolidated statement of income and impacted the Corporate operating segment. Refer to the heading ‘‘OperationsReview — Other Income (Loss) — Net’’ below as well as Note 16 and Note 17 of Notes to Consolidated Financial Statements.
In 2011, the Company recognized impairment charges of $17 million as a result of the other-than-temporary decline in the fairvalues of certain available-for-sale securities. In addition, the Company recognized charges of $41 million during 2011 related tothe impairment of an investment in an entity accounted for under the equity method of accounting. These impairment chargeswere recorded in the line item other income (loss) — net in our consolidated statement of income and impacted the Corporateoperating segment. Refer to the heading ‘‘Operations Review — Other Income (Loss) — Net’’ below as well as Note 16 andNote 17 of Notes to Consolidated Financial Statements.
In 2010, the Company recognized impairment charges of $41 million as a result of the other-than-temporary decline in the fairvalues of certain available-for-sale securities and an equity method investment. These impairment charges were recorded in theline item other income (loss) — net in our consolidated statement of income and impacted the Bottling Investments andCorporate operating segments. Refer to the heading ‘‘Operations Review — Other Income (Loss) — Net’’ below as well asNote 16 and Note 17 of Notes to Consolidated Financial Statements.
The following table presents the difference between calculated fair values, based on quoted closing prices of publicly tradedshares, and our Company’s cost basis in publicly traded bottlers accounted for as equity method investments (in millions):
Fair CarryingDecember 31, 2012 Value Value Difference
Coca-Cola FEMSA, S.A.B. de C.V. $ 8,601 $ 2,074 $ 6,527Coca-Cola Amatil Limited 3,133 1,125 2,008Coca-Cola Hellenic Bottling Company S.A. 1,865 1,368 497Coca-Cola Icecek A.S. 1,055 215 840Embotelladora Andina S.A. 787 389 398Coca-Cola Central Japan Co., Ltd. 188 176 12Coca-Cola Bottling Co. Consolidated 165 84 81Mikuni Coca-Cola Bottling Co., Ltd. 106 105 1
Total $ 15,900 $ 5,536 $ 10,364
Other Assets
Our Company invests in infrastructure programs with our bottlers that are directed at strengthening our bottling system andincreasing unit case volume. Additionally, our Company advances payments to certain customers to fund future marketingactivities intended to generate profitable volume and expenses such payments over the periods benefited. Advance payments arealso made to certain customers for distribution rights. Payments under these programs are generally capitalized and reported inthe line items prepaid expenses and other assets or other assets, as appropriate, in our consolidated balance sheets. When factsand circumstances indicate that the carrying value of these assets (or asset groups) may not be recoverable, management assessesthe recoverability of the carrying value by preparing estimates of sales volume and the resulting gross profit and cash flows. Theseestimated future cash flows are consistent with those we use in our internal planning. If the sum of the expected future cash flows(undiscounted and without interest charges) is less than the carrying amount, we recognize an impairment loss. The impairmentloss recognized is the amount by which the carrying amount exceeds the fair value.
As a result of our acquisition of CCE’s former North America business, the Company recorded charges of $266 million related topreexisting relationships during the year ended December 31, 2010. These charges were primarily related to the write-off of ourinvestment in infrastructure programs with CCE. Our investment in these infrastructure programs with CCE did not meet thecriteria to be recognized as an asset subsequent to the acquisition. Refer to Note 2 and Note 6 of Notes to Consolidated FinancialStatements.
38

Property, Plant and Equipment
As of December 31, 2012, the carrying value of our property, plant and equipment, net of depreciation, was $14,476 million, or17 percent of our total assets. Certain events or changes in circumstances may indicate that the recoverability of the carryingamount or remaining useful life of property, plant and equipment should be assessed, including, among others, the manner orlength of time in which the Company intends to use the asset, a significant decrease in market value, a significant change in thebusiness climate in a particular market, or a current period operating or cash flow loss combined with historical losses orprojected future losses. When such events or changes in circumstances are present and an impairment review is performed, weestimate the future cash flows expected to result from the use of the asset (or asset group) and its eventual disposition. Theseestimated future cash flows are consistent with those we use in our internal planning. If the sum of the expected future cash flows(undiscounted and without interest charges) is less than the carrying amount, we recognize an impairment loss. The impairmentloss recognized is the amount by which the carrying amount exceeds the fair value. We use a variety of methodologies todetermine the fair value of property, plant and equipment, including appraisals and discounted cash flow models, which areconsistent with the assumptions we believe hypothetical marketplace participants would use.
Goodwill, Trademarks and Other Intangible Assets
Intangible assets are classified into one of three categories: (1) intangible assets with definite lives subject to amortization,(2) intangible assets with indefinite lives not subject to amortization and (3) goodwill. For intangible assets with definite lives, testsfor impairment must be performed if conditions exist that indicate the carrying value may not be recoverable. For intangible assetswith indefinite lives and goodwill, tests for impairment must be performed at least annually or more frequently if events orcircumstances indicate that assets might be impaired. The following table presents the carrying values of intangible assets includedin our consolidated balance sheet (in millions):
PercentageCarrying of Total
December 31, 2012 Value Assets
Goodwill $ 12,255 14%Bottlers’ franchise rights with indefinite lives 7,405 9Trademarks with indefinite lives 6,527 8Definite-lived intangible assets, net 1,039 1Other intangible assets not subject to amortization 111 *
Total $ 27,337 32%
* Accounts for less than 1 percent of the Company’s total assets.
When facts and circumstances indicate that the carrying value of definite-lived intangible assets may not be recoverable,management assesses the recoverability of the carrying value by preparing estimates of sales volume and the resulting gross profitand cash flows. These estimated future cash flows are consistent with those we use in our internal planning. If the sum of theexpected future cash flows (undiscounted and without interest charges) is less than the carrying amount of the asset (or assetgroup), we recognize an impairment loss. The impairment loss recognized is the amount by which the carrying amount exceeds thefair value. We use a variety of methodologies to determine the fair value of these assets, including discounted cash flow models,which are consistent with the assumptions we believe hypothetical marketplace participants would use.
We test intangible assets determined to have indefinite useful lives, including trademarks, franchise rights and goodwill, forimpairment annually, or more frequently if events or circumstances indicate that assets might be impaired. Our Companyperforms these annual impairment reviews as of the first day of our third fiscal quarter. We use a variety of methodologies inconducting impairment assessments of indefinite-lived intangible assets, including, but not limited to, discounted cash flow models,which are based on the assumptions we believe hypothetical marketplace participants would use. For indefinite-lived intangibleassets, other than goodwill, if the carrying amount exceeds the fair value, an impairment charge is recognized in an amount equalto that excess.
The Company has the option to perform a qualitative assessment of indefinite-lived intangible assets, other than goodwill, prior tocompleting the impairment test described above. The Company must assess whether it is more likely than not that the fair valueof the intangible asset is less than its carrying amount. If the Company concludes that this is the case, it must perform the testingdescribed above. Otherwise, the Company does not need to perform any further assessment. During 2012, the Company onlyperformed qualitative assessments on less than 10 percent of our indefinite-lived intangible assets balance.
39
We perform impairment tests of goodwill at our reporting unit level, which is one level below our operating segments. Ouroperating segments are primarily based on geographic responsibility, which is consistent with the way management runs ourbusiness. Our operating segments are subdivided into smaller geographic regions or territories that we sometimes refer to as‘‘business units.’’ These business units are also our reporting units. The Bottling Investments operating segment includes allCompany-owned or consolidated bottling operations, regardless of geographic location, except for bottling operations managed byCCR, which are included in our North America operating segment. Generally, each Company-owned or consolidated bottlingoperation within our Bottling Investments operating segment is its own reporting unit. Goodwill is assigned to the reporting unitor units that benefit from the synergies arising from each business combination.
The goodwill impairment test consists of a two-step process, if necessary. The first step is to compare the fair value of a reportingunit to its carrying value, including goodwill. We typically use discounted cash flow models to determine the fair value of areporting unit. The assumptions used in these models are consistent with those we believe hypothetical marketplace participantswould use. If the fair value of the reporting unit is less than its carrying value, the second step of the impairment test must beperformed in order to determine the amount of impairment loss, if any. The second step compares the implied fair value of thereporting unit’s goodwill with the carrying amount of that goodwill. If the carrying amount of the reporting unit’s goodwill exceedsits implied fair value, an impairment charge is recognized in an amount equal to that excess. The loss recognized cannot exceedthe carrying amount of goodwill.
The Company has the option to perform a qualitative assessment of goodwill prior to completing the two-step process describedabove to determine whether it is more likely than not that the fair value of a reporting unit is less than its carrying amount,including goodwill and other intangible assets. If the Company concludes that this is the case, it must perform the two-stepprocess. Otherwise, the Company will forego the two-step process and does not need to perform any further testing. During 2012,the Company only performed qualitative assessments on less than 10 percent of our consolidated goodwill balance.
Intangible assets acquired in recent transactions are naturally more susceptible to impairment, primarily due to the fact that theyare recorded at fair value based on recent operating plans and macroeconomic conditions present at the time of acquisition.Consequently, if operating results and/or macroeconomic conditions deteriorate shortly after an acquisition, it could result in theimpairment of the acquired assets. A deterioration of macroeconomic conditions may not only negatively impact the estimatedoperating cash flows used in our cash flow models, but may also negatively impact other assumptions used in our analyses,including, but not limited to, the estimated cost of capital and/or discount rates. Additionally, as discussed above, in accordancewith accounting principles generally accepted in the United States, we are required to ensure that assumptions used to determinefair value in our analyses are consistent with the assumptions a hypothetical marketplace participant would use. As a result, thecost of capital and/or discount rates used in our analyses may increase or decrease based on market conditions and trends,regardless of whether our Company’s actual cost of capital has changed. Therefore, if the cost of capital and/or discount rateschange, our Company may recognize an impairment of an intangible asset in spite of realizing actual cash flows that areapproximately equal to, or greater than, our previously forecasted amounts.
As of our most recent annual impairment review, the Company had no significant impairments of its intangible assets, individuallyor in the aggregate. In addition, as of December 31, 2012, we did not have any reporting unit with a material amount of goodwillfor which it is reasonably likely that it will fail step one of a goodwill impairment test in the near term. However, ifmacroeconomic conditions worsen, it is possible that we may experience significant impairments of some of our intangible assets,which would require us to recognize impairment charges. Management will continue to monitor the fair value of our intangibleassets in future periods.
We acquired CCE’s former North America business on October 2, 2010, which resulted in the Company recording $14,327 millionof intangible assets, including goodwill. Refer to Note 2 of Notes to Consolidated Financial Statements. The acquired intangibleassets included $5,850 million of bottler franchise rights, which consisted of $5,200 million of franchise rights with indefinite livesand $650 million of franchise rights with definite lives. The franchise rights with indefinite lives represent franchise rights that hadpreviously provided CCE with exclusive and perpetual rights to manufacture and/or distribute certain beverages in specifiedterritories. The franchise rights with definite lives relate to franchise rights that had previously provided CCE with exclusive rightsto manufacture and/or distribute certain beverages in specified territories for a finite period of time and, therefore, have beenclassified as definite-lived intangible assets.
The Company recorded $8,050 million of goodwill in connection with this acquisition that was assigned to the North Americaoperating segment, of which $170 million has been, and will continue to be, amortized for tax purposes. This goodwill is primarilyrelated to synergistic value created from having a unified operating system that will strategically position us to better market anddistribute our nonalcoholic beverage brands in North America. It also includes certain other intangible assets that do not qualifyfor separate recognition, such as an assembled workforce.
40
Pension Plan Valuations
Our Company sponsors and/or contributes to pension and postretirement health care and life insurance benefit plans coveringsubstantially all U.S. employees. We also sponsor nonqualified, unfunded defined benefit pension plans for certain associates andparticipate in multi-employer pension plans in the United States. In addition, our Company and its subsidiaries have variouspension plans and other forms of postretirement arrangements outside the United States.
Management is required to make certain critical estimates related to actuarial assumptions used to determine our pension expenseand related obligation. We believe the most critical assumptions are related to (1) the discount rate used to determine the presentvalue of the liabilities and (2) the expected long-term rate of return on plan assets. All of our actuarial assumptions are reviewedannually. Changes in these assumptions could have a material impact on the measurement of our pension expense and relatedobligation.
At each measurement date, we determine the discount rate by reference to rates of high-quality, long-term corporate bonds thatmature in a pattern similar to the future payments we anticipate making under the plans. As of December 31, 2012 and 2011, theweighted-average discount rate used to compute our benefit obligation was 4.00 percent and 4.75 percent, respectively.
The expected long-term rate of return on plan assets is based upon the long-term outlook of our investment strategy as well asour historical returns and volatilities for each asset class. We also review current levels of interest rates and inflation to assess thereasonableness of our long-term rates. Our pension plan investment objective is to ensure all of our plans have sufficient funds tomeet their benefit obligations when they become due. As a result, the Company periodically revises asset allocations, whereappropriate, to improve returns and manage risk. The weighted-average expected long-term rate of return used to calculate ournet periodic benefit cost was 8.25 percent in 2012 and 2011.
In 2012, the Company’s total pension expense related to defined benefit plans was $251 million. In 2013, we expect our totalpension expense to be approximately $191 million. The anticipated decrease is primarily due to approximately $640 million ofcontributions the Company expects to make to various plans in 2013 as well as the impact of favorable returns on plan assets in2012. The favorable impact of these items will be partially offset by the unfavorable impact of a decrease in the weighted-averagediscount rate used to calculate the Company’s benefit obligation. The estimated impact of an additional 50-basis-point decrease inthe discount rate on our 2013 pension expense is an increase to our pension expense of approximately $47 million. Additionally,the estimated impact of a 50-basis-point decrease in the expected long-term rate of return on plan assets on our 2013 pensionexpense is an increase to our pension expense of approximately $29 million.
The sensitivity information provided above is based only on changes to the actuarial assumptions used for our U.S. pension plans.As of December 31, 2012, the Company’s primary U.S. plan represented 59 percent and 64 percent of the Company’s consolidatedprojected pension benefit obligation and pension assets, respectively. Refer to Note 13 of Notes to Consolidated FinancialStatements for additional information about our pension plans and related actuarial assumptions.
Revenue Recognition
We recognize revenue when persuasive evidence of an arrangement exists, delivery of products has occurred, the sales price isfixed or determinable, and collectibility is reasonably assured. For our Company, this generally means that we recognize revenuewhen title to our products is transferred to our bottling partners, resellers or other customers. Title usually transfers uponshipment to or receipt at our customers’ locations, as determined by the specific sales terms of each transaction. Our sales termsdo not allow for a right of return except for matters related to any manufacturing defects on our part.
Our customers can earn certain incentives which are included in deductions from revenue, a component of net operating revenuesin our consolidated statements of income. These incentives include, but are not limited to, cash discounts, funds for promotionaland marketing activities, volume-based incentive programs and support for infrastructure programs. Refer to Note 1 of Notes toConsolidated Financial Statements. The aggregate deductions from revenue recorded by the Company in relation to theseprograms, including amortization expense on infrastructure programs, were $6.1 billion, $5.8 billion and $5.0 billion in 2012, 2011and 2010, respectively. In preparing the financial statements, management must make estimates related to the contractual terms,customer performance and sales volume to determine the total amounts recorded as deductions from revenue. Management alsoconsiders past results in making such estimates. The actual amounts ultimately paid may be different from our estimates. Suchdifferences are recorded once they have been determined and have historically not been significant.
41

Income Taxes
Our annual tax rate is based on our income, statutory tax rates and tax planning opportunities available to us in the variousjurisdictions in which we operate. Significant judgment is required in determining our annual tax expense and in evaluating our taxpositions. We establish reserves to remove some or all of the tax benefit of any of our tax positions at the time we determine thatthe positions become uncertain based upon one of the following: (1) the tax position is not ‘‘more likely than not’’ to be sustained,(2) the tax position is ‘‘more likely than not’’ to be sustained, but for a lesser amount, or (3) the tax position is ‘‘more likely thannot’’ to be sustained, but not in the financial period in which the tax position was originally taken. For purposes of evaluatingwhether or not a tax position is uncertain, (1) we presume the tax position will be examined by the relevant taxing authority thathas full knowledge of all relevant information, (2) the technical merits of a tax position are derived from authorities such aslegislation and statutes, legislative intent, regulations, rulings and case law and their applicability to the facts and circumstances ofthe tax position, and (3) each tax position is evaluated without considerations of the possibility of offset or aggregation with othertax positions taken. We adjust these reserves, including any impact on the related interest and penalties, in light of changing factsand circumstances, such as the progress of a tax audit. Refer to the heading ‘‘Operations Review — Income Taxes’’ below andNote 14 of Notes to Consolidated Financial Statements.
A number of years may elapse before a particular matter for which we have established a reserve is audited and finally resolved.The number of years with open tax audits varies depending on the tax jurisdiction. The tax benefit that has been previouslyreserved because of a failure to meet the ‘‘more likely than not’’ recognition threshold would be recognized in our income taxexpense in the first interim period when the uncertainty disappears under any one of the following conditions: (1) the tax positionis ‘‘more likely than not’’ to be sustained, (2) the tax position, amount, and/or timing is ultimately settled through negotiation orlitigation, or (3) the statute of limitations for the tax position has expired. Settlement of any particular issue would usually requirethe use of cash.
Tax law requires items to be included in the tax return at different times than when these items are reflected in the consolidatedfinancial statements. As a result, the annual tax rate reflected in our consolidated financial statements is different from thatreported in our tax return (our cash tax rate). Some of these differences are permanent, such as expenses that are not deductiblein our tax return, and some differences reverse over time, such as depreciation expense. These timing differences create deferredtax assets and liabilities. Deferred tax assets and liabilities are determined based on temporary differences between the financialreporting and tax bases of assets and liabilities. The tax rates used to determine deferred tax assets or liabilities are the enactedtax rates in effect for the year and manner in which the differences are expected to reverse. Based on the evaluation of allavailable information, the Company recognizes future tax benefits, such as net operating loss carryforwards, to the extent thatrealizing these benefits is considered more likely than not.
We evaluate our ability to realize the tax benefits associated with deferred tax assets by analyzing our forecasted taxable incomeusing both historical and projected future operating results; the reversal of existing taxable temporary differences; taxable incomein prior carryback years (if permitted); and the availability of tax planning strategies. A valuation allowance is required to beestablished unless management determines that it is more likely than not that the Company will ultimately realize the tax benefitassociated with a deferred tax asset. As of December 31, 2012, the Company’s valuation allowances on deferred tax assets were$487 million and primarily related to uncertainties regarding the future realization of recorded tax benefits on tax losscarryforwards generated in various jurisdictions. Current evidence does not suggest we will realize sufficient taxable income of theappropriate character within the carryforward period to allow us to realize these deferred tax benefits. If we were to identify andimplement tax planning strategies to recover these deferred tax assets or generate sufficient income of the appropriate characterin these jurisdictions in the future, it could lead to the reversal of these valuation allowances and a reduction of income taxexpense. The Company believes it will generate sufficient future taxable income to realize the tax benefits related to the remainingnet deferred tax assets in our consolidated balance sheets.
The Company does not record a U.S. deferred tax liability for the excess of the book basis over the tax basis of its investments inforeign corporations to the extent that the basis difference results from earnings that meet the indefinite reversal criteria. Thesecriteria are met if the foreign subsidiary has invested, or will invest, the undistributed earnings indefinitely. The decision as to theamount of undistributed earnings that the Company intends to maintain in non-U.S. subsidiaries takes into account itemsincluding, but not limited to, forecasts and budgets of financial needs of cash for working capital, liquidity plans, capitalimprovement programs, merger and acquisition plans, and planned loans to other non-U.S. subsidiaries. The Company alsoevaluates its expected cash requirements in the United States. Other factors that can influence that determination are localrestrictions on remittances (for example, in some countries a central bank application and approval are required in order for theCompany’s local country subsidiary to pay a dividend), economic stability and asset risk. As of December 31, 2012, undistributedearnings of the Company’s foreign subsidiaries that met the indefinite reversal criteria amounted to $26.9 billion. Refer to Note 14of Notes to Consolidated Financial Statements.
42

The Company’s effective tax rate is expected to be approximately 24.0 percent in 2013. This estimated tax rate does not reflect theimpact of any unusual or special items that may affect our tax rate in 2013.
Recent Accounting Standards and Pronouncements
Refer to Note 1 of Notes to Consolidated Financial Statements for a discussion of recent accounting standards andpronouncements.
Operations Review
Our organizational structure as of December 31, 2012, consisted of the following operating segments, the first six of which aresometimes referred to as ‘‘operating groups’’ or ‘‘groups’’: Eurasia and Africa; Europe; Latin America; North America; Pacific;Bottling Investments; and Corporate. For further information regarding our operating segments, refer to Note 19 of Notes toConsolidated Financial Statements.
Structural Changes, Acquired Brands and New License Agreements
In order to continually improve upon the Company’s operating performance, from time to time, we engage in buying and sellingownership interests in bottling partners and other manufacturing operations. In addition, we also acquire brands or enter intolicense agreements for certain brands to supplement our beverage offerings. These items impact our operating results and certainkey metrics used by management in assessing the Company’s performance.
Unit case volume growth is a key metric used by management to evaluate the Company’s performance because it measuresdemand for our products at the consumer level. The Company’s unit case volume represents the number of unit cases (or unitcase equivalents) of Company beverage products directly or indirectly sold by the Company and its bottling partners to customersand, therefore, reflects unit case volume for consolidated and unconsolidated bottlers. Refer to the heading ‘‘Beverage Volume’’below.
Concentrate sales volume represents the amount of concentrates and syrups (in all cases expressed in equivalent unit cases) soldby, or used in finished products sold by, the Company to its bottling partners or other customers. Refer to the heading ‘‘BeverageVolume’’ below.
Our Bottling Investments operating segment and our other finished product operations, including the finished product operationsin our North America operating segment, typically generate net operating revenues by selling sparkling beverages and a variety ofstill beverages, such as juices and juice drinks, energy and sports drinks, ready-to-drink teas and coffees, and certain waterproducts, to retailers or to distributors, wholesalers and bottling partners who distribute them to retailers. In addition, in theUnited States, we manufacture fountain syrups and sell them to fountain retailers such as restaurants and convenience stores whouse the fountain syrups to produce beverages for immediate consumption, or to authorized fountain wholesalers or bottlingpartners who resell the fountain syrups to fountain retailers. For these consolidated finished product operations, we recognize theassociated concentrate sales volume at the time the unit case or unit case equivalent is sold to the customer. Our concentrateoperations typically generate net operating revenues by selling concentrates and syrups to authorized bottling and canningoperations. For these concentrate operations, we recognize concentrate revenue and concentrate sales volume when we sellconcentrate to the authorized unconsolidated bottling and canning operations, and we typically report unit case volume whenfinished products manufactured from the concentrates and syrups are sold to the customer. When we analyze our net operatingrevenues we generally consider the following four factors: (1) volume growth (unit case volume or concentrate sales volume, asappropriate), (2) structural changes, (3) changes in price, product and geographic mix and (4) foreign currency fluctuations. Referto the heading ‘‘Net Operating Revenues’’ below.
‘‘Structural changes’’ generally refers to acquisitions or dispositions of bottling, distribution or canning operations andconsolidation or deconsolidation of bottling and distribution entities for accounting purposes. Typically, structural changes do notimpact the Company’s unit case volume on a consolidated basis or at the geographic operating segment level. We recognize unitcase volume for all sales of Company beverage products regardless of our ownership interest in the bottling partner, if any.However, the unit case volume reported by our Bottling Investments operating segment is generally impacted by structuralchanges because it only includes the unit case volume of our consolidated bottling operations.
The Company acquired Great Plains Coca-Cola Bottling Company (‘‘Great Plains’’) in December 2011, bottling operations inVietnam and Cambodia in February 2012, and bottling operations in Guatemala in June 2012. Accordingly, the impact to netoperating revenues related to these acquisitions was included as a structural change in our analysis of changes to net operatingrevenues. Refer to the heading ‘‘Net Operating Revenues’’ below.
43

In January 2012, the Company announced that BPW, our joint venture with Nestle in the ready-to-drink tea category, will focus itsgeographic scope primarily on Europe and Canada. The joint venture was phased out in all other territories by the end of 2012,and the Company’s agreement to distribute products in the United States under a sublicense from a subsidiary of Nestleterminated at the end of 2012. The impact to net operating revenues for North America related to the termination of our licenseagreement has been included as a structural change in our analysis of changes to net operating revenues. In addition, we haveeliminated the BPW and Nestle licensed unit case volume and associated concentrate sales for the year ended December 31, 2012,in those countries impacted by these structural changes. We have also eliminated the BPW and Nestle licensed unit case volumeand associated concentrate sales from the base year, where applicable, when calculating 2012 versus 2011 volume growth rates.Refer to the headings ‘‘Beverage Volume’’ and ‘‘Net Operating Revenues’’ below.
The Company sells concentrates and syrups to both consolidated and unconsolidated bottling partners. The ownership structure ofour bottling partners impacts the timing of recognizing concentrate revenue and concentrate sales volume. When we sellconcentrates or syrups to our consolidated bottling partners, we are not able to recognize the concentrate revenue or concentratesales volume until the bottling partner has sold finished products manufactured from the concentrates or syrups to a customer.When we sell concentrates or syrups to our unconsolidated bottling partners, we recognize the concentrate revenue andconcentrate sales volume when the concentrates or syrups are sold to the bottling partner. The subsequent sale of the finishedproducts manufactured from the concentrates or syrups to a customer does not impact the timing of recognizing the concentraterevenue or concentrate sales volume.
‘‘Acquired brands’’ refers to brands acquired during the past 12 months. Typically, the Company has not reported unit case volumeor recognized concentrate sales volume related to acquired brands in periods prior to the closing of the transaction. Therefore,the unit case volume and concentrate sales volume from the sale of these brands is incremental to prior year volume. We do notgenerally consider acquired brands to be structural changes.
In 2012, the Company invested in the existing beverage business of Aujan, one of the largest independent beverage companies inthe Middle East. Under our definitive agreement with Aujan, the Company now owns 50 percent of the Aujan entity that holdsthe rights to Aujan-owned brands in certain territories and 49 percent of Aujan’s bottling and distribution operations in certainterritories. Accordingly, the volume associated with the Aujan transaction, subsequent to our initial equity investment during thesecond quarter of 2012, is considered to be from acquired brands. Refer to the heading ‘‘Beverage Volume’’ below.
‘‘License agreements’’ refers to brands not owned by the Company, but for which we hold certain rights, generally including, butnot limited to, distribution rights, and from which we derive an economic benefit when these brands are ultimately sold. Typically,the Company has not reported unit case volume or recognized concentrate sales volume related to these brands in periods priorto the beginning of the term of the license agreement. Therefore, the unit case volume and concentrate sales volume from thesale of these brands is incremental to prior year volume. We do not generally consider new license agreements to be structuralchanges.
On October 2, 2010, in legally separate transactions, we acquired CCE’s former North America business and entered into alicense agreement with DPS. We also sold all of our ownership interests in our Norwegian and Swedish bottling operations to NewCCE. Although each of these items does not have an impact on the comparability of the Company’s 2012 and 2011 consolidatedfinancial statements, the sections below are intended to provide an overview of the impact these items had on the comparability ofour 2011 and 2010 consolidated financial statements.
Acquisition of CCE’s Former North America Business and the DPS License Agreements
Immediately prior to our acquisition of CCE’s former North America business on October 2, 2010, the Company owned33 percent of CCE’s outstanding common stock. This ownership represented our indirect ownership interest in both CCE’s formerNorth America business and its European operations. On October 2, 2010, the Company acquired the remaining 67 percent ofCCE’s former North America business not already owned by the Company for consideration that included the Company’s indirectownership interest in CCE’s European operations. As a result of this transaction, the Company now owns 100 percent of CCE’sformer North America business and does not own any interest in New CCE’s European operations. The operating results ofCCE’s former North America business were included in our consolidated financial statements starting October 2, 2010. Theoperating results of New CCE do not directly impact the Company’s consolidated financial statements, since we have noownership interest in this entity. Refer to the heading ‘‘Our Business — General’’ above and Note 2 of Notes to ConsolidatedFinancial Statements for additional details related to the acquisition.
On October 2, 2010, the Company also entered into an agreement with DPS to distribute certain DPS brands in territories wherethese brands were distributed by CCE prior to our acquisition of CCE’s former North America business. The license agreementsreplaced agreements between DPS and CCE existing immediately prior to the acquisition. Refer to the heading ‘‘Our Business —General’’ above and Note 2 of Notes to Consolidated Financial Statements for additional details related to these new licenseagreements.
44

Prior to the acquisition and entering into the DPS license agreements, the Company’s North America operating segment waspredominantly a concentrate operation. As a result of the acquisition and the DPS license agreements, the North Americaoperating segment is now predominantly a finished product operation. Generally, finished product operations produce higher netoperating revenues but lower gross profit margins and operating margins compared to concentrate operations. Refer to ‘‘Item 1.Business — Products and Brands’’ for additional discussion of the differences between the Company’s concentrate operations andour finished product operations. These transactions resulted in higher net operating revenues but lower gross profit margins andoperating margins for the North America operating segment and our consolidated operating results.
Prior to the acquisition, the Company reported unit case volume for the sale of Company beverage products sold by CCE. Afterthe transaction closing, we report unit case volume of Company beverage products just as we had prior to the transaction.
Prior to the acquisition, the Company recognized concentrate sales volume at the time we sold the concentrate to CCE. Upon theclosing of the transaction, we do not recognize the concentrate sales volume until CCR has sold finished products manufacturedfrom concentrate to a customer.
The DPS license agreements impact both the Company’s unit case and concentrate sales volumes. Sales made pursuant to theselicense agreements represent acquired volume and are incremental unit case volume and concentrate sales volume to theCompany only during the 12-month period following the acquisition. Prior to entering into the license agreements, the Companydid not include the DPS brands as unit case volume or concentrate sales volume, as these brands were not Company beverageproducts. Refer to the heading ‘‘Unit Case Volume’’ below for additional information.
Prior to the acquisition, we recognized the revenues and profits associated with concentrate sales when the concentrate was soldto CCE, excluding the portion that was deemed to be intercompany due to our previous ownership interest in CCE. However,subsequent to the acquisition, the Company does not recognize the revenues and profits associated with concentrate sold to CCE’sformer North America business until the finished products manufactured from those concentrates are sold. For example, in 2010,most of our pre-Easter concentrate sales to CCE impacted our first quarter operating results. In 2011, our Easter-related finishedproduct sales had a greater impact on our second quarter operating results. As a result of this transaction, the Company does nothave an indirect ownership interest in New CCE’s European operations. Therefore, we are no longer required to defer theportion of revenues and profits associated with concentrate sales to New CCE.
The acquisition of CCE’s former North America business has resulted in a significant adjustment to our overall cost structure,especially in North America. The following inputs represent a substantial portion of the Company’s total cost of goods sold:(1) sweeteners, (2) metals, (3) juices and (4) polyethylene terephthalate (‘‘PET’’). The majority of these costs are included withinour North America and Bottling Investments operating segments. The Company increased our hedging activities related to certaincommodities in order to mitigate a portion of the price risk associated with forecasted purchases. Many of the derivative financialinstruments used by the Company to mitigate the risk associated with these commodity exposures do not qualify for hedgeaccounting. As a result, the changes in fair value of these derivative instruments have been, and will continue to be, included as acomponent of net income in each reporting period. Refer to the heading ‘‘Gross Profit Margin’’ below and Note 5 of Notes toConsolidated Financial Statements for additional information regarding our commodity hedging activity.
In 2010, the gross profit for our North America operating segment was negatively impacted by $235 million, primarily due to theelimination of gross profit in inventory on intercompany sales and an inventory fair value adjustment as a result of the acquisition.Refer to the headings ‘‘Gross Profit Margin’’ and ‘‘Operating Income and Operating Margin’’ below.
The acquisition of CCE’s former North America business increased the Company’s selling, general and administrative expenses,primarily due to delivery-related expenses. Selling, general and administrative expenses are typically higher, as a percentage of netoperating revenues, for finished product operations compared to concentrate operations. Selling, general and administrativeexpenses were also negatively impacted by the amortization of definite-lived intangible assets acquired in the acquisition. TheCompany recorded $650 million of definite-lived acquired franchise rights that are being amortized over a weighted-average life ofapproximately eight years from the date of acquisition, which is equal to the weighted-average remaining contractual term of theacquired franchise rights. In addition, the Company recorded $380 million of customer rights that are being amortized over20 years. We estimate the amortization expense related to these definite-lived intangible assets to be approximately $100 millionper year for the next several years, which will be recorded in selling, general and administrative expenses.
In connection with the Company’s acquisition of CCE’s former North America business, we assumed $7,602 million of long-termdebt, which had an estimated fair value of $9,345 million as of the acquisition date. In accordance with accounting principlesgenerally accepted in the United States, we recorded the assumed debt at its fair value as of the acquisition date. Refer to theheading ‘‘Liquidity, Capital Resources and Financial Position — Cash Flows from Financing Activities — Debt Financing’’ belowand Note 2 of Notes to Consolidated Financial Statements.
45

In 2010, the Company recognized a gain of $4,978 million due to the remeasurement of our equity interest in CCE to fair valueupon the close of the transaction. This gain was classified in the line item other income (loss) — net in our consolidatedstatement of income.
Prior to the closing of this acquisition, we had accounted for our investment in CCE under the equity method of accounting.Under the equity method of accounting, we recorded our proportionate share of CCE’s net income or loss in the line item equityincome (loss) — net in our consolidated statements of income. However, as a result of this transaction, beginning October 2,2010, the Company no longer records equity income or loss related to CCE, and therefore, this transaction negatively impactedthe amount of equity income the Company recorded during both 2011 and 2010. Refer to the heading ‘‘Equity Income (Loss) —Net’’ below.
Divestiture of Norwegian and Swedish Bottling Operations
The divestiture of our Norwegian and Swedish bottling operations had no impact on our consolidated unit case volume andconsolidated concentrate sales volume, for the same reasons discussed above in relation to our acquisition of CCE’s former NorthAmerica business. The divestiture of these bottling operations reduced unit case volume for the Bottling Investments operatingsegment. In addition, the divestiture reduced net operating revenues and net income for our consolidated operating results andthe Bottling Investments operating segment. However, since we divested a finished product business, it had a positive impact onour gross profit margins and operating margins. Furthermore, the impact these divestitures had on the Company’s net operatingrevenues was partially offset by the concentrate revenues that were recognized on sales to these bottling operations. Theseconcentrate sales had previously been eliminated because they were intercompany transactions. The net impact to net operatingrevenues was included as a structural change in our analysis of changes to net operating revenues. Refer to the heading ‘‘NetOperating Revenues’’ below.
This divestiture resulted in a gain of $597 million in 2010, which was classified in the line item other income (loss) — net in ourconsolidated statement of income. In 2011, the Company recorded charges of $5 million related to the finalization of workingcapital adjustments in connection with the divestiture of our Norwegian and Swedish bottling operations. These charges reducedthe transaction gain the Company previously reported in 2010.
Beverage Volume
We measure the volume of Company beverage products sold in two ways: (1) unit cases of finished products and (2) concentratesales. As used in this report, ‘‘unit case’’ means a unit of measurement equal to 192 U.S. fluid ounces of finished beverage(24 eight-ounce servings); and ‘‘unit case volume’’ means the number of unit cases (or unit case equivalents) of Company beverageproducts directly or indirectly sold by the Company and its bottling partners to customers. Unit case volume primarily consists ofbeverage products bearing Company trademarks. Also included in unit case volume are certain products licensed to, or distributedby, our Company, and brands owned by Coca-Cola system bottlers for which our Company provides marketing support and fromthe sale of which we derive economic benefit. In addition, unit case volume includes sales by joint ventures in which the Companyhas an equity interest. We believe unit case volume is one of the measures of the underlying strength of the Coca-Cola systembecause it measures trends at the consumer level. The unit case volume numbers used in this report are derived based onestimates received by the Company from its bottling partners and distributors. Concentrate sales volume represents the amount ofconcentrates and syrups (in all cases expressed in equivalent unit cases) sold by, or used in finished beverages sold by, theCompany to its bottling partners or other customers. Unit case volume and concentrate sales volume growth rates are notnecessarily equal during any given period. Factors such as seasonality, bottlers’ inventory practices, supply point changes, timing ofprice increases, new product introductions and changes in product mix can impact unit case volume and concentrate sales volumeand can create differences between unit case volume and concentrate sales volume growth rates. In addition to the itemsmentioned above, the impact of unit case volume from certain joint ventures, in which the Company has an equity interest, but towhich the Company does not sell concentrates or syrups, may give rise to differences between unit case volume and concentratesales volume growth rates.
46
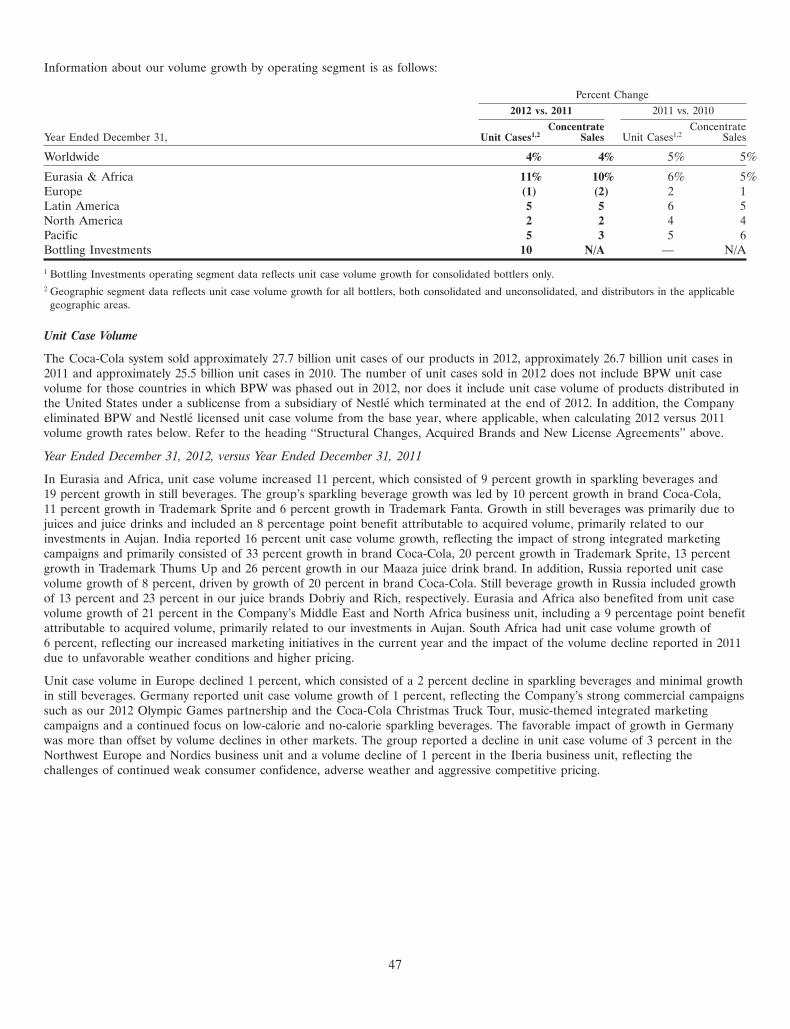
Information about our volume growth by operating segment is as follows:
Percent Change2012 vs. 2011 2011 vs. 2010
Concentrate ConcentrateYear Ended December 31, Unit Cases1,2 Sales Unit Cases1,2 Sales
Worldwide 4% 4% 5% 5%
Eurasia & Africa 11% 10% 6% 5%Europe (1) (2) 2 1Latin America 5 5 6 5North America 2 2 4 4Pacific 5 3 5 6Bottling Investments 10 N/A — N/A
1 Bottling Investments operating segment data reflects unit case volume growth for consolidated bottlers only.2 Geographic segment data reflects unit case volume growth for all bottlers, both consolidated and unconsolidated, and distributors in the applicable
geographic areas.
Unit Case Volume
The Coca-Cola system sold approximately 27.7 billion unit cases of our products in 2012, approximately 26.7 billion unit cases in2011 and approximately 25.5 billion unit cases in 2010. The number of unit cases sold in 2012 does not include BPW unit casevolume for those countries in which BPW was phased out in 2012, nor does it include unit case volume of products distributed inthe United States under a sublicense from a subsidiary of Nestle which terminated at the end of 2012. In addition, the Companyeliminated BPW and Nestle licensed unit case volume from the base year, where applicable, when calculating 2012 versus 2011volume growth rates below. Refer to the heading ‘‘Structural Changes, Acquired Brands and New License Agreements’’ above.
Year Ended December 31, 2012, versus Year Ended December 31, 2011
In Eurasia and Africa, unit case volume increased 11 percent, which consisted of 9 percent growth in sparkling beverages and19 percent growth in still beverages. The group’s sparkling beverage growth was led by 10 percent growth in brand Coca-Cola,11 percent growth in Trademark Sprite and 6 percent growth in Trademark Fanta. Growth in still beverages was primarily due tojuices and juice drinks and included an 8 percentage point benefit attributable to acquired volume, primarily related to ourinvestments in Aujan. India reported 16 percent unit case volume growth, reflecting the impact of strong integrated marketingcampaigns and primarily consisted of 33 percent growth in brand Coca-Cola, 20 percent growth in Trademark Sprite, 13 percentgrowth in Trademark Thums Up and 26 percent growth in our Maaza juice drink brand. In addition, Russia reported unit casevolume growth of 8 percent, driven by growth of 20 percent in brand Coca-Cola. Still beverage growth in Russia included growthof 13 percent and 23 percent in our juice brands Dobriy and Rich, respectively. Eurasia and Africa also benefited from unit casevolume growth of 21 percent in the Company’s Middle East and North Africa business unit, including a 9 percentage point benefitattributable to acquired volume, primarily related to our investments in Aujan. South Africa had unit case volume growth of6 percent, reflecting our increased marketing initiatives in the current year and the impact of the volume decline reported in 2011due to unfavorable weather conditions and higher pricing.
Unit case volume in Europe declined 1 percent, which consisted of a 2 percent decline in sparkling beverages and minimal growthin still beverages. Germany reported unit case volume growth of 1 percent, reflecting the Company’s strong commercial campaignssuch as our 2012 Olympic Games partnership and the Coca-Cola Christmas Truck Tour, music-themed integrated marketingcampaigns and a continued focus on low-calorie and no-calorie sparkling beverages. The favorable impact of growth in Germanywas more than offset by volume declines in other markets. The group reported a decline in unit case volume of 3 percent in theNorthwest Europe and Nordics business unit and a volume decline of 1 percent in the Iberia business unit, reflecting thechallenges of continued weak consumer confidence, adverse weather and aggressive competitive pricing.
47
In Latin America, unit case volume increased 5 percent, which consisted of 3 percent growth in sparkling beverages and12 percent growth in still beverages. The growth reported across Latin America was driven by continued investments in ourbrands, strong activation of holiday programming, and a continued focus on a differentiated occasion-based package, price andchannel strategy. The group’s growth in sparkling beverages was led by 3 percent growth in brand Coca-Cola, 6 percent growth inTrademark Fanta and 5 percent growth in Trademark Sprite. Still beverage growth in Latin America reflected 34 percent growth inready-to-drink teas as a result of the newly launched Fuze Tea, 28 percent growth in sports drinks, 9 percent growth in packagedwater and 12 percent growth in juices and juice drinks. Brazil reported unit case volume growth of 6 percent, which consisted of3 percent growth in brand Coca-Cola, 11 percent growth in Trademark Fanta and 16 percent growth in still beverages. LatinAmerica also benefited from unit case volume growth of 4 percent in Mexico and 7 percent growth in Argentina.
Unit case volume in North America increased 2 percent, led by growth of 8 percent in still beverages. Still beverage growth inNorth America included 16 percent growth in ready-to-drink teas, 12 percent growth in sports drinks, 9 percent growth inpackaged water and 2 percent growth in juices and juice drinks. The group reported 11 percent growth in Trademark Powerade,reflecting the benefit of a strong 2012 Olympic Games activation. Growth in ready-to-drink teas included the continued stronggrowth of Gold Peak, and the group’s juices and juice drinks benefited from 7 percent growth in Trademark Simply. Dasani hadunit case volume growth of 10 percent and maintained its premium pricing position, supported by our PlantBottle PET packaging.The group’s growth in still beverages was partially offset by a volume decline of 1 percent in sparkling beverages. Although overallsparkling beverage volume declined in North America, the group benefited from growth in Coca-Cola Zero and Trademark Fantaof 7 percent and 6 percent, respectively.
In Pacific, unit case volume increased 5 percent, which consisted of 4 percent growth in sparkling beverages and 8 percent growthin still beverages. The group’s volume results included 4 percent growth in China, despite the impact of an economic slowdown inthe country, extremely wet weather in July and August and the shift in timing of the 2013 Chinese New Year. Sparkling beveragegrowth in China was led by growth of 21 percent in Trademark Fanta. Still beverage growth in China was primarily due to volumegrowth in packaged water. Japan’s unit case volume increased 2 percent, which included a 3 percent increase in still beverages,partially offset by a 2 percent decline in sparkling beverages. Still beverages in Japan benefited primarily from growth in theCompany’s ready-to-drink tea and coffee categories. The Pacific group also benefited from unit case volume growth of 22 percentin Thailand, 20 percent in South Korea and 5 percent in the Philippines.
Unit case volume for Bottling Investments increased 10 percent. The group had growth in key markets where we own or otherwiseconsolidate bottling operations, including unit case volume growth of 4 percent in China, 16 percent in India, 5 percent in thePhilippines and 1 percent in Germany. The Company’s consolidated bottling operations accounted for 34 percent, 65 percent,100 percent and 100 percent of the unit case volume in China, India, the Philippines and Germany, respectively. The group’svolume growth included a benefit of 3 percentage points attributable to the acquisition of bottling operations in Vietnam,Cambodia and Guatemala during the year ended December 31, 2012.
Year Ended December 31, 2011, versus Year Ended December 31, 2010
In Eurasia and Africa, unit case volume increased 6 percent, which consisted of 5 percent growth in sparkling beverages and13 percent growth in still beverages. The group’s unit case volume growth was largely due to growth in our key markets, includingIndia and Turkey. India experienced 12 percent unit case volume growth, which consisted of 12 percent growth in sparklingbeverages and 11 percent growth in still beverages. India’s growth in sparkling beverages was primarily due to 17 percent growthin Trademark Sprite, 15 percent growth in Trademark Thums Up and 11 percent growth in Trademark Coca-Cola. Still beveragesin India benefited from 14 percent growth in our Kinley water brand and 11 percent growth in Maaza, a component of our juiceportfolio in India. The group also benefited from unit case volume growth of 10 percent in Turkey, which included strong growthin brand Coca-Cola. Unit case volume grew 5 percent in Russia, primarily due to our acquisition of OAO Nidan Juices (‘‘Nidan’’)in the third quarter of 2010. Excluding the impact of the acquired Nidan juice, Russia’s overall unit case volume declined2 percent in 2011. Eurasia and Africa also benefited from unit case volume growth of 8 percent in the Company’s Middle Eastand North Africa business unit despite ongoing geopolitical challenges in the region. The group’s unit case volume growth in themarkets described above was partially offset by a 2 percent unit case volume decline in South Africa. This decline was primarilydue to the impact of unfavorable weather conditions during our peak summer selling season as well as higher pricing in themarketplace.
48

Unit case volume in Europe increased 2 percent, despite an unseasonably cold and rainy summer selling season and moderateconsumer confidence. The Company achieved these results by strategically tailoring our price and package offerings to meet theneeds of each market with consideration for the current economic environment. The group benefited from the Company’ssuccessful launch of our 125th anniversary marketing campaign as well as other integrated marketing campaigns. The group had2 percent growth in sparkling beverages, including 3 percent growth in Trademark Coca-Cola and growth of 14 percent inCoca-Cola Zero. Unit case volume for still beverages increased 2 percent, led by growth in energy drinks and tea. Germany’s unitcase volume increased 6 percent, primarily attributable to 6 percent growth in Trademark Coca-Cola and 13 percent growth inTrademark Fanta. Our German business continued to benefit from the Company’s bottler restructuring efforts and our effectivemarketing campaigns. In addition, France and Great Britain had growth of 5 percent and 4 percent, respectively, each led bygrowth in Trademark Coca-Cola.
In Latin America, unit case volume increased 6 percent, which consisted of 4 percent growth in sparkling beverages and15 percent growth in still beverages. The group’s sparkling beverage unit case volume growth was led by 4 percent growth inbrand Coca-Cola. Still beverages benefited from the successful performance of Del Valle as well as strong growth in other stillbeverages, including water and tea. Mexico had unit case volume growth of 9 percent, led by 7 percent growth in sparklingbeverages, which included 7 percent growth in Trademark Coca-Cola. In addition, Argentina had 10 percent growth in TrademarkCoca-Cola which contributed to its overall unit case volume growth of 10 percent. Argentina’s unit case volume growth benefitedfrom strong integrated marketing campaigns, including sponsorship of the Copa America soccer tournament in July. Brazil’s unitcase volume increased 1 percent despite a general slowdown in the country’s economy. The group’s unit case volume growth inthe markets described above was partially offset by a 10 percent volume decline in Venezuela. The decline in Venezuela is areflection of the continued economic and political pressures affecting the country.
Unit case volume in North America increased 4 percent, including 3 percent growth attributable to the new license agreementswith DPS. The group’s unit case volume growth was driven by 3 percent growth in sparkling beverages, primarily due to the saleof Dr Pepper brands under the new license agreements. Coca-Cola Zero continued its strong performance in North America with11 percent unit case volume growth. Unit case volume for still beverages in North America increased 4 percent, including12 percent growth in Trademark Powerade, 10 percent growth in Trademark Dasani and 48 percent growth in Gold Peak. Thegrowth in still beverages in North America was partially offset by a decline of 2 percent in juice and juice drinks, a reflection ofincreased pricing to offset commodity costs. In December 2011, the Company acquired Great Plains in the United States. As aresult of this acquisition, we report volume from cross-licensed brands, primarily Dr Pepper, that were previously distributed byGreat Plains. Unit case volume for these cross-licensed brands was 12 million unit cases for full year 2011. The Company beganreporting unit case volume for these cross-licensed brands in December 2011.
In Pacific, unit case volume increased 5 percent, which consisted of 4 percent growth in sparkling beverages and 8 percent growthin still beverages. The group’s volume growth was led by 13 percent growth in China, which included 12 percent growth insparkling beverages attributable to strong growth in Trademark Sprite, Coca-Cola and Fanta. The group also benefited fromChina’s 16 percent growth in still beverages, including strong growth in Minute Maid Pulpy and other still beverages, includingwater. In Japan, unit case volume growth was even, reflecting the impact of the earthquake and tsunami that devastated thenorthern and eastern portions of the country on March 11, 2011. The group’s unit case volume growth in the markets describedabove was partially offset by a 9 percent volume decline in the Philippines.
Unit case volume for Bottling Investments was even when compared to the prior year. The group had growth in key marketswhere we own or otherwise consolidate bottling operations, including unit case volume growth of 13 percent in China, 12 percentin India and 6 percent in Germany. The Company’s consolidated bottling operations accounted for 34 percent, 66 percent and100 percent of the unit case volume in China, India and Germany, respectively. However, growth in these markets was offset bythe unfavorable impact of the Company’s sale of our Norwegian and Swedish bottling operations to New CCE during the fourthquarter of 2010 as well as a unit case volume decline of 9 percent in the Philippines where we own 100 percent of the country’sbottling operations.
Concentrate Sales Volume
In 2012, concentrate sales volume and unit case volume both grew 4 percent compared to 2011. Likewise, in 2011, concentratesales volume and unit case volume both grew 5 percent compared to 2010. The differences between concentrate sales volume andunit case volume growth rates for individual operating segments in 2012 and 2011 were primarily due to the timing of concentrateshipments and the impact of unit case volume from certain joint ventures in which the Company has an equity interest, but towhich the Company does not sell concentrates, syrups, beverage bases or powders.
49

Analysis of Consolidated Statements of Income
Percent ChangeYear Ended December 31, 2012 2011 2010 2012 vs. 2011 2011 vs. 2010(In millions except percentages and per share data) As Adjusted1,2
NET OPERATING REVENUES $ 48,017 $ 46,542 $ 35,119 3% 33%Cost of goods sold 19,053 18,215 12,693 5 44
GROSS PROFIT 28,964 28,327 22,426 2 26GROSS PROFIT MARGIN 60.3% 60.9% 63.9%Selling, general and administrative expenses 17,738 17,422 13,194 2 32Other operating charges 447 732 819 * *
OPERATING INCOME 10,779 10,173 8,413 6 21OPERATING MARGIN 22.4% 21.9% 24.0%Interest income 471 483 317 (2) 52Interest expense 397 417 733 (5) (43)Equity income (loss) — net 819 690 1,025 19 (33)Other income (loss) — net 137 529 5,185 * *
INCOME BEFORE INCOME TAXES 11,809 11,458 14,207 3 (19)Income taxes 2,723 2,812 2,370 (3) 19Effective tax rate 23.1% 24.5% 16.7%
CONSOLIDATED NET INCOME 9,086 8,646 11,837 5 (27)Less: Net income attributable to noncontrolling interests 67 62 50 8 24
NET INCOME ATTRIBUTABLE TO SHAREOWNERS OFTHE COCA-COLA COMPANY $ 9,019 $ 8,584 $ 11,787 5% (27)%
BASIC NET INCOME PER SHARE3 $ 2.00 $ 1.88 $ 2.55 6% (26)%DILUTED NET INCOME PER SHARE3 $ 1.97 $ 1.85 $ 2.53 6% (27)%
* Calculation is not meaningful.1 Effective January 1, 2012, the Company elected to change our accounting methodology for determining the market-related value of assets for our
U.S. qualified defined benefit pension plans. The Company’s change in accounting methodology has been applied retrospectively, and we haveadjusted all prior period financial information presented herein as required.
2 On July 27, 2012, the Company’s certificate of incorporation was amended to increase the number of authorized shares of common stock from5.6 billion to 11.2 billion and effect a two-for-one stock split of the common stock. The record date for the stock split was July 27, 2012, and theadditional shares were distributed on August 10, 2012. Each shareowner of record on the close of business on the record date received oneadditional share of common stock for each share held. All share and per share data presented herein reflect the impact of the increase in authorizedshares and the stock split, as appropriate.
3 Calculated based on net income attributable to shareowners of The Coca-Cola Company.
50
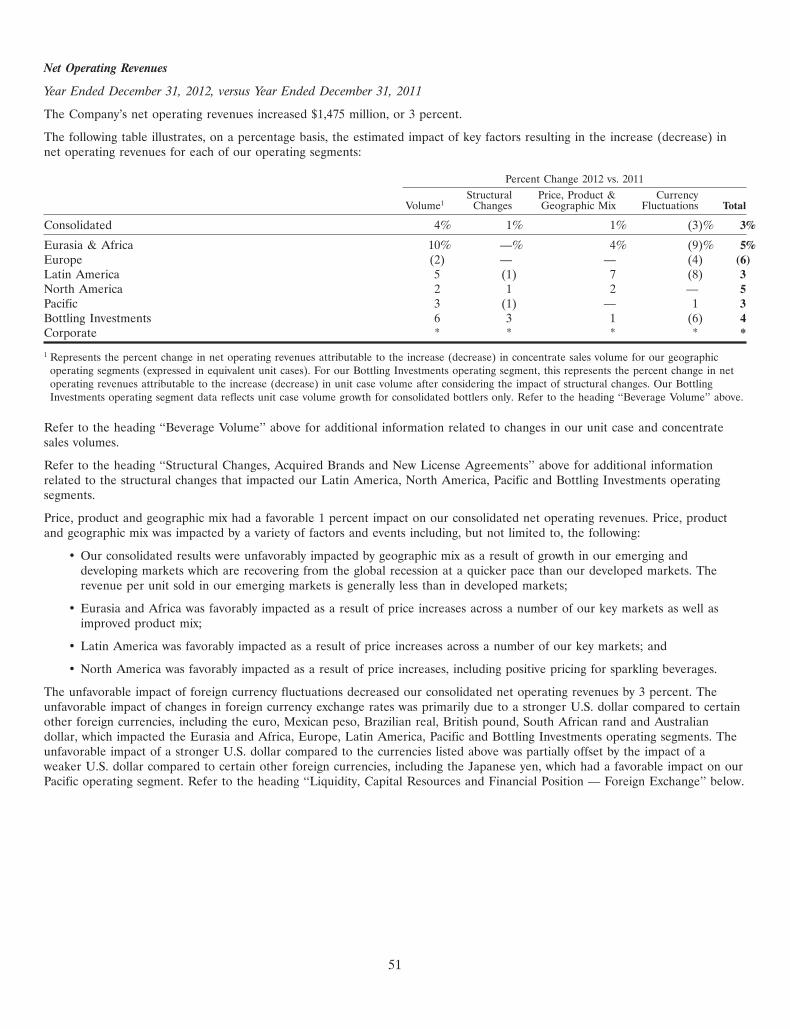
Net Operating Revenues
Year Ended December 31, 2012, versus Year Ended December 31, 2011
The Company’s net operating revenues increased $1,475 million, or 3 percent.
The following table illustrates, on a percentage basis, the estimated impact of key factors resulting in the increase (decrease) innet operating revenues for each of our operating segments:
Percent Change 2012 vs. 2011Structural Price, Product & Currency
Volume1 Changes Geographic Mix Fluctuations Total
Consolidated 4% 1% 1% (3)% 3%
Eurasia & Africa 10% —% 4% (9)% 5%Europe (2) — — (4) (6)Latin America 5 (1) 7 (8) 3North America 2 1 2 — 5Pacific 3 (1) — 1 3Bottling Investments 6 3 1 (6) 4Corporate * * * * *
1 Represents the percent change in net operating revenues attributable to the increase (decrease) in concentrate sales volume for our geographicoperating segments (expressed in equivalent unit cases). For our Bottling Investments operating segment, this represents the percent change in netoperating revenues attributable to the increase (decrease) in unit case volume after considering the impact of structural changes. Our BottlingInvestments operating segment data reflects unit case volume growth for consolidated bottlers only. Refer to the heading ‘‘Beverage Volume’’ above.
Refer to the heading ‘‘Beverage Volume’’ above for additional information related to changes in our unit case and concentratesales volumes.
Refer to the heading ‘‘Structural Changes, Acquired Brands and New License Agreements’’ above for additional informationrelated to the structural changes that impacted our Latin America, North America, Pacific and Bottling Investments operatingsegments.
Price, product and geographic mix had a favorable 1 percent impact on our consolidated net operating revenues. Price, productand geographic mix was impacted by a variety of factors and events including, but not limited to, the following:
• Our consolidated results were unfavorably impacted by geographic mix as a result of growth in our emerging anddeveloping markets which are recovering from the global recession at a quicker pace than our developed markets. Therevenue per unit sold in our emerging markets is generally less than in developed markets;
• Eurasia and Africa was favorably impacted as a result of price increases across a number of our key markets as well asimproved product mix;
• Latin America was favorably impacted as a result of price increases across a number of our key markets; and
• North America was favorably impacted as a result of price increases, including positive pricing for sparkling beverages.
The unfavorable impact of foreign currency fluctuations decreased our consolidated net operating revenues by 3 percent. Theunfavorable impact of changes in foreign currency exchange rates was primarily due to a stronger U.S. dollar compared to certainother foreign currencies, including the euro, Mexican peso, Brazilian real, British pound, South African rand and Australiandollar, which impacted the Eurasia and Africa, Europe, Latin America, Pacific and Bottling Investments operating segments. Theunfavorable impact of a stronger U.S. dollar compared to the currencies listed above was partially offset by the impact of aweaker U.S. dollar compared to certain other foreign currencies, including the Japanese yen, which had a favorable impact on ourPacific operating segment. Refer to the heading ‘‘Liquidity, Capital Resources and Financial Position — Foreign Exchange’’ below.
51
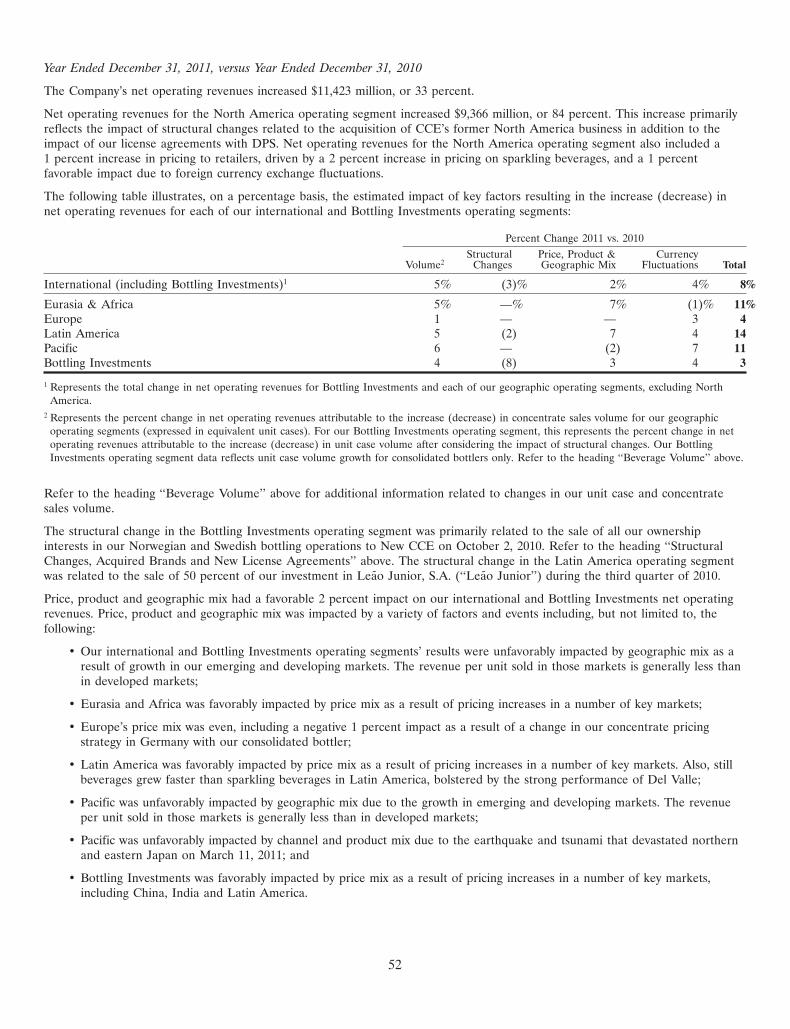
Year Ended December 31, 2011, versus Year Ended December 31, 2010
The Company’s net operating revenues increased $11,423 million, or 33 percent.
Net operating revenues for the North America operating segment increased $9,366 million, or 84 percent. This increase primarilyreflects the impact of structural changes related to the acquisition of CCE’s former North America business in addition to theimpact of our license agreements with DPS. Net operating revenues for the North America operating segment also included a1 percent increase in pricing to retailers, driven by a 2 percent increase in pricing on sparkling beverages, and a 1 percentfavorable impact due to foreign currency exchange fluctuations.
The following table illustrates, on a percentage basis, the estimated impact of key factors resulting in the increase (decrease) innet operating revenues for each of our international and Bottling Investments operating segments:
Percent Change 2011 vs. 2010Structural Price, Product & Currency
Volume2 Changes Geographic Mix Fluctuations Total
International (including Bottling Investments)1 5% (3)% 2% 4% 8%
Eurasia & Africa 5% —% 7% (1)% 11%Europe 1 — — 3 4Latin America 5 (2) 7 4 14Pacific 6 — (2) 7 11Bottling Investments 4 (8) 3 4 3
1 Represents the total change in net operating revenues for Bottling Investments and each of our geographic operating segments, excluding NorthAmerica.
2 Represents the percent change in net operating revenues attributable to the increase (decrease) in concentrate sales volume for our geographicoperating segments (expressed in equivalent unit cases). For our Bottling Investments operating segment, this represents the percent change in netoperating revenues attributable to the increase (decrease) in unit case volume after considering the impact of structural changes. Our BottlingInvestments operating segment data reflects unit case volume growth for consolidated bottlers only. Refer to the heading ‘‘Beverage Volume’’ above.
Refer to the heading ‘‘Beverage Volume’’ above for additional information related to changes in our unit case and concentratesales volume.
The structural change in the Bottling Investments operating segment was primarily related to the sale of all our ownershipinterests in our Norwegian and Swedish bottling operations to New CCE on October 2, 2010. Refer to the heading ‘‘StructuralChanges, Acquired Brands and New License Agreements’’ above. The structural change in the Latin America operating segmentwas related to the sale of 50 percent of our investment in Leao Junior, S.A. (‘‘Leao Junior’’) during the third quarter of 2010.
Price, product and geographic mix had a favorable 2 percent impact on our international and Bottling Investments net operatingrevenues. Price, product and geographic mix was impacted by a variety of factors and events including, but not limited to, thefollowing:
• Our international and Bottling Investments operating segments’ results were unfavorably impacted by geographic mix as aresult of growth in our emerging and developing markets. The revenue per unit sold in those markets is generally less thanin developed markets;
• Eurasia and Africa was favorably impacted by price mix as a result of pricing increases in a number of key markets;
• Europe’s price mix was even, including a negative 1 percent impact as a result of a change in our concentrate pricingstrategy in Germany with our consolidated bottler;
• Latin America was favorably impacted by price mix as a result of pricing increases in a number of key markets. Also, stillbeverages grew faster than sparkling beverages in Latin America, bolstered by the strong performance of Del Valle;
• Pacific was unfavorably impacted by geographic mix due to the growth in emerging and developing markets. The revenueper unit sold in those markets is generally less than in developed markets;
• Pacific was unfavorably impacted by channel and product mix due to the earthquake and tsunami that devastated northernand eastern Japan on March 11, 2011; and
• Bottling Investments was favorably impacted by price mix as a result of pricing increases in a number of key markets,including China, India and Latin America.
52

The favorable impact of foreign currency fluctuations increased net operating revenues for our international and BottlingInvestments operating segments by 4 percent. The favorable impact of changes in foreign currency exchange rates was primarilydue to a weaker U.S. dollar compared to certain other foreign currencies, including the euro, Japanese yen, Mexican peso,Brazilian real, British pound, South African rand and Australian dollar, which had a favorable impact on the Eurasia and Africa,Europe, Latin America, Pacific and Bottling Investments operating segments. Refer to the heading ‘‘Liquidity, Capital Resourcesand Financial Position — Foreign Exchange’’ below.
Net Operating Revenues by Operating Segment
Information about our net operating revenues by operating segment as a percentage of Company net operating revenues is asfollows:
Year Ended December 31, 2012 2011 2010
Eurasia & Africa 5.9% 5.8% 6.9%Europe 9.3 10.3 12.6Latin America 9.5 9.4 11.0North America 45.1 44.2 31.7Pacific 11.6 11.7 14.1Bottling Investments 18.3 18.3 23.4Corporate 0.3 0.3 0.3
100.0% 100.0% 100.0%
The percentage contribution of each operating segment fluctuates over time due to net operating revenues in certain operatingsegments growing at a faster rate compared to other operating segments. Net operating revenue growth rates are impacted bysales volume, structural changes, price and product/geographic mix, and foreign currency fluctuations. In 2012, the percentagecontribution of each operating segment did not change significantly when compared to 2011. In 2011, the percentage of theCompany’s net operating revenues contributed by our North America operating segment increased 12.5 percentage points whencompared to 2010 as a result of our acquisition of CCE’s former North America business on October 2, 2010. The CCEacquisition resulted in a decrease in the proportionate share of the Company’s consolidated net operating revenues contributed byour operating segments outside of North America for both 2011 and 2010. In addition, the percentage of the Company’s netoperating revenues contributed by our Bottling Investments operating segment decreased 5.1 percentage points in 2011 whencompared to 2010, primarily due to the sale of our Norwegian and Swedish bottling operations to New CCE and the segment’sproportionate decrease in the Company’s consolidated net operating revenues due to the CCE acquisition in North America.Refer to the heading ‘‘Structural Changes, Acquired Brands and New License Agreements’’ above.
The size and timing of structural changes are not consistent from period to period. As a result, anticipating the impact of suchevents on future net operating revenues, and other financial statement line items, usually is not possible. We expect structuralchanges to have an impact on our consolidated financial statements in future periods.
Gross Profit Margin
Year Ended December 31, 2012, versus Year Ended December 31, 2011
Our gross profit margin decreased to 60.3 percent in 2012 from 60.9 percent in 2011. This decrease reflected the unfavorableimpact of continued increases in commodity costs during 2012 as well as temporary shifts in channel and package mix acrossmarkets as a result of the impact of current global economic conditions on consumers. In addition, our gross profit margin wasunfavorably impacted as a result of ongoing fluctuations in foreign currency exchange rates and the impact of our acquisition ofGreat Plains in North America as well as our acquisition of bottling operations in Vietnam, Cambodia and Guatemala. Theimpact of these items was partially offset by favorable geographic mix as well as price increases in many of our key markets.
The following inputs represent a substantial portion of the Company’s total cost of goods sold: (1) sweeteners, (2) metals,(3) juices and (4) PET. The majority of these costs are included in our North America and Bottling Investments operatingsegments. The cost to purchase these inputs continued to increase in 2012 when compared to 2011, and as a result the Companyincurred incremental costs of $225 million related to these inputs during 2012. The Company anticipates that the cost ofunderlying commodities will continue to face upward pressure in 2013. We currently expect the incremental impact of increasedcommodity costs related to these inputs, after considering our hedge positions, to be approximately $100 million on our full year2013 consolidated results.
53

In recent years, the Company has increased our hedging activities related to certain commodities in order to mitigate a portion ofthe price and foreign currency risk associated with forecasted purchases. Many of the derivative financial instruments used by theCompany to mitigate the risk associated with these commodity exposures do not qualify, or are not designated, for hedgeaccounting. As a result, the change in fair value of these derivative instruments has been, and will continue to be, included as acomponent of net income in each reporting period. The Company recorded losses of $110 million and $54 million and a gain of$31 million during the years ended December 31, 2012, 2011 and 2010, respectively, in the line item cost of goods sold in ourconsolidated statements of income. Refer to Note 5 of Notes to Consolidated Financial Statements.
The favorable geographic mix was primarily due to many of our emerging markets recovering from the global recession at aquicker pace than our developed markets. Although this shift in geographic mix has a negative impact on net operating revenues,it generally has a favorable impact on our gross profit margin due to the correlated impact it has on our product mix. The productmix in the majority of our emerging and developing markets is more heavily skewed toward our sparkling beverage products,which generally yield a higher gross profit margin compared to our still beverages and finished products. Refer to the heading‘‘Net Operating Revenues’’ above.
Year Ended December 31, 2011, versus Year Ended December 31, 2010
Our gross profit margin decreased to 60.9 percent in 2011 from 63.9 percent in 2010. The decrease was primarily due to the fullyear impact of consolidating CCE’s former North America business as well as a significant increase in commodity costs. Theunfavorable impact of these items was partially offset by favorable geographic mix as a result of growth in our emerging anddeveloping markets, favorable product mix, price increases in many of our key markets and foreign currency exchange fluctuations.In addition, the sale of our Norwegian and Swedish bottling operations during the fourth quarter of 2010 had a favorable impacton our full year 2011 gross profit margin.
The Company’s acquisition of CCE’s former North America business during the fourth quarter of 2010 resulted in a significantadjustment to our overall cost structure, especially in North America. Finished product operations typically have lower gross profitmargins and greater exposure to fluctuations in the cost of raw materials when compared to concentrate operations. The followinginputs represent a substantial portion of the Company’s total cost of goods sold: (1) sweeteners, (2) metals, (3) juices and (4) PET.The majority of these costs are included in our North America and Bottling Investments operating segments. The cost to purchasethese inputs increased significantly in 2011 when compared to 2010, and as a result the Company incurred incremental costs of$800 million related to these inputs during 2011.
Selling, General and Administrative Expenses
The following table sets forth the significant components of selling, general and administrative expenses (in millions):
Year Ended December 31, 2012 2011 2010
As Adjusted
Stock-based compensation expense $ 259 $ 354 $ 380Advertising expenses 3,342 3,256 2,917Bottling and distribution expenses 8,905 8,502 3,902Other operating expenses 5,232 5,310 5,995
Selling, general and administrative expenses $ 17,738 $ 17,422 $ 13,194
Year Ended December 31, 2012, versus Year Ended December 31, 2011
Selling, general and administrative expenses increased $316 million, or 2 percent. Foreign currency fluctuations decreased selling,general and administrative expenses by 3 percent. The decrease in stock-based compensation expense in 2012 was primarily due tothe reversal of previously recognized expenses related to the Company’s long-term incentive compensation programs. As a resultof the Company’s revised outlook of the unfavorable impact foreign currency fluctuations are projected to have on certainperformance periods, the Company lowered the estimated payouts associated with these periods. Advertising expenses increasedduring the year and reflect the Company’s continued investment in the health and strength of our brands and building marketexecution capabilities while simultaneously capturing incremental marketing efficiencies. The increase in bottling and distributionexpenses includes the full year impact of the Company’s acquisition of Great Plains in December 2011 as well as our acquisitionof bottling operations in Vietnam, Cambodia and Guatemala during 2012. Other operating expenses decreased during the year,partially reflecting the impact of the Company’s productivity and integration initiatives.
In 2013, our pension expense is expected to decrease by approximately $60 million compared to 2012. The anticipated decreaseis primarily due to approximately $640 million of contributions the Company expects to make to various plans in 2013, as wellas favorable returns on plan assets in 2012. The favorable impact of these items will be partially offset by the unfavorableimpact of a decrease in the weighted-average discount rate used to calculate the Company’s benefit obligation. Refer to the
54

heading ‘‘Liquidity, Capital Resources and Financial Position’’ below for information related to these contributions. Refer to theheading ‘‘Critical Accounting Policies and Estimates — Pension Plan Valuations’’ above and Note 13 of Notes to ConsolidatedFinancial Statements for additional information related to the discount rates used by the Company.
As of December 31, 2012, we had $467 million of total unrecognized compensation cost related to nonvested share-basedcompensation arrangements granted under our plans. This cost is expected to be recognized over a weighted-average period of1.8 years as stock-based compensation expense. This expected cost does not include the impact of any future stock-basedcompensation awards. Refer to Note 12 of Notes to Consolidated Financial Statements.
Year Ended December 31, 2011, versus Year Ended December 31, 2010
Selling, general and administrative expenses increased $4,228 million, or 32 percent. Foreign currency fluctuations increasedselling, general and administrative expenses by 3 percent. The decrease in stock-based compensation expense was primarily relatedto the impact of modifications made to certain replacement performance share unit awards on our prior year results, partiallyoffset by higher estimated payouts tied to performance in conjunction with our long-term incentive compensation programs.Advertising expenses increased during the year and reflect the Company’s continued investment in the health and strength of ourbrands and building market execution capabilities. The increase in bottling and distribution expenses was primarily due to the fullyear impact of consolidating CCE’s former North America business in addition to our continued investments in our other bottlingoperations around the world. This increase was partially offset by the full year impact of the sale of our Norwegian and Swedishbottling operations to New CCE during the fourth quarter of 2010. Other operating expenses decreased during the year, partiallyreflecting the impact of the Company’s productivity and integration initiatives.
Other Operating Charges
Other operating charges incurred by operating segment were as follows (in millions):
Year Ended December 31, 2012 2011 2010
Eurasia & Africa $ — $ 12 $ 7Europe (3) 25 50Latin America — 4 —North America 255 374 133Pacific 1 54 22Bottling Investments 164 89 122Corporate 30 174 485
Total $ 447 $ 732 $ 819
In 2012, the Company incurred other operating charges of $447 million, which primarily consisted of $270 million associated withthe Company’s productivity and reinvestment program; $163 million related to the Company’s other restructuring and integrationinitiatives; $20 million due to changes in the Company’s ready-to-drink tea strategy as a result of our U.S. license agreement withNestle terminating at the end of 2012; and $8 million due to costs associated with the Company detecting carbendazim in orangejuice imported from Brazil for distribution in the United States. These charges were partially offset by reversals of $10 millionassociated with the refinement of previously established accruals related to the Company’s 2008-2011 productivity initiatives, aswell as reversals of $6 million associated with the refinement of previously established accruals related to the Company’sintegration of CCE’s former North America business. Refer to Note 19 of Notes to Consolidated Financial Statements for theimpact these charges had on our operating segments. Refer to Note 18 of Notes to Consolidated Financial Statements and seebelow for further information on the Company’s productivity and reinvestment program, as well as the Company’s otherproductivity, integration and restructuring initiatives.
In 2011, the Company incurred other operating charges of $732 million, which primarily consisted of $633 million associated withthe Company’s productivity, integration and restructuring initiatives; $50 million related to the events in Japan; $35 million ofcosts associated with the merger of Embotelladoras Arca, S.A.B. de C.V. (‘‘Arca’’) and Grupo Continental S.A.B. (‘‘Contal’’); and$10 million associated with the floods in Thailand that impacted the Company’s supply chain operations in the region. Refer toNote 17 of Notes to Consolidated Financial Statements for additional information related to the merger of Arca and Contal.Refer to Note 19 of Notes to Consolidated Financial Statements for the impact these charges had on our operating segments.Refer to Note 18 of Notes to Consolidated Financial Statements and see below for additional information on the Company’sproductivity, integration and restructuring initiatives.
55

In 2010, the Company incurred other operating charges of $819 million, which consisted of $478 million associated with theCompany’s productivity, integration and restructuring initiatives; $250 million related to charitable contributions; $81 million dueto transaction costs incurred in connection with our acquisition of CCE’s former North America business and the sale of ourNorwegian and Swedish bottling operations to New CCE; and $10 million of charges related to bottling activities in Eurasia. TheCompany’s integration activities included costs associated with the integration of CCE’s former North America business, as well asthe integration of 18 German bottling and distribution operations acquired in 2007. The charitable contributions were primarilyattributable to a cash donation to The Coca-Cola Foundation. Refer to Note 2 of Notes to Consolidated Financial Statements foradditional information related to the transaction costs. Refer to Note 19 of Notes to Consolidated Financial Statements for theimpact these charges had on our operating segments. Refer to Note 18 of Notes to Consolidated Financial Statements and seebelow for additional information on the Company’s productivity, integration and restructuring initiatives.
Productivity and Reinvestment Program
In February 2012, the Company announced a new four-year productivity and reinvestment program. This program will furtherenable our efforts to strengthen our brands and reinvest our resources to drive long-term profitable growth. The first componentof this program is a new global productivity initiative that will target annualized savings of $350 million to $400 million. Thisinitiative will be focused on four primary areas: global supply chain optimization; global marketing and innovation effectiveness;operating expense leverage and operational excellence; and data and information technology (‘‘IT’’) systems standardization. TheCompany is in the process of defining the costs associated with this initiative.
The second component of our new productivity and reinvestment program involves beginning a new integration initiative in NorthAmerica related to our acquisition of CCE’s former North America business. The Company has identified incremental synergies,primarily in the area of our North American product supply operations, which will better enable us to service our customers andconsumers. We believe these efforts will create annualized savings of $200 million to $250 million.
As a combined productivity and reinvestment program, the Company anticipates generating annualized savings of $550 million to$650 million, which will be phased in over time. We expect to begin fully realizing the annual benefit of these savings in 2015, thefinal year of the program. The savings generated by this program will be reinvested in brand-building initiatives, and in the shortterm will also mitigate potential incremental commodity costs. Refer to Note 18 of Notes to Consolidated Financial Statements.
Productivity Initiatives
During 2011, the Company successfully completed our four-year global productivity program and exceeded our target of providing$500 million in annualized savings from these initiatives. These savings have provided the Company additional flexibility to investfor growth. The Company generated these savings in a number of areas, which include aggressively managing operating expensessupported by lean techniques, redesigning key processes to drive standardization and effectiveness, better leveraging our size andscale, and driving savings in indirect costs through the implementation of a ‘‘procure-to-pay’’ program. In realizing these savings,the Company incurred total costs of $498 million related to these productivity initiatives since they commenced during the firstquarter of 2008. Refer to Note 18 of Notes to Consolidated Financial Statements.
Integration of CCE’s Former North America Business
In 2010, the Company began an integration initiative related to our acquisition of CCE’s former North America business onOctober 2, 2010. Upon completion of the CCE transaction, we combined the management of the acquired North Americabusiness with the management of our existing foodservice business; Minute Maid and Odwalla juice businesses; North Americasupply chain operations; and Company-owned bottling operations in Philadelphia, Pennsylvania, into a unified bottling andcustomer service organization called CCR. In addition, we reshaped our remaining CCNA operations into an organization thatprimarily provides franchise leadership and consumer marketing and innovation for the North American market. As a result of thetransaction and related reorganization, our North American businesses operate as aligned and agile organizations with distinctcapabilities, responsibilities and strengths. Refer to Note 2 of Notes to Consolidated Financial Statements.
In 2011, we completed this program. The Company incurred total pretax expenses of $487 million related to this initiative sincethe plan commenced in the fourth quarter of 2010, and we realized nearly all of the $350 million in annualized savings by the endof 2011. Refer to Note 18 of Notes to Consolidated Financial Statements.
56

Integration of Our German Bottling and Distribution Operations
The Company’s integration initiatives include costs related to the integration of 18 German bottling and distribution operationsacquired in 2007. We incurred expenses of $148 million in 2012 related to this initiative. The expenses recorded in connection withthese integration activities have been primarily due to involuntary terminations. The Company began these integration initiativesin 2008 and has incurred total pretax expenses of $440 million since they commenced. The Company is currently reviewing otherintegration and restructuring opportunities within the German bottling and distribution operations, which if implemented willresult in additional charges in future periods. However, as of December 31, 2012, the Company had not finalized any additionalplans. Refer to Note 18 of Notes to Consolidated Financial Statements.
Operating Income and Operating Margin
Information about our operating income contribution by operating segment on a percentage basis is as follows:
Year Ended December 31, 2012 2011 2010
Eurasia & Africa 10.8% 10.7% 11.6%Europe 27.5 30.4 35.4Latin America 26.7 27.7 28.6North America 24.1 22.8 18.1Pacific 22.5 21.1 24.3Bottling Investments 1.3 2.2 2.7Corporate (12.9) (14.9) (20.7)
Total 100.0% 100.0% 100.0%
Information about our operating margin on a consolidated basis and by operating segment is as follows:
Year Ended December 31, 2012 2011 2010
Consolidated 22.4% 21.9% 24.0%
Eurasia & Africa 41.5% 40.6% 40.4%Europe 66.1 64.7 67.3Latin America 63.1 63.9 62.0North America 12.0 11.3 13.6Pacific 43.6 39.4 41.4Bottling Investments 1.6 2.6 2.8Corporate * * *
* Calculation is not meaningful.
As demonstrated by the tables above, the percentage contribution to operating income and operating margin by operating segmentfluctuated from year to year. Operating income and operating margin by operating segment were influenced by a variety of factorsand events, including the following:
• In 2012, foreign currency exchange rates unfavorably impacted consolidated operating income by 5 percent. Theunfavorable impact of changes in foreign currency exchange rates was primarily due to a stronger U.S. dollar compared tocertain other foreign currencies, including the euro, Mexican peso, Brazilian real, British pound, South African rand andAustralian dollar, which impacted the Eurasia and Africa, Europe, Latin America, Pacific and Bottling Investmentsoperating segments. The unfavorable impact of a stronger U.S. dollar compared to the currencies listed above was partiallyoffset by the impact of a weaker U.S. dollar compared to certain other foreign currencies, including the Japanese yen,which had a favorable impact on our Pacific operating segment. Refer to the heading ‘‘Liquidity, Capital Resources andFinancial Position — Foreign Exchange’’ below.
• In 2012, operating income was unfavorably impacted by fluctuations in foreign currency exchange rates by 11 percent forEurasia and Africa, 4 percent for Europe, 10 percent for Latin America, 19 percent for Bottling Investments and 1 percentfor Corporate. Operating income was favorably impacted by fluctuations in foreign currency exchange rates by 2 percent forPacific. Fluctuations in foreign currency exchange rates had a minimal impact on operating income for North America.
57
• In 2012, our consolidated operating margin was favorably impacted by geographic mix. The favorable geographic mix wasprimarily due to many of our emerging markets recovering from the global recession at a quicker pace than our developedmarkets. Although this shift in geographic mix has a negative impact on net operating revenues, it generally has a favorableimpact on our gross profit margin and operating margin due to the correlated impact it has on our product mix. Theproduct mix in the majority of our emerging and developing markets is more heavily skewed toward products in oursparkling beverage portfolio, which generally yield a higher gross profit margin compared to our still beverages and finishedproducts. Consequently, the shift in our geographic mix is driving favorable product mix from a global perspective.
• In 2012, our consolidated operating income and operating margin were favorably impacted by the reversal of previouslyrecognized expenses related to the Company’s long-term incentive compensation programs. As a result of the Company’srevised outlook of the unfavorable impact foreign currency fluctuations are projected to have on certain performanceperiods, the Company lowered the estimated payouts associated with these periods.
• In 2012, operating income increased for Eurasia and Africa due to volume and revenue growth across the operatingsegment.
• In 2012, operating income declined for Europe as a result of lower sales volume and shifts in product, package and channelmix across markets, partially offset by efficient expense management.
• In 2012, operating income increased for Latin America, reflecting solid volume growth and favorable pricing across thegroup, partially offset by continued investments in the business, including some initial investments related to the 2014World Cup.
• In 2012, operating income increased for North America, primarily due to positive volume growth and favorable pricing,partially offset by higher commodity costs and ongoing investment in marketplace executional capabilities.
• In 2012, operating income was reduced by $21 million for North America due to costs associated with the Companydetecting residues of carbendazim, a fungicide that is not registered in the United States for use on citrus products, inorange juice imported from Brazil for distribution in the United States. As a result, the Company began purchasingadditional supplies of Florida orange juice at a higher cost than Brazilian orange juice.
• In 2012, operating income was reduced by $20 million for North America due to changes in the Company’s ready-to-drinktea strategy as a result of our current U.S. license agreement with Nestle terminating at the end of 2012.
• In 2012, operating income was reduced by $1 million for Europe, $227 million for North America, $3 million for Pacific,$164 million for Bottling Investments and $38 million for Corporate due to charges related to the Company’s productivityand reinvestment program as well as other restructuring initiatives.
• In 2012, operating income was increased by $4 million for Europe, $1 million for Pacific and $5 million for Corporate dueto the refinement of previously established accruals related to the Company’s 2008-2011 productivity initiatives.
• In 2012, operating income was increased by $6 million for North America due to the refinement of previously establishedaccruals related to the Company’s integration of CCE’s former North America business.
• In 2011, foreign currency exchange rates favorably impacted consolidated operating income by 4 percent. The favorableimpact of changes in foreign currency exchange rates was primarily due to a weaker U.S. dollar compared to most foreigncurrencies, including the Japanese yen, Mexican peso, Brazilian real, British pound, South African rand and Australiandollar, which had a favorable impact on the Eurasia and Africa, Europe, Latin America, Pacific and Bottling Investmentsoperating segments. Refer to the heading ‘‘Liquidity, Capital Resources and Financial Position — Foreign Exchange’’below.
• In 2011, operating income was favorably impacted by fluctuations in foreign currency exchange rates by 2 percent forEurope, 4 percent for Latin America, 1 percent for North America, 7 percent for Pacific, 7 percent for BottlingInvestments and 1 percent for Corporate. Operating income was unfavorably impacted by fluctuations in foreign currencyexchange rates by 1 percent for Eurasia and Africa.
• In 2011, our consolidated operating margin was favorably impacted by geographic mix. The favorable geographic mix wasprimarily due to many of our emerging markets recovering from the global recession at a quicker pace than our developedmarkets. Although this shift in geographic mix has a negative impact on net operating revenues, it generally has a favorableimpact on our gross profit margin and operating margin due to the correlated impact it has on our product mix. Theproduct mix in the majority of our emerging and developing markets is more heavily skewed toward products in oursparkling beverage portfolio, which generally yield a higher gross profit margin compared to our still beverages and finishedproducts.
58

• In 2011, operating income and operating margin for Europe were unfavorably impacted by a change in our concentratepricing strategy in Germany with our consolidated bottler.
• In 2011, operating income and operating margin for Latin America were favorably impacted by volume growth across all ofthe group’s business units and pricing increases in key markets, partially offset by continued investments in the business.
• In 2011, the operating margin for North America was unfavorably impacted by the full year impact of the Company’sacquisition of CCE’s former North America business. Generally, bottling and finished product operations have higher netoperating revenues but lower operating margins when compared to concentrate and syrup operations. The impact of thistransaction was also reflected in the Company’s operating margin. Refer to the heading ‘‘Structural Changes, AcquiredBrands and New License Agreements’’ above.
• In 2011, operating income and operating margin for North America were unfavorably impacted by higher commodity costsin the segment’s finished product businesses.
• In 2011, operating income was reduced by $19 million for North America due to the amortization of favorable supplycontracts acquired in connection with our acquisition of CCE’s former North America business.
• In 2011, operating income and operating margin for Pacific and North America were unfavorably impacted as a result ofthe earthquake and tsunami that devastated northern and eastern Japan on March 11, 2011. Operating income was reducedby $82 million and $2 million for Pacific and North America, respectively. The charges were primarily related to theCompany’s charitable donations in support of relief and rebuilding efforts in Japan as well as funds we provided to certainbottling partners in the affected regions.
• In 2011, operating income was reduced by $10 million for Corporate due to charges associated with the floods in Thailandthat impacted the Company’s supply chain operations in the region.
• In 2011, operating income was reduced by $12 million for Eurasia and Africa, $25 million for Europe, $4 million for LatinAmerica, $374 million for North America, $4 million for Pacific, $89 million for Bottling Investments and $164 million forCorporate, primarily due to the Company’s productivity, integration and restructuring initiatives as well as costs associatedwith the merger of Arca and Contal.
• In 2010, foreign currency exchange rates favorably impacted consolidated operating income by 3 percent. The favorableimpact of changes in foreign currency exchange rates was primarily due to a weaker U.S. dollar compared to most foreigncurrencies, including the Japanese yen, Mexican peso, Brazilian real, South African rand and Australian dollar, which had afavorable impact on the Eurasia and Africa, Latin America, Pacific and Bottling Investments operating segments. Thefavorable impact of a weaker U.S. dollar compared to the aforementioned currencies was partially offset by the impact of astronger U.S. dollar compared to certain other foreign currencies, including the euro and British pound, which had anunfavorable impact on the Europe and Bottling Investments operating segments. Refer to the heading ‘‘Liquidity, CapitalResources and Financial Position — Foreign Exchange’’ below.
• In 2010, operating income was favorably impacted by fluctuations in foreign currency exchange rates by 7 percent forEurasia and Africa, 3 percent for Latin America, 8 percent for Pacific and 9 percent for Bottling Investments. Operatingincome was unfavorably impacted by fluctuations in foreign currency exchange rates by 1 percent for Europe. Fluctuationsin foreign currency exchange rates had a minimal impact on operating income for North America and Corporate.
• In 2010, our consolidated operating margin was favorably impacted by geographic mix. The favorable geographic mix wasprimarily due to many of our emerging markets recovering from the global recession at a quicker pace than our developedmarkets. Although this shift in geographic mix has a negative impact on net operating revenues, it generally has a favorableimpact on our gross profit margin and operating margin due to the correlated impact it has on our product mix. Theproduct mix in the majority of our emerging and developing markets is more heavily skewed toward products in oursparkling beverage portfolio, which generally yield a higher gross profit margin compared to our still beverages and finishedproducts.
• In 2010, our consolidated operating margin was favorably impacted by the deconsolidation of certain entities as a result ofthe Company’s adoption of new accounting guidance issued by the FASB. These entities are primarily bottling operationsand have been accounted for under the equity method of accounting since they were deconsolidated on January 1, 2010.Generally, bottling and finished product operations produce higher net revenues but lower operating margins compared toconcentrate and syrup operations. The majority of the deconsolidated entities had previously been included in our BottlingInvestments operating segment.
59

• In 2010, the operating margin for the Latin America operating segment was favorably impacted by the sale of 50 percent ofour ownership interest in Leao Junior, resulting in its deconsolidation, as well as the deconsolidation of certain entities as aresult of the Company’s adoption of new accounting guidance issued by the FASB. Price and product mix also favorablyimpacted Latin America’s operating income and operating margin during the year.
• In 2010, the operating margin for the North America operating segment was unfavorably impacted by the Company’sacquisition of CCE’s former North America business. Generally, bottling and finished product operations have higher netoperating revenues but lower operating margins when compared to concentrate and syrup operations. Refer to the heading‘‘Structural Changes, Acquired Brands and New License Agreements’’ above. Refer to Note 2 of Notes to ConsolidatedFinancial Statements.
• In 2010, operating income for the North America operating segment was reduced by $74 million due to the acceleration ofexpense associated with certain share-based replacement awards issued in connection with our acquisition of CCE’s formerNorth America business. Refer to Note 2 of Notes to Consolidated Financial Statements.
• In 2010, operating income for the North America operating segment was negatively impacted by $235 million, primarily dueto the elimination of gross profit in inventory on intercompany sales and an inventory fair value adjustment as a result ofour acquisition of CCE’s former North America business. Prior to the acquisition, we recognized the profit associated withconcentrate sales when the concentrate was sold to CCE, excluding the portion that was deemed to be intercompany due toour previous ownership interest in CCE. However, subsequent to the acquisition, the Company does not recognize theprofit associated with concentrate sold to CCE’s legacy North America business until the finished beverage products madefrom those concentrates are sold. Refer to Note 2 of Notes to Consolidated Financial Statements.
• In 2010, operating income for the North America operating segment was reduced by $20 million due to the amortization offavorable supply contracts acquired in connection with our acquisition of CCE’s former North America business.
• In 2010, operating income was reduced by $7 million for Eurasia and Africa, $50 million for Europe, $133 million forNorth America, $22 million for Pacific, $122 million for Bottling Investments and $485 million for Corporate, primarily dueto the Company’s productivity, integration and restructuring initiatives; charitable donations; transaction costs incurred inconnection with our acquisition of CCE’s former North America business and the sale of our Norwegian and Swedishbottling operations to New CCE; and other charges related to bottling activities in Eurasia. Refer to the heading ‘‘OtherOperating Charges’’ above.
Interest Income
Year Ended December 31, 2012, versus Year Ended December 31, 2011
Interest income was $471 million in 2012, compared to $483 million in 2011, a decrease of $12 million, or 2 percent. The decreasewas primarily due to the impact of lower average interest rates, partially offset by higher average cash, cash equivalents andshort-term investment balances. The majority of the Company’s cash, cash equivalents and short-term investments is held by ourinternational locations.
Year Ended December 31, 2011, versus Year Ended December 31, 2010
Interest income was $483 million in 2011, compared to $317 million in 2010, an increase of $166 million, or 52 percent. Theincrease was primarily due to the impact of higher average cash, cash equivalents and short-term investment balances in additionto higher average interest rates, particularly in international locations. The majority of the Company’s cash, cash equivalents andshort-term investments is held by our international locations.
Interest Expense
Year Ended December 31, 2012, versus Year Ended December 31, 2011
Interest expense was $397 million in 2012, compared to $417 million in 2011, a decrease of $20 million, or 5 percent. Thisdecrease reflects the impact of long-term debt maturities during the second quarter of 2012 and a net benefit related to interestrate swaps on our fixed-rate debt, partially offset by the impact of additional long-term debt the Company issued during the firstquarter of 2012. Refer to Note 5 of Notes to Consolidated Financial Statements for additional information related to theCompany’s hedging program. Refer to the heading ‘‘Liquidity, Capital Resources and Financial Position — Cash Flows fromFinancing Activities — Debt Financing’’ below for additional information related to the Company’s long-term debt activity.
60

Year Ended December 31, 2011, versus Year Ended December 31, 2010
Interest expense was $417 million in 2011, compared to $733 million in 2010, a decrease of $316 million, or 43 percent. Thisdecrease was primarily due to a $342 million charge recorded in 2010 related to the premiums paid to repurchase long-term debtand the costs associated with the settlement of treasury rate locks issued in connection with the Company’s debt tender offer in2010. The decrease was partially offset by the full year impact of increased interest expense on long-term debt assumed inconnection with the Company’s acquisition of CCE’s former North America business as well as additional long-term debt issuedby the Company in 2011. The Company’s interest expense also includes the impact of interest rate swap agreements. Refer toNote 5 of Notes to Consolidated Financial Statements for additional information related to our interest rate swaps. Refer to theheading ‘‘Liquidity, Capital Resources and Financial Position — Cash Flows from Financing Activities — Debt Financing’’ belowfor additional information related to the Company’s long-term debt activity.
Equity Income (Loss) — Net
Year Ended December 31, 2012, versus Year Ended December 31, 2011
Equity income (loss) — net represents our Company’s proportionate share of net income or loss from each of our equity methodinvestees. In 2012, equity income was $819 million, compared to equity income of $690 million in 2011, an increase of$129 million, or 19 percent. This increase was primarily due to more favorable operating results reported by certain of our equitymethod investees, a decrease in the impact of unusual or infrequent charges recorded by certain of our equity method investees,and the Company’s acquisition of an equity ownership interest in Aujan during 2012, partially offset by the unfavorable impact offoreign currency fluctuations. Refer to Note 17 of Notes to Consolidated Financial Statements for additional information relatedto the unusual or infrequent charges recorded by certain of our equity method investees.
Year Ended December 31, 2011, versus Year Ended December 31, 2010
In 2011, equity income was $690 million, compared to equity income of $1,025 million in 2010, a decrease of $335 million, or33 percent. This decrease was primarily due to the Company’s acquisition and consolidation of CCE’s former North Americabusiness during the fourth quarter of 2010. As a result of this transaction, the Company stopped recording equity income relatedto CCE beginning October 2, 2010, and our 2011 consolidated statement of income reflects the full year impact of not having anequity interest in New CCE. Refer to the heading ‘‘Structural Changes, Acquired Brands and New License Agreements’’ above. Inaddition, the decrease in equity income (loss) — net was partially due to the Company’s sale of its investment in Coca-ColaEmbonor, S.A. (‘‘Embonor’’) during the first quarter of 2011. Refer to Note 2 of Notes to Consolidated Financial Statements foradditional information on the Company’s acquisition and divestiture activities. The unfavorable impact of these items was partiallyoffset by the Company’s proportionate share of increased net income from certain of our equity method investees and thefavorable impact of foreign currency fluctuations.
Other Income (Loss) — Net
Other income (loss) — net includes, among other things, the impact of foreign currency exchange gains and losses; dividendincome; rental income; gains and losses related to the disposal of property, plant and equipment; realized and unrealized gainsand losses on trading securities; realized gains and losses on available-for-sale securities; other-than-temporary impairments ofavailable-for-sale securities; and the accretion of expense related to certain acquisitions. The foreign currency exchange gains andlosses are primarily the result of the remeasurement of monetary assets and liabilities from certain currencies into functionalcurrencies. The effects of the remeasurement of these assets and liabilities are partially offset by the impact of our economichedging program for certain exposures on our consolidated balance sheets. Refer to Note 5 of Notes to Consolidated FinancialStatements.
In 2012, other income (loss) — net was income of $137 million, primarily related to a gain of $185 million due to the merger ofEmbotelladora Andina S.A. (‘‘Andina’’) and Embotelladoras Coca-Cola Polar S.A. (‘‘Polar’’); a gain of $92 million the Companyrecognized as a result of Coca-Cola FEMSA, an equity method investee, issuing additional shares of its own stock at per shareamounts greater than the carrying value of the Company’s per share investment; dividend income of $44 million; and net gains of$31 million related to fluctuations in the fair value of the Company’s trading securities and the sale of available-for-sale securities.The favorable impact of the previous items was partially offset by a charge of $108 million due to the loss we recognized on thepending sale of a majority ownership interest in our consolidated Philippine bottling operations to Coca-Cola FEMSA; a charge of$82 million related to the premium we paid in excess of the publicly traded market price to acquire an ownership interest inMikuni Coca-Cola Bottling Co., Ltd. (‘‘Mikuni’’); and charges of $16 million due to other-than-temporary declines in the fairvalues of certain cost method investments. Refer to Note 2 and Note 17 of Notes to Consolidated Financial Statements.
61
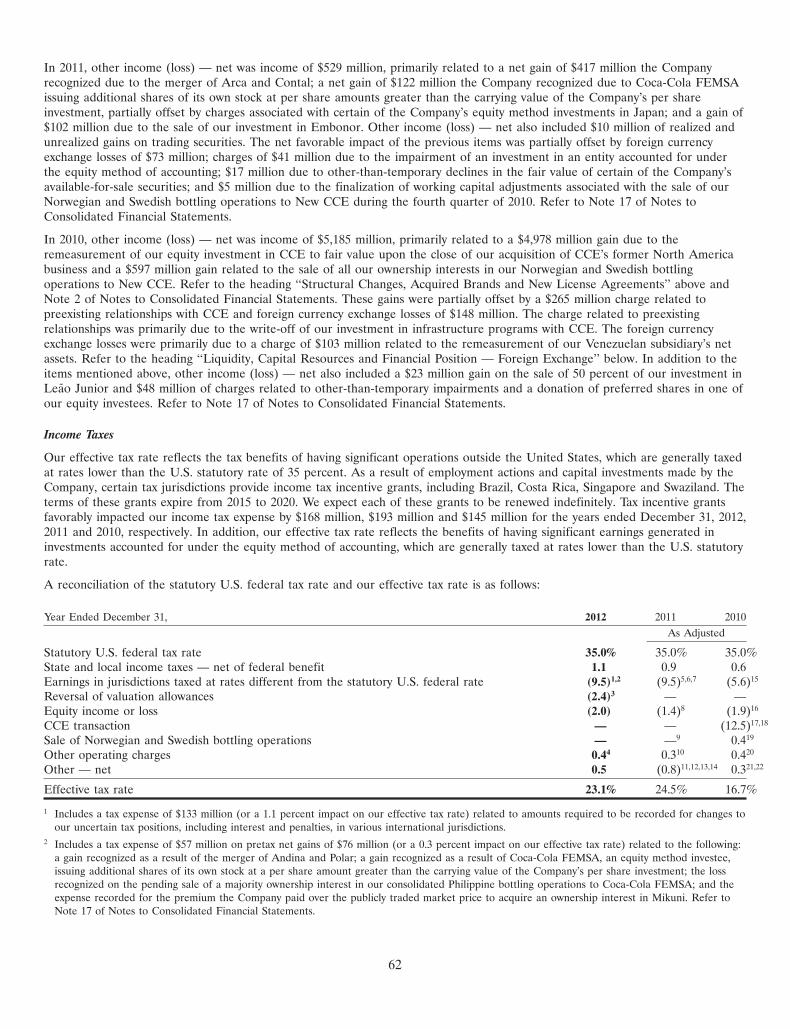
In 2011, other income (loss) — net was income of $529 million, primarily related to a net gain of $417 million the Companyrecognized due to the merger of Arca and Contal; a net gain of $122 million the Company recognized due to Coca-Cola FEMSAissuing additional shares of its own stock at per share amounts greater than the carrying value of the Company’s per shareinvestment, partially offset by charges associated with certain of the Company’s equity method investments in Japan; and a gain of$102 million due to the sale of our investment in Embonor. Other income (loss) — net also included $10 million of realized andunrealized gains on trading securities. The net favorable impact of the previous items was partially offset by foreign currencyexchange losses of $73 million; charges of $41 million due to the impairment of an investment in an entity accounted for underthe equity method of accounting; $17 million due to other-than-temporary declines in the fair value of certain of the Company’savailable-for-sale securities; and $5 million due to the finalization of working capital adjustments associated with the sale of ourNorwegian and Swedish bottling operations to New CCE during the fourth quarter of 2010. Refer to Note 17 of Notes toConsolidated Financial Statements.
In 2010, other income (loss) — net was income of $5,185 million, primarily related to a $4,978 million gain due to theremeasurement of our equity investment in CCE to fair value upon the close of our acquisition of CCE’s former North Americabusiness and a $597 million gain related to the sale of all our ownership interests in our Norwegian and Swedish bottlingoperations to New CCE. Refer to the heading ‘‘Structural Changes, Acquired Brands and New License Agreements’’ above andNote 2 of Notes to Consolidated Financial Statements. These gains were partially offset by a $265 million charge related topreexisting relationships with CCE and foreign currency exchange losses of $148 million. The charge related to preexistingrelationships was primarily due to the write-off of our investment in infrastructure programs with CCE. The foreign currencyexchange losses were primarily due to a charge of $103 million related to the remeasurement of our Venezuelan subsidiary’s netassets. Refer to the heading ‘‘Liquidity, Capital Resources and Financial Position — Foreign Exchange’’ below. In addition to theitems mentioned above, other income (loss) — net also included a $23 million gain on the sale of 50 percent of our investment inLeao Junior and $48 million of charges related to other-than-temporary impairments and a donation of preferred shares in one ofour equity investees. Refer to Note 17 of Notes to Consolidated Financial Statements.
Income Taxes
Our effective tax rate reflects the tax benefits of having significant operations outside the United States, which are generally taxedat rates lower than the U.S. statutory rate of 35 percent. As a result of employment actions and capital investments made by theCompany, certain tax jurisdictions provide income tax incentive grants, including Brazil, Costa Rica, Singapore and Swaziland. Theterms of these grants expire from 2015 to 2020. We expect each of these grants to be renewed indefinitely. Tax incentive grantsfavorably impacted our income tax expense by $168 million, $193 million and $145 million for the years ended December 31, 2012,2011 and 2010, respectively. In addition, our effective tax rate reflects the benefits of having significant earnings generated ininvestments accounted for under the equity method of accounting, which are generally taxed at rates lower than the U.S. statutoryrate.
A reconciliation of the statutory U.S. federal tax rate and our effective tax rate is as follows:
Year Ended December 31, 2012 2011 2010As Adjusted
Statutory U.S. federal tax rate 35.0% 35.0% 35.0%State and local income taxes — net of federal benefit 1.1 0.9 0.6Earnings in jurisdictions taxed at rates different from the statutory U.S. federal rate (9.5)1,2 (9.5)5,6,7 (5.6)15
Reversal of valuation allowances (2.4)3 — —Equity income or loss (2.0) (1.4)8 (1.9)16
CCE transaction — — (12.5)17,18
Sale of Norwegian and Swedish bottling operations — —9 0.419
Other operating charges 0.44 0.310 0.420
Other — net 0.5 (0.8)11,12,13,14 0.321,22
Effective tax rate 23.1% 24.5% 16.7%
1 Includes a tax expense of $133 million (or a 1.1 percent impact on our effective tax rate) related to amounts required to be recorded for changes toour uncertain tax positions, including interest and penalties, in various international jurisdictions.
2 Includes a tax expense of $57 million on pretax net gains of $76 million (or a 0.3 percent impact on our effective tax rate) related to the following:a gain recognized as a result of the merger of Andina and Polar; a gain recognized as a result of Coca-Cola FEMSA, an equity method investee,issuing additional shares of its own stock at a per share amount greater than the carrying value of the Company’s per share investment; the lossrecognized on the pending sale of a majority ownership interest in our consolidated Philippine bottling operations to Coca-Cola FEMSA; and theexpense recorded for the premium the Company paid over the publicly traded market price to acquire an ownership interest in Mikuni. Refer toNote 17 of Notes to Consolidated Financial Statements.
62

3 Relates to a net tax benefit of $283 million associated with the reversal of valuation allowances in certain of the Company’s foreign jurisdictions.4 Includes a tax benefit of $95 million on pretax charges of $416 million (or a 0.4 percent impact on our effective tax rate) primarily related to the
Company’s productivity and reinvestment program as well as other restructuring initiatives; the refinement of previously established accruals relatedto the Company’s 2008-2011 productivity initiatives; and the refinement of previously established accruals related to the Company’s integration ofCCE’s former North America business. Refer to Note 18 of Notes to Consolidated Financial Statements.
5 Includes a tax benefit of $6 million related to amounts required to be recorded for changes to our uncertain tax positions, including interest andpenalties, in various international jurisdictions.
6 Includes a zero percent effective tax rate on pretax charges of $17 million due to the impairment of available-for-sale securities. Refer to Note 3and Note 17 of Notes to Consolidated Financial Statements.
7 Includes a tax expense of $299 million on pretax net gains of $641 million (or a 0.7 percent impact on our effective tax rate) related to the net gainrecognized as a result of the merger of Arca and Contal; the gain recognized on the sale of our investment in Embonor; and gains the Companyrecognized as a result of Coca-Cola FEMSA, an equity method investee, issuing additional shares of its own stock at per share amounts greaterthan the carrying value of the Company’s per share investment. These gains were partially offset by charges associated with certain of theCompany’s equity method investments in Japan. Refer to Note 17 of Notes to Consolidated Financial Statements.
8 Includes a tax benefit of $7 million on pretax net charges of $53 million (or a 0.1 percent impact on our effective tax rate) related to ourproportionate share of asset impairments and restructuring charges recorded by certain of our equity method investees. Refer to Note 17 of Notesto Consolidated Financial Statements.
9 Includes a tax benefit of $2 million on pretax charges of $5 million related to the finalization of working capital adjustments on the sale of ourNorwegian and Swedish bottling operations. Refer to Note 2 and Note 17 of Notes to Consolidated Financial Statements.
10 Includes a tax benefit of $224 million on pretax charges of $732 million (or a 0.3 percent impact on our effective tax rate) primarily related to theCompany’s productivity, integration and restructuring initiatives; transaction costs incurred in connection with the merger of Arca and Contal; costsassociated with the earthquake and tsunami that devastated northern and eastern Japan; and costs associated with the flooding in Thailand. Referto Note 17 of Notes to Consolidated Financial Statements.
11 Includes a tax benefit of $8 million on pretax charges of $19 million related to the amortization of favorable supply contracts acquired inconnection with our acquisition of CCE’s former North America business.
12 Includes a tax benefit of $3 million on pretax net charges of $9 million related to the repurchase and/or exchange of certain long-term debtassumed in connection with our acquisition of CCE’s former North America business as well as the early extinguishment of certain other long-termdebt. Refer to Note 10 of Notes to Consolidated Financial Statements.
13 Includes a tax benefit of $14 million on pretax charges of $41 million related to the impairment of an investment in an entity accounted for underthe equity method of accounting. Refer to Note 17 of Notes to Consolidated Financial Statements.
14 Includes a tax benefit of $2 million related to amounts required to be recorded for changes to our uncertain tax positions, including interest andpenalties, in certain domestic jurisdictions.
15 Includes a tax expense of $265 million (or a 1.9 percent impact on our effective tax rate) primarily related to deferred tax expense on certaincurrent year undistributed foreign earnings that are not considered indefinitely reinvested and amounts required to be recorded for changes to ouruncertain tax positions, including interest and penalties.
16 Includes a tax benefit of $9 million on pretax net charges of $66 million (or a 0.1 percent impact on our effective tax rate) related to chargesrecorded by our equity method investees. Refer to Note 17 of Notes to Consolidated Financial Statements.
17 Includes a tax benefit of $34 million on a pretax gain of $4,978 million (or a reduction of 12.5 percent on our effective tax rate) related to theremeasurement of our equity investment in CCE to fair value upon our acquisition of CCE’s former North America business. The tax benefitreflects the impact of reversing deferred tax liabilities associated with our equity investment in CCE prior to the acquisition. Refer to Note 2 ofNotes to Consolidated Financial Statements.
18 Includes a tax benefit of $99 million on pretax charges of $265 million related to the write-off of preexisting relationships with CCE. Refer toNote 2 of Notes to Consolidated Financial Statements.
19 Includes a tax expense of $261 million on a pretax gain of $597 million (or a 0.4 percent impact on our effective tax rate) related to the sale of ourNorwegian and Swedish bottling operations. Refer to Note 2 of Notes to Consolidated Financial Statements.
20 Includes a tax benefit of $223 million on pretax charges of $819 million (or a 0.4 percent impact on our effective tax rate) primarily related to theCompany’s productivity, integration and restructuring initiatives, transaction costs and charitable contributions. Refer to Note 17 of Notes toConsolidated Financial Statements.
21 Includes a tax benefit of $114 million on pretax charges of $493 million (or a 0.5 percent impact on our effective tax rate) related to the repurchaseof certain long-term debt and costs associated with the settlement of treasury rate locks issued in connection with the debt tender offer; the lossrelated to the remeasurement of our Venezuelan subsidiary’s net assets; other-than-temporary impairment charges; and a donation of preferredshares in one of our equity method investees. Refer to Note 17 of Notes to Consolidated Financial Statements.
22 Includes a tax expense of $31 million (or a 0.2 percent impact on our effective tax rate) related to amounts required to be recorded for changes toour uncertain tax positions, including interest and penalties, and other tax matters in certain domestic jurisdictions.
63

In 2010, the Company recorded a $4,978 million pretax remeasurement gain associated with the acquisition of CCE’s formerNorth America business. This remeasurement gain was not recognized for tax purposes and therefore no tax expense was recordedon this gain. Also, as a result of this acquisition, the Company was required to reverse $34 million of deferred tax liabilities whichwere associated with our equity investment in CCE prior to the acquisition. In addition, the Company recognized a $265 millioncharge related to the settlement of preexisting relationships with CCE, and we recorded a tax benefit of 37 percent related to thischarge.
As of December 31, 2012, the gross amount of unrecognized tax benefits was $302 million. If the Company were to prevail on alluncertain tax positions, the net effect would be a benefit to the Company’s effective tax rate of $187 million, exclusive of anybenefits related to interest and penalties. The remaining $115 million, which was recorded as a deferred tax asset, primarilyrepresents tax benefits that would be received in different tax jurisdictions in the event the Company did not prevail on alluncertain tax positions.
A reconciliation of the changes in the gross balance of unrecognized tax benefit amounts is as follows (in millions):
Year Ended December 31, 2012 2011 2010
Beginning balance of unrecognized tax benefits $ 320 $ 387 $ 354Increases related to prior period tax positions 69 9 26Decreases related to prior period tax positions (15) (19) (10)Increases related to current period tax positions 23 6 33Decreases related to current period tax positions — (1) —Decreases related to settlements with taxing authorities (45) (5) —Reductions as a result of a lapse of the applicable statute of limitations (36) (46) (1)Increase related to acquisition of CCE’s former North America business — — 6Increases (decreases) from effects of foreign currency exchange rates (14) (11) (21)
Ending balance of unrecognized tax benefits $ 302 $ 320 $ 387
The Company recognizes accrued interest and penalties related to unrecognized tax benefits in income tax expense. The Companyhad $113 million, $110 million and $112 million in interest and penalties related to unrecognized tax benefits accrued as ofDecember 31, 2012, 2011 and 2010, respectively. Of these amounts, $33 million of expense, $2 million of benefit and $17 millionof expense were recognized through income tax expense in 2012, 2011 and 2010, respectively. If the Company were to prevail onall uncertain tax positions, the reversal of this accrual would also be a benefit to the Company’s effective tax rate.
Based on current tax laws, the Company’s effective tax rate in 2013 is expected to be approximately 24.0 percent beforeconsidering the effect of any unusual or special items that may affect our tax rate in future years.
Liquidity, Capital Resources and Financial Position
We believe our ability to generate cash from operating activities is one of our fundamental financial strengths. Refer to theheading ‘‘Cash Flows from Operating Activities’’ below. The near-term outlook for our business remains strong, and we expect togenerate substantial cash flows from operations in 2013. As a result of our expected cash flows from operations, we havesignificant flexibility to meet our financial commitments. The Company does not typically raise capital through the issuance ofstock. Instead, we use debt financing to lower our overall cost of capital and increase our return on shareowners’ equity. Refer tothe heading ‘‘Cash Flows from Financing Activities’’ below. We have a history of borrowing funds domestically and continue tohave the ability to borrow funds domestically at reasonable interest rates. Our debt financing includes the use of an extensivecommercial paper program as part of our overall cash management strategy. The Company reviews its optimal mix of short-termand long-term debt regularly and may replace certain amounts of commercial paper, short-term debt and current maturities oflong-term debt with new issuances of long-term debt in the future. In addition to the Company’s cash balances, commercial paperprogram, and our ability to issue long-term debt, we also had $6,314 million in lines of credit for general corporate purposes as ofDecember 31, 2012. These backup lines of credit expire at various times from 2013 through 2017.
We have significant operations outside the United States. Unit case volume outside the United States represented approximately80 percent of the Company’s worldwide unit case volume in 2012. We earn a substantial amount of our consolidated operatingincome and income before income taxes in foreign subsidiaries that either sell concentrate to our local bottling partners or, incertain instances, sell finished products directly to our customers to fulfill the demand for Company beverage products outsidethe United States. A significant portion of these foreign earnings is considered to be indefinitely reinvested in foreignjurisdictions. The Company’s cash, cash equivalents, short-term investments and marketable securities held by our foreignsubsidiaries totaled $15.3 billion as of December 31, 2012. With the exception of an insignificant amount, for which U.S.
64
federal and state income taxes have already been provided, we do not intend, nor do we foresee a need, to repatriate these funds.Additionally, the absence of a government-approved mechanism to convert local currency into U.S. dollars in Argentina andVenezuela restricts the Company’s ability to pay dividends from these locations. As of December 31, 2012, the Company’ssubsidiaries in Argentina and Venezuela held $247 million and $353 million, respectively, of cash, cash equivalents, short-terminvestments and marketable securities. Subsequent to December 31, 2012, the Venezuelan government devalued its currency,which will result in the Company remeasuring the net assets of our subsidiary in Venezuela. Based on the carrying value of ourassets and liabilities denominated in Venezuelan bolivar as of December 31, 2012, we anticipate recognizing a remeasurement lossof $100 million to $125 million during the first quarter of 2013.
Net operating revenues in the United States were $19.7 billion in 2012, or 41 percent of the Company’s consolidated netoperating revenues. We expect existing domestic cash, cash equivalents, short-term investments, marketable securities, cash flowsfrom operations and the issuance of domestic debt to continue to be sufficient to fund our domestic operating activities and cashcommitments for investing and financing activities. In addition, we expect existing foreign cash, cash equivalents, short-terminvestments, marketable securities and cash flows from operations to continue to be sufficient to fund our foreign operatingactivities and cash commitments for investing activities.
In the future, should we require more capital to fund significant discretionary activities in the United States than is generated byour domestic operations, or is available through the issuance of domestic debt, we could elect to repatriate future periods’earnings from foreign jurisdictions. This alternative could result in a higher effective tax rate. While the likelihood is remote, theCompany could also elect to repatriate earnings from foreign jurisdictions that have previously been considered to be indefinitelyreinvested. Upon distribution of those earnings in the form of dividends or otherwise, the Company would be subject to additionalU.S. income taxes (net of an adjustment for foreign tax credits) and withholding taxes payable to various foreign jurisdictions,where applicable. This alternative could also result in a higher effective tax rate in the period in which such a determination ismade to repatriate prior period foreign earnings. Refer to Note 14 of Notes to Consolidated Financial Statements for furtherinformation related to our income taxes and undistributed earnings of the Company’s foreign subsidiaries.
Based on all the aforementioned factors, the Company believes its current liquidity position is strong, and we will continue tomeet all of our financial commitments for the foreseeable future. These commitments include, but are not limited to, regularquarterly dividends, debt maturities, capital expenditures, share repurchases and other obligations included under the heading‘‘Off-Balance Sheet Agreements and Aggregate Contractual Obligations’’ below.
Cash Flows from Operating Activities
Net cash provided by operating activities for the years ended December 31, 2012, 2011 and 2010 was $10,645 million,$9,474 million and $9,532 million, respectively.
Cash flows from operating activities increased $1,171 million, or 12 percent, in 2012 compared to 2011. This increase reflectshigher receipts from customers, lower tax payments and the favorable impact of the Company discontinuing its temporaryextension of credit terms in Japan. The favorable impact of the previous items was partially offset by the unfavorable impact offoreign currency fluctuations and an increase in contributions to our pension plans.
The Company discontinued the temporary extension of its credit terms in Japan during the first quarter of 2012. We originallyextended our credit terms in Japan during the second quarter of 2011 as a result of the natural disasters that devastated portionsof the country on March 11, 2011. This change resulted in an increase in cash from operations during the year endedDecember 31, 2012.
Cash flows from operating activities decreased $58 million, or 1 percent, in 2011 compared to 2010. This decrease was primarilyattributable to an increase in contributions to our pension plans of $924 million during 2011, compared to contributions of$77 million in 2010; the temporary extension of the Company’s credit terms in Japan as a result of the natural disasters thatdevastated the northern and eastern portions of the country during the first quarter of 2011; an increase in interest paymentsrelated to long-term debt; and an increase in cash payments related to our productivity, integration and restructuring initiatives.The unfavorable impact of these items was partially offset by an increase in cash receipts from customers, a decrease in taxpayments, and the favorable impact of foreign currency exchange rates on operations. Refer to the heading ‘‘Net OperatingRevenues’’ above.
65

Cash Flows from Investing Activities
Our cash flows provided by (used in) investing activities are summarized as follows (in millions):
Year Ended December 31, 2012 2011 2010
Purchases of short-term investments $ (9,590) $ (4,057) $ (4,579)Proceeds from disposals of short-term investments 5,622 5,647 4,032Acquisitions and investments (1,535) (977) (2,511)Purchases of other investments (5,266) (787) (132)Proceeds from disposals of bottling companies and other investments 2,189 562 972Purchases of property, plant and equipment (2,780) (2,920) (2,215)Proceeds from disposals of property, plant and equipment 143 101 134Other investing activities (187) (93) (106)
Net cash provided by (used in) investing activities $ (11,404) $ (2,524) $ (4,405)
Net cash used in investing activities increased $8,880 million in 2012 compared to 2011. This increase was primarily related to achange in the Company’s overall cash management program. In an effort to manage counterparty risk and diversify our assets,the Company began to make additional investments in high-quality securities. These investments are primarily classified asavailable-for-sale securities. Refer to Note 3 of Notes to Consolidated Financial Statements for additional information. Refer tothe headings ‘‘Short-Term Investments,’’ ‘‘Purchases of Other Investments’’ and ‘‘Proceeds from Disposals of Bottling Companiesand Other Investments’’ below for the impact this change had on our consolidated statements of cash flows. Refer to the heading‘‘Overview of Financial Position’’ below for the impact this change had on our consolidated balance sheets.
Short-Term Investments
In 2012, purchases of short-term investments were $9,590 million, and proceeds from disposals of short-term investments were$5,622 million. This activity resulted in a net cash outflow of $3,968 million during 2012. In 2011, purchases of short-terminvestments were $4,057 million and proceeds from disposals of short-term investments were $5,647 million, resulting in a net cashinflow of $1,590 million. In 2010, purchases of short-term investments were $4,579 million and proceeds from disposals ofshort-term investments were $4,032 million, resulting in a net cash outflow of $547 million. These short-term investments are timedeposits that have maturities of greater than three months but less than one year and are classified in the line item short-terminvestments in our consolidated balance sheets.
Acquisitions and Investments
In 2012, the Company’s acquisition and investment activities totaled $1,535 million. These activities were primarily related tothe following: our investments in the existing beverage business of Aujan, one of the largest independent beverage companies inthe Middle East; our investment in Mikuni, a bottling partner located in Japan; our acquisition of Sacramento Coca-ColaBottling Co., Inc. (‘‘Sacramento bottler’’); and our acquisition of bottling operations in Vietnam, Cambodia and Guatemala. Noneof the Company’s other acquisitions or investments were individually significant.
In 2011, the Company’s acquisition and investment activities totaled $977 million. These activities were primarily related to theacquisitions of Great Plains and Honest Tea, Inc. (‘‘Honest Tea’’), and an additional investment in Coca-Cola Central JapanCompany (‘‘Central Japan’’). In addition, the Company’s acquisition and investment activities during 2011 included immaterialcash payments for the finalization of working capital adjustments related to our acquisition of CCE’s former North Americabusiness. Refer to our discussion of this transaction below. None of the Company’s other acquisitions or investments wereindividually significant.
In 2010, our Company’s acquisition and investment activities totaled $2,511 million, which was primarily related to our acquisitionof CCE’s former North America business; DPS license agreements; our acquisition of Nidan, a Russian juice company; and ouradditional investment in Fresh Trading Ltd. (‘‘innocent’’). The Company and the existing shareowners of innocent have a series ofoutstanding put and call options for the Company to potentially acquire the remaining shares not already owned by the Company.The put and call options are exercisable in stages between 2013 and 2014. The Company anticipates acquiring the majority of theremaining outstanding shares in the second quarter of 2013. None of the Company’s other acquisitions or investments wereindividually significant.
Refer to the heading ‘‘Operations Review — Structural Changes, Acquired Brands and New License Agreements’’ above andNote 2 of Notes to Consolidated Financial Statements for additional information related to our acquisitions during the yearsended December 31, 2012, 2011 and 2010.
66

Purchases of Other Investments
In 2012, purchases of other investments were $5,266 million, primarily due to a change in the Company’s overall cashmanagement program. In an effort to manage counterparty risk and diversify our assets, the Company began to make additionalinvestments in high-quality securities. Refer to Note 3 of Notes to Consolidated Financial Statements for additional information.
In 2011, purchases of other investments were $787 million, primarily related to long-term investments made by the Company fornonoperating activities. These investments are primarily classified as available-for-sale securities.
Proceeds from Disposals of Bottling Companies and Other Investments
In 2012, proceeds from disposals of bottling companies and other investments were $2,189 million. These proceeds were primarilyrelated to the sale of investments associated with the Company’s cash and risk management programs and were not related to thedisposal of bottling companies. Refer to Note 2 and Note 3 of Notes to Consolidated Financial Statements for additionalinformation.
In 2011, proceeds from disposals of bottling companies and other investments were $562 million. These proceeds were primarilyrelated to the sale of our investment in Embonor for $394 million. Refer to Note 2 of Notes to Consolidated Financial Statementsfor additional information.
In 2010, proceeds from disposals of bottling companies and other investments were $972 million. These proceeds were primarilyrelated to the sale of our Norwegian and Swedish bottling operations to New CCE for $0.9 billion and the sale of 50 percent ofour investment in Leao Junior for $83 million. Refer to the heading ‘‘Operations Review — Structural Changes, Acquired Brandsand New License Agreements’’ above and Note 2 of Notes to Consolidated Financial Statements for additional information.
Property, Plant and Equipment
Purchases of property, plant and equipment net of disposals for the years ended December 31, 2012, 2011 and 2010 were$2,637 million, $2,819 million and $2,081 million, respectively. Total capital expenditures for property, plant and equipment(including our investments in information technology) and the percentage of such totals by operating segment were as follows(in millions):
Year Ended December 31, 2012 2011 2010
Capital expenditures $ 2,780 $ 2,920 $ 2,215
Eurasia & Africa 3.2% 2.9% 2.7%Europe 1.1 1.3 1.5Latin America 3.2 3.6 4.2North America 52.0 46.7 32.1Pacific 2.5 3.2 4.6Bottling Investments 31.2 35.6 42.5Corporate 6.8 6.7 12.4
We expect our annual 2013 capital expenditures to be approximately $3.0 billion as we continue to make investments to enablegrowth in our business and further enhance our operational effectiveness.
Other Investing Activities
In 2012, other investing activities were primarily related to the Company’s consolidated Philippine and Brazilian bottlingoperations being classified as held for sale as of December 31, 2012. Refer to Note 2 of Notes to Consolidated FinancialStatements for additional information on these transactions. The cash flow impact of these transactions in other investing activitiesrepresents the balance of cash and cash equivalents held by these entities being transferred to assets held for sale.
In 2011, other investing activities were primarily related to the Company’s investments in joint ventures. None of theseinvestments were individually significant.
67
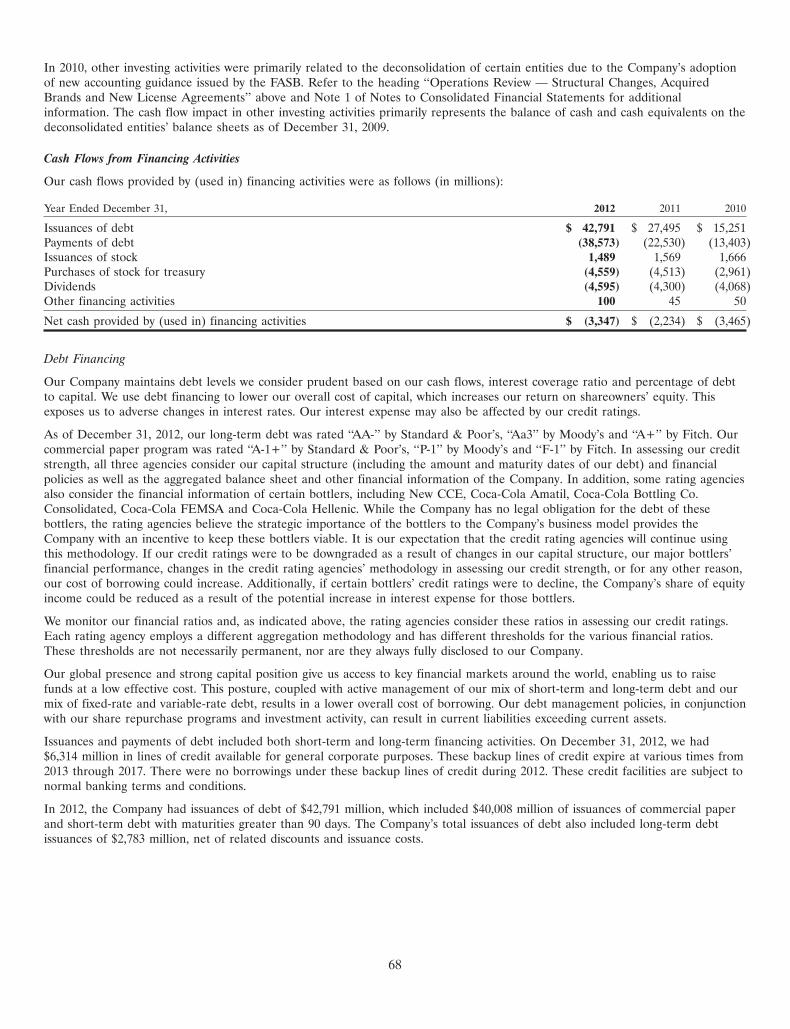
In 2010, other investing activities were primarily related to the deconsolidation of certain entities due to the Company’s adoptionof new accounting guidance issued by the FASB. Refer to the heading ‘‘Operations Review — Structural Changes, AcquiredBrands and New License Agreements’’ above and Note 1 of Notes to Consolidated Financial Statements for additionalinformation. The cash flow impact in other investing activities primarily represents the balance of cash and cash equivalents on thedeconsolidated entities’ balance sheets as of December 31, 2009.
Cash Flows from Financing Activities
Our cash flows provided by (used in) financing activities were as follows (in millions):
Year Ended December 31, 2012 2011 2010
Issuances of debt $ 42,791 $ 27,495 $ 15,251Payments of debt (38,573) (22,530) (13,403)Issuances of stock 1,489 1,569 1,666Purchases of stock for treasury (4,559) (4,513) (2,961)Dividends (4,595) (4,300) (4,068)Other financing activities 100 45 50
Net cash provided by (used in) financing activities $ (3,347) $ (2,234) $ (3,465)
Debt Financing
Our Company maintains debt levels we consider prudent based on our cash flows, interest coverage ratio and percentage of debtto capital. We use debt financing to lower our overall cost of capital, which increases our return on shareowners’ equity. Thisexposes us to adverse changes in interest rates. Our interest expense may also be affected by our credit ratings.
As of December 31, 2012, our long-term debt was rated ‘‘AA-’’ by Standard & Poor’s, ‘‘Aa3’’ by Moody’s and ‘‘A+’’ by Fitch. Ourcommercial paper program was rated ‘‘A-1+’’ by Standard & Poor’s, ‘‘P-1’’ by Moody’s and ‘‘F-1’’ by Fitch. In assessing our creditstrength, all three agencies consider our capital structure (including the amount and maturity dates of our debt) and financialpolicies as well as the aggregated balance sheet and other financial information of the Company. In addition, some rating agenciesalso consider the financial information of certain bottlers, including New CCE, Coca-Cola Amatil, Coca-Cola Bottling Co.Consolidated, Coca-Cola FEMSA and Coca-Cola Hellenic. While the Company has no legal obligation for the debt of thesebottlers, the rating agencies believe the strategic importance of the bottlers to the Company’s business model provides theCompany with an incentive to keep these bottlers viable. It is our expectation that the credit rating agencies will continue usingthis methodology. If our credit ratings were to be downgraded as a result of changes in our capital structure, our major bottlers’financial performance, changes in the credit rating agencies’ methodology in assessing our credit strength, or for any other reason,our cost of borrowing could increase. Additionally, if certain bottlers’ credit ratings were to decline, the Company’s share of equityincome could be reduced as a result of the potential increase in interest expense for those bottlers.
We monitor our financial ratios and, as indicated above, the rating agencies consider these ratios in assessing our credit ratings.Each rating agency employs a different aggregation methodology and has different thresholds for the various financial ratios.These thresholds are not necessarily permanent, nor are they always fully disclosed to our Company.
Our global presence and strong capital position give us access to key financial markets around the world, enabling us to raisefunds at a low effective cost. This posture, coupled with active management of our mix of short-term and long-term debt and ourmix of fixed-rate and variable-rate debt, results in a lower overall cost of borrowing. Our debt management policies, in conjunctionwith our share repurchase programs and investment activity, can result in current liabilities exceeding current assets.
Issuances and payments of debt included both short-term and long-term financing activities. On December 31, 2012, we had$6,314 million in lines of credit available for general corporate purposes. These backup lines of credit expire at various times from2013 through 2017. There were no borrowings under these backup lines of credit during 2012. These credit facilities are subject tonormal banking terms and conditions.
In 2012, the Company had issuances of debt of $42,791 million, which included $40,008 million of issuances of commercial paperand short-term debt with maturities greater than 90 days. The Company’s total issuances of debt also included long-term debtissuances of $2,783 million, net of related discounts and issuance costs.
68
During the first quarter of 2012, the Company issued $2,750 million of long-term debt. The general terms of the notes issued areas follows:
• $1,000 million total principal amount of notes due March 14, 2014, at a variable interest rate equal to the three-monthLondon Interbank Offered Rate (‘‘LIBOR’’) minus 0.05 percent;
• $1,000 million total principal amount of notes due March 13, 2015, at a fixed interest rate of 0.75 percent; and
• $750 million total principal amount of notes due March 14, 2018, at a fixed interest rate of 1.65 percent.
In 2012, the Company had payments of debt of $38,573 million. Total payments of debt included $1,553 million of net payments ofcommercial paper and short-term debt with maturities of 90 days or less, and $35,118 million of payments of commercial paperand short-term debt with maturities greater than 90 days. The Company’s total payments of debt also included long-term debtpayments of $1,902 million.
In 2011, the Company had issuances of debt of $27,495 million, which included $25,219 million of issuances of commercial paperand short-term debt with maturities greater than 90 days. The Company’s total issuances of debt also included long-term debtissuances of $2,276 million, net of the debt issued to exchange a certain amount of our existing long-term debt. The Companyissued $2,979 million of long-term debt during 2011. We used $979 million of this newly issued debt and paid a premium of$208 million to exchange $1,022 million of existing long-term debt that was assumed in connection with our acquisition of CCE’sformer North America business in the fourth quarter of 2010. The remaining cash from the issuance was used to reduce theCompany’s outstanding commercial paper balance and exchange a certain amount of short-term debt.
The general terms of the notes issued during 2011 are as follows:
• $1,655 million total principal amount of notes due September 1, 2016, at a fixed interest rate of 1.8 percent; and
• $1,324 million total principal amount of notes due September 1, 2021, at a fixed interest rate of 3.3 percent.
During the fourth quarter of 2011, the Company extinguished long-term debt that had a carrying value of $20 million and was notscheduled to mature until 2012. This debt was outstanding prior to the Company’s acquisition of CCE’s former North Americabusiness. In addition, the Company repurchased long-term debt during 2011 that was assumed in connection with our acquisitionof CCE’s former North America business. The repurchased debt included $99 million in unamortized fair value adjustmentsrecorded as part of our purchase accounting for the CCE transaction and was settled throughout the year as follows:
• During the first quarter of 2011, the Company repurchased all of our outstanding U.K. pound sterling notes that had acarrying value of $674 million;
• During the second quarter of 2011, the Company repurchased long-term debt that had a carrying value of $42 million; and
• During the third quarter of 2011, the Company repurchased long-term debt that had a carrying value of $19 million.
In 2011, the Company had payments of debt of $22,530 million, including the repurchased debt discussed above. Total paymentsof debt included $91 million of net payments of commercial paper and short-term debt with maturities of 90 days or less, and$20,334 million of payments of commercial paper and short-term debt with maturities greater than 90 days. The Company’s totalpayments of debt also included long-term debt payments of $2,105 million. The Company recorded a net charge of $9 million inthe line item interest expense in our consolidated statement of income during the year ended December 31, 2011. This net chargewas due to the exchange, repurchase and/or extinguishment of long-term debt described above.
In 2010, the Company had issuances of debt of $15,251 million, which included $1,171 million of net issuances of commercialpaper and short-term debt with maturities of 90 days or less, and $9,503 million of issuances of commercial paper and short-termdebt with maturities greater than 90 days. We also assumed $7.9 billion of debt as a result of our acquisition of CCE’s formerNorth America business. In addition, on November 15, 2010, the Company issued $4,500 million of long-term notes. The proceedsfrom the debt issuance were used to repurchase $2,910 million of long-term debt, and the remainder was used to reduce ourcommercial paper balance. The long-term notes issued on November 15, 2010, had the following general terms:
• $1,250 million total principal notes due May 15, 2012, at a variable interest rate of three-month LIBOR plus 0.05 percent;
• $1,250 million total principal notes due November 15, 2013, at a fixed interest rate of 0.75 percent;
• $1,000 million total principal notes due November 15, 2015, at a fixed interest rate of 1.5 percent; and
• $1,000 million total principal notes due November 15, 2020, at a fixed interest rate of 3.15 percent.
69

In 2010, the Company had payments of debt of $13,403 million, including the repurchased long-term debt discussed above. Totalpayments of debt also included $9,667 million related to commercial paper and short-term debt with maturities greater than90 days. The Company recorded a charge of $342 million related to the premiums paid to repurchase the long-term debt and thecosts associated with the settlement of treasury rate locks issued in connection with the debt tender offer.
The carrying value of the Company’s long-term debt included fair value adjustments related to the debt assumed from CCE of$617 million and $733 million as of December 31, 2012 and 2011, respectively. These fair value adjustments are being amortizedover the number of years remaining until the underlying debt matures. As of December 31, 2012, the weighted-average maturityof the assumed debt to which these fair value adjustments relate was approximately 17 years. The amortization of these fair valueadjustments will be a reduction of interest expense in future periods, which will typically result in our interest expense being lessthan the actual interest paid to service the debt. Total interest paid was $574 million, $573 million and $422 million in 2012, 2011and 2010, respectively. Refer to Note 10 of Notes to Consolidated Financial Statements for additional information related to theCompany’s long-term debt balances.
Issuances of Stock
The issuances of stock in 2012, 2011 and 2010 were primarily related to the exercise of stock options by Company employees.
Share Repurchases
On July 20, 2006, the Board of Directors of the Company authorized a share repurchase program of up to 600 million shares ofthe Company’s common stock. The program took effect on October 31, 2006. Although there are approximately 43 million sharesthat may yet be purchased under this share repurchase program, the Board of Directors authorized a new share repurchaseprogram of up to 500 million shares of the Company’s common stock on October 18, 2012. The new share repurchase programwill allow the Company to continue repurchasing shares following the completion of the prior program. The table below presentsannual shares repurchased and average price per share:
Year Ended December 31, 2012 2011 2010
As Adjusted
Number of shares repurchased (in millions) 121 127 98Average price per share $ 37.11 $ 33.73 $ 31.92
Since the inception of our initial share repurchase program in 1984 through our current program as of December 31, 2012, wehave purchased approximately 3.0 billion shares of our Company’s common stock at an average price per share of $12.75. Inaddition to shares repurchased under the stock repurchase plans authorized by our Board of Directors, the Company’s treasurystock activity also includes shares surrendered to the Company to pay the exercise price and/or to satisfy tax withholdingobligations in connection with so-called stock swap exercises of employee stock options and/or the vesting of restricted stockissued to employees. In 2012, we repurchased $4.5 billion of our stock. However, due to the timing of settlements, the totalamount of treasury stock purchases that settled during 2012 was $4.6 billion, which includes treasury stock that was purchased andsettled during 2012 as well as treasury stock purchased in December 2011 that settled in early 2012. The net impact of theCompany’s treasury stock issuance and purchase activities in 2012 resulted in a net cash outflow of $3.1 billion. We currentlyexpect to repurchase an additional $3.0 billion to $3.5 billion of our stock during 2013, net of proceeds from the issuance of stockdue to the exercise of employee stock options.
Dividends
At its February 2013 meeting, our Board of Directors increased our quarterly dividend by 10 percent, raising it to $0.28 per share,equivalent to a full year dividend of $1.12 per share in 2013. This is our 51st consecutive annual increase. Our annual commonstock dividend was $1.02 per share, $0.94 per share and $0.88 per share in 2012, 2011 and 2010, respectively. The 2012 dividendrepresented an 8.5 percent increase from 2011, and the 2011 dividend represented a 7 percent increase from 2010.
70
Off-Balance Sheet Arrangements and Aggregate Contractual Obligations
Off-Balance Sheet Arrangements
In accordance with the definition under SEC rules, the following qualify as off-balance sheet arrangements:
• any obligation under certain guarantee contracts;
• a retained or contingent interest in assets transferred to an unconsolidated entity or similar arrangement that serves ascredit, liquidity or market risk support to that entity for such assets;
• any obligation under certain derivative instruments; and
• any obligation arising out of a material variable interest held by the registrant in an unconsolidated entity that providesfinancing, liquidity, market risk or credit risk support to the registrant, or engages in leasing, hedging or research anddevelopment services with the registrant.
As of December 31, 2012, we were contingently liable for guarantees of indebtedness owed by third parties of $671 million, ofwhich $294 million was related to VIEs. These guarantees are primarily related to third-party customers, bottlers, vendors andcontainer manufacturing operations and have arisen through the normal course of business. These guarantees have various terms,and none of these guarantees were individually significant. The amount represents the maximum potential future payments thatwe could be required to make under the guarantees; however, we do not consider it probable that we will be required to satisfythese guarantees. Management concluded that the likelihood of any significant amounts being paid by our Company under theseguarantees is not probable. As of December 31, 2012, we were not directly liable for the debt of any unconsolidated entity, andwe did not have any retained or contingent interest in assets as defined above.
Our Company recognizes all derivatives as either assets or liabilities at fair value in our consolidated balance sheets. Refer toNote 5 of Notes to Consolidated Financial Statements.
As of December 31, 2012, the Company had $6,314 million in lines of credit for general corporate purposes. These backup linesof credit expire at various times from 2013 through 2017. There were no borrowings under these backup lines of credit during2012. These credit facilities are subject to normal banking terms and conditions. Some of the financial arrangements requirecompensating balances, none of which are presently significant to our Company.
71
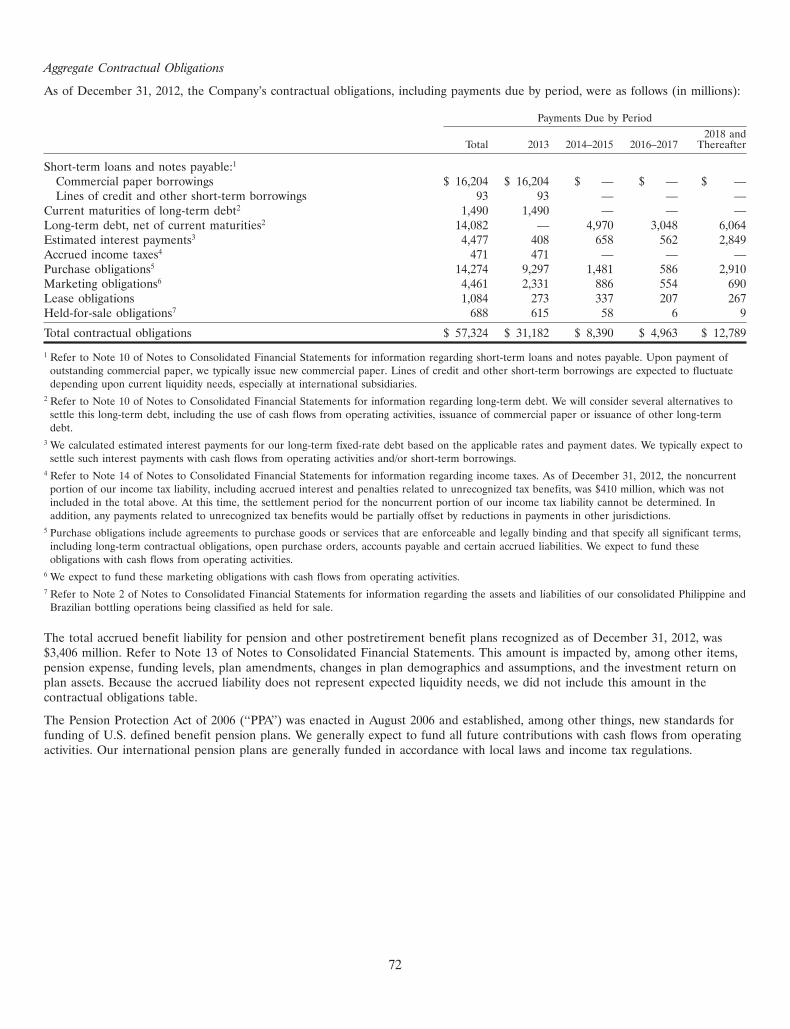
Aggregate Contractual Obligations
As of December 31, 2012, the Company’s contractual obligations, including payments due by period, were as follows (in millions):
Payments Due by Period2018 and
Total 2013 2014–2015 2016–2017 Thereafter
Short-term loans and notes payable:1
Commercial paper borrowings $ 16,204 $ 16,204 $ — $ — $ —Lines of credit and other short-term borrowings 93 93 — — —
Current maturities of long-term debt2 1,490 1,490 — — —Long-term debt, net of current maturities2 14,082 — 4,970 3,048 6,064Estimated interest payments3 4,477 408 658 562 2,849Accrued income taxes4 471 471 — — —Purchase obligations5 14,274 9,297 1,481 586 2,910Marketing obligations6 4,461 2,331 886 554 690Lease obligations 1,084 273 337 207 267Held-for-sale obligations7 688 615 58 6 9
Total contractual obligations $ 57,324 $ 31,182 $ 8,390 $ 4,963 $ 12,789
1 Refer to Note 10 of Notes to Consolidated Financial Statements for information regarding short-term loans and notes payable. Upon payment ofoutstanding commercial paper, we typically issue new commercial paper. Lines of credit and other short-term borrowings are expected to fluctuatedepending upon current liquidity needs, especially at international subsidiaries.
2 Refer to Note 10 of Notes to Consolidated Financial Statements for information regarding long-term debt. We will consider several alternatives tosettle this long-term debt, including the use of cash flows from operating activities, issuance of commercial paper or issuance of other long-termdebt.
3 We calculated estimated interest payments for our long-term fixed-rate debt based on the applicable rates and payment dates. We typically expect tosettle such interest payments with cash flows from operating activities and/or short-term borrowings.
4 Refer to Note 14 of Notes to Consolidated Financial Statements for information regarding income taxes. As of December 31, 2012, the noncurrentportion of our income tax liability, including accrued interest and penalties related to unrecognized tax benefits, was $410 million, which was notincluded in the total above. At this time, the settlement period for the noncurrent portion of our income tax liability cannot be determined. Inaddition, any payments related to unrecognized tax benefits would be partially offset by reductions in payments in other jurisdictions.
5 Purchase obligations include agreements to purchase goods or services that are enforceable and legally binding and that specify all significant terms,including long-term contractual obligations, open purchase orders, accounts payable and certain accrued liabilities. We expect to fund theseobligations with cash flows from operating activities.
6 We expect to fund these marketing obligations with cash flows from operating activities.7 Refer to Note 2 of Notes to Consolidated Financial Statements for information regarding the assets and liabilities of our consolidated Philippine and
Brazilian bottling operations being classified as held for sale.
The total accrued benefit liability for pension and other postretirement benefit plans recognized as of December 31, 2012, was$3,406 million. Refer to Note 13 of Notes to Consolidated Financial Statements. This amount is impacted by, among other items,pension expense, funding levels, plan amendments, changes in plan demographics and assumptions, and the investment return onplan assets. Because the accrued liability does not represent expected liquidity needs, we did not include this amount in thecontractual obligations table.
The Pension Protection Act of 2006 (‘‘PPA’’) was enacted in August 2006 and established, among other things, new standards forfunding of U.S. defined benefit pension plans. We generally expect to fund all future contributions with cash flows from operatingactivities. Our international pension plans are generally funded in accordance with local laws and income tax regulations.
72
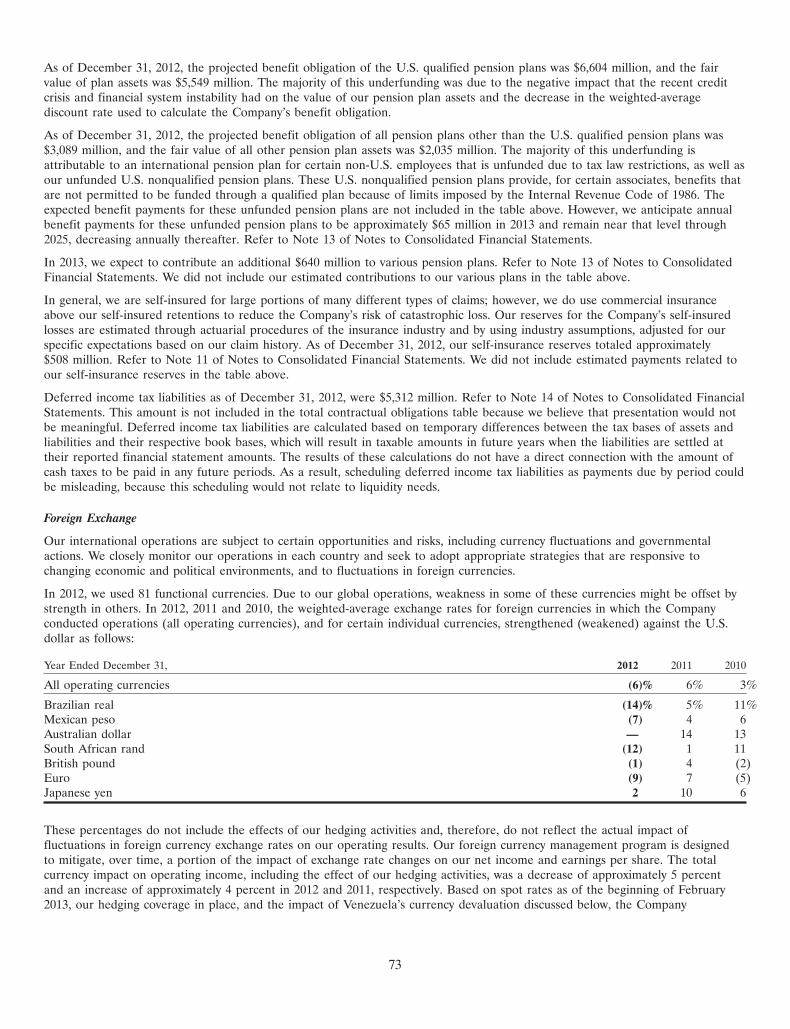
As of December 31, 2012, the projected benefit obligation of the U.S. qualified pension plans was $6,604 million, and the fairvalue of plan assets was $5,549 million. The majority of this underfunding was due to the negative impact that the recent creditcrisis and financial system instability had on the value of our pension plan assets and the decrease in the weighted-averagediscount rate used to calculate the Company’s benefit obligation.
As of December 31, 2012, the projected benefit obligation of all pension plans other than the U.S. qualified pension plans was$3,089 million, and the fair value of all other pension plan assets was $2,035 million. The majority of this underfunding isattributable to an international pension plan for certain non-U.S. employees that is unfunded due to tax law restrictions, as well asour unfunded U.S. nonqualified pension plans. These U.S. nonqualified pension plans provide, for certain associates, benefits thatare not permitted to be funded through a qualified plan because of limits imposed by the Internal Revenue Code of 1986. Theexpected benefit payments for these unfunded pension plans are not included in the table above. However, we anticipate annualbenefit payments for these unfunded pension plans to be approximately $65 million in 2013 and remain near that level through2025, decreasing annually thereafter. Refer to Note 13 of Notes to Consolidated Financial Statements.
In 2013, we expect to contribute an additional $640 million to various pension plans. Refer to Note 13 of Notes to ConsolidatedFinancial Statements. We did not include our estimated contributions to our various plans in the table above.
In general, we are self-insured for large portions of many different types of claims; however, we do use commercial insuranceabove our self-insured retentions to reduce the Company’s risk of catastrophic loss. Our reserves for the Company’s self-insuredlosses are estimated through actuarial procedures of the insurance industry and by using industry assumptions, adjusted for ourspecific expectations based on our claim history. As of December 31, 2012, our self-insurance reserves totaled approximately$508 million. Refer to Note 11 of Notes to Consolidated Financial Statements. We did not include estimated payments related toour self-insurance reserves in the table above.
Deferred income tax liabilities as of December 31, 2012, were $5,312 million. Refer to Note 14 of Notes to Consolidated FinancialStatements. This amount is not included in the total contractual obligations table because we believe that presentation would notbe meaningful. Deferred income tax liabilities are calculated based on temporary differences between the tax bases of assets andliabilities and their respective book bases, which will result in taxable amounts in future years when the liabilities are settled attheir reported financial statement amounts. The results of these calculations do not have a direct connection with the amount ofcash taxes to be paid in any future periods. As a result, scheduling deferred income tax liabilities as payments due by period couldbe misleading, because this scheduling would not relate to liquidity needs.
Foreign Exchange
Our international operations are subject to certain opportunities and risks, including currency fluctuations and governmentalactions. We closely monitor our operations in each country and seek to adopt appropriate strategies that are responsive tochanging economic and political environments, and to fluctuations in foreign currencies.
In 2012, we used 81 functional currencies. Due to our global operations, weakness in some of these currencies might be offset bystrength in others. In 2012, 2011 and 2010, the weighted-average exchange rates for foreign currencies in which the Companyconducted operations (all operating currencies), and for certain individual currencies, strengthened (weakened) against the U.S.dollar as follows:
Year Ended December 31, 2012 2011 2010
All operating currencies (6)% 6% 3%
Brazilian real (14)% 5% 11%Mexican peso (7) 4 6Australian dollar — 14 13South African rand (12) 1 11British pound (1) 4 (2)Euro (9) 7 (5)Japanese yen 2 10 6
These percentages do not include the effects of our hedging activities and, therefore, do not reflect the actual impact offluctuations in foreign currency exchange rates on our operating results. Our foreign currency management program is designedto mitigate, over time, a portion of the impact of exchange rate changes on our net income and earnings per share. The totalcurrency impact on operating income, including the effect of our hedging activities, was a decrease of approximately 5 percentand an increase of approximately 4 percent in 2012 and 2011, respectively. Based on spot rates as of the beginning of February2013, our hedging coverage in place, and the impact of Venezuela’s currency devaluation discussed below, the Company
73

expects currencies to have a 4 percent negative impact on operating income for the first quarter of 2013 and a 1 percent negativeimpact on operating income for the full year of 2013.
Foreign currency exchange gains and losses are primarily the result of the remeasurement of monetary assets and liabilities fromcertain currencies into functional currencies. The effects of the remeasurement of these assets and liabilities are partially offset bythe impact of our economic hedging program for certain exposures on our consolidated balance sheets. Refer to Note 5 of Notesto Consolidated Financial Statements. Foreign currency exchange gains and losses are included as a component of other income(loss) — net in our consolidated financial statements. Refer to the heading ‘‘Operations Review — Other Income (Loss) — Net’’above. The Company recorded foreign currency exchange losses of $2 million, $73 million and $148 million in 2012, 2011 and2010, respectively.
Hyperinflationary Economies
Our Company conducts business in more than 200 countries, some of which have been deemed to be hyperinflationary economiesdue to excessively high inflation rates in recent years. These economies create financial exposure to the Company.
In 2010, Venezuela was determined to be a hyperinflationary economy, and the Venezuelan government devalued the bolivar byresetting the official rate of exchange (‘‘official rate’’) from 2.15 bolivars per U.S. dollar to 2.6 bolivars per U.S. dollar foressential goods and 4.3 bolivars per U.S. dollar for nonessential goods. In order to utilize the official rate, entities must seekapproval from the government-operated Foreign Exchange Administration Board (‘‘CADIVI’’). In accordance withhyperinflationary accounting under accounting principles generally accepted in the United States, our local subsidiary was requiredto use the U.S. dollar as its functional currency. As a result, during the first quarter of 2010 we remeasured the net assets of ourVenezuelan subsidiary using the official rate for nonessential goods of 4.3 bolivars per U.S. dollar which resulted in a loss of$103 million. The loss was recorded in the line item other income (loss) — net in our consolidated statement of income. Weclassified the impact of the remeasurement loss in the line item effect of exchange rate changes on cash and cash equivalents inour consolidated statement of cash flows.
In June 2010, the Venezuelan government introduced a newly regulated foreign currency exchange system known as theTransaction System for Foreign Currency Denominated Securities (‘‘SITME’’). This system, which was subject to annual limits,enabled entities domiciled in Venezuela to exchange their bolivars to U.S. dollars through authorized financial institutions(commercial banks, savings and lending institutions, etc.).
In December 2010, the Venezuelan government announced that it was eliminating the official rate of 2.6 bolivars per U.S. dollarfor essential goods. As a result, the only two exchange rates available for remeasuring bolivar-denominated transactions were theofficial rate of 4.3 bolivars per U.S. dollar for nonessential goods and the SITME rate. As discussed above, the Companyremeasured the net assets of our Venezuelan subsidiary using the official rate for nonessential goods of 4.3 bolivars per U.S.dollar starting on January 1, 2010. Therefore, the elimination of the official rate for essential goods had no impact on theremeasurement of the net assets of our Venezuelan subsidiary.
Subsequent to December 31, 2012, the Venezuelan government devalued its currency further to an official rate of 6.3 bolivars perU.S. dollar. The government also announced that it was discontinuing the SITME foreign exchange system. As a result, theCompany will remeasure the net assets of our local subsidiary and recognize the related gains or losses from remeasurement inthe line item other income (loss) — net in our consolidated statement of income. Based on the carrying value of our assets andliabilities denominated in Venezuelan bolivar as of December 31, 2012, we anticipate recognizing a remeasurement loss of$100 million to $125 million during the first quarter of 2013.
The Company will continue to use the official rate to remeasure the net assets of our Venezuelan subsidiary. If the official ratedevalues further, it would result in our Company recognizing additional foreign currency exchange gains or losses in ourconsolidated financial statements. As of December 31, 2012, our Venezuelan subsidiary held monetary assets of approximately$450 million and monetary liabilities of approximately $85 million.
In addition to the foreign currency exchange exposure related to our Venezuelan subsidiary’s net assets, we also sell concentrateto our bottling partner in Venezuela from outside the country. These sales are denominated in U.S. dollars. If we are unable toutilize a government-approved exchange rate mechanism to settle future concentrate sales to our bottling partner in Venezuela,the Company’s outstanding receivables balance related to these sales will continue to increase. In addition, we have certainintangible assets associated with products sold in Venezuela. If the bolivar further devalues, it could result in the impairment ofthese intangible assets. As of December 31, 2012, the carrying value of our accounts receivable from our bottling partner inVenezuela for these concentrate sales and intangible assets associated with products sold in Venezuela totaled $216 million.
The Company will continue to manage its foreign currency exposure to mitigate, over time, a portion of the impact of exchangerate changes on net income and earnings per share.
74

Impact of Inflation and Changing Prices
Inflation affects the way we operate in many markets around the world. In general, we believe that, over time, we are able toincrease prices to counteract the majority of the inflationary effects of increasing costs and to generate sufficient cash flows tomaintain our productive capability.
Overview of Financial Position
The following table illustrates the change in the individual line items of the Company’s consolidated balance sheet (in millions):
Increase PercentDecember 31, 2012 2011 (Decrease) Change
As Adjusted
Cash and cash equivalents $ 8,442 $ 12,803 $ (4,361) (34)%Short-term investments 5,017 1,088 3,929 361Marketable securities 3,092 144 2,948 2,047Trade accounts receivable — net 4,759 4,920 (161) (3)Inventories 3,264 3,092 172 6Prepaid expenses and other assets 2,781 3,450 (669) (19)Assets held for sale 2,973 — 2,973 —Equity method investments 9,216 7,233 1,983 27Other investments, principally bottling companies 1,232 1,141 91 8Other assets 3,585 3,495 90 3Property, plant and equipment — net 14,476 14,939 (463) (3)Trademarks with indefinite lives 6,527 6,430 97 2Bottlers’ franchise rights with indefinite lives 7,405 7,770 (365) (5)Goodwill 12,255 12,219 36 0Other intangible assets 1,150 1,250 (100) (8)
Total assets $ 86,174 $ 79,974 $ 6,200 8%
Accounts payable and accrued expenses $ 8,680 $ 9,009 $ (329) (4)%Loans and notes payable 16,297 12,871 3,426 27Current maturities of long-term debt 1,577 2,041 (464) (23)Accrued income taxes 471 362 109 30Liabilities held for sale 796 — 796 —Long-term debt 14,736 13,656 1,080 8Other liabilities 5,468 5,420 48 1Deferred income taxes 4,981 4,694 287 6
Total liabilities $ 53,006 $ 48,053 $ 4,953 10%
Net assets $ 33,168 $ 31,921 $ 1,2471 4%
1 Includes a decrease in net assets of $144 million resulting from foreign currency translation adjustments in various balance sheet accounts.
The table above includes the impact of the following transactions and events:
• Cash and cash equivalents decreased $4,361 million, or 34 percent, primarily due to a change in the Company’s overall cashmanagement program which resulted in more of our cash balances being transferred into short-term investments as well ashigh-quality marketable securities. As a result of this change in strategy, short-term investments increased $3,929 millionand marketable securities increased $2,948 million. A majority of the Company’s consolidated cash, cash equivalents,short-term investments and marketable securities are held by our foreign subsidiaries.
• Assets held for sale increased $2,973 million due to our consolidated Philippine and Brazilian bottling operations beingclassified as held for sale. Refer to Note 2 of Notes to Consolidated Financial Statements for additional information onthese transactions and their impact on other line items in our consolidated balance sheet as of December 31, 2012.
75

• Equity method investments increased $1,983 million, or 27 percent, primarily due to the Company’s new investments inAujan, one of the largest independent beverage companies in the Middle East, and Mikuni, a bottling partner located inJapan. The increase was also due to the impact of the merger of Andina and Polar, foreign currency translationadjustments and additional equity income recorded during 2012.
• Loans and notes payable increased $3,426 million, or 27 percent, primarily due to an increase in the Company’s commercialpaper balance.
• Liabilities held for sale increased $796 million due to our consolidated Philippine and Brazilian bottling operations beingclassified as held for sale. Refer to Note 2 of Notes to Consolidated Financial Statements for additional information onthese transactions and their impact on other line items in our consolidated balance sheet as of December 31, 2012.
• Long-term debt increased $1,080 million, or 8 percent, primarily due to the Company’s issuance of long-term debt duringthe first quarter of 2012. Refer to the heading ‘‘Cash Flows from Financing Activities’’ above and Note 10 of Notes toConsolidated Financial Statements for additional information on our long-term debt balance.
ITEM 7A. QUANTITATIVE AND QUALITATIVE DISCLOSURES ABOUT MARKET RISK
Our Company uses derivative financial instruments primarily to reduce our exposure to adverse fluctuations in foreign currencyexchange rates, interest rates, commodity prices and other market risks. We do not enter into derivative financial instruments fortrading purposes. As a matter of policy, all of our derivative positions are used to reduce risk by hedging an underlying economicexposure. Because of the high correlation between the hedging instrument and the underlying exposure, fluctuations in the valueof the instruments are generally offset by reciprocal changes in the value of the underlying exposure. The Company generallyhedges anticipated exposures up to 36 months in advance; however, the majority of our derivative instruments expire within24 months or less. Virtually all of our derivatives are straightforward over-the-counter instruments with liquid markets.
We monitor our exposure to financial market risks using several objective measurement systems. In prior years, the Companyprimarily used the value at risk methodology for its quantitative and qualitative disclosures about market risk. However, with theCompany’s acquisition of CCE’s former North America business in 2010, and the related changes to our consolidated balancesheet, the Company has provided a sensitivity analysis to measure our exposure to fluctuations in foreign currency exchange rates,interest rates and commodity prices. Refer to Note 5 of the Notes to Consolidated Financial Statements for additional informationabout our hedging transactions and derivative financial instruments.
Foreign Currency Exchange Rates
We manage most of our foreign currency exposures on a consolidated basis, which allows us to net certain exposures and takeadvantage of any natural offsets. In 2012, we used 81 functional currencies and generated $28,285 million of our net operatingrevenues from operations outside the United States; therefore, weakness in one particular currency might be offset by strength inother currencies over time. We use derivative financial instruments to further reduce our net exposure to foreign currencyfluctuations.
Our Company enters into forward exchange contracts and purchases currency options (principally euro and Japanese yen) andcollars to hedge certain portions of forecasted cash flows denominated in foreign currencies. Additionally, we enter into forwardexchange contracts to offset the earnings impact related to foreign currency fluctuations on certain monetary assets and liabilities.We also enter into forward exchange contracts as hedges of net investments in international operations.
The total notional value of our foreign currency derivatives was $11,148 million and $10,469 million as of December 31, 2012 and2011, respectively. This total includes derivative instruments that are designated and qualify for hedge accounting as well aseconomic hedges. The fair value of the contracts that qualify for hedge accounting resulted in an asset of $94 million as ofDecember 31, 2012. At the end of 2012, we estimate that an unfavorable 10 percent change in the foreign currency exchange rateswould have eliminated the net unrealized gain and created an unrealized loss of $254 million. The fair value of the contracts thatdo not qualify for hedge accounting resulted in an asset of $36 million, and we estimate that an unfavorable 10 percent change inrates would have increased our net losses by $372 million. All losses were offset by changes in the underlying hedged item,resulting in no net material impact on earnings.
76

Interest Rates
The Company is subject to interest rate volatility with regard to existing and future issuances of debt. We monitor our mix offixed-rate and variable-rate debt, as well as our mix of short-term debt versus long-term debt. From time to time, we enter intointerest rate swap agreements to manage our exposure to interest rate fluctuations.
Based on the Company’s variable-rate debt and derivative instruments outstanding as of December 31, 2012, a 1 percentage pointincrease in interest rates would have increased interest expense by $101 million in 2012. However, this increase in interest expensewould have been partially offset by the increase in interest income related to higher interest rates.
In 2012, we changed our overall cash management program and made additional investments in highly liquid debt securities. As aresult, we are exposed to interest rate risk related to these investments. These investments are primarily managed by externalmanagers within the guidelines of the Company’s investment policy. Our policy requires investments to be investment grade, withthe primary objective of minimizing the potential risk of principal loss. In addition, our policy limits the amount of credit exposureto any one issuer. We estimate that a 1 percent increase in interest rates would result in a $36 million decrease in the fair marketvalue of the portfolio.
Commodity Prices
The Company is subject to market risk with respect to commodity price fluctuations, principally related to our purchases ofaluminum and plastic, sweeteners and energy. Whenever possible, we manage our exposure to commodity risks primarily throughthe use of supplier pricing agreements that enable us to establish the purchase prices for certain inputs that are used in ourmanufacturing and distribution business. We also use derivative financial instruments to manage our exposure to commodity risksat times. Certain of these derivatives do not qualify for hedge accounting, but they are effective economic hedges that help theCompany mitigate the price risk associated with the purchases of materials used in our manufacturing processes and the fuel usedto operate our extensive vehicle fleet.
Open commodity derivatives that qualify for hedge accounting had a notional value of $17 million and $26 million as ofDecember 31, 2012 and 2011, respectively. These contracts resulted in a liability of $1 million. The potential change in fair valueof these commodity derivative instruments, assuming a 10 percent decrease in underlying commodity prices, would have increasedour net loss by $2 million.
Open commodity derivatives that do not qualify for hedge accounting had a notional value of $1,084 million and $1,165 million asof December 31, 2012 and 2011, respectively. These contracts had a fair value of $28 million. The potential change in fair value ofthese commodity derivative instruments, assuming a 10 percent decrease in underlying commodity prices, would have eliminatedour net unrealized gain and created an unrealized loss of $142 million.
77

ITEM 8. FINANCIAL STATEMENTS AND SUPPLEMENTARY DATA
TABLE OF CONTENTS
Page
Consolidated Statements of Income . . . . . . . . . . . . . . . . . . . . . . . . . . . . . . . . . . . . . . . . . . . . . . . . . . . . . . . . . . . . . 79
Consolidated Statements of Comprehensive Income . . . . . . . . . . . . . . . . . . . . . . . . . . . . . . . . . . . . . . . . . . . . . . . . . . 80
Consolidated Balance Sheets . . . . . . . . . . . . . . . . . . . . . . . . . . . . . . . . . . . . . . . . . . . . . . . . . . . . . . . . . . . . . . . . . . 81
Consolidated Statements of Cash Flows . . . . . . . . . . . . . . . . . . . . . . . . . . . . . . . . . . . . . . . . . . . . . . . . . . . . . . . . . . 82
Consolidated Statements of Shareowners’ Equity . . . . . . . . . . . . . . . . . . . . . . . . . . . . . . . . . . . . . . . . . . . . . . . . . . . . 83
Notes to Consolidated Financial Statements . . . . . . . . . . . . . . . . . . . . . . . . . . . . . . . . . . . . . . . . . . . . . . . . . . . . . . . . 84
Report of Management . . . . . . . . . . . . . . . . . . . . . . . . . . . . . . . . . . . . . . . . . . . . . . . . . . . . . . . . . . . . . . . . . . . . . . 150
Report of Independent Registered Public Accounting Firm . . . . . . . . . . . . . . . . . . . . . . . . . . . . . . . . . . . . . . . . . . . . . 152
Report of Independent Registered Public Accounting Firm on Internal Control Over Financial Reporting . . . . . . . . . . . . . 153
Quarterly Data (Unaudited) . . . . . . . . . . . . . . . . . . . . . . . . . . . . . . . . . . . . . . . . . . . . . . . . . . . . . . . . . . . . . . . . . . 154
78

THE COCA-COLA COMPANY AND SUBSIDIARIES
CONSOLIDATED STATEMENTS OF INCOME
Year Ended December 31, 2012 2011 2010
(In millions except per share data) As Adjusted
NET OPERATING REVENUES $ 48,017 $ 46,542 $ 35,119Cost of goods sold 19,053 18,215 12,693
GROSS PROFIT 28,964 28,327 22,426Selling, general and administrative expenses 17,738 17,422 13,194Other operating charges 447 732 819
OPERATING INCOME 10,779 10,173 8,413Interest income 471 483 317Interest expense 397 417 733Equity income (loss) — net 819 690 1,025Other income (loss) — net 137 529 5,185
INCOME BEFORE INCOME TAXES 11,809 11,458 14,207Income taxes 2,723 2,812 2,370
CONSOLIDATED NET INCOME 9,086 8,646 11,837Less: Net income attributable to noncontrolling interests 67 62 50
NET INCOME ATTRIBUTABLE TO SHAREOWNERS OF THE COCA-COLA COMPANY $ 9,019 $ 8,584 $ 11,787
BASIC NET INCOME PER SHARE1 $ 2.00 $ 1.88 $ 2.55
DILUTED NET INCOME PER SHARE1 $ 1.97 $ 1.85 $ 2.53
AVERAGE SHARES OUTSTANDING 4,504 4,568 4,616Effect of dilutive securities 80 78 51
AVERAGE SHARES OUTSTANDING ASSUMING DILUTION 4,584 4,646 4,667
1 Calculated based on net income attributable to shareowners of The Coca-Cola Company.
Refer to Notes to Consolidated Financial Statements.
79

THE COCA-COLA COMPANY AND SUBSIDIARIES
CONSOLIDATED STATEMENTS OF COMPREHENSIVE INCOME
Year Ended December 31, 2012 2011 2010(In millions) As Adjusted
CONSOLIDATED NET INCOME $ 9,086 $ 8,646 $ 11,837Other comprehensive income:
Net foreign currency translation adjustment (182) (692) (947)Net gain (loss) on derivatives 99 145 (120)Net unrealized gain (loss) on available-for-sale securities 178 (7) 102Net change in pension and other benefit liabilities (668) (763) 282
TOTAL COMPREHENSIVE INCOME 8,513 7,329 11,154Less: Comprehensive income (loss) attributable to noncontrolling interests 105 10 38
TOTAL COMPREHENSIVE INCOME ATTRIBUTABLE TO SHAREOWNERS OFTHE COCA-COLA COMPANY $ 8,408 $ 7,319 $ 11,116
Refer to Notes to Consolidated Financial Statements.
80
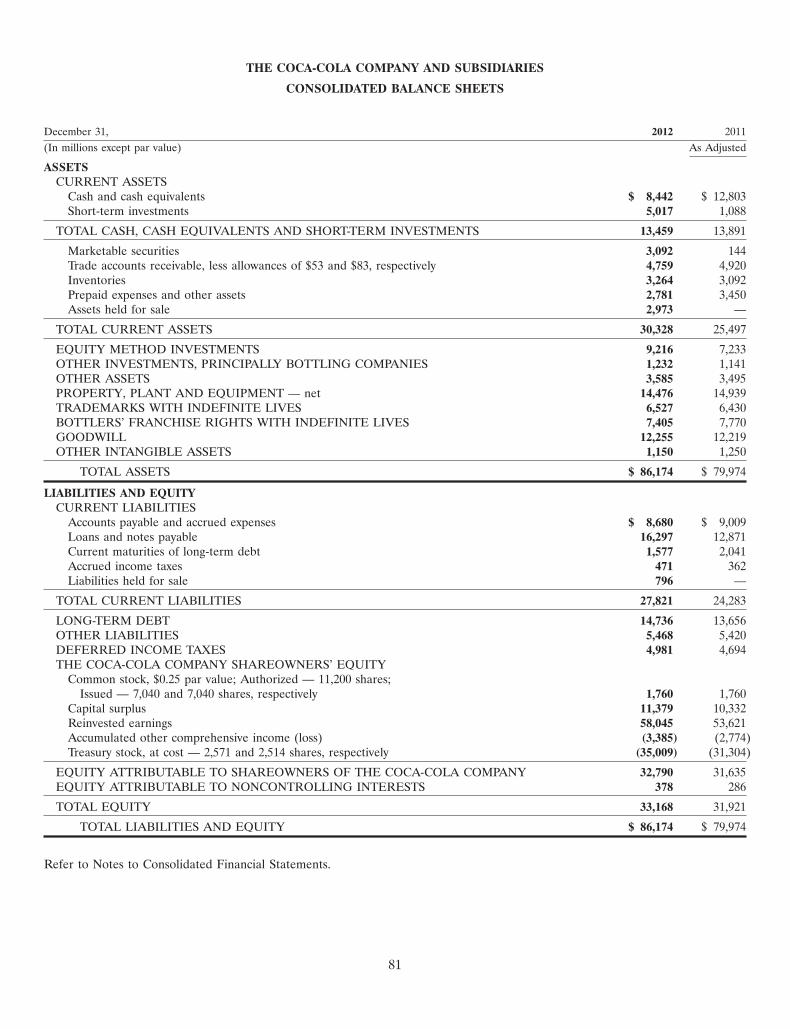
THE COCA-COLA COMPANY AND SUBSIDIARIES
CONSOLIDATED BALANCE SHEETS
December 31, 2012 2011(In millions except par value) As Adjusted
ASSETSCURRENT ASSETS
Cash and cash equivalents $ 8,442 $ 12,803Short-term investments 5,017 1,088
TOTAL CASH, CASH EQUIVALENTS AND SHORT-TERM INVESTMENTS 13,459 13,891
Marketable securities 3,092 144Trade accounts receivable, less allowances of $53 and $83, respectively 4,759 4,920Inventories 3,264 3,092Prepaid expenses and other assets 2,781 3,450Assets held for sale 2,973 —
TOTAL CURRENT ASSETS 30,328 25,497
EQUITY METHOD INVESTMENTS 9,216 7,233OTHER INVESTMENTS, PRINCIPALLY BOTTLING COMPANIES 1,232 1,141OTHER ASSETS 3,585 3,495PROPERTY, PLANT AND EQUIPMENT — net 14,476 14,939TRADEMARKS WITH INDEFINITE LIVES 6,527 6,430BOTTLERS’ FRANCHISE RIGHTS WITH INDEFINITE LIVES 7,405 7,770GOODWILL 12,255 12,219OTHER INTANGIBLE ASSETS 1,150 1,250
TOTAL ASSETS $ 86,174 $ 79,974
LIABILITIES AND EQUITYCURRENT LIABILITIES
Accounts payable and accrued expenses $ 8,680 $ 9,009Loans and notes payable 16,297 12,871Current maturities of long-term debt 1,577 2,041Accrued income taxes 471 362Liabilities held for sale 796 —
TOTAL CURRENT LIABILITIES 27,821 24,283
LONG-TERM DEBT 14,736 13,656OTHER LIABILITIES 5,468 5,420DEFERRED INCOME TAXES 4,981 4,694THE COCA-COLA COMPANY SHAREOWNERS’ EQUITY
Common stock, $0.25 par value; Authorized — 11,200 shares;Issued — 7,040 and 7,040 shares, respectively 1,760 1,760
Capital surplus 11,379 10,332Reinvested earnings 58,045 53,621Accumulated other comprehensive income (loss) (3,385) (2,774)Treasury stock, at cost — 2,571 and 2,514 shares, respectively (35,009) (31,304)
EQUITY ATTRIBUTABLE TO SHAREOWNERS OF THE COCA-COLA COMPANY 32,790 31,635EQUITY ATTRIBUTABLE TO NONCONTROLLING INTERESTS 378 286
TOTAL EQUITY 33,168 31,921
TOTAL LIABILITIES AND EQUITY $ 86,174 $ 79,974
Refer to Notes to Consolidated Financial Statements.
81
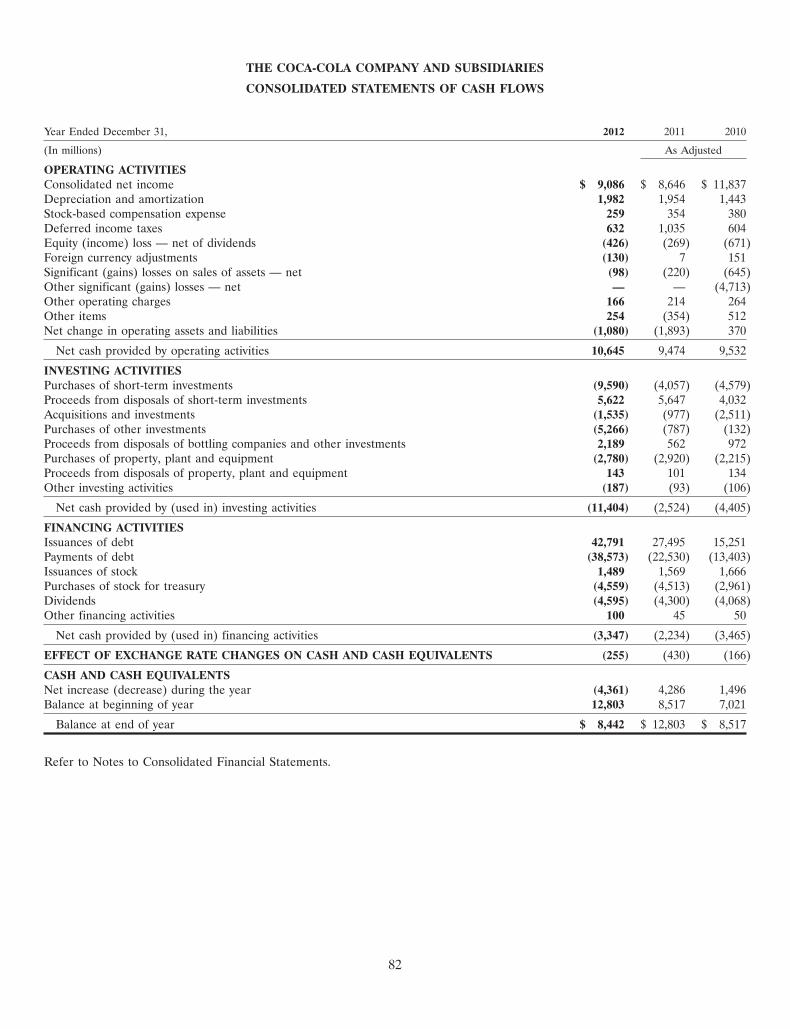
THE COCA-COLA COMPANY AND SUBSIDIARIES
CONSOLIDATED STATEMENTS OF CASH FLOWS
Year Ended December 31, 2012 2011 2010
(In millions) As Adjusted
OPERATING ACTIVITIESConsolidated net income $ 9,086 $ 8,646 $ 11,837Depreciation and amortization 1,982 1,954 1,443Stock-based compensation expense 259 354 380Deferred income taxes 632 1,035 604Equity (income) loss — net of dividends (426) (269) (671)Foreign currency adjustments (130) 7 151Significant (gains) losses on sales of assets — net (98) (220) (645)Other significant (gains) losses — net — — (4,713)Other operating charges 166 214 264Other items 254 (354) 512Net change in operating assets and liabilities (1,080) (1,893) 370
Net cash provided by operating activities 10,645 9,474 9,532
INVESTING ACTIVITIESPurchases of short-term investments (9,590) (4,057) (4,579)Proceeds from disposals of short-term investments 5,622 5,647 4,032Acquisitions and investments (1,535) (977) (2,511)Purchases of other investments (5,266) (787) (132)Proceeds from disposals of bottling companies and other investments 2,189 562 972Purchases of property, plant and equipment (2,780) (2,920) (2,215)Proceeds from disposals of property, plant and equipment 143 101 134Other investing activities (187) (93) (106)
Net cash provided by (used in) investing activities (11,404) (2,524) (4,405)
FINANCING ACTIVITIESIssuances of debt 42,791 27,495 15,251Payments of debt (38,573) (22,530) (13,403)Issuances of stock 1,489 1,569 1,666Purchases of stock for treasury (4,559) (4,513) (2,961)Dividends (4,595) (4,300) (4,068)Other financing activities 100 45 50
Net cash provided by (used in) financing activities (3,347) (2,234) (3,465)
EFFECT OF EXCHANGE RATE CHANGES ON CASH AND CASH EQUIVALENTS (255) (430) (166)
CASH AND CASH EQUIVALENTSNet increase (decrease) during the year (4,361) 4,286 1,496Balance at beginning of year 12,803 8,517 7,021
Balance at end of year $ 8,442 $ 12,803 $ 8,517
Refer to Notes to Consolidated Financial Statements.
82

THE COCA-COLA COMPANY AND SUBSIDIARIES
CONSOLIDATED STATEMENTS OF SHAREOWNERS’ EQUITY
Year Ended December 31, 2012 2011 2010
(In millions except per share data) As Adjusted
EQUITY ATTRIBUTABLE TO SHAREOWNERS OF THE COCA-COLA COMPANYNUMBER OF COMMON SHARES OUTSTANDINGBalance at beginning of year 4,526 4,583 4,605
Purchases of treasury stock (121) (127) (98)Treasury stock issued to employees related to stock compensation plans 64 70 76
Balance at end of year 4,469 4,526 4,583
COMMON STOCK $ 1,760 $ 1,760 $ 1,760
CAPITAL SURPLUSBalance at beginning of year 10,332 9,177 7,657
Stock issued to employees related to stock compensation plans 640 724 855Replacement share-based awards issued in connection with an acquisition — — 237Tax benefit (charge) from employees’ stock option and restricted stock plans 144 79 48Stock-based compensation 259 354 380Other activities 4 (2) —
Balance at end of year 11,379 10,332 9,177
REINVESTED EARNINGSBalance at beginning of year 53,621 49,337 41,618
Net income attributable to shareowners of The Coca-Cola Company 9,019 8,584 11,787Dividends (per share — $1.02, $0.94 and $0.88 in 2012, 2011 and 2010, respectively) (4,595) (4,300) (4,068)
Balance at end of year 58,045 53,621 49,337
ACCUMULATED OTHER COMPREHENSIVE INCOME (LOSS)Balance at beginning of year (2,774) (1,509) (838)
Net other comprehensive income (loss) (611) (1,265) (671)
Balance at end of year (3,385) (2,774) (1,509)
TREASURY STOCKBalance at beginning of year (31,304) (27,762) (25,398)
Stock issued to employees related to stock compensation plans 786 830 824Purchases of treasury stock (4,491) (4,372) (3,188)
Balance at end of year (35,009) (31,304) (27,762)
TOTAL EQUITY ATTRIBUTABLE TO SHAREOWNERS OF THE COCA-COLA COMPANY $ 32,790 $ 31,635 $ 31,003
EQUITY ATTRIBUTABLE TO NONCONTROLLING INTERESTSBalance at beginning of year $ 286 $ 314 $ 547
Net income attributable to noncontrolling interests 67 62 50Net foreign currency translation adjustment 38 (52) (12)Dividends paid to noncontrolling interests (48) (38) (32)Acquisition of interests held by noncontrolling owners (15) — —Contributions by noncontrolling interests — — 1Increase due to business combinations 50 — 13Deconsolidation of certain variable interest entities — — (253)
TOTAL EQUITY ATTRIBUTABLE TO NONCONTROLLING INTERESTS $ 378 $ 286 $ 314
Refer to Notes to Consolidated Financial Statements.
83

THE COCA-COLA COMPANY AND SUBSIDIARIES
NOTES TO CONSOLIDATED FINANCIAL STATEMENTS
NOTE 1: BUSINESS AND SUMMARY OF SIGNIFICANT ACCOUNTING POLICIES
Description of Business
The Coca-Cola Company is the world’s largest beverage company. We own or license and market more than 500 nonalcoholicbeverage brands, primarily sparkling beverages but also a variety of still beverages such as waters, enhanced waters, juices andjuice drinks, ready-to-drink teas and coffees, and energy and sports drinks. We own and market four of the world’s top fivenonalcoholic sparkling beverage brands: Coca-Cola, Diet Coke, Fanta and Sprite. Finished beverage products bearing ourtrademarks, sold in the United States since 1886, are now sold in more than 200 countries.
We make our branded beverage products available to consumers throughout the world through our network of Company-ownedor -controlled bottling and distribution operations, bottling partners, distributors, wholesalers and retailers — the world’s largestbeverage distribution system. Of the approximately 57 billion beverage servings of all types consumed worldwide every day,beverages bearing trademarks owned by or licensed to us account for more than 1.8 billion servings.
On October 2, 2010, we acquired the former North America business of Coca-Cola Enterprises Inc. (‘‘CCE’’), one of our majorbottlers, consisting of CCE’s production, sales and distribution operations in the United States, Canada, the British Virgin Islands,the United States Virgin Islands and the Cayman Islands, and a substantial majority of CCE’s corporate segment. Uponcompletion of the CCE transaction, we combined the management of the acquired North America business with the managementof our existing foodservice business; Minute Maid and Odwalla juice businesses; North America supply chain operations; andCompany-owned bottling operations in Philadelphia, Pennsylvania, into a unified bottling and customer service organization calledCoca-Cola Refreshments (‘‘CCR’’). In addition, we reshaped our remaining Coca-Cola North America (‘‘CCNA’’) operations intoan organization that primarily provides franchise leadership and consumer marketing and innovation for the North Americanmarket.
Our Company markets, manufactures and sells:
• beverage concentrates, sometimes referred to as ‘‘beverage bases,’’ and syrups, including fountain syrups (we refer to thispart of our business as our ‘‘concentrate business’’ or ‘‘concentrate operations’’); and
• finished sparkling and still beverages (we refer to this part of our business as our ‘‘finished product business’’ or ‘‘finishedproduct operations’’).
Generally, finished product operations generate higher net operating revenues but lower gross profit margins than concentrateoperations.
In our concentrate operations, we typically generate net operating revenues by selling concentrates and syrups to authorizedbottling and canning operations (to which we typically refer as our ‘‘bottlers’’ or our ‘‘bottling partners’’). Our bottling partnerseither combine the concentrates with sweeteners (depending on the product), still water and/or sparkling water, or combine thesyrups with sparkling water to produce finished beverages. The finished beverages are packaged in authorized containers bearingour trademarks or trademarks licensed to us — such as cans and refillable and nonrefillable glass and plastic bottles — and arethen sold to retailers directly or, in some cases, through wholesalers or other bottlers. Outside the United States, we also sellconcentrates for fountain beverages to our bottling partners who are typically authorized to manufacture fountain syrups, whichthey sell to fountain retailers such as restaurants and convenience stores which use the fountain syrups to produce beverages forimmediate consumption, or to fountain wholesalers who in turn sell and distribute the fountain syrups to fountain retailers.
Our finished product operations consist primarily of the production, sales and distribution operations managed by CCR and ourCompany-owned or -controlled bottling and distribution operations. CCR is included in our North America operating segment,and our Company-owned or -controlled bottling and distribution operations are included in our Bottling Investments operatingsegment. Our finished product operations generate net operating revenues by selling sparkling beverages and a variety of stillbeverages, such as juices and juice drinks, energy and sports drinks, ready-to-drink teas and coffees, and certain water products, toretailers or to distributors, wholesalers and bottling partners who distribute them to retailers. In addition, in the United States, wemanufacture fountain syrups and sell them to fountain retailers, such as restaurants and convenience stores who use the fountainsyrups to produce beverages for immediate consumption, or to authorized fountain wholesalers or bottling partners who resell thefountain syrups to fountain retailers. In the United States, we authorize wholesalers to resell our fountain syrups throughnonexclusive appointments that neither restrict us in setting the prices at which we sell fountain syrups to the wholesalers norrestrict the territories in which the wholesalers may resell in the United States.
84

Summary of Significant Accounting Policies
Basis of Presentation
Our consolidated financial statements are prepared in accordance with accounting principles generally accepted in the UnitedStates. The preparation of our consolidated financial statements requires us to make estimates and assumptions that affect thereported amounts of assets, liabilities, revenues and expenses and the disclosure of contingent assets and liabilities in ourconsolidated financial statements and accompanying notes. Although these estimates are based on our knowledge of currentevents and actions we may undertake in the future, actual results may ultimately differ from these estimates and assumptions.Furthermore, when testing assets for impairment in future periods, if management uses different assumptions or if differentconditions occur, impairment charges may result.
We use the equity method to account for investments in companies, if our investment provides us with the ability to exercisesignificant influence over operating and financial policies of the investee. Our consolidated net income includes our Company’sproportionate share of the net income or loss of these companies. Our judgment regarding the level of influence over each equitymethod investment includes considering key factors such as our ownership interest, representation on the board of directors,participation in policy-making decisions and material intercompany transactions.
We eliminate from our financial results all significant intercompany transactions, including the intercompany transactions withconsolidated variable interest entities (‘‘VIEs’’) and the intercompany portion of transactions with equity method investees.
Effective January 1, 2012, the Company elected to change our accounting methodology for determining the market-related valueof assets for our U.S. qualified defined benefit pension plans. The market-related value of assets is used to determine theCompany’s expected return on assets, a component of our annual pension expense calculation. The Company previously used asmoothing technique to calculate our market-related value of assets, which reflected changes in the fair value over no more thanfive years. However, we now use the actual fair value of plan assets to determine our expected return on those assets for all ofour defined benefit plans. Although both methods are permitted under accounting principles generally accepted in the UnitedStates, the Company believes our new methodology is preferable as it accelerates the recognition of gains and losses in thedetermination of our annual pension expense. The Company’s change in accounting methodology has been applied retrospectively,and we have adjusted all applicable prior period financial information presented herein as required.
On July 27, 2012, the Company’s certificate of incorporation was amended to increase the number of authorized shares ofcommon stock from 5.6 billion to 11.2 billion and effect a two-for-one stock split of the common stock. The record date for thestock split was July 27, 2012, and the additional shares were distributed on August 10, 2012. Each shareowner of record on theclose of business on the record date received one additional share of common stock for each share held. All share and per sharedata presented herein reflect the impact of the increase in authorized shares and the stock split, as appropriate.
Any prior period amounts that were revised as a result of the changes described above have been labeled ‘‘as adjusted’’ herein.Certain other amounts in the prior years’ consolidated financial statements and notes have been revised to conform to the currentyear presentation.
Principles of Consolidation
Our Company consolidates all entities that we control by ownership of a majority voting interest as well as VIEs for which ourCompany is the primary beneficiary. Generally, we consolidate only business enterprises that we control by ownership of amajority voting interest. However, there are situations in which consolidation is required even though the usual condition ofconsolidation (ownership of a majority voting interest) does not apply. Generally, this occurs when an entity holds an interest inanother business enterprise that was achieved through arrangements that do not involve voting interests, which results in adisproportionate relationship between such entity’s voting interests in, and its exposure to the economic risks and potentialrewards of, the other business enterprise. This disproportionate relationship results in what is known as a variable interest, and theentity in which we have the variable interest is referred to as a ‘‘VIE.’’ An enterprise must consolidate a VIE if it is determined tobe the primary beneficiary of the VIE. The primary beneficiary has both (a) the power to direct the activities of the VIE thatmost significantly impact the entity’s economic performance, and (b) the obligation to absorb losses or the right to receive benefitsfrom the VIE that could potentially be significant to the VIE.
85

Our Company holds interests in certain VIEs, primarily bottling and container manufacturing operations, for which we were notdetermined to be the primary beneficiary. Our variable interests in these VIEs primarily relate to profit guarantees orsubordinated financial support. Refer to Note 11. Although these financial arrangements resulted in us holding variable interestsin these entities, they did not empower us to direct the activities of the VIEs that most significantly impact the VIEs’ economicperformance. Our Company’s investments, plus any loans and guarantees, related to these VIEs totaled $1,776 million and$1,183 million as of December 31, 2012 and 2011, respectively, representing our maximum exposures to loss. The Company’sinvestments, plus any loans and guarantees, related to these VIEs were not significant to the Company’s consolidated financialstatements.
In addition, our Company holds interests in certain VIEs, primarily bottling and container manufacturing operations, for which wewere determined to be the primary beneficiary. As a result, we have consolidated these entities. Our Company’s investments, plusany loans and guarantees, related to these VIEs totaled $234 million and $199 million as of December 31, 2012 and 2011,respectively, representing our maximum exposures to loss. The assets and liabilities of VIEs for which we are the primarybeneficiary were not significant to the Company’s consolidated financial statements.
Creditors of our VIEs do not have recourse against the general credit of the Company, regardless of whether they are accountedfor as consolidated entities.
Assets and Liabilities Held for Sale
Our Company classifies long-lived assets (disposal groups) to be sold as held for sale in the period in which all of the followingcriteria are met: management, having the authority to approve the action, commits to a plan to sell the asset (disposal group); theasset (disposal group) is available for immediate sale in its present condition subject only to terms that are usual and customaryfor sales of such assets (disposal groups); an active program to locate a buyer and other actions required to complete the plan tosell the asset (disposal group) have been initiated; the sale of the asset (disposal group) is probable, and transfer of the asset(disposal group) is expected to qualify for recognition as a completed sale within one year, except if events or circumstancesbeyond our control extend the period of time required to sell the asset (disposal group) beyond one year; the asset (disposalgroup) is being actively marketed for sale at a price that is reasonable in relation to its current fair value; and actions required tocomplete the plan indicate that it is unlikely that significant changes to the plan will be made or that the plan will be withdrawn.
We initially measure a long-lived asset (disposal group) that is classified as held for sale at the lower of its carrying value or fairvalue less any costs to sell. Any loss resulting from this measurement is recognized in the period in which the held-for-sale criteriaare met. Conversely, gains are not recognized on the sale of a long-lived asset (disposal group) until the date of sale. We assessthe fair value of a long-lived asset (disposal group) less any costs to sell each reporting period it remains classified as held for saleand report any subsequent changes as an adjustment to the carrying value of the asset (disposal group), as long as the newcarrying value does not exceed the carrying value of the asset at the time it was initially classified as held for sale.
Upon determining that a long-lived asset (disposal group) meets the criteria to be classified as held for sale, the Company reportsthe assets and liabilities of the disposal group, if material, in the line items assets held for sale and liabilities held for sale,respectively, in our consolidated balance sheet.
Risks and Uncertainties
Factors that could adversely impact the Company’s operations or financial results include, but are not limited to, the following:obesity and other health concerns; water scarcity and poor quality; changes in the nonalcoholic beverage business environmentand retail landscape; increased competition; increased demand for food products and decreased agricultural productivity;consolidation in the retail channel or the loss of key retail or foodservice customers; an inability to expand operations indeveloping and emerging markets; fluctuations in foreign currency exchange rates; interest rate increases; an inability tomaintain good relationships with our bottling partners; a deterioration in our bottling partners’ financial condition; increases inincome tax rates, changes in income tax laws or unfavorable resolution of tax matters; increased or new indirect taxes in theUnited States or in other major markets; increased cost, disruption of supply or shortage of energy or fuels; increased cost,disruption of supply or shortage of ingredients, other raw materials or packaging materials; changes in laws and regulationsrelating to beverage containers and packaging; significant additional labeling or warning requirements or limitations on theavailability of our products; an inability to protect our information systems against service interruption, misappropriation ofdata or breaches of security; unfavorable general economic conditions in the United States; unfavorable economic and politicalconditions in international markets; litigation or legal proceedings; adverse weather conditions; climate change; damage to ourbrand image and corporate reputation from negative publicity related to product safety or quality, human and workplace rights,obesity or other issues, even if unwarranted; changes in, or failure to comply with, the laws and regulations applicable to ourproducts or our business operations; changes in accounting standards; an inability to achieve our overall long-term goals;continuing uncertainty in the global credit markets; one or more of our counterparty financial institutions defaulting on their
86
obligations to us or failing; an inability to realize additional benefits targeted by our productivity and reinvestment program; aninability to renew collective bargaining agreements on satisfactory terms, or we or our bottling partners experience strikes, workstoppages or labor unrest; future impairment charges; future multi-employer plan withdrawal liabilities; an inability to successfullyintegrate and manage our Company-owned or -controlled bottling operations; and global or regional catastrophic events.
Our Company monitors our operations with a view to minimizing the impact to our overall business that could arise as a result ofthe risks and uncertainties inherent in our business.
Revenue Recognition
Our Company recognizes revenue when persuasive evidence of an arrangement exists, delivery of products has occurred, the salesprice charged is fixed or determinable, and collectibility is reasonably assured. For our Company, this generally means that werecognize revenue when title to our products is transferred to our bottling partners, resellers or other customers. In particular,title usually transfers upon shipment to or receipt at our customers’ locations, as determined by the specific sales terms of thetransactions. Our sales terms do not allow for a right of return except for matters related to any manufacturing defects on ourpart.
Deductions from Revenue
Our customers can earn certain incentives including, but not limited to, cash discounts, funds for promotional and marketingactivities, volume-based incentive programs and support for infrastructure programs. The costs associated with these incentives areincluded in deductions from revenue, a component of net operating revenues in our consolidated statements of income. Forcustomer incentives that must be earned, management must make estimates related to the contractual terms, customerperformance and sales volume to determine the total amounts earned and to be recorded in deductions from revenue. In makingthese estimates, management considers past results. The actual amounts ultimately paid may be different from our estimates.
In some situations, the Company may determine it to be advantageous to make advance payments to specific customers to fundcertain marketing activities intended to generate profitable volume and/or invest in infrastructure programs with our bottlers thatare directed at strengthening our bottling system and increasing unit case volume. The Company also makes advance payments tocertain customers for distribution rights. The advance payments made to customers are initially capitalized and included in ourconsolidated balance sheets in prepaid expenses and other assets and noncurrent other assets, depending on the duration of theagreements. The assets are amortized over the applicable periods and included in deductions from revenue. The duration of theseagreements typically ranges from 4 to 10 years.
Amortization expense for infrastructure programs was $86 million, $90 million and $137 million in 2012, 2011 and 2010,respectively. The aggregate deductions from revenue recorded by the Company in relation to these programs, includingamortization expense on infrastructure programs, were $6.1 billion, $5.8 billion and $5.0 billion in 2012, 2011 and 2010,respectively.
Advertising Costs
Our Company expenses production costs of print, radio, television and other advertisements as of the first date the advertisementstake place. All other marketing expenditures are expensed in the annual period in which the expenditure is incurred. Advertisingcosts included in the line item selling, general and administrative expenses in our consolidated statements of income were$3.3 billion, $3.3 billion and $2.9 billion in 2012, 2011 and 2010, respectively. As of December 31, 2012 and 2011, advertising andproduction costs of $295 million and $349 million, respectively, were primarily recorded in the line item prepaid expenses andother assets in our consolidated balance sheets.
For interim reporting purposes, we allocate our estimated full year marketing expenditures that benefit multiple interim periods toeach of our interim reporting periods. We use the proportion of each interim period’s actual unit case volume to the estimatedfull year unit case volume as the basis for the allocation. This methodology results in our marketing expenditures being recognizedat a standard rate per unit case. At the end of each interim reporting period, we review our estimated full year unit case volumeand our estimated full year marketing expenditures in order to evaluate if a change in estimate is necessary. The impact of anychanges in these full year estimates is recognized in the interim period in which the change in estimate occurs. Our full yearmarketing expenditures are not impacted by this interim accounting policy.
87
Shipping and Handling Costs
Shipping and handling costs related to the movement of finished goods from manufacturing locations to our sales distributioncenters are included in the line item cost of goods sold in our consolidated statements of income. Shipping and handling costsincurred to move finished goods from our sales distribution centers to customer locations are included in the line item selling,general and administrative expenses in our consolidated statements of income. As a result of our acquisition of CCE’s formerNorth America business, the amount of shipping and handling costs recorded in the line item selling, general and administrativeexpenses increased significantly in 2011 when compared to 2010. During the years ended December 31, 2012 and 2011, theCompany recorded shipping and handling costs of $2.8 billion and $2.4 billion, respectively, in the line item selling, general andadministrative expenses. Our customers do not pay us separately for shipping and handling costs related to finished goods.
Net Income Per Share
Basic net income per share is computed by dividing net income by the weighted-average number of common shares outstandingduring the reporting period. Diluted net income per share is computed similarly to basic net income per share, except that itincludes the potential dilution that could occur if dilutive securities were exercised. Approximately 34 million, 32 million (asadjusted) and 77 million (as adjusted) stock option awards were excluded from the computations of diluted net income per sharein 2012, 2011 and 2010, respectively, because the awards would have been antidilutive for the years presented.
Cash Equivalents
We classify time deposits and other investments that are highly liquid and have maturities of three months or less at the date ofpurchase as cash equivalents. We manage our exposure to counterparty credit risk through specific minimum credit standards,diversification of counterparties and procedures to monitor our credit risk concentrations.
Short-Term Investments
We classify time deposits and other investments that have maturities of greater than three months but less than one year asshort-term investments.
Investments in Equity and Debt Securities
We use the equity method to account for our investments in equity securities if our investment gives us the ability to exercisesignificant influence over operating and financial policies of the investee. We include our proportionate share of earnings and/orlosses of our equity method investees in equity income (loss) — net in our consolidated statements of income. The carrying valueof our equity investments is reported in equity method investments in our consolidated balance sheets. Refer to Note 6.
We account for investments in companies that we do not control or account for under the equity method either at fair value orunder the cost method, as applicable. Investments in equity securities are carried at fair value if the fair value of the security isreadily determinable. Equity investments carried at fair value are classified as either trading or available-for-sale securities withtheir cost basis determined by the specific identification method. Realized and unrealized gains and losses on trading securitiesand realized gains and losses on available-for-sale securities are included in other income (loss) — net in our consolidatedstatements of income. Unrealized gains and losses, net of deferred taxes, on available-for-sale securities are included in ourconsolidated balance sheets as a component of accumulated other comprehensive income (loss) (‘‘AOCI’’). Trading securities arereported as either marketable securities or other assets in our consolidated balance sheets. Securities classified as available-for-saleare reported as either marketable securities, other investments or other assets in our consolidated balance sheets, depending onthe length of time we intend to hold the investment. Refer to Note 3.
Investments in equity securities that we do not control or account for under the equity method and do not have readilydeterminable fair values are accounted for under the cost method. Cost method investments are originally recorded at cost, andwe record dividend income when applicable dividends are declared. Cost method investments are reported as other investments inour consolidated balance sheets, and dividend income from cost method investments is reported in the line item other income(loss) — net in our consolidated statements of income.
Our investments in debt securities are carried at either amortized cost or fair value. Investments in debt securities that theCompany has the positive intent and ability to hold to maturity are carried at amortized cost and classified as held-to-maturity.Investments in debt securities that are not classified as held-to-maturity are carried at fair value and classified as either trading oravailable-for-sale.
Each reporting period we review all of our investments in equity and debt securities, except for those classified as trading, todetermine whether a significant event or change in circumstances has occurred that may have an adverse effect on the fair valueof each investment. When such events or changes occur, we evaluate the fair value compared to our cost basis in theinvestment. We also perform this evaluation every reporting period for each investment for which our cost basis exceeded thefair value in the prior period. The fair values of most of our investments in publicly traded companies are often readily available
88

based on quoted market prices. For investments in nonpublicly traded companies, management’s assessment of fair value isbased on valuation methodologies including discounted cash flows, estimates of sales proceeds and appraisals, as appropriate.We consider the assumptions that we believe hypothetical marketplace participants would use in evaluating estimated futurecash flows when employing the discounted cash flow or estimates of sales proceeds valuation methodologies.
In the event the fair value of an investment declines below our cost basis, management determines if the decline in fair value isother than temporary. If management determines the decline is other than temporary, an impairment charge is recorded.Management’s assessment as to the nature of a decline in fair value is based on, among other things, the length of time and theextent to which the market value has been less than our cost basis, the financial condition and near-term prospects of the issuer,and our intent and ability to retain the investment for a period of time sufficient to allow for any anticipated recovery in marketvalue.
Trade Accounts Receivable
We record trade accounts receivable at net realizable value. This value includes an appropriate allowance for estimateduncollectible accounts to reflect any loss anticipated on the trade accounts receivable balances and charged to the provision fordoubtful accounts. We calculate this allowance based on our history of write-offs, the level of past-due accounts based on thecontractual terms of the receivables, and our relationships with, and the economic status of, our bottling partners andcustomers. We believe our exposure to concentrations of credit risk is limited due to the diverse geographic areas covered byour operations. Activity in the allowance for doubtful accounts was as follows (in millions):
Year Ended December 31, 2012 2011 2010
Balance at beginning of year $ 83 $ 48 $ 55Net charges to costs and expenses 5 56 21Write-offs (19) (12) (18)Other1 (16) (9) (10)
Balance at end of year $ 53 $ 83 $ 48
1 Other includes acquisitions, divestitures, foreign currency translation and the impact of transferring the assets of our consolidated Philippine andBrazilian bottling operations to assets held for sale.
A significant portion of our net operating revenues and corresponding accounts receivable is derived from sales of our productsin international markets. Refer to Note 19. We also generate a significant portion of our net operating revenues by sellingconcentrates and syrups to bottlers in which we have a noncontrolling interest, including Coca-Cola Hellenic BottlingCompany S.A. (‘‘Coca-Cola Hellenic’’), Coca-Cola FEMSA, S.A.B. de C.V. (‘‘Coca-Cola FEMSA’’) and Coca-Cola AmatilLimited (‘‘Coca-Cola Amatil’’). Refer to Note 6.
Inventories
Inventories consist primarily of raw materials and packaging (which includes ingredients and supplies) and finished goods (whichinclude concentrates and syrups in our concentrate operations, and finished beverages in our finished product operations).Inventories are valued at the lower of cost or market. We determine cost on the basis of the average cost or first-in, first-outmethods. Refer to Note 4.
Derivative Instruments
Our Company, when deemed appropriate, uses derivatives as a risk management tool to mitigate the potential impact of certainmarket risks. The primary market risks managed by the Company through the use of derivative instruments are foreign currencyexchange rate risk, commodity price risk and interest rate risk. All derivatives are carried at fair value in our consolidatedbalance sheets in the line items prepaid expenses and other assets or accounts payable and accrued expenses, as applicable. Thecash flow impact of the Company’s derivative instruments is primarily included in our consolidated statements of cash flows innet cash provided by operating activities. Refer to Note 5.
89

Property, Plant and Equipment
Property, plant and equipment are stated at cost. Repair and maintenance costs that do not improve service potential or extendeconomic life are expensed as incurred. Depreciation is recorded principally by the straight-line method over the estimateduseful lives of our assets, which are reviewed periodically and generally have the following ranges: buildings and improvements:40 years or less; and machinery, equipment and vehicle fleet: 20 years or less. Land is not depreciated, and construction inprogress is not depreciated until ready for service. Leasehold improvements are amortized using the straight-line method overthe shorter of the remaining lease term, including renewals that are deemed to be reasonably assured, or the estimated usefullife of the improvement. Depreciation is not recorded during the period in which a long-lived asset (disposal group) is classifiedas held for sale, even if the asset (disposal group) continues to generate revenue during the period. Depreciation expense,including the depreciation expense of assets under capital lease, totaled $1,704 million, $1,654 million and $1,188 million in2012, 2011 and 2010, respectively. Amortization expense for leasehold improvements totaled $19 million, $18 million and$16 million in 2012, 2011 and 2010, respectively.
Certain events or changes in circumstances may indicate that the recoverability of the carrying amount of property, plant andequipment should be assessed, including, among others, a significant decrease in market value, a significant change in thebusiness climate in a particular market, or a current period operating or cash flow loss combined with historical losses orprojected future losses. When such events or changes in circumstances are present, we estimate the future cash flows expectedto result from the use of the asset (or asset group) and its eventual disposition. These estimated future cash flows are consistentwith those we use in our internal planning. If the sum of the expected future cash flows (undiscounted and without interestcharges) is less than the carrying amount, we recognize an impairment loss. The impairment loss recognized is the amount bywhich the carrying amount exceeds the fair value. We use a variety of methodologies to determine the fair value of property,plant and equipment, including appraisals and discounted cash flow models, which are consistent with the assumptions webelieve hypothetical marketplace participants would use. Refer to Note 7.
Goodwill, Trademarks and Other Intangible Assets
We classify intangible assets into three categories: (1) intangible assets with definite lives subject to amortization, (2) intangibleassets with indefinite lives not subject to amortization and (3) goodwill. We determine the useful lives of our identifiableintangible assets after considering the specific facts and circumstances related to each intangible asset. Factors we consider whendetermining useful lives include the contractual term of any agreement related to the asset, the historical performance of theasset, the Company’s long-term strategy for using the asset, any laws or other local regulations which could impact the usefullife of the asset, and other economic factors, including competition and specific market conditions. Intangible assets that aredeemed to have definite lives are amortized, primarily on a straight-line basis, over their useful lives, generally ranging from1 to 20 years. Refer to Note 8.
When facts and circumstances indicate that the carrying value of definite-lived intangible assets may not be recoverable,management assesses the recoverability of the carrying value by preparing estimates of sales volume and the resulting grossprofit and cash flows. These estimated future cash flows are consistent with those we use in our internal planning. If the sum ofthe expected future cash flows (undiscounted and without interest charges) is less than the carrying amount, we recognize animpairment loss. The impairment loss recognized is the amount by which the carrying amount of the asset (or asset group)exceeds the fair value. We use a variety of methodologies to determine the fair value of these assets, including discounted cashflow models, which are consistent with the assumptions we believe hypothetical marketplace participants would use.
We test intangible assets determined to have indefinite useful lives, including trademarks, franchise rights and goodwill, forimpairment annually, or more frequently if events or circumstances indicate that assets might be impaired. Our Companyperforms these annual impairment reviews as of the first day of our third fiscal quarter. We use a variety of methodologies inconducting impairment assessments of indefinite-lived intangible assets, including, but not limited to, discounted cash flowmodels, which are based on the assumptions we believe hypothetical marketplace participants would use. For indefinite-livedintangible assets, other than goodwill, if the carrying amount exceeds the fair value, an impairment charge is recognized in anamount equal to that excess.
The Company has the option to perform a qualitative assessment of indefinite-lived intangible assets, other than goodwill, priorto completing the impairment test described above. The Company must assess whether it is more likely than not that the fairvalue of the intangible asset is less than its carrying amount. If the Company concludes that this is the case, it must perform thetesting described above. Otherwise, the Company does not need to perform any further assessment. During 2012, the Companyonly performed qualitative assessments on less than 10 percent of our indefinite-lived intangible assets balance.
90
We perform impairment tests of goodwill at our reporting unit level, which is one level below our operating segments. Ouroperating segments are primarily based on geographic responsibility, which is consistent with the way management runs ourbusiness. Our operating segments are subdivided into smaller geographic regions or territories that we sometimes refer to as‘‘business units.’’ These business units are also our reporting units. The Bottling Investments operating segment includes allCompany-owned or consolidated bottling operations, regardless of geographic location, except for bottling operations managed byCCR, which are included in our North America operating segment. Generally, each Company-owned or consolidated bottlingoperation within our Bottling Investments operating segment is its own reporting unit. Goodwill is assigned to the reporting unitor units that benefit from the synergies arising from each business combination.
The goodwill impairment test consists of a two-step process, if necessary. The first step is to compare the fair value of a reportingunit to its carrying value, including goodwill. We typically use discounted cash flow models to determine the fair value of areporting unit. The assumptions used in these models are consistent with those we believe hypothetical marketplace participantswould use. If the fair value of the reporting unit is less than its carrying value, the second step of the impairment test must beperformed in order to determine the amount of impairment loss, if any. The second step compares the implied fair value of thereporting unit’s goodwill with the carrying amount of that goodwill. If the carrying amount of the reporting unit’s goodwill exceedsits implied fair value, an impairment charge is recognized in an amount equal to that excess. The loss recognized cannot exceedthe carrying amount of goodwill.
The Company has the option to perform a qualitative assessment of goodwill prior to completing the two-step process describedabove to determine whether it is more likely than not that the fair value of a reporting unit is less than its carrying amount,including goodwill and other intangible assets. If the Company concludes that this is the case, it must perform the two-stepprocess. Otherwise, the Company will forego the two-step process and does not need to perform any further testing. During 2012,the Company only performed qualitative assessments on less than 10 percent of our consolidated goodwill balance.
Impairment charges related to intangible assets are generally recorded in the line item other operating charges or, to the extentthey relate to equity method investees, in the line item equity income (loss) — net in our consolidated statements of income.
Contingencies
Our Company is involved in various legal proceedings and tax matters. Due to their nature, such legal proceedings and taxmatters involve inherent uncertainties including, but not limited to, court rulings, negotiations between affected parties andgovernmental actions. Management assesses the probability of loss for such contingencies and accrues a liability and/or disclosesthe relevant circumstances, as appropriate. Refer to Note 11.
Stock-Based Compensation
Our Company currently sponsors stock option plans and restricted stock award plans. The fair value of our stock option grants isestimated on the grant date using a Black-Scholes-Merton option-pricing model. The Company recognizes compensation expenseon a straight-line basis over the period the grant is earned by the employee, generally four years.
The fair value of our restricted stock awards is the quoted market value of the Company’s stock on the grant date less the presentvalue of the expected dividends not received during the relevant holding period. In the period it becomes probable that theminimum performance criteria specified in the restricted stock award plan will be achieved, we recognize expense for theproportionate share of the total fair value of the award related to the vesting period that has already lapsed. The remaining costof the award is expensed on a straight-line basis over the balance of the vesting period. In the event the Company determines it isno longer probable that we will achieve the minimum performance criteria specified in the plan, we reverse all of the previouslyrecognized compensation expense in the period such a determination is made. Refer to Note 12.
Pension and Other Postretirement Benefit Plans
Our Company sponsors and/or contributes to pension and postretirement health care and life insurance benefit plans coveringsubstantially all U.S. employees. We also sponsor nonqualified, unfunded defined benefit pension plans for certain associates andparticipate in multi-employer pension plans in the United States. In addition, our Company and its subsidiaries have variouspension plans and other forms of postretirement arrangements outside the United States. Refer to Note 13.
Effective January 1, 2012, the Company elected to change our accounting methodology for determining the market-related valueof assets for our U.S. qualified defined benefit pension plans. The market-related value of assets is used to determine theCompany’s expected return on assets, a component of our annual pension expense calculation. The Company previously used asmoothing technique to calculate our market-related value of assets, which reflected changes in the fair value over no more thanfive years. However, we now use the actual fair value of plan assets to determine our expected return on those assets for all ofour defined benefit plans. Although both methods are permitted under accounting principles generally accepted in the UnitedStates, the Company believes our new methodology is preferable as it accelerates the recognition of gains and losses in thedetermination of our annual pension expense.
91
The Company’s change in accounting methodology has been applied retrospectively, and we have adjusted all applicable priorperiod financial information presented herein as required. The cumulative effect of this change on retained earnings as ofJanuary 1, 2011, was an increase of $59 million, with an offset to AOCI. The impact of this change on the Company’s incomebefore income taxes was an increase of $4 million and $19 million and a decrease of $36 million during the years endedDecember 31, 2012, 2011 and 2010, respectively. The impact on the Company’s earnings per share was not significant for any ofthe financial statement periods presented in this report.
Income Taxes
Income tax expense includes United States, state, local and international income taxes, plus a provision for U.S. taxes onundistributed earnings of foreign subsidiaries not deemed to be indefinitely reinvested. Deferred tax assets and liabilities arerecognized for the tax consequences of temporary differences between the financial reporting basis and the tax basis of existingassets and liabilities. The tax rate used to determine the deferred tax assets and liabilities is the enacted tax rate for the year andmanner in which the differences are expected to reverse. Valuation allowances are recorded to reduce deferred tax assets to theamount that will more likely than not be realized. The Company records taxes that are collected from customers and remitted togovernmental authorities on a net basis in our consolidated statements of income.
The Company is involved in various tax matters, with respect to some of which the outcome is uncertain. We establish reserves toremove some or all of the tax benefit of any of our tax positions at the time we determine that it becomes uncertain based uponone of the following conditions: (1) the tax position is not ‘‘more likely than not’’ to be sustained, (2) the tax position is ‘‘morelikely than not’’ to be sustained, but for a lesser amount, or (3) the tax position is ‘‘more likely than not’’ to be sustained, but notin the financial period in which the tax position was originally taken. For purposes of evaluating whether or not a tax position isuncertain, (1) we presume the tax position will be examined by the relevant taxing authority that has full knowledge of all relevantinformation; (2) the technical merits of a tax position are derived from authorities such as legislation and statutes, legislativeintent, regulations, rulings and case law and their applicability to the facts and circumstances of the tax position; and (3) each taxposition is evaluated without consideration of the possibility of offset or aggregation with other tax positions taken. A number ofyears may elapse before a particular uncertain tax position is audited and finally resolved or when a tax assessment is raised. Thenumber of years subject to tax assessments varies depending on the tax jurisdiction. The tax benefit that has been previouslyreserved because of a failure to meet the ‘‘more likely than not’’ recognition threshold would be recognized in our income taxexpense in the first interim period when the uncertainty disappears under any one of the following conditions: (1) the tax positionis ‘‘more likely than not’’ to be sustained, (2) the tax position, amount, and/or timing is ultimately settled through negotiation orlitigation, or (3) the statute of limitations for the tax position has expired. Refer to Note 14.
Translation and Remeasurement
We translate the assets and liabilities of our foreign subsidiaries from their respective functional currencies to U.S. dollars at theappropriate spot rates as of the balance sheet date. Generally, our foreign subsidiaries use the local currency as their functionalcurrency. Changes in the carrying value of these assets and liabilities attributable to fluctuations in spot rates are recognized inforeign currency translation adjustment, a component of AOCI. Refer to Note 15. Income statement accounts are translated usingthe monthly average exchange rates during the year.
Monetary assets and liabilities denominated in a currency that is different from a reporting entity’s functional currency must firstbe remeasured from the applicable currency to the legal entity’s functional currency. The effect of this remeasurement process isrecognized in the line item other income (loss) — net in our consolidated statements of income and is partially offset by theimpact of our economic hedging program for certain exposures on our consolidated balance sheets. Refer to Note 5.
Hyperinflationary Economies
A hyperinflationary economy is one that has cumulative inflation of approximately 100 percent or more over a three-year period.Effective January 1, 2010, Venezuela was determined to be a hyperinflationary economy, and the Venezuelan governmentdevalued the bolivar by resetting the official rate of exchange (‘‘official rate’’) from 2.15 bolivars per U.S. dollar to 2.6 bolivars perU.S. dollar for essential goods and 4.3 bolivars per U.S. dollar for nonessential goods. In accordance with hyperinflationaryaccounting under accounting principles generally accepted in the United States, our local subsidiary was required to use the U.S.dollar as its functional currency. As a result, we remeasured the net assets of our Venezuelan subsidiary using the official rate fornonessential goods of 4.3 bolivars per U.S. dollar, which resulted in a loss of $103 million during the first quarter of 2010. Theloss was recorded in the line item other income (loss) — net in our consolidated statement of income. We classified the impact ofthe remeasurement loss in the line item effect of exchange rate changes on cash and cash equivalents in our consolidatedstatement of cash flows.
92

In June 2010, the Venezuelan government introduced a newly regulated foreign currency exchange system known as theTransaction System for Foreign Currency Denominated Securities (‘‘SITME’’). This system, which was subject to annual limits,enabled entities domiciled in Venezuela to exchange their bolivars to U.S. dollars through authorized financial institutions(commercial banks, savings and lending institutions, etc.).
In December 2010, the Venezuelan government announced that it was eliminating the official rate of 2.6 bolivars per U.S. dollarfor essential goods. As a result, the only two exchange rates available for remeasuring bolivar-denominated transactions as ofDecember 31, 2010, were the official rate of 4.3 bolivars per U.S. dollar and the SITME rate. As discussed above, the Companyremeasured the net assets of our Venezuelan subsidiary using the official rate for nonessential goods of 4.3 bolivars per U.S.dollar starting on January 1, 2010. Therefore, the elimination of the official rate for essential goods had no impact on theremeasurement of the net assets of our Venezuelan subsidiary.
Subsequent to December 31, 2012, the Venezuelan government devalued its currency further to an official rate of 6.3 bolivars perU.S. dollar. The government also announced that it was discontinuing the SITME foreign exchange system. As a result, theCompany will remeasure the net assets of our local subsidiary and recognize the related gains or losses from remeasurement inthe line item other income (loss) — net in our consolidated statement of income. Based on the carrying value of our assets andliabilities denominated in Venezuelan bolivar as of December 31, 2012, we anticipate recognizing a remeasurement loss of$100 million to $125 million during the first quarter of 2013.
The Company will continue to use the official rate to remeasure the net assets of our Venezuelan subsidiary. If the official ratedevalues further, it would result in our Company recognizing additional foreign currency exchange gains or losses in ourconsolidated financial statements. As of December 31, 2012, our Venezuelan subsidiary held monetary assets of approximately$450 million and monetary liabilities of approximately $85 million.
In addition to the foreign currency exchange exposure related to our Venezuelan subsidiary’s net assets, we also sell concentrateto our bottling partner in Venezuela from outside the country. These sales are denominated in U.S. dollars. If we are unable toutilize a government-approved exchange rate mechanism for future concentrate sales to our bottling partner in Venezuela, theamount of receivables related to these sales will increase. In addition, we have certain intangible assets associated with productssold in Venezuela. If the bolivar further devalues, it could result in the impairment of these intangible assets. As of December 31,2012, the carrying value of our accounts receivable from our bottling partner in Venezuela and intangible assets associated withproducts sold in Venezuela was $216 million.
Recently Issued Accounting Guidance
In June 2011, the Financial Accounting Standards Board (‘‘FASB’’) issued Accounting Standards Update (‘‘ASU’’) 2011-05 whichrequires companies to present net income and other comprehensive income in one continuous statement or in two separate, butconsecutive, statements. In addition, ASU 2011-05 eliminates the option for companies to present the components of othercomprehensive income as part of the statement of changes in shareowners’ equity. In December 2011, the FASB issued ASU2011-12 which deferred the requirement to present components of reclassifications of other comprehensive income on the face ofthe income statement. The Company adopted the non-deferred provisions of ASU 2011-05 as of January 1, 2012, which did nothave a material impact on our consolidated financial statements.
In February 2013, the FASB issued ASU 2013-02 which requires companies to provide information about the amounts reclassifiedout of AOCI by component. In addition, companies are required to present, either on the face of the statement where net incomeis presented or in the accompanying notes, significant amounts reclassified out of AOCI by the respective line items of netincome, but only if the amount reclassified is required to be reclassified to net income in its entirety in the same reporting period.For amounts that are not required to be reclassified in their entirety to net income, companies are required to cross-reference toother disclosures that provide additional detail on those amounts. ASU 2013-02 is effective prospectively for reporting periodsbeginning after December 15, 2012.
93

NOTE 2: ACQUISITIONS AND DIVESTITURES
Acquisitions
During 2012, cash payments related to the Company’s acquisition and investment activities totaled $1,535 million. These paymentswere primarily related to the following: our investments in the existing beverage business of Aujan Industries Company J.S.C.(‘‘Aujan’’), one of the largest independent beverage companies in the Middle East; our investment in Mikuni Coca-ColaBottling Co., Ltd. (‘‘Mikuni’’), a bottling partner located in Japan; our acquisition of Sacramento Coca-Cola Bottling Co., Inc.(‘‘Sacramento bottler’’); and our acquisition of bottling operations in Vietnam, Cambodia and Guatemala. The Company’sinvestment in Mikuni is being accounted for under the equity method of accounting.
The Company’s investments in Aujan include an ownership interest of 50 percent in the Aujan entity that holds the rights toAujan-owned brands in certain territories and an ownership interest of 49 percent in Aujan’s bottling and distribution operationsin certain territories. The Company completed the transaction for $980 million in total value, of which $820 million was paid incash by the Company and the remainder was composed of the Company’s proportionate share of underlying debt in the acquiredentities. The Company’s investments in Aujan are being accounted for under the equity method of accounting.
During 2011, cash payments related to the Company’s acquisition and investment activities totaled $977 million. These paymentswere primarily related to the acquisitions of Great Plains Coca-Cola Bottling Company (‘‘Great Plains’’) and Honest Tea, Inc.(‘‘Honest Tea’’), and an additional investment in Coca-Cola Central Japan Company (‘‘Central Japan’’). In addition, theCompany’s acquisition and investment activities during 2011 included immaterial cash payments for the finalization of workingcapital adjustments related to our acquisition of CCE’s former North America business. Refer to our discussion of this transactionbelow.
The Company acquired Great Plains on December 30, 2011. The total purchase price for the Great Plains acquisition wasapproximately $360 million, of which $321 million was paid at closing. The purchase price was primarily allocated to property,plant and equipment, identifiable intangible assets and goodwill. The Company finalized our purchase accounting for Great Plainsduring the fourth quarter of 2012.
During 2011, the Company also acquired the remaining ownership interest of Honest Tea not already owned by the Company.Prior to the Company acquiring the remaining ownership interest of Honest Tea, we accounted for our investment under theequity method of accounting. We remeasured our equity interest in Honest Tea to fair value upon the close of the transaction.The resulting gain on the remeasurement was not significant to our consolidated financial statements. The Company finalized ourpurchase accounting for Honest Tea during the fourth quarter of 2011.
In December 2011, the Company acquired an additional minority interest in Central Japan. As a result, the Company began toaccount for our investment in Central Japan under the equity method of accounting beginning in December 2011.
During 2010, cash payments related to the Company’s acquisition and investment activities totaled $2,511 million. These paymentswere primarily related to the Company’s acquisition of CCE’s former North America business and the acquisition of certaindistribution rights from Dr Pepper Snapple Group, Inc. (‘‘DPS’’). See the relevant sections below for further discussion of thesetransactions.
In addition to the transactions listed in the preceding paragraph, our acquisition and investment activities during 2010 alsoincluded the acquisition of OAO Nidan Juices (‘‘Nidan’’), a Russian juice company, and an additional investment in FreshTrading Ltd. (‘‘innocent’’). Total consideration for the Nidan acquisition was approximately $276 million, which was primarilyallocated to property, plant and equipment, identifiable intangible assets and goodwill. The Company finalized our purchaseaccounting for Nidan in the third quarter of 2011. Under the terms of the agreement for our additional investment in innocent,we have a series of outstanding put and call options with the existing shareowners of innocent for the Company to potentiallyacquire the remaining shares not already owned by the Company. The put and call options are exercisable in stages between 2013and 2014. The Company anticipates acquiring the majority of the remaining outstanding shares in the second quarter of 2013.Currently, innocent’s founders maintain operational control of the business, and we account for our investment under the equitymethod of accounting.
94
Acquisition of Coca-Cola Enterprises Inc.’s Former North America Business
Pursuant to the terms of the business separation and merger agreement entered into on February 25, 2010, as amended (the‘‘merger agreement’’), on October 2, 2010 (the ‘‘acquisition date’’), we acquired CCE’s former North America business. Webelieve this acquisition will result in an evolved franchise system that will enable us to better serve the unique needs of the NorthAmerican market. The creation of a unified operating system will strategically position us to better market and distribute ournonalcoholic beverage brands in North America. Refer to Note 18 for information related to the Company’s integration initiativesassociated with this acquisition.
Under the terms of the merger agreement, the Company acquired the 67 percent of CCE’s former North America business thatwas not already owned by the Company for consideration that included: (1) the Company’s 33 percent indirect ownership interestin CCE’s European operations; (2) cash consideration; and (3) replacement awards issued to certain current and formeremployees of CCE’s corporate operations and former North America business. At closing, CCE shareowners other than theCompany exchanged their CCE common stock for common stock in a new entity, which was renamed Coca-Cola Enterprises, Inc.(which is referred to herein as ‘‘New CCE’’) and which continues to hold the European operations held by CCE prior to theacquisition. At closing, New CCE became 100 percent owned by shareowners that held shares of common stock of CCEimmediately prior to the closing, other than the Company. As a result of this transaction, the Company does not own any interestin New CCE.
As of October 1, 2010, our Company owned 33 percent of the outstanding common stock of CCE. Based on the closing price ofCCE’s common stock on the last day of trading prior to the acquisition date, the fair value of our investment in CCE was$5,373 million, which reflected the fair value of our ownership in both CCE’s European operations and former North Americabusiness. We remeasured our equity interest in CCE to fair value upon the close of the transaction. As a result, we recognized again of $4,978 million, which was classified in the line item other income (loss) — net in our consolidated statement of income.The gain included a $137 million reclassification adjustment related to foreign currency translation gains recognized upon thedisposal of our indirect investment in CCE’s European operations. The Company relinquished its indirect ownership interest inCCE’s European operations to New CCE as part of the consideration to acquire the 67 percent of CCE’s former North Americabusiness that was not already owned by the Company.
Although the CCE transaction was structured to be primarily cashless, under the terms of the merger agreement, we agreed toassume $8.9 billion of CCE debt. In the event the actual CCE debt on the acquisition date was less than the agreed amount, weagreed to make a cash payment to New CCE for the difference. As of the acquisition date, the debt assumed by the Company was$7.9 billion. The total cash consideration paid to New CCE as part of the transaction was $1.4 billion, which included $1.0 billionrelated to the debt shortfall. In addition, the cash consideration paid to New CCE included amounts related to working capitaladjustments which were finalized in 2011.
Under the terms of the merger agreement, the Company replaced share-based payment awards for certain current and formeremployees of CCE’s corporate operations and former North America business. The following table provides a list of allreplacement awards and the estimated fair value of those awards issued in conjunction with our acquisition of CCE’s formerNorth America business (in millions):
Number ofShares, Options
and Units Issued Fair Value
As Adjusted
Performance share units 3.3 $ 192Stock options 9.6 109Restricted share units 1.6 50Restricted stock 0.4 12
Total 14.9 $ 363
The portion of the fair value of the replacement awards related to services provided prior to the business combination wasincluded in the total purchase price. The portion of the fair value associated with future service is recognized as expense over thefuture service period, which varies by award. The Company determined that $237 million ($154 million net of tax) of thereplacement awards was related to services rendered prior to the business combination.
95
Each CCE performance share unit (‘‘PSU’’) replaced by the Company was converted at 100 percent of target into an adjustedPSU of The Coca-Cola Company, determined by multiplying the number of shares of each PSU by an exchange ratio (the‘‘closing exchange ratio’’) equal to the closing price of a share of CCE common stock on the last day of trading prior to theacquisition date divided by the closing price of the Company’s common stock on the same day. At the time we issued thesereplacement PSUs, they were subject to the same vesting conditions and other terms applicable to the CCE PSUs immediatelyprior to the closing date. However, in the fourth quarter of 2010, the Company modified primarily all of these PSUs to eliminatethe remaining holding period, which resulted in $74 million of accelerated expense. Refer to Note 12 for additional information.
Each CCE stock option replaced by the Company was converted into an adjusted stock option of The Coca-Cola Company toacquire a number of shares of Coca-Cola common stock, determined by multiplying the number of shares of CCE common stocksubject to the CCE stock option by the closing exchange ratio. The exercise price per share of the replacement awards was equalto the per share exercise price of the CCE stock option divided by the closing exchange ratio. All of the replacement stockoptions are subject to the same vesting conditions and other terms applicable to the CCE stock options immediately prior to theclosing date. Refer to Note 12 for additional information.
Each CCE restricted share unit (‘‘RSU’’) replaced by the Company was converted into an adjusted RSU of The Coca-ColaCompany, determined by multiplying the number of shares of each RSU by the closing exchange ratio. All of the replacementRSUs are subject to the same vesting conditions and other terms applicable to the CCE RSUs immediately prior to the closingdate. Refer to Note 12 for additional information.
Each share of CCE restricted stock replaced by the Company was converted into an adjusted share of restricted stock ofThe Coca-Cola Company, determined by multiplying the number of shares of CCE restricted stock by the closing exchange ratio.All of the replacement shares of restricted stock are subject to the same vesting conditions and other terms applicable to the CCEshares of restricted stock immediately prior to the closing date. Refer to Note 12 for additional information.
The following table reconciles the total purchase price of the Company’s acquisition of CCE’s former North America business,including adjustments recorded as part of the Company’s purchase accounting (in millions):
October 2,2010
Fair value of our equity investment in CCE1 $ 5,373Cash consideration2 1,368Fair value of share-based payment awards3 154
Total purchase price $ 6,895
1 Represents the fair value of our 33 percent ownership interest in the outstanding common stock of CCE based on the closing price of CCE’scommon stock on the last day the New York Stock Exchange was open prior to the acquisition date. The fair value reflects our indirect ownershipinterest in both CCE’s European operations and former North America business.
2 Primarily related to the debt shortfall and working capital adjustments.3 Represents the portion of the total fair value of the replacement awards associated with services rendered prior to the business combination, net of
tax.
96
The following table presents the final allocation of the purchase price by major class of assets and liabilities (in millions) as of theacquisition date, as well as adjustments made during 2011 (referred to as ‘‘measurement period adjustments’’):
AmountsAmounts Measurement Recognized as of
Recognized as of Period Acquisition DateAcquisition Date1 Adjustments2 (as Adjusted)
Cash and cash equivalents $ 49 $ — $ 49Marketable securities 7 — 7Trade accounts receivable3 1,194 — 1,194Inventories 696 — 696Other current assets4 744 (5) 739Property, plant and equipment4 5,385 (682) 4,703Bottlers’ franchise rights with indefinite lives4,5 5,100 100 5,200Other intangible assets4,6 1,032 45 1,077Other noncurrent assets 261 — 261
Total identifiable assets acquired $ 14,468 $ (542) $ 13,926
Accounts payable and accrued expenses4 1,826 8 1,834Loans and notes payable7 266 — 266Long-term debt7 9,345 — 9,345Pension and other postretirement liabilities8 1,313 — 1,313Other noncurrent liabilities4,9 2,603 (293) 2,310
Total liabilities assumed $ 15,353 $ (285) $ 15,068
Net liabilities assumed (885) (257) (1,142)Goodwill4,10 7,746 304 8,050
$ 6,861 $ 47 $ 6,908Less: Noncontrolling interests 13 — 13
Net assets acquired $ 6,848 $ 47 $ 6,895
1 As previously reported in the Notes to Consolidated Financial Statements included in our annual report on Form 10-K for the year endedDecember 31, 2010.
2 The measurement period adjustments did not have a significant impact on our consolidated statements of income for the years endedDecember 31, 2011, and December 31, 2010. Therefore, we did not retrospectively adjust the comparative 2010 financial information.
3 The gross amount due under receivables we acquired was $1,226 million, of which $32 million was expected to be uncollectible.4 The measurement period adjustments were due to the finalization of appraisals related to intangible assets and certain fixed assets and resulted in
the following: a decrease to property, plant and equipment; an increase to franchise rights; and a decrease to noncurrent deferred tax liabilities.The net impact of the measurement period adjustments and the payments made to New CCE that related to the finalization of working capitaladjustments resulted in a net increase to goodwill.
5 Represents reacquired franchise rights that had previously provided CCE with exclusive and perpetual rights to manufacture and/or distributecertain beverages in specified territories. These rights have been determined to have indefinite lives and are not amortized.
6 Other intangible assets primarily relate to franchise rights that had previously provided CCE with exclusive rights to manufacture and/or distributecertain beverages in specified territories for a finite period of time, and therefore have been classified as definite-lived intangible assets. Theestimated fair value of franchise rights with definite lives was $650 million as of the acquisition date. These franchise rights will be amortized over aweighted-average life of approximately eight years, which is equal to the weighted-average remaining contractual term of the franchise rights. Otherintangible assets also include $380 million of customer relationships, which will be amortized over approximately 20 years.
7 Refer to Note 10 for additional information.8 The assumed pension and other postretirement liabilities consisted of benefit obligations of $3,544 million and plan assets of $2,231 million. Refer
to Note 13 for additional information related to pension and other postretirement plans assumed from CCE.9 Primarily relates to deferred tax liabilities recorded on franchise rights. Refer to Note 14.10 The goodwill recognized as part of this acquisition has been assigned to the North America operating segment, of which $170 million is tax
deductible. The goodwill recognized in conjunction with our acquisition of CCE’s former North America business is primarily related to synergisticvalue created from having a unified operating system that will strategically position us to better market and distribute our nonalcoholic beveragebrands in North America. It also includes certain other intangible assets that do not qualify for separate recognition, such as an assembledworkforce.
97

In a concurrent transaction, we agreed to sell all of our ownership interests in Coca-Cola Drikker AS (‘‘Norwegian bottlingoperation’’) and Coca-Cola Drycker Sverige AB (‘‘Swedish bottling operation’’) to New CCE at fair value. The divestiture of ourNorwegian and Swedish bottling operations also closed on October 2, 2010. See further discussion of this divestiture below. Inaddition, we granted New CCE the right to negotiate the acquisition of our majority interest in our German bottling operation,Coca-Cola Erfrischungsgetranke AG (‘‘CCEAG’’), 18 to 39 months after the date of the merger agreement, at the then currentfair value and subject to terms and conditions as mutually agreed.
The Company has incurred $84 million of transaction costs in connection with our acquisition of CCE’s former North Americabusiness and the sale of our ownership interests in our Norwegian and Swedish bottling operations to New CCE since thetransaction commenced. These costs were included in the line item other operating charges in our consolidated statements ofincome. Refer to Note 17 for additional information. In addition, the Company recorded charges of $265 million related topreexisting relationships during 2010. These charges were primarily related to the write-off of our investment in infrastructureprograms with CCE. Our investment in these infrastructure programs with CCE did not meet the criteria to be recognized as anasset subsequent to the acquisition. In 2011, the Company recorded an additional charge of $1 million associated with thesepreexisting relationships. These charges were included in the line item other income (loss) — net in our consolidated statementsof income. Refer to Note 6 for additional information.
CCE’s former North America business contributed net revenues of approximately $3,637 million and net losses of approximately$122 million from October 2, 2010 through December 31, 2010. The following table presents unaudited consolidated pro formainformation as if our acquisition of CCE’s former North America business and the divestiture of our Norwegian and Swedishbottling operations had occurred on January 1, 2010 (in millions):
UnauditedYear Ended December 31, 2010
Net operating revenues1 $ 43,106Net income attributable to shareowners of The Coca-Cola Company2,3 6,839
1 The deconsolidation of our Norwegian and Swedish bottling operations resulted in a decrease to net operating revenues of approximately$433 million in 2010.
2 The deconsolidation of our Norwegian and Swedish bottling operations resulted in a decrease to net income attributable to shareowners ofThe Coca-Cola Company of approximately $387 million in 2010.
3 The 2010 pro forma information has been adjusted to exclude the gain related to the remeasurement of our equity interest in CCE to fair valueupon the close of the transaction, the gain on the sale of our Norwegian and Swedish bottling operations, transaction costs and charges related topreexisting relationships in order to present the pro forma information as if the transactions had occurred prior to January 1, 2010.
The unaudited pro forma financial information presented above does not purport to represent what the actual results of ouroperations would have been if our acquisition of CCE’s former North America business and the divestiture of our Norwegian andSwedish bottling operations had occurred prior to January 1, 2010, nor is it indicative of the future operating results of TheCoca-Cola Company. The unaudited pro forma financial information does not reflect the impact of future events that may occurafter the acquisition, including, but not limited to, anticipated cost savings from operating synergies.
The unaudited pro forma financial information presented in the table above has been adjusted to give effect to adjustments thatare (1) directly related to the business combination; (2) factually supportable; and (3) expected to have a continuing impact. Theseadjustments include, but are not limited to, the application of our accounting policies; elimination of related party transactionsand equity income; and depreciation and amortization related to fair value adjustments to property, plant and equipment andintangible assets.
Dr Pepper Snapple Group, Inc. Agreements
In contemplation of the closing of our acquisition of CCE’s former North America business, we reached an agreementwith DPS to distribute certain DPS brands in territories where DPS brands had been distributed by CCE prior to the CCEtransaction. Under the terms of our agreement with DPS, and concurrently with the closing of the CCE transaction, we enteredinto license agreements with DPS to distribute Dr Pepper trademark brands in the United States, Canada Dry in theNortheastern United States, and Canada Dry and C’ Plus in Canada, and we made a net one-time cash payment of $715 millionto DPS. Under the license agreements, the Company agreed to meet certain performance obligations in order to distribute DPSproducts in retail and foodservice accounts and vending machines. The license agreements have initial terms of 20 years, withautomatic 20-year renewal periods unless otherwise terminated under the terms of the agreements. The license agreementsreplaced agreements between DPS and CCE existing immediately prior to the completion of the CCE transaction. In addition,
98

we entered into an agreement with DPS to include Dr Pepper and Diet Dr Pepper in our Coca-Cola Freestyle fountain dispensersin certain outlets throughout the United States. The Coca-Cola Freestyle agreement has a term of 20 years.
Although these transactions were negotiated concurrently, they are legally separable and have distinct termination provisions andpenalties, if applicable. As a result, the Company recorded an asset of $865 million related to the DPS license agreements andrecorded deferred revenue of $150 million related to the Freestyle agreement. The DPS license agreements were determined to beindefinite-lived intangible assets and classified in the line item bottlers’ franchise rights with indefinite lives in our consolidatedbalance sheet. The Company reached the conclusion that these distribution rights had an indefinite life based on several keyfactors, including, but not limited to, (1) our license agreements with DPS shall remain in effect for 20 years and shallautomatically renew for additional 20-year successive periods thereafter unless terminated pursuant to the provisions of theagreements; (2) no additional payments shall be due for the renewal periods; (3) we anticipate using the assets indefinitely;(4) there are no known legal, regulatory or contractual provisions that are likely to limit the useful life of these assets; and(5) the classification of these assets as indefinite-lived assets is consistent with similar market transactions. The Company has beenamortizing, and will continue to amortize, the deferred revenue related to the Freestyle agreement on a straight-line basis over20 years, which is the length of the agreement. The amortization is included as a component of the Company’s net operatingrevenues.
Divestitures
During 2012, proceeds from the disposal of bottling companies and other investments totaled $2,189 million. These proceedsresulted from the sale and/or maturity of investments associated with the Company’s cash and risk management programs andwere not related to the disposal of bottling companies. Refer to Note 3 for additional information.
In 2011, proceeds from the disposal of bottling companies and other investments totaled $562 million, primarily related to the saleof our investment in Coca-Cola Embonor, S.A. (‘‘Embonor’’), a bottling partner with operations primarily in Chile, for$394 million. Prior to this transaction, the Company accounted for our investment in Embonor under the equity method ofaccounting. Refer to Note 17. None of the Company’s other divestitures were individually significant.
In 2010, proceeds from the disposal of bottling companies and other investments totaled $972 million, primarily related to the saleof all our ownership interests in our Norwegian and Swedish bottling operations to New CCE for $0.9 billion in cash onOctober 2, 2010. In addition to the proceeds related to the disposal of our Norwegian and Swedish bottling operations, ourCompany sold 50 percent of our investment in Leao Junior, S.A. (‘‘Leao Junior’’), a Brazilian tea company, for $83 million. Referto Note 17 for information related to the gain on these divestitures.
Assets and Liabilities Held for Sale
On December 13, 2012, the Company and Coca-Cola FEMSA executed a share purchase agreement for the sale of a majorityownership interest in our consolidated bottling operations in the Philippines (‘‘Philippine bottling operations’’). As a result, ourPhilippine bottling operations met the criteria to be classified as held for sale, and we were required to record their assets andliabilities at the lower of carrying value or fair value less any costs to sell based on the agreed-upon purchase price. Accordingly,we recorded a loss of $108 million, including $1 million of related transaction costs, in the line item other income (loss) — net inour consolidated statement of income. This transaction was completed in January 2013.
On December 17, 2012, the Company entered into an agreement with several parties which will result in the merger of ourconsolidated bottling operations in Brazil (‘‘Brazilian bottling operations’’) with an independent bottler in Brazil. Upon completionof the transaction, we will deconsolidate our Brazilian bottling operations in exchange for cash and a minority ownership interestin the newly combined entity. As a result, our Brazilian bottling operations met the criteria to be classified as held for sale. Wewere not required to record their assets and liabilities at fair value less any costs to sell because their fair value exceeded ourcarrying value as of December 31, 2012.
99

The following table presents information related to the major classes of assets and liabilities of the Company’s Philippine andBrazilian bottling operations, both of which are included in our Bottling Investments operating segment, as of December 31, 2012(in millions):
Total BottlingPhilippine Bottling Brazilian Bottling Operations
Operations Operations Held for Sale
Cash, cash equivalents and short-term investments $ 133 $ 45 $ 178Trade accounts receivable, less allowances 108 88 196Inventories 187 85 272Prepaid expenses and other assets 223 174 397Other assets 7 128 135Property, plant and equipment — net 841 419 1,260Bottlers’ franchise rights with indefinite lives 341 130 471Goodwill 148 22 170Other intangible assets — 1 1Allowance for reduction of assets held for sale (107) — (107)
Total assets $ 1,881 $ 1,092 $ 2,973
Accounts payable and accrued expenses $ 241 $ 157 $ 398Loans and notes payable — 6 6Current maturities of long-term debt — 28 28Accrued income taxes (4) 4 —Long-term debt — 147 147Other liabilities 20 75 95Deferred income taxes 102 20 122
Total liabilities $ 359 $ 437 $ 796
We determined that our Philippine and Brazilian bottling operations did not meet the criteria to be classified as discontinuedoperations, primarily due to the continued significant involvement we anticipate having in these operations following eachtransaction.
NOTE 3: INVESTMENTS
Investments in debt and marketable securities, other than investments accounted for under the equity method, are classified astrading, available-for-sale or held-to-maturity. Our marketable equity investments are classified as either trading oravailable-for-sale with their cost basis determined by the specific identification method. Our investments in debt securities arecarried at either amortized cost or fair value. Investments in debt securities that the Company has the positive intent and ability tohold to maturity are carried at amortized cost and classified as held-to-maturity. Investments in debt securities that are notclassified as held-to-maturity are carried at fair value and classified as either trading or available-for-sale. Realized and unrealizedgains and losses on trading securities and realized gains and losses on available-for-sale securities are included in net income.Unrealized gains and losses, net of deferred taxes, on available-for-sale securities are included in our consolidated balance sheetsas a component of AOCI, except for the change in fair value attributable to the currency risk being hedged. Refer to Note 5 foradditional information related to the Company’s fair value hedges of available-for-sale securities.
100

Trading Securities
As of December 31, 2012 and 2011, our trading securities had a fair value of $266 million and $211 million, respectively, andconsisted primarily of equity securities. The Company had net unrealized gains on trading securities of $19 million as ofDecember 31, 2012, and net unrealized losses of $5 million and $3 million as of December 31, 2011 and 2010, respectively. TheCompany’s trading securities were included in the following captions in our consolidated balance sheets (in millions):
December 31, 2012 2011
Marketable securities $ 184 $ 138Other assets 82 73
Total trading securities $ 266 $ 211
Available-for-Sale and Held-to-Maturity Securities
As of December 31, 2012 and 2011, available-for-sale and held-to-maturity securities consisted of the following (in millions):
GrossUnrealized Estimated
Cost Gains Losses Fair Value
2012Available-for-sale securities:1,2
Equity securities $ 957 $ 441 $ (10) $ 1,388Debt securities 3,169 46 (10) 3,205
$ 4,126 $ 487 $ (20) $ 4,593
Held-to-maturity securities:Bank and corporate debt $ — $ — $ — $ —
2011Available-for-sale securities:1
Equity securities $ 834 $ 237 $ — $ 1,071Debt securities 332 1 (3) 330
$ 1,166 $ 238 $ (3) $ 1,401
Held-to-maturity securities:Bank and corporate debt $ 113 $ — $ — $ 113
1 Refer to Note 16 for additional information related to the estimated fair value.2 During 2012, the Company made a change to its overall cash management program. In an effort to manage counterparty risk and diversify our
assets, the Company began to make additional investments in high-quality securities. These investments are primarily classified as available-for-salesecurities.
The sale and/or maturity of available-for-sale securities resulted in the following activity (in millions):
Years Ending December 31, 2012 2011
Gross gains $ 41 $ 5Gross losses (35) (1)Proceeds 5,036 37
The Company did not sell any available-for-sale securities during 2010.
In 2012, the Company had investments classified as available-for-sale securities in which our cost basis exceeded the fair value ofour investment. Management assessed each of these investments on an individual basis to determine if the decline in fair valuewas other than temporary. Management’s assessment as to the nature of a decline in fair value is based on, among other things,the length of time and the extent to which the market value has been less than our cost basis; the financial condition andnear-term prospects of the issuer; and our intent and ability to retain the investment for a period of time sufficient to allow forany anticipated recovery in market value. As a result of these assessments, management determined that the decline in fair valueof these investments was not other than temporary and did not record any impairment charges.
101

In 2011 and 2010, the Company realized losses of $17 million and $26 million, respectively, due to other-than-temporaryimpairments of certain available-for-sale securities. These impairment charges were recorded in other income (loss) — net.Refer to Note 16 and Note 17.
During 2011, the Company began using one of its insurance captives to reinsure group annuity insurance contracts that cover thepension obligations of certain of our European pension plans. In accordance with local insurance regulations, our insurancecaptive is required to meet and maintain minimum solvency capital requirements. The Company elected to invest its solvencycapital in a portfolio of available-for-sale securities, which have been classified in the line item other assets in our consolidatedbalance sheets because the assets are not available to satisfy our current obligations. As of December 31, 2012, and December 31,2011, the Company’s available-for-sale securities included solvency capital funds of $451 million and $285 million, respectively.
The Company’s available-for-sale and held-to-maturity securities were included in the following captions in our consolidatedbalance sheets (in millions):
December 31, 2012 December 31, 2011Available- Held-to- Available- Held-to-
for-Sale Maturity for-Sale MaturitySecurities Securities Securities Securities
Cash and cash equivalents $ 9 $ — $ — $ 112Marketable securities 2,908 — 5 1Other investments, principally bottling companies 1,087 — 986 —Other assets 589 — 410 —
$ 4,593 $ — $ 1,401 $ 113
The contractual maturities of these investments as of December 31, 2012, were as follows (in millions):
Available-for-Sale Securities Held-to-Maturity SecuritiesCost Fair Value Amortized Cost Fair Value
Within 1 year $ 1,003 $ 1,001 $ — $ —After 1 year through 5 years 1,590 1,598 — —After 5 years through 10 years 270 299 — —After 10 years 306 307 — —Equity securities 957 1,388 — —
$ 4,126 $ 4,593 $ — $ —
The Company expects that actual maturities may differ from the contractual maturities above because borrowers have the right tocall or prepay certain obligations.
Cost Method Investments
Cost method investments are initially recorded at cost, and we record dividend income when applicable dividends are declared.Cost method investments are reported as other investments in our consolidated balance sheets, and dividend income from costmethod investments is reported in other income (loss) — net in our consolidated statements of income. We review all of our costmethod investments quarterly to determine if impairment indicators are present; however, we are not required to determine thefair value of these investments unless impairment indicators exist. When impairment indicators exist, we generally use discountedcash flow analyses to determine the fair value. We estimate that the fair values of our cost method investments approximated orexceeded their carrying values as of December 31, 2012 and 2011. Our cost method investments had a carrying value of$145 million and $155 million as of December 31, 2012 and 2011, respectively.
In 2012, the Company recorded a charge of $16 million as a result of other-than-temporary declines in the fair values of certaincost method investments. This impairment was recorded in the line item other income (loss) — net in our consolidated statementof income. Refer to Note 16 for additional information related to this impairment.
102
NOTE 4: INVENTORIES
Inventories consist primarily of raw materials and packaging (which includes ingredients and supplies) and finished goods (whichinclude concentrates and syrups in our concentrate operations, and finished beverages in our finished product operations).Inventories are valued at the lower of cost or market. We determine cost on the basis of the average cost or first-in, first-outmethods. Inventories consisted of the following (in millions):
December 31, 2012 2011
Raw materials and packaging $ 1,773 $ 1,680Finished goods 1,171 1,198Other 320 214
Total inventories $ 3,264 $ 3,092
NOTE 5: HEDGING TRANSACTIONS AND DERIVATIVE FINANCIAL INSTRUMENTS
The Company is directly and indirectly affected by changes in certain market conditions. These changes in market conditions mayadversely impact the Company’s financial performance and are referred to as ‘‘market risks.’’ Our Company, when deemedappropriate, uses derivatives as a risk management tool to mitigate the potential impact of certain market risks. The primarymarket risks managed by the Company through the use of derivative instruments are foreign currency exchange rate risk,commodity price risk and interest rate risk.
The Company uses various types of derivative instruments including, but not limited to, forward contracts, commodity futurescontracts, option contracts, collars and swaps. Forward contracts and commodity futures contracts are agreements to buy or sell aquantity of a currency or commodity at a predetermined future date, and at a predetermined rate or price. An option contract isan agreement that conveys the purchaser the right, but not the obligation, to buy or sell a quantity of a currency or commodity ata predetermined rate or price during a period or at a time in the future. A collar is a strategy that uses a combination of optionsto limit the range of possible positive or negative returns on an underlying asset or liability to a specific range, or to protectexpected future cash flows. To do this, an investor simultaneously buys a put option and sells (writes) a call option, or alternativelybuys a call option and sells (writes) a put option. A swap agreement is a contract between two parties to exchange cash flowsbased on specified underlying notional amounts, assets and/or indices. We do not enter into derivative financial instruments fortrading purposes.
All derivatives are carried at fair value in our consolidated balance sheets in the following line items, as applicable: prepaidexpenses and other assets; other assets; accounts payable and accrued expenses; and other liabilities. The carrying values of thederivatives reflect the impact of legally enforceable master netting agreements and cash collateral held or placed with the samecounterparties, as applicable. These master netting agreements allow the Company to net settle positive and negative positions(assets and liabilities) arising from different transactions with the same counterparty.
The accounting for gains and losses that result from changes in the fair values of derivative instruments depends on whether thederivatives have been designated and qualify as hedging instruments and the type of hedging relationships. Derivatives can bedesignated as fair value hedges, cash flow hedges or hedges of net investments in foreign operations. The changes in the fairvalues of derivatives that have been designated and qualify for fair value hedge accounting are recorded in the same line item inour consolidated statements of income as the changes in the fair values of the hedged items attributable to the risk being hedged.The changes in fair values of derivatives that have been designated and qualify as cash flow hedges or hedges of net investmentsin foreign operations are recorded in AOCI and are reclassified into the line item in our consolidated statement of income inwhich the hedged items are recorded in the same period the hedged items affect earnings. Due to the high degree of effectivenessbetween the hedging instruments and the underlying exposures being hedged, fluctuations in the value of the derivativeinstruments are generally offset by changes in the fair values or cash flows of the underlying exposures being hedged. The changesin fair values of derivatives that were not designated and/or did not qualify as hedging instruments are immediately recognizedinto earnings.
For derivatives that will be accounted for as hedging instruments, the Company formally designates and documents, at inception,the financial instrument as a hedge of a specific underlying exposure, the risk management objective and the strategy forundertaking the hedge transaction. In addition, the Company formally assesses, both at the inception and at least quarterlythereafter, whether the financial instruments used in hedging transactions are effective at offsetting changes in either the fairvalues or cash flows of the related underlying exposures. Any ineffective portion of a financial instrument’s change in fair value isimmediately recognized into earnings.
The Company determines the fair values of its derivatives based on quoted market prices or using standard valuation models.Refer to Note 16. The notional amounts of the derivative financial instruments do not necessarily represent amounts exchanged bythe parties and, therefore, are not a direct measure of our exposure to the financial risks described above. The amounts
103

exchanged are calculated by reference to the notional amounts and by other terms of the derivatives, such as interest rates,foreign currency exchange rates, commodity rates or other financial indices. The Company does not view the fair values of itsderivatives in isolation, but rather in relation to the fair values or cash flows of the underlying hedged transactions or otherexposures. Virtually all of our derivatives are straightforward over-the-counter instruments with liquid markets.
The following table presents the fair values of the Company’s derivative instruments that were designated and qualified as part ofa hedging relationship (in millions):
Fair Value1,2
December 31, December 31,Derivatives Designated as Hedging Instruments Balance Sheet Location1 2012 2011
Assets:Foreign currency contracts Prepaid expenses and other assets $ 149 $ 170Commodity contracts Prepaid expenses and other assets — 2Interest rate contracts Prepaid expenses and other assets 7 —Interest rate contracts Other assets 335 246
Total assets $ 491 $ 418
Liabilities:Foreign currency contracts Accounts payable and accrued expenses $ 55 $ 41Commodity contracts Accounts payable and accrued expenses 1 1Interest rate contracts Other liabilities 6 —
Total liabilities $ 62 $ 42
1 All of the Company’s derivative instruments are carried at fair value in our consolidated balance sheets after considering the impact of legallyenforceable master netting agreements and cash collateral held or placed with the same counterparties, as applicable. Current disclosurerequirements mandate that derivatives must also be disclosed without reflecting the impact of master netting agreements and cash collateral. Referto Note 16 for the net presentation of the Company’s derivative instruments.
2 Refer to Note 16 for additional information related to the estimated fair value.
The following table presents the fair values of the Company’s derivative instruments that were not designated as hedginginstruments (in millions):
Fair Value1,2
December 31, December 31,Derivatives Not Designated as Hedging Instruments Balance Sheet Location1 2012 2011
Assets:Foreign currency contracts Prepaid expenses and other assets $ 19 $ 29Foreign currency contracts Other assets 42 —Commodity contracts Prepaid expenses and other assets 72 54Other derivative instruments Prepaid expenses and other assets 6 5
Total assets $ 139 $ 88
Liabilities:Foreign currency contracts Accounts payable and accrued expenses $ 24 $ 116Foreign currency contracts Other liabilities 1 —Commodity contracts Accounts payable and accrued expenses 43 47Commodity contracts Other liabilities 1 —Other derivative instruments Accounts payable and accrued expenses 2 1
Total liabilities $ 71 $ 164
1 All of the Company’s derivative instruments are carried at fair value in our consolidated balance sheets after considering the impact of legallyenforceable master netting agreements and cash collateral held or placed with the same counterparties, as applicable. Current disclosurerequirements mandate that derivatives must also be disclosed without reflecting the impact of master netting agreements and cash collateral. Referto Note 16 for the net presentation of the Company’s derivative instruments.
2 Refer to Note 16 for additional information related to the estimated fair value.
104
Credit Risk Associated with Derivatives
We have established strict counterparty credit guidelines and enter into transactions only with financial institutions of investmentgrade or better. We monitor counterparty exposures regularly and review any downgrade in credit rating immediately. If adowngrade in the credit rating of a counterparty were to occur, we have provisions requiring collateral in the form of U.S.government securities for substantially all of our transactions. To mitigate presettlement risk, minimum credit standards becomemore stringent as the duration of the derivative financial instrument increases. In addition, the Company’s master nettingagreements reduce credit risk by permitting the Company to net settle for transactions with the same counterparty. To minimizethe concentration of credit risk, we enter into derivative transactions with a portfolio of financial institutions. Based on thesefactors, we consider the risk of counterparty default to be minimal.
Cash Flow Hedging Strategy
The Company uses cash flow hedges to minimize the variability in cash flows of assets or liabilities or forecasted transactionscaused by fluctuations in foreign currency exchange rates, commodity prices or interest rates. The changes in the fair values ofderivatives designated as cash flow hedges are recorded in AOCI and are reclassified into the line item in our consolidatedstatement of income in which the hedged items are recorded in the same period the hedged items affect earnings. The changes infair values of hedges that are determined to be ineffective are immediately reclassified from AOCI into earnings. The Companydid not discontinue any cash flow hedging relationships during the years ended December 31, 2012, 2011 and 2010. The maximumlength of time for which the Company hedges its exposure to future cash flows is typically three years.
The Company maintains a foreign currency cash flow hedging program to reduce the risk that our eventual U.S. dollar net cashinflows from sales outside the United States and U.S. dollar net cash outflows from procurement activities will be adverselyaffected by changes in foreign currency exchange rates. We enter into forward contracts and purchase foreign currency options(principally euros and Japanese yen) and collars to hedge certain portions of forecasted cash flows denominated in foreigncurrencies. When the U.S. dollar strengthens against the foreign currencies, the decline in the present value of future foreigncurrency cash flows is partially offset by gains in the fair value of the derivative instruments. Conversely, when the U.S. dollarweakens, the increase in the present value of future foreign currency cash flows is partially offset by losses in the fair value of thederivative instruments. The total notional value of derivatives that have been designated and qualify for the Company’s foreigncurrency cash flow hedging program was $4,715 million and $5,158 million as of December 31, 2012 and 2011, respectively.
The Company has entered into commodity futures contracts and other derivative instruments on various commodities to mitigatethe price risk associated with forecasted purchases of materials used in our manufacturing process. The derivative instrumentshave been designated and qualify as part of the Company’s commodity cash flow hedging program. The objective of this hedgingprogram is to reduce the variability of cash flows associated with future purchases of certain commodities. The total notional valueof derivatives that have been designated and qualify for this program was $17 million and $26 million as of December 31, 2012and 2011, respectively.
Our Company monitors our mix of short-term debt and long-term debt regularly. From time to time, we manage our risk tointerest rate fluctuations through the use of derivative financial instruments. The Company has entered into interest rate swapagreements and has designated these instruments as part of the Company’s interest rate cash flow hedging program. The objectiveof this hedging program is to mitigate the risk of adverse changes in benchmark interest rates on the Company’s future interestpayments. The total notional value of these interest rate swap agreements that were designated and qualified for the Company’sinterest rate cash flow hedging program was $1,764 million as of December 31, 2012. The Company had no outstanding derivativeinstruments under this hedging program as of December 31, 2011.
105

The following table presents the pretax impact that changes in the fair values of derivatives designated as cash flow hedges had onAOCI and earnings during the years ended December 31, 2012, 2011 and 2010 (in millions):
Gain (Loss) Gain (Loss)Recognized Gain (Loss) Recognized in Income
in Other Reclassified from (Ineffective Portion andComprehensive Location of Gain (Loss) AOCI into Income Amount Excluded fromIncome (‘‘OCI’’) Recognized in Income1 (Effective Portion) Effectiveness Testing)
2012Foreign currency contracts $ 59 Net operating revenues $ (46) $ 2Foreign currency contracts 34 Cost of goods sold (23) —Interest rate contracts 1 Interest expense (12) —2
Commodity contracts (4) Cost of goods sold (1) —
Total $ 90 $ (82) $ 2
2011Foreign currency contracts $ 3 Net operating revenues $ (231) $ —2
Interest rate contracts (11) Interest expense (12) (1)Commodity contracts (1) Cost of goods sold — —
Total $ (9) $ (243) $ (1)
2010Foreign currency contracts $ (307) Net operating revenues $ (2) $ (2)Interest rate contracts — Interest expense (15) —Commodity contracts 1 Cost of goods sold — —
Total $ (306) $ (17) $ (2)
1 The Company records gains and losses reclassified from AOCI in income for the effective portion and ineffective portion, if any, to the same lineitems in our consolidated statements of income.
2 Includes a de minimis amount of ineffectiveness in the hedging relationship.
As of December 31, 2012, the Company estimates that it will reclassify into earnings during the next 12 months gains ofapproximately $41 million from the pretax amount recorded in AOCI as the anticipated cash flows occur.
Fair Value Hedging Strategy
The Company uses interest rate swap agreements designated as fair value hedges to minimize exposure to changes in the fairvalue of fixed-rate debt that results from fluctuations in benchmark interest rates. The changes in fair values of derivativesdesignated as fair value hedges and the offsetting changes in fair values of the hedged items are recognized in earnings. As ofDecember 31, 2012, such adjustments increased the carrying value of our long-term debt by $273 million. Refer to Note 10. Thechanges in fair values of hedges that are determined to be ineffective are immediately recognized into earnings. The total notionalvalue of derivatives that related to our fair value hedges of this type was $6,700 million and $5,700 million as of December 31,2012 and 2011, respectively.
During the first quarter of 2012, the Company began using fair value hedges to minimize exposure to changes in the fair value ofcertain available-for-sale securities from fluctuations in foreign currency exchange rates. The changes in fair values of derivativesdesignated as fair value hedges and the offsetting changes in fair values of the hedged items are recognized in earnings. Thechanges in fair values of hedges that are determined to be ineffective are immediately recognized into earnings. The total notionalvalue of derivatives that related to our fair value hedges of this type was $850 million as of December 31, 2012. The Company hadno outstanding derivative instruments under this hedging program as of December 31, 2011.
106
The following table summarizes the pretax impact that changes in the fair values of derivatives designated as fair value hedges hadon earnings during the years ended December 31, 2012, 2011 and 2010 (in millions):
Gain (Loss)Recognized in Income
(Ineffective Portion andLocation of Gain (Loss) Amount Excluded from
Hedging Instruments and Hedged Items Recognized in Income Effectiveness Testing)
2012Interest rate contracts Interest expense $ 89Fixed-rate debt Interest expense (42)
Net impact to interest expense $ 47
Foreign currency contracts Other income (loss) — net $ 42Available-for-sale securities Other income (loss) — net (46)
Net impact to other income (loss) — net $ (4)
Net impact of fair value hedging instruments $ 43
2011Interest rate contracts Interest expense $ 343Fixed-rate debt Interest expense (333)
Net impact to interest expense $ 10
2010Interest rate contracts Interest expense $ (97)Fixed-rate debt Interest expense 102
Net impact to interest expense $ 5
Hedges of Net Investments in Foreign Operations Strategy
The Company uses forward contracts to protect the value of our investments in a number of foreign subsidiaries. For derivativeinstruments that are designated and qualify as hedges of net investments in foreign operations, the changes in fair values of thederivative instruments are recognized in net foreign currency translation gain (loss), a component of AOCI, to offset the changesin the values of the net investments being hedged. Any ineffective portions of net investment hedges are reclassified from AOCIinto earnings during the period of change. The total notional value of derivatives under this hedging program was $1,718 millionand $1,681 million as of December 31, 2012 and 2011, respectively.
The following table presents the pretax impact that changes in the fair values of derivatives designated as net investment hedgeshad on AOCI during the years ended December 31, 2012, 2011 and 2010 (in millions):
Gain (Loss)Recognized in OCI
Year Ended December 31, 2012 2011 2010
Foreign currency contracts $ (61) $ (3) $ (15)
The Company did not reclassify any deferred gains or losses related to net investment hedges from AOCI to earnings during theyears ended December 31, 2012, 2011 and 2010. In addition, the Company did not have any ineffectiveness related to netinvestment hedges during the years ended December 31, 2012, 2011 and 2010.
107
Economic (Non-Designated) Hedging Strategy
In addition to derivative instruments that are designated and qualify for hedge accounting, the Company also uses certainderivatives as economic hedges of foreign currency and commodity exposure. Although these derivatives were not designatedand/or did not qualify for hedge accounting, they are effective economic hedges. The changes in fair value of economic hedges areimmediately recognized into earnings.
The Company uses foreign currency economic hedges to offset the earnings impact that fluctuations in foreign currency exchangerates have on certain monetary assets and liabilities denominated in nonfunctional currencies. The changes in fair value ofeconomic hedges used to offset the monetary assets and liabilities are recognized into earnings in the line item other income(loss) — net in our consolidated statements of income. In addition, we use foreign currency economic hedges to minimize thevariability in cash flows associated with changes in foreign currency exchange rates. The changes in fair value of economic hedgesused to offset the variability in U.S. dollar net cash flows are recognized into earnings in the line items net operating revenuesand cost of goods sold in our consolidated statements of income. The total notional value of derivatives related to our foreigncurrency economic hedges was $3,865 million and $3,629 million as of December 31, 2012 and 2011, respectively.
The Company also uses certain derivatives as economic hedges to mitigate the price risk associated with the purchase of materialsused in the manufacturing process and for vehicle fuel. The changes in fair values of these economic hedges are immediatelyrecognized into earnings in the line items net operating revenues, cost of goods sold, and selling, general and administrativeexpenses in our consolidated statements of income, as applicable. The total notional value of derivatives related to our economichedges of this type was $1,084 million and $1,165 million as of December 31, 2012 and 2011, respectively.
In connection with our acquisition of CCE’s former North America business, the Company assumed certain interest ratederivatives. The Company did not designate these derivatives as hedges subsequent to the acquisition. These derivatives wereoriginally recorded at fair value as of October 2, 2010. As of December 31, 2010, all interest rate derivatives acquired from CCEwere settled and will have no additional impact on future earnings. In 2010, the Company recorded $5 million of losses related tothese instruments in interest expense.
The Company entered into interest rate locks that were used as economic hedges to mitigate the interest rate risk associated withthe Company’s repurchase of certain long-term debt. These hedges were not designated and did not qualify for hedge accountingbut were effective economic hedges. The Company settled these hedges and recognized losses of $104 million in interest expenseduring 2010. As of December 31, 2010, there were no outstanding interest rate derivatives used as economic hedges.
The following table presents the pretax impact that changes in the fair values of derivatives not designated as hedging instrumentshad on earnings during the years ended December 31, 2012, 2011 and 2010 (in millions):
Gains (Losses)Year Ended December 31,Derivatives Not Designated Location of Gains (Losses)
as Hedging Instruments Recognized in Income 2012 2011 2010
Foreign currency contracts Net operating revenues $ (7) $ 7 $ (15)Foreign currency contracts Other income (loss) — net 24 (37) (46)Foreign currency contracts Cost of goods sold — (12) (9)Commodity contracts Net operating revenues 4 — —Commodity contracts Cost of goods sold (110) (42) 40Commodity contracts Selling, general and administrative expenses 9 (11) —Interest rate swaps Interest expense — — (5)Interest rate locks Interest expense — — (104)Other derivative instruments Selling, general and administrative expenses 18 8 21
Total $ (62) $ (87) $ (118)
108

NOTE 6: EQUITY METHOD INVESTMENTS
Our consolidated net income includes our Company’s proportionate share of the net income or loss of our equity methodinvestees. When we record our proportionate share of net income, it increases equity income (loss) — net in our consolidatedstatements of income and our carrying value in that investment. Conversely, when we record our proportionate share of a net loss,it decreases equity income (loss) — net in our consolidated statements of income and our carrying value in that investment. TheCompany’s proportionate share of the net income or loss of our equity method investees includes significant operating andnonoperating items recorded by our equity method investees. These items can have a significant impact on the amount of equityincome (loss) — net in our consolidated statements of income and our carrying value in those investments. Refer to Note 17 foradditional information related to significant operating and nonoperating items recorded by our equity method investees. Thecarrying values of our equity method investments are also impacted by our proportionate share of items impacting the equityinvestee’s AOCI.
We eliminate from our financial results all significant intercompany transactions, including the intercompany portion oftransactions with equity method investees.
Coca-Cola Enterprises Inc.
On October 2, 2010, we completed our acquisition of CCE’s former North America business and relinquished our indirectownership interest in CCE’s European operations. As a result of this transaction, the Company does not own any interest in NewCCE. Refer to Note 2 for additional information related to this transaction.
We accounted for our investment in CCE under the equity method of accounting until our acquisition of CCE’s former NorthAmerica business was completed on October 2, 2010. Therefore, our consolidated net income for the year ended December 31,2010, included equity income from CCE during the first nine months of 2010. The Company owned 33 percent of the outstandingcommon stock of CCE immediately prior to the acquisition. The following table provides summarized financial information forCCE for the nine months ended October 1, 2010 (in millions):
Nine Months EndedOctober 1, 2010
Net operating revenues $ 16,464Cost of goods sold 10,028
Gross profit $ 6,436
Operating income (loss) $ 1,369
Net income (loss) $ 677
The following table provides a summary of our significant transactions with CCE for the nine months ended October 1, 2010(in millions):
Nine Months EndedOctober 1, 2010
Concentrate, syrup and finished product sales to CCE $ 4,737Syrup and finished product purchases from CCE 263CCE purchases of sweeteners through our Company 251Marketing payments made by us directly to CCE 314Marketing payments made to third parties on behalf of CCE 106Local media and marketing program reimbursements from CCE 268Payments made to CCE for dispensing equipment repair services 64Other payments — net 19
Syrup and finished product purchases from CCE represent purchases of fountain syrup in certain territories that have been resoldby our Company to major customers and purchases of bottle and can products. Marketing payments made by us directly to CCErepresent support of certain marketing activities and our participation with CCE in cooperative advertising and other marketingactivities to promote the sale of Company trademark products within CCE territories. These programs were agreed to on anannual basis. Marketing payments made to third parties on behalf of CCE represent support of certain marketing activities andprograms to promote the sale of Company trademark products within CCE’s territories in conjunction with certain of CCE’s
109
customers. Pursuant to cooperative advertising and trade agreements with CCE, we received funds from CCE for local media andmarketing program reimbursements. Payments made to CCE for dispensing equipment repair services represent reimbursement toCCE for its costs of parts and labor for repairs on cooler, dispensing or post-mix equipment owned by us or our customers. Theother payments — net line in the table above represents payments made to and received from CCE that are individuallyinsignificant.
Our Company had previously entered into programs with CCE designed to help develop cold-drink infrastructure. Under theseprograms, we paid CCE for a portion of the cost of developing the infrastructure necessary to support accelerated placements ofcold-drink equipment. These payments supported a common objective of increased sales of Company Trademark Beverages fromincreased availability and consumption in the cold-drink channel.
Preexisting Relationships
The Company evaluated all of our preexisting relationships with CCE prior to the close of the transaction. Based on theseevaluations, the Company recognized charges of $265 million in 2010 related to preexisting relationships with CCE. These chargeswere primarily related to the write-off of our investment in cold-drink infrastructure programs with CCE as our investment inthese programs did not meet the criteria to be recognized as an asset subsequent to the acquisition. These charges were includedin the line item other income (loss) — net in our consolidated statements of income and impacted the Corporate operatingsegment. Refer to Note 17.
Other Equity Method Investments
The Company’s other equity method investments include our ownership interests in Coca-Cola Hellenic, Coca-Cola FEMSA andCoca-Cola Amatil. As of December 31, 2012, we owned approximately 23 percent, 29 percent and 29 percent, respectively, ofthese companies’ common shares. As of December 31, 2012, our investment in our equity method investees in the aggregateexceeded our proportionate share of the net assets of these equity method investees by $2,241 million. This difference is notamortized.
A summary of financial information for our equity method investees in the aggregate, other than CCE, is as follows (in millions):
Year Ended December 31, 2012 2011 2010
Net operating revenues $ 47,087 $ 42,472 $ 38,663Cost of goods sold 28,821 26,271 23,053
Gross profit $ 18,266 $ 16,201 $ 15,610
Operating income $ 4,605 $ 4,181 $ 4,134
Consolidated net income $ 2,993 $ 2,237 $ 2,659Less: Net income attributable to noncontrolling interests 89 99 89
Net income attributable to common shareowners $ 2,904 $ 2,138 $ 2,570
December 31, 2012 2011
Current assets $ 16,054 $ 13,960Noncurrent assets 32,687 27,152
Total assets $ 48,741 $ 41,112
Current liabilities $ 12,004 $ 10,545Noncurrent liabilities 12,272 11,646
Total liabilities $ 24,276 $ 22,191
Equity attributable to shareowners of investees $ 23,827 $ 18,392Equity attributable to noncontrolling interests 638 529
Total equity $ 24,465 $ 18,921
Company equity investment $ 9,216 $ 7,233
110

Net sales to equity method investees other than CCE, the majority of which are located outside the United States, were$7.1 billion, $6.9 billion and $6.2 billion in 2012, 2011 and 2010, respectively. Total payments, primarily marketing, made to equitymethod investees other than CCE were $1,587 million, $1,147 million and $1,034 million in 2012, 2011 and 2010, respectively. Inaddition, purchases of finished products from equity method investees other than CCE were $392 million, $430 million and$205 million in 2012, 2011 and 2010, respectively.
If valued at the December 31, 2012, quoted closing prices of shares actively traded on stock markets, the value of our equitymethod investments in publicly traded bottlers would have exceeded our carrying value by $10.4 billion.
Net Receivables and Dividends from Equity Method Investees
Total net receivables due from equity method investees were $1,162 million and $1,042 million as of December 31, 2012 and 2011,respectively. The total amount of dividends received from equity method investees was $393 million, $421 million and $354 millionfor the years ended December 31, 2012, 2011 and 2010, respectively. Dividends received included a $35 million and $60 millionspecial dividend from Coca-Cola Hellenic during 2012 and 2011, respectively. We classified the receipt of these cash dividends incash flows from operating activities because our cumulative equity in earnings from Coca-Cola Hellenic exceeded the cumulativedistributions received; therefore, the dividends were deemed to be a return on our investment and not a return of our investment.
NOTE 7: PROPERTY, PLANT AND EQUIPMENT
The following table summarizes our property, plant and equipment (in millions):
December 31, 2012 2011
Land $ 997 $ 1,141Buildings and improvements 5,307 5,240Machinery, equipment and vehicle fleet 16,203 15,504Construction in progress 979 1,266
23,486 23,151Less accumulated depreciation 9,010 8,212
Property, plant and equipment — net $ 14,476 $ 14,939
NOTE 8: INTANGIBLE ASSETS
Indefinite-Lived Intangible Assets
The following table summarizes information related to indefinite-lived intangible assets (in millions):
December 31, 2012 2011
Trademarks $ 6,527 $ 6,430Bottlers’ franchise rights1 7,405 7,770Goodwill 12,255 12,219Other 111 113
Indefinite-lived intangible assets2 $ 26,298 $ 26,532
1 The decrease in 2012 was primarily related to the Company’s consolidated Philippine and Brazilian bottling operations being transferred to assetsheld for sale as of December 31, 2012. This decrease was partially offset by the acquisition of the Sacramento bottler in 2012 and the finalization ofpurchase accounting related to our 2011 acquisition of Great Plains. Refer to Note 2 for additional information related to each of these transactions.
2 The distribution rights acquired from DPS are the only significant indefinite-lived intangible assets subject to renewal or extension arrangements.Refer to Note 2.
111

The following table provides information related to the carrying value of our goodwill by operating segment (in millions):
Eurasia & Latin North BottlingAfrica Europe America America Pacific Investments Total
2011Balance as of January 1 $ 44 $ 695 $ 166 $ 9,861 $ 112 $ 787 $ 11,665Effect of foreign currency translation (6) 15 (3) — 2 11 19Acquisitions1 — — — 195 — — 195Adjustments related to the finalization
of purchase accounting1 — — — 304 — 5 309Divestitures, deconsolidations and other1 — — — 155 — (124) 31
Balance as of December 31 $ 38 $ 710 $ 163 $ 10,515 $ 114 $ 679 $ 12,219
2012Balance as of January 1 $ 38 $ 710 $ 163 $ 10,515 $ 114 $ 679 $ 12,219Effect of foreign currency translation (1) (19) 5 — 6 (4) (13)Acquisitions1 — — — 100 — 157 257Adjustments related to the finalization
of purchase accounting1 — — — (38) — — (38)Divestitures, deconsolidations and other2 — — — — — (170) (170)
Balance as of December 31 $ 37 $ 691 $ 168 $ 10,577 $ 120 $ 662 $ 12,255
1 Refer to Note 2 for information related to the Company’s acquisitions and divestitures.2 Relates to the transfer of goodwill associated with the Company’s consolidated Philippine and Brazilian bottling operations to assets held for sale as
of December 31, 2012. Refer to Note 2 for additional information related to this transaction.
Definite-Lived Intangible Assets
The following table summarizes information related to definite-lived intangible assets (in millions):
December 31, 2012 December 31, 2011Gross Gross
Carrying Accumulated Carrying AccumulatedAmount Amortization Net Amount Amortization Net
Customer relationships $ 622 $ (166) $ 456 $ 619 $ (126) $ 493Bottlers’ franchise rights 730 (221) 509 668 (119) 549Trademarks 65 (43) 22 99 (70) 29Other 129 (77) 52 196 (130) 66
Total $ 1,546 $ (507) $ 1,039 $ 1,582 $ (445) $ 1,137
Total amortization expense for intangible assets subject to amortization was $173 million, $192 million and $102 million in 2012,2011 and 2010, respectively. Based on the carrying value of definite-lived intangible assets as of December 31, 2012, we estimateour amortization expense for the next five years will be as follows (in millions):
AmortizationExpense
2013 $ 1612014 1532015 1482016 1422017 90
112
NOTE 9: ACCOUNTS PAYABLE AND ACCRUED EXPENSES
Accounts payable and accrued expenses consisted of the following (in millions):
December 31, 2012 2011
Accrued marketing $ 2,231 $ 2,286Other accrued expenses 2,711 2,749Trade accounts payable 1,969 2,172Accrued compensation 1,045 1,048Sales, payroll and other taxes 389 405Container deposits 335 349
Accounts payable and accrued expenses $ 8,680 $ 9,009
NOTE 10: DEBT AND BORROWING ARRANGEMENTS
Short-Term Borrowings
Loans and notes payable consist primarily of commercial paper issued in the United States. As of December 31, 2012 and 2011,we had $16,204 million and $12,135 million, respectively, in outstanding commercial paper borrowings. Our weighted-averageinterest rates for commercial paper outstanding were approximately 0.3 percent and 0.2 percent per year as of December 31, 2012and 2011, respectively.
In addition, we had $7,768 million in lines of credit and other short-term credit facilities as of December 31, 2012, of which$854 million was related to the Company’s consolidated Philippine bottling operations that were classified as held for sale. TheCompany’s total lines of credit included $93 million that was outstanding and primarily related to our international operations.
Included in the credit facilities discussed above, the Company had $6,314 million in lines of credit for general corporate purposes.These backup lines of credit expire at various times from 2013 through 2017. There were no borrowings under these backup linesof credit during 2012. These credit facilities are subject to normal banking terms and conditions. Some of the financialarrangements require compensating balances, none of which is presently significant to our Company.
Long-Term Debt
During 2012, the Company retired $1,250 million of long-term notes upon maturity and issued $2,750 million of long-term debt.The general terms of the notes issued are as follows:
• $1,000 million total principal amount of notes due March 14, 2014, at a variable interest rate equal to the three-monthLondon Interbank Offered Rate (‘‘LIBOR’’) minus 0.05 percent;
• $1,000 million total principal amount of notes due March 13, 2015, at a fixed interest rate of 0.75 percent; and
• $750 million total principal amount of notes due March 14, 2018, at a fixed interest rate of 1.65 percent.
During 2011, the Company issued $2,979 million of long-term debt. We used $979 million of this newly issued debt and paid apremium of $208 million to exchange $1,022 million of existing long-term debt that was assumed in connection with ouracquisition of CCE’s former North America business. The remaining cash from the issuance was used to reduce the Company’soutstanding commercial paper balance and exchange a certain amount of short-term debt.
The general terms of the notes issued during 2011 are as follows:
• $1,655 million total principal amount of notes due September 1, 2016, at a fixed interest rate of 1.8 percent; and
• $1,324 million total principal amount of notes due September 1, 2021, at a fixed interest rate of 3.3 percent.
113

During the fourth quarter of 2011, the Company extinguished long-term debt that had a carrying value of $20 million and was notscheduled to mature until 2012. This debt was outstanding prior to the Company’s acquisition of CCE’s former North Americabusiness. In addition, the Company repurchased long-term debt during 2011 that was assumed in connection with our acquisitionof CCE’s former North America business. The repurchased debt included $99 million in unamortized fair value adjustmentsrecorded as part of our purchase accounting for the CCE transaction and was settled throughout the year as follows:
• During the first quarter of 2011, the Company repurchased all of our outstanding U.K. pound sterling notes that had acarrying value of $674 million;
• During the second quarter of 2011, the Company repurchased long-term debt that had a carrying value of $42 million; and
• During the third quarter of 2011, the Company repurchased long-term debt that had a carrying value of $19 million.
The Company recorded a net charge of $9 million in the line item interest expense in our consolidated statement of incomeduring the year ended December 31, 2011. This net charge was due to the exchange, repurchase and/or extinguishment oflong-term debt described above.
During 2010, in connection with the Company’s acquisition of CCE’s former North America business, we assumed $7,602 millionof long-term debt, which had an estimated fair value of approximately $9,345 million as of the acquisition date. We recorded theassumed debt at its fair value as of the acquisition date. Refer to Note 2.
On November 15, 2010, the Company issued $4,500 million of long-term notes and used some of the proceeds to repurchase$2,910 million of long-term debt. The remaining cash from the issuance was used to reduce our outstanding commercial paperbalance. The repurchased debt consisted of $1,827 million of debt assumed in our acquisition of CCE’s former North Americabusiness and $1,083 million of the Company’s debt that was outstanding prior to the acquisition. The Company recorded a chargeof $342 million in interest expense related to the premiums paid to repurchase the long-term debt and the costs associated withthe settlement of treasury rate locks issued in connection with the debt tender offer. The general terms of the notes issued onNovember 15, 2010, were as follows:
• $1,250 million total principal amount of notes due May 15, 2012, at a variable interest rate of three-month LIBOR plus0.05 percent;
• $1,250 million total principal amount of notes due November 15, 2013, at a fixed interest rate of 0.75 percent;
• $1,000 million total principal amount of notes due November 15, 2015, at a fixed interest rate of 1.5 percent; and
• $1,000 million total principal amount of notes due November 15, 2020, at a fixed interest rate of 3.15 percent.
Subsequent to the repurchase of a portion of the long-term debt assumed from CCE, the general terms of the debt assumed andremaining outstanding as of December 31, 2010, were as follows:
• $2,594 million total principal amount of U.S. dollar notes due 2011 to 2037 at an average interest rate of 5.7 percent;
• $2,288 million total principal amount of U.S. dollar debentures due 2012 to 2098 at an average interest rate of 7.4 percent;
• $275 million total principal amount of U.S. dollar notes due 2011 at a variable interest rate of 1.0 percent;
• $544 million total principal amount of U.K. pound sterling notes due 2016 and 2021 at an average interest rate of6.5 percent;
• $303 million principal amount of U.S. dollar zero coupon notes due 2020; and
• $26 million of other long-term debt.
114

The Company’s long-term debt consisted of the following (in millions, except average rate data):
December 31, 2012 December 31, 2011Average Average
Amount Rate1 Amount Rate1
U.S. dollar notes due 2013–2093 $ 13,407 1.7% $ 12,270 1.9%U.S. dollar debentures due 2017–2098 2,207 3.7 2,482 4.0U.S. dollar zero coupon notes due 20202 135 8.4 130 8.4Other, due through 20983 291 4.4 584 4.8Fair value adjustment4 273 N/A 231 N/A
Total5,6 $ 16,313 2.1% $ 15,697 2.3%Less current portion 1,577 2,041
Long-term debt $ 14,736 $ 13,656
1 These rates represent the weighted-average effective interest rate on the balances outstanding as of year end, as adjusted for the effects of interestrate swap agreements as well as fair value adjustments, if applicable. Refer to Note 5 for a more detailed discussion on interest rate management.
2 This amount is shown net of unamortized discounts of $36 million and $41 million as of December 31, 2012 and 2011, respectively.3 As of December 31, 2012, the amount shown includes $90 million of debt instruments that are due through 2022.4 Refer to Note 5 for additional information about our fair value hedging strategy.5 As of December 31, 2012 and 2011, the fair value of our long-term debt, including the current portion, was $17,157 million and $16,360 million,
respectively. The fair value of our long-term debt is estimated based on quoted prices for those or similar instruments.6 The above notes and debentures include various restrictions, none of which is presently significant to our Company.
The carrying value of the Company’s long-term debt included fair value adjustments related to the debt assumed from CCE of$617 million and $733 million as of December 31, 2012 and 2011, respectively. These fair value adjustments are being amortizedover the number of years remaining until the underlying debt matures. As of December 31, 2012, the weighted-average maturityof the assumed debt to which these fair value adjustments relate was approximately 17 years. The amortization of these fair valueadjustments will be a reduction of interest expense in future periods, which will typically result in our interest expense being lessthan the actual interest paid to service the debt. Total interest paid was $574 million, $573 million and $422 million in 2012, 2011and 2010, respectively.
Maturities of long-term debt for the five years succeeding December 31, 2012, are as follows (in millions):
Maturities ofLong-Term Debt
2013 $ 1,5772014 2,6332015 2,4512016 1,7052017 1,439
NOTE 11: COMMITMENTS AND CONTINGENCIES
Guarantees
As of December 31, 2012, we were contingently liable for guarantees of indebtedness owed by third parties of $671 million, ofwhich $294 million was related to VIEs. Refer to Note 1 for additional information related to the Company’s maximum exposureto loss due to our involvement with VIEs. Our guarantees are primarily related to third-party customers, bottlers, vendors andcontainer manufacturing operations and have arisen through the normal course of business. These guarantees have various terms,and none of these guarantees were individually significant. The amount represents the maximum potential future payments thatwe could be required to make under the guarantees; however, we do not consider it probable that we will be required to satisfythese guarantees.
We believe our exposure to concentrations of credit risk is limited due to the diverse geographic areas covered by our operations.
115

Legal Contingencies
The Company is involved in various legal proceedings. We establish reserves for specific legal proceedings when we determine thatthe likelihood of an unfavorable outcome is probable and the amount of loss can be reasonably estimated. Management has alsoidentified certain other legal matters where we believe an unfavorable outcome is reasonably possible and/or for which noestimate of possible losses can be made. Management believes that the total liabilities to the Company that may arise as a resultof currently pending legal proceedings will not have a material adverse effect on the Company taken as a whole.
During the period from 1970 to 1981, our Company owned Aqua-Chem, Inc., now known as Cleaver-Brooks, Inc. (‘‘Aqua-Chem’’).During that time, the Company purchased over $400 million of insurance coverage, which also insures Aqua-Chem for some of itsprior and future costs for certain product liability and other claims. A division of Aqua-Chem manufactured certain boilers thatcontained gaskets that Aqua-Chem purchased from outside suppliers. Several years after our Company sold this entity,Aqua-Chem received its first lawsuit relating to asbestos, a component of some of the gaskets. Aqua-Chem was first named as adefendant in asbestos lawsuits in or around 1985 and currently has approximately 40,000 active claims pending against it. InSeptember 2002, Aqua-Chem notified our Company that it believed we were obligated for certain costs and expenses associatedwith its asbestos litigations. Aqua-Chem demanded that our Company reimburse it for approximately $10 million for out-of-pocketlitigation-related expenses. Aqua-Chem also demanded that the Company acknowledge a continuing obligation to Aqua-Chem forany future liabilities and expenses that are excluded from coverage under the applicable insurance or for which there is noinsurance. Our Company disputes Aqua-Chem’s claims, and we believe we have no obligation to Aqua-Chem for any of its past,present or future liabilities, costs or expenses. Furthermore, we believe we have substantial legal and factual defenses toAqua-Chem’s claims. The parties entered into litigation in Georgia to resolve this dispute, which was stayed by agreement of theparties pending the outcome of litigation filed in Wisconsin by certain insurers of Aqua-Chem. In that case, five plaintiff insurancecompanies filed a declaratory judgment action against Aqua-Chem, the Company and 16 defendant insurance companies seeking adetermination of the parties’ rights and liabilities under policies issued by the insurers and reimbursement for amounts paid byplaintiffs in excess of their obligations. During the course of the Wisconsin insurance coverage litigation, Aqua-Chem and theCompany reached settlements with several of the insurers, including plaintiffs, who have or will pay funds into an escrow accountfor payment of costs arising from the asbestos claims against Aqua-Chem. On July 24, 2007, the Wisconsin trial court entered afinal declaratory judgment regarding the rights and obligations of the parties under the insurance policies issued by the remainingdefendant insurers, which judgment was not appealed. The judgment directs, among other things, that each insurer whose policy istriggered is jointly and severally liable for 100 percent of Aqua-Chem’s losses up to policy limits. The court’s judgment concludedthe Wisconsin insurance coverage litigation. The Georgia litigation remains subject to the stay agreement. The Company andAqua-Chem continued to negotiate with various insurers that were defendants in the Wisconsin insurance coverage litigation overthose insurers’ obligations to defend and indemnify Aqua-Chem for the asbestos-related claims. The Company anticipated that afinal settlement with three of those insurers (the ‘‘Chartis insurers’’) would be finalized in May 2011, but such insurers repudiatedtheir settlement commitments and, as a result, Aqua-Chem and the Company filed suit against them in Wisconsin state court toenforce the coverage-in-place settlement or, in the alternative, to obtain a declaratory judgment validating Aqua-Chem and theCompany’s interpretation of the court’s judgment in the Wisconsin insurance coverage litigation. In February 2012, the partiesfiled and argued a number of cross-motions for summary judgment related to the issues of the enforceability of the settlementagreement and the exhaustion of policies underlying those of the Chartis insurers. The court granted defendants’ motions forsummary judgment that the 2011 Settlement Agreement and 2010 Term Sheet were not binding contracts, but denied their similarmotions related to plaintiffs’ claims for promissory and/or equitable estoppel. On or about May 15, 2012, the parties entered intoa mutually agreeable settlement/stipulation resolving two major issues: exhaustion of underlying coverage and control of defense;and, on or about January 10, 2013, the parties reached a settlement of the remaining coverage issues and the estoppel claims. TheChartis insurers have filed a notice of appeal with respect to certain issues that were the subject of summary judgment ordersearlier in the case. Whatever the outcome of that appeal, these three insurance companies will remain subject to the court’sjudgment in the Wisconsin insurance coverage litigation.
The Company is unable to estimate at this time the amount or range of reasonably possible loss it may ultimately incur as a resultof asbestos-related claims against Aqua-Chem. The Company believes that assuming (a) the defense and indemnity costs for theasbestos-related claims against Aqua-Chem in the future are in the same range as during the past five years, and (b) the variousinsurers that cover the asbestos-related claims against Aqua-Chem remain solvent, regardless of the outcome of thecoverage-in-place settlement litigation but taking into account the issues resolved to date, insurance coverage for substantially alldefense and indemnity costs would be available for the next 10 to 15 years.
Indemnifications
At the time we acquire or divest our interest in an entity, we sometimes agree to indemnify the seller or buyer for specificcontingent liabilities. Management believes that any liability to the Company that may arise as a result of any such indemnificationagreements will not have a material adverse effect on the Company taken as a whole.
116

Tax Audits
The Company is involved in various tax matters, with respect to some of which the outcome is uncertain. These audits may resultin the assessment of additional taxes that are subsequently resolved with authorities or potentially through the courts. Refer toNote 14.
Risk Management Programs
The Company has numerous global insurance programs in place to help protect the Company from the risk of loss. In general, weare self-insured for large portions of many different types of claims; however, we do use commercial insurance above ourself-insured retentions to reduce the Company’s risk of catastrophic loss. Our reserves for the Company’s self-insured losses areestimated through actuarial procedures of the insurance industry and by using industry assumptions, adjusted for our specificexpectations based on our claim history. The Company’s self-insurance reserves totaled $508 million and $527 million as ofDecember 31, 2012 and 2011, respectively.
Workforce (Unaudited)
As of December 31, 2012, our Company had approximately 150,900 associates, of which approximately 68,300 associates werelocated in the United States. Our Company, through its divisions and subsidiaries, is a party to numerous collective bargainingagreements. As of December 31, 2012, approximately 17,900 associates in North America were covered by collective bargainingagreements. These agreements typically have terms of three to five years. We currently expect that we will be able to renegotiatesuch agreements on satisfactory terms when they expire. The Company believes that its relations with its associates are generallysatisfactory.
Operating Leases
The following table summarizes our minimum lease payments under noncancelable operating leases with initial or remaining leaseterms in excess of one year as of December 31, 2012 (in millions):
OperatingYears Ending December 31, Lease Payments
2013 $ 2332014 1622015 1282016 1012017 72Thereafter 235
Total minimum operating lease payments1 $ 931
1 Income associated with sublease arrangements is not significant.
NOTE 12: STOCK COMPENSATION PLANS
Our Company grants stock options and restricted stock awards to certain employees of the Company. Total stock-basedcompensation expense was $259 million, $354 million and $380 million in 2012, 2011 and 2010, respectively, and was included as acomponent of selling, general and administrative expenses in our consolidated statements of income. The total income tax benefitrecognized in our consolidated statements of income related to stock-based compensation arrangements was $72 million,$99 million and $110 million in 2012, 2011 and 2010, respectively.
As of December 31, 2012, we had $467 million of total unrecognized compensation cost related to nonvested stock-basedcompensation arrangements granted under our plans. This cost is expected to be recognized over a weighted-average period of1.8 years as stock-based compensation expense. This expected cost does not include the impact of any future stock-basedcompensation awards.
On July 27, 2012, the Company’s certificate of incorporation was amended to increase the number of authorized shares ofcommon stock from 5.6 billion to 11.2 billion and effect a two-for-one stock split of the common stock. The record date for thestock split was July 27, 2012, and the additional shares were distributed on August 10, 2012. Each shareowner of record on theclose of business on the record date received one additional share of common stock for each share held. All share and per sharedata presented herein reflect the impact of the increase in authorized shares and the stock split, as appropriate.
117

As a result of our acquisition of CCE’s former North America business, the Company assumed certain stock-based compensationplans previously sponsored by CCE. Shares from these plans remain available for future grant to current employees who wereemployees of CCE or its subsidiaries prior to the acquisition or who are hired by the Company or its subsidiaries following theacquisition. The assumed Coca-Cola Enterprises Inc. 2001 Stock Option Plan, Coca-Cola Enterprises Inc. 2004 Stock Award Planand Coca-Cola Enterprises Inc. 2007 Incentive Award Plan previously sponsored by CCE have approximately 29 million sharesavailable for grant after conversion of CCE common stock into our common stock. The Company has not granted any equityawards from the assumed plans.
Stock Option Plans
The fair value of our stock option grants is amortized over the vesting period, generally four years. The fair value of each optionaward is estimated on the grant date using a Black-Scholes-Merton option-pricing model. The weighted-average fair value ofoptions granted during the past three years and the weighted-average assumptions used in the Black-Scholes-Merton option-pricing model for such grants were as follows:
2012 2011 2010As Adjusted
Fair value of options at grant date $ 3.80 $ 4.64 $ 4.70Dividend yield1 2.7% 2.7% 2.9%Expected volatility2 18.0% 19.0% 20.0%Risk-free interest rate3 1.0% 2.3% 3.0%Expected term of the option4 5 years 5 years 6 years
1 The dividend yield is the calculated yield on the Company’s stock at the time of the grant.2 Expected volatility is based on implied volatilities from traded options on the Company’s stock, historical volatility of the Company’s stock and other
factors.3 The risk-free interest rate for the period matching the expected term of the option is based on the U.S. Treasury yield curve in effect at the time of
the grant.4 The expected term of the option represents the period of time that options granted are expected to be outstanding and is derived by analyzing
historic exercise behavior.
Generally, stock options granted from 1999 through July 2003 expire 15 years from the date of grant and stock options granted inDecember 2003 and thereafter expire 10 years from the date of grant. The shares of common stock to be issued, transferredand/or sold under the stock option plans are made available from authorized and unissued Company common stock or from theCompany’s treasury shares. In 2007, the Company began issuing common stock under these plans from the Company’s treasuryshares. The Company had the following active stock option plans as of December 31, 2012:
• The Coca-Cola Company 1999 Stock Option Plan (the ‘‘1999 Option Plan’’) was approved by shareowners in April 1999.Under the 1999 Option Plan, a maximum of 240 million shares of our common stock was approved to be issued ortransferred, through the grant of stock options, to certain officers and employees.
• The Coca-Cola Company 2002 Stock Option Plan (the ‘‘2002 Option Plan’’) was approved by shareowners in April 2002.An amendment to the 2002 Option Plan which permitted the issuance of stock appreciation rights was approved byshareowners in April 2003. Under the 2002 Option Plan, a maximum of 240 million shares of our common stock wasapproved to be issued or transferred, through the grant of stock options or stock appreciation rights, to certain officers andemployees. No stock appreciation rights have been issued under the 2002 Option Plan as of December 31, 2012.
• The Coca-Cola Company 2008 Stock Option Plan (the ‘‘2008 Option Plan’’) was approved by shareowners in April 2008.Under the 2008 Option Plan, a maximum of 280 million shares of our common stock was approved to be issued ortransferred to certain officers and employees pursuant to stock options granted under the 2008 Option Plan.
As of December 31, 2012, there were 132 million shares available to be granted under the stock option plans discussed above.Options to purchase common stock under all of these plans have generally been granted at the fair market value of theCompany’s stock at the date of grant.
118
Stock option activity for all stock option plans for the year ended December 31, 2012, was as follows:
Weighted-Average AggregateShares Weighted-Average Remaining Intrinsic Value
(In millions) Exercise Price Contractual Life (In millions)
Outstanding on January 1, 2012 — As Adjusted 323 $ 25.62Granted 53 34.40Exercised (61) 24.43Forfeited/expired (6) 30.01
Outstanding on December 31, 20121 309 $ 27.27 5.82 years $ 2,777
Expected to vest at December 31, 2012 305 $ 27.20 5.79 years $ 2,765
Exercisable on December 31, 2012 194 $ 24.92 4.41 years $ 2,200
1 Includes 4 million stock option replacement awards in connection with our acquisition of CCE’s former North America business in 2010. Theseoptions had a weighted-average exercise price of $18.32, and generally vest over 3 years and expire 10 years from the original date of grant.
The total intrinsic value of the options exercised was $780 million, $631 million and $524 million in 2012, 2011 and 2010,respectively. The total shares exercised were 61 million, 65 million and 73 million in 2012, 2011 and 2010, respectively.
Restricted Stock Award Plans
Under The Coca-Cola Company 1989 Restricted Stock Award Plan and The Coca-Cola Company 1983 Restricted Stock AwardPlan (the ‘‘Restricted Stock Award Plans’’), 80 million and 48 million shares of restricted common stock, respectively, wereoriginally available to be granted to certain officers and key employees of our Company. As of December 31, 2012, 32 millionshares remain available for grant under the Restricted Stock Award Plans. The Company issues restricted stock to employees as aresult of performance share unit awards, time-based awards and performance-based awards.
For awards prior to January 1, 2008, under the 1983 Restricted Stock Award Plan, participants are reimbursed by our Companyfor income taxes imposed on the award, but not for taxes generated by the reimbursement payment. The 1983 Restricted StockAward Plan has been amended to eliminate this tax reimbursement for awards after January 1, 2008. The shares are subject tocertain transfer restrictions and may be forfeited if a participant leaves our Company for reasons other than retirement, disabilityor death, absent a change in control of our Company.
Performance Share Unit Awards
In 2003, the Company established a program to grant performance share units under The Coca-Cola Company 1989 RestrictedStock Award Plan to executives. In 2008, the Company expanded the program to award a mix of stock options and performanceshare units to eligible employees in addition to executives. The number of shares earned is determined at the end of eachperformance period, generally three years, based on the actual performance criteria predetermined by the Board of Directors atthe time of grant. If the performance criteria are met, the award results in a grant of restricted stock or restricted stock units,which are then generally subject to a holding period in order for the restricted stock to be released. For performance share unitsgranted before 2008, this holding period is generally two years. For performance share units granted in 2008 and after, thisholding period is generally one year. Restrictions on such stock generally lapse at the end of the holding period. Performanceshare units generally do not pay dividends or allow voting rights during the performance period. For awards granted prior to 2011,participants generally receive dividends or dividend equivalents once the performance criteria have been certified and therestricted stock or restricted stock units have been issued. For awards granted in 2011 and later, participants generally receivedividends or dividend equivalents once the shares have been released. Accordingly, the fair value of the performance share units isthe quoted market value of the Company stock on the grant date less the present value of the expected dividends not receivedduring the relevant period. In the period it becomes probable that the minimum performance criteria specified in the plan will beachieved, we recognize expense for the proportionate share of the total fair value of the performance share units related to thevesting period that has already lapsed. The remaining cost of the grant is expensed on a straight-line basis over the balance of thevesting period. In the event the Company determines it is no longer probable that we will achieve the minimum performancecriteria specified in the plan, we reverse all of the previously recognized compensation expense in the period such a determinationis made.
119

Performance share units under The Coca-Cola Company 1989 Restricted Stock Award Plan require achievement of certainfinancial measures, primarily compound annual growth in earnings per share or economic profit. These financial measures areadjusted for certain items approved and certified by the Audit Committee of the Board of Directors. The purpose of theseadjustments is to ensure a consistent year to year comparison of the specific performance criteria. Economic profit is our netoperating profit after tax less the cost of the capital used in our business. In the event the financial results equal the predefinedtarget, the Company will grant the number of restricted shares equal to the target award in the underlying performance share unitagreements. In the event the financial results exceed the predefined target, additional shares up to the maximum award may begranted. In the event the financial results fall below the predefined target, a reduced number of shares may be granted. If thefinancial results fall below the threshold award performance level, no shares will be granted. Performance share units are generallysettled in stock, except for certain circumstances such as death or disability, where former employees or their beneficiaries areprovided a cash equivalent payment. As of December 31, 2012, performance share units of 5,105,000, 5,655,000 and 6,824,000were outstanding for the 2010–2012, 2011–2013 and 2012–2014 performance periods, respectively, based on the target awardamounts in the performance share unit agreements.
The following table summarizes information about performance share units based on the target award amounts in theperformance share unit agreements:
Weighted-AverageShare Units Grant-Date
(In thousands) Fair Value
Outstanding on January 1, 2012 — As Adjusted 11,366 $ 25.41Granted 7,034 29.95Paid in cash equivalent (16) 27.30Canceled/forfeited (800) 27.71
Outstanding on December 31, 20121 17,584 $ 28.01
1 The outstanding performance share units as of December 31, 2012, at the threshold award and maximum award levels were 8.8 million and26.4 million, respectively.
The weighted-average grant date fair value of performance share units granted was $29.95 in 2012, $25.58 in 2011 and $25.17 in2010. The Company converted performance share units of 16,267 in 2012, 19,462 in 2011 and 27,650 in 2010 to cash equivalentpayments of $0.6 million, $0.7 million and $0.7 million, respectively, to former executives who were ineligible for restricted stockgrants due to certain events such as death, disability or termination.
The following table summarizes information about the conversions of performance share units to restricted stock and restrictedstock units:
Weighted-AverageShare Units Grant-Date
(In thousands) Fair Value1
Nonvested on January 1, 2012 — As Adjusted2 4,444 $ 26.53Vested and released (4,302) 26.53Canceled/forfeited (44) 26.54
Nonvested on December 31, 20122 98 $ 26.54
1 The weighted-average grant-date fair value is based on the fair values of the performance share units granted.2 The nonvested shares as of January 1, 2012, and December 31, 2012, are presented at the performance share units certified award amount.
The total intrinsic value of restricted shares that were vested and released was $148 million, $72 million and $58 million in 2012,2011 and 2010, respectively. The total restricted share units vested and released in 2012 were 4,301,732 at the certified awardamount. In 2011 and 2010, the total restricted share units vested and released were 2,084,912 and 1,850,466, respectively.
Replacement performance share unit awards issued by the Company in connection with our acquisition of CCE’s former NorthAmerica business are not included in the tables or discussions above and were originally granted under the Coca-ColaEnterprises Inc. 2007 Incentive Award Plan. Refer to Note 2. These awards were converted into equivalent share units of theCompany’s common stock on the acquisition date and entitle the participant to dividend equivalents (which vest, in some cases,only if the restricted share units vest), but not the right to vote. Accordingly, the fair value of these units was the quoted value
120

of the Company’s stock at the grant date. The number of shares earned is determined at the end of each performance period,generally one to three years, based on the actual performance criteria predetermined at the time of grant. These performanceshare units require achievement of certain financial measures, primarily compound annual growth in earnings per share, asadjusted for certain items detailed in the plan documents. In the event the financial results exceed the predefined targets,additional shares up to a maximum of 200 percent of target may be granted. In the event the financial results fall below thepredefined targets, a reduced number of shares may be granted. If the financial results fall below the minimum awardperformance level, no shares will be granted.
On the acquisition date, the Company issued 3.3 million replacement performance share unit awards at target with a weightedaverage grant-date price of $29.56 per share unit for the 2008–2010, 2009 and 2010 performance periods. The 2008–2010 and the2010 performance period awards were projected to pay out at 200 percent on the acquisition date and were certified as such inFebruary 2011. The 2009 award was already certified at 200 percent prior to the acquisition date. In accordance with accountingprinciples generally accepted in the United States, the portion of the fair value of the replacement awards related to servicesprovided prior to the business combination was included in the total purchase price. Refer to Note 2. The portion of the fair valueassociated with future service is recognized as expense over the future service period. However, in the fourth quarter of 2010, theCompany modified primarily all of these performance awards to eliminate the remaining holding period after December 31, 2010,which resulted in $74 million of accelerated expense included in the total stock-based compensation expense above. As a result ofthis modification, the Company released 2.8 million shares at the 200 percent payout for the 2009 performance period awardduring the fourth quarter of 2010. The intrinsic value of the release of these shares was $91 million. During 2011, the Companyreleased 3.1 million shares at the 200 percent payout with an intrinsic value of $98 million, primarily related to the 2008–2010 and2010 performance periods. During 2012, the Company released 0.6 million shares at the 200 percent payout with an intrinsic valueof $22 million, primarily related to the 2009 performance period. As of December 31, 2012, the Company had 0.1 millionoutstanding replacement performance share units related to the 2009 performance period. The remaining shares are scheduled forrelease during the second quarter of 2013.
Time-Based and Performance-Based Restricted Stock and Restricted Stock Unit Awards
The Coca-Cola Company 1989 Restricted Stock Award Plan allows for the grant of time-based and performance-based restrictedstock and restricted stock units. The performance-based restricted awards are released only upon the achievement of specificmeasurable performance criteria. These awards pay dividends during the performance period. The majority of awards have specificperformance targets for achievement. If the performance targets are not met, the awards will be canceled. In the period itbecomes probable that the performance criteria will be achieved, we recognize expense for the proportionate share of the totalfair value of the grant related to the vesting period that has already lapsed. The remaining cost of the grant is expensed on astraight-line basis over the balance of the vesting period.
For time-based and performance-based restricted stock awards, participants are entitled to vote and receive dividends on therestricted shares. The Company also awards time-based and performance-based restricted stock units for which participants mayreceive payments of dividend equivalents but are not entitled to vote. As of December 31, 2012, the Company had outstandingnonvested time-based and performance-based restricted stock awards, including restricted stock units, of 774,000 and 92,000,respectively. Time-based and performance-based restricted awards were not significant to our consolidated financial statements.
In 2010, the Company issued time-based restricted stock unit replacement awards in connection with our acquisition of CCE’sformer North America business. Refer to Note 2. These awards were converted into equivalent shares of the Company’s commonstock. These restricted share awards entitle the participant to dividend equivalents (which vest, in some cases, only if the restrictedshare unit vests), but not the right to vote. As of December 31, 2012, the Company had 65,000 outstanding nonvested time-basedrestricted stock replacement awards, including restricted stock units. These time-based restricted awards were not significant toour consolidated financial statements.
NOTE 13: PENSION AND OTHER POSTRETIREMENT BENEFIT PLANS
Our Company sponsors and/or contributes to pension and postretirement health care and life insurance benefit plans coveringsubstantially all U.S. employees. We also sponsor nonqualified, unfunded defined benefit pension plans for certain associates. Inaddition, our Company and its subsidiaries have various pension plans and other forms of postretirement arrangements outsidethe United States.
Effective January 1, 2012, the Company elected to change our accounting methodology for determining the market-related valueof assets for our U.S. qualified defined benefit pension plans. This change in accounting methodology has been appliedretrospectively, and we have adjusted all applicable prior period financial information presented herein as required. Refer toNote 1 for further information related to this change and the impact it had on our consolidated financial statements.
121
As part of the Company’s acquisition of CCE’s former North America business during the fourth quarter of 2010, we assumedcertain liabilities related to pension and other postretirement benefit plans. Refer to Note 2 for additional information related tothis acquisition. These liabilities relate to various pension, retiree medical and defined contribution plans (referred to herein asthe ‘‘assumed plans’’). The assumed plans include participation in multi-employer pension plans in the United States. Seediscussion of multi-employer plans below.
We refer to the funded defined benefit pension plan in the United States that is not associated with collective bargainingorganizations as the ‘‘primary U.S. plan.’’ As of December 31, 2012, the primary U.S. plan represented 59 percent and 64 percentof the Company’s consolidated projected benefit obligation and pension assets, respectively.
Obligations and Funded Status
The following table sets forth the changes in benefit obligations and the fair value of plan assets for our benefit plans(in millions):
Pension Benefits Other Benefits2012 2011 2012 2011
Benefit obligation at beginning of year1 $ 8,255 $ 7,292 $ 953 $ 889Service cost 291 249 34 32Interest cost 388 391 43 45Foreign currency exchange rate changes (7) 30 3 2Amendments (3) (57) (2) (12)Actuarial loss (gain) 1,259 773 115 45Benefits paid2 (420) (440) (53) (63)Settlements (35) (24) — —Curtailments 6 — — —Special termination benefits 1 8 — 3Other3 (42) 33 11 12
Benefit obligation at end of year1 $ 9,693 $ 8,255 $ 1,104 $ 953
Fair value of plan assets at beginning of year $ 6,171 $ 5,497 $ 185 $ 187Actual return on plan assets 822 73 16 (4)Employer contributions 1,056 1,001 — —Foreign currency exchange rate changes (17) (1) — —Benefits paid (366) (374) (2) (1)Settlements (34) (27) — —Other3 (48) 2 3 3
Fair value of plan assets at end of year $ 7,584 $ 6,171 $ 202 $ 185
Net liability recognized $ (2,109) $ (2,084) $ (902) $ (768)
1 For pension benefit plans, the benefit obligation is the projected benefit obligation. For other benefit plans, the benefit obligation is the accumulatedpostretirement benefit obligation. The accumulated benefit obligation for our pension plans was $9,345 million and $7,958 million as ofDecember 31, 2012 and 2011, respectively.
2 Benefits paid to pension plan participants during 2012 and 2011 included $54 million and $66 million, respectively, in payments related to unfundedpension plans that were paid from Company assets. Benefits paid to participants of other benefit plans during 2012 and 2011 included $51 millionand $62 million, respectively, that were paid from Company assets.
3 In 2012, primarily relates to the transfer of assets and liabilities associated with the Company’s consolidated Philippine bottling operations to assetsheld for sale and liabilities held for sale as of December 31, 2012. Refer to Note 2 for additional information.
122

Pension and other benefit amounts recognized in our consolidated balance sheets are as follows (in millions):
Pension Benefits Other BenefitsDecember 31, 2012 2011 2012 2011
Noncurrent asset $ 395 $ 468 $ — $ —Current liability (73) (68) (21) (21)Long-term liability (2,431) (2,484) (881) (747)
Net liability recognized $ (2,109) $ (2,084) $ (902) $ (768)
Effective January 1, 2010, the Company’s existing primary U.S. plan was transitioned from a traditional final average pay formulato a cash balance formula. In general, employees may receive credits based on age, service, pay and interest under the newmethod. The pension plan acquired by the Company in connection with our acquisition of CCE’s former North America businesstransitioned to a cash balance formula in 2011.
Certain of our pension plans have projected benefit obligations in excess of the fair value of plan assets. For these plans, theprojected benefit obligations and the fair value of plan assets were as follows (in millions):
December 31, 2012 2011
Projected benefit obligation $ 9,161 $ 7,591Fair value of plan assets 6,659 5,048
Certain of our pension plans have accumulated benefit obligations in excess of the fair value of plan assets. For these plans, theaccumulated benefit obligations and the fair value of plan assets were as follows (in millions):
December 31, 2012 2011
Accumulated benefit obligation $ 8,736 $ 7,277Fair value of plan assets 6,546 4,998
Pension Plan Assets
The following table presents total assets for our U.S. and non-U.S. pension plans (in millions):
U.S. Plans Non-U.S. PlansDecember 31, 2012 2011 2012 2011
Cash and cash equivalents $ 299 $ 104 $ 87 $ 123Equity securities:
U.S.-based companies 1,844 1,362 37 33International-based companies 324 630 640 323
Fixed-income securities:Government bonds 399 358 163 415Corporate bonds and debt securities 856 669 126 49
Mutual, pooled and commingled funds1 1,057 323 453 406Hedge funds/limited partnerships 496 458 29 31Real estate 248 256 9 14Other 26 114 491 503
Total pension plan assets2 $ 5,549 $ 4,274 $ 2,035 $ 1,897
1 Mutual, pooled and commingled funds include investments in equity securities, fixed-income securities and combinations of both. There are asignificant number of mutual, pooled and commingled funds from which investors can choose. The selection of the type of fund is dictated by thespecific investment objectives and needs of a given plan. These objectives and needs vary greatly between plans.
2 Fair value disclosures related to our pension assets are included in Note 16. Fair value disclosures include, but are not limited to, the levels withinthe fair value hierarchy on which the fair value measurements in their entirety fall; a reconciliation of the beginning and ending balances of Level 3assets; and information about the valuation techniques and inputs used to measure the fair value of our pension and other postretirement assets.
123
Investment Strategy for U.S. Pension Plans
The Company utilizes the services of investment managers to actively manage the pension assets of our U.S. plans. We haveestablished asset allocation targets and investment guidelines with each investment manager. Our asset allocation targets promoteoptimal expected return and volatility characteristics given the long-term time horizon for fulfilling the obligations of the plan.Selection of the targeted asset allocation for U.S. plan assets was based upon a review of the expected return and riskcharacteristics of each asset class, as well as the correlation of returns among asset classes. During 2012, the Company revisedasset allocation targets and restructured the investment manager composition to further diversify investment risk and reducevolatility while maintaining long-term return objectives. Our revised target allocation is a mix of approximately 42 percent equityinvestments, 30 percent fixed-income investments and 28 percent alternative investments. As of December 31, 2012, the transitionto the new asset allocation targets was not complete, but we anticipate this transition being completed during the first quarter of2013. We believe this target allocation will enable us to achieve the following long-term investment objectives:
(1) optimize the long-term return on plan assets at an acceptable level of risk;
(2) maintain a broad diversification across asset classes and among investment managers;
(3) maintain careful control of the risk level within each asset class; and
(4) focus on a long-term return objective.
The guidelines that have been established with each investment manager provide parameters within which the investmentmanagers agree to operate, including criteria that determine eligible and ineligible securities, diversification requirements andcredit quality standards, where applicable. Unless exceptions have been approved, investment managers are prohibited frombuying or selling commodities, futures or option contracts, as well as from short selling of securities. Additionally, investmentmanagers agree to obtain written approval for deviations from stated investment style or guidelines. As of December 31, 2012, noinvestment manager was responsible for more than 10 percent of total U.S. plan assets.
Our target allocation of 42 percent equity investments is composed of approximately 60 percent in global equities, 16 percent inemerging market equities and 24 percent in domestic small- and mid-cap equities. Optimal returns through our investments inglobal equities are achieved through security selection as well as country and sector diversification. Investments in the commonstock of our Company accounted for approximately 5 percent of our global equities allocation and approximately 2 percent oftotal U.S. plan assets. Our investments in global equities are intended to provide diversified exposure to both U.S. and non-U.S.equity markets. Our investments in both emerging market equities and domestic small- and mid-cap equities are expected toexperience larger swings in their market value on a periodic basis. Our investments in these asset classes are selected based oncapital appreciation potential.
Our target allocation of 30 percent fixed-income investments is composed of 33 percent long-duration bonds and 67 percent withmulti-strategy alternative credit managers. Long-duration bonds provide a stable rate of return through investments in high-qualitypublicly traded debt securities. Our investments in long-duration bonds are diversified in order to mitigate duration and creditexposure. Multi-strategy alternative credit managers invest in a combination of high-yield bonds, bank loans, structured credit andemerging market debt. These investments are in lower-rated and non-rated debt securities, which generally produce higher returnscompared to long-duration bonds and also help to diversify our overall fixed-income portfolio.
In addition to investments in equity securities and fixed-income investments, we have a target allocation of 28 percent inalternative investments. These alternative investments include hedge funds, reinsurance, private equity limited partnerships,leveraged buyout funds, international venture capital partnerships and real estate. The objective of investing in alternativeinvestments is to provide a higher rate of return than that available from publicly traded equity securities. These investments areinherently illiquid and require a long-term perspective in evaluating investment performance.
Investment Strategy for Non-U.S. Pension Plans
As of December 31, 2012, the long-term target allocation for 45 percent of our international subsidiaries’ plan assets, primarilycertain of our European plans, is 56 percent equity securities and 44 percent fixed-income securities. The actual allocation for theremaining 55 percent of the Company’s international subsidiaries’ plan assets consisted of 38 percent mutual, pooled andcommingled funds; 16 percent equity securities; 15 percent fixed-income securities; and 31 percent other investments. Theinvestment strategies of our international subsidiaries differ greatly, and in some instances are influenced by local law. None ofour pension plans outside the United States is individually significant for separate disclosure.
124

Other Postretirement Benefit Plan Assets
Plan assets associated with other benefits primarily represent funding of the U.S. postretirement benefit plan through a U.S.Voluntary Employee Beneficiary Association (‘‘VEBA’’), a tax-qualified trust. The VEBA assets remain segregated from theprimary U.S. pension master trust and are primarily invested in liquid assets due to the level of expected future benefit payments.
The following table presents total assets for our other postretirement benefit plans (in millions):
December 31, 2012 2011
Cash and cash equivalents $ 13 $ 86Equity securities:
U.S.-based companies 81 70International-based companies 4 13
Fixed-income securities:Government bonds 78 2Corporate bonds and debt securities 5 6
Mutual, pooled and commingled funds 16 3Hedge funds/limited partnerships 3 2Real estate 2 2Other — 1
Total other postretirement benefit plan assets1 $ 202 $ 185
1 Fair value disclosures related to our other postretirement benefit plan assets are included in Note 16. Fair value disclosures include, but are notlimited to, the levels within the fair value hierarchy on which the fair value measurements in their entirety fall; a reconciliation of the beginning andending balances of Level 3 assets; and information about the valuation techniques and inputs used to measure the fair value of our pension andother postretirement assets.
Components of Net Periodic Benefit Cost
Net periodic benefit cost for our pension and other postretirement benefit plans consisted of the following (in millions):
Pension Benefits Other BenefitsYear Ended December 31, 2012 2011 2010 2012 2011 2010
As Adjusted
Service cost $ 291 $ 249 $ 143 $ 34 $ 32 $ 24Interest cost 388 391 260 43 45 30Expected return on plan assets (573) (508) (285) (8) (8) (8)Amortization of prior service cost (credit) (2) 5 5 (52) (61) (61)Amortization of actuarial loss 137 82 83 6 2 3
Net periodic benefit cost (credit) $ 241 $ 219 $ 206 $ 23 $ 10 $ (12)Settlement charge 3 3 6 — — —Curtailment charge 6 — — — — —Special termination benefits1 1 8 — — 3 1
Total cost (credit) recognized in the statements of income $ 251 $ 230 $ 212 $ 23 $ 13 $ (11)
1 The special termination benefits primarily relate to the Company’s productivity, restructuring and integration initiatives. Refer to Note 18 foradditional information related to our productivity, restructuring and integration initiatives.
125

The following table sets forth the changes in AOCI for our benefit plans (in millions, pretax):
Pension Benefits Other BenefitsDecember 31, 2012 2011 2012 2011
As Adjusted
Beginning balance in AOCI $ (2,169) $ (1,101) $ (34) $ 72Recognized prior service cost (credit) (2) 5 (52) (61)Recognized net actuarial loss (gain) 140 85 6 2Prior service credit (cost) arising in current year 3 57 2 12Net actuarial (loss) gain arising in current year (1,009) (1,208) (107) (57)Foreign currency translation gain (loss) 5 (7) (1) (2)
Ending balance in AOCI $ (3,032) $ (2,169) $ (186) $ (34)
The following table sets forth amounts in AOCI for our benefit plans (in millions, pretax):
Pension Benefits Other BenefitsDecember 31, 2012 2011 2012 2011
As Adjusted
Prior service credit (cost) $ 16 $ 14 $ 23 $ 73Net actuarial loss (3,048) (2,183) (209) (107)
Ending balance in AOCI $ (3,032) $ (2,169) $ (186) $ (34)
Amounts in AOCI expected to be recognized as components of net periodic pension cost in 2013 are as follows (in millions,pretax):
Pension Benefits Other Benefits
Amortization of prior service cost (credit) $ (3) $ (10)Amortization of actuarial loss 238 11
$ 235 $ 1
Assumptions
Certain weighted-average assumptions used in computing the benefit obligations are as follows:
Pension Benefits Other BenefitsDecember 31, 2012 2011 2012 2011
Discount rate 4.00% 4.75% 4.00% 4.75%Rate of increase in compensation levels 3.50% 3.25% N/A N/A
Certain weighted-average assumptions used in computing net periodic benefit cost are as follows:
Pension Benefits Other BenefitsDecember 31, 2012 2011 2010 2012 2011 2010
Discount rate 4.75% 5.50% 5.75% 4.75% 5.25% 5.50%Rate of increase in compensation levels 3.25% 4.00% 3.75% N/A N/A N/AExpected long-term rate of return on plan assets 8.25% 8.25% 8.00% 4.75% 4.75% 4.75%
The expected long-term rate of return assumption for U.S. pension plan assets is based upon the target asset allocation and isdetermined using forward-looking assumptions in the context of historical returns and volatilities for each asset class, as well ascorrelations among asset classes. We evaluate the rate of return assumption on an annual basis. The expected long-term rate ofreturn assumption used in computing 2012 net periodic pension cost for the U.S. plans was 8.5 percent. As of December 31,
126

2012, the 10-year annualized return on plan assets in the primary U.S. plan was 8.4 percent, the 15-year annualized return was6.1 percent, and the annualized return since inception was 11.0 percent.
The assumed health care cost trend rates are as follows:
December 31, 2012 2011
Health care cost trend rate assumed for next year 8.00% 8.00%Rate to which the cost trend rate is assumed to decline (the ultimate trend rate) 5.00% 5.00%Year that the rate reaches the ultimate trend rate 2019 2018
The Company’s U.S. postretirement benefit plans are primarily defined dollar benefit plans that limit the effects of medicalinflation because the plans have established dollar limits for determining our contributions. As a result, the effect of a1 percentage point change in the assumed health care cost trend rate would not be significant to the Company.
The discount rate assumptions used to account for pension and other postretirement benefit plans reflect the rates at which thebenefit obligations could be effectively settled. Rates for each of our U.S. plans at December 31, 2012, were determined using acash flow matching technique whereby the rates of a yield curve, developed from high-quality debt securities, were applied to thebenefit obligations to determine the appropriate discount rate. For our non-U.S. plans, we base the discount rate on comparableindices within each of the countries. The rate of compensation increase assumption is determined by the Company based uponannual reviews. We review external data and our own historical trends for health care costs to determine the health care costtrend rate assumptions.
Cash Flows
Our estimated future benefit payments for funded and unfunded plans are as follows (in millions):
Year Ended December 31, 2013 2014 2015 2016 2017 2018–2022
Pension benefit payments $ 452 $ 473 $ 493 $ 510 $ 542 $ 2,929Other benefit payments1 58 61 64 65 66 352
Total estimated benefit payments $ 510 $ 534 $ 557 $ 575 $ 608 $ 3,281
1 The expected benefit payments for our other postretirement benefit plans are net of estimated federal subsidies expected to be received under theMedicare Prescription Drug, Improvement and Modernization Act of 2003. Federal subsidies are estimated to be approximately $18 million for theperiod 2013–2017, and $22 million for the period 2018–2022.
On March 23, 2010, the Patient Protection and Affordable Care Act (HR 3590) (the ‘‘Act’’) was signed into law. As a result ofthis legislation, entities are no longer eligible to receive a tax deduction for the portion of prescription drug expenses reimbursedunder the Medicare Part D subsidy. This change resulted in a reduction of our deferred tax assets and a corresponding charge toincome tax expense of $14 million during the first quarter of 2010.
The Company anticipates making pension contributions in 2013 of approximately $640 million, of which approximately$359 million will be allocated to our primary U.S. plan. The majority of these contributions are discretionary.
Defined Contribution Plans
Our Company sponsors qualified defined contribution plans covering substantially all U.S. employees. Under the largest U.S.defined contribution plan, we match participants’ contributions up to a maximum of 3.5 percent of compensation, subject tocertain limitations. Company costs related to the U.S. plans were $93 million, $78 million and $44 million in 2012, 2011 and 2010,respectively. We also sponsor defined contribution plans in certain locations outside the United States. Company costs associatedwith those plans were $29 million, $31 million and $35 million in 2012, 2011 and 2010, respectively.
Multi-Employer Plans
As a result of our acquisition of CCE’s former North America business during the fourth quarter of 2010, the Company nowparticipates in various multi-employer pension plans in the United States. Multi-employer pension plans are designed to coveremployees from multiple employers and are typically established under collective bargaining agreements. These plans allowmultiple employers to pool their pension resources and realize efficiencies associated with the daily administration of the plan.
Multi-employer plans are generally governed by a board of trustees composed of management and labor representatives and arefunded through employer contributions.
127

The Company’s expense for U.S. multi-employer pension plans totaled $31 million and $69 million in 2012 and 2011,respectively. In 2011, the Company’s expense for U.S. multi-employer pension plans included charges of $32 million related tothe withdrawal from certain of these plans in connection with the Company’s integration initiatives in North America. Refer toNote 18 for additional information related to these initiatives. The plans we currently participate in have contractualarrangements that extend into 2017. If, in the future, we choose to withdraw from any of the multi-employer pension plans inwhich we currently participate, we would need to record the appropriate withdrawal liabilities at that time.
NOTE 14: INCOME TAXES
Income before income taxes consisted of the following (in millions):
Year Ended December 31, 2012 2011 2010As Adjusted
United States1 $ 3,526 $ 3,029 $ 7,188International 8,283 8,429 7,019
Total $ 11,809 $ 11,458 $ 14,207
1 In 2010, the Company’s U.S. income before income taxes included a $4,978 million gain due to the remeasurement of our equity investment inCCE to fair value upon our acquisition of CCE’s former North America business. Refer to Note 2 for additional information.
Income tax expense consisted of the following for the years ended December 31, 2012, 2011 and 2010 (in millions):
United States State and Local International Total
2012Current $ 602 $ 74 $ 1,415 $ 2,091Deferred 936 33 (337) 632
2011 — As AdjustedCurrent $ 286 $ 66 $ 1,425 $ 1,777Deferred 898 27 110 1,035
2010 — As AdjustedCurrent $ 469 $ 85 $ 1,212 $ 1,766Deferred 586 2 16 604
We made income tax payments of $981 million, $1,612 million and $1,766 million in 2012, 2011 and 2010, respectively.
A reconciliation of the statutory U.S. federal tax rate and our effective tax rate is as follows:
Year Ended December 31, 2012 2011 2010As Adjusted
Statutory U.S. federal tax rate 35.0% 35.0% 35.0%State and local income taxes — net of federal benefit 1.1 0.9 0.6Earnings in jurisdictions taxed at rates different from the statutory U.S. federal rate (9.5)1,2 (9.5)5,6,7 (5.6)15
Reversal of valuation allowances (2.4)3 — —Equity income or loss (2.0) (1.4)8 (1.9)16
CCE transaction — — (12.5)17,18
Sale of Norwegian and Swedish bottling operations — —9 0.419
Other operating charges 0.44 0.310 0.420
Other — net 0.5 (0.8)11,12,13,14 0.321,22
Effective tax rate 23.1% 24.5% 16.7%
1 Includes a tax expense of $133 million (or a 1.1 percent impact on our effective tax rate) related to amounts required to be recorded for changesto our uncertain tax positions, including interest and penalties, in various international jurisdictions.
2 Includes a tax expense of $57 million on pretax net gains of $76 million (or a 0.3 percent impact on our effective tax rate) related to thefollowing: a gain recognized as a result of the merger of Embotelladora Andina S.A. (‘‘Andina’’) and Embotelladoras Coca-Cola Polar S.A.(‘‘Polar’’); a gain recognized as a result of Coca-Cola FEMSA, an equity method investee, issuing additional shares of its own stock
128

at a per share amount greater than the carrying value of the Company’s per share investment; the loss recognized on the pending sale of a majorityownership interest in our consolidated Philippine bottling operations to Coca-Cola FEMSA; and the expense recorded for the premium theCompany paid over the publicly traded market price to acquire an ownership interest in Mikuni. Refer to Note 17.
3 Relates to a net tax benefit of $283 million associated with the reversal of valuation allowances in certain of the Company’s foreign jurisdictions.4 Includes a tax benefit of $95 million on pretax charges of $416 million (or a 0.4 percent impact on our effective tax rate) primarily related to the
Company’s productivity and reinvestment program as well as other restructuring initiatives; the refinement of previously established accruals relatedto the Company’s 2008–2011 productivity initiatives; and the refinement of previously established accruals related to the Company’s integration ofCCE’s former North America business. Refer to Note 18.
5 Includes a tax benefit of $6 million related to amounts required to be recorded for changes to our uncertain tax positions, including interest andpenalties, in various international jurisdictions.
6 Includes a zero percent effective tax rate on pretax charges of $17 million due to the impairment of available-for-sale securities. Refer to Note 3and Note 17.
7 Includes a tax expense of $299 million on pretax net gains of $641 million (or a 0.7 percent impact on our effective tax rate) related to the net gainrecognized as a result of the merger of Embotelladoras Arca, S.A.B. de C.V. (‘‘Arca’’) and Grupo Continental S.A.B. (‘‘Contal’’); the gainrecognized on the sale of our investment in Embonor; and gains the Company recognized as a result of Coca-Cola FEMSA, an equity methodinvestee, issuing additional shares of its own stock at per share amounts greater than the carrying value of the Company’s per share investment.These gains were partially offset by charges associated with certain of the Company’s equity method investments in Japan. Refer to Note 17.
8 Includes a tax benefit of $7 million on pretax net charges of $53 million (or a 0.1 percent impact on our effective tax rate) related to ourproportionate share of asset impairments and restructuring charges recorded by certain of our equity method investees. Refer to Note 17.
9 Includes a tax benefit of $2 million on pretax charges of $5 million related to the finalization of working capital adjustments on the sale of ourNorwegian and Swedish bottling operations. Refer to Note 2 and Note 17.
10 Includes a tax benefit of $224 million on pretax charges of $732 million (or a 0.3 percent impact on our effective tax rate) primarily related to theCompany’s productivity, integration and restructuring initiatives; transaction costs incurred in connection with the merger of Arca and Contal; costsassociated with the earthquake and tsunami that devastated northern and eastern Japan; and costs associated with the flooding in Thailand. Referto Note 17.
11 Includes a tax benefit of $8 million on pretax charges of $19 million related to the amortization of favorable supply contracts acquired inconnection with our acquisition of CCE’s former North America business.
12 Includes a tax benefit of $3 million on pretax net charges of $9 million related to the repurchase and/or exchange of certain long-term debtassumed in connection with our acquisition of CCE’s former North America business as well as the early extinguishment of certain other long-termdebt. Refer to Note 10.
13 Includes a tax benefit of $14 million on pretax charges of $41 million related to the impairment of an investment in an entity accounted for underthe equity method of accounting. Refer to Note 17.
14 Includes a tax benefit of $2 million related to amounts required to be recorded for changes to our uncertain tax positions, including interest andpenalties, in certain domestic jurisdictions.
15 Includes a tax expense of $265 million (or a 1.9 percent impact on our effective tax rate) primarily related to deferred tax expense on certaincurrent year undistributed foreign earnings that are not considered indefinitely reinvested and amounts required to be recorded for changes to ouruncertain tax positions, including interest and penalties.
16 Includes a tax benefit of $9 million on pretax net charges of $66 million (or a 0.1 percent impact on our effective tax rate) related to chargesrecorded by our equity method investees. Refer to Note 17.
17 Includes a tax benefit of $34 million on a pretax gain of $4,978 million (or a reduction of 12.5 percent on our effective tax rate) related to theremeasurement of our equity investment in CCE to fair value upon our acquisition of CCE’s former North America business. The tax benefitreflects the impact of reversing deferred tax liabilities associated with our equity investment in CCE prior to the acquisition. Refer to Note 2.
18 Includes a tax benefit of $99 million on pretax charges of $265 million related to the write-off of preexisting relationships with CCE. Refer toNote 2.
19 Includes a tax expense of $261 million on a pretax gain of $597 million (or a 0.4 percent impact on our effective tax rate) related to the sale of ourNorwegian and Swedish bottling operations. Refer to Note 2.
20 Includes a tax benefit of $223 million on pretax charges of $819 million (or a 0.4 percent impact on our effective tax rate) primarily related to theCompany’s productivity, integration and restructuring initiatives, transaction costs and charitable contributions. Refer to Note 17.
21 Includes a tax benefit of $114 million on pretax charges of $493 million (or a 0.5 percent impact on our effective tax rate) related to the repurchaseof certain long-term debt and costs associated with the settlement of treasury rate locks issued in connection with the debt tender offer; the lossrelated to the remeasurement of our Venezuelan subsidiary’s net assets; other-than-temporary impairment charges; and a donation of preferredshares in one of our equity method investees. Refer to Note 17.
22 Includes a tax expense of $31 million (or a 0.2 percent impact on our effective tax rate) related to amounts required to be recorded for changes toour uncertain tax positions, including interest and penalties, and other tax matters in certain domestic jurisdictions.
129
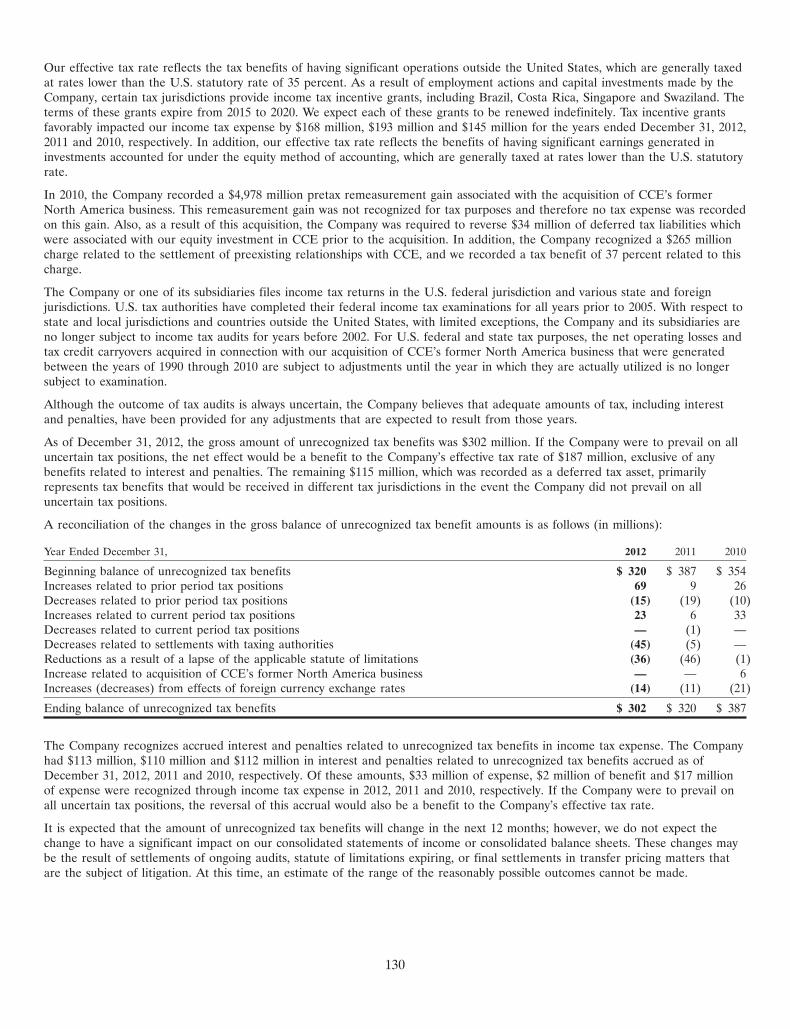
Our effective tax rate reflects the tax benefits of having significant operations outside the United States, which are generally taxedat rates lower than the U.S. statutory rate of 35 percent. As a result of employment actions and capital investments made by theCompany, certain tax jurisdictions provide income tax incentive grants, including Brazil, Costa Rica, Singapore and Swaziland. Theterms of these grants expire from 2015 to 2020. We expect each of these grants to be renewed indefinitely. Tax incentive grantsfavorably impacted our income tax expense by $168 million, $193 million and $145 million for the years ended December 31, 2012,2011 and 2010, respectively. In addition, our effective tax rate reflects the benefits of having significant earnings generated ininvestments accounted for under the equity method of accounting, which are generally taxed at rates lower than the U.S. statutoryrate.
In 2010, the Company recorded a $4,978 million pretax remeasurement gain associated with the acquisition of CCE’s formerNorth America business. This remeasurement gain was not recognized for tax purposes and therefore no tax expense was recordedon this gain. Also, as a result of this acquisition, the Company was required to reverse $34 million of deferred tax liabilities whichwere associated with our equity investment in CCE prior to the acquisition. In addition, the Company recognized a $265 millioncharge related to the settlement of preexisting relationships with CCE, and we recorded a tax benefit of 37 percent related to thischarge.
The Company or one of its subsidiaries files income tax returns in the U.S. federal jurisdiction and various state and foreignjurisdictions. U.S. tax authorities have completed their federal income tax examinations for all years prior to 2005. With respect tostate and local jurisdictions and countries outside the United States, with limited exceptions, the Company and its subsidiaries areno longer subject to income tax audits for years before 2002. For U.S. federal and state tax purposes, the net operating losses andtax credit carryovers acquired in connection with our acquisition of CCE’s former North America business that were generatedbetween the years of 1990 through 2010 are subject to adjustments until the year in which they are actually utilized is no longersubject to examination.
Although the outcome of tax audits is always uncertain, the Company believes that adequate amounts of tax, including interestand penalties, have been provided for any adjustments that are expected to result from those years.
As of December 31, 2012, the gross amount of unrecognized tax benefits was $302 million. If the Company were to prevail on alluncertain tax positions, the net effect would be a benefit to the Company’s effective tax rate of $187 million, exclusive of anybenefits related to interest and penalties. The remaining $115 million, which was recorded as a deferred tax asset, primarilyrepresents tax benefits that would be received in different tax jurisdictions in the event the Company did not prevail on alluncertain tax positions.
A reconciliation of the changes in the gross balance of unrecognized tax benefit amounts is as follows (in millions):
Year Ended December 31, 2012 2011 2010
Beginning balance of unrecognized tax benefits $ 320 $ 387 $ 354Increases related to prior period tax positions 69 9 26Decreases related to prior period tax positions (15) (19) (10)Increases related to current period tax positions 23 6 33Decreases related to current period tax positions — (1) —Decreases related to settlements with taxing authorities (45) (5) —Reductions as a result of a lapse of the applicable statute of limitations (36) (46) (1)Increase related to acquisition of CCE’s former North America business — — 6Increases (decreases) from effects of foreign currency exchange rates (14) (11) (21)
Ending balance of unrecognized tax benefits $ 302 $ 320 $ 387
The Company recognizes accrued interest and penalties related to unrecognized tax benefits in income tax expense. The Companyhad $113 million, $110 million and $112 million in interest and penalties related to unrecognized tax benefits accrued as ofDecember 31, 2012, 2011 and 2010, respectively. Of these amounts, $33 million of expense, $2 million of benefit and $17 millionof expense were recognized through income tax expense in 2012, 2011 and 2010, respectively. If the Company were to prevail onall uncertain tax positions, the reversal of this accrual would also be a benefit to the Company’s effective tax rate.
It is expected that the amount of unrecognized tax benefits will change in the next 12 months; however, we do not expect thechange to have a significant impact on our consolidated statements of income or consolidated balance sheets. These changes maybe the result of settlements of ongoing audits, statute of limitations expiring, or final settlements in transfer pricing matters thatare the subject of litigation. At this time, an estimate of the range of the reasonably possible outcomes cannot be made.
130

As of December 31, 2012, undistributed earnings of the Company’s foreign subsidiaries amounted to $26.9 billion. Those earningsare considered to be indefinitely reinvested and, accordingly, no U.S. federal and state income taxes have been provided thereon.Upon distribution of those earnings in the form of dividends or otherwise, the Company would be subject to both U.S. incometaxes (subject to an adjustment for foreign tax credits) and withholding taxes payable to the various foreign countries.Determination of the amount of unrecognized deferred U.S. income tax liability is not practical because of the complexitiesassociated with its hypothetical calculation; however, unrecognized foreign tax credits would be available to reduce a portion ofthe U.S. tax liability.
The tax effects of temporary differences and carryforwards that give rise to deferred tax assets and liabilities consist of thefollowing (in millions):
December 31, 2012 2011
Deferred tax assets:Property, plant and equipment $ 89 $ 224Trademarks and other intangible assets 77 68Equity method investments (including foreign currency translation adjustment) 209 278Derivative financial instruments 116 43Other liabilities 1,178 1,257Benefit plans 1,808 2,022Net operating/capital loss carryforwards 782 818Other 320 418
Gross deferred tax assets $ 4,579 $ 5,128Valuation allowances (487) (859)
Total deferred tax assets1,2 $ 4,092 $ 4,269
Deferred tax liabilities:Property, plant and equipment $ (2,204) $ (2,039)Trademarks and other intangible assets (4,133) (4,201)Equity method investments (including foreign currency translation adjustment) (712) (816)Derivative financial instruments (140) (129)Other liabilities (144) (129)Benefit plans (495) (445)Other (929) (753)
Total deferred tax liabilities3 $ (8,757) $ (8,512)
Net deferred tax liabilities $ (4,665) $ (4,243)
1 Noncurrent deferred tax assets of $403 million and $243 million were included in the line item other assets in our consolidated balance sheets as ofDecember 31, 2012 and 2011, respectively.
2 Current deferred tax assets of $244 million and $227 million were included in the line item prepaid expenses and other assets in our consolidatedbalance sheets as of December 31, 2012 and 2011, respectively.
3 Current deferred tax liabilities of $331 million and $19 million were included in the line item accounts payable and accrued expenses in ourconsolidated balance sheets as of December 31, 2012 and 2011, respectively.
As of December 31, 2012 and 2011, we had $70 million of net deferred tax assets and $491 million of net deferred tax liabilitieslocated in countries outside the United States.
As of December 31, 2012, we had $6,494 million of loss carryforwards available to reduce future taxable income. Losscarryforwards of $279 million must be utilized within the next five years, and the remainder can be utilized over a period greaterthan five years.
131

An analysis of our deferred tax asset valuation allowances is as follows (in millions):
Year Ended December 31, 2012 2011 2010
Balance at beginning of year $ 859 $ 950 $ 681Increase due to our acquisition of CCE’s former North America business — — 291Additions 126 138 115Decrease due to transfer to assets held for sale (146) — —Deductions (352) (229) (137)
Balance at end of year $ 487 $ 859 $ 950
The Company’s deferred tax asset valuation allowances are primarily the result of uncertainties regarding the future realization ofrecorded tax benefits on tax loss carryforwards from operations in various jurisdictions. These valuation allowances were primarilyrelated to deferred tax assets generated from net operating losses. Current evidence does not suggest we will realize sufficienttaxable income of the appropriate character within the carryforward period to allow us to realize these deferred tax benefits. If wewere to identify and implement tax planning strategies to recover these deferred tax assets or generate sufficient income of theappropriate character in these jurisdictions in the future, it could lead to the reversal of these valuation allowances and areduction of income tax expense. The Company believes that it will generate sufficient future taxable income to realize the taxbenefits related to the remaining net deferred tax assets in our consolidated balance sheets.
In 2012, the Company recognized a net decrease of $372 million in its valuation allowances. This decrease was primarily related tothe reversal of valuation allowances in several foreign jurisdictions. As a result of considering recent significant positive evidence,including, among other items, a consistent pattern of earnings in the past three years, as well as business plans showing continuedprofitability, it was determined that a valuation allowance was no longer required for certain deferred tax assets primarily recordedon net operating losses in foreign jurisdictions. This decrease was also partially due to a transfer of a valuation allowance intoassets held for sale as required by accounting principles generally accepted in the United States upon execution of the sharepurchase agreement for the sale of a majority interest in our consolidated Philippine bottling operations. Refer to Note 1 foradditional information on the Company’s accounting policy related to assets and liabilities held for sale. Refer to Note 2 foradditional information on the Company’s Philippine bottling operations. In addition, the Company recognized an increase in itsvaluation allowances primarily due to the addition of a deferred tax asset and related valuation allowance on certain investmentsaccounted for under the equity method of accounting and increases in net operating losses during the normal course of businessoperations.
In 2011, the Company recognized a net decrease of $91 million in its valuation allowances. This decrease was primarily related tothe utilization of net operating losses during the normal course of business operations; the reversal of a deferred tax asset andrelated valuation allowance on certain expiring attributes; and the reversal of a deferred tax asset and related valuation allowanceon certain equity investments. In addition, the Company recognized an increase in the valuation allowances primarily due to thecarryforward of expenses disallowed in the current year and increases in net operating losses during the normal course of businessoperations.
In 2010, the Company recognized a net increase of $269 million in its valuation allowances. This increase was primarily related tovaluation allowances on various tax loss carryforwards acquired in conjunction with our acquisition of CCE’s former NorthAmerica business. The Company also recognized an increase in the valuation allowances due to the carryforward of expensesdisallowed in the current year and changes to deferred tax assets and a related valuation allowance on certain equity methodinvestments. In addition, the Company recognized a reduction in the valuation allowances primarily due to the reversal of adeferred tax asset and related valuation allowance on certain expiring attributes; the reversal of a deferred tax asset and relatedvaluation allowance related to the deconsolidation of certain entities; and the impact of foreign currency fluctuations.
132

NOTE 15: OTHER COMPREHENSIVE INCOME
AOCI attributable to shareowners of The Coca-Cola Company is separately presented on our consolidated balance sheets as acomponent of The Coca-Cola Company’s shareowners’ equity, which also includes our proportionate share of equity methodinvestees’ AOCI. Other comprehensive income (loss) (‘‘OCI’’) attributable to noncontrolling interests is allocated to, and includedin, our balance sheets as part of the line item equity attributable to noncontrolling interests. AOCI attributable to shareowners ofThe Coca-Cola Company consisted of the following (in millions):
December 31, 2012 2011As Adjusted
Foreign currency translation adjustment $ (1,665) $ (1,445)Accumulated derivative net gains (losses) 46 (53)Unrealized net gains (losses) on available-for-sale securities 338 160Adjustments to pension and other benefit liabilities (2,104) (1,436)
Accumulated other comprehensive income (loss) $ (3,385) $ (2,774)
OCI attributable to shareowners of The Coca-Cola Company, including our proportionate share of equity method investees’ OCI,for the years ended December 31, 2012, 2011 and 2010, is as follows (in millions):
Before-Tax Income After-TaxAmount Tax Amount
2012Net foreign currency translation adjustment $ (219) $ (1) $ (220)
Derivatives:Unrealized gains (losses) arising during the year 77 (29) 48Reclassification adjustments recognized in net income 82 (31) 51
Net gain (loss) on derivatives1 159 (60) 99
Available-for-sale securities:Unrealized gains (losses) arising during the year 248 (64) 184Reclassification adjustments recognized in net income (6) — (6)
Net change in unrealized gain (loss) on available-for-sale securities2 242 (64) 178
Pension and other benefit liabilities:Net pension and other benefits arising during the year (1,132) 405 (727)Reclassification adjustments recognized in net income 92 (33) 59
Net change in pension and other benefit liabilities3 (1,040) 372 (668)
Other comprehensive income (loss) attributable to The Coca-Cola Company $ (858) $ 247 $ (611)
1 Refer to Note 5 for additional information related to the net gain or loss on derivative instruments designated and qualifying as cash flow hedginginstruments.
2 Includes reclassification adjustments related to divestitures of certain available-for-sale securities. Refer to Note 3 for additional information relatedto these divestitures.
3 Refer to Note 13 for additional information related to the Company’s pension and other postretirement benefit liabilities.
133

Before-Tax Income After-TaxAmount Tax Amount
2011 — As AdjustedNet foreign currency translation adjustment $ (639) $ (1) $ (640)
Derivatives:Unrealized gains (losses) arising during the year (3) (1) (4)Reclassification adjustments recognized in net income 243 (94) 149
Net gain (loss) on derivatives1 240 (95) 145
Available-for-sale securities:Unrealized gains (losses) arising during the year (4) (8) (12)Reclassification adjustments recognized in net income 10 (5) 5
Net change in unrealized gain (loss) on available-for-sale securities2 6 (13) (7)
Pension and other benefit liabilities:Net pension and other benefits arising during the year (1,206) 423 (783)Reclassification adjustments recognized in net income 31 (11) 20
Net change in pension and other benefit liabilities3 (1,175) 412 (763)
Other comprehensive income (loss) attributable to The Coca-Cola Company $ (1,568) $ 303 $ (1,265)
1 Refer to Note 5 for additional information related to the net gain or loss on derivative instruments designated and qualifying as cash flow hedginginstruments.
2 Includes reclassification adjustments related to divestitures of certain available-for-sale securities. Refer to Note 3 for additional information relatedto these divestitures.
3 Refer to Note 13 for additional information related to the Company’s pension and other postretirement benefit liabilities.
Before-Tax Income After-TaxAmount Tax Amount
2010 — As AdjustedNet foreign currency translation adjustment $ (966) $ 31 $ (935)
Derivatives:Unrealized gains (losses) arising during the year (239) 108 (131)Reclassification adjustments recognized in net income 17 (6) 11
Net gain (loss) on derivatives1 (222) 102 (120)
Available-for-sale securities:Unrealized gains (losses) arising during the year 115 (25) 90Reclassification adjustments recognized in net income 18 (6) 12
Net change in unrealized gain (loss) on available-for-sale securities2 133 (31) 102
Pension and other benefit liabilities:Net pension and other benefits arising during the year 397 (139) 258Reclassification adjustments recognized in net income 35 (11) 24
Net change in pension and other benefit liabilities3 432 (150) 282
Other comprehensive income (loss) attributable to The Coca-Cola Company $ (623) $ (48) $ (671)
1 Refer to Note 5 for additional information related to the net gain or loss on derivative instruments designated and qualifying as cash flow hedginginstruments.
2 Includes reclassification adjustments related to divestitures of certain available-for-sale securities. Refer to Note 3 for additional information relatedto these divestitures.
3 Refer to Note 13 for additional information related to the Company’s pension and other postretirement benefit liabilities.
134
NOTE 16: FAIR VALUE MEASUREMENTS
Accounting principles generally accepted in the United States define fair value as the exchange price that would be received foran asset or paid to transfer a liability (an exit price) in the principal or most advantageous market for the asset or liability in anorderly transaction between market participants at the measurement date. Additionally, the inputs used to measure fair value areprioritized based on a three-level hierarchy. This hierarchy requires entities to maximize the use of observable inputs andminimize the use of unobservable inputs. The three levels of inputs used to measure fair value are as follows:
• Level 1 — Quoted prices in active markets for identical assets or liabilities.
• Level 2 — Observable inputs other than quoted prices included in Level 1. We value assets and liabilities included in thislevel using dealer and broker quotations, certain pricing models, bid prices, quoted prices for similar assets and liabilities inactive markets, or other inputs that are observable or can be corroborated by observable market data.
• Level 3 — Unobservable inputs that are supported by little or no market activity and that are significant to the fair valueof the assets or liabilities. This includes certain pricing models, discounted cash flow methodologies and similar techniquesthat use significant unobservable inputs.
Recurring Fair Value Measurements
In accordance with accounting principles generally accepted in the United States, certain assets and liabilities are required to berecorded at fair value on a recurring basis. For our Company, the only assets and liabilities that are adjusted to fair value on arecurring basis are investments in equity and debt securities classified as trading or available-for-sale and derivative financialinstruments. Additionally, the Company adjusts the carrying value of long-term debt as a result of the Company’s fair valuehedging strategy.
Investments in Trading and Available-for-Sale Securities
The fair values of our investments in trading and available-for-sale securities using quoted market prices from daily exchangetraded markets are based on the closing price as of the balance sheet date and are classified as Level 1. The fair values of ourinvestments in trading and available-for-sale securities classified as Level 2 are priced using quoted market prices for similarinstruments or nonbinding market prices that are corroborated by observable market data. Inputs into these valuation techniquesinclude actual trade data, benchmark yields, broker/dealer quotes and other similar data. These inputs are obtained from quotedmarket prices, independent pricing vendors or other sources.
Derivative Financial Instruments
The fair values of our futures contracts are primarily determined using quoted contract prices on futures exchange markets. Thefair values of these instruments are based on the closing contract price as of the balance sheet date and are classified as Level 1.
The fair values of our derivative instruments other than futures are determined using standard valuation models. The significantinputs used in these models are readily available in public markets, or can be derived from observable market transactions, andtherefore have been classified as Level 2. Inputs used in these standard valuation models for derivative instruments other thanfutures include the applicable exchange rates, forward rates, interest rates and discount rates. The standard valuation model foroptions also uses implied volatility as an additional input. The discount rates are based on the historical U.S. Deposit orU.S. Treasury rates, and the implied volatility specific to options is based on quoted rates from financial institutions.
Included in the fair value of derivative instruments is an adjustment for nonperformance risk. The adjustment is based on currentcredit default swap (‘‘CDS’’) rates applied to each contract, by counterparty. We use our counterparty’s CDS rate when we are inan asset position and our own CDS rate when we are in a liability position. The adjustment for nonperformance risk did not havea significant impact on the estimated fair value of our derivative instruments.
135
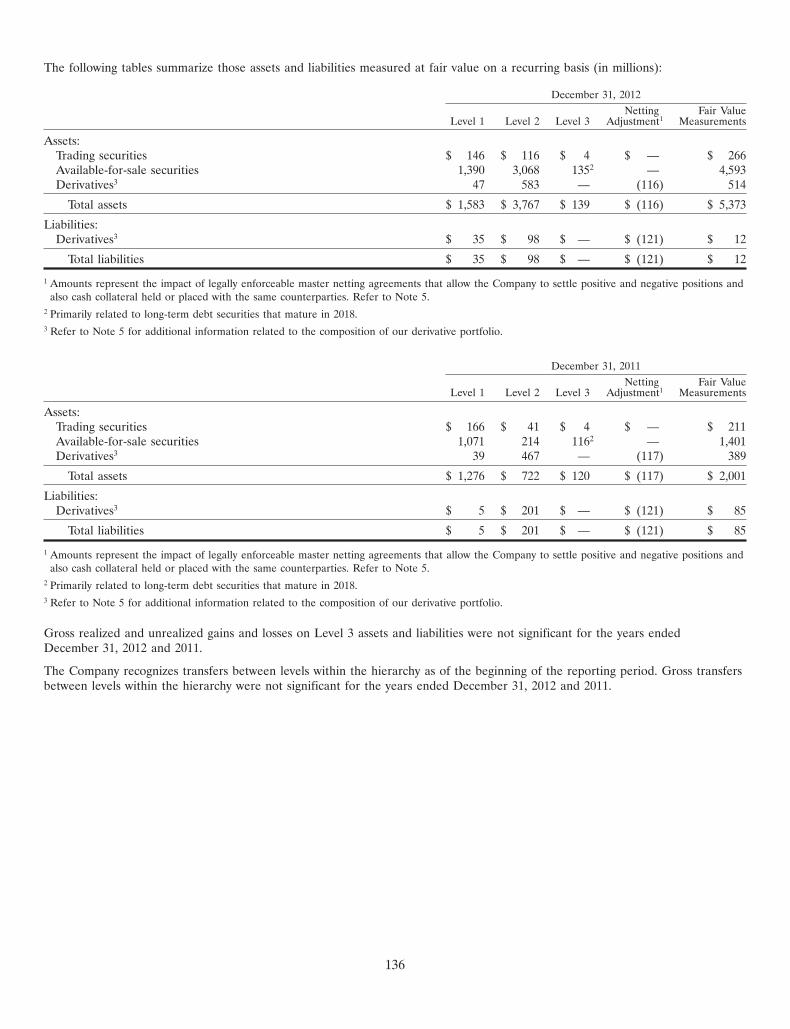
The following tables summarize those assets and liabilities measured at fair value on a recurring basis (in millions):
December 31, 2012Netting Fair Value
Level 1 Level 2 Level 3 Adjustment1 Measurements
Assets:Trading securities $ 146 $ 116 $ 4 $ — $ 266Available-for-sale securities 1,390 3,068 1352 — 4,593Derivatives3 47 583 — (116) 514
Total assets $ 1,583 $ 3,767 $ 139 $ (116) $ 5,373
Liabilities:Derivatives3 $ 35 $ 98 $ — $ (121) $ 12
Total liabilities $ 35 $ 98 $ — $ (121) $ 12
1 Amounts represent the impact of legally enforceable master netting agreements that allow the Company to settle positive and negative positions andalso cash collateral held or placed with the same counterparties. Refer to Note 5.
2 Primarily related to long-term debt securities that mature in 2018.3 Refer to Note 5 for additional information related to the composition of our derivative portfolio.
December 31, 2011Netting Fair Value
Level 1 Level 2 Level 3 Adjustment1 Measurements
Assets:Trading securities $ 166 $ 41 $ 4 $ — $ 211Available-for-sale securities 1,071 214 1162 — 1,401Derivatives3 39 467 — (117) 389
Total assets $ 1,276 $ 722 $ 120 $ (117) $ 2,001
Liabilities:Derivatives3 $ 5 $ 201 $ — $ (121) $ 85
Total liabilities $ 5 $ 201 $ — $ (121) $ 85
1 Amounts represent the impact of legally enforceable master netting agreements that allow the Company to settle positive and negative positions andalso cash collateral held or placed with the same counterparties. Refer to Note 5.
2 Primarily related to long-term debt securities that mature in 2018.3 Refer to Note 5 for additional information related to the composition of our derivative portfolio.
Gross realized and unrealized gains and losses on Level 3 assets and liabilities were not significant for the years endedDecember 31, 2012 and 2011.
The Company recognizes transfers between levels within the hierarchy as of the beginning of the reporting period. Gross transfersbetween levels within the hierarchy were not significant for the years ended December 31, 2012 and 2011.
136

Nonrecurring Fair Value Measurements
In addition to assets and liabilities that are recorded at fair value on a recurring basis, the Company records assets and liabilitiesat fair value on a nonrecurring basis as required by accounting principles generally accepted in the United States. Generally, assetsare recorded at fair value on a nonrecurring basis as a result of impairment charges. Assets measured at fair value on anonrecurring basis for the years ended December 31, 2012 and 2011, are summarized below (in millions):
Gains (Losses)December 31, 2012 2011
Exchange of investment in equity securities $ 1851 $ 4185
Assets held for sale (108)2 —Valuation of shares in equity method investee 103 1226
Cost method investments (16)4 —Equity method investments — (41)7
Available-for-sale securities — (17)8
Inventories — (11)9
Cold-drink equipment — (1)9
Total $ 71 $ 470
1 As a result of the merger of Andina and Polar, the Company recognized a gain of $185 million on the exchange of shares we previously owned inPolar for shares in Andina. This gain primarily represents the difference between the carrying value of the Polar shares we relinquished and the fairvalue of the Andina shares we received as a result of the transaction. The gain was calculated based on Level 1 inputs. Refer to Note 17.
2 The Company and Coca-Cola FEMSA executed a share purchase agreement for the sale of a majority ownership interest in our consolidatedPhilippine bottling operations. As a result of this agreement, the Company was required to classify our Philippine bottling operations as held for salein our consolidated balance sheet as of December 31, 2012. We also recognized a loss of $108 million during the year ended December 31, 2012,based on the agreed upon sale price and related transaction costs. The loss was calculated based on Level 3 inputs. Refer to Note 17.
3 The Company recognized a gain of $92 million as a result of Coca-Cola FEMSA, an equity method investee, issuing additional shares of its ownstock at a per share amount greater than the carrying value of the Company’s per share investment. Accordingly, the Company is required to treatthis type of transaction as if we sold a proportionate share of our investment in Coca-Cola FEMSA. This gain was partially offset by a loss of$82 million the Company recognized due to the Company acquiring an ownership interest in Mikuni for which we paid a premium over the publiclytraded market price. This premium was expensed on the acquisition date. Subsequent to this transaction, the Company accounts for our investmentin Mikuni under the equity method of accounting. The gain and loss described above were determined using Level 1 inputs. Refer to Note 17.
4 The Company recognized impairment charges of $16 million due to other-than-temporary declines in the fair values of certain cost methodinvestments. These charges were determined using Level 3 inputs. Refer to Note 17.
5 As a result of the merger of Arca and Contal, the Company recognized a gain of $418 million on the exchange of the shares we previously owned inContal for shares in the newly formed entity Arca Contal. The gain represents the difference between the carrying value of the Contal shares werelinquished and the fair value of the Arca Contal shares we received as a result of the transaction. The gain and initial carrying value of ourinvestment were calculated based on Level 1 inputs. Refer to Note 17.
6 The Company recognized a net gain of $122 million, primarily as a result of Coca-Cola FEMSA, an equity method investee, issuing additional sharesof its own stock at per share amounts greater than the carrying value of the Company’s per share investment. Accordingly, the Company is requiredto treat this type of transaction as if we sold a proportionate share of our investment in Coca-Cola FEMSA. The gains the Company recognized as aresult of the previous transactions were partially offset by charges associated with certain of the Company’s equity method investments in Japan. Thegains and charges were determined using Level 1 inputs. Refer to Note 17.
7 The Company recognized impairment charges of $41 million related to an investment in an entity accounted for under the equity method ofaccounting. Subsequent to the recognition of these impairment charges, the Company’s remaining financial exposure related to this entity is notsignificant. This charge was determined using Level 3 inputs. Refer to Note 17.
8 The Company recognized impairment charges of $17 million due to the other-than-temporary decline in the fair values of certain available-for-salesecurities. These charges were determined using Level 1 inputs. Refer to Note 17.
9 These assets primarily consisted of Company-owned inventory as well as cold-drink equipment that were damaged or lost as a result of the naturaldisasters in Japan on March 11, 2011. We recorded impairment charges of $11 million and $1 million related to Company-owned inventory andcold-drink equipment, respectively. These charges were determined using Level 3 inputs based on the carrying value of the inventory and cold-drinkequipment prior to the disasters. Refer to Note 17.
137

Fair Value Measurements for Pension and Other Postretirement Benefit Plans
The fair value hierarchy discussed above is not only applicable to assets and liabilities that are included in our consolidatedbalance sheets, but is also applied to certain other assets that indirectly impact our consolidated financial statements. For example,our Company sponsors and/or contributes to a number of pension and other postretirement benefit plans. Assets contributed bythe Company become the property of the individual plans. Even though the Company no longer has control over these assets, weare indirectly impacted by subsequent fair value adjustments to these assets. The actual return on these assets impacts theCompany’s future net periodic benefit cost, as well as amounts recognized in our consolidated balance sheets. Refer to Note 13.The Company uses the fair value hierarchy to measure the fair value of assets held by our various pension and otherpostretirement benefit plans.
Pension Plan Assets
The following table summarizes the levels within the fair value hierarchy used to determine the fair value of our pension planassets for our U.S. and non-U.S. pension plans as of December 31, 2012 and 2011 (in millions):
December 31, 2012 December 31, 2011Level 1 Level 2 Level 3 Total Level 1 Level 2 Level 3 Total
Cash and cash equivalents $ 187 $ 199 $ — $ 386 $ 152 $ 75 $ — $ 227Equity securities:
U.S.-based companies 1,847 20 14 1,881 1,366 15 14 1,395International-based companies 910 54 — 964 865 82 6 953
Fixed-income securities:Government bonds — 562 — 562 — 773 — 773Corporate bonds and debt securities — 982 — 982 — 718 — 718
Mutual, pooled and commingled funds 504 1,006 — 1,510 167 557 5 729Hedge funds/limited partnerships — 125 400 525 — 140 349 489Real estate — — 257 257 — — 270 270Other — 7 5101 517 — 99 5181 617
Total $ 3,448 $ 2,955 $ 1,181 $ 7,584 $ 2,550 $ 2,459 $ 1,162 $ 6,171
1 Includes $510 million and $514 million of purchased annuity contracts as of December 31, 2012 and 2011, respectively.
138
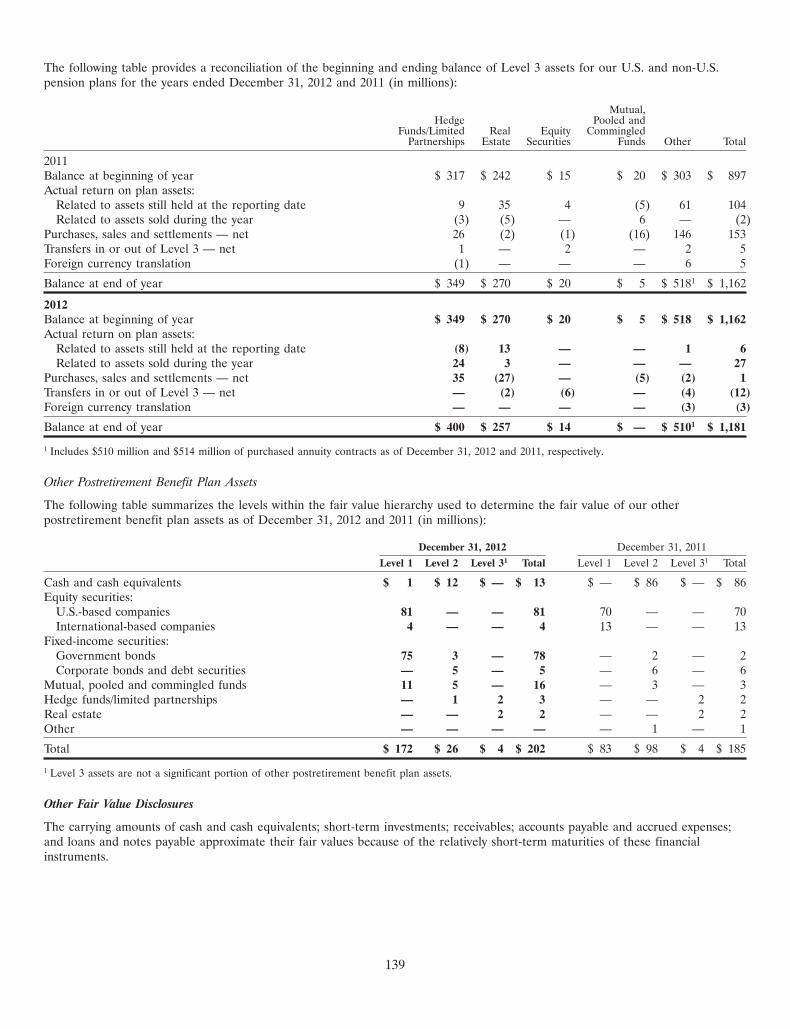
The following table provides a reconciliation of the beginning and ending balance of Level 3 assets for our U.S. and non-U.S.pension plans for the years ended December 31, 2012 and 2011 (in millions):
Mutual,Hedge Pooled and
Funds/Limited Real Equity CommingledPartnerships Estate Securities Funds Other Total
2011Balance at beginning of year $ 317 $ 242 $ 15 $ 20 $ 303 $ 897Actual return on plan assets:
Related to assets still held at the reporting date 9 35 4 (5) 61 104Related to assets sold during the year (3) (5) — 6 — (2)
Purchases, sales and settlements — net 26 (2) (1) (16) 146 153Transfers in or out of Level 3 — net 1 — 2 — 2 5Foreign currency translation (1) — — — 6 5
Balance at end of year $ 349 $ 270 $ 20 $ 5 $ 5181 $ 1,162
2012Balance at beginning of year $ 349 $ 270 $ 20 $ 5 $ 518 $ 1,162Actual return on plan assets:
Related to assets still held at the reporting date (8) 13 — — 1 6Related to assets sold during the year 24 3 — — — 27
Purchases, sales and settlements — net 35 (27) — (5) (2) 1Transfers in or out of Level 3 — net — (2) (6) — (4) (12)Foreign currency translation — — — — (3) (3)
Balance at end of year $ 400 $ 257 $ 14 $ — $ 5101 $ 1,181
1 Includes $510 million and $514 million of purchased annuity contracts as of December 31, 2012 and 2011, respectively.
Other Postretirement Benefit Plan Assets
The following table summarizes the levels within the fair value hierarchy used to determine the fair value of our otherpostretirement benefit plan assets as of December 31, 2012 and 2011 (in millions):
December 31, 2012 December 31, 2011Level 1 Level 2 Level 31 Total Level 1 Level 2 Level 31 Total
Cash and cash equivalents $ 1 $ 12 $ — $ 13 $ — $ 86 $ — $ 86Equity securities:
U.S.-based companies 81 — — 81 70 — — 70International-based companies 4 — — 4 13 — — 13
Fixed-income securities:Government bonds 75 3 — 78 — 2 — 2Corporate bonds and debt securities — 5 — 5 — 6 — 6
Mutual, pooled and commingled funds 11 5 — 16 — 3 — 3Hedge funds/limited partnerships — 1 2 3 — — 2 2Real estate — — 2 2 — — 2 2Other — — — — — 1 — 1
Total $ 172 $ 26 $ 4 $ 202 $ 83 $ 98 $ 4 $ 185
1 Level 3 assets are not a significant portion of other postretirement benefit plan assets.
Other Fair Value Disclosures
The carrying amounts of cash and cash equivalents; short-term investments; receivables; accounts payable and accrued expenses;and loans and notes payable approximate their fair values because of the relatively short-term maturities of these financialinstruments.
139

The fair value of our long-term debt is estimated using Level 2 inputs based on quoted prices for those instruments. Wherequoted prices are not available, fair value is estimated using discounted cash flows and market-based expectations for interestrates, credit risk and the contractual terms of the debt instruments. As of December 31, 2012, the carrying amount and fair valueof our long-term debt, including the current portion, were $16,313 million and $17,157 million, respectively. As of December 31,2011, the carrying amount and fair value of our long-term debt, including the current portion, were $15,697 million and$16,360 million, respectively.
NOTE 17: SIGNIFICANT OPERATING AND NONOPERATING ITEMS
Other Operating Items
In December 2011, the Company detected that orange juice being imported from Brazil contained residues of carbendazim, afungicide that is not registered in the United States for use on citrus products. As a result, we began purchasing additionalsupplies of Florida orange juice at a higher cost than Brazilian orange juice and incurred charges of $13 million during the yearended December 31, 2012. These charges were recorded in the line item cost of goods sold in our consolidated statement ofincome.
On March 11, 2011, a major earthquake struck off the coast of Japan, resulting in a tsunami that devastated the northern andeastern regions of the country. As a result of these events, the Company made a donation to a charitable organization to establishthe Coca-Cola Japan Reconstruction Fund, which has helped rebuild schools and community facilities across the impacted areas ofthe country. The Company recorded total charges of $84 million related to these events during the year ended December 31,2011, including $23 million in deductions from revenue, $11 million in cost of goods sold and $50 million in other operatingcharges. The charges of $23 million recorded in deductions from revenue were primarily related to funds we provided our localbottling partners to enable them to continue producing and distributing our beverage products in the affected regions. Thissupport not only helped restore our business operations in the impacted areas, but it also assisted our bottling partners in meetingthe evolving customer and consumer needs as the recovery and rebuilding efforts advanced. The charges of $11 million recordedin cost of goods sold were primarily related to Company-owned inventory that was destroyed or lost. The charges of $50 millionrecorded in other operating charges were primarily related to the donation discussed above and included an impairment charge of$1 million related to certain Company-owned fixed assets. These fixed assets primarily consisted of Company-owned vendingequipment and coolers that were damaged or lost as a result of these events. Refer to Note 16 for the fair value disclosuresrelated to the inventory and fixed asset charges described above. Refer to Note 19 for the impact these charges had on ouroperating segments.
Other Operating Charges
In 2012, the Company incurred other operating charges of $447 million, which primarily consisted of $270 million associated withthe Company’s productivity and reinvestment program; $163 million related to the Company’s other restructuring and integrationinitiatives; $20 million due to changes in the Company’s ready-to-drink tea strategy as a result of our U.S. license agreement withNestle S.A. (‘‘Nestle’’) terminating at the end of 2012; and $8 million due to costs associated with the Company detectingcarbendazim in orange juice imported from Brazil for distribution in the United States as described above. These charges werepartially offset by reversals of $10 million associated with the refinement of previously established accruals related to theCompany’s 2008-2011 productivity initiatives as well as reversals of $6 million associated with the refinement of previouslyestablished accruals related to the Company’s integration of CCE’s former North America business. Refer to Note 18 foradditional information on our productivity and reinvestment program as well as the Company’s other productivity, integration andrestructuring initiatives. Refer to Note 19 for the impact these charges had on our operating segments.
In 2011, the Company incurred other operating charges of $732 million, which primarily consisted of $633 million associated withthe Company’s productivity, integration and restructuring initiatives; $50 million related to the events in Japan described above;$35 million of costs associated with the merger of Arca and Contal; and $10 million associated with the floods in Thailand thatimpacted the Company’s supply chain operations in the region. Refer to Note 18 for additional information on our productivity,integration and restructuring initiatives. Refer to the discussion of the merger of Arca and Contal below for additional informationon the transaction. Refer to Note 19 for the impact these charges had on our operating segments.
In 2010, the Company incurred other operating charges of $819 million, which consisted of $478 million related to the Company’sproductivity, integration and restructuring initiatives; $250 million related to charitable contributions; $81 million due totransaction costs incurred in connection with our acquisition of CCE’s former North America business and the sale of ourNorwegian and Swedish bottling operations to New CCE; and $10 million of charges related to bottling activities in Eurasia. Referto Note 18 for additional information on our productivity, integration and restructuring initiatives. The charitable contributionswere primarily attributable to a cash donation to The Coca-Cola Foundation. Refer to Note 2 for additional information relatedto the transaction costs. Refer to Note 19 for the impact these charges had on our operating segments.
140

Other Nonoperating Items
Equity Income (Loss) — Net
The Company recorded a net gain of $8 million and net charges of $53 million and $66 million in equity income (loss) — netduring the years ended December 31, 2012, 2011 and 2010, respectively. These amounts primarily represent the Company’sproportionate share of unusual or infrequent items recorded by certain of our equity method investees.
In 2012, the Company also recorded a charge of $11 million related to changes in the structure of Beverage Partners Worldwide(‘‘BPW’’), our 50/50 joint venture with Nestle in the ready-to-drink tea category. These changes resulted in the joint venturefocusing its geographic scope primarily on Europe and Canada. The Company accounts for our investment in BPW under theequity method of accounting.
Refer to Note 19 for the impact these items had on our operating segments.
Other Income (Loss) — Net
In 2012, the Company recognized a gain of $185 million as a result of the merger of Andina and Polar, with Andina being theacquiring company. Prior to this transaction, the Company held an investment in Andina that we accounted for as anavailable-for-sale security as well as an investment in Polar that we accounted for under the equity method of accounting. Themerger of the two companies was a noncash transaction that resulted in Polar shareholders exchanging their existing Polar sharesfor newly issued shares of Andina at a specified exchange rate. As a result, the Company now holds an investment in Andina thatwe account for as an equity method investment. This gain impacted the Corporate operating segment. Refer to Note 19. Refer toNote 16 for additional information on the measurement of the gain.
On December 13, 2012, the Company and Coca-Cola FEMSA executed a share purchase agreement for the sale of a majorityownership interest in our consolidated Philippine bottling operations. As a result of this agreement, the Company was required toclassify our Philippine bottling operations as held for sale in our consolidated balance sheet as of December 31, 2012. We alsorecognized a loss of $108 million during the year ended December 31, 2012, based on the agreed-upon sale price and relatedtransaction costs. This loss impacted the Corporate operating segment. Refer to Note 19.
The Company also recognized a gain of $92 million as a result of Coca-Cola FEMSA issuing additional shares of its own stock ata per share amount greater than the carrying value of the Company’s investment. Accordingly, the Company is required to treatthis type of transaction as if we sold a proportionate share of our investment in Coca-Cola FEMSA. This gain impacted theCorporate operating segment. Refer to Note 19. Refer to Note 16 for additional information on the measurement of the gain.
During the year ended December 31, 2012, the Company recorded a charge of $82 million due to the acquisition of an ownershipinterest in Mikuni for which we paid a premium over the publicly traded market price. Although the Company paid this premiumto obtain specific rights that have an economic and strategic value to the Company, they do not qualify as an asset and wererecorded as expense on the acquisition date. This charge impacted the Corporate operating segment. Refer to Note 19. TheCompany accounts for our investment in Mikuni under the equity method of accounting.
The Company also recognized charges of $16 million during the year ended December 31, 2012, due to other-than-temporarydeclines in the fair values of certain cost method investments. These charges impacted the Corporate operating segment. Refer toNote 19.
In 2011, the Company recognized a net gain of $417 million, primarily as a result of the merger of Arca and Contal, two bottlingpartners headquartered in Mexico, into a combined entity known as Arca Contal. Prior to this transaction the Company held aninvestment in Contal that we accounted for under the equity method of accounting. The merger of the two companies was anoncash transaction that resulted in Contal shareholders exchanging their existing Contal shares for new shares in Arca Contal ata specified exchange rate. Refer to Note 16 for additional information on the measurement of the gain. As a result, the Companynow holds an investment in Arca Contal that we account for as an available-for-sale security. This net gain impacted theCorporate operating segment. Refer to Note 19.
The Company also recognized a net gain of $122 million during 2011, primarily as a result of Coca-Cola FEMSA issuingadditional shares of its own stock at per share amounts greater than the carrying value of the Company’s per share investment.Accordingly, the Company is required to treat this type of transaction as if we sold a proportionate share of our investment inCoca-Cola FEMSA. The gains the Company recognized as a result of the previous transactions were partially offset by chargesassociated with certain of the Company’s equity method investments in Japan. In addition, the Company recognized a gain of$102 million during 2011 related to the sale of our investment in Embonor. Refer to Note 2 for additional information. Refer toNote 19 for the impact these items had on our operating segments.
During 2011, the Company recorded charges of $41 million due to the impairment of an investment in an entity accounted forunder the equity method of accounting and $17 million due to other-than-temporary declines in the fair value of certain of theCompany’s available-for-sale securities. Refer to Note 16 for additional fair value information related to these impairments. The
141

Company also recorded a charge of $5 million related to the finalization of working capital adjustments associated with the sale ofour Norwegian and Swedish Bottling operations to New CCE during the fourth quarter of 2010. This charge reduced the amountof our previously reported gain on the sale of these bottling operations. Refer to Note 19 for the impact these charges had on ouroperating segments.
In 2010, the Company recognized gains of $4,978 million related to the remeasurement of our equity investment in CCE to fairvalue; $597 million due to the sale of all our ownership interests in our Norwegian and Swedish bottling operations to New CCE;and $23 million as a result of the sale of 50 percent of our investment in Leao Junior, which was a wholly owned subsidiary of theCompany prior to this transaction. Refer to Note 2 for additional information related to our acquisition of CCE’s former NorthAmerica business and the sale of all our ownership interests in our Norwegian and Swedish bottling operations to New CCE. Thegain on the Leao Junior transaction consisted of two parts: (1) the difference between the consideration received and 50 percentof the carrying value of our investment and (2) the fair value adjustment for our remaining 50 percent ownership. We haveaccounted for our remaining investment in Leao Junior under the equity method of accounting since the close of this transaction.The gains related to these transactions impacted our Corporate operating segment. Refer to Note 19.
During 2010, in addition to the transaction gains, the Company recorded charges of $265 million related to preexistingrelationships with CCE and $103 million due to the remeasurement of our Venezuelan subsidiary’s net assets. The charges relatedto preexisting relationships with CCE were primarily due to the write-off of our investment in infrastructure programs with CCE.Refer to Note 6 for additional information related to our preexisting relationships with CCE. The remeasurement loss related toour Venezuelan subsidiary’s net assets was due to the Venezuelan government announcing a currency devaluation and Venezuelabecoming a hyperinflationary economy subsequent to December 31, 2009. As a result, our local subsidiary was required to use theU.S. dollar as its functional currency, and the remeasurement gains and losses were recorded in other income (loss) — net. Thischarge impacted the Corporate operating segment. Refer to Note 19.
Also during 2010, the Company recorded charges of $48 million related to other-than-temporary impairments of available-for-salesecurities and an equity method investment and a donation of preferred shares in one of our equity method investees. Refer toNote 19 for the impact these charges had on our operating segments.
NOTE 18: PRODUCTIVITY, INTEGRATION AND RESTRUCTURING INITIATIVES
Productivity and Reinvestment
In February 2012, the Company announced a four-year productivity and reinvestment program which will further enable ourefforts to strengthen our brands and reinvest our resources to drive long-term profitable growth. This program will be focused onthe following initiatives: global supply chain optimization; global marketing and innovation effectiveness; operating expenseleverage and operational excellence; data and information technology systems standardization; and further integration of CCE’sformer North America business.
The Company incurred total pretax expenses of $270 million related to this program during the year ended December 31, 2012.These expenses were recorded in the line item other operating charges in our consolidated statement of income. Refer to Note 19for the impact these charges had on our operating segments. Outside services reported in the table below primarily relate toexpenses in connection with legal, outplacement and consulting activities. Other direct costs reported in the table below include,among other items, internal and external costs associated with the development, communication, administration andimplementation of these initiatives; accelerated depreciation on certain fixed assets; contract termination fees; and relocation costs.
The following table summarizes the balance of accrued expenses related to these productivity and reinvestment initiatives and thechanges in the accrued amounts since the commencement of the plan (in millions):
Severance Pay Otherand Benefits Outside Services Direct Costs Total
2012Costs incurred $ 21 $ 61 $ 188 $ 270Payments (8) (55) (167) (230)Noncash and exchange (1) — (13) (14)
Accrued balance as of December 31 $ 12 $ 6 $ 8 $ 26
142

Productivity Initiatives
During 2008, the Company announced a transformation effort centered on productivity initiatives to provide additional flexibilityto invest for growth. The initiatives impacted a number of areas, including aggressively managing operating expenses supported bylean techniques; redesigning key processes to drive standardization and effectiveness; better leveraging our size and scale; anddriving savings in indirect costs through the implementation of a ‘‘procure-to-pay’’ program.
In 2011, we completed this program. The Company has incurred total pretax expenses of $498 million related to these productivityinitiatives since they commenced in the first quarter of 2008. These expenses were recorded in the line item other operatingcharges in our consolidated statements of income. Refer to Note 19 for the impact these charges had on our operating segments.Outside services reported in the table below primarily relate to expenses in connection with legal, outplacement and consultingactivities. Other direct costs reported in the table below include, among other items, internal and external costs associated withthe development, communication, administration and implementation of these initiatives and accelerated depreciation on certainfixed assets.
The following table summarizes the balance of accrued expenses related to productivity initiatives and the changes in the accruedamounts (in millions):
Severance Pay Otherand Benefits Outside Services Direct Costs Total
2010Accrued balance as of January 1 $ 18 $ 9 $ 4 $ 31Costs incurred 71 58 61 190Payments (30) (61) (54) (145)Noncash and exchange — — (2) (2)
Accrued balance as of December 31 $ 59 $ 6 $ 9 $ 74
2011Costs incurred $ 59 $ 17 $ 80 $ 156Payments (50) (21) (71) (142)Noncash and exchange (20) 1 (9) (28)
Accrued balance as of December 31 $ 48 $ 3 $ 9 $ 60
2012Costs incurred $ (8) $ — $ (2) $ (10)Payments (29) (2) (3) (34)Noncash and exchange (2) — (3) (5)
Accrued balance as of December 31 $ 9 $ 1 $ 1 $ 11
Integration Initiatives
Integration of CCE’s former North America Business
In 2010, we acquired CCE’s former North America business and began an integration initiative to develop, design and implementour future operating framework. Upon completion of the CCE transaction, we combined the management of the acquiredNorth America business with the management of our existing foodservice business; Minute Maid and Odwalla juice businesses;North America supply chain operations; and Company-owned bottling operations in Philadelphia, Pennsylvania, into a unifiedbottling and customer service organization called Coca-Cola Refreshments, or CCR. In addition, we reshaped our remainingCCNA operations into an organization that primarily provides franchise leadership and consumer marketing and innovation forthe North American market. As a result of the transaction and related reorganization, our North American businesses operate asaligned and agile organizations with distinct capabilities, responsibilities and strengths.
In 2011, we completed this program. The Company has incurred total pretax expenses of $487 million related to this initiativesince the plan commenced in the fourth quarter of 2010. These expenses were recorded in the line item other operating chargesin our consolidated statements of income. Refer to Note 19 for the impact these charges had on our operating segments. Outsideservices reported in the table below primarily relate to expenses in connection with legal, outplacement and consulting activities.Other direct costs reported in the table below include, among other items, internal and external costs associated with thedevelopment, design and implementation of our future operating framework; contract termination fees; and relocation costs.
143
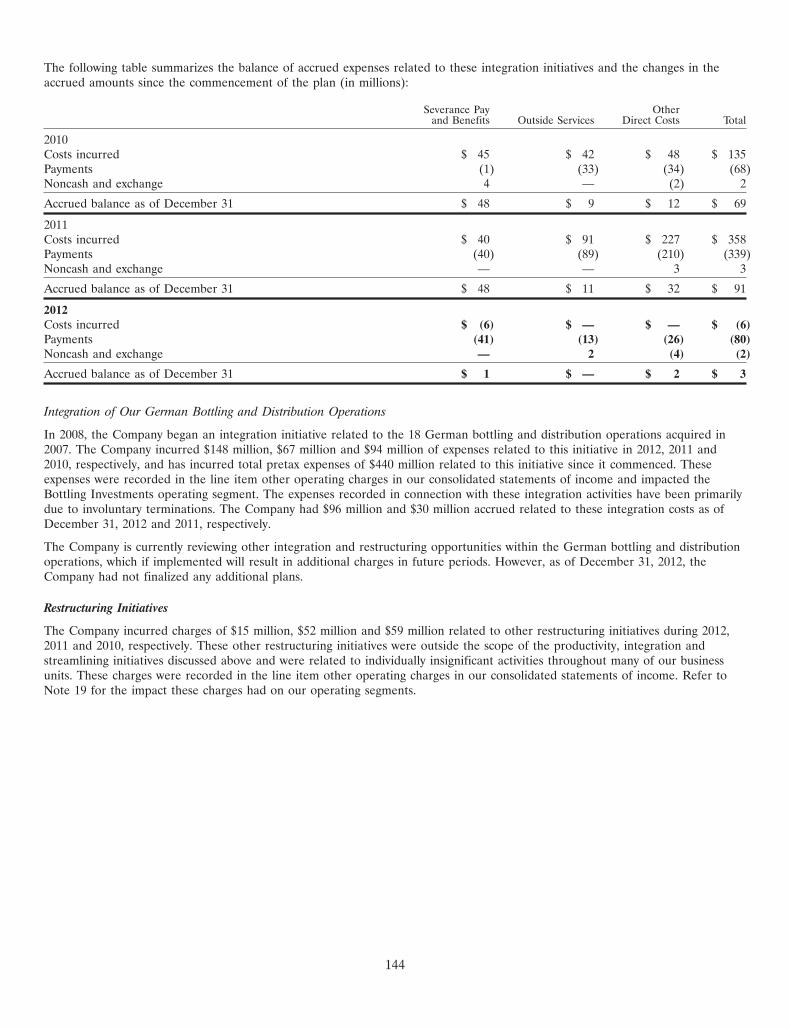
The following table summarizes the balance of accrued expenses related to these integration initiatives and the changes in theaccrued amounts since the commencement of the plan (in millions):
Severance Pay Otherand Benefits Outside Services Direct Costs Total
2010Costs incurred $ 45 $ 42 $ 48 $ 135Payments (1) (33) (34) (68)Noncash and exchange 4 — (2) 2
Accrued balance as of December 31 $ 48 $ 9 $ 12 $ 69
2011Costs incurred $ 40 $ 91 $ 227 $ 358Payments (40) (89) (210) (339)Noncash and exchange — — 3 3
Accrued balance as of December 31 $ 48 $ 11 $ 32 $ 91
2012Costs incurred $ (6) $ — $ — $ (6)Payments (41) (13) (26) (80)Noncash and exchange — 2 (4) (2)
Accrued balance as of December 31 $ 1 $ — $ 2 $ 3
Integration of Our German Bottling and Distribution Operations
In 2008, the Company began an integration initiative related to the 18 German bottling and distribution operations acquired in2007. The Company incurred $148 million, $67 million and $94 million of expenses related to this initiative in 2012, 2011 and2010, respectively, and has incurred total pretax expenses of $440 million related to this initiative since it commenced. Theseexpenses were recorded in the line item other operating charges in our consolidated statements of income and impacted theBottling Investments operating segment. The expenses recorded in connection with these integration activities have been primarilydue to involuntary terminations. The Company had $96 million and $30 million accrued related to these integration costs as ofDecember 31, 2012 and 2011, respectively.
The Company is currently reviewing other integration and restructuring opportunities within the German bottling and distributionoperations, which if implemented will result in additional charges in future periods. However, as of December 31, 2012, theCompany had not finalized any additional plans.
Restructuring Initiatives
The Company incurred charges of $15 million, $52 million and $59 million related to other restructuring initiatives during 2012,2011 and 2010, respectively. These other restructuring initiatives were outside the scope of the productivity, integration andstreamlining initiatives discussed above and were related to individually insignificant activities throughout many of our businessunits. These charges were recorded in the line item other operating charges in our consolidated statements of income. Refer toNote 19 for the impact these charges had on our operating segments.
144
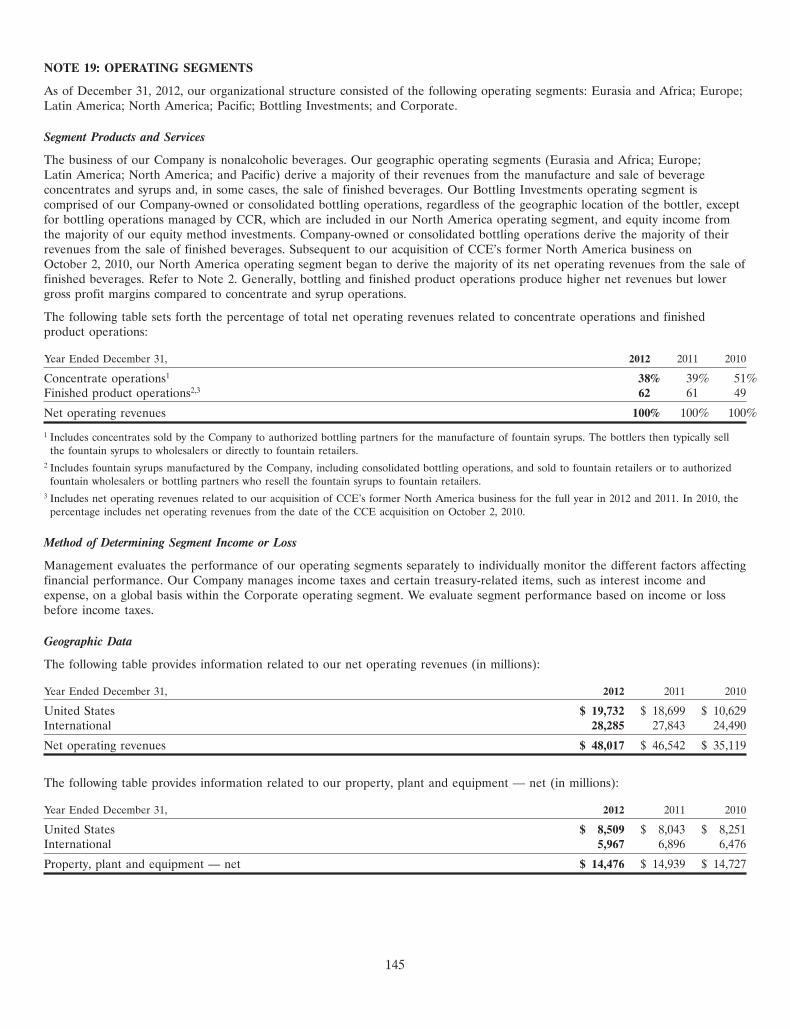
NOTE 19: OPERATING SEGMENTS
As of December 31, 2012, our organizational structure consisted of the following operating segments: Eurasia and Africa; Europe;Latin America; North America; Pacific; Bottling Investments; and Corporate.
Segment Products and Services
The business of our Company is nonalcoholic beverages. Our geographic operating segments (Eurasia and Africa; Europe;Latin America; North America; and Pacific) derive a majority of their revenues from the manufacture and sale of beverageconcentrates and syrups and, in some cases, the sale of finished beverages. Our Bottling Investments operating segment iscomprised of our Company-owned or consolidated bottling operations, regardless of the geographic location of the bottler, exceptfor bottling operations managed by CCR, which are included in our North America operating segment, and equity income fromthe majority of our equity method investments. Company-owned or consolidated bottling operations derive the majority of theirrevenues from the sale of finished beverages. Subsequent to our acquisition of CCE’s former North America business onOctober 2, 2010, our North America operating segment began to derive the majority of its net operating revenues from the sale offinished beverages. Refer to Note 2. Generally, bottling and finished product operations produce higher net revenues but lowergross profit margins compared to concentrate and syrup operations.
The following table sets forth the percentage of total net operating revenues related to concentrate operations and finishedproduct operations:
Year Ended December 31, 2012 2011 2010
Concentrate operations1 38% 39% 51%Finished product operations2,3 62 61 49
Net operating revenues 100% 100% 100%
1 Includes concentrates sold by the Company to authorized bottling partners for the manufacture of fountain syrups. The bottlers then typically sellthe fountain syrups to wholesalers or directly to fountain retailers.
2 Includes fountain syrups manufactured by the Company, including consolidated bottling operations, and sold to fountain retailers or to authorizedfountain wholesalers or bottling partners who resell the fountain syrups to fountain retailers.
3 Includes net operating revenues related to our acquisition of CCE’s former North America business for the full year in 2012 and 2011. In 2010, thepercentage includes net operating revenues from the date of the CCE acquisition on October 2, 2010.
Method of Determining Segment Income or Loss
Management evaluates the performance of our operating segments separately to individually monitor the different factors affectingfinancial performance. Our Company manages income taxes and certain treasury-related items, such as interest income andexpense, on a global basis within the Corporate operating segment. We evaluate segment performance based on income or lossbefore income taxes.
Geographic Data
The following table provides information related to our net operating revenues (in millions):
Year Ended December 31, 2012 2011 2010
United States $ 19,732 $ 18,699 $ 10,629International 28,285 27,843 24,490
Net operating revenues $ 48,017 $ 46,542 $ 35,119
The following table provides information related to our property, plant and equipment — net (in millions):
Year Ended December 31, 2012 2011 2010
United States $ 8,509 $ 8,043 $ 8,251International 5,967 6,896 6,476
Property, plant and equipment — net $ 14,476 $ 14,939 $ 14,727
145

Information about our Company’s operations by operating segment for the years ended December 31, 2012, 2011 and 2010, is asfollows (in millions):
Eurasia & Latin North BottlingAfrica Europe America America Pacific Investments Corporate Eliminations Consolidated
2012Net operating revenues:
Third party $ 2,818 $ 4,481 $ 4,560 $ 21,665 $ 5,559 $ 8,807 $ 127 $ — $ 48,017Intersegment 152 642 271 15 476 88 — (1,644) —Total net revenues 2,970 5,123 4,831 21,680 6,035 8,895 127 (1,644) 48,017
Operating income (loss) 1,169 2,960 2,879 2,597 2,425 140 (1,391) — 10,779Interest income — — — — — — 471 — 471Interest expense — — — — — — 397 — 397Depreciation and amortization 45 100 70 1,083 107 406 171 — 1,982Equity income (loss) — net 20 45 4 13 2 732 3 — 819Income (loss) before income taxes 1,192 3,015 2,882 2,624 2,432 904 (1,240) — 11,809Identifiable operating assets1 1,415 2,9762 2,759 34,114 2,047 9,6482 22,767 — 75,726Investments3 1,155 271 539 39 127 8,253 64 — 10,448Capital expenditures 88 30 88 1,447 70 867 190 — 2,780
2011 — As AdjustedNet operating revenues:
Third party $ 2,689 $ 4,777 $ 4,403 $ 20,559 $ 5,454 $ 8,501 $ 159 $ — $ 46,542Intersegment 152 697 287 12 384 90 — (1,622) —Total net revenues 2,841 5,474 4,690 20,571 5,838 8,591 159 (1,622) 46,542
Operating income (loss) 1,091 3,090 2,815 2,319 2,151 224 (1,517) — 10,173Interest income — — — — — — 483 — 483Interest expense — — — — — — 417 — 417Depreciation and amortization 39 109 63 1,065 106 403 169 — 1,954Equity income (loss) — net (3) 33 20 6 1 646 (13) — 690Income (loss) before income taxes 1,089 3,134 2,832 2,327 2,154 897 (975) — 11,458Identifiable operating assets1 1,245 3,2042 2,446 33,422 2,085 8,9052 20,293 — 71,600Investments3 284 243 475 26 133 7,140 73 — 8,374Capital expenditures 86 38 105 1,364 92 1,039 196 — 2,920
2010 — As AdjustedNet operating revenues:
Third party $ 2,426 $ 4,424 $ 3,880 $ 11,140 $ 4,941 $ 8,216 $ 92 $ — $ 35,119Intersegment 130 825 241 65 330 97 — (1,688) —Total net revenues 2,556 5,249 4,121 11,205 5,271 8,313 92 (1,688) 35,119
Operating income (loss) 980 2,976 2,405 1,520 2,048 227 (1,743) — 8,413Interest income — — — — — — 317 — 317Interest expense — — — — — — 733 — 733Depreciation and amortization 31 106 54 575 101 430 146 — 1,443Equity income (loss) — net 18 33 24 (4) 1 971 (18) — 1,025Income (loss) before income taxes 1,000 3,020 2,426 1,523 2,049 1,205 2,984 — 14,207Identifiable operating assets1 1,278 2,7242 2,298 32,793 1,827 8,3982 16,018 — 65,336Investments3 291 243 379 57 123 6,426 66 — 7,585Capital expenditures 59 33 94 711 101 942 275 — 2,215
1 Principally cash and cash equivalents, short-term investments, marketable securities, trade accounts receivable, inventories, goodwill, trademarks andother intangible assets and property, plant and equipment — net.
2 Property, plant and equipment — net in Germany represented approximately 10 percent of consolidated property, plant and equipment — net in2012, 10 percent in 2011 and 10 percent in 2010.
3 Principally equity method investments, available-for-sale securities and nonmarketable investments in bottling companies.
146

In 2012, the results of our operating segments were impacted by the following items:
• Operating income (loss) and income (loss) before income taxes were reduced by $1 million for Europe, $227 million forNorth America, $3 million for Pacific, $164 million for Bottling Investments and $38 million for Corporate due to chargesrelated to the Company’s productivity and reinvestment program as well as other restructuring initiatives. Refer to Note 18.
• Operating income (loss) and income (loss) before income taxes were increased by $4 million for Europe, $1 million forPacific and $5 million for Corporate due to the refinement of previously established accruals related to the Company’s2008-2011 productivity initiatives. Refer to Note 18.
• Operating income (loss) and income (loss) before income taxes were increased by $6 million for North America due to therefinement of previously established accruals related to the Company’s integration of CCE’s former North Americabusiness. Refer to Note 18.
• Operating income (loss) and income (loss) before income taxes were reduced by $21 million for North America due tocosts associated with the Company detecting residues of carbendazim, a fungicide that is not registered in the United Statesfor use on citrus products, in orange juice imported from Brazil for distribution in the United States. As a result, theCompany began purchasing additional supplies of Florida orange juice at a higher cost than Brazilian orange juice. Refer toNote 17.
• Operating income (loss) and income (loss) before income taxes were reduced by $20 million for North America due tochanges in the Company’s ready-to-drink tea strategy as a result of our current U.S. license agreement with Nestleterminating at the end of 2012. Refer to Note 17.
• Equity income (loss) — net and income (loss) before income taxes were increased by $8 million for Bottling Investmentsdue to the Company’s proportionate share of unusual or infrequent items recorded by certain of our equity methodinvestees. Refer to Note 17.
• Income (loss) before income taxes was increased by $185 million for Corporate due to the gain the Company recognized asa result of the merger of Andina and Polar. Refer to Note 16 and Note 17.
• Income (loss) before income taxes was reduced by $108 million for Corporate due to the loss the Company recognized onthe pending sale of a majority ownership interest in our Philippine bottling operations to Coca-Cola FEMSA which closedin January 2013. As of December 31, 2012, the assets and liabilities associated with our Philippine bottling operations wereclassified as held for sale in our consolidated balance sheets. Refer to Note 16 and Note 17.
• Income (loss) before income taxes was increased by $92 million for Corporate due to a gain the Company recognized as aresult of Coca-Cola FEMSA issuing additional shares of its own stock during the period at a per share amount greater thanthe carrying amount of the Company’s per share investment. Refer to Note 16 and Note 17.
• Income (loss) before income taxes was reduced by $82 million for Corporate due to the Company acquiring an ownershipinterest in Mikuni for which we paid a premium over the publicly traded market price. This premium was expensed on theacquisition date. Subsequent to this transaction, the Company accounts for our investment in Mikuni under the equitymethod of accounting. Refer to Note 16 and Note 17.
• Income (loss) before income taxes was reduced by $16 million for Corporate due to other-than-temporary declines in thefair values of certain cost method investments. Refer to Note 16 and Note 17.
• Income (loss) before income taxes was reduced by $1 million for Eurasia and Africa, $4 million for Europe, $2 million forLatin America and $4 million for Pacific due to changes in the structure of BPW, our 50/50 joint venture with Nestle in theready-to-drink tea category. Refer to Note 17.
In 2011, the results of our operating segments were impacted by the following items:
• Operating income (loss) and income (loss) before income taxes were reduced by $12 million for Eurasia and Africa,$25 million for Europe, $4 million for Latin America, $374 million for North America, $4 million for Pacific, $89 millionfor Bottling Investments and $164 million for Corporate, primarily due to the Company’s ongoing productivity, integrationand restructuring initiatives as well as costs associated with the merger of Arca and Contal. Refer to Note 18 for additionalinformation on our productivity, integration and restructuring initiatives. Refer to Note 17 for additional informationrelated to the merger of Arca and Contal.
• Operating income (loss) and income (loss) before income taxes were reduced by $82 million for Pacific and $2 million forNorth America due to charges associated with the earthquake and tsunami that devastated northern and eastern Japan onMarch 11, 2011. Refer to Note 17.
147

• Operating income (loss) and income (loss) before income taxes were reduced by $10 million for Corporate due to chargesassociated with the floods in Thailand that impacted the Company’s supply chain operations in the region. Refer toNote 17.
• Equity income (loss) — net and income (loss) before income taxes were reduced by $53 million for Bottling Investments,primarily attributable to the Company’s proportionate share of asset impairments and restructuring charges recorded bycertain of our equity method investees. Refer to Note 17.
• Income (loss) before income taxes was increased by a net $417 million for Corporate, primarily due to the gain theCompany recognized as a result of the merger of Arca and Contal. Refer to Note 17.
• Income (loss) before income taxes was increased by a net $122 million for Corporate, primarily due to gains the Companyrecognized as a result of Coca-Cola FEMSA issuing additional shares of its own stock during the year at per share amountsgreater than the carrying value of the Company’s per share investment. These gains were partially offset by chargesassociated with certain of the Company’s equity method investments in Japan. Refer to Note 17.
• Income (loss) before income taxes was increased by $102 million for Corporate, primarily due to the gain on the sale ofour investment in Embonor, a bottling partner with operations primarily in Chile. Prior to this transaction, the Companyaccounted for our investment in Embonor under the equity method of accounting. Refer to Note 17.
• Income (loss) before income taxes was reduced by $41 million for Corporate due to the impairment of an investment in anentity accounted for under the equity method of accounting. Refer to Note 16 and Note 17.
• Income (loss) before income taxes was reduced by $17 million for Corporate due to other-than-temporary impairments ofcertain available-for-sale securities. Refer to Note 16 and Note 17.
• Income (loss) before income taxes was reduced by $9 million for Corporate due to the net charge we recognized on therepurchase and/or exchange of certain long-term debt assumed in connection with our acquisition of CCE’s formerNorth America business as well as the early extinguishment of certain other long-term debt. Refer to Note 10.
• Income (loss) before income taxes was reduced by $5 million for Corporate due to the finalization of working capitaladjustments related to the sale of our Norwegian and Swedish bottling operations to New CCE. Refer to Note 2 andNote 17.
In 2010, the results of our operating segments were impacted by the following items:
• Operating income (loss) and income (loss) before income taxes were reduced by $7 million for Eurasia and Africa,$50 million for Europe, $133 million for North America, $22 million for Pacific, $122 million for Bottling Investments and$485 million for Corporate, primarily due to the Company’s ongoing productivity, integration and restructuring initiatives;charitable donations; transaction costs incurred in connection with our acquisition of CCE’s former North America businessand the sale of our Norwegian and Swedish bottling operations to New CCE; and other charges related to bottlingactivities in Eurasia. Refer to Note 17.
• Operating income (loss) and income (loss) before income taxes were reduced by $74 million for North America due to theacceleration of expense associated with certain share-based replacement awards issued in connection with our acquisition ofCCE’s former North America business. Refer to Note 12.
• Equity income (loss) — net and income (loss) before income taxes were reduced by $66 million for Bottling Investments.This net charge was primarily attributable to the Company’s proportionate share of unusual tax charges, asset impairments,restructuring charges and transaction costs recorded by equity method investees, which were partially offset by ourproportionate share of a foreign currency remeasurement gain recorded by an equity method investee. The components ofthe net charge were individually insignificant. Refer to Note 17.
• Income (loss) before income taxes was reduced by $23 million for Bottling Investments and $25 million for Corporate dueto other-than-temporary impairments and a donation of preferred shares in one of our equity method investees. Refer toNote 17.
• Income (loss) before income taxes was increased by $4,978 million for Corporate due to the remeasurement of our equityinvestment in CCE to fair value upon the close of the transaction. Refer to Note 2.
• Income (loss) before income taxes was increased by $597 million for Corporate due to the gain on the sale of ourNorwegian and Swedish bottling operations to New CCE. Refer to Note 2.
148
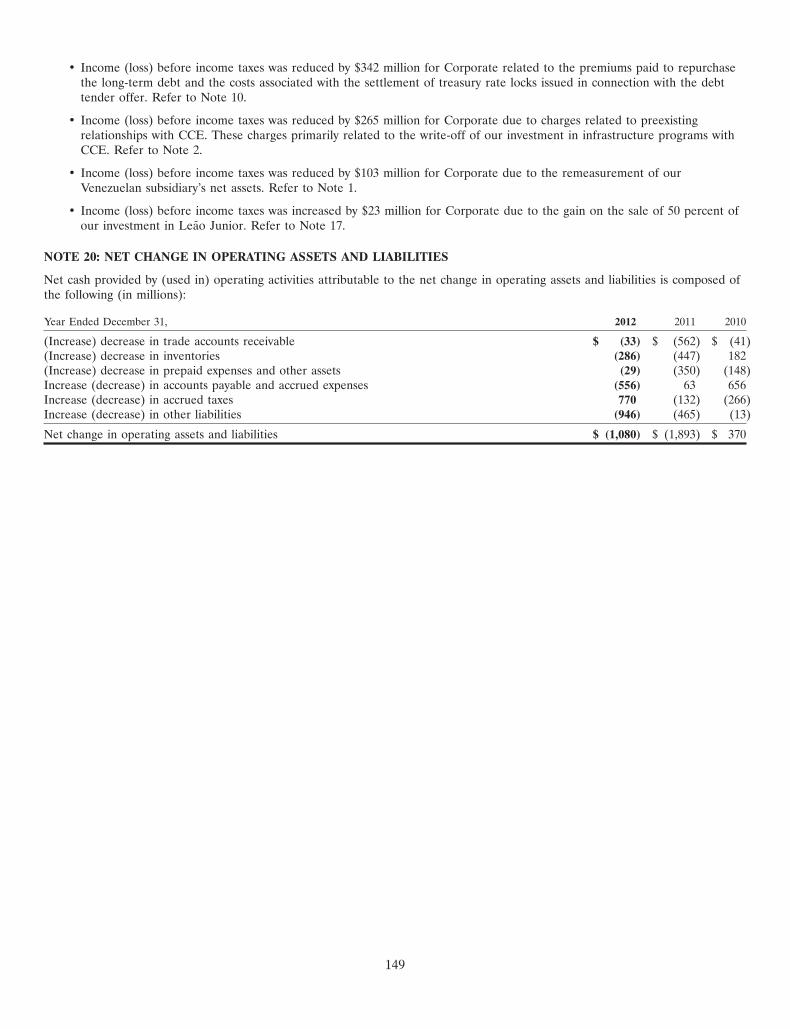
• Income (loss) before income taxes was reduced by $342 million for Corporate related to the premiums paid to repurchasethe long-term debt and the costs associated with the settlement of treasury rate locks issued in connection with the debttender offer. Refer to Note 10.
• Income (loss) before income taxes was reduced by $265 million for Corporate due to charges related to preexistingrelationships with CCE. These charges primarily related to the write-off of our investment in infrastructure programs withCCE. Refer to Note 2.
• Income (loss) before income taxes was reduced by $103 million for Corporate due to the remeasurement of ourVenezuelan subsidiary’s net assets. Refer to Note 1.
• Income (loss) before income taxes was increased by $23 million for Corporate due to the gain on the sale of 50 percent ofour investment in Leao Junior. Refer to Note 17.
NOTE 20: NET CHANGE IN OPERATING ASSETS AND LIABILITIES
Net cash provided by (used in) operating activities attributable to the net change in operating assets and liabilities is composed ofthe following (in millions):
Year Ended December 31, 2012 2011 2010
(Increase) decrease in trade accounts receivable $ (33) $ (562) $ (41)(Increase) decrease in inventories (286) (447) 182(Increase) decrease in prepaid expenses and other assets (29) (350) (148)Increase (decrease) in accounts payable and accrued expenses (556) 63 656Increase (decrease) in accrued taxes 770 (132) (266)Increase (decrease) in other liabilities (946) (465) (13)
Net change in operating assets and liabilities $ (1,080) $ (1,893) $ 370
149

REPORT OF MANAGEMENT
Management’s Responsibility for the Financial Statements
Management of the Company is responsible for the preparation and integrity of the consolidated financial statements appearing inour annual report on Form 10-K. The financial statements were prepared in conformity with generally accepted accountingprinciples appropriate in the circumstances and, accordingly, include certain amounts based on our best judgments and estimates.Financial information in this annual report on Form 10-K is consistent with that in the financial statements.
Management of the Company is responsible for establishing and maintaining a system of internal controls and procedures toprovide reasonable assurance regarding the reliability of financial reporting and the preparation of the consolidated financialstatements. Our internal control system is supported by a program of internal audits and appropriate reviews by management,written policies and guidelines, careful selection and training of qualified personnel and a written Code of Business Conductadopted by our Company’s Board of Directors, applicable to all officers and employees of our Company and subsidiaries. Inaddition, our Company’s Board of Directors adopted a written Code of Business Conduct for Non-Employee Directors whichreflects the same principles and values as our Code of Business Conduct for officers and employees but focuses on matters ofrelevance to non-employee Directors.
Because of its inherent limitations, internal control over financial reporting may not prevent or detect misstatements and, evenwhen determined to be effective, can only provide reasonable assurance with respect to financial statement preparation andpresentation. Also, projections of any evaluation of effectiveness to future periods are subject to the risk that controls may becomeinadequate because of changes in conditions, or that the degree of compliance with the policies or procedures may deteriorate.
Management’s Report on Internal Control Over Financial Reporting
Management of the Company is responsible for establishing and maintaining adequate internal control over financial reporting assuch term is defined in Rule 13a-15(f) under the Securities Exchange Act of 1934 (‘‘Exchange Act’’). Management assessed theeffectiveness of the Company’s internal control over financial reporting as of December 31, 2012. In making this assessment,management used the criteria set forth by the Committee of Sponsoring Organizations of the Treadway Commission (‘‘COSO’’) inInternal Control — Integrated Framework. Based on this assessment, management believes that the Company maintained effectiveinternal control over financial reporting as of December 31, 2012.
The Company’s independent auditors, Ernst & Young LLP, a registered public accounting firm, are appointed by the AuditCommittee of the Company’s Board of Directors, subject to ratification by our Company’s shareowners. Ernst & Young LLP hasaudited and reported on the consolidated financial statements of The Coca-Cola Company and subsidiaries and the Company’sinternal control over financial reporting. The reports of the independent auditors are contained in this annual report.
150
25FEB200913564291 22FEB201023414934
21JAN200918403249
Audit Committee’s Responsibility
The Audit Committee of our Company’s Board of Directors, composed solely of Directors who are independent in accordancewith the requirements of the New York Stock Exchange listing standards, the Exchange Act, and the Company’s CorporateGovernance Guidelines, meets with the independent auditors, management and internal auditors periodically to discuss internalcontrols and auditing and financial reporting matters. The Audit Committee reviews with the independent auditors the scope andresults of the audit effort. The Audit Committee also meets periodically with the independent auditors and the chief internalauditor without management present to ensure that the independent auditors and the chief internal auditor have free access tothe Audit Committee. Our Audit Committee’s Report can be found in the Company’s 2013 Proxy Statement.
Muhtar Kent Kathy N. WallerChairman of the Board of Directors, Vice President and ControllerChief Executive Officer and President February 27, 2013February 27, 2013
Gary P. FayardExecutive Vice Presidentand Chief Financial OfficerFebruary 27, 2013
151
Report of Independent Registered Public Accounting Firm
Board of Directors and ShareownersThe Coca-Cola Company
We have audited the accompanying consolidated balance sheets of The Coca-Cola Company and subsidiaries as of December 31,2012 and 2011, and the related consolidated statements of income, comprehensive income, shareowners’ equity, and cash flows foreach of the three years in the period ended December 31, 2012. These financial statements are the responsibility of theCompany’s management. Our responsibility is to express an opinion on these financial statements based on our audits.
We conducted our audits in accordance with the standards of the Public Company Accounting Oversight Board (United States).Those standards require that we plan and perform the audit to obtain reasonable assurance about whether the financialstatements are free of material misstatement. An audit includes examining, on a test basis, evidence supporting the amounts anddisclosures in the financial statements. An audit also includes assessing the accounting principles used and significant estimatesmade by management, as well as evaluating the overall financial statement presentation. We believe that our audits provide areasonable basis for our opinion.
In our opinion, the financial statements referred to above present fairly, in all material respects, the consolidated financial positionof The Coca-Cola Company and subsidiaries at December 31, 2012 and 2011, and the consolidated results of their operations andtheir cash flows for each of the three years in the period ended December 31, 2012, in conformity with U.S. generally acceptedaccounting principles.
As discussed in Note 1 to the consolidated financial statements, The Coca-Cola Company has elected to change its method ofcalculating the market-related value of plan assets related to certain of its pension plans in 2012.
We also have audited, in accordance with the standards of the Public Company Accounting Oversight Board (United States),The Coca-Cola Company and subsidiaries’ internal control over financial reporting as of December 31, 2012, based on criteriaestablished in Internal Control — Integrated Framework issued by the Committee of Sponsoring Organizations of the TreadwayCommission and our report dated February 27, 2013 expressed an unqualified opinion thereon.
Atlanta, GeorgiaFebruary 27, 2013
152

Report of Independent Registered Public Accounting Firmon Internal Control Over Financial Reporting
Board of Directors and ShareownersThe Coca-Cola Company
We have audited The Coca-Cola Company and subsidiaries’ internal control over financial reporting as of December 31, 2012,based on criteria established in Internal Control — Integrated Framework issued by the Committee of Sponsoring Organizations ofthe Treadway Commission (the COSO criteria). The Coca-Cola Company and subsidiaries’ management is responsible formaintaining effective internal control over financial reporting, and for its assessment of the effectiveness of internal control overfinancial reporting included in the accompanying Management’s Report on Internal Control Over Financial Reporting. Ourresponsibility is to express an opinion on the Company’s internal control over financial reporting based on our audit.
We conducted our audit in accordance with the standards of the Public Company Accounting Oversight Board (United States).Those standards require that we plan and perform the audit to obtain reasonable assurance about whether effective internalcontrol over financial reporting was maintained in all material respects. Our audit included obtaining an understanding of internalcontrol over financial reporting, assessing the risk that a material weakness exists, testing and evaluating the design and operatingeffectiveness of internal control based on the assessed risk, and performing such other procedures as we considered necessary inthe circumstances. We believe that our audit provides a reasonable basis for our opinion.
A company’s internal control over financial reporting is a process designed to provide reasonable assurance regarding thereliability of financial reporting and the preparation of financial statements for external purposes in accordance with generallyaccepted accounting principles. A company’s internal control over financial reporting includes those policies and procedures that(1) pertain to the maintenance of records that, in reasonable detail, accurately and fairly reflect the transactions and dispositionsof the assets of the company; (2) provide reasonable assurance that transactions are recorded as necessary to permit preparationof financial statements in accordance with generally accepted accounting principles, and that receipts and expenditures of thecompany are being made only in accordance with authorizations of management and directors of the company; and (3) providereasonable assurance regarding prevention or timely detection of unauthorized acquisition, use, or disposition of the company’sassets that could have a material effect on the financial statements.
Because of its inherent limitations, internal control over financial reporting may not prevent or detect misstatements. Also,projections of any evaluation of effectiveness to future periods are subject to the risk that controls may become inadequatebecause of changes in conditions, or that the degree of compliance with the policies or procedures may deteriorate.
In our opinion, The Coca-Cola Company and subsidiaries maintained, in all material respects, effective internal control overfinancial reporting as of December 31, 2012, based on the COSO criteria.
We also have audited, in accordance with the standards of the Public Company Accounting Oversight Board (United States), theconsolidated balance sheets of The Coca-Cola Company and subsidiaries as of December 31, 2012 and 2011, and the relatedconsolidated statements of income, comprehensive income, shareowners’ equity, and cash flows for each of the three years in theperiod ended December 31, 2012, and our report dated February 27, 2013 expressed an unqualified opinion thereon.
Atlanta, GeorgiaFebruary 27, 2013
153

Quarterly Data (Unaudited)
First Second Third FourthQuarter Quarter Quarter Quarter Full Year
(In millions except per share data)2012Net operating revenues $ 11,137 $ 13,085 $ 12,340 $ 11,455 $ 48,017Gross profit 6,789 7,861 7,487 6,827 28,964Net income attributable to shareowners of The Coca-Cola Company 2,054 2,788 2,311 1,866 9,019
Basic net income per share $ 0.45 $ 0.62 $ 0.51 $ 0.42 $ 2.00
Diluted net income per share $ 0.45 $ 0.61 $ 0.50 $ 0.41 $ 1.97
2011 — As Adjusted2,3
Net operating revenues $ 10,517 $ 12,737 $ 12,248 $ 11,040 $ 46,542Gross profit 6,569 7,748 7,373 6,637 28,327Net income attributable to shareowners of The Coca-Cola Company 1,903 2,800 2,224 1,657 8,584
Basic net income per share $ 0.42 $ 0.61 $ 0.49 $ 0.37 $ 1.881
Diluted net income per share $ 0.41 $ 0.60 $ 0.48 $ 0.36 $ 1.85
1 The sum of the quarterly net income per share amounts do not agree to the full year net income per share amounts. We calculate net income pershare based on the weighted average number of outstanding shares during the reporting period. The average number of shares fluctuates throughoutthe year and can therefore produce a full year result that does not agree to the sum of the individual quarters.
2 Effective January 1, 2012, the Company elected to change our accounting methodology for determining the market-related value of assets for ourU.S. qualified defined benefit pension plans. The Company’s change in accounting methodology has been applied retrospectively, and we haveadjusted all prior period financial information presented herein as required.
3 On July 27, 2012, the Company’s certificate of incorporation was amended to increase the number of authorized shares of common stock from5.6 billion to 11.2 billion and effect a two-for-one stock split of the common stock. The record date for the stock split was July 27, 2012, and theadditional shares were distributed on August 10, 2012. Each shareowner of record on the close of business on the record date received oneadditional share of common stock for each share held. All share and per share data presented herein reflect the impact of the increase in authorizedshares and the stock split, as appropriate.
Our reporting period ends on the Friday closest to the last day of the quarterly calendar period. Our fiscal year ends onDecember 31 regardless of the day of the week on which December 31 falls.
The Company’s first quarter 2012 results were impacted by one less shipping day compared to the first quarter of 2011.Furthermore, the Company recorded the following transactions which impacted results:
• Charges of $61 million for North America, $15 million for Bottling Investments and $3 million for Corporate due to theCompany’s productivity and reinvestment program as well as other restructuring initiatives. Refer to Note 17 and Note 18.
• Benefit of $1 million for Europe due to the refinement of previously established accruals related to the Company’s2008-2011 productivity initiatives. Refer to Note 17 and Note 18.
• Charge of $20 million for North America due to changes in the Company’s ready-to-drink tea strategy as a result of ourcurrent U.S. license agreement with Nestle terminating at the end of 2012. Refer to Note 17.
• Charge of $6 million for North America due to costs associated with the Company detecting residues of carbendazim, afungicide that is not registered in the United States for use on citrus products, in orange juice imported from Brazil fordistribution in the United States. As a result, the Company began purchasing additional supplies of Florida orange juice ata higher cost than Brazilian orange juice. Refer to Note 17.
• Charge of $3 million for Corporate due to changes in the structure of BPW, our 50/50 joint venture with Nestle in theready-to-drink tea category. Refer to Note 17.
• Net benefit of $44 million for Bottling Investments due to the Company’s proportionate share of unusual or infrequentitems recorded by certain of our equity method investees. Refer to Note 17.
154

• Net tax benefit of $8 million associated with the reversal of a valuation allowance in one of the Company’s foreignjurisdictions, partially offset by amounts required to be recorded for changes to our uncertain tax positions, includinginterest and penalties. Refer to Note 14.
In the second quarter of 2012, the Company recorded the following transactions which impacted results:
• Charges of $48 million for North America, $16 million for Bottling Investments and $5 million for Corporate due to theCompany’s productivity and reinvestment program as well as other restructuring initiatives. Refer to Note 17 and Note 18.
• Benefit of $2 million for Europe due to the refinement of previously established accruals related to the Company’s2008-2011 productivity initiatives. Refer to Note 17 and Note 18.
• Charge of $6 million for North America due to costs associated with the Company detecting residues of carbendazim inorange juice imported from Brazil for distribution in the United States. Refer to Note 17.
• Benefit of $92 million for Corporate due to a gain the Company recognized as a result of Coca-Cola FEMSA, an equitymethod investee, issuing additional shares of its own stock during the period at a per share amount greater than thecarrying amount of the Company’s per share investment. Refer to Note 17.
• Charges of $3 million for Eurasia and Africa, $6 million for Europe, $2 million for Latin America, $3 million for Pacificand a benefit of $3 million for Corporate due to changes in the structure of BPW. Refer to Note 17.
• Net charge of $1 million for Bottling Investments due to the Company’s proportionate share of unusual or infrequent itemsrecorded by certain of our equity method investees. Refer to Note 17.
• Net tax benefit of $25 million associated with the reversal of a valuation allowance in one of the Company’s foreignjurisdictions as well as amounts required to be recorded for changes to our uncertain tax positions, including interest andpenalties. Refer to Note 14.
In the third quarter of 2012, the Company recorded the following transactions which impacted results:
• Charges of $48 million for North America, $1 million for Pacific, $14 million for Bottling Investments and $10 million forCorporate due to charges related to the Company’s productivity and reinvestment program as well as other restructuringinitiatives. Refer to Note 17 and Note 18.
• Benefit of $1 million for Pacific and $5 million for Corporate due to the refinement of previously established accrualsrelated to the Company’s 2008-2011 productivity initiatives. Refer to Note 17 and Note 18.
• Benefit of $5 million for North America due to the refinement of previously established accruals related to the Company’sintegration of CCE’s former North America business. Refer to Note 17 and Note 18.
• Charge of $9 million for North America due to costs associated with the Company detecting residues of carbendazim inorange juice imported from Brazil for distribution in the United States. Refer to Note 17.
• Charges of $1 million for Latin America, $1 million for North America, $2 million for Pacific and benefits of $1 million forEurasia and Africa and $3 million for Europe due to changes in the structure of BPW. Refer to Note 17.
• Net charge of $10 million for Bottling Investments due to the Company’s proportionate share of unusual or infrequentitems recorded by certain of our equity method investees. Refer to Note 17.
• Net charge of $7 million related to amounts required to be recorded for changes to our uncertain tax positions, includinginterest and penalties. Refer to Note 14.
The Company’s fourth quarter 2012 results were impacted by two additional shipping days compared to the fourth quarter of2011. Furthermore, the Company recorded the following transactions which impacted results:
• Charges of $1 million for Europe, $70 million for North America, $2 million for Pacific, $119 million for BottlingInvestments and $20 million for Corporate due to the Company’s productivity and reinvestment program as well as otherrestructuring initiatives. Refer to Note 17 and Note 18.
• Benefit of $1 million for Europe due to the refinement of previously established accruals related to the Company’s2008-2011 productivity initiatives. Refer to Note 17 and Note 18.
• Benefit of $1 million for North America due to the refinement of previously established accruals related to the Company’sintegration of CCE’s former North America business. Refer to Note 17 and Note 18.
155

• Benefit of $185 million for Corporate due to the gain the Company recognized as a result of the merger of Andina andPolar. Refer to Note 16 and Note 17.
• Charge of $108 million for Corporate due to the loss the Company recognized on the pending sale of a majority ownershipinterest in our Philippine bottling operations to Coca-Cola FEMSA. This transaction was completed in January 2013. As ofDecember 31, 2012, the assets and liabilities associated with our Philippine bottling operations were classified as held forsale in our consolidated balance sheets. Refer to Note 17.
• Charge of $82 million for Corporate due to the Company acquiring an ownership interest in Mikuni for which we paid apremium over the publicly traded market price. This premium was expensed on the acquisition date. The Companyaccounts for our investment in Mikuni under the equity method of accounting. Refer to Note 17.
• Net charge of $25 million for Bottling Investments due to the Company’s proportionate share of unusual or infrequentitems recorded by certain of our equity method investees. Refer to Note 17.
• Charge of $16 million for Corporate due to other-than-temporary declines in the fair values of certain cost methodinvestments. Refer to Note 16 and Note 17.
• Benefits of $1 million for Eurasia and Africa, $1 million for Latin America, $1 million for North America, $1 million forPacific and a charge of $1 million for Europe due to changes in the structure of BPW. Refer to Note 17.
• Net tax benefit of $124 million associated with the reversal of a valuation allowance in one of the Company’s foreignjurisdictions as well as amounts required to be recorded for changes to our uncertain tax positions, including interest andpenalties. Refer to Note 14.
In the first quarter of 2011, the Company recorded the following transactions which impacted results:
• Charges of $1 million for Eurasia and Africa, $1 million for Europe, $111 million for North America, $1 million for Pacific,$21 million for Bottling Investments and $27 million for Corporate due to the Company’s ongoing productivity, integrationand restructuring initiatives. Refer to Note 17 and Note 18.
• Gain of $102 million for Corporate due to the sale of our investment in Embonor, a bottling partner with operationsprimarily in Chile. Prior to this transaction, the Company accounted for our investment in Embonor under the equitymethod of accounting. Refer to Note 17.
• Charge of $79 million for Pacific associated with the earthquake and tsunami that devastated northern and eastern Japanon March 11, 2011. This charge was primarily related to the Company’s charitable donations in support of relief andrebuilding efforts in Japan and funds provided to certain bottling partners in the affected regions. Refer to Note 17.
• Charge of $19 million for North America due to the amortization of favorable supply contracts acquired in connection withour acquisition of CCE’s former North America business. Refer to Note 17.
• Charge of $4 million for Corporate related to premiums paid to repurchase certain long-term debt assumed in connectionwith our acquisition of CCE’s former North America business. Refer to Note 10.
• Charge of $4 million for Bottling Investments, primarily attributable to the Company’s proportionate share of restructuringcharges recorded by an equity method investee. Refer to Note 17.
• A net tax charge of $3 million related to amounts required to be recorded for changes to our uncertain tax positions,including interest and penalties. Refer to Note 14.
In the second quarter of 2011, the Company recorded the following transactions which impacted results:
• Charges of $8 million for Eurasia and Africa, $2 million for Europe, $1 million for Latin America, $66 million forNorth America, $23 million for Bottling Investments and $47 million for Corporate, primarily due to the Company’songoing productivity, integration and restructuring initiatives as well as costs associated with the merger of Arca andContal. Refer to Note 17 and Note 18.
• A net gain of $417 million for Corporate, primarily due to the merger of Arca and Contal. Refer to Note 16 and Note 17.
• Charge of $38 million for Corporate due to the impairment of an investment in an entity accounted for under the equitymethod of accounting. Refer to Note 16 and Note 17.
• Charge of $4 million for Pacific due to the earthquake and tsunami that devastated northern and eastern Japan onMarch 11, 2011. Refer to Note 17.
156
• A net gain of $1 million for Corporate related to the repurchase of certain long-term debt we assumed in connection withour acquisition of CCE’s former North America business. Refer to Note 10.
• A net tax charge of $16 million related to amounts required to be recorded for changes to our uncertain tax positions,including interest and penalties. Refer to Note 14.
In the third quarter of 2011, the Company recorded the following transactions which impacted results:
• Charges of $2 million for Europe, $2 million for Latin America, $52 million for North America, $2 million for Pacific,$14 million for Bottling Investments and $26 million for Corporate, due to the Company’s ongoing productivity, integrationand restructuring initiatives as well as costs associated with the merger of Arca and Contal. Refer to Note 17 and Note 18.
• Charge of $36 million for Bottling Investments, primarily attributable to the Company’s proportionate share of assetimpairments and restructuring charges recorded by certain of our equity method investees. Refer to Note 17.
• A net charge of $5 million for Corporate due to the repurchase and/or exchange of certain long-term debt assumed inconnection with our acquisition of CCE’s former North America business. Refer to Note 10.
• Charge of $5 million for Corporate due to the finalization of working capital adjustments related to the sale of all ourownership interests in our Norwegian and Swedish bottling operations to New CCE. Refer to Note 17.
• Charge of $3 million for Corporate due to the impairment of an investment in an entity accounted for under the equitymethod of accounting. Refer to Note 16 and Note 17.
• A net charge of $1 million associated with the earthquake and tsunami that devastated northern and eastern Japan onMarch 11, 2011. This net charge included a charge of $2 million for North America and a benefit of $1 million for Pacific.Refer to Note 17.
• A net tax benefit of $4 million related to amounts required to be recorded for changes to our uncertain tax positions,including interest and penalties. Refer to Note 14.
In the fourth quarter of 2011, the Company recorded the following transactions which impacted results:
• Charges of $3 million for Eurasia and Africa, $20 million for Europe, $1 million for Latin America, $145 million for NorthAmerica, $1 million for Pacific, $31 million for Bottling Investments and $64 million for Corporate, primarily due to theCompany’s ongoing productivity, integration and restructuring initiatives. Refer to Note 17 and Note 18.
• A net gain of $122 million for Corporate, primarily due to gains the Company recognized as a result of Coca-Cola FEMSA,an equity method investee, issuing additional shares of its own stock during the period at per share amounts greater thanthe carrying value of the Company’s per share investment. These gains were partially offset by charges associated withcertain of the Company’s equity method investments in Japan. Refer to Note 17.
• Charge of $17 million for Corporate due to other-than-temporary impairments of certain available-for-sale securities. Referto Note 16 and Note 17.
• Charge of $13 million for Bottling Investments, primarily attributable to the Company’s proportionate share of assetimpairments and restructuring charges recorded by certain of our equity method investees. Refer to Note 17.
• Charge of $10 million for Corporate due to the floods in Thailand that impacted the Company’s supply chain operations inthe region. Refer to Note 17.
• Charge of $1 million for Corporate due to the early extinguishment of certain long-term debt. This debt existed prior to theCompany’s acquisition of CCE’s former North America business. Refer to Note 10.
• A net tax benefit of $22 million related to amounts required to be recorded for changes to our uncertain tax positions,including interest and penalties. Refer to Note 14.
157

ITEM 9. CHANGES IN AND DISAGREEMENTS WITH ACCOUNTANTS ON ACCOUNTING AND FINANCIALDISCLOSURE
Not applicable.
ITEM 9A. CONTROLS AND PROCEDURES
Evaluation of Disclosure Controls and Procedures
The Company, under the supervision and with the participation of its management, including the Chief Executive Officer and theChief Financial Officer, evaluated the effectiveness of the design and operation of the Company’s ‘‘disclosure controls andprocedures’’ (as defined in Rule 13a-15(e) under the Securities Exchange Act of 1934, as amended (the ‘‘Exchange Act’’)) as ofthe end of the period covered by this report. Based on that evaluation, the Chief Executive Officer and the Chief FinancialOfficer concluded that the Company’s disclosure controls and procedures were effective as of December 31, 2012.
Report of Management on Internal Control Over Financial Reporting and Attestation Report of Independent Registered PublicAccounting Firm
The report of management on our internal control over financial reporting as of December 31, 2012 and the attestation report ofour independent registered public accounting firm on our internal control over financial reporting are set forth in Part II, ‘‘Item 8.Financial Statements and Supplementary Data’’ in this report.
Changes in Internal Control Over Financial Reporting
There have been no changes in the Company’s internal control over financial reporting during the quarter ended December 31,2012 that have materially affected, or are reasonably likely to materially affect, the Company’s internal control over financialreporting.
ITEM 9B. OTHER INFORMATION
Not applicable.
PART III
ITEM 10. DIRECTORS, EXECUTIVE OFFICERS AND CORPORATE GOVERNANCE
The information under the principal headings ‘‘ELECTION OF DIRECTORS’’ and ‘‘SECTION 16(A) BENEFICIALOWNERSHIP REPORTING COMPLIANCE,’’ the information under the subheading ‘‘Codes of Business Conduct’’ under theprincipal heading ‘‘CORPORATE GOVERNANCE,’’ and the information regarding the Audit Committee under the subheading‘‘Board Meetings and Committees’’ under the principal heading ‘‘CORPORATE GOVERNANCE,’’ in the Company’s 2013 ProxyStatement is incorporated herein by reference. See Item X in Part I of this report for information regarding executive officers ofthe Company.
ITEM 11. EXECUTIVE COMPENSATION
The information under the principal headings ‘‘DIRECTOR COMPENSATION,’’ ‘‘COMPENSATION DISCUSSION ANDANALYSIS,’’ ‘‘REPORT OF THE COMPENSATION COMMITTEE,’’ ‘‘COMPENSATION COMMITTEE INTERLOCKS ANDINSIDER PARTICIPATION’’ and ‘‘EXECUTIVE COMPENSATION’’ in the Company’s 2013 Proxy Statement is incorporatedherein by reference.
ITEM 12. SECURITY OWNERSHIP OF CERTAIN BENEFICIAL OWNERS AND MANAGEMENT AND RELATEDSTOCKHOLDER MATTERS
The information under the principal headings ‘‘EQUITY COMPENSATION PLAN INFORMATION’’ and ‘‘OWNERSHIP OFEQUITY SECURITIES OF THE COMPANY’’ in the Company’s 2013 Proxy Statement is incorporated herein by reference.
ITEM 13. CERTAIN RELATIONSHIPS AND RELATED TRANSACTIONS, AND DIRECTOR INDEPENDENCE
The information under the subheading ‘‘Independence and Related Person Transactions’’ under the principal heading‘‘CORPORATE GOVERNANCE’’ in the Company’s 2013 Proxy Statement is incorporated herein by reference.
158

ITEM 14. PRINCIPAL ACCOUNTANT FEES AND SERVICES
The information under the subheadings ‘‘Audit Fees and All Other Fees’’ and ‘‘Audit Committee Pre-Approval of Audit andPermissible Non-Audit Services of Independent Auditors’’ below the principal heading ‘‘RATIFICATION OF THEAPPOINTMENT OF ERNST & YOUNG LLP AS INDEPENDENT AUDITORS’’ in the Company’s 2013 Proxy Statement isincorporated herein by reference.
PART IV
ITEM 15. EXHIBITS AND FINANCIAL STATEMENT SCHEDULES
(a) The following documents are filed as part of this report:
1. Financial Statements:
Consolidated Statements of Income — Years ended December 31, 2012, 2011 and 2010.
Consolidated Statements of Comprehensive Income — Years ended December 31, 2012, 2011 and 2010.
Consolidated Balance Sheets — December 31, 2012 and 2011.
Consolidated Statements of Cash Flows — Years ended December 31, 2012, 2011 and 2010.
Consolidated Statements of Shareowners’ Equity — Years ended December 31, 2012, 2011 and 2010.
Notes to Consolidated Financial Statements.
Report of Independent Registered Public Accounting Firm.
Report of Independent Registered Public Accounting Firm on Internal Control Over Financial Reporting.
2. Financial Statement Schedules:
The schedules for which provision is made in the applicable accounting regulations of the Securities and ExchangeCommission (‘‘SEC’’) are not required under the related instructions or are inapplicable and, therefore, have beenomitted.
3. Exhibits
In reviewing the agreements included as exhibits to this report, please remember they are included to provide youwith information regarding their terms and are not intended to provide any other factual or disclosure informationabout the Company or the other parties to the agreements. The agreements contain representations, warranties,covenants and conditions by or of each of the parties to the applicable agreement. These representations, warranties,covenants and conditions have been made solely for the benefit of the other parties to the applicable agreementand:
• should not in all instances be treated as categorical statements of fact, but rather as a way of allocating the risk toone of the parties if those statements prove to be inaccurate;
• may have been qualified by disclosures that were made to the other party in connection with the negotiation ofthe applicable agreement, which disclosures are not necessarily reflected in the agreement;
• may apply standards of materiality in a way that is different from what may be viewed as material to you or otherinvestors; and
• were made only as of the date of the applicable agreement or such other date or dates as may be specified in theagreement and are subject to more recent developments.
Accordingly, these representations and warranties may not describe the actual state of affairs as of the date theywere made or at any other time. Additional information about the Company may be found elsewhere in this reportand the Company’s other public filings, which are available without charge through the SEC’s website athttp://www.sec.gov.
159

Exhibit No.
(With regard to applicable cross-references in the list of exhibits below, the Company’s Current, Quarterly and Annual Reports are filed withthe Securities and Exchange Commission (the ‘‘SEC’’) under File No. 001-02217; and Coca-Cola Refreshments USA, Inc.’s (formerlyknown as Coca-Cola Enterprises Inc.) Current, Quarterly and Annual Reports are filed with the SEC under File No. 01-09300).
2.1.1 Business Separation and Merger Agreement, dated as of February 25, 2010, by and among Coca-ColaEnterprises Inc., International CCE, Inc., The Coca-Cola Company and Cobalt Subsidiary LLC.
Exhibit I Tax Sharing AgreementExhibit II Employee Matters AgreementExhibit III Form of Corporate Name LetterExhibit IV Form of Transition Services AgreementExhibit V-1 Bottler’s Agreement JurisdictionsExhibit V-2 Form of Bottler’s Agreement
— incorporated herein by reference to Exhibit 2.1 to the Company’s Current Report on Form 8-K filed on March 3,2010. In accordance with Item 601(b)(2) of Regulation S-K, certain schedules have not been filed. The Companyhereby agrees to furnish supplementally a copy of any omitted schedule to the SEC upon request.
2.1.2 Amendment No. 1, dated as of September 6, 2010, to the Business Separation and Merger Agreement, dated as ofFebruary 25, 2010, by and among Coca-Cola Enterprises Inc., International CCE Inc., the Company and CobaltSubsidiary LLC — incorporated by reference to Exhibit 2.1 to the Company’s Current Report on Form 8-K filed onSeptember 7, 2010.
2.2 Tax Sharing Agreement, dated as of February 25, 2010, by and among The Coca-Cola Company, Coca-ColaEnterprises Inc. and International CCE, Inc. (included as Exhibit I to the Business Separation and MergerAgreement) — incorporated herein by reference to Exhibit 2.2 of the Company’s Current Report on Form 8-K filedon March 3, 2010.
2.3 Employee Matters Agreement, dated as of February 25, 2010, by and among The Coca-Cola Company, Coca-ColaEnterprises Inc. and International CCE, Inc. (included as Exhibit II to the Business Separation and MergerAgreement) — incorporated herein by reference to Exhibit 2.3 to the Company’s Current Report on Form 8-K filedon March 3, 2010.
2.4 Letter Agreement, dated as of February 25, 2010, by and between the Company and Coca-Cola Enterprises Inc. —incorporated herein by reference to Exhibit 2.4 to the Company’s Current Report on Form 8-K filed on March 3,2010.
2.5 Share Purchase Agreement, dated as of March 20, 2010, by and among The Coca-Cola Company, Bottling Holdings(Luxembourg) s.a.r.l., Coca-Cola Enterprises Inc. and International CCE, Inc.
Exhibit I Form of Corporate Name LetterExhibit II Form of Bottler’s Agreement
— incorporated herein by reference to Exhibit 2.1 of the Company’s Current Report on Form 8-K filed on March 22,2010. In accordance with Item 601(b)(2) of Regulation S-K, certain schedules have not been filed. The Companyhereby agrees to furnish supplementally a copy of any omitted schedule to the SEC upon request.
3.1 Certificate of Incorporation of the Company, including Amendment of Certificate of Incorporation, dated July 27,2012 — incorporated herein by reference to Exhibit 3.1 to the Company’s Quarterly Report on Form 10-Q for thequarter ended September 28, 2012.
3.2 By-Laws of the Company, as amended and restated through April 17, 2008 — incorporated herein by reference toExhibit 3.2 of the Company’s Quarterly Report on Form 10-Q for the quarter ended June 27, 2008.
4.1 As permitted by the rules of the SEC, the Company has not filed certain instruments defining the rights of holders oflong-term debt of the Company or consolidated subsidiaries under which the total amount of securities authorizeddoes not exceed 10 percent of the total assets of the Company and its consolidated subsidiaries. The Company agreesto furnish to the SEC, upon request, a copy of any omitted instrument.
4.2 Amended and Restated Indenture, dated as of April 26, 1988, between the Company and Deutsche Bank TrustCompany Americas, as successor to Bankers Trust Company, as trustee — incorporated herein by reference toExhibit 4.1 to the Company’s Registration Statement on Form S-3 (Registration No. 33-50743) filed on October 25,1993.
160

Exhibit No.
4.3 First Supplemental Indenture, dated as of February 24, 1992, to Amended and Restated Indenture, dated as ofApril 26, 1988, between the Company and Deutsche Bank Trust Company Americas, as successor to Bankers TrustCompany, as trustee — incorporated herein by reference to Exhibit 4.2 to the Company’s Registration Statement onForm S-3 (Registration No. 33-50743) filed on October 25, 1993.
4.4 Second Supplemental Indenture, dated as of November 1, 2007, to Amended and Restated Indenture, dated as ofApril 26, 1988, as amended, between the Company and Deutsche Bank Trust Company Americas, as successor toBankers Trust Company, as trustee — incorporated herein by reference to Exhibit 4.3 to the Company’s CurrentReport on Form 8-K filed on March 5, 2009.
4.5 Form of Note for 5.350% Notes due November 15, 2017 — incorporated herein by reference to Exhibit 4.1 to theCompany’s Current Report on Form 8-K filed October 31, 2007.
4.6 Form of Note for 3.625% Notes due March 15, 2014 — incorporated herein by reference to Exhibit 4.4 to theCompany’s Current Report on Form 8-K filed on March 5, 2009.
4.7 Form of Note for 4.875% Notes due March 15, 2019 — incorporated herein by reference to Exhibit 4.5 to theCompany’s Current Report on Form 8-K filed on March 5, 2009.
4.8 [RESERVED]
4.9 Form of Note for 0.750% Notes due November 15, 2013 — incorporated herein by reference to Exhibit 4.5 to theCompany’s Current Report on Form 8-K filed November 18, 2010.
4.10 Form of Note for 1.500% Notes due November 15, 2015 — incorporated herein by reference to Exhibit 4.6 to theCompany’s Current Report on Form 8-K filed November 18, 2010.
4.10.1 Form of Note for 3.150% Notes due November 15, 2020 — incorporated herein by reference to Exhibit 4.7 to theCompany’s Current Report on Form 8-K filed November 18, 2010.
4.11 Form of Exchange and Registration Rights Agreement among the Company, the representatives of the initialpurchasers of the Notes and the other parties named therein — incorporated herein by reference to Exhibit 4.1 to theCompany’s Current Report on Form 8-K filed August 8, 2011.
4.12 Form of Note for 1.80% Notes due September 1, 2016 — incorporated herein by reference to Exhibit 4.13 to theCompany’s Quarterly Report on Form 10-Q for the quarter ended September 30, 2011.
4.13 Form of Note for 3.30% Notes due September 1, 2021 — incorporated herein by reference to Exhibit 4.14 to theCompany’s Quarterly Report on Form 10-Q for the quarter ended September 30, 2011.
4.14 Form of Note for Floating Rates Notes due March 14, 2014 — incorporated herein by reference to Exhibit 4.4 to theCompany’s Current Report on Form 8-K filed March 14, 2012.*
4.15 Form of Note for 0.750% Notes due March 13, 2015 — incorporated herein by reference to Exhibit 4.5 to theCompany’s Current Report on Form 8-K filed March 14, 2012.*
4.16 Form of Note for 1.650% Notes due March 14, 2018 — incorporated herein by reference to Exhibit 4.6 to theCompany’s Current Report on Form 8-K filed March 14, 2012.*
10.1.1 Supplemental Disability Plan of the Company, as amended and restated effective January 1, 2003 — incorporatedherein by reference to Exhibit 10.2 to the Company’s Annual Report on Form 10-K for the year ended December 31,2002.*
10.1.2 Termination of the Company’s Supplemental Disability Plan, effective December 31, 2012.*
10.2 Performance Incentive Plan of the Company, as amended and restated as of February 16, 2011 — incorporated hereinby reference to Exhibit 10.7 to the Company’s Current Report on Form 8-K filed February 17, 2011.*
10.3.1 1999 Stock Option Plan of the Company, as amended and restated through February 16, 2011 — incorporated hereinby reference to Exhibit 10.1 to the Company’s Current Report on Form 8-K filed February 17, 2011.*
10.3.2 Form of Stock Option Agreement in connection with the 1999 Stock Option Plan of the Company — incorporatedherein by reference to Exhibit 99.1 to the Company’s Current Report on Form 8-K filed February 14, 2007.*
10.3.3 Form of Stock Option Agreement in connection with the 1999 Stock Option Plan of the Company, as adoptedDecember 12, 2007 — incorporated herein by reference to Exhibit 10.8 to the Company’s Current Report onForm 8-K filed February 21, 2008.*
10.3.4 Form of Stock Option Agreement in connection with the 1999 Stock Option Plan of the Company, as adoptedFebruary 18, 2009 — incorporated herein by reference to Exhibit 10.5 to the Company’s Current Report on Form 8-Kfiled February 18, 2009.*
10.4.1 2002 Stock Option Plan of the Company, amended and restated through February 18, 2009 — incorporated herein byreference to Exhibit 10.3 to the Company’s Current Report on Form 8-K filed February 18, 2009.*
161

Exhibit No.
10.4.2 Form of Stock Option Agreement in connection with the 2002 Stock Option Plan, as amended — incorporated hereinby reference to Exhibit 99.1 to the Company’s Current Report on Form 8-K filed on December 8, 2004.*
10.4.3 Form of Stock Option Agreement in connection with the 2002 Stock Option Plan, as adopted December 12, 2007 —incorporated herein by reference to Exhibit 10.9 to the Company’s Current Report on Form 8-K filed on February 21,2008.*
10.4.4 Form of Stock Option Agreement in connection with the 2002 Stock Option Plan, as adopted February 18, 2009 —incorporated herein by reference to Exhibit 10.6 to the Company’s Current Report on Form 8-K filed on February 18,2009.*
10.5.1 2008 Stock Option Plan of the Company, as amended and restated, effective February 16, 2011 — incorporated hereinby reference to Exhibit 10.2 to the Company’s Current Report on Form 8-K filed on February 17, 2011.*
10.5.2 Form of Stock Option Agreement for grants under the Company’s 2008 Stock Option Plan — incorporated herein byreference to Exhibit 10.1 to the Company’s Current Report on Form 8-K filed July 16, 2008.*
10.5.3 Form of Stock Option Agreement for grants under the Company’s 2008 Stock Option Plan, as adopted February 18,2009 — incorporated herein by reference to Exhibit 10.7 to the Company’s Current Report on Form 8-K filedFebruary 18, 2009.*
10.6 1983 Restricted Stock Award Plan of the Company, as amended and restated through February 16, 2011 —incorporated herein by reference to Exhibit 10.3 to the Company’s Current Report on Form 8-K filed on February 17,2011.*
10.7.1 1989 Restricted Stock Award Plan of the Company, as amended and restated through February 16, 2011 —incorporated herein by reference to Exhibit 10.4 to the Company’s Current Report on Form 8-K filed February 17,2011.*
10.7.2 Form of Restricted Stock Agreement (Performance Share Unit Agreement) in connection with the 1989 RestrictedStock Award Plan of the Company, as adopted December 12, 2007 — incorporated herein by reference toExhibit 10.5 to the Company’s Current Report on Form 8-K filed February 21, 2008.*
10.7.3 Form of Restricted Stock Agreement (Performance Share Unit Agreement) for France in connection with the 1989Restricted Stock Award Plan of the Company, as adopted December 12, 2007 — incorporated herein by reference toExhibit 10.6 to the Company’s Current Report on Form 8-K filed February 21, 2008.*
10.7.4 Form of Restricted Stock Agreement in connection with The Coca-Cola Company 1989 Restricted Stock Award Plan,as adopted February 17, 2010 — incorporated herein by reference to Exhibit 10.1 to the Company’s Current Reporton Form 8-K filed on February 18, 2010. *
10.7.5 Form of Restricted Stock Agreement (Performance Share Unit Agreement) in connection withThe Coca-Cola Company 1989 Restricted Stock Award Plan, as adopted February 17, 2010 — incorporated herein byreference to Exhibit 10.2 to the Company’s Current Report on Form 8-K filed on February 18, 2010.*
10.7.6 Form of Restricted Stock Agreement (Performance Share Unit Agreement) for France in connection withThe Coca-Cola Company 1989 Restricted Stock Award Plan, as adopted February 17, 2010 — incorporated herein byreference to Exhibit 10.3 to the Company’s Current Report on Form 8-K filed on February 18, 2010.*
10.7.7 Form of Restricted Stock Agreement (Performance Share Unit Agreement) in connection with the 1989 RestrictedStock Award Plan of the Company, as adopted February 16, 2011 — incorporated herein by reference to Exhibit 10.5to the Company’s Current Report on Form 8-K filed February 17, 2011.*
10.7.8 Form of Restricted Stock Agreement (Performance Share Unit Agreement) for France in connection with the 1989Restricted Stock Award Plan of the Company, as adopted February 16, 2011 — incorporated herein by reference toExhibit 10.6 to the Company’s Current Report on Form 8-K filed February 17, 2011.*
10.7.9 Form of Restricted Stock Unit Agreement in connection with The Coca-Cola Company 1989 Restricted Stock AwardPlan, as adopted February 15, 2012 — incorporated herein by reference to Exhibit 10.1 to the Company’s CurrentReport on Form 8-K filed February 15, 2012.*
10.7.10 Form of Restricted Stock Unit Agreement in connection with The Coca-Cola Company 1989 Restricted Stock AwardPlan, as adopted February 15, 2012 — incorporated herein by reference to Exhibit 10.2 to the Company’s CurrentReport on Form 8-K filed February 15, 2012.*
10.7.11 Form of Restricted Stock Unit Agreement in connection with The Coca-Cola Company 1989 Restricted Stock AwardPlan, as adopted February 15, 2012 — incorporated herein by reference to Exhibit 10.1 to the Company’s CurrentReport on Form 8-K filed February 15, 2012.*
10.7.12 Form of Restricted Stock Unit Agreement in connection with The Coca-Cola Company 1989 Restricted Stock AwardPlan, as adopted February 15, 2012 — incorporated herein by reference to Exhibit 10.4 to the Company’s CurrentReport on Form 8-K filed February 15, 2012.*
162
Exhibit No.
10.7.13 Form of Restricted Stock Agreement (Performance Share Unit Agreement) in connection withThe Coca-Cola Company 1989 Restricted Stock Award Plan, as adopted February 15, 2012 — incorporated herein byreference to Exhibit 10.5 to the Company’s Current Report on Form 8-K filed February 15, 2012.*
10.7.14 Form of Restricted Stock Agreement (Performance Share Unit Agreement) for France in connection withThe Coca-Cola Company 1989 Restricted Stock Award Plan, as adopted February 15, 2012 — incorporated herein byreference to Exhibit 10.6 to the Company’s Current Report on Form 8-K filed February 15, 2012.*
10.8.1 Compensation Deferral & Investment Program of the Company, as amended, including Amendment Number Four,dated November 28, 1995 — incorporated herein by reference to Exhibit 10.13 to the Company’s Annual Report onForm 10-K for the year ended December 31, 1995.*
10.8.2 Amendment Number Five to the Compensation Deferral & Investment Program of the Company, effective as ofJanuary 1, 1998 — incorporated herein by reference to Exhibit 10.8.2 to the Company’s Annual Report on Form 10-Kfor the year ended December 31, 1997.*
10.8.3 Amendment Number Six to the Compensation Deferral & Investment Program of the Company, dated as ofJanuary 12, 2004, effective January 1, 2004 — incorporated herein by reference to Exhibit 10.9.3 to the Company’sAnnual Report on Form 10-K for the year ended December 31, 2003.*
10.9 [RESERVED]
10.10.1 Supplemental Pension Plan, Amended and Restated Effective January 1, 2010 — incorporated herein by reference toExhibit 10.10.6 to the Company’s Annual Report on Form 10-K for the year ended December 31, 2009.*
10.10.2 Amendment One to The Coca-Cola Company Supplemental Pension Plan, effective December 31, 2012, datedDecember 6, 2012.*
10.11 The Coca-Cola Company Supplemental 401(k) Plan (f/k/a the Supplemental Thrift Plan of the Company), Amendedand Restated Effective January 1, 2012, dated December 14, 2011 — incorporated herein by reference toExhibit 10.11 to the Company’s Annual Report on Form 10-K for the year ended December 31, 2011.*
10.12.1 The Coca-Cola Company Supplemental Cash Balance Plan, effective January 1, 2012 — incorporated herein byreference to Exhibit 10.12 to the Company’s Annual Report on Form 10-K for the year ended December 31, 2011.*
10.12.2 Amendment One to The Coca-Cola Company Supplemental Cash Balance Plan, dated December 6, 2012.*
10.13 The Coca-Cola Company Directors’ Plan, amended and restated on December 13, 2012, effective January 1, 2013.*
10.14 Long-Term Performance Incentive Plan of the Company, as amended and restated effective December 13, 2006 —incorporated herein by reference to Exhibit 10.14 to the Company’s Annual Report on Form 10-K for the year endedDecember 31, 2010.*
10.15 Executive Incentive Plan of the Company, adopted as of February 14, 2001 — incorporated herein by reference toExhibit 10.19 to the Company’s Annual Report on Form 10-K for the year ended December 31, 2000.*
10.16 Deferred Compensation Plan of the Company, as amended and restated December 8, 2010 — incorporated herein byreference to Exhibit 10.16 to the Company’s Annual Report on Form 10-K for the year ended December 31, 2010.*
10.17 The Coca-Cola Export Corporation Employee Share Plan, effective as of March 13, 2002 — incorporated herein byreference to Exhibit 10.31 to the Company’s Annual Report on Form 10-K for the year ended December 31, 2002.*
10.18 Employees’ Savings and Share Ownership Plan of Coca-Cola Ltd., effective as of January 1, 1990 — incorporatedherein by reference to Exhibit 10.32 to the Company’s Annual Report on Form 10-K for the year endedDecember 31, 2002.*
10.19 Share Purchase Plan — Denmark, effective as of 1991 — incorporated herein by reference to Exhibit 10.33 to theCompany’s Annual Report on Form 10-K for the year ended December 31, 2002.*
10.20.1 The Coca-Cola Company Benefits Plan for Members of the Board of Directors, as amended and restated throughApril 14, 2004 — incorporated herein by reference to Exhibit 10.1 to the Company’s Quarterly Report on Form 10-Qfor the quarter ended March 31, 2004.*
10.20.2 Amendment Number One to the Company’s Benefits Plan for Members of the Board of Directors, datedDecember 16, 2005 — incorporated herein by reference to Exhibit 10.31.2 to the Company’s Annual Report onForm 10-K for the year ended December 31, 2005.*
163

Exhibit No.
10.21.1 Employment Agreement, dated as of February 20, 2003, between the Company and Jose Octavio Reyes —incorporated herein by reference to Exhibit 10.43 to the Company’s Annual Report on Form 10-K for the year endedDecember 31, 2004.*
10.21.2 Letter, dated September 13, 2012, between Servicios Integrados de Administracion y Alta Gerencia, S de R.L. de C.V.and Jose Octavio Reyes — incorporated herein by reference to Exhibit 10.3 to the Company’s Current Report onForm 8-K filed on September 14, 2012.*
10.21.3 Modification of Conditions, Termination Agreement and Release, dated September 13, 2012, between ServiciosIntegrados de Administracion y Alta Gerencia, S de R.L. de C.V. and Jose Octavio Reyes — incorporated herein byreference to Exhibit 10.4 to the Company’s Current Report on Form 8-K filed on September 14, 2012.*
10.22 The Coca-Cola Company Severance Pay Plan, As Amended and Restated Effective January 1, 2012, datedDecember 14, 2011 — incorporated herein by reference to Exhibit 10.22 to the Company’s Annual Report onForm 10-K for the year ended December 31, 2011.*
10.23 Order Instituting Cease and Desist Proceedings, Making Findings and Imposing a Cease-and-Desist Order Pursuantto Section 8A of the Securities Act of 1933 and Section 21C of the Securities Exchange Act of 1934 — incorporatedherein by reference to Exhibit 99.2 to the Company’s Current Report on Form 8-K filed on April 18, 2005.
10.24 Offer of Settlement of The Coca-Cola Company — incorporated herein by reference to Exhibit 99.2 to theCompany’s Current Report on Form 8-K filed on April 18, 2005.
10.25 Employment Agreement, effective as of May 1, 2005, between Refreshment Services S.A.S. and Dominique Reiniche,dated September 7, 2006 — incorporated herein by reference to Exhibit 99.1 to the Company’s Current Report onForm 8-K filed on September 12, 2006.*
10.26 Refreshment Services S.A.S. Defined Benefit Plan, dated September 25, 2006 — incorporated herein by reference toExhibit 10.3 to the Company’s Quarterly Report on Form 10-Q for the quarter ended September 29, 2006.*
10.27 Share Purchase Agreement among Coca-Cola South Asia Holdings, Inc. and San Miguel Corporation, San MiguelBeverages (L) Pte Limited and San Miguel Holdings Limited in connection with the Company’s purchase ofCoca-Cola Bottlers Philippines, Inc., dated December 23, 2006 — incorporated herein by reference to Exhibit 99.1 tothe Company’s Current Report on Form 8-K filed on December 29, 2006.
10.28 Cooperation Agreement between Coca-Cola South Asia Holdings, Inc. and San Miguel Corporation in connectionwith the Company’s purchase of Coca-Cola Bottlers Philippines, Inc., dated December 23, 2006 — incorporatedherein by reference to Exhibit 99.2 to the Company’s Current Report on Form 8-K filed on December 29, 2006.
10.29.1 Offer Letter, dated July 20, 2007, from the Company to Joseph V. Tripodi, including Agreement on Confidentiality,Non-Competition and Non-Solicitation, dated July 20, 2007 — incorporated herein by reference to Exhibit 10.1 to theCompany’s Quarterly Report on Form 10-Q for the quarter ended September 28, 2007.*
10.29.2 Agreement between the Company and Joseph V. Tripodi, dated December 15, 2008 — incorporated herein byreference to Exhibit 10.47.2 to the Company’s Annual Report on Form 10-K for the year ended December 31, 2008.*
10.30 Letter, dated July 17, 2008, to Muhtar Kent — incorporated herein by reference to Exhibit 10.1 to the Company’sCurrent Report on Form 8-K filed July 21, 2008.*
10.31 Separation Agreement between the Company and Robert Leechman, dated February 24, 2009, including form of Fulland Complete Release and Agreement on Competition, Trade Secrets and Confidentiality — incorporated herein byreference to Exhibit 10.9 to the Company’s Quarterly Report on Form 10-Q for the quarter ended April 3, 2009.*
10.32 Separation Agreement between the Company and Cynthia McCague, dated June 22, 2009 (effective as of July 22,2009), including form of Full and Complete Release and Agreement on Competition, Trade Secrets andConfidentiality and summary of anticipated consulting agreement — incorporated herein by reference to Exhibit 10.1to the Company’s Quarterly Report on Form 10-Q for the quarter ended October 2, 2009.*
10.33 Letter of Understanding between the Company and Ceree Eberly, dated October 26, 2009, including Agreement onConfidentiality, Non-Competition and Non-Solicitation, dated November 1, 2009 — incorporated herein by referenceto Exhibit 10.47 to the Company’s Annual Report on Form 10-K for the year ended December 31, 2009.*
10.34.1 The Coca-Cola Export Corporation Overseas Retirement Plan, as amended and restated, effective October 1, 2007 —incorporated herein by reference to Exhibit 10.55 to the Company’s Annual Report on Form 10-K for the year endedDecember 31, 2008.*
164

Exhibit No.
10.34.2 Amendment Number One to The Coca-Cola Export Corporation Overseas Retirement Plan, as Amended andRestated Effective October 1, 2007, dated September 29, 2011 — incorporated herein by reference to Exhibit 10.34.2to the Company’s Annual Report on Form 10-K for the year ended December 31, 2011.*
10.34.3 Amendment Number Two to The Coca-Cola Export Corporation Overseas Retirement Plan, as Amended andRestated Effective October 1, 2007, dated November 14, 2011 — incorporated herein by reference to Exhibit 10.34.3to the Company’s Annual Report on Form 10-K for the year ended December 31, 2011.*
10.34.4 Amendment Number Three to The Coca-Cola Export Corporation Overseas Retirement Plan, as Amended andRestated Effective October 1, 2007, dated September 27, 2012 — incorporated herein by reference to Exhibit 10.11 tothe Company’s Quarterly Report on Form 10-Q filed on September 28, 2012.*
10.35.1 The Coca-Cola Export Corporation International Thrift Plan, as amended and restated, effective January 1, 2011 —incorporated herein by reference to Exhibit 10.8 to the Company’s Quarterly Report on Form 10-Q for the quarterended April 1, 2011.*
10.35.2 Amendment Number One to The Coca-Cola Export Corporation International Thrift Plan, as Amended andRestated, Effective January 1, 2011, dated September 20, 2011 — incorporated herein by reference to Exhibit 10.35.2to the Company’s Annual Report on Form 10-K for the year ended December 31, 2011.*
10.35.3 Amendment Number Two to The Coca-Cola Export Corporation International Thrift Plan, as Amended and RestatedEffective January 1, 2011, dated September 27, 2012 — incorporated herein by reference to Exhibit 10.10 to theCompany’s Quarterly Report on Form 10-Q filed on September 28, 2012.*
10.36 Letter Agreement, dated as of June 7, 2010, between The Coca-Cola Company and Dr Pepper Seven-Up, Inc. —incorporated herein by reference to Exhibit 10.1 to the Company’s Current Report on Form 8-K filed on June 7,2010.
10.37 [RESERVED]
10.38 Coca-Cola Enterprises Inc. Stock Deferral Plan — incorporated herein by reference to Exhibit 99.1 to the Company’sRegistration Statement on Form S-3 (Registration No. 333-169724) filed on October 1, 2010.*
10.39 Coca-Cola Enterprises Inc. 1997 Stock Option Plan — incorporated herein by reference to Exhibit 99.1 to theCompany’s Registration Statement on Form S-8 (Registration No. 333-169722) filed on October 1, 2010.*
10.40 Coca-Cola Enterprises Inc. 1999 Stock Option Plan — incorporated herein by reference to Exhibit 99.2 to theCompany’s Registration Statement on Form S-8 (Registration No. 333-169722) filed on October 1, 2010.*
10.41 Coca-Cola Enterprises Inc. 2001 Restricted Stock Award Plan — incorporated herein by reference to Exhibit 99.3 tothe Company’s Registration Statement on Form S-8 (Registration No. 333-169722) filed on October 1, 2010.*
10.42 Coca-Cola Enterprises Inc. 2001 Stock Option Plan — incorporated herein by reference to Exhibit 99.4 to theCompany’s Registration Statement on Form S-8 (Registration No. 333-169722) filed on October 1, 2010.*
10.43 Coca-Cola Enterprises Inc. 2004 Stock Award Plan — incorporated herein by reference to Exhibit 99.5 to theCompany’s Registration Statement on Form S-8 (Registration No. 333-169722) filed on October 1, 2010.*
10.44.1 Coca-Cola Enterprises Inc. 2007 Incentive Award Plan — incorporated herein by reference to Exhibit 99.6 to theCompany’s Registration Statement on Form S-8 (Registration No. 333-169722) filed on October 1, 2010.*
10.44.2 Form of 2007 Stock Option Agreement (Senior Officers) under the Coca-Cola Enterprises Inc. 2007 Incentive AwardPlan — incorporated herein by reference to Exhibit 10.32 to Coca-Cola Refreshments USA, Inc.’s (formerly known asCoca-Cola Enterprises Inc.) Annual Report on Form 10-K for the year ended December 31, 2007.*
10.44.3 Form of Stock Option Agreement (Chief Executive Officer and Senior Officers) under the Coca-Cola Enterprises Inc.2007 Incentive Award Plan for Awards after October 29, 2008 — incorporated herein by reference to Exhibit 10.16.4to Coca-Cola Refreshments USA, Inc.’s (formerly known as Coca-Cola Enterprises Inc.) Annual Report onForm 10-K for the year ended December 31, 2008.*
10.44.4 Form of 2007 Restricted Stock Unit Agreement (Senior Officers) under the Coca-Cola Enterprises Inc. 2007 IncentiveAward Plan — incorporated herein by reference to Exhibit 10.16.7 to Coca-Cola Refreshments USA, Inc.’s (formerlyknown as Coca-Cola Enterprises Inc.) Annual Report on Form 10-K for the year ended December 31, 2008.*
10.44.5 Form of 2007 Performance Share Unit Agreement (Senior Officers) under the Coca-Cola Enterprises Inc. 2007Incentive Award Plan — incorporated herein by reference to Exhibit 10.16.10 to Coca-Cola Refreshments USA, Inc.’s(formerly known as Coca-Cola Enterprises Inc.) Annual Report on Form 10-K for the year ended December 31,2008.*
165

Exhibit No.
10.44.6 Form of Performance Share Unit Agreement (Chief Executive Officer and Senior Officers) under the Coca-ColaEnterprises Inc. 2007 Incentive Award Plan for Awards after October 29, 2008 — incorporated herein by reference toExhibit 10.16.12 to Coca-Cola Refreshments USA, Inc.’s (formerly known as Coca-Cola Enterprises Inc.) AnnualReport on Form 10-K for the year ended December 31, 2008.*
10.45.1 Coca-Cola Refreshments USA, Inc. Supplemental Matched Employee Savings and Investment Plan (Amended andRestated Effective January 1, 2010) — incorporated herein by reference to Exhibit 10.2 to Coca-Cola RefreshmentsUSA, Inc.’s (formerly known as Coca-Cola Enterprises Inc.) Annual Report on Form 10-K for the year endedDecember 31, 2009.*
10.45.2 First Amendment to the Coca-Cola Refreshments USA, Inc. Supplemental Matched Employee Savings andInvestment Plan (Amended and Restated Effective January 1, 2010), dated September 24, 2010 — incorporatedherein by reference to Exhibit 10.45.2 to the Company’s Annual Report on Form 10-K for the year endedDecember 31, 2010.*
10.45.3 Second Amendment to the Coca-Cola Refreshments USA, Inc. Supplemental Matched Employee Savings andInvestment Plan (Amended and Restated Effective January 1, 2010), dated November 3, 2010 — incorporated hereinby reference to Exhibit 10.45.3 to the Company’s Annual Report on Form 10-K for the year ended December 31,2010.*
10.45.4 Third Amendment to the Coca-Cola Refreshments USA, Inc. Supplemental Matched Employee Savings andInvestment Plan, Effective January 1, 2010, dated February 15, 2011 — incorporated herein by reference toExhibit 10.45.4 to the Company’s Annual Report on Form 10-K for the year ended December 31, 2011.*
10.45.5 Fourth Amendment to the Coca-Cola Refreshments USA, Inc. Supplemental Matched Employee Savings andInvestment Plan, effective December 31, 2011, dated December 14, 2011 — incorporated herein by reference toExhibit 10.45.5 to the Company’s Annual Report on Form 10-K for the year ended December 31, 2011.*
10.46.1 Coca-Cola Refreshments Executive Pension Plan, dated December 13, 2010 (Amended and Restated EffectiveJanuary 1, 2011) — incorporated herein by reference to Exhibit 10.46 to the Company’s Annual Report on Form 10-Kfor the year ended December 31, 2010.*
10.46.2 Amendment Number One to the Coca-Cola Refreshments Executive Pension Plan (Amended and Restated EffectiveJanuary 1, 2011), dated as of July 14, 2011 — incorporated herein by reference to Exhibit 10.1 to the Company’sQuarterly Report on Form 10-Q for the quarter ended September 30, 2011.*
10.46.3 Amendment Number Two to the Coca-Cola Refreshments Executive Pension Plan, effective December 31, 2011, datedDecember 14, 2011 — incorporated herein by reference to Exhibit 10.46.3 to the Company’s Annual Report onForm 10-K for the year ended December 31, 2011.*
10.47 Summary Plan Description for Coca-Cola Refreshments USA, Inc. Executive Long-Term Disability Plan —incorporated by reference to Exhibit 10.18 of Coca-Cola Refreshments USA, Inc.’s (formerly known as Coca-ColaEnterprises Inc.) Annual Report on Form 10-K for the year ended December 31, 2006.*
10.48.1 Coca-Cola Refreshments USA, Inc. Executive Severance Plan (Amended and Restated Effective December 31,2008) — incorporated herein by reference to Exhibit 10.5.4 to Coca-Cola Refreshments USA, Inc.’s (formerly knownas Coca-Cola Enterprises Inc.) Annual Report on Form 10-K for the year ended December 31, 2008.*
10.48.2 Form Agreement in connection with the Coca-Cola Refreshments USA, Inc. Executive Severance Plan (Amended andRestated Effective September 25, 2008) — incorporated herein by reference to Exhibit 10.5.5 to Coca-ColaRefreshments USA, Inc.’s (formerly known as Coca-Cola Enterprises Inc.) Annual Report on Form 10-K for the yearended December 31, 2008.*
10.48.3 First Amendment to the Coca-Cola Refreshments USA, Inc. Executive Severance Plan (Amended and RestatedEffective December 31, 2008), dated as of November 3, 2010 — incorporated herein by reference to Exhibit 10.48.2to the Company’s Annual Report on Form 10-K for the year ended December 31, 2010.*
10.48.4 Amendment Number Two to the Coca-Cola Refreshments USA, Inc. Executive Severance Plan (Amended andRestated Effective December 31, 2008), dated as of July 14, 2011 — incorporated herein by reference to Exhibit 10.2to the Company’s Quarterly Report on Form 10-Q for the quarter ended September 30, 2011.*
10.48.5 Amendment Number Three to the Coca-Cola Refreshments Executive Severance Plan, dated September 24, 2012 —incorporated herein by reference to Exhibit 10.12 to the Company’s Quarterly Report on Form 10-Q filed onSeptember 28, 2012.*
10.49 Amendment to certain Coca-Cola Refreshments USA, Inc.’s (formerly known as Coca-Cola Enterprises Inc.)Employee Benefit Plans and Equity Plans, effective December 6, 2010 — incorporated herein by reference toExhibit 10.49 to the Company’s Annual Report on Form 10-K for the year ended December 31, 2010.*
10.50.1 Offer Letter, dated October 21, 2010, from the Company to Steven A. Cahillane, including Agreement onConfidentiality, Non-Competition and Non-Solicitation, dated November 10, 2010 — incorporated herein by referenceto Exhibit 10.50 to the Company’s Annual Report on Form 10-K for the year ended December 31, 2010.*
166
Exhibit No.
10.50.2 Letter, dated September 11, 2012, from the Company to Steven A. Cahillane — incorporated herein by reference toExhibit 10.1 to the Company’s Current Report on Form 8-K filed on September 14, 2012.*
10.51 Offer Letter, dated January 5, 2011, from the Company to Guy Wollaert, including Agreement on Confidentiality,Non-Competition and Non-Solicitation, dated June 23, 2008 — incorporated herein by reference to Exhibit 10.9 tothe Company’s Quarterly Report on Form 10-Q for the quarter ended April 1, 2011.*
10.52 Letter, dated September 11, 2012, from the Company to Ahmet Bozer — incorporated herein by reference toExhibit 10.2 to the Company’s Current Report on Form 8-K filed on September 14, 2012.*
10.53 Letter, dated September 11, 2012, from the Company to Brian Smith — incorporated herein by reference toExhibit 10.5 to the Company’s Current Report on Form 8-K filed on September 14, 2012.*
10.54 Letter, dated September 11, 2012, from the Company to J. Alexander Douglas, Jr. — incorporated herein byreference to Exhibit 10.6 to the Company’s Current Report on Form 8-K filed on September 14, 2012.*
10.55 Letter, dated September 11, 2012, from the Company to Brian Kelley — incorporated herein by reference toExhibit 10.7 to the Company’s Current Report on Form 8-K filed on September 14, 2012.*
10.56 Letter, dated September 11, 2012, from the Company to Nathan Kalumbu — incorporated herein by reference toExhibit 10.8 to the Company’s Current Report on Form 8-K filed on September 14, 2012.*
10.57.1 Letter, dated September 11, 2012, from the Company to James Quincey — incorporated herein by reference toExhibit 10.9 to the Company’s Current Report on Form 8-K filed on September 14, 2012.*
10.57.2 Service Agreement between Beverage Services Limited and James Robert Quincey, dated November 14, 2012.*
10.58 Letter, dated December 12, 2012, from the Company to Glen Walter, including Agreement on Confidentiality,Non-Competition and Non-Solicitation, dated December 14, 2012.*
10.59.1 Coca-Cola Refreshments Supplemental Pension Plan (Amended and Restated Effective January 1, 2011), datedDecember 13, 2010 — incorporated herein by reference to Exhibit 10.7 to the Company’s Quarterly Report onForm 10-Q for the quarter ended March 30, 2012.*
10.59.2 Amendment Number One to the Coca-Cola Refreshments Supplemental Pension Plan, dated December 14, 2011 —incorporated herein by reference to Exhibit 10.8 to the Company’s Quarterly Report on Form 10-Q for the quarterended March 30, 2012.*
10.59.3 Amendment Two to the Coca-Cola Refreshments Supplemental Pension Plan, dated December 6, 2012.*
10.60.1 Coca-Cola Refreshments Severance Pay Plan for Exempt Employees, effective as of January 1, 2012.*
10.60.2 Amendment One to the Coca-Cola Refreshments Severance Pay Plan for Exempt Employees, effective January 1,2012, dated May 24, 2012.*
10.60.3 Amendment Two to the Coca-Cola Refreshments Severance Pay Plan for Exempt Employees, dated December 6,2012.*
12.1 Computation of Ratios of Earnings to Fixed Charges for the years ended December 31, 2012, 2011, 2010, 2009 and2008.
18.1 Preferability Letter from Independent Registered Public Accounting Firm — incorporated herein by reference toExhibit 18.1 to the Company’s Quarterly Report on Form 10-Q for the quarter ended March 30, 2012.
21.1 List of subsidiaries of the Company as of December 31, 2012.
23.1 Consent of Independent Registered Public Accounting Firm.
24.1 Powers of Attorney of Officers and Directors signing this report.
31.1 Rule 13a-14(a)/15d-14(a) Certification, executed by Muhtar Kent, Chairman of the Board of Directors, ChiefExecutive Officer and President of The Coca-Cola Company.
31.2 Rule 13a-14(a)/15d-14(a) Certification, executed by Gary P. Fayard, Executive Vice President and Chief FinancialOfficer of The Coca-Cola Company.
32.1 Certifications required by Rule 13a-14(b) or Rule 15d-14(b) and Section 1350 of Chapter 63 of Title 18 of theUnited States Code (18 U.S.C. 1350), executed by Muhtar Kent, Chairman of the Board of Directors, Chief ExecutiveOfficer and President of The Coca-Cola Company and by Gary P. Fayard, Executive Vice President and ChiefFinancial Officer of The Coca-Cola Company.
167

Exhibit No.
101 The following financial information from The Coca-Cola Company’s Annual Report on Form 10-K for the year endedDecember 31, 2012, formatted in XBRL (eXtensible Business Reporting Language): (i) Consolidated Statements ofIncome for the years ended December 31, 2012, 2011 and 2010, (ii) Consolidated Statements of ComprehensiveIncome for the years ended December 31, 2012, 2011 and 2010, (iii) Consolidated Balance Sheets as of December 31,2012 and 2011, (iv) Consolidated Statements of Cash Flows for the years ended December 31, 2012, 2011 and 2010,(v) Consolidated Statements of Shareowners’ Equity for the years ended December 31, 2012, 2011 and 2010 and(vi) the Notes to Consolidated Financial Statements.
* Management contracts and compensatory plans and arrangements required to be filed as exhibits pursuant to Item 15(b) of this report.
168
SIGNATURES
Pursuant to the requirements of Section 13 or 15(d) of the Securities Exchange Act of 1934, the Registrant has duly caused thisreport to be signed on its behalf by the undersigned, thereunto duly authorized.
THE COCA-COLA COMPANY(Registrant)
By: /s/ MUHTAR KENT
Muhtar KentChairman of the Board of Directors,Chief Executive Officer and President
Date: February 27, 2013
Pursuant to the requirements of the Securities Exchange Act of 1934, this report has been signed below by the following personson behalf of the Registrant and in the capacities and on the dates indicated.
/s/ MUHTAR KENT *
Muhtar Kent Richard M. DaleyChairman of the Board of Directors, DirectorChief Executive Officer,President and a Director(Principal Executive Officer)
February 27, 2013 February 27, 2013
/s/ GARY P. FAYARD *
Gary P. Fayard Barry DillerExecutive Vice President and Chief Financial Officer Director(Principal Financial Officer)
February 27, 2013 February 27, 2013
/s/ KATHY N. WALLER *
Kathy N. Waller Evan G. GreenbergVice President and Controller Director(Principal Accounting Officer)
February 27, 2013 February 27, 2013
* *
Herbert A. Allen Alexis M. HermanDirector Director
February 27, 2013 February 27, 2013
* *
Ronald W. Allen Donald R. KeoughDirector Director
February 27, 2013 February 27, 2013
* *
Howard G. Buffett Robert A. KotickDirector Director
February 27, 2013 February 27, 2013
169

* *
Maria Elena Lagomasino Peter V. UeberrothDirector Director
February 27, 2013 February 27, 2013
* *
Donald F. McHenry Jacob WallenbergDirector Director
February 27, 2013 February 27, 2013
* *
Sam Nunn James B. WilliamsDirector Director
February 27, 2013 February 27, 2013
*
James D. Robinson IIIDirector
February 27, 2013
*By: /s/ GLORIA K. BOWDEN
Gloria K. BowdenAttorney-in-fact
February 27, 2013
170

EXHIBIT 31.1
CERTIFICATIONS
I, Muhtar Kent, Chairman of the Board of Directors, Chief Executive Officer and President of The Coca-Cola Company, certifythat:
1. I have reviewed this annual report on Form 10-K of The Coca-Cola Company;
2. Based on my knowledge, this report does not contain any untrue statement of a material fact or omit to state a materialfact necessary to make the statements made, in light of the circumstances under which such statements were made, notmisleading with respect to the period covered by this report;
3. Based on my knowledge, the financial statements, and other financial information included in this report, fairly presentin all material respects the financial condition, results of operations and cash flows of the registrant as of, and for, theperiods presented in this report;
4. The registrant’s other certifying officer(s) and I are responsible for establishing and maintaining disclosure controls andprocedures (as defined in Exchange Act Rules 13a-15(e) and 15d-15(e)) and internal control over financial reporting (asdefined in Exchange Act Rules 13a-15(f) and 15d-15(f)) for the registrant and have:
(a) Designed such disclosure controls and procedures, or caused such disclosure controls and procedures to be designedunder our supervision, to ensure that material information relating to the registrant, including its consolidatedsubsidiaries, is made known to us by others within those entities, particularly during the period in which this reportis being prepared;
(b) Designed such internal control over financial reporting, or caused such internal control over financial reporting to bedesigned under our supervision, to provide reasonable assurance regarding the reliability of financial reporting andthe preparation of financial statements for external purposes in accordance with generally accepted accountingprinciples;
(c) Evaluated the effectiveness of the registrant’s disclosure controls and procedures and presented in this report ourconclusions about the effectiveness of the disclosure controls and procedures, as of the end of the period covered bythis report based on such evaluation; and
(d) Disclosed in this report any change in the registrant’s internal control over financial reporting that occurred duringthe registrant’s most recent fiscal quarter (the registrant’s fourth fiscal quarter in the case of an annual report) thathas materially affected, or is reasonably likely to materially affect, the registrant’s internal control over financialreporting; and
5. The registrant’s other certifying officer(s) and I have disclosed, based on our most recent evaluation of internal controlover financial reporting, to the registrant’s auditors and the audit committee of the registrant’s board of directors (orpersons performing the equivalent functions):
(a) All significant deficiencies and material weaknesses in the design or operation of internal control over financialreporting which are reasonably likely to adversely affect the registrant’s ability to record, process, summarize andreport financial information; and
(b) Any fraud, whether or not material, that involves management or other employees who have a significant role in theregistrant’s internal control over financial reporting.
Date: February 27, 2013
/s/ MUHTAR KENT
Muhtar KentChairman of the Board of Directors, Chief Executive Officerand President
EXHIBIT 31.2
CERTIFICATIONS
I, Gary P. Fayard, Executive Vice President and Chief Financial Officer of The Coca-Cola Company, certify that:
1. I have reviewed this annual report on Form 10-K of The Coca-Cola Company;
2. Based on my knowledge, this report does not contain any untrue statement of a material fact or omit to state a materialfact necessary to make the statements made, in light of the circumstances under which such statements were made, notmisleading with respect to the period covered by this report;
3. Based on my knowledge, the financial statements, and other financial information included in this report, fairly presentin all material respects the financial condition, results of operations and cash flows of the registrant as of, and for, theperiods presented in this report;
4. The registrant’s other certifying officer(s) and I are responsible for establishing and maintaining disclosure controls andprocedures (as defined in Exchange Act Rules 13a-15(e) and 15d-15(e)) and internal control over financial reporting (asdefined in Exchange Act Rules 13a-15(f) and 15d-15(f)) for the registrant and have:
(a) Designed such disclosure controls and procedures, or caused such disclosure controls and procedures to be designedunder our supervision, to ensure that material information relating to the registrant, including its consolidatedsubsidiaries, is made known to us by others within those entities, particularly during the period in which this reportis being prepared;
(b) Designed such internal control over financial reporting, or caused such internal control over financial reporting to bedesigned under our supervision, to provide reasonable assurance regarding the reliability of financial reporting andthe preparation of financial statements for external purposes in accordance with generally accepted accountingprinciples;
(c) Evaluated the effectiveness of the registrant’s disclosure controls and procedures and presented in this report ourconclusions about the effectiveness of the disclosure controls and procedures, as of the end of the period covered bythis report based on such evaluation; and
(d) Disclosed in this report any change in the registrant’s internal control over financial reporting that occurred duringthe registrant’s most recent fiscal quarter (the registrant’s fourth fiscal quarter in the case of an annual report) thathas materially affected, or is reasonably likely to materially affect, the registrant’s internal control over financialreporting; and
5. The registrant’s other certifying officer(s) and I have disclosed, based on our most recent evaluation of internal controlover financial reporting, to the registrant’s auditors and the audit committee of the registrant’s board of directors (orpersons performing the equivalent functions):
(a) All significant deficiencies and material weaknesses in the design or operation of internal control over financialreporting which are reasonably likely to adversely affect the registrant’s ability to record, process, summarize andreport financial information; and
(b) Any fraud, whether or not material, that involves management or other employees who have a significant role in theregistrant’s internal control over financial reporting.
Date: February 27, 2013
/s/ GARY P. FAYARD
Gary P. FayardExecutive Vice President and Chief Financial Officer
EXHIBIT 32.1
CERTIFICATION PURSUANT TO18 U.S.C. SECTION 1350,
AS ADOPTED PURSUANT TOSECTION 906 OF THE SARBANES-OXLEY ACT OF 2002
In connection with the annual report of The Coca-Cola Company (the ‘‘Company’’) on Form 10-K for the period endedDecember 31, 2012 (the ‘‘Report’’), I, Muhtar Kent, Chairman of the Board of Directors, Chief Executive Officer and President ofthe Company and I, Gary P. Fayard, Executive Vice President and Chief Financial Officer of the Company, each certify, pursuantto 18 U.S.C. Section 1350, as adopted pursuant to Section 906 of the Sarbanes-Oxley Act of 2002, that:
(1) to my knowledge, the Report fully complies with the requirements of Section 13(a) or 15(d) of the Securities ExchangeAct of 1934; and
(2) the information contained in the Report fairly presents, in all material respects, the financial condition and results ofoperations of the Company.
/s/ MUHTAR KENT
Muhtar KentChairman of the Board of Directors, Chief Executive Officerand President
February 27, 2013
/s/ GARY P. FAYARD
Gary P. FayardExecutive Vice President and Chief Financial Officer
February 27, 2013

21JAN200914582922Printed on Recycled Paper