coherent radar—opportunities and demands radar system stability and signal processing are...
TRANSCRIPT

R. RZEMIEN
DEVELOPMENT
he Applied Physics Laboratory, in its role as Technical Direction Agent forseveral Navy radar development programs, applies a coherent data collection andanalysis methodology when evaluating system performance. Programs that havebenefited from this approach include the Mark 92 Modification 6 (MK 92 MOD 6) firecontrol system, the Phalanx close-in weapon system, and the AN/SPS-48E surveillanceradar. Examples from these and other programs, highlighting specific cases where thisapproach has proved successful, are presented. Programs using Laboratory-designedprocessors that also collect and play back coherent data at real-time rates are described.An example of the use of the coherent database in the development and verificationof a land clutter model is presented. Ongoing and future efforts are described.
Coherent Radar—Opportunities and Demands
Russell Rzemien
T
INTRODUCTIONRadar systems detect targets by examining reflected
energy, or returns, from objects.1,2 Along with targetechoes, however, come returns from the sea surface,land masses, buildings, rainstorms, and other sources.Much of this clutter is far stronger than signals receivedfrom the targets of interest. The main challenge toradar systems is discriminating these weaker targetechoes from the clutter. Coherent signal processingtechniques (see the boxed insert on page 393) are fre-quently used to this end.3 These techniques will onlywork if sufficient waveform stability is provided. Thus,the main demand on the system designer is to ensurethat radar system stability and signal processing aresufficient to detect the targets.
The designer, when estimating radar performance,will often use simplified models. Statistical methodsare employed since the environment and the target areusually far too complex to be treated by exact math-ematical methods. Aircraft echoes, for example, fluc-tuate tens of decibels in power when changing aspectangle, with respect to the radar, by only a few degrees.Clutter returns, particularly from land, are equally dif-
386 JOHN
ficult to estimate. Thus, radar performance can only beapproximated in many situations.
APL is frequently tasked to evaluate the perfor-mance of either existing or proposed radar systems. Amethodology frequently used by the Laboratory in-volves collecting and analyzing the coherent data seenby the radar system prior to any digital signal process-ing. This approach provides the actual radar view ofthe environment and gives the designer a powerful toolfor assessing system performance in the real world. Thedata are invaluable for developing accurate radar en-vironment models.
In modern coherent radar receivers, input datarates to the signal processor can easily exceed thecapabilities of commercially available storage devices.To meet system analysis requirements, APL buildsand operates a number of specialized recording de-vices (see the boxed insert on the generic coherentdata collector). The following sections describe howseveral Navy programs have benefited from theLaboratory’s coherent data collection and analysismethodology.
S HOPKINS APL TECHNICAL DIGEST, VOLUME 17, NUMBER 4 (1996)

COHERENT RADAR—OPPORTUNITIES AND DEMANDS
MK 92 MOD 6 FIRE CONTROL SYSTEMThe Mark 92 Modification 6 (MK 92 MOD 6) fire
control system provides radar air and surface surveil-lance, acquisition, and tracking in support of gun andmissile engagements against threats to ownship. In theearly 1980s, a letter from the Chief of Naval Opera-tions directed that a comprehensive program be initi-ated to improve performance of the fire control systemson frigates of the FFG-7 class. The program involvedmajor modifications to the existing version of theradars (designated MOD 2), including development ofa coherent transmitter and digital signal processor. AsTechnical Direction Agent, APL initiated coherentdata collection and analysis efforts in support of systemtest and evaluation.4 Since the MK 92 MOD 6 firecontrol system has both search and track radars, thecoherent data collector developed to support this effortwas designed to collect data from either type of radar.
One of the earliest results of the effort was the dis-covery of a limitation in the stability of the transmittedpulse. By examining the radar return from stationarytargets and clutter, it was apparent that the first pulsetransmitted by the radar was not locked in phase prop-erly with respect to subsequent pulses. The result wasa reduction in the ability to cancel clutter, since can-cellation techniques depend on, among other things,phase stability in the transmitted pulse. Although theprogram could not afford to replace the electronicsresponsible for the instability, signal processing changeswere implemented to mitigate the problem.
Study of the collected data led to a greater appre-ciation of the effect of multiple-interval clutter onsystem performance. Multiple-interval clutter occurswhen echoes come from objects so far away that thetime required for the echo to return is greater than thetime between transmitted pulses. In this case, the firstecho will be received during the listening time associ-ated with the second or later transmitted pulse. In itscoherent modes, these late-arriving returns perturb thesignal processor and may generate false detections.
A common technique used to lessen the effects ofmultiple-interval clutter is to process only the laterpulses in the processing interval, that is, some numberof pulses are transmitted before search processing be-gins. The earlier transmitted pulses are thereby giventime to return, and the clutter seen by the processor isstable. This approach does not work well for the MK92 MOD 6 because it has a limited number of pulsesavailable for processing. Eliminating several pulses re-sults in a significant reduction in system sensitivity and,consequently, a sizable loss in the system’s ability todetect targets. An innovative technique was developedat APL in collaboration with Loral Defense Systems,using the collected coherent data. The new approachallowed the radar to automatically select between ei-ther those pulses that were not corrupted by distant
JOHNS HOPKINS APL TECHNICAL DIGEST, VOLUME 17, NUMBER 4 (199
clutter or pulses consisting only of close-in, and con-sequently stable, clutter.
In 1995, APL supported radar propagation testsconducted in the Arabian Gulf. The environment fre-quently produces ducting or trapping of radar signals,resulting in abnormally large returns from objects thatwould otherwise not be seen by the radar. This phe-nomenon, combined with the heavy ship traffic andlarge number of oil platforms in the Gulf, can severelyaffect system performance. The tests were an opportu-nity to directly measure the effectiveness of MK 92MOD 6 coherent processing in a challenging environ-ment.
Figure 1a is a planned position indicator plot pro-duced using the coherent data collected during theexercise. The plot was created by entering the data intoa software emulation of the MK 92 MOD 6 radar pro-cessor. This is a good representation of what an operatoractually sees on the MK 92 MOD 6 planned positionindicator display. As a result of data analysis, APLproposed a new approach to multiple-interval clutterprocessing. This approach typically eliminates over80%, and in some cases over 90%, of the false detec-tions. Figure 1b illustrates the improvement using thesame data in Fig. 1a but incorporating the recommend-ed modifications to the radar’s signal processor.
MK 92 MOD 2 RADAR PROCESSORThe MOD 6 version of the MK 92 fire control sys-
tem provided significant improvement over the MOD2 radar. However, the cost of upgrading all frigates withthe newer radar is prohibitive, especially in an era ofdeclining defense spending. APL and the Naval Re-search Laboratory proposed an upgrade to the MOD 2system that would result in improved performancewhile costing considerably less than a MOD 6 system.This upgrade was named the MK 92 Commercial-off-the-shelf Affordable Near-term Deficiency-correctingORDALT (CANDO). (ORDALT stands for ordinancealteration.) The program was initiated primarily toprovide MOD 2 ships with reliable detection and track-ing capability against low-flying missile threats withsmall radar cross sections. Program constraints includedlow system cost, no major changes to the radar, and arapid development schedule of 2 years.
Reliable detection of low-flying threats would re-quire the addition of an automatic detect and track(ADT) capability. Low-flying threats are of particularconcern since they are below the horizon and notvisible to ship sensors until shortly before they reachthe ship, thereby leaving little time for defensive ac-tion. Standard ADT techniques would result in toomany false tracks, since the MOD 2 system generatesa large number of false detections in clutter. The re-quired ADT performance would be achieved using an
6) 387

R. RZEMIEN
A generic coherent data collector. The actual interface to the radar may require picking up signals from several locations in the radar.In some cases special boards are built for use in the radar to provide signal driving capability to the data collector. The collectoritself is typically a combination of custom-built boards and commercially available circuit cards. Peripheral devices, such as the externalstorage devices, are frequently housed in separate enclosures. I/Q, in-phase channel/quadrature channel.
THE GENERIC COHERENT DATA COLLECTORThe block diagram shows the essential elements of a generic
coherent data collector. Conceptually, the device is quite sim-ple. It consists of a high-speed digital interface to the radarsystem, test signal generation capability and signal multiplex-ing, data control and formatting, high-speed buffer memory, asystem controller, a host bus adapter, and peripheral devices.Although some of these functions can be implemented usingcommercially available circuit cards, the more demanding tasksrequire custom hardware.
The high-speed digital interface, for example, is usuallycustom designed, since radar sets seldom make provision forexternal instrumentation that taps into the high-speed digital
signal processor. The interface will frequently provide impor-tant radar system information such as triggers for each trans-mitted pulse, antenna pointing information, and radar modedata. In some cases radar data are available only in analog form,in which case analog-to-digital converters are provided as partof the coherent data collector.
There is usually internally generated test circuitry to sim-ulate radar signals. This capability aids in debugging the coher-ent data collector during development and provides a meansto test system performance when the device is operated in thefield. Either radar data or test data can be selected for furtherprocessing. (Usually an external planned position indicator
Coherent datacollector radarvideo display
Host busadapter
Systemcontroller
Externalstoragedevices
Controlterminal
High-speedbuffer
memory
Datacontrol
andformatter
Receivers
Radar/testsignal
multiplexermonitorpoints
Digitalsignaldrivers
I/Q data
Radar set Coherent data collector processor VME
Status
0
30
60
90
120
150
180
210
240
270
300
330
Bearing (deg)
20 Range (nmi)
16
12
8
4
(a)0
30
60
90
120
150
180
210
240
270
300
330
Bearing (deg)
20 Range (nmi)
16
12
8
4
(b)
Figure 1. MK 92 multiple-interval clutter false detections. (a) With current clutter processing. The range scale is from 0 to 20 nmi andcorresponds to the unambiguous range of the radar, i.e., the maximum range at which an echo can return from a transmitted pulse beforea following pulse is transmitted. The false detections, apparent as “bars” of detections radiating out from the center of the planned-positionindicator plot, are caused by land and other objects located more than 20 mi from the radar. Four scans; 6149 detections. (b) With the APLmodification to clutter processing. Note the almost complete absence of false detection “bars” compared with Fig. 1a. Four scans; 546detections.
388 JOHNS HOPKINS APL TECHNICAL DIGEST, VOLUME 17, NUMBER 4 (1996)

COHERENT RADAR—OPPORTUNITIES AND DEMANDS
monitor is driven by this circuitry. It acts as an aid to thecollector operator.) The data controlling and formatting cir-cuitry group data as needed to optimize throughput by cuttingdown on overhead or “spare” bits. Test or data synchronizationpatterns are often inserted into the data at this point.
A high-speed random access memory buffer is frequentlyused to temporarily store data until some or all of it is sent topermanent storage devices. Even the high-speed storage devicesavailable today are inadequate when faced with data rates thatcan reach 90 MB/s. In such cases some type of data gating isrequired to reduce this input rate to a lower sustainable collec-tion rate. The reduction is accomplished by gating the data inrange, azimuth, elevation angle, or some combination of these.The rate reduction comes with a loss of coverage. In many cases,however, this loss is not significant. For targets, the position inspace may be known well enough to allow gating. Environmen-tal samples may also cover only a fraction of the total surveil-lance volume.
Permanent storage is frequently provided by external pe-ripheral units. As technology improves, sufficient speed anddensity will be available to allow these devices to be part of thecollector enclosure. Typically, a parallel disk array, consistingof several hard disk drive units operating simultaneously, is usedto temporarily hold the data. These devices have the neededstorage rate and density to support most test requirements, butthey will eventually fill. At a convenient time, the array isdownloaded to magnetic tape for permanent storage. Thesetapes are later used in data reduction and analysis. Given thevery high data rates of modern digital radar receivers, this two-tiered approach will likely be used for many years to come.
Occasionally, a tape drive system is used alone, but thatusually severely limits the amount of data that can be taken.Permanent storage writing to a medium must keep up with theaverage data rate from the system. On a per-scan basis, this ratecan amount to several megabytes of data per second, whichexceeds the capabilities of most affordable tape drive units.(Very-high-speed tape drive units in the 10- to 30-MB/s storage
rate range are available but cost from $70,000 to $250,000 perunit.)
An imbedded monoboard computer is used as the systemcontroller. The controller allows the operator to select collectormodes, such as internal test, collect data, download data, etc.The operator enters commands to the collector via an externalcontrol terminal. The terminal provides status and error mes-sages to the operator. An internal bus is always used for com-munication between the different devices in the processor. Thediagram shows a VME bus because this is the one most frequent-ly used in these applications. (The acronym VME comes fromVERSAmodule Eurocard, where VERSAbus is an old Motorolabackplane bus and the Eurocard is a circuit board standard.) Ahost bus adapter provides the interface between the externalstorage devices and the coherent data collector processor. Insome cases, such as data transfers to tape drive units, the in-terface may exist on the system controller itself.
A collection normally proceeds as follows: First, the oper-ator initializes the collector, entering time of day and date.Next, the collect sector is set and the command is given to startcollection. The time at the start of the collection is stored alongwith data from the collect sector. Collection continues untileither the operator stops the collector or the system’s perma-nent storage device fills up. Multiple collect files may be madebefore the parallel disk array is downloaded to magnetic tape.
Although most coherent data collectors have been built toperform these tasks alone, some have been incorporated intoradar processors. In this configuration, the collector not onlyprovides its traditional role but also has been designed to playback the data into the processor at real-time speeds. In this way,collected test data can be replayed through the processor, andthe effectiveness of the processing can be studied in detail. Insome cases the collector function is available well before theprocessor design and debug are completed. The collector nowtakes the place of the radar, allowing the processor circuitry andalgorithms to be tested at greatly reduced cost and with fargreater efficiency.
innovative track initiation algorithm that receives tar-get velocity information via a new velocity estimationalgorithm.
To minimize program cost and risk, a proof-of-concept phase, which included data collection andanalysis, was first completed. Data analysis showed thatin most environments fast, reliable promotion on thetargets of interest was possible. The data also demon-strated that the system was susceptible to multiple-in-terval clutter. The MOD 6 search radar improvementsthat ameliorated the effects of multiple-interval clutterare not applicable to MOD 2 because its waveform isdifferent. Unfortunately, the ambitious developmentschedule did not allow a potential solution proposed bythe Naval Research Laboratory to be implemented.
The processor electronics, housed in a unit calledthe MK 92 radar processor (MRP), consisted of state-
JOHNS HOPKINS APL TECHNICAL DIGEST, VOLUME 17, NUMBER 4 (1
of-the-art digital signal processing boards, general-purpose processors, commercial interface boards, andcustom-designed boards. Figure 2 shows the board andbus architecture. Custom boards, designed and built atAPL, were needed to support unique interface require-ments between the MRP and the radar. The commer-cial interface cards provided standardized interfaces toperipherals or computers. The general-purpose proces-sors provided system control capability and general-purpose calculation ability. The digital signal process-ing boards provided the high speed needed for radarsignal processing of the raw in-phase channel/quadra-ture channel (I/Q) data received from either live radardata or parallel disk array archived data.
The MRP is designed to act as a data collector, asignal processor, and an automatic tracker. Playbackcapability, achieved by reloading archived data tapes to
996) 389

R. RZEMIEN
Displayinterface
DX data distributorDX data distributor
Disk arraycontroller
Disk arrayHBA
FlashEPROM
I/O datadistributorI/O data
distributor
DetectionDetection
DetectionDetection
DetectionDetection
FlashEPROM
I/O buscontroller
Main DX
WSP I/F
UpdateTMF
Trk init
Assoc/Res
Act. control
Clutter mapCentroider
Velocityestimator
Load levelerFlash
EPROM
Main buscontroller
WSPNTDS I/O
Signal multiplexerand data controller
Buffer controller
32-bit data
DX VSB bus
VSB bus
VSB
VSB bus
I/Q DX bus(VME)
I/O bus(VME)
Main bus(VME)
SCSIExabytetape drive
Disk array
WSP
SCSI Exabyte
EthernetDisplayMK 92 CAS search
radar data
VSB
Figure 2. Board architecture for the MK 92 radar processor. Each block represents a circuit board. The white blocks are i860-based boards.Not shown is the parallel disk array that is part of the data collection and playback capability. DX, data extraction; VME, VERSAmoduleEurocard; VSB, VME sub-bus; SCSI, Small Computer System Interface; WSP, Weapons Support Processor; I/F, interface; NTDS, NavalTactical Data System; I/O, input/output; TMF, Track Management Function; Trk init, track initiation; Assoc/Res, association/resolution; Act.control, activity control; HBA, host bus adapter; I/Q, in-phase channel/quadrature; EPROM, erasable programmable read-only memory;CAS, Combined Antenna System.
the disk array, is implemented to allow stored I/Q datafrom previous collections to be reprocessed through thesystem in real time. This capability allowed the programto be successfully completed within the short develop-ment schedule. It makes it possible to check processingalgorithms under realistic conditions, significantly re-ducing the amount of expensive at-sea or land-basedtesting.
The most significant improvement in system perfor-mance came from the new automatic tracker. In track-ers, spatially correlated detections that meet criteriasuch as a minimum number of detections are assumedto originate from a real target. Correlation is requiredto minimize the number of false tracks generated by asystem. Trackers maintain several confidence levels fortracks, such as tentative tracks and assumed tracks. Thehighest confidence track level is called “firm.” Onlyfirm tracks are reported to the combat system and,consequently, to ship personnel responsible for assign-ing weapons to counter threats. This approach keeps aship’s resources from being unnecessarily diverted tofalse tracks generated by clutter. In the process of re-ducing false tracks, one must be careful not to severelydesensitize the system.
The new tracker decreased the number of detectionsneeded to declare a firm track by checking velocityestimates associated with each detection. If the spatial-ly determined range rate corresponded to the velocity
390 JOH
estimation, a track would reach firm status sooner.In defending against low-flying threats, every secondis important. The new ADT with its quicker firm trackpromotion logic identifies threats at greater range,thereby increasing the time available for defensiveaction.
The MRP was used to collect data in at-sea testinginvolving low-flying missiles with small cross sections.The data were returned to APL for analysis. Figure 3shows detections from two targets approaching theship. The arrows show where the detections would formfirm tracks using the MRP tracker and where the samedetections would have formed firm tracks without thevelocity estimator. In both cases, the new tracker pro-vided firm tracks earlier than the older tracker.
As the system matured, further tests and demonstra-tions of the MRP were conducted at land-based sites.As a result of the successful demonstrations, the systemwas installed aboard a frigate for live firing tests at thePacific Missile Range Facility. The tests, involvingsmall, sea-skimming targets, were a complete success;the MRP-equipped ship consistently outperformed twoother ships equipped with MK 92 MOD 2. These testshighlight the importance of a properly functioningADT capability. The CANDO program’s implementa-tion of the combined coherent collection and playbackcapability demonstrated the value of such an approachto system development.
NS HOPKINS APL TECHNICAL DIGEST, VOLUME 17, NUMBER 4 (1996)

COHERENT RADAR—OPPORTUNITIES AND DEMANDS
Figure 3. Comparison of MRP tracker performance with andwithout the use of velocity estimates. Detection/track updates oftwo low-flying missiles with small radar cross section are shown.The numbers in parentheses are the ranges at which the indicatedevents occurred, e.g., firm track occurred at 11.5 nmi with velocityestimation.
13
11
9
7
50 10 20 30 40
Time (s)
Ran
ge (
nmi)
Firm track (11.5)
Firm track withoutvelocity estimates (10.0)
Firm track (9.1)
Firm track withoutvelocity estimates (8.7)
PHALANX CLOSE-IN WEAPONSYSTEM
Naval combatant ships, such as cruisers, destroyers,and frigates, have several weapon systems for defenseagainst attacking aircraft and missiles. One of these isthe Phalanx close-in weapon system. It uses short-rangesurveillance and tracking radars and a 20-mm gun toengage those threats that have penetrated the outerlayers of defense (i.e., those ship’s systems used to en-gage threats farther out from the ship). Because of itsclose-in defense role, little time is available for Phalanxto detect and engage attackers. Phalanx must cope withlarge levels of close-in sea clutter, as well as with strongradar returns from land and rain that may appear asmultiple-interval clutter. The challenge to the radardesigner is to maintain high sensitivity (to detect small,fast-moving targets) while keeping the false-alarm rate(caused by clutter) low.
USS Coral Sea (CV 43) received the first afloatBlock 0 in 1980. This version had analog processors forboth search and track radars. At about the same time,an upgraded system was proposed to meet new threats.Designated Block 1 (first deployed aboard USS Wiscon-sin [BB 64] in 1988), it had an increased search surveil-lance volume coverage, the ability to acquire and en-gage faster targets, an increased fire rate, and a largermagazine. As part of the upgrade, a new digital searchradar processor and search waveforms were proposed.APL, providing technical direction for the program,proposed and built a coherent data collector to supporttest and evaluation.5
The Laboratory’s efforts focused on the search radar.One of the first areas of concern had to do with thelarge number of false alarms generated when the radar
JOHNS HOPKINS APL TECHNICAL DIGEST, VOLUME 17, NUMBER 4 (19
was close to large land masses. Data collection andanalysis showed that these false alarms were caused bydynamic range limitations in the receiver. Electronicsystems can process signals only over a limited range ofamplitudes before becoming saturated. Saturation re-sults in, among other things, the suppression of systemnoise. In the presence of saturating levels of clutter, theprocessor will respond to the suppressed noise by low-ering its detection threshold (see the boxed insert oncoherent radar signal processing) to keep the false-alarm rate constant, while maintaining detection sen-sitivity. Once the radar is no longer pointing at thelarge clutter, the receiver noise may rise faster than thedetection threshold, resulting in a flood of false alarms.
If receiver gain is reduced to keep the system frombecoming saturated, a second problem can develop.The transmit pulse will, at some level, contain noise ofits own that appears on the echo signal from either thetarget or the clutter background. If the echo signal isfrom the target, this is not as serious a problem, becauseit does not affect target detectability. (It can cause otherlimitations, but these are beyond the scope of thisarticle.) However, the radar must cancel or reduce thevery large echoes returned from the environment inorder to see the small target return. For transmittednoise reflected off a large land mass or other object, thereflected noise will not cancel, resulting in what iscalled clutter breakthrough. This additional noise raisesthe overall system noise and can mask the returns fromsmall targets.
These two conflicting processes, noise suppressionby receiver saturation and noise enhancement via noiseon the transmitted pulse, must be balanced in a well-designed receiver. Radars are not the instruments tomeasure these effects. For Phalanx, designers wereaware of the noise characteristics of the radar but werehandicapped by a clutter model that greatly underes-timated the size of echoes from land clutter. Systemtests in the presence of large land masses provided thefirst indication of problems. However, the actual cause,as described earlier, was not found until the coherentdata were collected and analyzed.
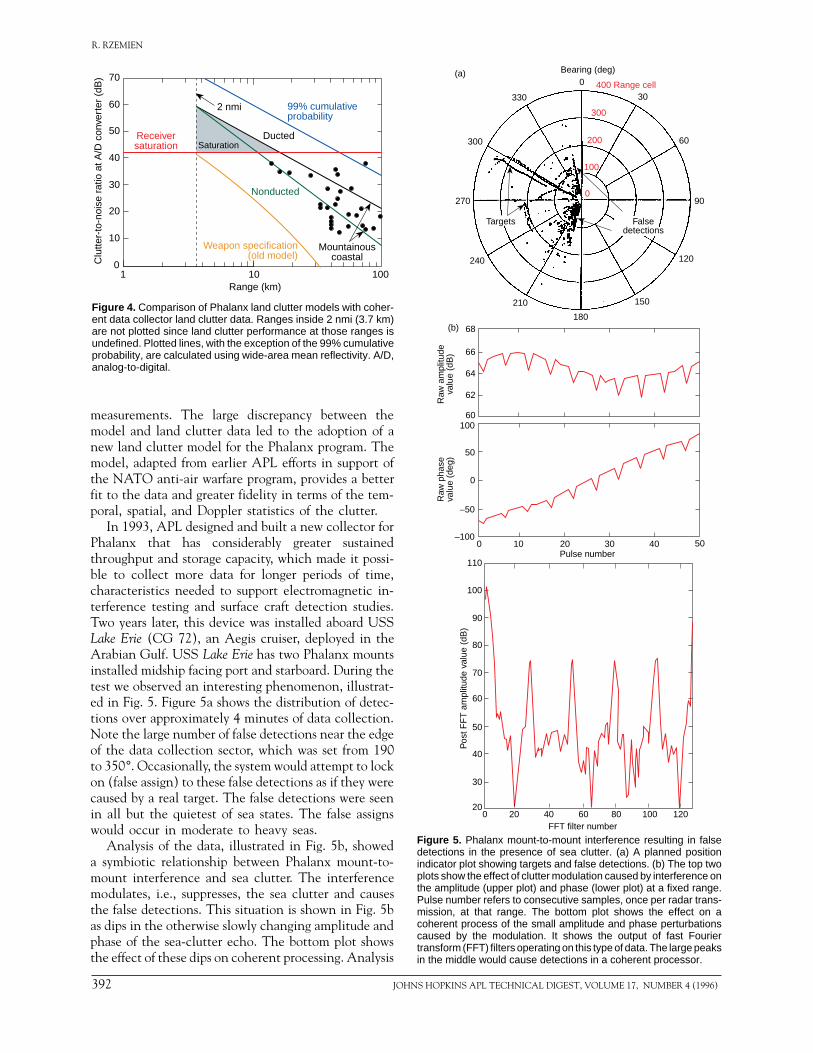
These efforts had two results. First, the gain chainof the radar was optimally adjusted to balance receivernoise suppression against clutter breakthrough. Theresult is a constant noise floor regardless of the level ofthe clutter. This condition, in turn, keeps the false-alarm rate under control. Second, a change was madein the land clutter model used in the Phalanx program.Figure 4 is a plot of predicted clutter-to-noise ratio atthe receiver analog-to-digital converter as a function ofrange from the radar. Predictions inside 2 nmi are notgiven, since system performance is not defined thatclose to land. The orange line indicates the level of landclutter returns based on the original Phalanx weaponspecification model. The points are from land clutter
96) 391
R. RZEMIEN
measurements. The large discrepancy between themodel and land clutter data led to the adoption of anew land clutter model for the Phalanx program. Themodel, adapted from earlier APL efforts in support ofthe NATO anti-air warfare program, provides a betterfit to the data and greater fidelity in terms of the tem-poral, spatial, and Doppler statistics of the clutter.
In 1993, APL designed and built a new collector forPhalanx that has considerably greater sustainedthroughput and storage capacity, which made it possi-ble to collect more data for longer periods of time,characteristics needed to support electromagnetic in-terference testing and surface craft detection studies.Two years later, this device was installed aboard USSLake Erie (CG 72), an Aegis cruiser, deployed in theArabian Gulf. USS Lake Erie has two Phalanx mountsinstalled midship facing port and starboard. During thetest we observed an interesting phenomenon, illustrat-ed in Fig. 5. Figure 5a shows the distribution of detec-tions over approximately 4 minutes of data collection.Note the large number of false detections near the edgeof the data collection sector, which was set from 190to 350°. Occasionally, the system would attempt to lockon (false assign) to these false detections as if they werecaused by a real target. The false detections were seenin all but the quietest of sea states. The false assignswould occur in moderate to heavy seas.
Analysis of the data, illustrated in Fig. 5b, showeda symbiotic relationship between Phalanx mount-to-mount interference and sea clutter. The interferencemodulates, i.e., suppresses, the sea clutter and causesthe false detections. This situation is shown in Fig. 5bas dips in the otherwise slowly changing amplitude andphase of the sea-clutter echo. The bottom plot showsthe effect of these dips on coherent processing. Analysis
Receiversaturation Saturation
2 nmi 99% cumulativeprobability
Ducted
Nonducted
Weapon specification(old model)
Mountainouscoastal
70
0
10
20
30
40
50
60
1 10 100Range (km)
Clu
tter-
to-n
oise
rat
io a
t A/D
con
vert
er (
dB)
Figure 4. Comparison of Phalanx land clutter models with coher-ent data collector land clutter data. Ranges inside 2 nmi (3.7 km)are not plotted since land clutter performance at those ranges isundefined. Plotted lines, with the exception of the 99% cumulativeprobability, are calculated using wide-area mean reflectivity. A/D,analog-to-digital.
392 JOH
Figure 5. Phalanx mount-to-mount interference resulting in falsedetections in the presence of sea clutter. (a) A planned positionindicator plot showing targets and false detections. (b) The top twoplots show the effect of clutter modulation caused by interference onthe amplitude (upper plot) and phase (lower plot) at a fixed range.Pulse number refers to consecutive samples, once per radar trans-mission, at that range. The bottom plot shows the effect on acoherent process of the small amplitude and phase perturbationscaused by the modulation. It shows the output of fast Fouriertransform (FFT) filters operating on this type of data. The large peaksin the middle would cause detections in a coherent processor.
30
60
90
120
150
180
210
240
270
300
330
0
0
100
200
300
400 Range cell
Bearing (deg)
Targets Falsedetections
(a)
110
100
90
80
70
60
50
40
30
200 20 40 60 80 100 120
FFT filter number
Pos
t FF
T a
mpl
itude
val
ue (
dB)
100
–100
50
0
–50
0 10 20 30 40 50Pulse number
(b)
60
62
64
66
68
Raw
am
plitu
deva
lue
(dB
)R
aw p
hase
valu
e (d
eg)
NS HOPKINS APL TECHNICAL DIGEST, VOLUME 17, NUMBER 4 (1996)
COHERENT RADAR—OPPORTUNITIES AND DEMANDS
COHERENT RADAR SIGNAL PROCESSINGThe Institute of Electrical and Electronics Engineers Stan-
dard Radar Definitions (Std 686-1990) defines coherent signalprocessing as echo integration, filtering, or detection using theamplitude of the received signal and its phase referred to thatof a reference oscillator or to the transmitted signal. The keypart of this definition is the use of phase information in thesignal processing. There are many ways for a processor to usethis information. In some cases, echo phase is compared to thephase of a reference oscillator in the receiver. Differences inphase are attributed to relative motion between the radar andthe reflector. If the phase is the same, the echo may be treatedas “clutter” in a moving target indicator filter and rejected orsuppressed from further processing. As is frequently the case indetection and estimation theory, signals may be corrupted bynoise, so even in the case of clutter some residue may remainafter cancellation.
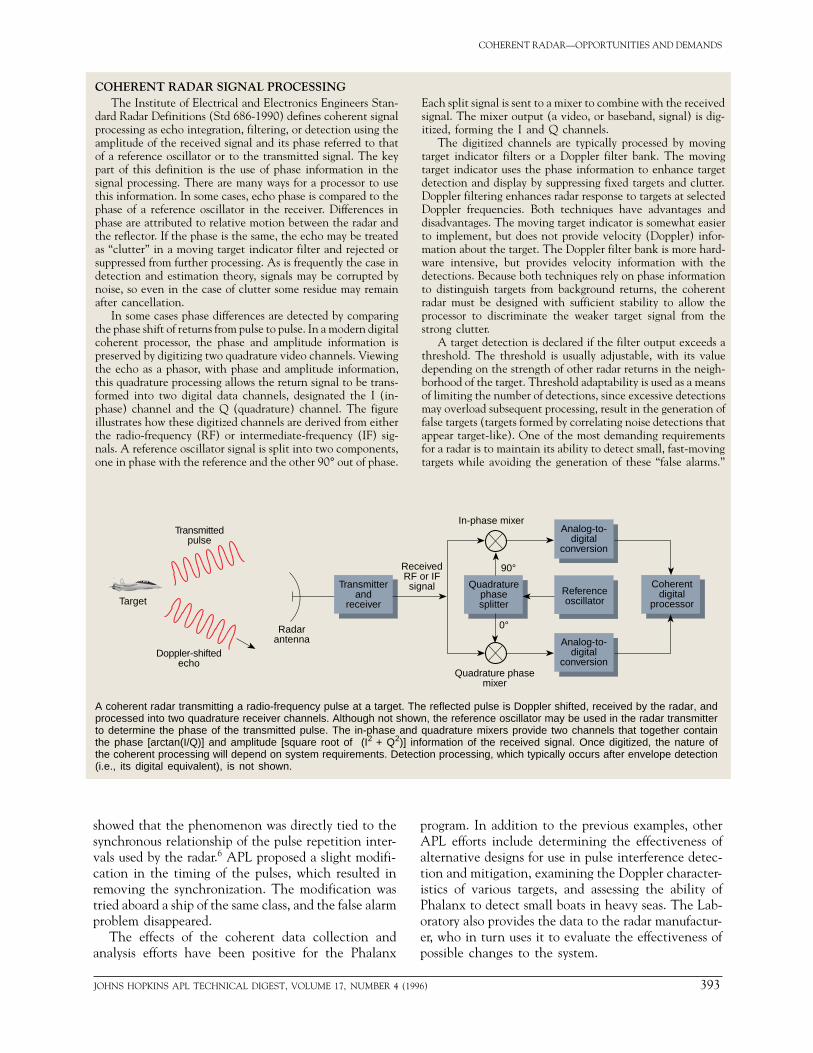
In some cases phase differences are detected by comparingthe phase shift of returns from pulse to pulse. In a modern digitalcoherent processor, the phase and amplitude information ispreserved by digitizing two quadrature video channels. Viewingthe echo as a phasor, with phase and amplitude information,this quadrature processing allows the return signal to be trans-formed into two digital data channels, designated the I (in-phase) channel and the Q (quadrature) channel. The figureillustrates how these digitized channels are derived from eitherthe radio-frequency (RF) or intermediate-frequency (IF) sig-nals. A reference oscillator signal is split into two components,one in phase with the reference and the other 90° out of phase.
Each split signal is sent to a mixer to combine with the receivedsignal. The mixer output (a video, or baseband, signal) is dig-itized, forming the I and Q channels.
The digitized channels are typically processed by movingtarget indicator filters or a Doppler filter bank. The movingtarget indicator uses the phase information to enhance targetdetection and display by suppressing fixed targets and clutter.Doppler filtering enhances radar response to targets at selectedDoppler frequencies. Both techniques have advantages anddisadvantages. The moving target indicator is somewhat easierto implement, but does not provide velocity (Doppler) infor-mation about the target. The Doppler filter bank is more hard-ware intensive, but provides velocity information with thedetections. Because both techniques rely on phase informationto distinguish targets from background returns, the coherentradar must be designed with sufficient stability to allow theprocessor to discriminate the weaker target signal from thestrong clutter.
A target detection is declared if the filter output exceeds athreshold. The threshold is usually adjustable, with its valuedepending on the strength of other radar returns in the neigh-borhood of the target. Threshold adaptability is used as a meansof limiting the number of detections, since excessive detectionsmay overload subsequent processing, result in the generation offalse targets (targets formed by correlating noise detections thatappear target-like). One of the most demanding requirementsfor a radar is to maintain its ability to detect small, fast-movingtargets while avoiding the generation of these “false alarms.”
ReceivedRF or IFsignal
Analog-to-digital
conversion
Analog-to-digital
conversion
Quadraturephasesplitter
Transmitterand
receiver
Coherentdigital
processor
Transmittedpulse
Doppler-shiftedecho
Target
In-phase mixer
Quadrature phasemixer
90°
0°Radarantenna
Referenceoscillator
A coherent radar transmitting a radio-frequency pulse at a target. The reflected pulse is Doppler shifted, received by the radar, andprocessed into two quadrature receiver channels. Although not shown, the reference oscillator may be used in the radar transmitterto determine the phase of the transmitted pulse. The in-phase and quadrature mixers provide two channels that together containthe phase [arctan(I/Q)] and amplitude [square root of (I2 + Q2)] information of the received signal. Once digitized, the nature ofthe coherent processing will depend on system requirements. Detection processing, which typically occurs after envelope detection(i.e., its digital equivalent), is not shown.
showed that the phenomenon was directly tied to thesynchronous relationship of the pulse repetition inter-vals used by the radar.6 APL proposed a slight modifi-cation in the timing of the pulses, which resulted inremoving the synchronization. The modification wastried aboard a ship of the same class, and the false alarmproblem disappeared.
The effects of the coherent data collection andanalysis efforts have been positive for the Phalanx
JOHNS HOPKINS APL TECHNICAL DIGEST, VOLUME 17, NUMBER 4 (19
program. In addition to the previous examples, otherAPL efforts include determining the effectiveness ofalternative designs for use in pulse interference detec-tion and mitigation, examining the Doppler character-istics of various targets, and assessing the ability ofPhalanx to detect small boats in heavy seas. The Lab-oratory also provides the data to the radar manufactur-er, who in turn uses it to evaluate the effectiveness ofpossible changes to the system.
96) 393
R. RZEMIEN
AN/SPS-48E AIR SURVEILLANCERADAR
The AN/SPS-48E radars provide long-range air sur-veillance capability for aircraft carriers, amphibiousassault ships, destroyers, and cruisers. Currently, morethan 40 of these radars are deployed. The need forimproved clutter performance, especially in view of theincreased importance of littoral warfighting capability,led the Naval Sea Systems Command SurveillanceRadar Office to fund development of a new DigitalMoving Target Indicator (DMTI) mode field changefor the AN/SPS-48E air surveillance radar. To supportthis effort, APL, in its role of providing technicalguidance and support, developed a coherent data col-lection and analysis capability to permit an in-depthperformance assessment of the radar system in an op-erating environment.
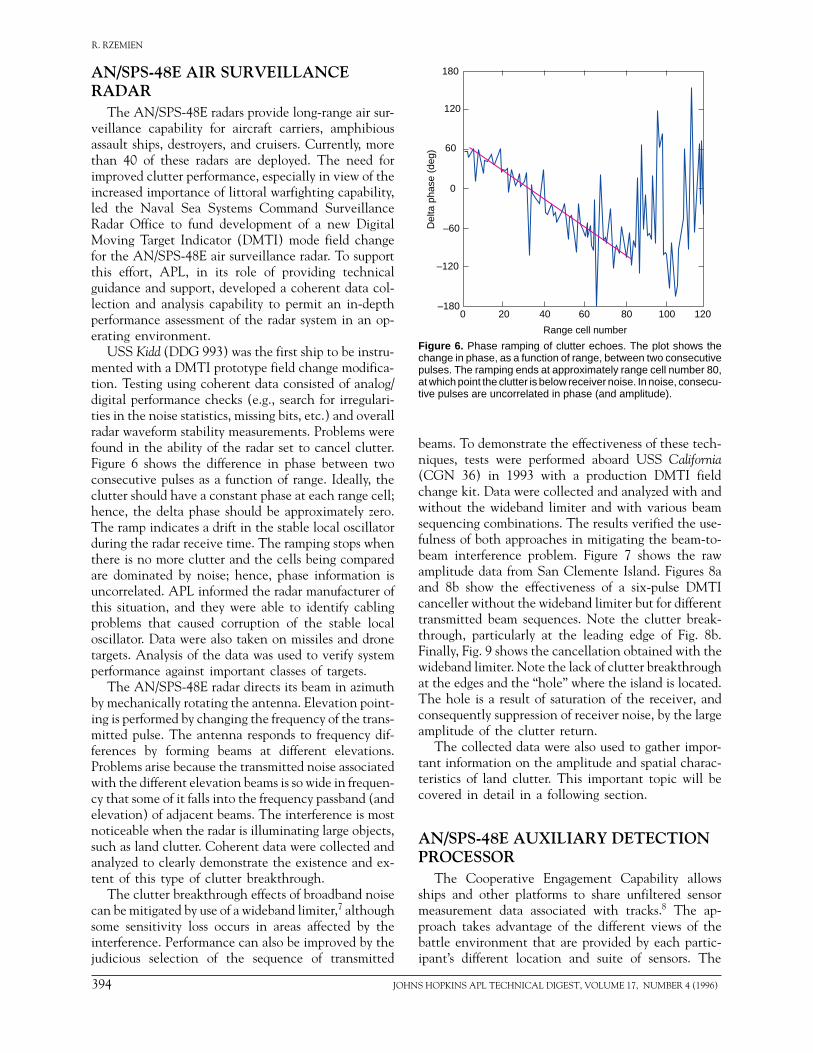
USS Kidd (DDG 993) was the first ship to be instru-mented with a DMTI prototype field change modifica-tion. Testing using coherent data consisted of analog/digital performance checks (e.g., search for irregulari-ties in the noise statistics, missing bits, etc.) and overallradar waveform stability measurements. Problems werefound in the ability of the radar set to cancel clutter.Figure 6 shows the difference in phase between twoconsecutive pulses as a function of range. Ideally, theclutter should have a constant phase at each range cell;hence, the delta phase should be approximately zero.The ramp indicates a drift in the stable local oscillatorduring the radar receive time. The ramping stops whenthere is no more clutter and the cells being comparedare dominated by noise; hence, phase information isuncorrelated. APL informed the radar manufacturer ofthis situation, and they were able to identify cablingproblems that caused corruption of the stable localoscillator. Data were also taken on missiles and dronetargets. Analysis of the data was used to verify systemperformance against important classes of targets.
The AN/SPS-48E radar directs its beam in azimuthby mechanically rotating the antenna. Elevation point-ing is performed by changing the frequency of the trans-mitted pulse. The antenna responds to frequency dif-ferences by forming beams at different elevations.Problems arise because the transmitted noise associatedwith the different elevation beams is so wide in frequen-cy that some of it falls into the frequency passband (andelevation) of adjacent beams. The interference is mostnoticeable when the radar is illuminating large objects,such as land clutter. Coherent data were collected andanalyzed to clearly demonstrate the existence and ex-tent of this type of clutter breakthrough.
The clutter breakthrough effects of broadband noisecan be mitigated by use of a wideband limiter,7 althoughsome sensitivity loss occurs in areas affected by theinterference. Performance can also be improved by thejudicious selection of the sequence of transmitted
394 JOH
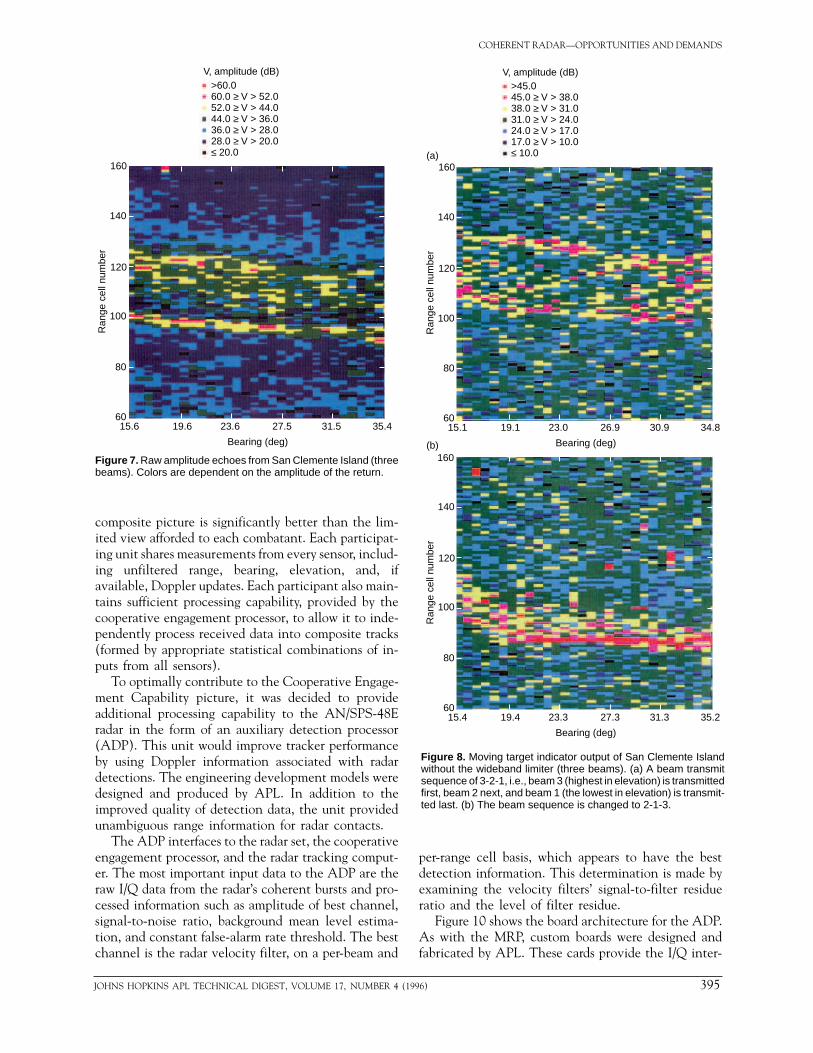
beams. To demonstrate the effectiveness of these tech-niques, tests were performed aboard USS California(CGN 36) in 1993 with a production DMTI fieldchange kit. Data were collected and analyzed with andwithout the wideband limiter and with various beamsequencing combinations. The results verified the use-fulness of both approaches in mitigating the beam-to-beam interference problem. Figure 7 shows the rawamplitude data from San Clemente Island. Figures 8aand 8b show the effectiveness of a six-pulse DMTIcanceller without the wideband limiter but for differenttransmitted beam sequences. Note the clutter break-through, particularly at the leading edge of Fig. 8b.Finally, Fig. 9 shows the cancellation obtained with thewideband limiter. Note the lack of clutter breakthroughat the edges and the “hole” where the island is located.The hole is a result of saturation of the receiver, andconsequently suppression of receiver noise, by the largeamplitude of the clutter return.
The collected data were also used to gather impor-tant information on the amplitude and spatial charac-teristics of land clutter. This important topic will becovered in detail in a following section.
AN/SPS-48E AUXILIARY DETECTIONPROCESSOR
The Cooperative Engagement Capability allowsships and other platforms to share unfiltered sensormeasurement data associated with tracks.8 The ap-proach takes advantage of the different views of thebattle environment that are provided by each partic-ipant’s different location and suite of sensors. The
180
60
120
0
–60
–120
–1800 20 40 60 80 100 120
Del
ta p
hase
(de
g)
Range cell number
Figure 6. Phase ramping of clutter echoes. The plot shows thechange in phase, as a function of range, between two consecutivepulses. The ramping ends at approximately range cell number 80,at which point the clutter is below receiver noise. In noise, consecu-tive pulses are uncorrelated in phase (and amplitude).
NS HOPKINS APL TECHNICAL DIGEST, VOLUME 17, NUMBER 4 (1996)
composite picture is significantly better than the lim-ited view afforded to each combatant. Each participat-ing unit shares measurements from every sensor, includ-ing unfiltered range, bearing, elevation, and, ifavailable, Doppler updates. Each participant also main-tains sufficient processing capability, provided by thecooperative engagement processor, to allow it to inde-pendently process received data into composite tracks(formed by appropriate statistical combinations of in-puts from all sensors).
To optimally contribute to the Cooperative Engage-ment Capability picture, it was decided to provideadditional processing capability to the AN/SPS-48Eradar in the form of an auxiliary detection processor(ADP). This unit would improve tracker performanceby using Doppler information associated with radardetections. The engineering development models weredesigned and produced by APL. In addition to theimproved quality of detection data, the unit providedunambiguous range information for radar contacts.
The ADP interfaces to the radar set, the cooperativeengagement processor, and the radar tracking comput-er. The most important input data to the ADP are theraw I/Q data from the radar’s coherent bursts and pro-cessed information such as amplitude of best channel,signal-to-noise ratio, background mean level estima-tion, and constant false-alarm rate threshold. The bestchannel is the radar velocity filter, on a per-beam and
160
140
120
100
80
60
Ran
ge c
ell n
umbe
r
15.6 19.6 23.6 27.5 31.5 35.4
Bearing (deg)
>60.060.0 ≥ V > 52.052.0 ≥ V > 44.044.0 ≥ V > 36.036.0 ≥ V > 28.028.0 ≥ V > 20.0≤ 20.0
V, amplitude (dB)
Figure 7. Raw amplitude echoes from San Clemente Island (threebeams). Colors are dependent on the amplitude of the return.
JOHNS HOPKINS APL TECHNICAL DIGEST, VOLUME 17, NUMBER 4 (19
COHERENT RADAR—OPPORTUNITIES AND DEMANDS
160
140
120
100
80
60R
ange
cel
l num
ber
15.1 19.1 23.0 26.9 30.9 34.8
Bearing (deg)
140
120
100
80
60
Ran
ge c
ell n
umbe
r
15.4 19.4 23.3 27.3 31.3 35.2
Bearing (deg)
160
(a)
(b)
>45.045.0 ≥ V > 38.038.0 ≥ V > 31.031.0 ≥ V > 24.024.0 ≥ V > 17.017.0 ≥ V > 10.0≤ 10.0
V, amplitude (dB)
Figure 8. Moving target indicator output of San Clemente Islandwithout the wideband limiter (three beams). (a) A beam transmitsequence of 3-2-1, i.e., beam 3 (highest in elevation) is transmittedfirst, beam 2 next, and beam 1 (the lowest in elevation) is transmit-ted last. (b) The beam sequence is changed to 2-1-3.
per-range cell basis, which appears to have the bestdetection information. This determination is made byexamining the velocity filters’ signal-to-filter residueratio and the level of filter residue.
Figure 10 shows the board architecture for the ADP.As with the MRP, custom boards were designed andfabricated by APL. These cards provide the I/Q inter-
96) 395

R. RZEMIEN
160
140
120
100
80
60
Ran
ge c
ell n
umbe
r
15.6 19.6 23.6 27.5 31.5 35.4
Bearing (deg)
V, amplitude (dB)>45.045.0 ≥ V > 38.038.0 ≥ V > 31.031.0 ≥ V > 24.024.0 ≥ V > 17.017.0 ≥ V > 10.0≤ 10.0
Figure 9. Moving target indicator output of San Clemente Islandwith the wideband limiter (three beams). Note the absence ofclutter breakthrough at the edges of the island. Note too the “hole”in the center of the island, which is an indication of clutter saturatingthe receiver and thereby suppressing system noise.
Signalmultiplexer
Datacontroller
BuffercontrollerDual ported
memoryDual ported
memory
Disk arraycontroller
Disk arrayHBA
MTIdetectionMTIdetectionMTIdetectionMTIdetectionMTIdetectionMTIdetectionMTIdetectionMTIdetection
EPROM
MTI buscontroller
Displayinterface
Dataextract
NTDS IONTDS IONTDS IONTDS I/O
Normal mode
processingMTI contactprocessing
Velocityunfold
Rangeunfold
EPROM
Main buscontroller
16-bit data
32-bit data
AN/SPS-48EI/Q data
ADP time
VSB bus
VSB bus
Disk array
AN/SPS-48EUYK-20
CEP
Ethernet
SCSI
Display
Exabyte
Figure 10. Architecture for the AN/SPS-48E auxiliary detection processor. ADP, auxiliary data processor; VSB, VME sub-bus; HBA, hostbus adaptor; MTI, moving target indicator; NTDS, Naval Tactical Data System; I/O, input/output; I/Q, in-phase channel/quadrature; SCSI,Small Computer System Interface; CEP, cooperative engagement processor; EPROM, erasable programmable read-only memory.
396 JO
face to the radar and perform the formatting and buff-ering needed to support processing of the data, coherentdata collection capability, and real-time playback.The primary function of the moving target indicatordetection cards is to provide ambiguous velocity esti-mates. Processing is limited to those range cells thatpass a number of detection and filtering criteria.For example, the threshold value is determined on thebasis of the value provided by the best channel and ismodified by an activity monitor (number of contacts)in the ADP.
If a detection is declared, or if a track gate (from theradar) is associated with a group of I/Q data, furtherprocessing is performed. The “coherency” of the datais checked across the pulses in the burst by comparingthe change in phase between two pulses. For validtargets, this change should be reasonably constant.Radio-frequency interference, or multiple-intervalclutter, would cause large discontinuities across theburst. Detections that pass these checks are range cen-troided, and the ambiguous range and velocity esti-mates are sent to the range unfold and velocity unfoldprocessors. Further processing is performed until thecontacts are sent to the tracker, along with the velocityestimation.
The difference between the AN/SPS-48E ADP andthe MK 92 MOD 2 MRP shows how rapidly technologydeveloped in the area of commercial off-the-shelf pro-cessors. The ADP was developed in 1991, 3 years before
HNS HOPKINS APL TECHNICAL DIGEST, VOLUME 17, NUMBER 4 (1996)
COHERENT RADAR—OPPORTUNITIES AND DEMANDS
the MRP. Moving target indicator processing in theADP had to be gated by an adjustable threshold, sincethe amount of processing needed to perform the meanlevel estimation, constant false-alarm rate, and velocityfilter functions could not be accomplished with theavailable commercial off-the-shelf processors. Threeyears later, the MRP was able to perform the neededprocessing.
Like the MRP, the ADP contains coherent datacollection and playback capability used during devel-opment. The collection capability provides the rawdata needed for off-line proof-of-concept work per-formed at APL. The playback capability has provedvaluable for testing electronic countermeasures im-provements that were later added to the system. It wasalso used in the development of the integration anddisplay processor.
The ADP was moved to production by the radar setmanufacturer. There are two basic configurations. Inthe multisensor integration and tracking system, theADP centroids are sent to the AN/SYS-2A(V)6 Inte-grated Automatic Detection and Track System. Inanother version, the tracking function is performedinternally. Currently, four production units are de-ployed, with additional units to be built.
RADAR LAND CLUTTER MODELINGAND VERIFICATION USINGCOHERENT DATA COLLECTORDATA
Land provides the most challenging natural clutterenvironment. Land echoes have, for a single scan, avery broad dynamic range, a potential wide-area cov-erage, and a highly nonhomogeneous spatial character-istic. Existing theoretical models are approximations atbest. They provide important dynamic range informa-tion but are of little aid to the radar system designertrying to balance detection sensitivity with subcluttervisibility while simultaneously maintaining a constantand well-behaved false-alarm rate. This section de-scribes an ongoing effort at APL that uses the large landclutter database accumulated by the various programsdescribed here. The high quality of the data in termsof range resolution and amplitude dynamic range allowsit to be especially useful in developing improved cluttermodels.
In the last decade, testing radar performance incoastal environments has become increasingly impor-tant, largely because of the Navy’s shift in emphasisfrom a “blue water” warfare scenario to fighting inlittoral waters. Much effort is now going into evaluatingthe performance of systems near land. Such testing isexpensive and, of course, not possible with new radarsystems until they are at an advanced stage in the designeffort. In this environment, it has become even more
JOHNS HOPKINS APL TECHNICAL DIGEST, VOLUME 17, NUMBER 4 (1
important to have appropriate modeling of land clutterto meet the needs of the system designer.
One approach is to provide accurate modeling ofspecific areas, as opposed to more generic models. Forexample, instead of having a model for a “mountainouscoastal environment,” one would have a high-fidelitymodel of, say, the Island of Hawaii as seen by a shiplocated 30 mi offshore. Such a model would provideradar cross-sectional estimates, furnishing the details ofthe land down to at least the resolution of the radar,i.e., range cell length by azimuth beam width. Themodel would include relevant radar parameters (pulsewidth, beamwidth, transmitted power, antenna gain,etc.) and account for propagation conditions and ter-rain characteristics. In Ref. 9, a model developed atAPL is described that provides this capability. Themodel uses Defense Mapping Agency digital terrainelevation data to determine terrain contours. An op-tical ray method is used to determine incidence angle.Propagation factors are estimated using the tropospher-ic electromagnetic parabolic equation routine (TEM-PER), developed at APL.10,11
As with any such effort, verification is an importantelement in gaining acceptance of the model. One earlyattempt at verification occurred in 1993, using cluttermeasurements collected aboard USS California. Theship was in transit from Washington State to SouthernCalifornia. The AN/SPS-48E coherent data collectorprovided the collection capability. In this case, thekey feature of the collector was not the coherency ofthe data (phase information does not play a role indetermining land backscatter cross section) but thelarge area coverage of the collected data coupled withthe high dynamic range of the amplitude data. Theradar itself limited instantaneous dynamic range toapproximately 40 dB. However, measurements usingvarious levels of attenuation in the receiver allowed thetotal range to be extended to 120 dB. Propagationconditions were estimated from data collected by aninstrumented helicopter.
Figures 11a and 11b compare the terrain visibilitymap calculated from the model with a similar map usingthe collected data.12 As can be seen, correspondence isquite good for illuminated and shadowed areas. A moredetailed comparison is obtained by observing the cumu-lative distributions of the clutter reflectivity (adjustedfor two-way propagation factor) for both model andmeasured data (Fig. 11c). Figure 11c also shows that thecorrespondence is relatively good for strong clutter. Asthe strength of the clutter falls off, however, the modelpredictions deviate on the low side, reaching up to 35dB for the smallest clutter. Several possible sources forthis discrepancy are being investigated, such as antennasidelobe contributions, positional smearing as a resultof ship movement during the data collection, multiplescattering, two- and three-dimensional diffraction, and
996) 397

R. RZEMIEN
33.8
33.1
32.333.8
33.1
32.3119.0 117.5 116.0
Longitude (deg)
Latit
ude
(deg
)La
titud
e (d
eg)
–20 dB <–50 dB <
–108 dB <
0 20
Scale (nmi)
Radar
Radar
≤ –20 dB≤ –50 dB
(a)
(b)
12,000
10,000
8000
6000
4000
2000
0
Num
ber
of c
ount
s
–80 200–20–40–60Modeled reflectivity (dB)
Measured data
Model, no sidelobe
With –80-dB sidelobeWith –70-dB sidelobe
With –60-dB sidelobe
(c)
Figure 11. Comparison of coherent data collector land clutter datawith theoretical cross-sectional estimates. (a) Predicted clutterreturn. (b) Actual return using coherent data collector data. (c)Comparison of the cumulative distribution of the radar data with thetheoretical prediction. The effects of different levels of antennasidelobes are shown.
even nonlinearities in the radar receiver/measuringdynamics. Methods for resolving the discrepancies arebeing studied but will require appropriate measure-ments for verification.
OTHER EFFORTSThe preceding examples by no means describe all
the systems affected by coherent data collection andanalysis. Following the success of the AN/SPS-48Ework, the target acquisition system (TAS) Mark 23radar was similarly instrumented using a special inter-face adapter. TAS is an automatic two-dimensionalradar with an associated self-defense command-controlsystem for countering antiship missiles and aircraftthreats. Performance in clutter environments againstsmall radar cross-sectional threats is of great impor-
398 JOHN
tance. TAS rejects the clutter while retaining movingtarget data by performing moving target indicator andDoppler processing on the digitized radar video.
APL provided a coherent data collection capabilityto aid in evaluating system performance and capability.In 1991, data were collected from the TAS radar on-board USS Kitty Hawk (CV 63) during its transit fromNorfolk, Virginia, to Puerto Rico. Analysis of thesedata demonstrated that the radar estimation of velocityby calculation of phase progression was highly accurate,as validated using low-altitude drone data collected atsea. The data also verified the strong performance ofTAS in difficult clutter environments. The effort pro-vided an excellent basis for future performance exten-sions.
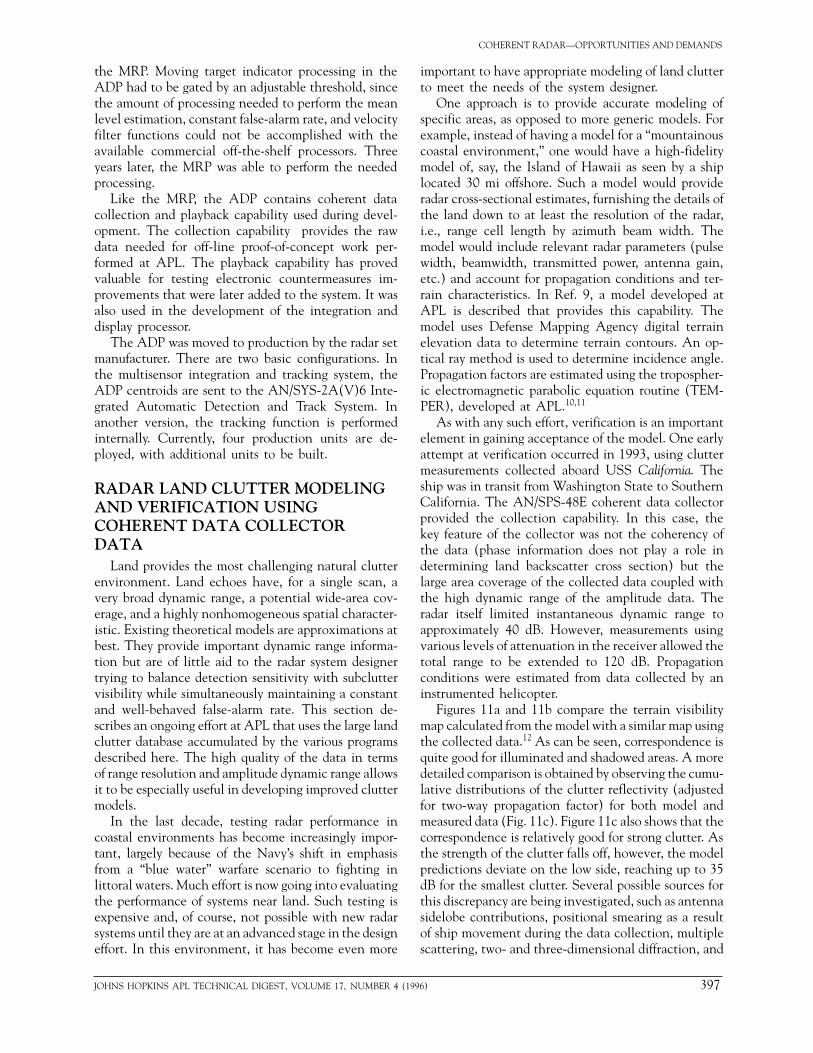
Another highly successful effort involved the TartarMK 74 MOD 15 radar set.13 The Naval Sea SystemsCommand asked APL to design, fabricate, and test acoherent data collector for this radar set. Possible de-sensitization of the radar in the presence of a missilewarhead blast was a concern. At the time, the effectwas not accounted for in the radar system analysisbecause of lack of an appropriate model. Parametricanalysis of coherent radar data collected during missiletests would result in the needed model. The device,pictured in Fig. 12, interfaces with the continuous waveilluminator and the pulse radars of the MK 74. It wastested by APL aboard USS California and then deliv-ered to the sponsor.
For all these examples building the hardware is onlythe first step. The collected data must be properlyanalyzed, keeping in mind the needs of the program andthe peculiarities of the radar systems from which thedata are collected. A window to the environment asseen by the radar itself is a tremendous asset in eval-uating performance. Models and approximations areessential for much of the work, but in the end thesystem must be tested. With the rising cost of testingand the limited availability of assets, a way must befound that allows system testing, and especially devel-opment, to be performed somewhere else than aboardship. As seen in the MK 92 CANDO and the AN/SPS-48E ADP, a coherent collection and playback capabil-ity can provide the needed environment.
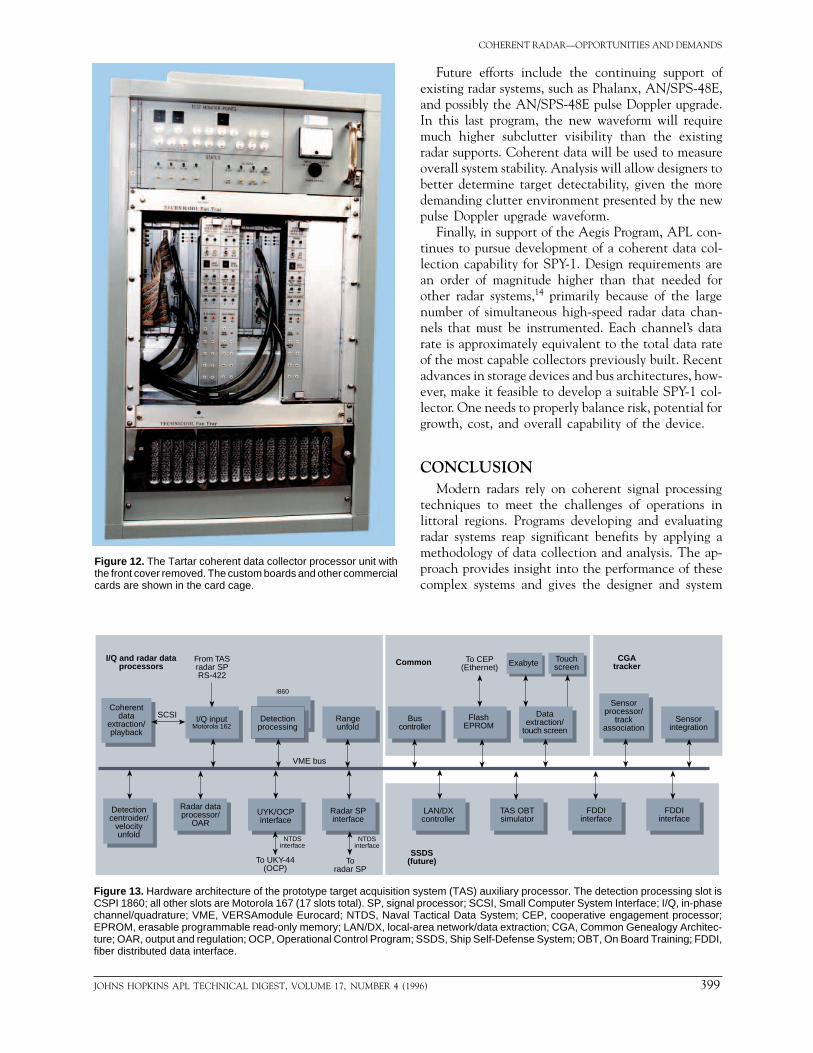
Current efforts include the design, fabrication, andtest of a prototype TAS auxiliary processor by APL.Three units are planned, each with a range of capabil-ities similar to those of the MRP and the ADP. Oneunit will support land-based testing in the summer of1996. The other two units will be installed aboard shipsand participate in the Cooperative Engagement Capa-bility/Initial Operational Capability testing in the fallof 1996. Figure 13 is a block diagram of the hardwarearchitecture of the prototype TAS auxiliary processor.The coherent data extraction capability will providethe important real-time playback capability.
S HOPKINS APL TECHNICAL DIGEST, VOLUME 17, NUMBER 4 (1996)
COHERENT RADAR—OPPORTUNITIES AND DEMANDS
Figure 12. The Tartar coherent data collector processor unit withthe front cover removed. The custom boards and other commercialcards are shown in the card cage.
JOHNS HOPKINS APL TECHNICAL DIGEST, VOLUME 17, NUMBER 4 (19
Future efforts include the continuing support ofexisting radar systems, such as Phalanx, AN/SPS-48E,and possibly the AN/SPS-48E pulse Doppler upgrade.In this last program, the new waveform will requiremuch higher subclutter visibility than the existingradar supports. Coherent data will be used to measureoverall system stability. Analysis will allow designers tobetter determine target detectability, given the moredemanding clutter environment presented by the newpulse Doppler upgrade waveform.
Finally, in support of the Aegis Program, APL con-tinues to pursue development of a coherent data col-lection capability for SPY-1. Design requirements arean order of magnitude higher than that needed forother radar systems,14 primarily because of the largenumber of simultaneous high-speed radar data chan-nels that must be instrumented. Each channel’s datarate is approximately equivalent to the total data rateof the most capable collectors previously built. Recentadvances in storage devices and bus architectures, how-ever, make it feasible to develop a suitable SPY-1 col-lector. One needs to properly balance risk, potential forgrowth, cost, and overall capability of the device.
CONCLUSIONModern radars rely on coherent signal processing
techniques to meet the challenges of operations inlittoral regions. Programs developing and evaluatingradar systems reap significant benefits by applying amethodology of data collection and analysis. The ap-proach provides insight into the performance of thesecomplex systems and gives the designer and system
Coherentdata
extraction/playback
I/Q inputMotorola 162
Rangeunfold
Buscontroller
FlashEPROM
Dataextraction/
touch screen
Sensorprocessor/
trackassociation
Sensorintegration
FDDIinterface
FDDIinterface
TAS OBTsimulator
LAN/DXcontroller
Radar SPinterface
UYK/OCPinterface
Radar dataprocessor/
OAR
Detectioncentroider/
velocityunfold
SCSI Detectionprocessing
VME bus
Exabyte Touchscreen
To CEP(Ethernet)
From TASradar SPRS-422
Toradar SP
To UKY-44(OCP)
I/Q and radar dataprocessors Common CGA
tracker
i860
SSDS(future)
NTDSinterface
NTDSinterface
Figure 13. Hardware architecture of the prototype target acquisition system (TAS) auxiliary processor. The detection processing slot isCSPI 1860; all other slots are Motorola 167 (17 slots total). SP, signal processor; SCSI, Small Computer System Interface; I/Q, in-phasechannel/quadrature; VME, VERSAmodule Eurocard; NTDS, Naval Tactical Data System; CEP, cooperative engagement processor;EPROM, erasable programmable read-only memory; LAN/DX, local-area network/data extraction; CGA, Common Genealogy Architec-ture; OAR, output and regulation; OCP, Operational Control Program; SSDS, Ship Self-Defense System; OBT, On Board Training; FDDI,fiber distributed data interface.
96) 399

R. RZEMIEN
analyst a much-needed radar perspective of the envi-ronment. Signal processor testing can be done usingrealistic data at real-time data rates. Design evaluationand system development benefit from realistically com-plex tests performed in the laboratory prior to the startof expensive at-sea testing. Future developmental ef-forts likewise benefit from both the technical expertisegained by applying these techniques and the availabil-ity of the database accrued during system development.
REFERENCES1Barton, D. K., Modern Radar Systems Analysis, Artech House, Norwood, MA,pp. 1–8 (1988).
2Nathanson, F. E., Reilly, J. P., and Cohen, M. N., Radar Design Principles, 2ndEd., McGraw-Hill, New York, pp. 1–41 (1990).
3Schleher, D. C., MTI and Pulsed Doppler Radar, Artech House, Norwood,MA, pp. 1–15 (1991).
4Rzemien, R., Bade, P. R., and Roulette, J. F., Functional Description—MK 92Coherent Data Collector, JHU/APL FS-85-261, Laurel, MD (1985).
400 JOHN
5Rzemien, R., Bade, P. R., Roulette, J. F., and Thomson, B. A., FunctionalDescription of Phalanx Coherent Data Collector, JHU/APL FS-86-146, Laurel,MD (1986).
6Taylor, S. A., Presentation of CIWS Intraship EMI Data from USS Lake Erie,JHU/APL F20-95U-099, Laurel, MD (1995).
7Roulette, J. F., Beam Sequence Tests for Mitigation of Beam to Beam Interferencein AN/SPS-48E MTI Radar, JHU/APL F2E-93-6-673, Laurel, MD (1993).
8“The Cooperative Engagement Capability,” Johns Hopkins APL Tech. Dig.16(4), 377–396 (1995).
9Lin, C. C., Development of Land Clutter Model with Digital Terrain ElevationData, JHU/APL F2A-92-1-022, Laurel, MD (1992).
10Dockery, G. D., “Modeling Electromagnetic Wave Propagation in Tropo-sphere Using the Parabolic Equation,” IEEE Trans. Ant. Prop., 36, 1464–1470 (Oct 1988).
11Dockery, G. D., Status of Tropospheric Electromagnetic Parabolic EquationRoutine (TEMPER) Development, JHU/APL F2B-89-U-8-012, Laurel, MD(1989).
12Reilly, J. P., and Lin, C. C., Radar Terrain Effects Modeling for Shipboard RadarApplications, JHU/APL FS-95-060, Laurel, MD (1995).
13Rzemien, R., Proposed Coherent Data Collector for the TARTAR MK 74 MOD15 Radar Set, JHU/APL F2E-92-3-417, Laurel, MD (1992).
14Rzemien, R., Design Alternatives for a SPY-1 Coherent Data Collector, JHU/APL F2E-94-3-443, Laurel, MD (1994).
THE AUTHOR
RUSSELL RZEMIEN is a Senior Professional Staff physicist in the APL FleetSystems Department’s Digital Systems Development Group. He earned an M.S.degree in physics from the University of Colorado (1979) and a B.S. degree inphysics from the University of Rhode Island (1975). Since joining APL in 1979,he has specialized in digital signal processing and instrumentation of radarsystems and is co-holder of a patent for a Coherent Radar Digital Data Collectorand Sampling Technique for Noncoherent Transmitter Radars. He served as leadhardware design engineer for the Laser Radar, the MK 92, Phalanx, and TartarCoherent Data Collectors. Mr. Rzemien was also lead engineer for the Radar IFExperimentation Facility. Other projects include Pacific Missile Test CenterDigital Data Collector, AN/SPS-48C Detection Data Converter, and MK 92Radar Processor. His e-mail address is [email protected].
S HOPKINS APL TECHNICAL DIGEST, VOLUME 17, NUMBER 4 (1996)