coherent preferences and asset prices in stock market
TRANSCRIPT
1 1
Coherent Preferences and Asset Prices in Stock Market
Leilei Shi (1,2), Andrea Fenu (3, 6), Xinshuai Guo (1), and Binghong Wang (1)
(1) University of Science and Technology of China (USTC), Hefei, P.R. China
(2) Haitong Securities Co., Ltd—Beijing Fuwaidajie, P.R. China
(3) Boston University, USA
(4) University of Cagliari, Italy
Session: AEA Poster Session (JEL C)
Time: January 3~5, 2021, 7:00 AM~6:00 PM (EST)
Venue: Virtual Conference
American Economic Association/ASSA 2021 Annual Meeting
January 3~5, 2021
Chicago · USA

Highlights
We study intraday individual coherent preferences underlying asset prices in stock market where there is price momentum and reversal in interaction;
We propose a set of explicit models for nonlinear V-shaped price pressure utility while market dynamics equilibrium exists;
Using a new mathematical method from a price-volume probability wave differential equation.
2

Asset prices include two parts:
The market equilibrium price formulated by price pressure from supply-
demand quantity complex and hard to predict The fundamental value price or rational asset
price determined with reference to macroeconomic
variables pertaining to the trading asset may be figured out in terms of its future
dividends in accounting (Shiller 1981)
3
Introduction (1)

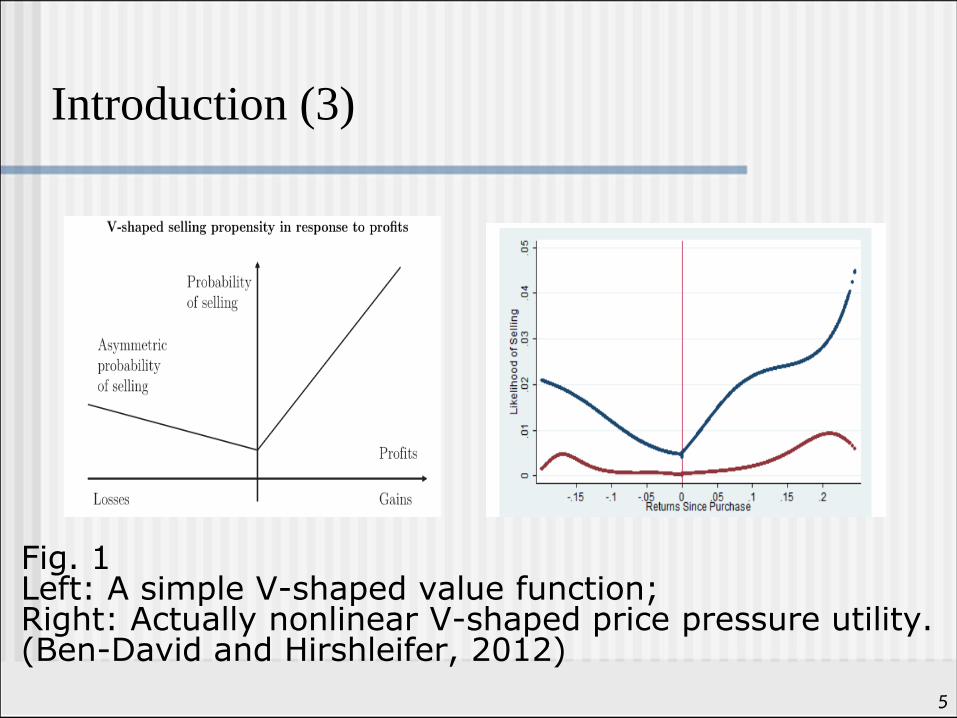
Previously, Ben-David and Hirshleifer (2012) propose a simple V-shaped value function in stock market, based on the actually nonlinear utility in empirical results (see Figure 1);
We assume that individual coherent preferences generate nonlinear price pressure utility and market dynamic equilibrium in stock market;
Coherent preferences specify individual consistent choices by those traders who adapt themselves to buy and sell, keep constant interactive trading between momentum trading and reversal trading across all prices, and generate market dynamic equilibrium (Shi et al., 2020).
4
Introduction (2)
5
Introduction (3)
Fig. 1 Left: A simple V-shaped value function; Right: Actually nonlinear V-shaped price pressure utility. (Ben-David and Hirshleifer, 2012)

A Coherent Preferences Hypothesis
Subject individuals behave coherent preferences and generate a nonlinear market dynamic equilibrium as long as intraday cumulative trading volume distribution exhibits a significant degree of coherence in the framework of a price-volume probability wave differential equation.
It follows a set of the absolute of zero-order Bessel eigenfunctions (see Figure 2).
6
Problem Solving (1)

Fig. 2. Left: Intraday cumulative trading volume distribution over a price range; Right: A set of explicit models (Bessel family models)
7
Problem Solving (2)
2.410 2.415 2.420 2.425 2.430 2.435 2.440 2.445
0.00
0.02
0.04
0.06
0.08
0.10
Data: Data1_B
Model: Probwave3
Chi^2/DoF = 0.00026
R^2 = 0.65758
P1 0.07537 ±0.00718
P2 377.49271 ±12.22346
P3 2.43186 ±0.00135
tra
din
g v
olu
me
we
igh
t
price (yuan)
20190125
-20 -10 10 20
0.2
0.4
0.6
0.8
1

8
Problem Solving (3)
Table 1: Empirical test for coherent preferences
No. of Distributions Percentage (%)
Total Number of Distributions 34 100
One Price Reference Point in
Trading 32 94.12
A Price Reference Point Jump
(Two Price Reference Points) 1 2.94
No Maximum Volume Prices
in Independent Trading
1 2.94
Data sources: Tick by tick high frequency trading data in Huaxia SSE 50ETF (510050) in Chinese stock market from January 3 to February 28, 2019

The explicit models in Fig. 2 come from the equation (1)
, (1)
which satisfies individual trading utility function as
(2)
and
(3)
where W(p) is a price pressure utility.
9
Problem Solving (4)
om ppApW
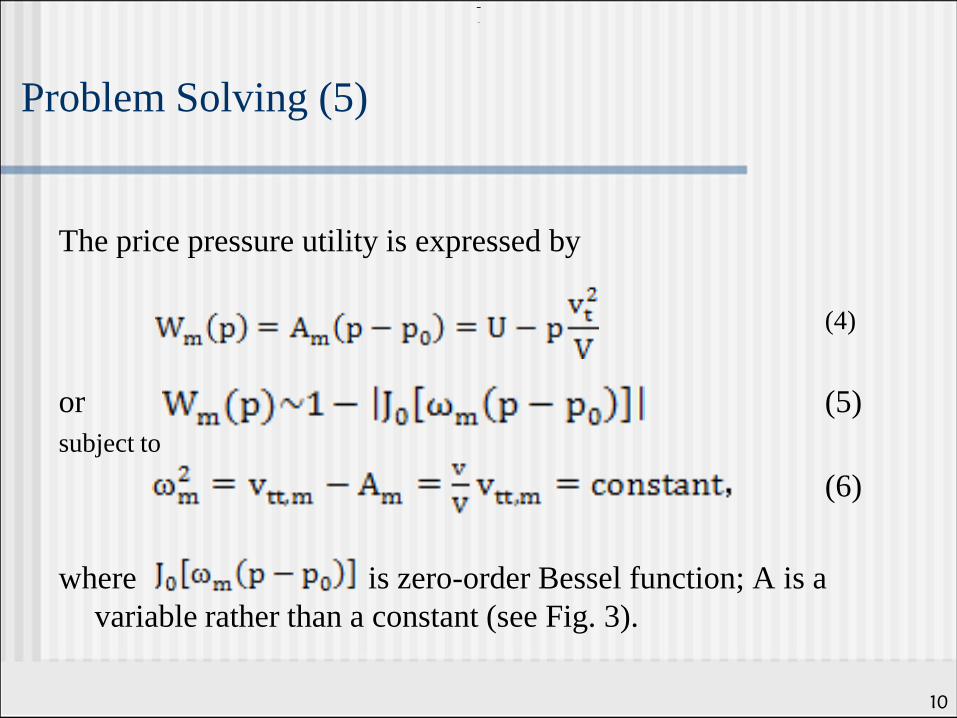
The price pressure utility is expressed by
(4)
or (5)
subject to
(6)
where is zero-order Bessel function; A is a
variable rather than a constant (see Fig. 3).
10
Problem Solving (5)

11
Problem Solving (6)
Fig. 3. Left: An asymmetrical nonlinear V-shaped price pressure utility function; Right: Empirical test results (Ben-David and Hirshleifer, 2012)

Conclusions
Coherent preferences exist widely, and generate nonlinear V-shaped price pressure utility and market dynamic equilibrium in stock market, whereas beliefs contribute to discrepancy between market equilibrium price and fundamental price;
Individual traders would be independent and homogeneous if there were a V-shaped value function. It is not true in the real world!
Our explicit models predict the nonlinear V-shaped price pressure utility detected in prior empiric tests (Ben-David and Hirshleifer, 2012; An, 2016)
They demonstrate Shi’s price-volume probability wave differential equation validity to a certain extent (Shi, 2006).
12

Comments are welcome Email
Mobile Phones: (0086)18611270598, (0086)13671328061
Full paper and references available at SSRN:
https://ssrn.com/abstract=2955504
http://ssrn.com/abstract=3496068
http://ssrn.com/abstract=1530226
13
Thank You!