coh cafr uvseal (page 1) · unions and numerous community non-profit organizations are...
TRANSCRIPT

2009
City of Houston, TexasComprehensive Annual Financial Reportfor the Fiscal Year Ended June 30, 2009
Annise D. Parker, City Controller
HOUSTON

OFFICE OF THE CITY CONTROLLER 106 YEARS OF HOUSTON HISTORY
Prepared by:Annise D. Parker, City Controller
Rudy Garcia, Deputy City Controller, Financial Reporting
CITY OF HOUSTON, TEXASComprehensive Annual Financial Report for the fiscal year ended June 30, 2009

PagePart I - Introductory Section
Office of the City Controller i City Controller ii Organization Chart for the Office of the Controller iiiElected Officials ivOrganization Chart for City Government vTransmittal Letter viiCertificate of Achievement for Excellence in Financial Reporting xiv
Part II - Financial Section
Independent Auditors' Report 1Management's Discussion and Analysis - (unaudited) 3Basic Financial Statements: Government-wide Financial Statements:
Statement of Net Assets 14 Statement of Activities 16
Fund Financial Statements: Balance Sheet - Governmental Funds 18 Statement of Revenues, Expenditures and Changes in Fund Balances - Governmental Funds 20 Reconciliation of the Statement of Revenues, Expenditures, and Change in Fund Balance of
Governmental Funds to the Statement of Activities 22 Statement of Net Assets - Proprietary Funds 24 Statement of Revenues, Expenses and Changes in Fund Net Assets - Proprietary Funds 28 Statement of Cash Flows - Proprietary Funds 30 Statement of Fiduciary Net Assets 34 Statement of Changes in Fiduciary Net Assets 35
Notes to the Basic Financial Statements 37 (See this section for Table of Content of the Notes)Required Supplementary Information (unaudited): Required Supplementary Information - General Operating Fund - Budgeted & Actual (unaudited) 115 Required Supplementary Information (Reconciliation) - General Fund Budget vs. GAAP (unaudited) 119 Required Notes to the Supplementary Information (unaudited) 120 Required Pension System Supplementary Information (unaudited) 121 Required Other Post Employment Benefits Supplementary Information (unaudited) 122
Individual Fund Statements and Schedules
Governmental Funds 123
General FundBalance Sheet 124Statement of Revenues, Expenditures and Changes in Fund Balance 125Debt Service FundBalance Sheet 126Schedule of Revenues, Expenditures and Changes in Fund Balance: Budget vs. Actual 127Capital Projects FundBalance Sheet 128Statement of Revenues, Expenditures and Changes in Fund Balance 129Grants FundBalance Sheet 130Statement of Revenues, Expenditures and Changes in Fund Balance 131
CITY OF HOUSTON, TEXASCOMPREHENSIVE ANNUAL FINANCIAL REPORT
For the Year Ended June 30, 2009

Page
CITY OF HOUSTON, TEXASCOMPREHENSIVE ANNUAL FINANCIAL REPORT
For the Year Ended June 30, 2009
Nonmajor Governmental FundsCombining Balance Sheet 132Combining Statement of Revenues, Expenditures and Changes in Fund Balances 134Schedule of Budgeted and Actual Revenues and Expenditures:
Asset Forfeiture Fund 136Auto Dealers Fund 137Building Inspection Fund 138Cable Television Fund 139Child Safety Fund 140Houston Transtar Fund 141Municipal Courts Technology Fee 142Parks Special Fund 143Police Special Services Fund 144Sign Administration Fund 145Stormwater Fund 146Houston Emergency Center Fund 147Supplemental Environmental Project Fund 148
Enterprise Funds 149
Airport SystemStatement of Net Assets 150Statement of Revenues, Expenses and Changes in Net Assets 152Statement of Cash Flows 153Convention & Entertainment Statement of Net Assets 154Statement of Revenues, Expenses and Changes in Net Assets 156Statement of Cash Flows 157Combined Utility SystemStatement of Net Assets 160Statement of Revenues, Expenses and Changes in Net Assets 162Statement of Cash Flows 163Nonmajor Enterprise FundsCombining Statement of Net Assets 164Combining Statement of Revenues, Expenses and Changes in Net Assets 165Combining Statement of Cash Flows 166
Internal Service Funds 167
Combining Statement of Net Assets 168Combining Statement of Revenues, Expenses and Changes in Net Assets 169Combining Statement of Cash Flows 170
Fiduciary Funds 171
Pension Trust FundsCombining Statement of Plan Net Assets 172Combining Statement of Changes in Plan Net Assets 174Agency FundsCombining Statement of Changes in Assets and Liabilities 176
Page
CITY OF HOUSTON, TEXASCOMPREHENSIVE ANNUAL FINANCIAL REPORT
For the Year Ended June 30, 2009
Discretely Presented Component Units 177
GovernmentalCombining Statement of Net Assets 178Combining Statement of Activities 184Business TypeCombining Statement of Net Assets 189Combining Statement of Activities 190Combining Statement of Cash flows 192
Part III - Statistical Section (unaudited)
Net Assets By Component 194Changes in Net Assets 196Fund Balances - Governmental Funds 198General Fund Budget 200Continuing Debt Disclosure Information 201Changes in Fund Balances of Governmental Funds 204Tax Revenue by Source - Governmental Funds 206Assessed Value and Estimated Value of Taxable Property 207Direct and Overlapping Property Tax Rates 208Principal Property Taxpayers 210Property Tax Levies and Collections 211Tax Supported Debt Service Funds 212Ratios of Outstanding Debt by Type 213Ratios of General Bonded Debt Outstanding 214Computation of Direct and Overlapping Debt 215Ad Valorem Tax Levies and Collections 216Computation of Legal Debt Margin 218Pledged-Revenue Coverage 220Demographic and Economic Statistics 221Principal Employers 222Employment Statistics 224City of Houston Employment Information 226Operating Indicators by Function 228Capital Asset Statistics by Function 229Increases/Decreases to Net Assets of Pension Plans 230Principal and Interest Payable from Ad Valorem Taxes 231Voter-Authorized Obligations 232Sales and Use Tax and Franchise Charges and Fees 233Convention and Entertainment Facilities Fund Revenues and Expenses 234Convention and Entertainment Facilities Statistics 236Combined Utility System Fund Revenues and Expenses 242Combined Utility System Revenue Bond Coverage 244Combined Utility System Statistics 245Revenues and Expenses of the Water and Sewer System 257Airport System Fund Revenues and Expenses 258Airport System Statistics 260Surety Bond and Insurance Coverage 270Salaries of Elected Officials 272Schedule of Credits 273

INTR
ODUC
TORY
SEC
TION
Office of the City Controller Houston City Controller Annise D. Parker is the second highest elected official in Houston City Government and its Chief Financial Officer. The Office of the Houston City Controller superintends the fiscal affairs of the City. This includes conducting audits, managing investments and debt, preparing financial statements and providing leadership on policy issues pertaining to the City’s financial health. The Controller is asked to balance the City’s fiscal needs with the politics of popular elections and acts as a check-and-balance to the Mayor and City Council, the executive and legislative branches of City government. She serves as an independently elected “financial watchdog” over City government’s fiscal affairs. The Treasury Division of the Controller’s Office manages a total investment portfolio of approximately $2.4 billion. The City’s General Investment Pool consistently receives the highest rating available from Standard and Poor’s. The character of this pool is that of a short-term bond fund that holds investments of very high credit quality. The Treasury Division is also responsible for overseeing a debt program of approximately $12.8 billion. The City has ten commercial paper programs totaling $2.6 billion, seven auction-rate security issues, ten series of variable rate demand obligation bonds, two interest rate swaps with a total notional amount of $902 million and credit agreements totaling $3.8 billion. The Standard and Poor’s rating agency recently affirmed the City’s AA credit rating on its general obligation bonds secured by the City’s property taxes. Standard and Poor’s based its rating on the City’s “sizable and diverse economic base, which has shown marked resiliency over the past year; positive financial operations with a strong general fund reserve balance, although the balance is anticipated to decline; and management's continued commitment to control expenditure growth and address the City's contingent liabilities.” Likewise, Moody’s Investor’s Service affirmed its AA rating and positive outlook for the City’s general obligation bonds. Moody’s noted the City continues to be fiscally strong with a large tax base that remains stable despite current economic conditions. The Audit Division completed 41 audits and projects in Fiscal year 2009 and initiated the first city-wide survey of citizen satisfaction with City services. The survey found citizens are most satisfied with the fire department and least satisfied with streets, drainage and air quality. The Audit Division has been reorganized to create an information technology group focusing on continuous internal auditing through the City’s financial system. The Operations and Technical Services Division of the Controller’s Office is in the process of implementing a paperless approval system for invoices and direct deposit payments to City vendors. This follows last year’s completion of a paperless payroll system that is saving the City up to a million dollars a year in reduced personnel and printing costs. The Executive Division and Controller Parker recently celebrated the launch of Bank on Houston, a City-sponsored program to connect unbanked residents with the financial mainstream. The Federal Reserve Bank, Houston Branch; the Federal Deposit Insurance Corporation; the National League of Cities; 20 banks and credit unions and numerous community non-profit organizations are participating. Within three months, the program had already exceeded its 12-month goal of opening 10,000 new accounts. Although the Financial Reporting Division is ultimately responsible for the final product, the preparation of the CAFR requires a concentrated effort by every division of the City Controller’s Office. The CAFR is available on the City Controller’s website: www.houstoncontroller.org.
-i-

Annise D. Parker Houston City Controller
During her first two terms as Controller, Ms. Parker helped win overwhelming voter approval (85%) of Proposition 3, which gives the Controller’s Office the independent authority to conduct performance reviews of all City departments, agencies and programs. She was also successful in securing a seat for a controller’s appointee on the Houston Municipal Pension System Board of Trustees, marking the first time the city’s chief financial officer has had any involvement in the pension system. In addition, Ms. Parker was tapped by Mayor Bill White to serve as a member of the stakeholders committee overseeing an independent investigation of the City’s troubled crime lab, helped lead a task force charged with developing new funding options and policies for solid waste collection in the City of Houston and oversaw implementation of a new paperless payroll system that is saving the City $1 million annually.
Prior to her election as City Controller, Ms. Parker served for six years as an at-large member of Houston City Council. She chaired city council’s Fiscal Affairs and Neighborhood Protection Committees and served on eight other committees, playing leadership roles in the creation of the City’s $20 million Rainy Day Fund, a civic art program, a pooper-scooper law, tighter regulations for inner city development and the City’s non-discrimination policy. She also represented Houston on the Alliance for Interstate 69 Texas Board, the Municipal Solid Waste Management and Resource Recovery Advisory Council of Texas Commission on Environmental Quality and the World Energy Cities Partnership.
Despite her duties as City Controller, Ms. Parker remains active in the Houston community, currently serving on the boards of the Holocaust Museum and Girls Inc., and as an advisory board member of the Houston Zoo, the Montrose Counseling Center and Trees for Houston.
In 2001, Ms. Parker was selected as “Council Member of the Year” by the Houston Police Officers Union. In 2002, she received the “Distinguished Local Elected Official Award” from the Texas Recreation and Park Society. She previously received the “Good Brick Award” from the Greater Houston Preservation Alliance for her restoration of historic properties in the Old Sixth Ward.
Ms. Parker and her life partner, Kathy Hubbard, have been together since 1990. They have two children.
-ii-
Houston City Controller Annise D. Parker is a second generation native Houstonian. She attended Rice University, graduating in 1978 with a Bachelor of Arts Degree. In the private sector, Ms. Parker spent 20 years working in the oil and gas industry, including 18 years with Mosbacher Energy Company. She also co-owned a retail bookstore for 10 years and a bookkeeping and income tax company for 15 years. Controller Parker was sworn in for a third term on January 2, 2008. She is Houston’s 14th City Controller, the second-highest elected city official, and serves as the City’s Chief Financial Officer.
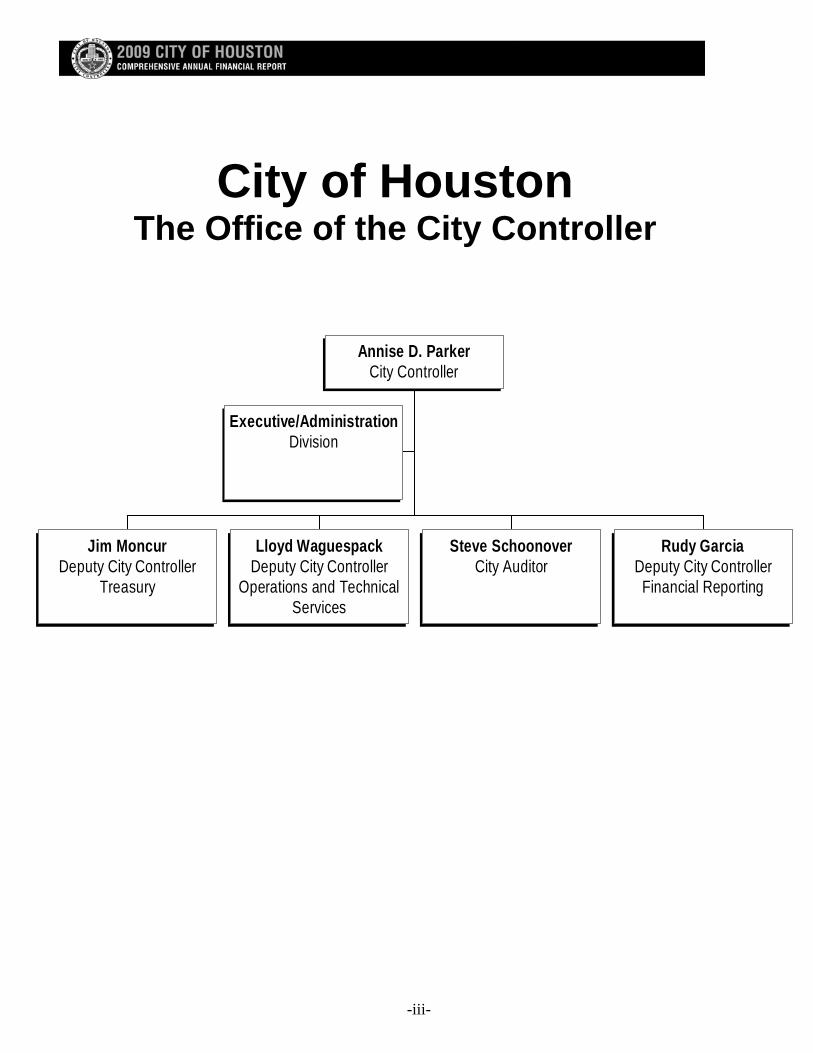
City of Houston The Office of the City Controller
-iii-
Executive/AdministrationDivision
Jim MoncurDeputy City Controller
Treasury
Lloyd WaguespackDeputy City Controller
Operations and TechnicalServices
Steve SchoonoverCity Auditor
Rudy GarciaDeputy City ControllerFinancial Reporting
Annise D. ParkerCity Controller

Elected Officials City of Houston, Texas
Mayor Bill White
City Controller Annise D. Parker
Council Members
Sue Lovell, Vice Mayor Pro Tem, At-Large Position 2
Peter Brown, At-Large Position 1 Melissa Noriega, At-Large Position 3
Ronald Green, At-Large Position 4 Jolanda “Jo” Jones, At-Large Position 5
Toni Lawrence, District A Jarvis Johnson, District B Anne Clutterbuck, District C
Wanda Adams, District D Mike Sullivan, District E M. J. Khan, District F
Pam Holm, District G Adrian Garcia, District H James Rodriguez, District I (Garcia resigned mid-year. Ed Gonzalez was
elected to fill the rest of the unexpired term.)
-iv-
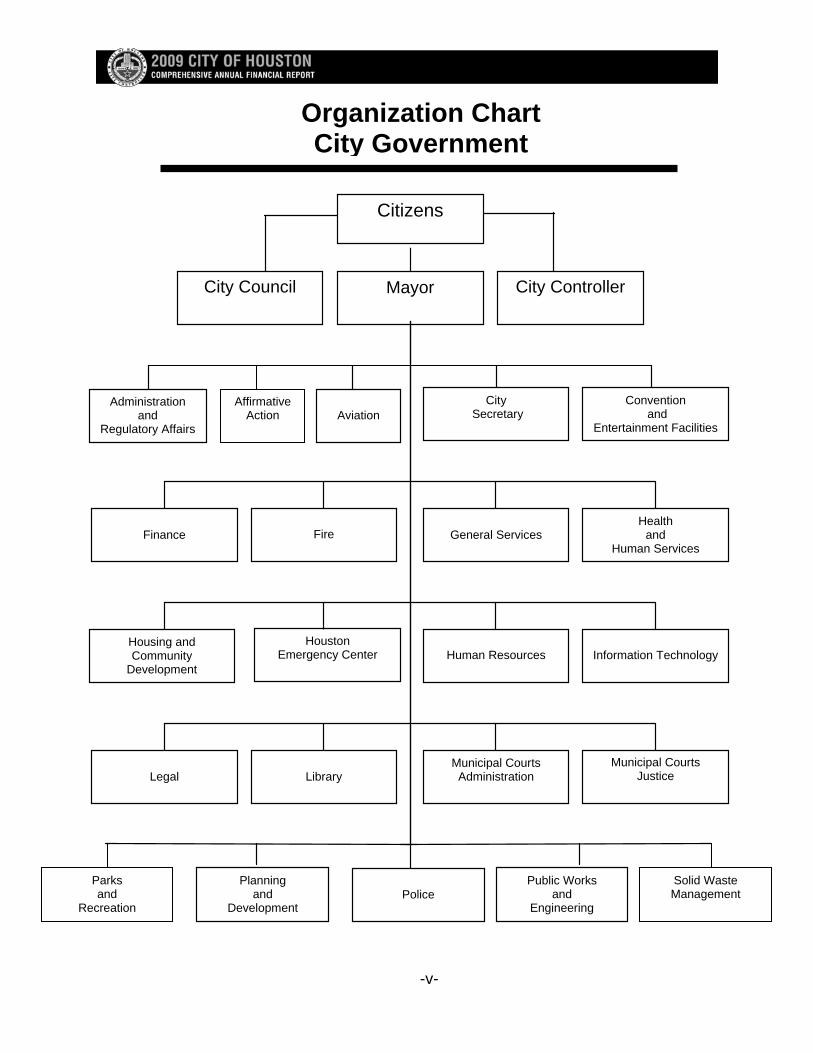
Organization Chart City Government
Planning and
Development
Police
Public Works and
Engineering
City Council
Mayor City Controller
Administration and
Regulatory Affairs
Aviation
City Secretary
Convention and
Entertainment Facilities
Finance
Fire
General Services
Health and
Human Services
Housing and Community
Development
Houston Emergency Center
Human Resources
Information Technology
Legal
Library
Municipal Courts Administration
Municipal Courts Justice
Citizens
-v-
Affirmative Action
Parks and
Recreation
Solid Waste Management

CITY OF HOUSTON, TEXAS
- vi -
vii
December 18, 2009 Citizens of Houston, Honorable Mayor and City Council Members Houston, Texas: I am pleased to provide you with the Comprehensive Annual Financial Report (CAFR) of the City of Houston, Texas (City) for the year ended June 30, 2009, including the independent auditor’s report prepared by Deloitte & Touche LLP. The CAFR was prepared by the City Controller’s Office and satisfies my responsibilities under the City Charter and State law. Responsibility for both the accuracy of the presented data and the completeness and fairness of the presentation, including all disclosures, rests with the City. We believe the data, as presented, is accurate in all material respects and is organized in a manner which fairly sets forth the financial position and results of operations of the City as measured by the financial activity of its various funds. The City’s management is responsible for establishing and maintaining a system of internal controls designed to provide reasonable, but not absolute, assurance that the assets of the City are protected from loss, theft, or misuse, and for the reliability of financial records for preparing financial statements and maintaining accountability of assets. The concept of reasonable assurance recognizes that the cost of a control should not exceed the benefits likely to be derived and that the evaluation of costs and benefits requires estimates and judgments by management. The CAFR is presented in three sections. The Introductory Section includes this transmittal letter, a list of elected City officials, and organizational charts for the Office of the City Controller and for City government. The Financial Section includes Management’s Discussion and Analysis (MD&A), basic financial statements, combining and individual fund statements and schedules, as well as the independent auditor’s report on the basic financial statements. The MD&A is a narrative introduction, overview, and analysis to accompany the basic financial statements. The Statistical Section includes selected financial and demographic information generally presented on a multi-year basis. The Basic Financial Statements of the City include all government activities, organizations and functions, including those legally separate organizations for which the City is financially accountable as defined by the Governmental Accounting Standards Board (GASB). These financial statements have been prepared in accordance with generally accepted accounting principles for local governments as prescribed by the GASB. The Reporting Entity and Its Services The Mayor serves as the Chief Executive Officer of the City. The City Controller is the second-highest elected official within City government and serves as the City’s Chief Financial Officer. The legislative body of the City is the City Council, which consists of the mayor, nine district members and five at-large members. The Mayor, City Controller, and Council Members are limited to three two-year elected terms.
viii
The City provides a full range of municipal government services including police and fire protection, emergency medical services, pretrial detention services, traffic and municipal courts, water production and distribution, solid waste collection, sanitary code enforcement, wastewater treatment, health and human services, building and housing code enforcement, construction and maintenance of streets and bridges, traffic and signal installation and maintenance, parks and recreation, library, convention and cultural activities, and operation of three municipal airports: George Bush Intercontinental Airport, William P. Hobby Airport and Ellington Airport. The City does not operate hospitals, schools, transportation systems, or higher education systems. Special districts and governmental entities with independent taxing authority are responsible for administering these services. History and Population Houston was founded on August 30, 1836 by New York real estate brokers John Kirby Allen and Augustus Chapman Allen. The Allen brothers paid $9,428 for 6,642 acres of land at the headwaters of Buffalo Bayou. About a year later, General Sam Houston, the first president of the Republic of Texas, authorized Houston to incorporate. For the next four years Houston was the capital of the Republic. In the early years, cotton and the railroad were the key drivers of Houston’s economy. That changed in 1901 with the discovery of oil at Spindletop in Beaumont, Texas. Energy is still king but the area’s economy is now also supported by other major drivers, including the Port of Houston; the Texas Medical Center, the world’s largest concentration of healthcare and medical research institutions; and NASA’s Johnson Space Center. At the time of the first Census in Texas in 1850, Houston had a population of 2,397 and Galveston, a bustling port town 45 miles south of Houston, was the state’s largest city. Today, Houston is the largest city in Texas and the fourth largest city in the United States. It is also the country’s fastest growing city. According to the U.S. Census Bureau, between July 1, 2006 and July 1, 2007 no city added more residents than Houston, almost 39,000 people, bringing the City’s population to more than 2.2 million. It offers a melting pot of ethnicities where no single group comprises a majority. It is the seat of a growing metropolitan area encompassing six counties and more than 5.5 million residents. Budgetary Information In accordance with State law and the City Charter, Houston City Council shall, in collaboration with the mayor and City departments, adopt balanced budgets each year for the General Fund, Debt Service Fund, Special Revenue Funds, Internal Service Funds, and Proprietary Funds. Exceptions are the Grant Revenue, Disaster Recovery, Health Special, and Housing Special Revenue Funds, for which City Council adopts separate operating or program budgets throughout the year. The City also does not budget capital projects and other capital expenditures related to the General Fund. Instead, City Council authorizes these expenditures through individual appropriation ordinances. Proprietary Fund budgets, also called Enterprise Funds, exclude depreciation and amortization expenses. These Proprietary Fund budgets include debt service and capital equipment costs, but exclude buildings and improvements, with the exception of Aviation, which budgets its current year expenses for these projects. As with General Fund capital projects, approval of each Proprietary Fund capital project is accomplished through individual appropriation ordinances. No City expenditures may be made without an appropriation. City Council can legally appropriate only those amounts of money that the City Controller has previously certified are, or will be, in the City treasury. Although the legal level of budgetary control is at the departmental level within a fund, the City maintains internal budgetary control at the expenditure category. (i.e., Personnel Services, Supplies, Other Services and Capital Outlay) Budget control is primarily managed using an automated encumbrance and accounts payable system.

ix
The City is required to undergo an annual Single Audit in conformity with the provisions of the Single Audit Act, the U. S. Office of Management and Budget Circular A-133, “Audits of State and Local Governments and Non-profit Organizations,” and the State of Texas Uniform Grant Management Standards. These audits are conducted simultaneously with the City’s annual financial statement audit. Information related to these Single Audits, including the schedules of federal and state financial assistance, findings and recommendations, and auditors’ reports on the internal control structure and compliance with applicable laws and regulations is included in separate Single Audit Reports. The Local Economy Historically, Houston tends to lag the rest of the nation going into a recession and lag it coming out. We also do not suffer quite as much. This appears to be the case with the current global recession, which Houston is weathering much better than other cities. The October 2009 unemployment rate for the area was 8.5 percent, compared to 10.2 percent for the nation as a whole. In early November 2009, Dr. Barton Smith, director of the University of Houston Institute for Regional Forecasting said, “the worst is behind us.” Smith predicts another 13,000 jobs will be lost early in 2010. Toward the end of the year, he expects Houston to begin seeing job growth. Bob Gilmer in the Houston Branch of the Federal Reserve Bank is more pessimistic, saying he has yet to see signs that Houston is emerging from the recession. Gilmer predicts total job losses of 100,000 for 2009, compared to Smith’s forecast of 62,000. Gilmer does agree that we will begin to experience job growth in the latter part of 2010. The predicted job losses are bigger than anticipated a year ago, mainly due to the loss of Houston’s energy cushion. Area home sales jumped 13.8 percent from October 2008 to October 2009. This marked the second straight month of year-over-year increased sales. According to the Houston Association of Realtors (HAR), the October 2009 median price for a single-family home was $149,000. This is up 5 percent from the same month a year ago. The numbers portend a mixed bag. Analysts see signs of increased interest, but they also caution about the lingering effects of the depressed market following Hurricane Ike in September 2009. HAR is optimistic about the future now that the federal homebuyer tax credit has been extended to April 2010. Homes in the price range that qualify for the credit comprise more than three-quarters of the area sales, leaving tight inventories in the lower end of the market Joining the oil industry in having a major impact on the Houston economy is the Port of Houston and the more than 150 private companies that line the Houston Ship Channel. The port is ranked first in the United States in foreign waterborne tonnage, second in the U.S. in total tonnage and tenth in the world. More than 225 million tons of cargo moved through the Port of Houston in 2007. A total of 8,053 vessel calls were recorded at the Port of Houston during the year 2008. A recent study indicates ship channel related businesses support more than 785,000 jobs and had a statewide economic impact of $118 billion in 2007. The Opening Phase of the port’s new Bayport Container and Cruise Terminal, the most technologically advanced container terminal on the gulf coast, occurred in 2007. Bayport will generate almost 12,000 jobs over the first 10 years, and $1 billion in new business revenues and more than $40 million in new tax revenues annually. The port is spotlighted on the cover and tab pages of this year’s CAFR. The Houston Airport System (HAS), consisting of George Bush Intercontinental Airport, Hobby Airport and Ellington Airport, is the fourth largest airport system in the country and the sixth largest in the world. The three airports served nearly 50 million passengers in 2008, including more than 7.9 million international passengers. Intercontinental is considered a prime gateway to Latin America and offers service to more Mexican destinations than any other U.S. airport. Cathay Pacific Cargo recently began service from Intercontinental, marking the start of the first all-cargo service between Houston and Hong Kong. HAS does not use local tax dollars and is supported entirely from user fees and leases. Houston also boasts the world renowned Texas Medical Center, a hub of medical research consisting of 47 member institutions and nine university systems that collectively serve 5.5 million patients annually. The medical center is the largest medical district in the world and accounts for nearly $6 billion in regional spending, $3.9 billion in regional personal income and 140,000 jobs. In 2007, the TMC recorded 5.5 million patient visits.
x
Johnson Space Center (JSC) in Houston is responsible for training astronauts from the U.S. and the international space station partners. The Mission Control Center (MCC) at JSC directs all space shuttle missions, including international space station assembly flights. MCC also manages all activity on board the international space station. JSC employs about 3,000 workers. Approximately 110 of these employees are astronauts. Another 12,000 workers are employed by contractors serving JSC.
The Houston Theater District boasts the largest number of theater seats outside of New York. It is one of only five cities to have professional resident companies in all of the major performing arts disciplines: opera, ballet, symphony and theater. Houston also has a vibrant and dynamic visual arts community. The cornerstone of this is the Houston Museum District (HMD), which attracts more than 7 million visitors every year. HMD is home to the Museum of Fine Arts, Houston; the Contemporary Arts Museum; the Houston Museum of Natural Science; the Holocaust Museum; the Children’s Museum; the Lawndale Art Center; the John P. McGovern Museum of Health and Medical Sciences; the Houston Center for Contemporary Craft; the Houston Museum of Printing History and the brand new Buffalo Soldiers National Museum.
Houston has teams in nearly every major professional sport including: Major League Baseball’s 2005 National League Champions, the Houston Astros; the two time world champion Houston Rockets of the National Basketball Association; the National Football League’s Houston Texans; the back-to- back MLS Cup Champions, the Houston Dynamo Soccer Team; and the Houston Aeros, the 2003 American Hockey League Champions. Numerous major sporting events have been held here, including Super Bowl XXXVIII in 2004, the World Series in 2005; the NBA All-Star game in 2006 and the Tennis Masters Cup in 2003 and 2004. Financial Policies and Planning The City has had formal financial and budgetary procedures in place since 1987. They require, among other things, a balanced budget, annual review of all fees and charges, funding of employee pensions and other benefits in a manner that systematically funds liabilities and maintenance of an Undesignated Fund Balance in its General Fund of a minimum of 5 percent of total expenses less debt service. Any funds in excess of 7.5 percent of total expenses less debt service are available for non-recurring expenses. In addition to the fund balance, the City has $20 million in cash in the Rainy Day Fund, which can only be used for emergencies or to provide for unanticipated or unforeseen extraordinary needs. The Rainy Day Fund was utilized to help with the cleanup following Hurricane Ike. The City expects to replenish the Rainy Day Fund when it receives final reimbursement from the Federal Emergency Management Agency. A 1983 resolution adopted by City Council requires the Mayor to develop and submit annually to the City Council for approval a continuous five-year Capital Improvement Plan (CIP). Each year, the Mayor must review the CIP, revise it as necessary, and obtain approval and adoption by City Council. Due to the economic downturn and its impact on the City budget, planned CIP spending has been reduced. The 2010-2014 CIP calls for the appropriation of $3.3 billion over the five-year period for both enterprise and property tax-supported projects. This is about 25 percent less than the 2009-2013 CIP. About $1.59 billion of the projects will be paid for with income generated by the self-supporting enterprise funds. The rest will be funded with tax-supported public improvement bonds approved by Houston voters. The City’s financial policies further require that any capital projects or equipment purchases funded through the issuance of bonds or other obligations will be financed for a period not to exceed the expected life of the project or equipment. Annual contributions for debt service from the General Fund are limited to 20 percent of total General Fund revenues, excluding state and federal grants. In addition, Texas law mandates that the City’s total tax supported indebtedness shall not exceed 10 percent of the total assessed valuation of property in the City. The City’s current outstanding debt payable from taxes and other revenue sources totals about $12 billion. It has been the City’s practice to maintain no more than 20 percent of the total outstanding debt for each type of debt in a variable rate structure. This is in compliance with all applicable financial policies and considered manageable.
xi
The City has investments totaling approximately $2.3 billion. We adhere to an investment policy that emphasizes, in order of priority, safety, liquidity and return on investment. The success of this deliberate approach is evident in the ‘AAAf’ credit quality rating and “S1” volatility rating assigned to the City’s General Investment Portfolio by Standard and Poor’s Rating Services. Long-term Financial Forecast and Major Initiatives Due to strong management practices in recent years that have resulted in disciplined budgets and healthy cash reserves, Houston is in better shape than other cities across the nation. However, there are challenges due to the ongoing recession. We are meeting these challenges. The increase in operating expenses for the current fiscal year has been limited to one half of one percent, equipment budgets have been tightened and employee staffing levels have been frozen at FY 09 levels. To bridge the FY 10 budget gap caused by declining property taxes and sales taxes, the General Fund’s two largest revenue sources, City Council has approved the use of $58 million of cash reserves. The City is also aggressively pursuing the sale of various parcels of surplus property that could generate as much as $15 million this fiscal year. In addition, steps are being taken to cut costs for administrative functions including payroll and vendor disbursements, permitting, billing and collections. The most recent five-year planning scenario available from the City’s Finance Department forecasts slow growth in revenues coupled with known cost increases that will continue to cause budget stress. The main factors driving the increased expenditures are contractual pay hikes for classified and civilian employees, increased costs for employee health insurance, pension responsibilities and operating costs for new facilities. The planning scenario recommends various strategies to ensure balanced budgets including reducing the City’s contribution to retiree health care costs, decreasing solid waste landfill fees, increasing solid waste fees for high volume users and requiring Tax Increment Reinvestment Zones to contribute more toward the cost of public safety. Mayor White is term limited and will be leaving office at the end of 2009. As a result, the decisions regarding future City budgets will be made by a new administration. City Charter Limitations Since completion of the FY 08 CAFR, supporters of a 2004 ballot initiative placing limits on revenue growth within the City’s General Fund have convinced the Texas Supreme Court to consider their case. The group has lost every previous argument in the lower courts. As a result, the City no longer considers their restrictions to be effective. However, another less restrictive voter approved restriction on city revenues remains in effect. Proposition 1 applies only to property taxes and water and sewer rates, limiting annual growth of these two revenues to the lesser of the actual revenues in the preceding fiscal year plus 4.5 percent, or the revenues received in the previous fiscal year plus the cumulative combined rates of inflation and the City’s population growth. Employee Pension Funds The City has three pension programs that cover all full time City employees: The Houston Municipal Employees Pension System (HMEPS) for municipal employees, the Houston Police Officers’ Pension System (HPOPS) for classified police officers and the Houston Firefighters’ Relief and Retirement Fund (HFRRF) for classified firefighters. According to the City’s Fiscal Year 2009 Monthly Financial and Operations Report for the period ending October 31, 2009, the unfunded liability for these three pensions totals $1.86 billion. Negotiated changes in pension benefits, increased employee contributions and the use of pension obligation bonds have helped to reduce this unfunded liability in recent years. The City expects additional improvement in the unfunded liabilities in future years as the full impact of the negotiated changes takes effect. However, there could also still be some setbacks due to Wall Street’s difficulties as all three pension systems invest heavily in the stock market.
xii
Retiree benefits The City also provides certain health care benefits for its retired employees, their spouses and survivors. In accordance with the Government Accounting Standards Board Statement No. 45 (GASB 45) the City now reports an actuarially determined cost of these Other Post-Employment Benefits (OPEBS). As of June 30, 2009 the City’s total actuarial accrued liability for retiree health care benefits was approximately $3.1 billion. It is the City’s practice to fund the cost of OPEBs on an annual pay-as-you-go basis and account for OPEB costs as a current operating expense in the fiscal year in which the OPEB cost is paid. Award The Government Finance Officers Association of the United States and Canada (GFOA) awarded a Certificate of Achievement for Excellence in Financial Reporting to the City of Houston for its comprehensive annual financial report for the fiscal year ended June 30, 2008. This was the 12th consecutive year that the City has achieved this prestigious award. In order to be awarded a Certificate of Achievement, a government must publish an easily readable and efficiently organized comprehensive annual financial report. This report must satisfy both generally accepted accounting principles and applicable legal requirements. A Certificate of Achievement is valid for a period of one year only. We believe that our current comprehensive annual financial report continues to meet the Certificate of Achievement Program’s requirements and we are submitting it to the GFOA to determine its eligibility for another certificate. Acknowledgements The preparation of this report on a timely basis could not have been accomplished without the dedicated services and hard work of a highly qualified staff. The City of Houston has such a staff in the City Controller’s Office. Although much time and effort in preparation of this report lies in the Financial Reporting Division, there was support from the other divisions of the Office: Administration, Executive, Operations and Technical Services and Treasury. I would like to express my appreciation to the entire staff of the City Controller’s Office, and to the staffs of the Finance, Aviation, Convention and Entertainment Facilities, and Public Works and Engineering departments who assisted and contributed to the preparation of this report. The City Controller’s Office also received invaluable assistance and support from many others outside its immediate organization. Within the City of Houston, the accounting staffs of the operating departments and the technical staff of the Information Services Division all played key roles in producing this report. Deloitte & Touche LLP was not only our independent auditor, but also served as an invaluable source of information and ideas for improving the way City finances are reported. The design is the creative work of the Houston Independent School District Printing Services and its graphic designers. We also acknowledge the Mayor and City Council Members who have consistently supported the City’s goal of excellence in all aspects of financial management. Their support is greatly appreciated.

xiii
Finally, I want to thank the Port of Houston Authority (PHA) for the photos used in the design of this year’s report. These photos provide a glimpse into this impressive operation. Request for Information This financial report is designed to provide a general overview of the City of Houston’s finances for all those with an interest in the government’s finances. Questions concerning any of the information provided in this report or requests for additional financial information should be addressed to the Office of the City Controller, 901 Bagby, 8th Floor, Houston, Texas 77002.
Annise D. Parker City Controller Sources: City of Houston FY 08 Operating Budget City of Houston 2010-2014 Capital Improvement Plan City of Houston General Fund Five-Year Planning Scenario City of Houston Valuation of Postretirement Medical and Life Obligations for Fiscal Year Ending June 30, 2009 Federal Reserve Bank of Dallas, Houston Branch Greater Houston Convention and Visitors Bureau Houston Airport System Houston Association of Realtors Houston Chronicle Nasa.gov Port Authority of Houston Texas Medical Center U.S. Census Bureau U.S. Department of Labor, Bureau of Labor Statistics

FINA
NCIA
L SE
CTIO
N


- 3 -
City of Houston, Texas Management’s Discussion and Analysis
June 30, 2009 (Unaudited)
As management of the City of Houston, we offer readers of the City of Houston’s financial statements this narrative overview and analysis of the financial activities of the City of Houston for the fiscal year ended June 30, 2009. Please read this information in conjunction with the basic financial statements that follow this section. The discussion and analysis includes comparative data for 2008. All amounts, unless otherwise indicated, are expressed in millions of dollars. Financial Highlights Some of the City’s financial highlights for the fiscal year ending June 30, 2009 include:
• The assets of the City of Houston exceeded its liabilities at the close of the most recent fiscal year by $3.677 billion.
• The City’s total net assets decreased during the year by $214 million. • Unrestricted assets are a deficit of $1.648 billion. • The City of Houston’s total expenses were $4.137 billion. • Program revenues of $1.975 billion reduced the net cost of the City’s functions to be financed
from the City’s general revenues to $2.162 billion. Overview of the Financial Statements This discussion and analysis is intended to serve as an introduction to the City of Houston’s basic financial statements. The City of Houston’s basic financial statements are comprised of three components: (1) government-wide financial statements, (2) fund financial statements, and (3) notes to the financial statements. Government-wide financial statements. The government-wide financial statements are designed to provide readers with a broad overview of the City of Houston’s finances, in a manner similar to a private-sector business. The statement of net assets presents information on all of the City of Houston’s assets and liabilities, with the difference between the assets and liabilities reported as net assets. Over time, increases and decreases in net assets may serve as a useful indicator of whether the financial position of the City of Houston is improving or deteriorating. The statement of activities presents information showing how the government’s net assets changed during the most recent fiscal year. All changes in net assets are reported as soon as the underlying event giving rise to the change occurs, regardless of the timing of related cash flows. Thus, revenues and expenses are reported in this statement for some items that will not result in cash flows until future fiscal periods (e.g., uncollected taxes and earned but unused vacation leave). Both of the government-wide financial statements distinguish between functions of the City of Houston that are principally supported by taxes and intergovernmental revenues (governmental activities) from other functions that are intended to recover all or a significant portion of their costs through user fees and charges (business-type activities). The governmental activities of the City of Houston include general government, public safety, public works, health, housing and community development, parks and recreation, and library. The business-type activities of the City of Houston include the airport system, combined utility system, convention & entertainment facilities, and parking facilities management.

- 4 -
The government-wide financial statements include not only the City of Houston itself (known as the primary government), but also legally separate component units for which the City of Houston is financially accountable. With the exception of the Houston Area Water Corporation and the three pension systems, financial information for the component units is reported separately from the financial information presented for the primary government itself. The Houston Area Water Corporation and the pension systems, although also legally separate, function for all practical purposes as departments of the City of Houston, and therefore have been included as an integral part of the primary government. Fund financial statements. A fund is a group of related accounts that is used to maintain control over resources that have been segregated for specific activities or objectives. The City of Houston, like other state and local governments, uses fund accounting to ensure and demonstrate compliance with finance-related legal requirements. All of the funds of the City of Houston can be divided into three categories: governmental funds, proprietary funds, and fiduciary funds. Governmental funds. Governmental funds are used to account for essentially the same functions reported as governmental activities in the government-wide financial statements. However, unlike the government-wide statements, fund financial statements focus on near-term inflows and outflows of spendable resources, as well as on balances of spendable resources available at the end of the fiscal year. Such information may be useful in evaluating a government’s near-term financing requirements. Because the focus of governmental funds is narrower than that of the government-wide financial statements, it is useful to compare the information presented for governmental funds with similar information presented for governmental activities in the government-wide financial statements. By doing so, readers may better understand the long-term impact of the government’s near-term financing decisions. The governmental fund balance sheet displays a reconciliation to facilitate this comparison between governmental funds. The reconciliation between the governmental fund statement of revenues, expenditures, and changes in fund balances and governmental activities is provided on a separate schedule. The City of Houston maintains nine individual governmental funds for financial reporting purposes. Information is presented separately in the governmental fund balance sheet and in the governmental fund statement of revenues, expenditures, and changes in fund balances for the general fund, the debt service fund, the capital projects fund and the grants fund, all of which are considered to be major funds. Data from the other funds is combined in the column labeled “Nonmajor Governmental Funds” on both of these statements (see the separate tab labeled “Governmental Funds” for more information on these funds). Proprietary funds. The City of Houston maintains two different types of proprietary funds: Enterprise funds (see separate tab of same name) and internal service funds (see separate tab of same name). Enterprise funds are used to report the same functions presented as business-type activities in the government-wide financial statements. The City of Houston uses enterprise funds to account for its aviation system, combined utility system and the convention and entertainment facilities. The City also includes the Houston Area Water Corporation and the parking facilities management fund as nonmajor proprietary funds. Internal service funds are an accounting device used to accumulate and allocate costs internally among the City of Houston’s various functions. The City of Houston uses internal service funds to account for health and benefits and long-term disability activities. Because both of these services predominantly benefit governmental rather than business-type functions, they have been included within governmental activities in the government-wide financial statements. Proprietary funds provide the same type of information as the government-wide financial statements, only in more detail. The proprietary fund financial statements provide separate information for the aviation system combined utility system and convention and entertainment facilities, all of which are considered to be major funds for the City of Houston. Conversely, both internal service funds are combined into a single, aggregated presentation in the proprietary fund financial statements.
- 5 -
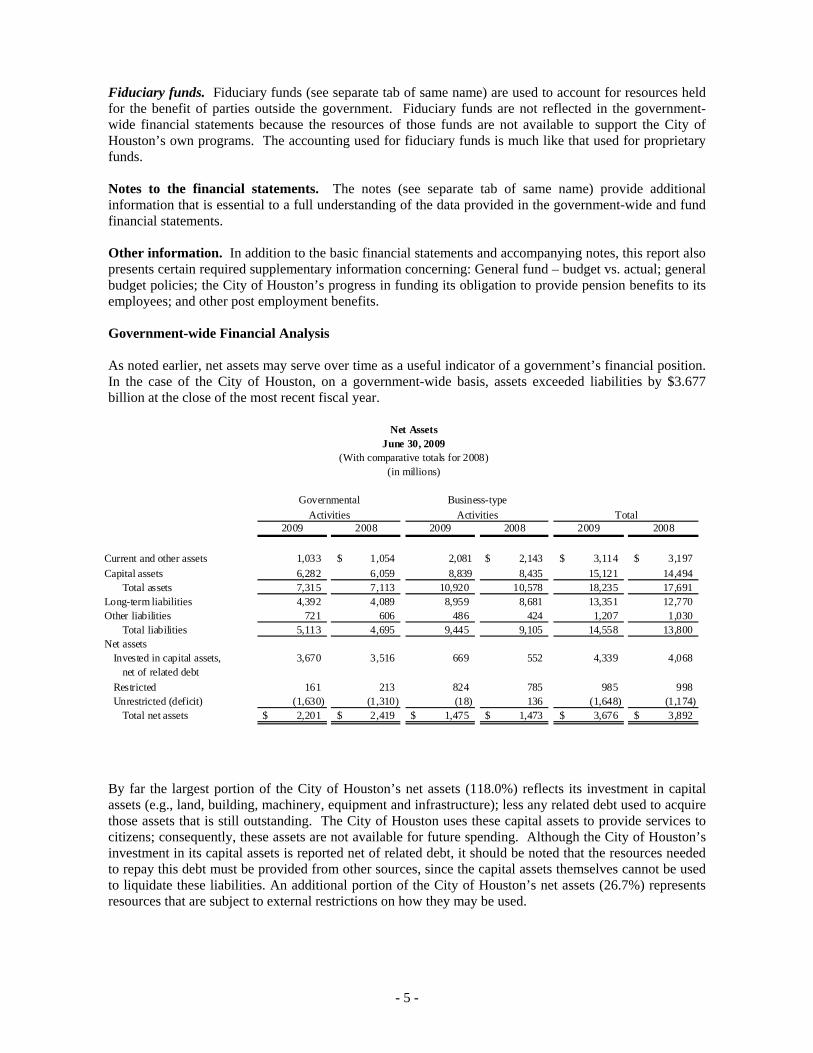
Fiduciary funds. Fiduciary funds (see separate tab of same name) are used to account for resources held for the benefit of parties outside the government. Fiduciary funds are not reflected in the government-wide financial statements because the resources of those funds are not available to support the City of Houston’s own programs. The accounting used for fiduciary funds is much like that used for proprietary funds. Notes to the financial statements. The notes (see separate tab of same name) provide additional information that is essential to a full understanding of the data provided in the government-wide and fund financial statements. Other information. In addition to the basic financial statements and accompanying notes, this report also presents certain required supplementary information concerning: General fund – budget vs. actual; general budget policies; the City of Houston’s progress in funding its obligation to provide pension benefits to its employees; and other post employment benefits. Government-wide Financial Analysis As noted earlier, net assets may serve over time as a useful indicator of a government’s financial position. In the case of the City of Houston, on a government-wide basis, assets exceeded liabilities by $3.677 billion at the close of the most recent fiscal year.
2009 2008 2009 2008 2009 2008
Current and other assets 1,033 1,054$ 2,081 2,143$ 3,114$ 3,197$ Capital assets 6,282 6,059 8,839 8,435 15,121 14,494
Total assets 7,315 7,113 10,920 10,578 18,235 17,691 Long-term liabilities 4,392 4,089 8,959 8,681 13,351 12,770 Other liabilities 721 606 486 424 1,207 1,030
Total liabilities 5,113 4,695 9,445 9,105 14,558 13,800 Net assets
Invested in capital assets, 3,670 3,516 669 552 4,339 4,068 net of related debt
Restricted 161 213 824 785 985 998 Unrestricted (deficit) (1,630) (1,310) (18) 136 (1,648) (1,174)
Total net assets 2,201$ 2,419$ 1,475$ 1,473$ 3,676$ 3,892$
TotalBusiness-type
ActivitiesGovernmental
Activities
Net AssetsJune 30, 2009
(With comparative totals for 2008)(in millions)
By far the largest portion of the City of Houston’s net assets (118.0%) reflects its investment in capital assets (e.g., land, building, machinery, equipment and infrastructure); less any related debt used to acquire those assets that is still outstanding. The City of Houston uses these capital assets to provide services to citizens; consequently, these assets are not available for future spending. Although the City of Houston’s investment in its capital assets is reported net of related debt, it should be noted that the resources needed to repay this debt must be provided from other sources, since the capital assets themselves cannot be used to liquidate these liabilities. An additional portion of the City of Houston’s net assets (26.7%) represents resources that are subject to external restrictions on how they may be used.
- 6 -
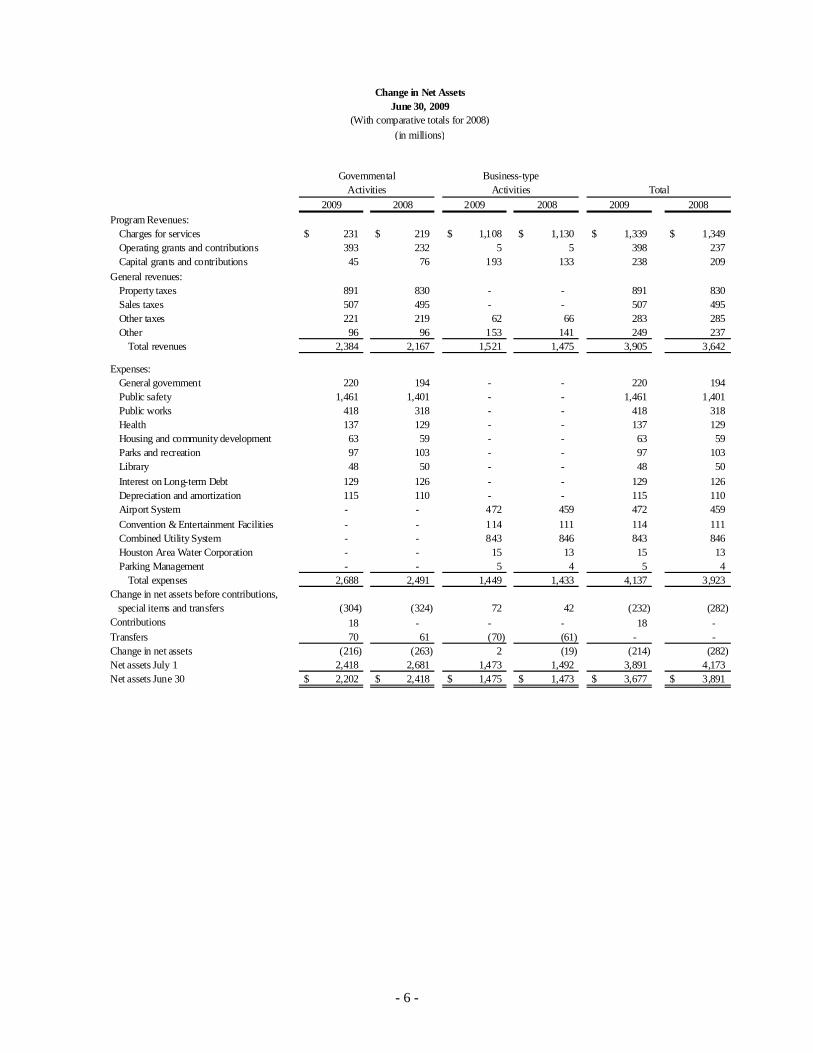
2009 2008 2009 2008 2009 2008Program Revenues:
Charges for services 231$ 219$ 1,108$ 1,130$ 1,339$ 1,349$ Operating grants and contributions 393 232 5 5 398 237 Capital grants and contributions 45 76 193 133 238 209
General revenues:Property taxes 891 830 - - 891 830 Sales taxes 507 495 - - 507 495 Other taxes 221 219 62 66 283 285 Other 96 96 153 141 249 237
Total revenues 2,384 2,167 1,521 1,475 3,905 3,642
Expenses:General government 220 194 - - 220 194 Public safety 1,461 1,401 - - 1,461 1,401 Public works 418 318 - - 418 318 Health 137 129 - - 137 129 Housing and community development 63 59 - - 63 59 Parks and recreation 97 103 - - 97 103 Library 48 50 - - 48 50 Interest on Long-term Debt 129 126 - - 129 126 Depreciation and amortization 115 110 - - 115 110 Airport System - - 472 459 472 459 Convention & Entertainment Facilities - - 114 111 114 111 Combined Utility System - - 843 846 843 846 Houston Area Water Corporation - - 15 13 15 13 Parking Management - - 5 4 5 4
Total expenses 2,688 2,491 1,449 1,433 4,137 3,923 Change in net assets before contributions, special items and transfers (304) (324) 72 42 (232) (282) Contributions 18 - - - 18 - Transfers 70 61 (70) (61) - - Change in net assets (216) (263) 2 (19) (214) (282) Net assets July 1 2,418 2,681 1,473 1,492 3,891 4,173 Net assets June 30 2,202$ 2,418$ 1,475$ 1,473$ 3,677$ 3,891$
Change in Net AssetsJune 30, 2009
(With comparative totals for 2008)(in millions)
TotalBusiness-type
ActivitiesGovernmental
Activities

- 7 -
Governmental activities. Governmental activities decreased the City of Houston’s net assets by $216 million. Key elements of this change are as follows:
• Sales tax revenue continued to show improvements during fiscal year 2009, providing a 2.4% increase for the year, from $495 million to $507 million.
• The City’s property tax rate remained at $0.63875 per $100 assessed value. Property tax revenue increased by $60 million because of the City’s rising property values and continued effort in the collection of delinquent taxes.
• The largest decrease in expenses was in the area of Parks and Recreation - $6 million. • The largest increase in expenses was in the area of Public Works - $100 million.
Revenue by Source - Governmental Activities
Charges for services10%
Operating grants and contributions
16%
Capital grants and contributions
2%Property taxes38%
Sales taxes21%
Other taxes9%
Other4%

- 8 -
Program Revenue and ExpenseGovernmental
$0
$200
$400
$600
$800
$1,000
$1,200
$1,400
$1,600
Gen
eral
gov
ernm
ent
Publ
ic sa
fety
Publ
ic w
orks
Heal
thH
ousin
g an
d co
mm
unity
deve
lopm
en
Park
s and
recr
eatio
n
Libr
ary
Inte
rest
on L
ong-
term
Deb
tD
epre
ciat
ion a
nd a
mor
tizat
ion
Expense
Revenue
Business-type activities. Business-type activities increased the City of Houston’s net assets by $2 million. Key elements of this change are as follows:
• Airport systems operating expenses were up by 6.3%, from $356 million to $378 million. Operating revenues for these facilities were down by 13.7%, from $447 million to $386 million. Investment income decreased by 10.5% from $42 million to $37 million.
• Convention & Entertainment operating expenses were up by 9.5%, from $49 million to $54 million. Operating revenues were down by 6.3%, from $22 million to $21 million. Hotel occupancy taxes decreased by 5.8%, from $66 million to $62 million.
• The Combined Utility System operating expenses increased by 1.7% from $567 million to $577 million. Operating revenues increased by 6.0% from $648 million to $687 million. Investment income was down by 5.6%, from $35 million to $33 million and interest expense was down by 2.7% from $268 million to $260 million.
• The Non-Major enterprise funds operating expenses increased by 6.6% from $17.2 million to $18.3 million. Operating revenues increased by 1.6% from $13.0 million to 13.3 million. Investment income increased 58.8% from $177 thousand to $281 thousand, and there was no interest expense.

- 9 -
Program Revenue & ExpenseBusiness-type
-$100
$0
$100
$200
$300
$400
$500
$600
$700
$800
Airport System Convention & Entertainment Combined Utility
Revenue
Operating expense
Nonoperating expense
Interest expense
Revenue by Source Business-type
Charges for services73%
Operating grants and contributions
0%
Capital grants and contributions
13%
Other taxes4%
Other10%
- 10 -
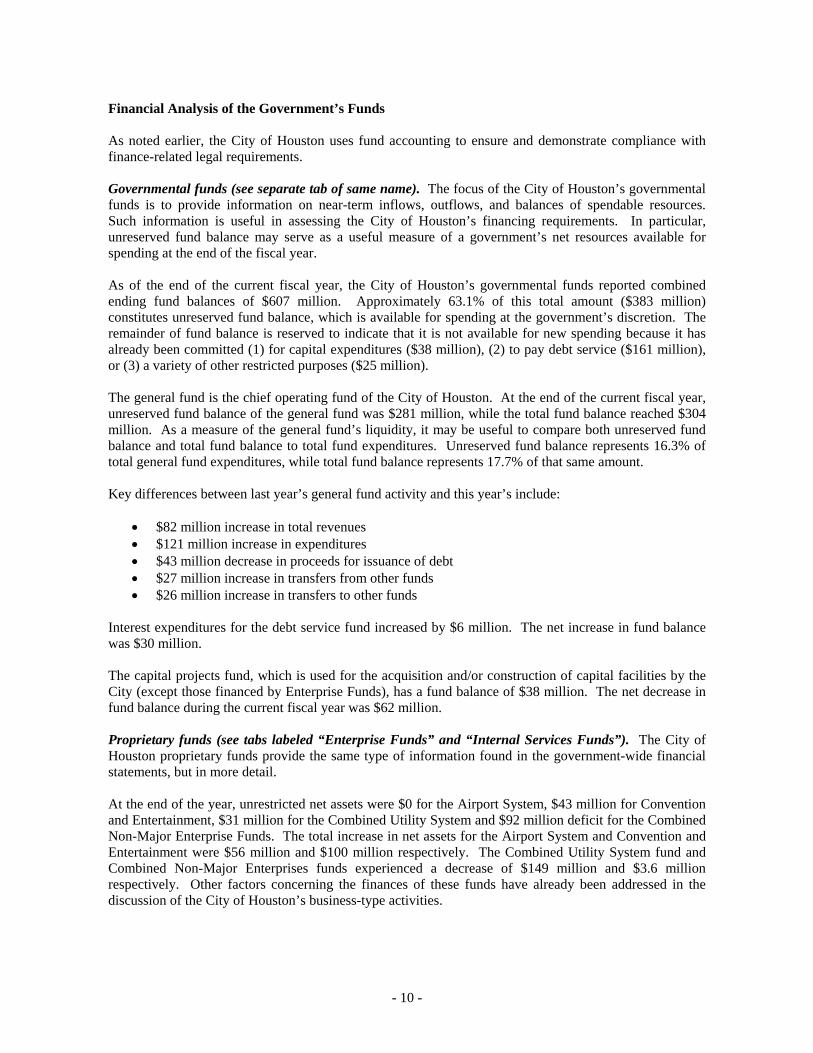
Financial Analysis of the Government’s Funds As noted earlier, the City of Houston uses fund accounting to ensure and demonstrate compliance with finance-related legal requirements. Governmental funds (see separate tab of same name). The focus of the City of Houston’s governmental funds is to provide information on near-term inflows, outflows, and balances of spendable resources. Such information is useful in assessing the City of Houston’s financing requirements. In particular, unreserved fund balance may serve as a useful measure of a government’s net resources available for spending at the end of the fiscal year. As of the end of the current fiscal year, the City of Houston’s governmental funds reported combined ending fund balances of $607 million. Approximately 63.1% of this total amount ($383 million) constitutes unreserved fund balance, which is available for spending at the government’s discretion. The remainder of fund balance is reserved to indicate that it is not available for new spending because it has already been committed (1) for capital expenditures ($38 million), (2) to pay debt service ($161 million), or (3) a variety of other restricted purposes ($25 million). The general fund is the chief operating fund of the City of Houston. At the end of the current fiscal year, unreserved fund balance of the general fund was $281 million, while the total fund balance reached $304 million. As a measure of the general fund’s liquidity, it may be useful to compare both unreserved fund balance and total fund balance to total fund expenditures. Unreserved fund balance represents 16.3% of total general fund expenditures, while total fund balance represents 17.7% of that same amount. Key differences between last year’s general fund activity and this year’s include:
• $82 million increase in total revenues • $121 million increase in expenditures • $43 million decrease in proceeds for issuance of debt • $27 million increase in transfers from other funds • $26 million increase in transfers to other funds
Interest expenditures for the debt service fund increased by $6 million. The net increase in fund balance was $30 million. The capital projects fund, which is used for the acquisition and/or construction of capital facilities by the City (except those financed by Enterprise Funds), has a fund balance of $38 million. The net decrease in fund balance during the current fiscal year was $62 million. Proprietary funds (see tabs labeled “Enterprise Funds” and “Internal Services Funds”). The City of Houston proprietary funds provide the same type of information found in the government-wide financial statements, but in more detail. At the end of the year, unrestricted net assets were $0 for the Airport System, $43 million for Convention and Entertainment, $31 million for the Combined Utility System and $92 million deficit for the Combined Non-Major Enterprise Funds. The total increase in net assets for the Airport System and Convention and Entertainment were $56 million and $100 million respectively. The Combined Utility System fund and Combined Non-Major Enterprises funds experienced a decrease of $149 million and $3.6 million respectively. Other factors concerning the finances of these funds have already been addressed in the discussion of the City of Houston’s business-type activities.
- 11 -
General Fund Budgetary Highlights Total revenues were above budget by $9.6 million. The details of the more significant variances are detailed below:
• $20 million decrease in sales taxes • $12 million increase in property taxes • $4 million decrease in other revenues • $2 million decrease in services performed for others • $1 million increase in franchise taxes • $1 million increase in industrial assessments • $2 million decrease in ambulance service • $1 million decrease in interest • $1 million decrease in other courts fines and forfeits
Total expenditures for the General Fund were $17 million below the final expenditure budget. The details of the more significant variances are detailed below:
• $6 million decrease in total general government expenditures • $2 million decrease in public safety expenditures • $2 million decrease in public works expenditures • $2 million decrease in library expenditures
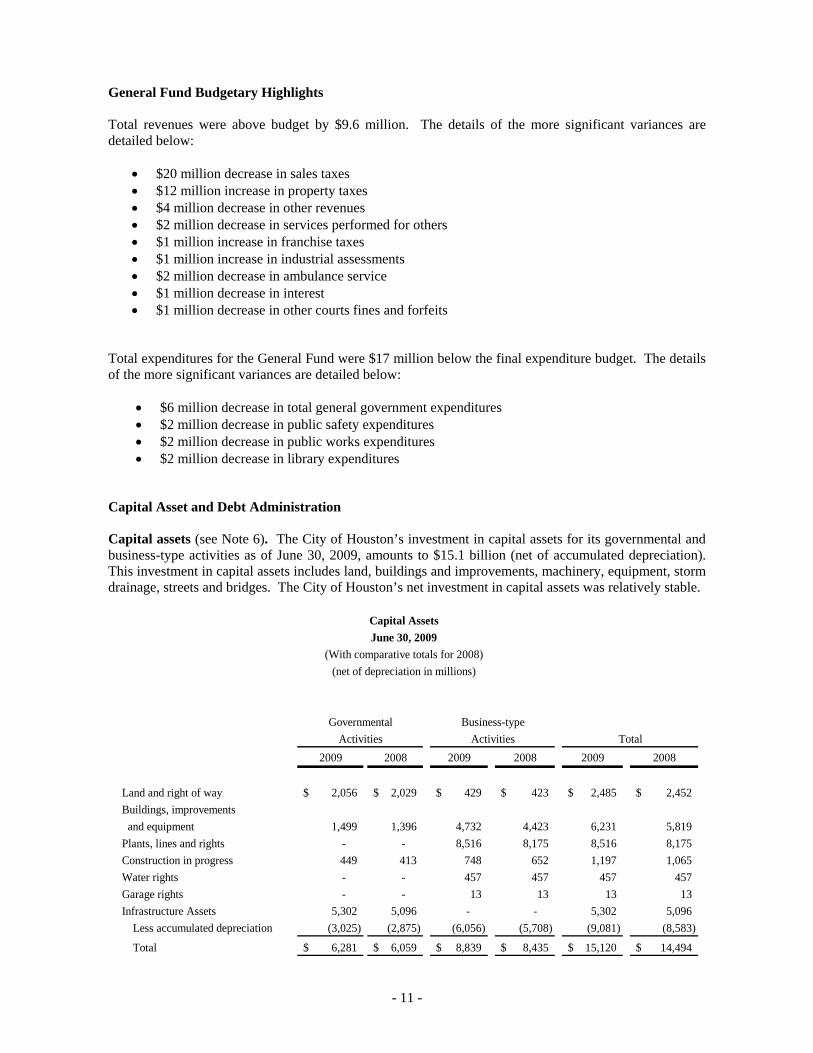
Capital Asset and Debt Administration Capital assets (see Note 6). The City of Houston’s investment in capital assets for its governmental and business-type activities as of June 30, 2009, amounts to $15.1 billion (net of accumulated depreciation). This investment in capital assets includes land, buildings and improvements, machinery, equipment, storm drainage, streets and bridges. The City of Houston’s net investment in capital assets was relatively stable.
2009 2008 2009 2008 2009 2008
Land and right of way 2,056$ 2,029$ 429$ 423$ 2,485$ 2,452$ Buildings, improvements and equipment 1,499 1,396 4,732 4,423 6,231 5,819 Plants, lines and rights - - 8,516 8,175 8,516 8,175 Construction in progress 449 413 748 652 1,197 1,065 Water rights - - 457 457 457 457 Garage rights - - 13 13 13 13 Infrastructure Assets 5,302 5,096 - - 5,302 5,096
Less accumulated depreciation (3,025) (2,875) (6,056) (5,708) (9,081) (8,583)
Total 6,281$ 6,059$ 8,839$ 8,435$ 15,120$ 14,494$
Total
Capital Assets
(net of depreciation in millions)(With comparative totals for 2008)
Governmental Business-type
June 30, 2009
Activities Activities
- 12 -
Major capital asset events during the current fiscal year included the following:
• Business-type activities construction in process balance reflects a $97 million increase. • Business-type activities buildings, improvements & equipment reflects a $309 million increase • Business-type activities plants, lines & rights reflects a $341 million increase • Governmental-type activities buildings, improvements & eqpt. reflects a $103 million increase
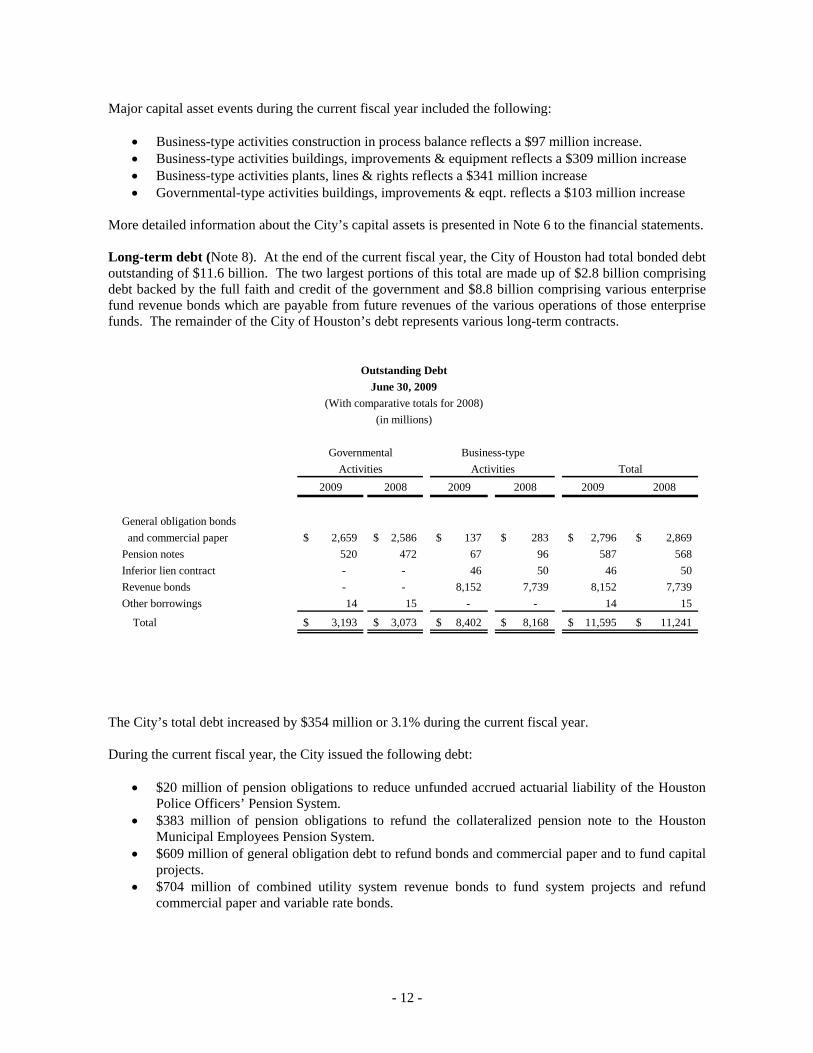
More detailed information about the City’s capital assets is presented in Note 6 to the financial statements. Long-term debt (Note 8). At the end of the current fiscal year, the City of Houston had total bonded debt outstanding of $11.6 billion. The two largest portions of this total are made up of $2.8 billion comprising debt backed by the full faith and credit of the government and $8.8 billion comprising various enterprise fund revenue bonds which are payable from future revenues of the various operations of those enterprise funds. The remainder of the City of Houston’s debt represents various long-term contracts.
2009 2008 2009 2008 2009 2008
General obligation bonds and commercial paper 2,659$ 2,586$ 137$ 283$ 2,796$ 2,869$ Pension notes 520 472 67 96 587 568 Inferior lien contract - - 46 50 46 50 Revenue bonds - - 8,152 7,739 8,152 7,739 Other borrowings 14 15 - - 14 15
Total 3,193$ 3,073$ 8,402$ 8,168$ 11,595$ 11,241$
Outstanding DebtJune 30, 2009
TotalGovernmental
ActivitiesBusiness-type
Activities
(in millions)(With comparative totals for 2008)
The City’s total debt increased by $354 million or 3.1% during the current fiscal year. During the current fiscal year, the City issued the following debt:
• $20 million of pension obligations to reduce unfunded accrued actuarial liability of the Houston Police Officers’ Pension System.
• $383 million of pension obligations to refund the collateralized pension note to the Houston Municipal Employees Pension System.
• $609 million of general obligation debt to refund bonds and commercial paper and to fund capital projects.
• $704 million of combined utility system revenue bonds to fund system projects and refund commercial paper and variable rate bonds.
- 13 -
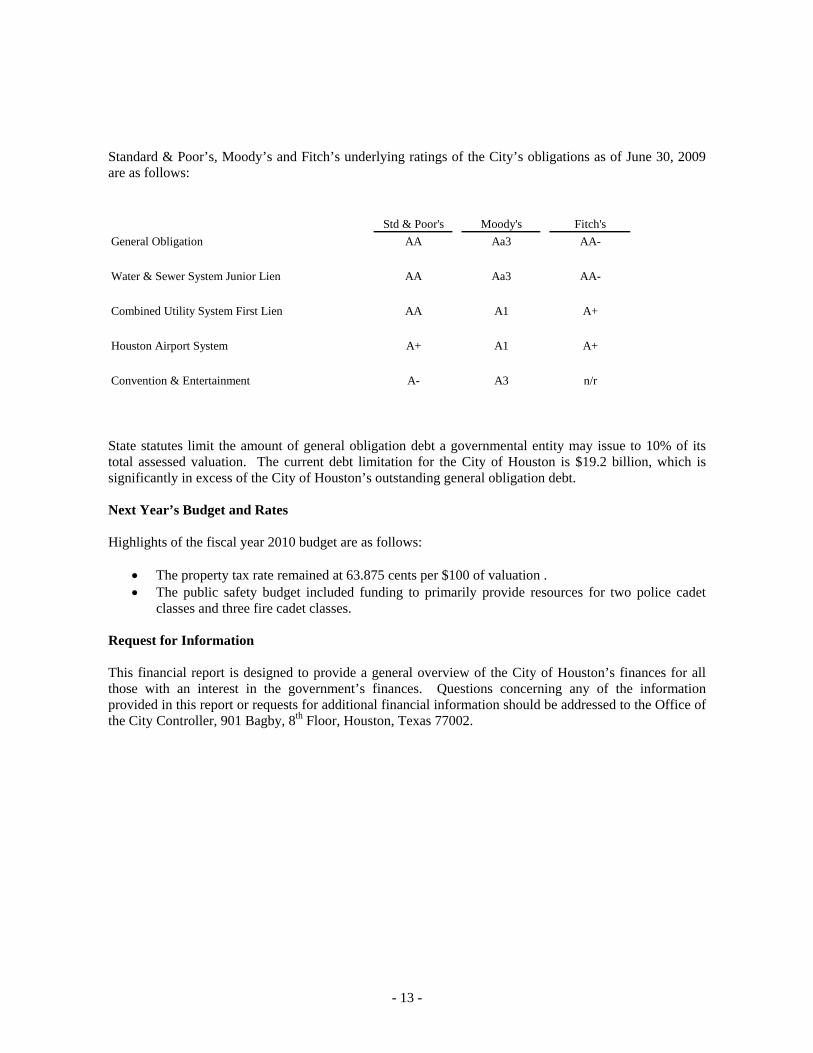
Standard & Poor’s, Moody’s and Fitch’s underlying ratings of the City’s obligations as of June 30, 2009 are as follows:
Std & Poor's Moody's Fitch'sGeneral Obligation AA Aa3 AA-
Water & Sewer System Junior Lien AA Aa3 AA-
Combined Utility System First Lien AA A1 A+
Houston Airport System A+ A1 A+
Convention & Entertainment A- A3 n/r State statutes limit the amount of general obligation debt a governmental entity may issue to 10% of its total assessed valuation. The current debt limitation for the City of Houston is $19.2 billion, which is significantly in excess of the City of Houston’s outstanding general obligation debt. Next Year’s Budget and Rates Highlights of the fiscal year 2010 budget are as follows:
• The property tax rate remained at 63.875 cents per $100 of valuation . • The public safety budget included funding to primarily provide resources for two police cadet
classes and three fire cadet classes. Request for Information This financial report is designed to provide a general overview of the City of Houston’s finances for all those with an interest in the government’s finances. Questions concerning any of the information provided in this report or requests for additional financial information should be addressed to the Office of the City Controller, 901 Bagby, 8th Floor, Houston, Texas 77002.

Governmental Business-type Activities Activities Total Governmental Business-type
AssetsEquity in pooled cash and investments 639,325$ 1,517,000$ 2,156,325$ 189,341$ 87,887$ Receivables, net of allowances
Accounts receivable 67,181 100,413 167,594 17,919 28,647 Contracts receivable - - - 943 - Hotel occupancy tax receivable - 14,713 14,713 - - Property taxes receivable 46,188 - 46,188 - - Sales taxes receivable 82,245 - 82,245 - - Mixed beverage taxes receivable 2,796 - 2,796 - - Franchise taxes receivable 17,009 - 17,009 - - Special assessments receivable 21,041 93 21,134 - - Accrued interest and other - - - 5,802 144
Due from component units 8,705 13,431 22,136 - - Internal balances (1,056) 1,056 - - - Due from other governments 103,558 20,508 124,066 - 1,641 Inventory 22,378 9,388 31,766 20,620 330 Prepaid items 2,318 7,269 9,587 31 1,382 Deferred charges for issuance cost 21,667 69,831 91,498 4,340 2,196 Investments - 28,600 28,600 35,723 17,615 Other receivables - - - 147 1,164 Due from component units - 288,758 288,758 - - Assessments receivable - - - 4,270 - Receivables and deposits - - - - 9,167 Amounts held by other governments - 10,146 10,146 - - Other long-term receivables - - - - 5,024 Capital Assets
Land and right-of-way 2,056,156 429,063 2,485,219 103,736 11,488 Buildings 751,011 2,654,712 3,405,723 41,905 319,141 Improvements and equipment 748,334 2,076,638 2,824,972 Plants, lines and rights - 8,515,663 8,515,663 - - Construction in progress 449,399 748,825 1,198,224 - 7,919 Water rights - 456,915 456,915 - - Garage rights - 13,144 13,144 - - Infrastructure assets 5,301,626 - 5,301,626 - Less accumulated depreciation and amortization (3,025,105) (6,055,824) (9,080,929) (10,076) (78,324)
Total assets 7,314,776$ 10,920,342$ 18,235,118$ 414,701$ 415,421$ (Continued)
Component Units
CITY OF HOUSTON, TEXASSTATEMENT OF NET ASSETS
June 30, 2009(amounts expressed in thousands)
* The notes to the basic financial statements are an integral part of this statement *
- 14 -
Governmental Business-type Activities Activities Total Governmental Business-type
Component Units
CITY OF HOUSTON, TEXASSTATEMENT OF NET ASSETS
June 30, 2009(amounts expressed in thousands)
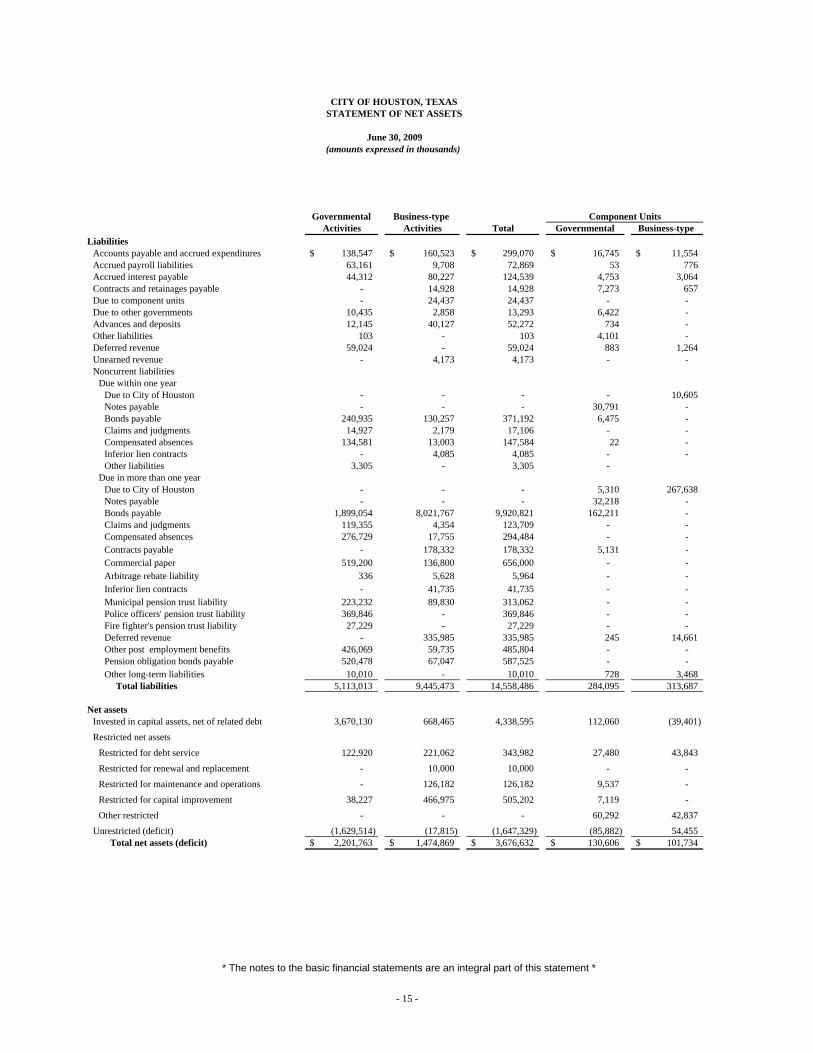
LiabilitiesAccounts payable and accrued expenditures 138,547$ 160,523$ 299,070$ 16,745$ 11,554$ Accrued payroll liabilities 63,161 9,708 72,869 53 776 Accrued interest payable 44,312 80,227 124,539 4,753 3,064 Contracts and retainages payable - 14,928 14,928 7,273 657 Due to component units - 24,437 24,437 - - Due to other governments 10,435 2,858 13,293 6,422 - Advances and deposits 12,145 40,127 52,272 734 - Other liabilities 103 - 103 4,101 - Deferred revenue 59,024 - 59,024 883 1,264 Unearned revenue - 4,173 4,173 - - Noncurrent liabilities
Due within one yearDue to City of Houston - - - - 10,605 Notes payable - - - 30,791 - Bonds payable 240,935 130,257 371,192 6,475 - Claims and judgments 14,927 2,179 17,106 - - Compensated absences 134,581 13,003 147,584 22 - Inferior lien contracts - 4,085 4,085 - - Other liabilities 3,305 - 3,305 -
Due in more than one yearDue to City of Houston - - - 5,310 267,638 Notes payable - - - 32,218 - Bonds payable 1,899,054 8,021,767 9,920,821 162,211 - Claims and judgments 119,355 4,354 123,709 - - Compensated absences 276,729 17,755 294,484 - - Contracts payable - 178,332 178,332 5,131 - Commercial paper 519,200 136,800 656,000 - - Arbitrage rebate liability 336 5,628 5,964 - - Inferior lien contracts - 41,735 41,735 - - Municipal pension trust liability 223,232 89,830 313,062 - - Police officers' pension trust liability 369,846 - 369,846 - - Fire fighter's pension trust liability 27,229 - 27,229 - - Deferred revenue - 335,985 335,985 245 14,661 Other post employment benefits 426,069 59,735 485,804 - - Pension obligation bonds payable 520,478 67,047 587,525 - - Other long-term liabilities 10,010 - 10,010 728 3,468
Total liabilities 5,113,013 9,445,473 14,558,486 284,095 313,687
Net assetsInvested in capital assets, net of related debt 3,670,130 668,465 4,338,595 112,060 (39,401) Restricted net assets
Restricted for debt service 122,920 221,062 343,982 27,480 43,843 Restricted for renewal and replacement - 10,000 10,000 - - Restricted for maintenance and operations - 126,182 126,182 9,537 - Restricted for capital improvement 38,227 466,975 505,202 7,119 - Other restricted - - - 60,292 42,837
Unrestricted (deficit) (1,629,514) (17,815) (1,647,329) (85,882) 54,455 Total net assets (deficit) 2,201,763$ 1,474,869$ 3,676,632$ 130,606$ 101,734$
* The notes to the basic financial statements are an integral part of this statement *
- 15 -

Operating CapitalCharges for Grants and Grants and
Functions/Programs Expenses Services Contributions Contributions
Primary GovernmentGovernmental activities
General government 219,584$ 22,601$ 148,898$ -$ Public safety 1,460,992 136,450 57,233 - Public works 417,953 46,404 35,614 45,354 Health 136,766 16,836 57,631 - Housing and community development 62,793 - 86,811 - Parks and recreation 97,398 7,578 5,439 - Library 48,015 1,056 1,531 -
Interest on long-term debt 129,324 - - - Unallocated Depreciation 115,050 - - -
Total governmental activities 2,687,875 230,925 393,157 45,354
Business-type activitiesAirport System 472,253 386,777 - 70,936 Convention & Entertainment facilities 114,110 20,902 1,580 105,968 Combined Utility System 842,518 687,238 2,969 15,911 Houston Area Water Corporation 14,867 13,250 25 - Parking Management 4,919 - -
Total business-type activities 1,448,667 1,108,167 4,574 192,815
Total primary government 4,136,542$ 1,339,092$ 397,731$ 238,169$
Component UnitsGovernmental 155,982 4,853 63,310 - Business-type 112,383 106,769 14,413 -
Total component units activities 268,365$ 111,622$ 77,723$ -$
General Revenues:Taxes
Property taxes levied for general purposes/tax incrementsProperty taxes levied for debt serviceIndustrial assessments taxSales taxFranchise taxMixed beverage taxBingo taxHotel occupancy tax
Investment earningsOther
ContributionsSpecial Items - gain (loss) on sale of assetsTransfers
Total general revenues, special items, and transfersChange in net assets
Net assets (deficit) beginning New component unit & restatement (see Note 16)Net assets (deficit) ending
(Continued)
CITY OF HOUSTON, TEXAS
Program Revenue
(amounts expressed in thousands)For the Fiscal Year Ended June 30, 2009
STATEMENT OF ACTIVITIES
* The notes to the basic financial statements are an integral part of this statement *
- 16 -
Governmental Business-type Activities Activities Total Governmental Business-type
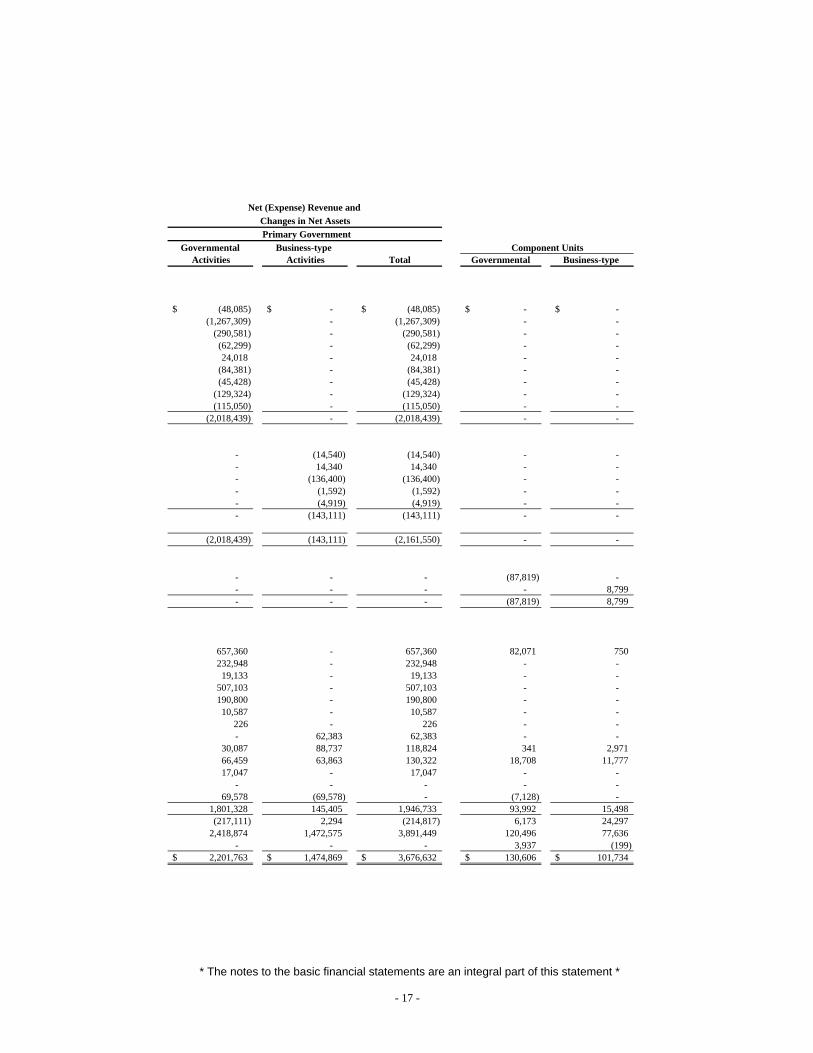
(48,085)$ -$ (48,085)$ -$ -$ (1,267,309) - (1,267,309) - -
(290,581) - (290,581) - - (62,299) - (62,299) - - 24,018 - 24,018 - -
(84,381) - (84,381) - - (45,428) - (45,428) - -
(129,324) - (129,324) - - (115,050) - (115,050) - -
(2,018,439) - (2,018,439) - -
- (14,540) (14,540) - - - 14,340 14,340 - - - (136,400) (136,400) - - - (1,592) (1,592) - - - (4,919) (4,919) - - - (143,111) (143,111) - -
(2,018,439) (143,111) (2,161,550) - -
- - - (87,819) - - - - - 8,799 - - - (87,819) 8,799
657,360 - 657,360 82,071 750 232,948 - 232,948 - -
19,133 - 19,133 - - 507,103 - 507,103 - - 190,800 - 190,800 - -
10,587 - 10,587 - - 226 - 226 - - - 62,383 62,383 - -
30,087 88,737 118,824 341 2,971 66,459 63,863 130,322 18,708 11,777 17,047 - 17,047 - -
- - - - - 69,578 (69,578) - (7,128) -
1,801,328 145,405 1,946,733 93,992 15,498 (217,111) 2,294 (214,817) 6,173 24,297
2,418,874 1,472,575 3,891,449 120,496 77,636 - - - 3,937 (199)
2,201,763$ 1,474,869$ 3,676,632$ 130,606$ 101,734$
Changes in Net AssetsNet (Expense) Revenue and
Component UnitsPrimary Government
* The notes to the basic financial statements are an integral part of this statement *
- 17 -

Debt CapitalGeneral Service Projects
AssetsEquity in pooled cash and investments 238,999$ 161,903$ 67,287$ Receivables, net of allowances
Accounts receivable 26,599 - - Property taxes receivable 46,188 - - Sales taxes receivable 82,245 - - Mixed beverage taxes receivable 2,796 - - Franchise taxes receivable 17,009 - -
Special assessments receivable 21,041 - - Due from component units - 5,310 - Due from other funds 28,480 19 10,000 Due from other governments 3,752 - 15,569 Inventory 20,685 - - Prepaid items 2,039 - 276
Total assets 489,833$ 167,232$ 93,132$
Liabilities and fund balanceLiabilities
Accounts payable 48,899 508 42,134 Accrued payroll liabilities 57,286 - - Due to other funds 1,637 - 2,132 Due to other governments 785 - - Advances and deposits 9,319 - 339 Claims and judgments 1,827 - - Compensated absences 2,613 - - Other liabilities - - - Deferred revenue 63,520 5,310 10,300
Total liabilities 185,886 5,818 54,905
Fund balanceReserved for imprest cash and prepaids 2,151 - 276 Reserved for equipment acquisitions and other capital outlay - - 37,951 Reserved for inventory 20,685 - - Reserved for debt service - 161,414 - Unreserved (deficit) 281,111 - - Unreserved - Special revenue funds - - -
Total fund balance 303,947 161,414 38,227
Total liabilities and fund balance 489,833$ 167,232$ 93,132$
Capital assets used in governmental activities are not financial resources and, therefore,are not reported in the funds.
Assets not available to pay for current-period expenditures are deferred in the funds.Internal service funds are used by management to charge the cost of health, benefits and workers'
compensation to individual funds. The assets and liabilities of the internal service funds areincluded in the governmental activities in the statement of net assets.
Liabilities, including bonds payable, not due and payable in the current period are not reportedin the funds.
Net assets of governmental activities(Continued)
CITY OF HOUSTON, TEXASBALANCE SHEET — GOVERNMENTAL FUNDS
June 30, 2009amounts expressed in thousands
* The notes to the basic financial statements are an integral part of this statement *
- 18 -
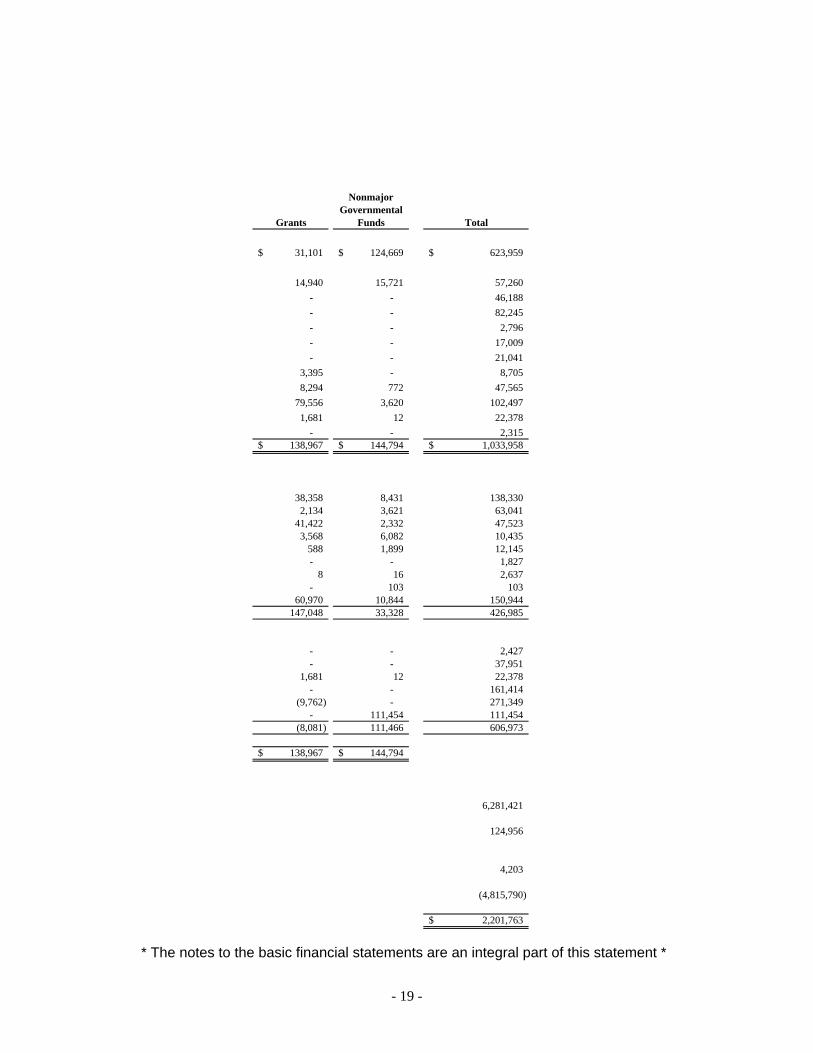
Grants Total
31,101$ 124,669$ 623,959$
14,940 15,721 57,260 - - 46,188 - - 82,245 - - 2,796 - - 17,009 - - 21,041
3,395 - 8,705 8,294 772 47,565
79,556 3,620 102,497 1,681 12 22,378
- - 2,315 138,967$ 144,794$ 1,033,958$
38,358 8,431 138,330 2,134 3,621 63,041
41,422 2,332 47,523 3,568 6,082 10,435
588 1,899 12,145 - - 1,827
8 16 2,637 - 103 103
60,970 10,844 150,944 147,048 33,328 426,985
- - 2,427 - - 37,951
1,681 12 22,378 - - 161,414
(9,762) - 271,349 - 111,454 111,454
(8,081) 111,466 606,973
138,967$ 144,794$
6,281,421
124,956
4,203
(4,815,790)
2,201,763$
Nonmajor Governmental
Funds
* The notes to the basic financial statements are an integral part of this statement *
- 19 -
Debt CapitalGeneral Service Projects
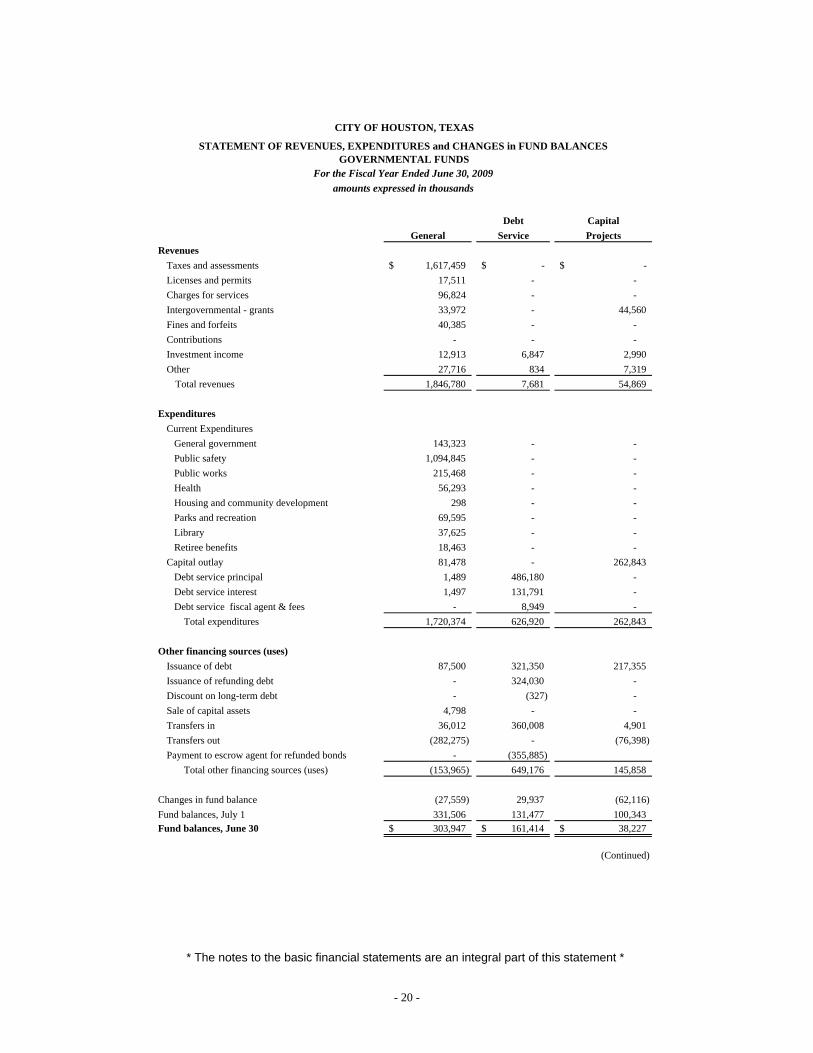
RevenuesTaxes and assessments 1,617,459$ -$ -$ Licenses and permits 17,511 - - Charges for services 96,824 - - Intergovernmental - grants 33,972 - 44,560 Fines and forfeits 40,385 - - Contributions - - - Investment income 12,913 6,847 2,990 Other 27,716 834 7,319
Total revenues 1,846,780 7,681 54,869
ExpendituresCurrent Expenditures General government 143,323 - - Public safety 1,094,845 - - Public works 215,468 - - Health 56,293 - - Housing and community development 298 - - Parks and recreation 69,595 - - Library 37,625 - - Retiree benefits 18,463 - - Capital outlay 81,478 - 262,843 Debt service principal 1,489 486,180 - Debt service interest 1,497 131,791 - Debt service fiscal agent & fees - 8,949 -
Total expenditures 1,720,374 626,920 262,843
Other financing sources (uses)Issuance of debt 87,500 321,350 217,355 Issuance of refunding debt - 324,030 - Discount on long-term debt - (327) - Sale of capital assets 4,798 - - Transfers in 36,012 360,008 4,901 Transfers out (282,275) - (76,398) Payment to escrow agent for refunded bonds - (355,885)
Total other financing sources (uses) (153,965) 649,176 145,858
Changes in fund balance (27,559) 29,937 (62,116) Fund balances, July 1 331,506 131,477 100,343 Fund balances, June 30 303,947$ 161,414$ 38,227$
(Continued)
STATEMENT OF REVENUES, EXPENDITURES and CHANGES in FUND BALANCES GOVERNMENTAL FUNDS
CITY OF HOUSTON, TEXAS
amounts expressed in thousandsFor the Fiscal Year Ended June 30, 2009
* The notes to the basic financial statements are an integral part of this statement *
- 20 -

Grants Total
-$ 478$ 1,617,937$ - 40,615 58,126 - 24,594 121,418
326,128 31,055 435,715 - 16,652 57,037 737 - 737
1,283 6,054 30,087 - 26,845 62,714
328,148 146,293 2,383,771
12,515 22,226 178,064 63,026 63,842 1,221,713
116,724 66,314 398,506 64,588 2,540 123,421 78,295 622 79,215
3,946 6,897 80,438 1,623 - 39,248
- - 18,463 - 28,151 372,472 - 21 487,690 - - 133,288 - - 8,949
340,717 190,613 3,141,467
- - 626,205 - 324,030 - - (327) - 583 5,381 - 61,872 462,793
(6,301) (26,169) (391,143) - - (355,885)
(6,301) 36,286 671,054
(18,870) (8,034) (86,642) 10,789 119,500 693,615 (8,081)$ 111,466$ 606,973$
Nonmajor Governmental
Funds
* The notes to the basic financial statements are an integral part of this statement *
- 21 -
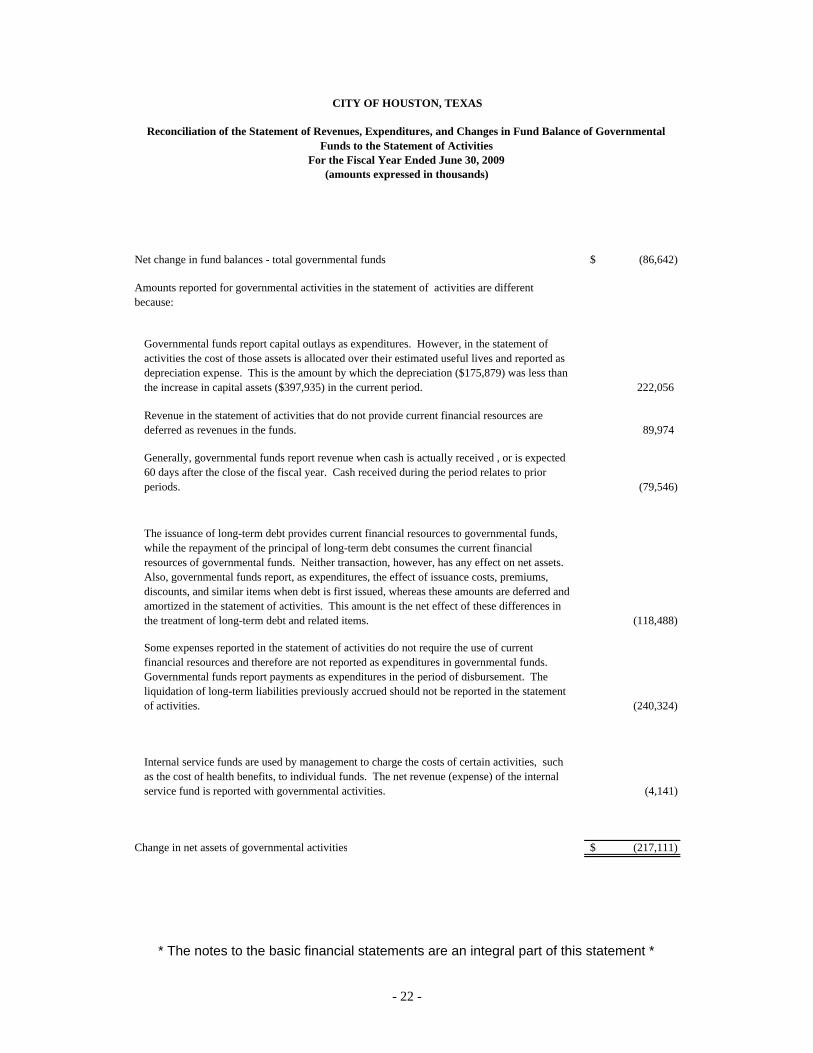
Net change in fund balances - total governmental funds (86,642)$
222,056
89,974
(79,546)
(118,488)
Some expenses reported in the statement of activities do not require the use of current financial resources and therefore are not reported as expenditures in governmental funds. Governmental funds report payments as expenditures in the period of disbursement. The liquidation of long-term liabilities previously accrued should not be reported in the statement of activities. (240,324)
(4,141)
Change in net assets of governmental activities (217,111)$
Internal service funds are used by management to charge the costs of certain activities, such as the cost of health benefits, to individual funds. The net revenue (expense) of the internal service fund is reported with governmental activities.
Governmental funds report capital outlays as expenditures. However, in the statement of activities the cost of those assets is allocated over their estimated useful lives and reported as depreciation expense. This is the amount by which the depreciation ($175,879) was less than the increase in capital assets ($397,935) in the current period.
Generally, governmental funds report revenue when cash is actually received , or is expected 60 days after the close of the fiscal year. Cash received during the period relates to prior periods.
The issuance of long-term debt provides current financial resources to governmental funds, while the repayment of the principal of long-term debt consumes the current financial resources of governmental funds. Neither transaction, however, has any effect on net assets. Also, governmental funds report, as expenditures, the effect of issuance costs, premiums, discounts, and similar items when debt is first issued, whereas these amounts are deferred and amortized in the statement of activities. This amount is the net effect of these differences in the treatment of long-term debt and related items.
Revenue in the statement of activities that do not provide current financial resources are deferred as revenues in the funds.
CITY OF HOUSTON, TEXAS
For the Fiscal Year Ended June 30, 2009(amounts expressed in thousands)
Amounts reported for governmental activities in the statement of activities are different because:
Reconciliation of the Statement of Revenues, Expenditures, and Changes in Fund Balance of Governmental Funds to the Statement of Activities
* The notes to the basic financial statements are an integral part of this statement *
- 22 -

CITY OF HOUSTON, TEXAS
This page is left blank intentionally
- 23 -
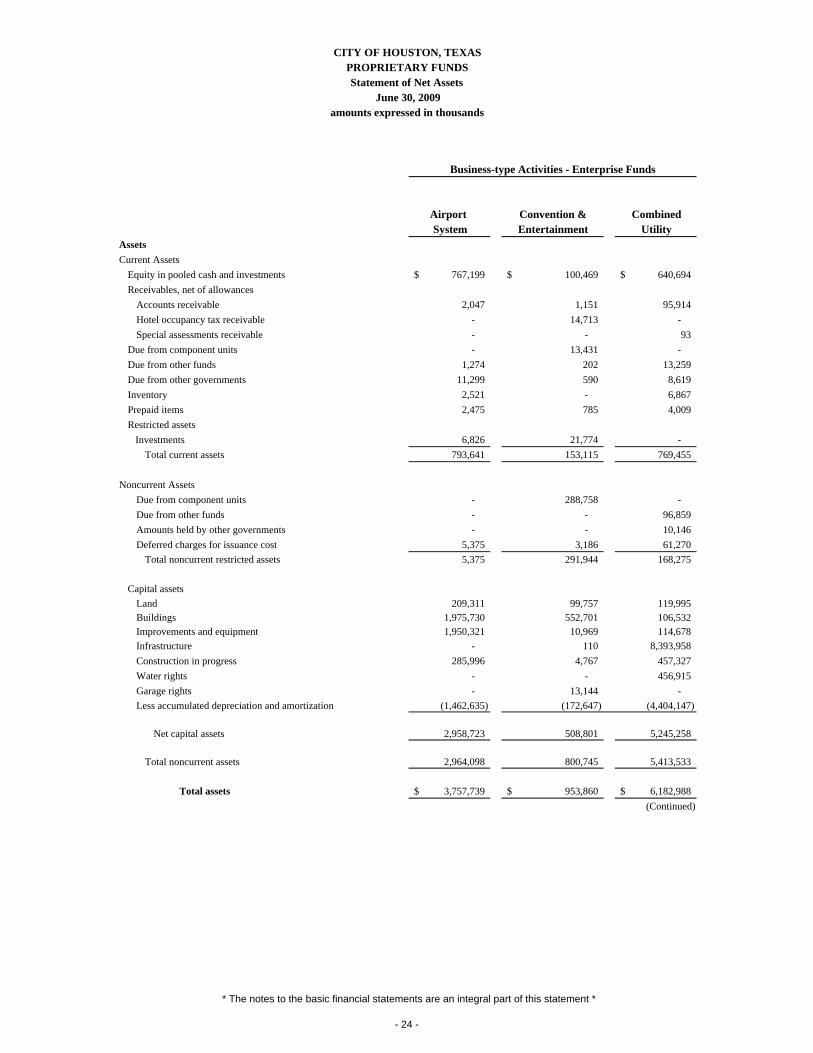
Airport Convention & CombinedSystem Entertainment Utility
AssetsCurrent Assets
Equity in pooled cash and investments 767,199$ 100,469$ 640,694$ Receivables, net of allowances
Accounts receivable 2,047 1,151 95,914 Hotel occupancy tax receivable - 14,713 - Special assessments receivable - - 93
Due from component units - 13,431 - Due from other funds 1,274 202 13,259 Due from other governments 11,299 590 8,619 Inventory 2,521 - 6,867 Prepaid items 2,475 785 4,009 Restricted assets Investments 6,826 21,774 -
Total current assets 793,641 153,115 769,455
Noncurrent AssetsDue from component units - 288,758 - Due from other funds - - 96,859 Amounts held by other governments - - 10,146 Deferred charges for issuance cost 5,375 3,186 61,270
Total noncurrent restricted assets 5,375 291,944 168,275
Capital assetsLand 209,311 99,757 119,995 Buildings 1,975,730 552,701 106,532 Improvements and equipment 1,950,321 10,969 114,678 Infrastructure - 110 8,393,958 Construction in progress 285,996 4,767 457,327 Water rights - - 456,915 Garage rights - 13,144 - Less accumulated depreciation and amortization (1,462,635) (172,647) (4,404,147)
Net capital assets 2,958,723 508,801 5,245,258
Total noncurrent assets 2,964,098 800,745 5,413,533
Total assets 3,757,739$ 953,860$ 6,182,988$ (Continued)
CITY OF HOUSTON, TEXASPROPRIETARY FUNDSStatement of Net Assets
June 30, 2009
Business-type Activities - Enterprise Funds
amounts expressed in thousands
* The notes to the basic financial statements are an integral part of this statement *
- 24 -
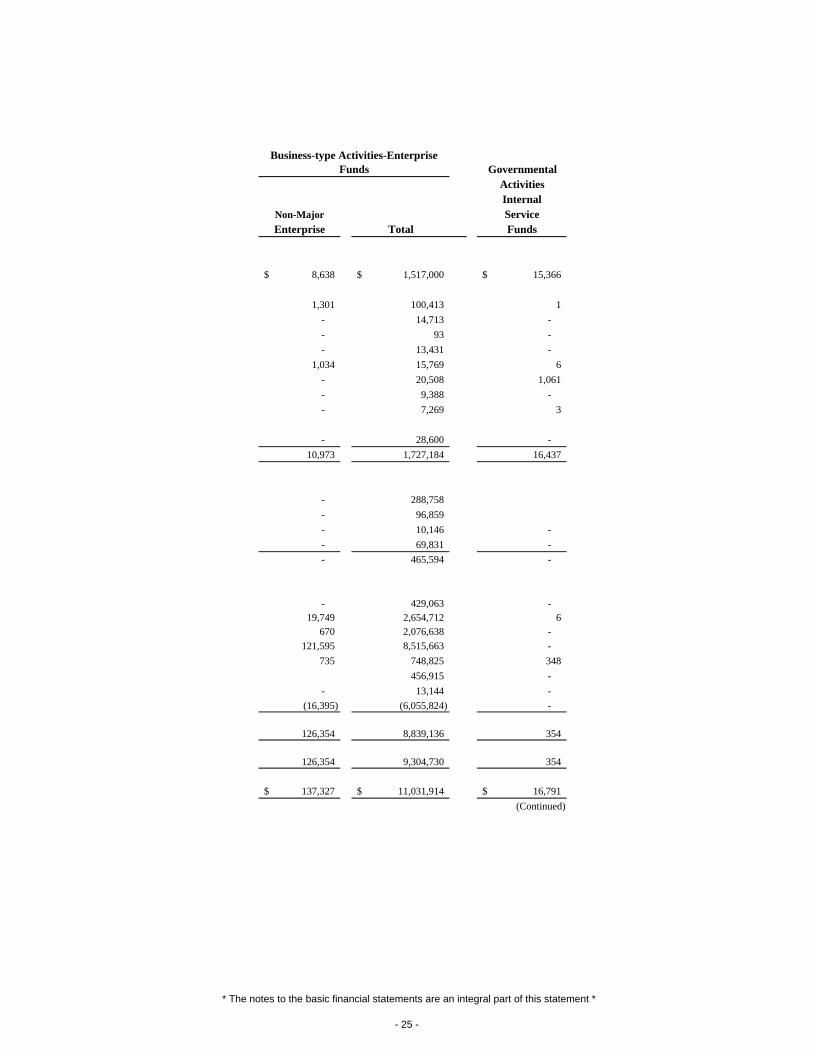
GovernmentalActivitiesInternal
Non-Major ServiceEnterprise Total Funds
8,638$ 1,517,000$ 15,366$
1,301 100,413 1 - 14,713 - - 93 - - 13,431 -
1,034 15,769 6 - 20,508 1,061 - 9,388 - - 7,269 3
- 28,600 - 10,973 1,727,184 16,437
- 288,758 - 96,859 - 10,146 - - 69,831 - - 465,594 -
- 429,063 - 19,749 2,654,712 6
670 2,076,638 - 121,595 8,515,663 -
735 748,825 348 456,915 -
- 13,144 - (16,395) (6,055,824) -
126,354 8,839,136 354
126,354 9,304,730 354
137,327$ 11,031,914$ 16,791$ (Continued)
Business-type Activities-Enterprise Funds
* The notes to the basic financial statements are an integral part of this statement *
- 25 -
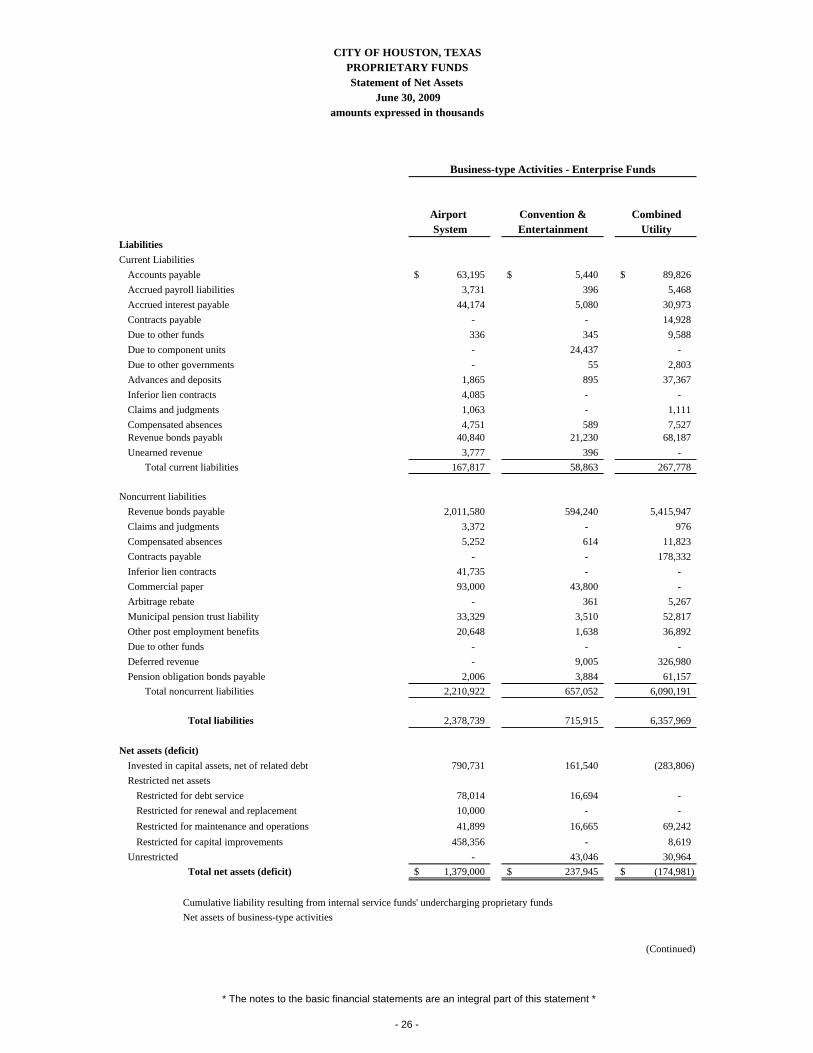
Airport Convention & CombinedSystem Entertainment Utility
CITY OF HOUSTON, TEXASPROPRIETARY FUNDSStatement of Net Assets
June 30, 2009
Business-type Activities - Enterprise Funds
amounts expressed in thousands
LiabilitiesCurrent Liabilities
Accounts payable 63,195$ 5,440$ 89,826$ Accrued payroll liabilities 3,731 396 5,468 Accrued interest payable 44,174 5,080 30,973 Contracts payable - - 14,928 Due to other funds 336 345 9,588 Due to component units - 24,437 - Due to other governments - 55 2,803 Advances and deposits 1,865 895 37,367 Inferior lien contracts 4,085 - - Claims and judgments 1,063 - 1,111 Compensated absences 4,751 589 7,527 Revenue bonds payable 40,840 21,230 68,187 Unearned revenue 3,777 396 -
Total current liabilities 167,817 58,863 267,778
Noncurrent liabilitiesRevenue bonds payable 2,011,580 594,240 5,415,947 Claims and judgments 3,372 - 976 Compensated absences 5,252 614 11,823 Contracts payable - - 178,332 Inferior lien contracts 41,735 - - Commercial paper 93,000 43,800 - Arbitrage rebate - 361 5,267 Municipal pension trust liability 33,329 3,510 52,817 Other post employment benefits 20,648 1,638 36,892 Due to other funds - - - Deferred revenue - 9,005 326,980 Pension obligation bonds payable 2,006 3,884 61,157
Total noncurrent liabilities 2,210,922 657,052 6,090,191
Total liabilities 2,378,739 715,915 6,357,969
Net assets (deficit)Invested in capital assets, net of related debt 790,731 161,540 (283,806) Restricted net assets
Restricted for debt service 78,014 16,694 - Restricted for renewal and replacement 10,000 - - Restricted for maintenance and operations 41,899 16,665 69,242 Restricted for capital improvements 458,356 - 8,619
Unrestricted - 43,046 30,964 Total net assets (deficit) 1,379,000$ 237,945$ (174,981)$
Cumulative liability resulting from internal service funds' undercharging proprietary funds Net assets of business-type activities
(Continued)
* The notes to the basic financial statements are an integral part of this statement *
- 26 -

GovernmentalActivitiesInternal
Non-Major ServiceEnterprise Total Funds
Business-type Activities-Enterprise Funds
2,062 160,523$ 217$ 113 9,708 120 - 80,227 - - 14,928 -
2,820 13,089 2,728 - 24,437 - - 2,858 - - 40,127 - - 4,085 -
5 2,179 3,050 136 13,003 150 - 130,257 - - 4,173 1,449
5,136 499,594 7,714
- 8,021,767 - 6 4,354 6,004
66 17,755 140 - 178,332 - - 41,735 - - 136,800 - - 5,628 - 174 89,830 - 557 59,735 -
96,859 96,859 - - 335,985 - - 67,047 -
97,662 9,055,827 6,144
102,798 9,555,421 13,858
- 668,465 354
126,354 221,062 - - 10,000 - - 127,806 - - 466,975 -
(91,825) (17,815) 2,579 34,529$ 1,476,493 2,933$
(1,624) 1,474,869$
* The notes to the basic financial statements are an integral part of this statement *
- 27 -

Airport Convention & CombinedSystem Entertainment Utility
Operating RevenuesLanding area fees 82,823$ -$ -$ Terminal space rentals 174,433 - - Parking 66,565 8,885 Concession 56,136 5,167 - Other 5,800 - - Rental - 6,850 - Water/Sewer Billing - - 687,238 Health benefit premiums - - -
Total operating revenue 385,757 20,902 687,238
Operating ExpensesAdministrative costs - - Claims Costs - - - Maintenance and operating 241,303 39,142 371,771 Depreciation and amortization 136,554 14,888 204,919
Total operating expenses 377,857 54,030 576,690 Operating income (loss) 7,900 (33,128) 110,548
Nonoperating revenue (expenses)Investment income 37,332 17,688 33,436 Hotel occupancy tax - 62,383 - Other revenue 1,093 1,082 29,880 Gain (Loss) on disposal of assets 1,020 (174) (5,432) Other expenses (30,166) Interest on long-term debt (94,396) (29,740) (260,396) Passenger facility charges 32,398 - - Contributions - 1,580 2,969
Total nonoperating revenues (expenses) (22,553) 22,653 (199,543)
Income (loss) before capital contributions and transfers (14,653) (10,475) (88,995)
Capital contributions 70,936 105,968 17,109
Transfers in - 4,635 - Transfers out - (500) (77,124)
Total transfers - 4,135 (77,124)
Change in net assets 56,283 99,628 (149,010) Liability resulting from internal service fund's undercharging proprietary fundsNet changeTotal net assets (deficit), July 1 1,322,717 138,317 (25,971)
Total net assets (deficit), June 30 1,379,000$ 237,945$ (174,981)$
Cumulative liability resulting from internal service funds' undercharging proprietary funds Total net assets business-type activities
(Continued)
Business-type Activities - Enterprise Funds
CITY OF HOUSTON, TEXASPROPRIETARY FUNDS
Statement of Revenues, Expenses and Changes in Fund Net AssetsFor the Fiscal Year Ended June 30, 2009
amounts expressed in thousands
* The notes to the basic financial statement are an integral part of this statement *
- 28 -
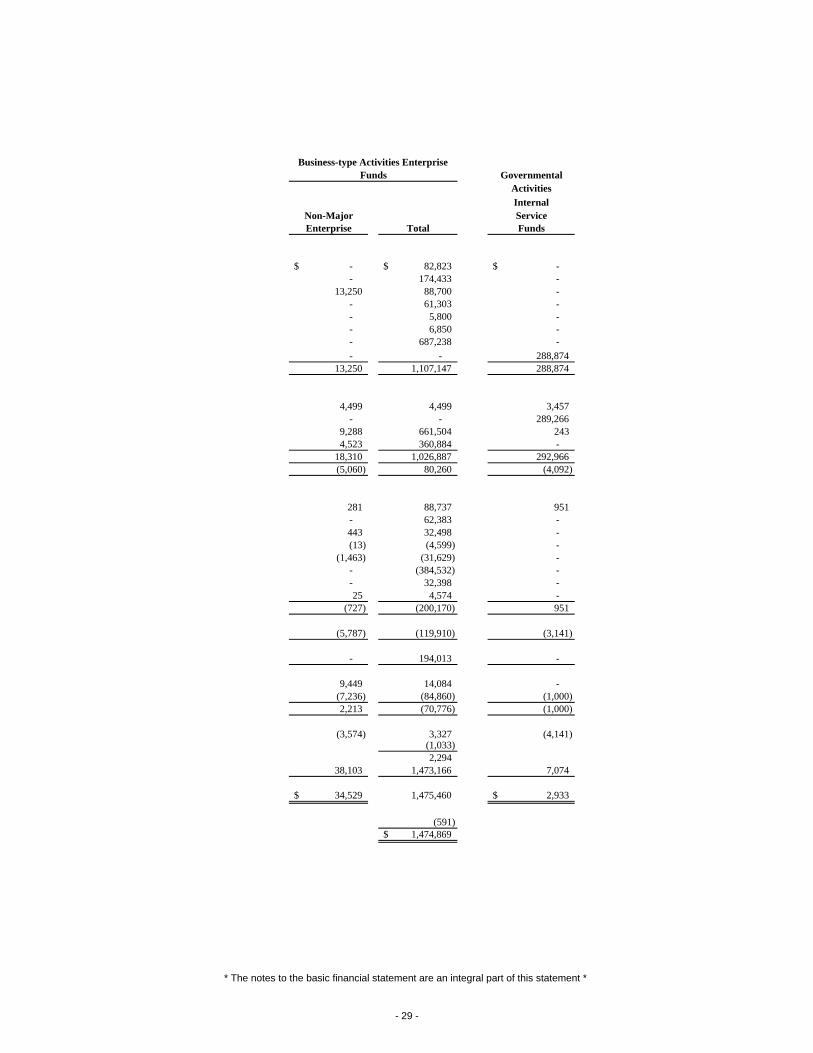
GovernmentalActivitiesInternal
Non-Major ServiceEnterprise Total Funds
-$ 82,823$ -$ - 174,433 -
13,250 88,700 - - 61,303 - - 5,800 - - 6,850 - - 687,238 - - - 288,874
13,250 1,107,147 288,874
4,499 4,499 3,457 - - 289,266
9,288 661,504 243 4,523 360,884 -
18,310 1,026,887 292,966 (5,060) 80,260 (4,092)
281 88,737 951 - 62,383 - 443 32,498 - (13) (4,599) -
(1,463) (31,629) - - (384,532) - - 32,398 - 25 4,574 -
(727) (200,170) 951
(5,787) (119,910) (3,141)
- 194,013 -
9,449 14,084 - (7,236) (84,860) (1,000) 2,213 (70,776) (1,000)
(3,574) 3,327 (4,141) (1,033) 2,294
38,103 1,473,166 7,074
34,529$ 1,475,460 2,933$
(591) 1,474,869$
Business-type Activities Enterprise Funds
* The notes to the basic financial statement are an integral part of this statement *
- 29 -
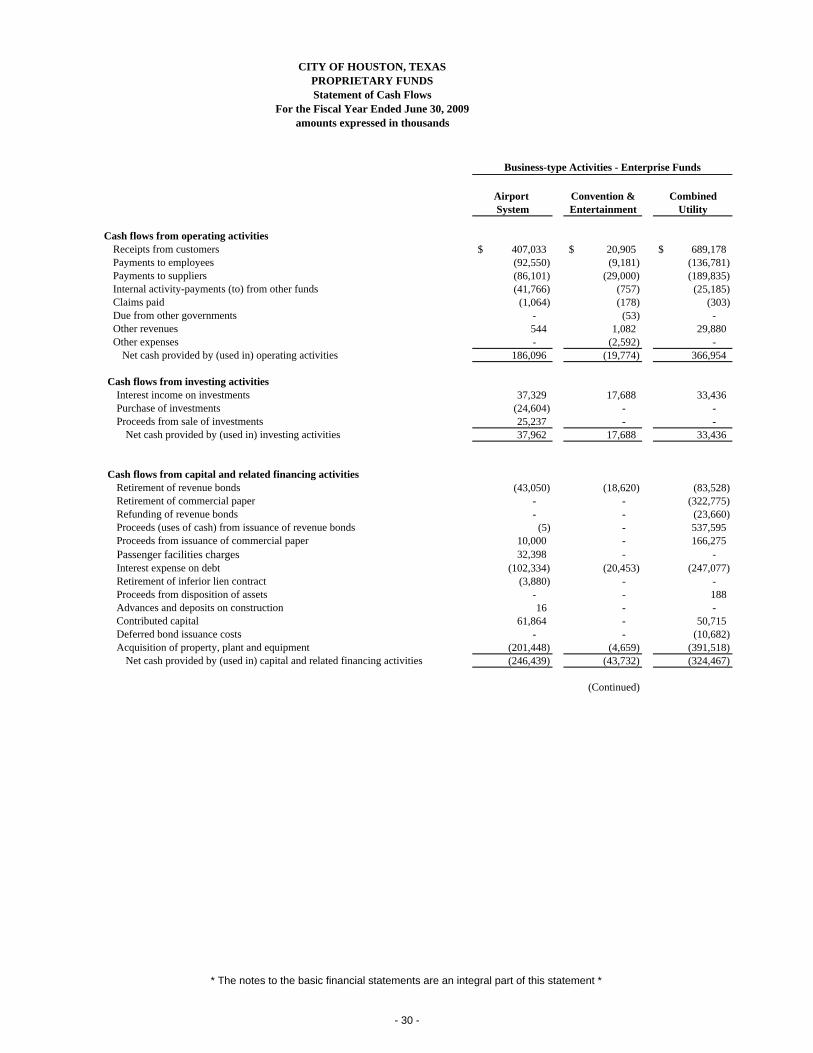
Airport Convention & CombinedSystem Entertainment Utility
Cash flows from operating activitiesReceipts from customers 407,033$ 20,905$ 689,178$ Payments to employees (92,550) (9,181) (136,781) Payments to suppliers (86,101) (29,000) (189,835) Internal activity-payments (to) from other funds (41,766) (757) (25,185) Claims paid (1,064) (178) (303) Due from other governments - (53) - Other revenues 544 1,082 29,880 Other expenses - (2,592) -
Net cash provided by (used in) operating activities 186,096 (19,774) 366,954
Cash flows from investing activitiesInterest income on investments 37,329 17,688 33,436 Purchase of investments (24,604) - - Proceeds from sale of investments 25,237 - -
Net cash provided by (used in) investing activities 37,962 17,688 33,436
Cash flows from capital and related financing activitiesRetirement of revenue bonds (43,050) (18,620) (83,528) Retirement of commercial paper - - (322,775) Refunding of revenue bonds - - (23,660) Proceeds (uses of cash) from issuance of revenue bonds (5) - 537,595 Proceeds from issuance of commercial paper 10,000 - 166,275 Passenger facilities charges 32,398 - - Interest expense on debt (102,334) (20,453) (247,077) Retirement of inferior lien contract (3,880) - - Proceeds from disposition of assets - - 188 Advances and deposits on construction 16 - - Contributed capital 61,864 - 50,715 Deferred bond issuance costs - - (10,682) Acquisition of property, plant and equipment (201,448) (4,659) (391,518)
Net cash provided by (used in) capital and related financing activities (246,439) (43,732) (324,467)
(Continued)
Business-type Activities - Enterprise Funds
CITY OF HOUSTON, TEXASPROPRIETARY FUNDSStatement of Cash Flows
For the Fiscal Year Ended June 30, 2009amounts expressed in thousands
* The notes to the basic financial statements are an integral part of this statement *
- 30 -
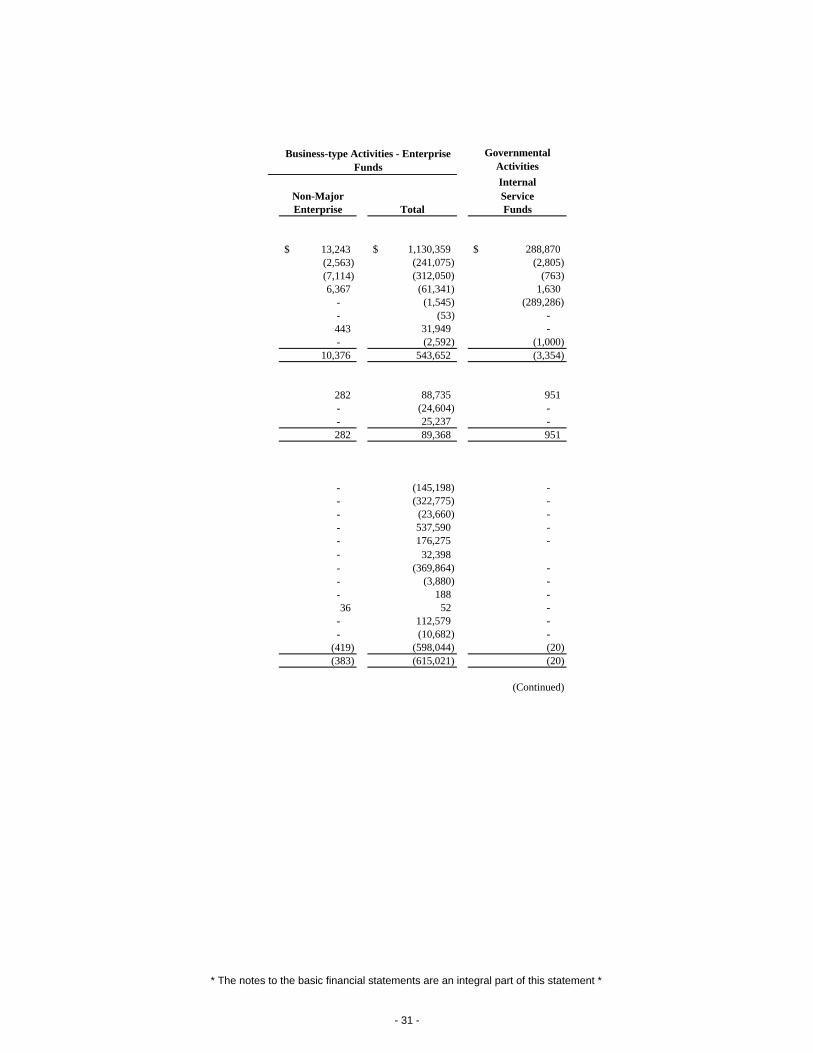
Governmental ActivitiesInternal
Non-Major ServiceEnterprise Total Funds
13,243$ 1,130,359$ 288,870$ (2,563) (241,075) (2,805) (7,114) (312,050) (763) 6,367 (61,341) 1,630
- (1,545) (289,286) - (53) - 443 31,949 - - (2,592) (1,000)
10,376 543,652 (3,354)
282 88,735 951 - (24,604) - - 25,237 - 282 89,368 951
- (145,198) - - (322,775) - - (23,660) - - 537,590 - - 176,275 - - 32,398 - (369,864) - - (3,880) - - 188 - 36 52 -
- 112,579 - - (10,682) -
(419) (598,044) (20) (383) (615,021) (20)
(Continued)
Business-type Activities - Enterprise Funds
* The notes to the basic financial statements are an integral part of this statement *
- 31 -

Airport Convention & CombinedSystem Entertainment Utility
Business-type Activities - Enterprise Funds
CITY OF HOUSTON, TEXASPROPRIETARY FUNDSStatement of Cash Flows
For the Fiscal Year Ended June 30, 2009amounts expressed in thousands
Cash flows from noncapital financing activitiesRetirement of collateralized pension note (34,800) - - Promotional contract paid from hotel occupancy tax revenues to component units - (27,574) - Interest expense electrical contract (53) - - Interest expense on pension obligation bonds (106) (10) - Interest expense collateralized note (3,823) (34) - Deferred charges on future debt issuance (441) - - Payments from Hotel Corporation - 11,775 - Hotel occupancy tax revenue - 67,122 - Proceeds form pension bonds - - 6,175 Transfers to debt service fund - - (28,419) Transfers from (to) other funds - 4,135 (48,578)
Net cash provided by (used in) noncapital financing activities (39,223) 55,414 (70,822)
Net increase (decrease) in cash and cash equivalents (61,604) 9,596 5,101 Cash and cash equivalents, July 1 828,803 90,873 635,593
Cash and cash equivalents, June 30 767,199$ 100,469$ 640,694$
Non cash transactionsCapital additions included in liabilities 23,203 - - Contributions of capital assets (2,009) (105,968) (17,109) Capitalize interest expense 10,042 - 13,198 Cap accretion interest - - 17,601 Gain (loss) on disposal of assets (997) - 5,432
Total non cash transactions 30,239$ (105,968)$ 19,122$
Reconciliation of operating income (loss) to net cash provided (used)by operating activities
Operating income (loss) 7,900$ (33,128)$ 110,548$ Adjustments to reconcile operating income (loss) to net cashprovided (used) by operating activitiesDepreciation and amortization 136,554 14,888 204,919 Other post employment benefits 9,292 719 17,037 Other revenues 1,093 1,082 29,880 Other expenses - (2,592) - Changes in assets and liabilities
Accounts receivable 19,232 775 813 Arbitrage rebate - - 425 Due from other funds (1,240) (100) (11,715) Due from other governments (548) - 1,626 Inventory and prepaid insurance 96 - (980) Accounts payable 8,276 (1,229) 2,673 Accrued payroll liabilities 290 15 561 Due to other funds 329 345 9,273 Due to other governments - (53) - Advances and deposits 2,043 (157) 1,127 Claims and judgments-workers' compensation (587) (160) (448) Compensated absences 146 (3) (685) Pension obligation payable 3,220 749 4,510 Deferred revenue - (946) - Other long-term liabilities - 21 (2,610)
Net cash provided by (used in) operating activities 186,096$ (19,774)$ 366,954$
(Continued)
* The notes to the basic financial statements are an integral part of this statement *
- 32 -
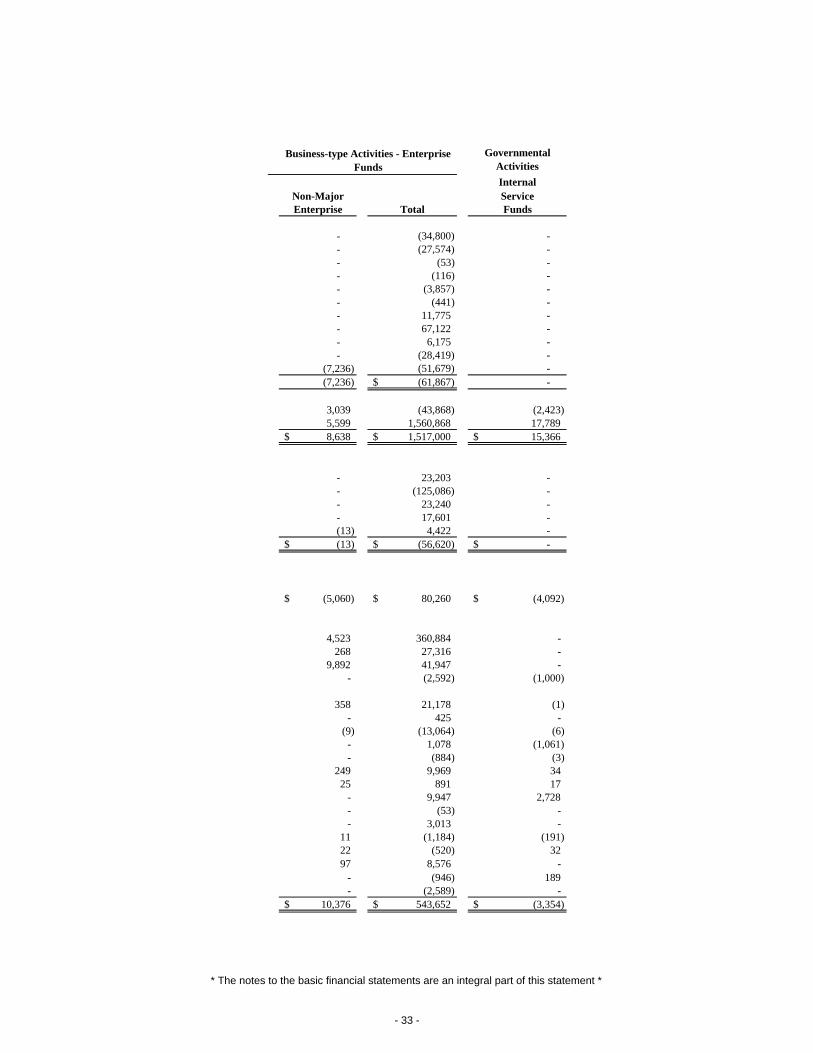
Governmental ActivitiesInternal
Non-Major ServiceEnterprise Total Funds
Business-type Activities - Enterprise Funds
- (34,800) - - (27,574) - - (53) - - (116) - - (3,857) - - (441) - - 11,775 - - 67,122 - - 6,175 - - (28,419) -
(7,236) (51,679) - (7,236) (61,867)$ -
3,039 (43,868) (2,423) 5,599 1,560,868 17,789 8,638$ 1,517,000$ 15,366$
- 23,203 - - (125,086) - - 23,240 - - 17,601 - (13) 4,422 - (13)$ (56,620)$ -$
(5,060)$ 80,260$ (4,092)$
4,523 360,884 - 268 27,316 -
9,892 41,947 - - (2,592) (1,000)
358 21,178 (1) - 425 -
(9) (13,064) (6) - 1,078 (1,061) - (884) (3)
249 9,969 34 25 891 17
- 9,947 2,728 - (53) - - 3,013 -
11 (1,184) (191) 22 (520) 32 97 8,576 -
- (946) 189 - (2,589) -
10,376$ 543,652$ (3,354)$
* The notes to the basic financial statements are an integral part of this statement *
- 33 -
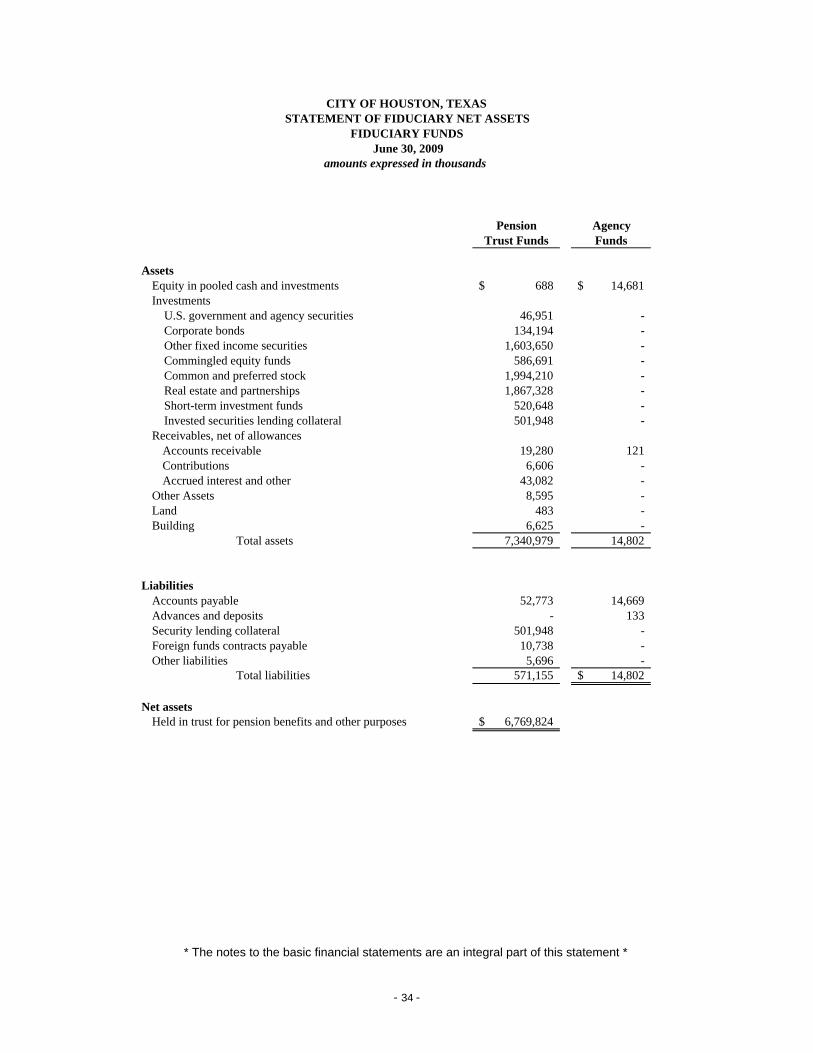
Pension AgencyTrust Funds Funds
AssetsEquity in pooled cash and investments 688$ 14,681$ Investments U.S. government and agency securities 46,951 - Corporate bonds 134,194 - Other fixed income securities 1,603,650 - Commingled equity funds 586,691 - Common and preferred stock 1,994,210 - Real estate and partnerships 1,867,328 - Short-term investment funds 520,648 - Invested securities lending collateral 501,948 - Receivables, net of allowances
Accounts receivable 19,280 121 Contributions 6,606 - Accrued interest and other 43,082 -
Other Assets 8,595 - Land 483 - Building 6,625 -
Total assets 7,340,979 14,802
LiabilitiesAccounts payable 52,773 14,669 Advances and deposits - 133 Security lending collateral 501,948 - Foreign funds contracts payable 10,738 - Other liabilities 5,696 -
Total liabilities 571,155 14,802$
Net assetsHeld in trust for pension benefits and other purposes 6,769,824$
CITY OF HOUSTON, TEXASSTATEMENT OF FIDUCIARY NET ASSETS
June 30, 2009FIDUCIARY FUNDS
amounts expressed in thousands
* The notes to the basic financial statements are an integral part of this statement *
- 34 -

2009AdditionsContributions:
City of Houston 215,870$ Plan members 74,826
Total Contributions 290,696 Investment earnings
Interest and dividends 187,716 Net decrease in the fair value of investments (1,831,337)
Total investment loss (1,643,621) Less investment expense (25,855)
Net investment loss (1,669,476) Total additions (1,378,780)
DeductionsBenefits 447,087 Refund of contributions 2,734 Administrative expense 21,065
Total deductions 470,886 Change in net assets (1,849,666)
Total net assets, July 1 8,619,490 Total net assets, June 30 6,769,824$
amounts expressed in thousands
CITY OF HOUSTON, TEXASSTATEMENT OF CHANGES IN FIDUCIARY NET ASSETS
FIDUCIARY FUNDS
For the Year Ended June 30, 2009PENSION TRUST FUNDS
* The notes to the basic financial statements are an integral part of this statement *
- 35 -

CITY OF HOUSTON, TEXAS
- 36 -

NOTE
S TO
THE
FIN
ANCI
AL S
TATE
MEN
TS

CITY OF HOUSTON, TEXAS NOTES TO THE BASIC FINANCIAL STATEMENTS
June 30, 2009
- 37 -
Note 1: Summary of Significant Accounting Policies ...................................................................................39
Note 2: Reconciliation of Government –Wide and Fund Financial Statements ............................................50
Note 3: Deposits and Investments..................................................................................................................53
Note 4: Allowance for Doubtful Accounts ....................................................................................................70
Note 5: Property Tax .....................................................................................................................................70
Note 6: Capital Assets ...................................................................................................................................71
Note 7: Short -Term Debt –Tax and Revenue Anticipation Notes ................................................................74
Note 8: Long -Term Liabilities ......................................................................................................................75
Note 9: Leases................................................................................................................................................93
Note 10: Pension Plans ....................................................................................................................................94
Note 11: Other Employee Benefits ..................................................................................................................97
Note 12: Interfund Transactions ....................................................................................................................100
Note 13: Commitments and Contingencies ...................................................................................................102
Note 14: Related Organization Transactions .................................................................................................105
Note 15: Conduit Debt Obligations ..............................................................................................................105
Note 16: Major Discretely Presented Component Units................................................................................106
Note 17: Subsequent Events ..........................................................................................................................114

CITY OF HOUSTON, TEXAS NOTES TO THE BASIC FINANCIAL STATEMENTS
June 30, 2009
- 38 -

CITY OF HOUSTON, TEXAS NOTES TO THE BASIC FINANCIAL STATEMENTS
June 30, 2009
- 39 -
NOTE 1: SUMMARY OF SIGNIFICANT ACCOUNTING POLICIES
The City of Houston, Texas ("City") was incorporated under the laws of the Republic of Texas in 1837 and again under the laws of the State of Texas in 1905. The City operates under a Home Rule Charter with a Mayor-Council form of government and provides the following services as authorized or required by its charter: public safety (police and fire), highways and streets, sanitation, water, airports, health services, culture-recreation, storm drainage, solid waste disposal, planning and inspection, civil defense, public improvements, and general administrative services, including pension and other benefits for its employees. The financial statements presented in this report conform to the reporting requirements of the Governmental Accounting Standards Board ("GASB"), which establishes combined statements as the required reporting level for governmental entities that present financial statements in accordance with generally accepted accounting principles. The significant accounting policies of the City are as follows: A. Principles Used in Determining the Reporting Entity for Financial Reporting Purposes The accompanying financial statements include financial statements for related organizations in accordance with GASB Statement No.14, The Financial Reporting Entity and GASB Statement No. 39, Determining Whether Certain Organizations are Component Units. Organizations are included if they are financially accountable to the City, or the nature and significance of their relationship with the City are such that exclusion would cause the financial statements to be misleading or incomplete. Inclusion is determined on the basis of the City’s ability to exercise significant influence. Significant influence or accountability is based primarily on its operational or financial relationship with the City (as distinct from legal relationship). The City is financially accountable if it appoints a voting majority of an organization’s governing body and is able to impose its will on that organization, or there is a potential for the organization to provide specific financial benefits to or impose specific financial burdens on the City. Blended component units (although legally separate entities) are, in substance, part of the City’s operations. Blended component units provide services exclusively or almost exclusively for the City. Both governmental and business-type discretely presented component units are reported in separate columns in the government-wide financial statements to emphasize their legal separateness from the City. B. Basis of Presentation - Financial Reporting Entity 1. Component Units Most component units of the City issue separately audited financial statements. Component units are reported in the City’s
Comprehensive Annual Financial Report (“CAFR”) as shown in the following tables. Additional information is available from the addresses shown.
There are three specific tests for determining whether a particular legally separate entity is a component unit of a primary government’s financial reporting entity. Those tests involve 1) appointment of the unit’s governing board (accompanied by either the potential imposition of will or ongoing financial benefit/burden), 2) fiscal dependence on the primary government, and 3) the potential that exclusion would result in misleading financial reporting. For this last test, special attention must be paid 1) to certain special financing authorities and 2) to the nature and significance of a legally separate, tax-exempt entity’s relationship with the primary government and its component units. Following are the City’s blended component units:
Blended Component Units Reported with the Primary Government
Brief Description of Activities, Relationship to the City and Key Inclusion Criteria
Houston Area Water Corporation 611 Walker, Suite 2100 Houston, TX 77002
The Corporation is organized for the purpose of: providing treated, potable water to the City of Houston for sale to customers located wholly or partially in Area Three of the Harris-Galveston Coastal Subsidence District, and; aiding and assisting the City of Houston in performing its obligations with respect to a regional groundwater reduction plan by, among other things, constructing, improving, equipping, repairing, operating and maintaining water treatment and distribution facilities and purchasing and selling water in connection therewith. The City appoints its Board and a financial benefit/burden relationship exists, allowing the city to impose its will. In addition, there is a fiscal dependency on the City. Reporting Fund: Business Type, Non-Major
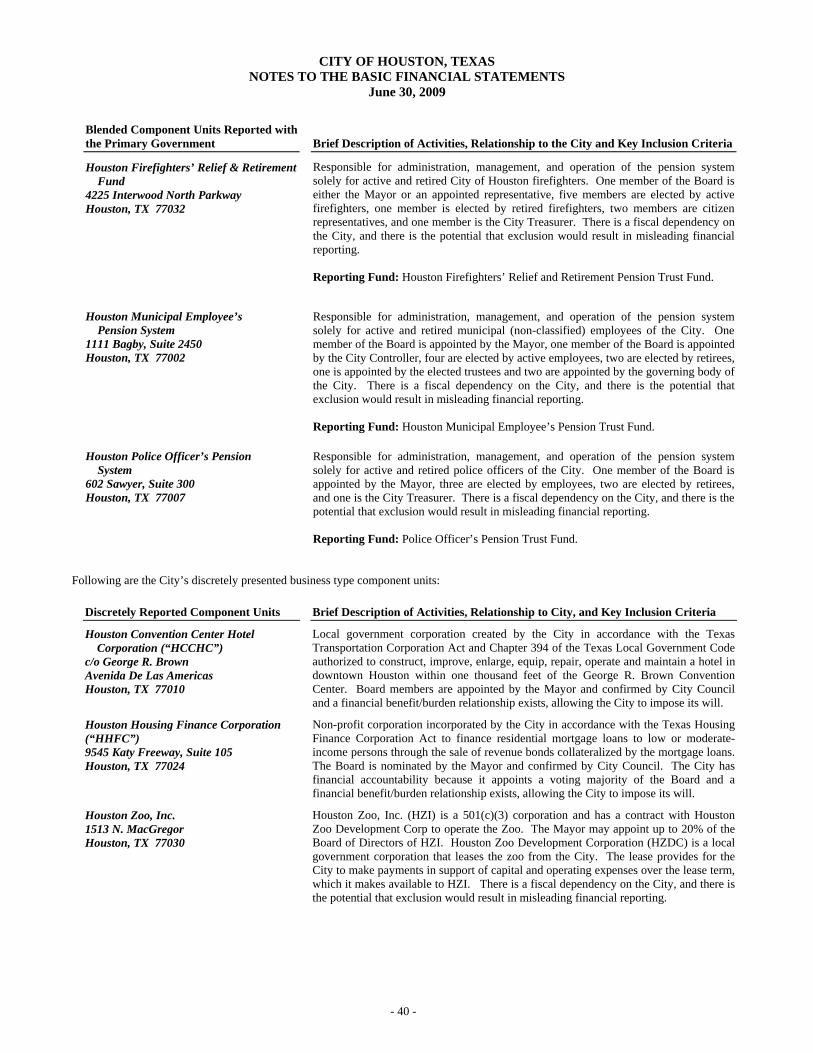
CITY OF HOUSTON, TEXAS NOTES TO THE BASIC FINANCIAL STATEMENTS
June 30, 2009
- 40 -
Blended Component Units Reported with the Primary Government
Brief Description of Activities, Relationship to the City and Key Inclusion Criteria
Houston Firefighters’ Relief & Retirement Fund 4225 Interwood North Parkway Houston, TX 77032
Responsible for administration, management, and operation of the pension system solely for active and retired City of Houston firefighters. One member of the Board is either the Mayor or an appointed representative, five members are elected by active firefighters, one member is elected by retired firefighters, two members are citizen representatives, and one member is the City Treasurer. There is a fiscal dependency on the City, and there is the potential that exclusion would result in misleading financial reporting. Reporting Fund: Houston Firefighters’ Relief and Retirement Pension Trust Fund.
Houston Municipal Employee’s Pension System 1111 Bagby, Suite 2450 Houston, TX 77002
Responsible for administration, management, and operation of the pension system solely for active and retired municipal (non-classified) employees of the City. One member of the Board is appointed by the Mayor, one member of the Board is appointed by the City Controller, four are elected by active employees, two are elected by retirees, one is appointed by the elected trustees and two are appointed by the governing body of the City. There is a fiscal dependency on the City, and there is the potential that exclusion would result in misleading financial reporting. Reporting Fund: Houston Municipal Employee’s Pension Trust Fund.
Houston Police Officer’s Pension System 602 Sawyer, Suite 300 Houston, TX 77007
Responsible for administration, management, and operation of the pension system solely for active and retired police officers of the City. One member of the Board is appointed by the Mayor, three are elected by employees, two are elected by retirees, and one is the City Treasurer. There is a fiscal dependency on the City, and there is the potential that exclusion would result in misleading financial reporting. Reporting Fund: Police Officer’s Pension Trust Fund.
Following are the City’s discretely presented business type component units:
Discretely Reported Component Units Brief Description of Activities, Relationship to City, and Key Inclusion Criteria
Houston Convention Center Hotel Corporation (“HCCHC”) c/o George R. Brown Avenida De Las Americas Houston, TX 77010
Local government corporation created by the City in accordance with the Texas Transportation Corporation Act and Chapter 394 of the Texas Local Government Code authorized to construct, improve, enlarge, equip, repair, operate and maintain a hotel in downtown Houston within one thousand feet of the George R. Brown Convention Center. Board members are appointed by the Mayor and confirmed by City Council and a financial benefit/burden relationship exists, allowing the City to impose its will.
Houston Housing Finance Corporation (“HHFC”) 9545 Katy Freeway, Suite 105 Houston, TX 77024
Non-profit corporation incorporated by the City in accordance with the Texas Housing Finance Corporation Act to finance residential mortgage loans to low or moderate-income persons through the sale of revenue bonds collateralized by the mortgage loans. The Board is nominated by the Mayor and confirmed by City Council. The City has financial accountability because it appoints a voting majority of the Board and a financial benefit/burden relationship exists, allowing the City to impose its will.
Houston Zoo, Inc. 1513 N. MacGregor Houston, TX 77030
Houston Zoo, Inc. (HZI) is a 501(c)(3) corporation and has a contract with Houston Zoo Development Corp to operate the Zoo. The Mayor may appoint up to 20% of the Board of Directors of HZI. Houston Zoo Development Corporation (HZDC) is a local government corporation that leases the zoo from the City. The lease provides for the City to make payments in support of capital and operating expenses over the lease term, which it makes available to HZI. There is a fiscal dependency on the City, and there is the potential that exclusion would result in misleading financial reporting.
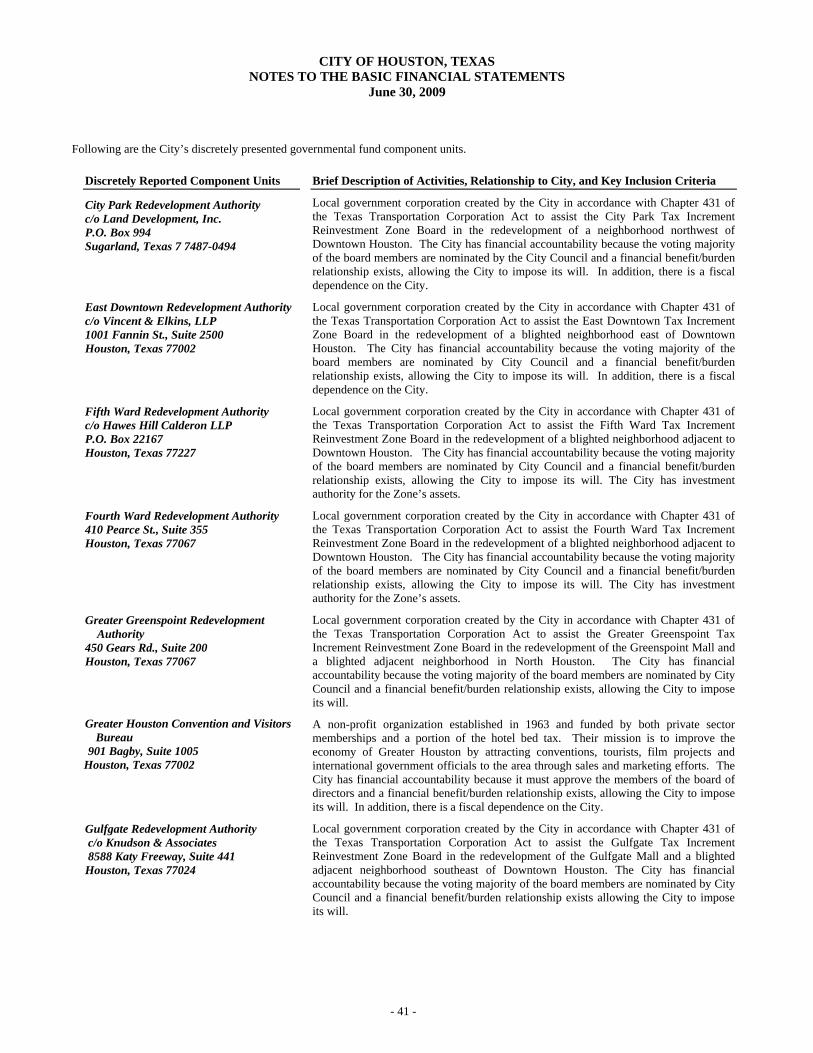
CITY OF HOUSTON, TEXAS NOTES TO THE BASIC FINANCIAL STATEMENTS
June 30, 2009
- 41 -
Following are the City’s discretely presented governmental fund component units. Discretely Reported Component Units Brief Description of Activities, Relationship to City, and Key Inclusion Criteria
City Park Redevelopment Authority c/o Land Development, Inc. P.O. Box 994 Sugarland, Texas 7 7487-0494
Local government corporation created by the City in accordance with Chapter 431 of the Texas Transportation Corporation Act to assist the City Park Tax Increment Reinvestment Zone Board in the redevelopment of a neighborhood northwest of Downtown Houston. The City has financial accountability because the voting majority of the board members are nominated by the City Council and a financial benefit/burden relationship exists, allowing the City to impose its will. In addition, there is a fiscal dependence on the City.
East Downtown Redevelopment Authority c/o Vincent & Elkins, LLP 1001 Fannin St., Suite 2500 Houston, Texas 77002
Local government corporation created by the City in accordance with Chapter 431 of the Texas Transportation Corporation Act to assist the East Downtown Tax Increment Zone Board in the redevelopment of a blighted neighborhood east of Downtown Houston. The City has financial accountability because the voting majority of the board members are nominated by City Council and a financial benefit/burden relationship exists, allowing the City to impose its will. In addition, there is a fiscal dependence on the City.
Fifth Ward Redevelopment Authority c/o Hawes Hill Calderon LLP P.O. Box 22167 Houston, Texas 77227
Local government corporation created by the City in accordance with Chapter 431 of the Texas Transportation Corporation Act to assist the Fifth Ward Tax Increment Reinvestment Zone Board in the redevelopment of a blighted neighborhood adjacent to Downtown Houston. The City has financial accountability because the voting majority of the board members are nominated by City Council and a financial benefit/burden relationship exists, allowing the City to impose its will. The City has investment authority for the Zone’s assets.
Fourth Ward Redevelopment Authority 410 Pearce St., Suite 355 Houston, Texas 77067
Local government corporation created by the City in accordance with Chapter 431 of the Texas Transportation Corporation Act to assist the Fourth Ward Tax Increment Reinvestment Zone Board in the redevelopment of a blighted neighborhood adjacent to Downtown Houston. The City has financial accountability because the voting majority of the board members are nominated by City Council and a financial benefit/burden relationship exists, allowing the City to impose its will. The City has investment authority for the Zone’s assets.
Greater Greenspoint Redevelopment Authority 450 Gears Rd., Suite 200 Houston, Texas 77067
Local government corporation created by the City in accordance with Chapter 431 of the Texas Transportation Corporation Act to assist the Greater Greenspoint Tax Increment Reinvestment Zone Board in the redevelopment of the Greenspoint Mall and a blighted adjacent neighborhood in North Houston. The City has financial accountability because the voting majority of the board members are nominated by City Council and a financial benefit/burden relationship exists, allowing the City to impose its will.
Greater Houston Convention and Visitors Bureau
901 Bagby, Suite 1005 Houston, Texas 77002
A non-profit organization established in 1963 and funded by both private sector memberships and a portion of the hotel bed tax. Their mission is to improve the economy of Greater Houston by attracting conventions, tourists, film projects and international government officials to the area through sales and marketing efforts. The City has financial accountability because it must approve the members of the board of directors and a financial benefit/burden relationship exists, allowing the City to impose its will. In addition, there is a fiscal dependence on the City.
Gulfgate Redevelopment Authority c/o Knudson & Associates 8588 Katy Freeway, Suite 441 Houston, Texas 77024
Local government corporation created by the City in accordance with Chapter 431 of the Texas Transportation Corporation Act to assist the Gulfgate Tax Increment Reinvestment Zone Board in the redevelopment of the Gulfgate Mall and a blighted adjacent neighborhood southeast of Downtown Houston. The City has financial accountability because the voting majority of the board members are nominated by City Council and a financial benefit/burden relationship exists allowing the City to impose its will.

CITY OF HOUSTON, TEXAS NOTES TO THE BASIC FINANCIAL STATEMENTS
June 30, 2009
- 42 -
Discretely Reported Component Units Brief Description of Activities, Relationship to City, and Key Inclusion Criteria
HALAN – Houston Area Library Automated Network Board Houston Central Library 500 McKinney Houston, TX 77002
Provides review and guidance to the operation, funding and development of the Houston Area Library Automated Network, which provides library services to Houston and surrounding communities. Three members are appointed by City Council, two by the County, and one elected by the smaller libraries. The City does not appoint a voting majority, but is financially accountable for this organization because HALAN is fiscally dependent on the City for revenues, allowing the City the ability to impose its will.
Houston Arts Alliance 3201 Allen Parkway, Suite 250 Houston, TX 77019
Non-profit organization that is the officially designated arts agency of the City. The City does not appoint a voting majority, but is financially accountable because the alliance is fiscally dependent on the revenues provided from a portion of hotel occupancy tax, which is levied by the City. This fiscal dependency allows the City to impose its will.
Houston Business Development, Inc. 5330 Griggs Road Houston, Texas 77021
A non-profit organization established by the City of Houston in 1986, providing loans and management counseling to small and emerging businesses, and encouraging the expansion of commercial and industrial enterprises. The City has financial accountability because the voting majority of the board members are appointed by City Council and the operations provide financial benefits to the City. Its primary source of funding is through community Development Block Grants and there is the potential that exclusion would result in misleading financial reporting.
Houston Downtown Park Corporation 2217 Welch Houston, TX 77019
Local government corporation created by the City in 2004 in accordance with Chapter 431 of the Texas Transportation Corporation Act to aid and act on behalf of the City to accomplish the City’s governmental purpose of providing for the acquisition, development, operation, and maintenance of a new public park, open space and related amenities and facilities to provide recreational, educational and tourism opportunities within, and beautification of the Central Business District of the City. Additionally, the corporation maintains an enterprise fund to account for the activities of the Discovery Green Parking Garage. Board members are appointed by the City and a financial benefit/burden relationship exists, allowing the City to impose its will. There is the potential that exclusion would result in misleading financial reporting.
Houston Parks Board, Inc. 2001 Kirby Dr., Suite 814 Houston, Texas 77019
Solicits and manages funds raised privately for park acquisitions and improvements on behalf of Houston Parks Board LGC., Inc., which provide a direct benefit to the City. Board members are nominated by the Mayor and confirmed by City Council, allowing the City to impose its will. Upon dissolution, all assets revert to the City. There is a potential that exclusion would result in misleading financial reporting.
Houston Parks Board LGC., Inc. 300 North Post Oak Lane Houston, Texas 77024
Solicits and manages funds raised privately for park acquisitions and advises the Mayor and City Council on park acquisitions and improvements, which provide a direct benefit to the City. Board members are nominated by the Mayor and confirmed by City Council, allowing the City to impose its will. Upon dissolution, all assets revert to the City. There is a potential that exclusion would result in misleading financial reporting.
Houston Public Library Foundation (formerly Houston Library Board) Houston Central Library 500 McKinney Houston, TX 77002
Solicits and manages funds raised privately for library improvements. Advises the Mayor and City Council on additions and improvements to the library system that provide a direct benefit to the City. Board members are nominated by the Mayor and confirmed by City Council, allowing the City to impose its will. There is a potential that exclusion would result in misleading financial reporting.
Lamar Terrace Public Improvement District City of Houston Box 1562 Houston, Texas 77251
Special district organized under state statute to redevelop a blighted neighborhood in Southwest Houston. The City has financial accountability because the voting majority of the board members are nominated by City Council and the operations provide financial benefits to the City, allowing the City to impose its will.

CITY OF HOUSTON, TEXAS NOTES TO THE BASIC FINANCIAL STATEMENTS
June 30, 2009
- 43 -
Discretely Reported Component Units Brief Description of Activities, Relationship to City, and Key Inclusion Criteria
Land Assemblage Redevelopment Authority
City of Houston Box 1562 Houston, Texas 77251
The Land Assemblage Redevelopment Authority (LARA) is a 13-member board appointed by the Mayor, City Council, Harris County and the Houston Independent School District. The LARA Authority is organized for the purpose of aiding, assisting and acting on behalf of the City in the performance of its governmental functions to promote the common good and general welfare of the City and in undertaking and completing one or more projects, as may be defined or determined by the City Council of the City. The City has financial accountability because the voting majority of the board members are nominated by City Council, allowing the City to impose its will, and the operations provide financial benefits to the City.
Main Street Market Square Redevelopment Authority
410 Pierce St., Suite 355 Houston, Texas 77002
Local government corporation created by the City in accordance with Chapter 431 of the Texas Transportation Corporation Act to assist the Main St./Market Square Tax Increment Reinvestment Zone Board in the redevelopment of Downtown Houston. The City has financial accountability because the voting majority of the board members are nominated by City Council and the operations provide financial benefits to the City.
Memorial City Redevelopment Authority c/o Knudson & Associates 8588 Katy Freeway, Suite 441 Houston, Texas 77024
Local government corporation created by the City in accordance with Chapter 431 of the Texas Transportation Corporation Act to assist the Memorial City Tax Increment Reinvestment Zone Board in the redevelopment of the Memorial City Mall and Town & Country Mall areas west of Downtown Houston. The City has financial accountability because the voting majority of the board members are nominated by City Council and the operations provide financial benefits to the City.
Memorial-Heights Redevelopment Authority
c/o Vincent & Elkins, LLP 1001 Fannin St., Suite 2500 Houston, Texas 77002
Local government corporation created by the City in accordance with Chapter 431 of the Texas Transportation Corporation Act to assist the Memorial Heights Tax Increment Reinvestment Zone Board in the redevelopment of a blighted neighborhood adjacent to Downtown Houston. The City has financial accountability because the voting majority of the board members are nominated by City Council and the operations provide financial benefits to the City.
Midtown Redevelopment Authority 410 Pierce Houston, Texas 77002
Local government corporation created by the City in accordance with Chapter 431 of the Texas Transportation Corporation Act to assist the Midtown Tax Increment Reinvestment Zone Board in the redevelopment of a blighted neighborhood south of Downtown Houston. The City has financial accountability because the voting majority of the board members are nominated by City Council and the operations provide financial benefits to the City.
Miller Theatre Advisory Board, Inc. 100 Concert Drive Houston, Texas 77030-1702
Miller Theatre Advisory Board, Inc. (the Board) is a Texas nonprofit corporation with the primary objective to advance the educational and cultural interests of the people of Houston through a continuing program of artistic, educational, and cultural events at the Miller Outdoor Theatre which is owned by the City of Houston. This is accomplished by various artistic and performing groups providing programs at the Theatre supported by grants awarded by the Board. The City has financial accountability because the directors are appointed by the mayor of the City of Houston and approved by City Council, and its primary source of funding is from Hotel Occupancy taxes which the Board receives from the City through the Houston Arts Alliance.
Old Sixth Ward Redevelopment Authority c/o Land Development, Inc. P.O. Box 994 Sugar Land, Texas 77487
Local government corporation created by the City in accordance with Chapter 431 of the Texas Transportation Corporation Act to assist the Old Sixth Ward Tax Increment Reinvestment Zone Board in the redevelopment of a neighborhood adjacent to Downtown Houston. The City has financial accountability because the voting majority of the board members are nominated by City Council, the operations provide financial benefits to the City, and the City has investment authority for the Zone’s assets.
OST/Almeda Corridors Redevelopment Authority
5445Almeda Suite 545 Houston, Texas 77004
Local government corporation created by the City in accordance with Chapter 431 of the Texas Transportation Corporation Act to assist the OST/Almeda Corridors Tax Increment Reinvestment Zone Board in the redevelopment of a blighted neighborhood south of Downtown Houston. The City has financial accountability because the voting majority of the board members are nominated by City Council and the operations provide financial benefits to the City.

CITY OF HOUSTON, TEXAS NOTES TO THE BASIC FINANCIAL STATEMENTS
June 30, 2009
- 44 -
Discretely Reported Component Units Brief Description of Activities, Relationship to City, and Key Inclusion Criteria
Saint George Place Redevelopment Authority
c/o Hawes Hill Calderon LLP P.O. Box 22167 Houston, Texas 77227-2167
Local government corporation created by the City in accordance with Chapter 431 of the Texas Transportation Corporation Act to assist the St. George Place Tax Increment Reinvestment Zone Board in the redevelopment of a blighted neighborhood in southwest Houston. The City has financial accountability because the voting majority of the board members are nominated by City Council. The operations provide financial benefits to the City and the City has investment authority for the Zone’s assets.
South Post Oak Redevelopment Authority c/o Knudson & Associates 8588 Katy Frwy. Houston, Texas 77024
Local government corporation created by the City in accordance with Chapter 431 of the Texas Transportation Corporation Act to assist the South Post Oak Tax Increment Reinvestment Zone Board in the development of an affordable housing project in Southwest Houston. The City has financial accountability because the voting majority of the board members are nominated by City Council, and the operations provide financial benefits to the City.
Southwest Houston Redevelopment Authority c/o Hawes Hill Calderon LLP P.O. Box 22167 Houston, Texas 77227-2167
Local government corporation created by the City in accordance with Chapter 431 of the Texas Transportation Corporation Act to assist the Southwest Houston Tax Increment Reinvestment Zone Board in the redevelopment of the Sharpstown Mall and adjacent neighborhoods southwest of Downtown Houston. The City has financial accountability because the voting majority of the board members are nominated by City Council and the operations provide financial benefits to the City.
Upper Kirby Redevelopment Authority 3015 Richmond Avenue, Suite 200 Houston, Texas 77098-3114
Local government corporation created by the City in accordance with Chapter 431 of the Texas Transportation Corporation Act to assist the Upper Kirby Tax Increment Reinvestment Zone Board in the redevelopment of a neighborhood west of Downtown Houston. The City has financial accountability because the voting majority of the board members are nominated by City Council and the operations provide financial benefits to the City.
Uptown Development Authority 1980 Post Oak Blvd., Suite 1580 Houston, Texas 77056
Local government corporation created by the City in accordance with Chapter 431 of the Texas Transportation Corporation Act to assist the Uptown Tax Increment Reinvestment Zone Board in the redevelopment of the Galleria Mall area, west of Downtown Houston. The City has financial accountability because the voting majority of the board members are nominated by City Council and the operations provide financial benefits to the City.
2. Related Organizations
The following entities are related organizations to which the City appoints board members but for which the City has no significant financial accountability. Some of these organizations are Access Houston Cable Corporation, Coastal Water Authority, Employees Deferred Compensation Plan, Harris County–Houston Sports Authority, Metropolitan Transit Authority of Harris County, Houston Clean City Commission, and the Miller Theater Advisory Council. All transactions with these related organizations are conducted in the ordinary course of business. Further financial information is available from the respective organizations.
C. Basis of Presentation – Government-wide and Fund Financial Statements
The government-wide financial statements (i.e., the statement of net assets and the statement of changes in net assets) report information on all of the nonfiduciary activities of the primary government and its component units. For the most part, the effect of interfund activity has been removed from these statements. Governmental activities, which normally are supported by taxes and intergovernmental revenues, are reported separately from business-type activities, which rely to a significant extent on fees and charges for support. Likewise, the primary government is reported separately from certain legally separate component units for which the primary government is financially accountable. The statement of activities demonstrates the degree to which the direct expense of a given function or segment are offset by program revenues. Direct expenses are those that are clearly identifiable with a specific function or segment. Program revenues include 1) charges to customers or applicants who purchase, use, or directly benefit from goods, services, or privileges provided by a given function or segment and 2) grants and contributions that are restricted to meeting the operational or capital requirements of a particular function or segment. Taxes and other items not included among program revenues are reported instead as general revenues.
CITY OF HOUSTON, TEXAS NOTES TO THE BASIC FINANCIAL STATEMENTS
June 30, 2009
- 45 -
Separate financial statements are provided for governmental funds, proprietary funds, and fiduciary funds, even though the latter are excluded from the government-wide financial statements. Major individual governmental funds and major individual enterprise funds are reported as separate columns in the fund financial statements. The accounts of the City are organized on the basis of funds, each of which is accounted for with a separate set of self-balancing accounts that comprise its assets, liabilities, fund balance/retained earnings, revenues, and expenditures/expenses. Government resources are allocated to and accounted for in individual funds for the purpose of carrying on specific activities in accordance with special regulations, restrictions, or limitations. The type and purpose of funds is described below.
Fund Accounting
1. The City reports the following major governmental funds:
(a) General Fund - is the principal operating fund of the City and is used to account for all financial resources except those
required to be accounted for in another fund. (b) Debt Service Fund - is used to account for the accumulation of resources for, and the payment of principal, interest, and
related costs of tax supported debt. (c) Capital Projects Fund - is used to account for financial resources to be used for the acquisition or construction of major
capital facilities (other than those financed by proprietary funds and trust funds). Such resources are derived principally from proceeds of public improvement bonds and from special assessments.
(d) Grants Fund - The Grants Fund is used to account for grant resources received from various local, state and national
agencies and organizations. The use of these resources is restricted to a particular function of the City by each grantor. 2. The City reports the following major enterprise funds:
(a) Airport System Fund - is used to account for the operations of the City’s Airport System. The system is comprised of
George Bush Intercontinental Airport, William P. Hobby Airport, and Ellington Airport. (b) Convention and Entertainment Facilities Fund - is used to account for the operations of the City’s major entertainment
facilities, outdoor venues, and parking garages and surface lots. These assets include, but are not limited to, the following: George R. Brown Convention Center, Gus S. Wortham Center, Jesse H. Jones Hall, Houston Center for the Arts, Talento Bilingue de Houston, Jones Plaza, and Theater District parking garages.
(c) Combined Utility System Fund – is used to account for the production and transmission of water and the treatment of
wastewater for City residents and businesses as well as for other governmental entities located in the Houston area.
3. The City reports the following additional funds:
(a) Nonmajor Special Revenue Funds - are used to account for the proceeds of specific revenue sources (other than major capital projects) that are legally restricted to expenditures for specific purposes.
(b) Nonmajor Enterprise Funds – HAWC – is used to account for the cost to provide treated, potable water to the City of
Houston for sale to customers. Parking Management – This fund was created to manage parking facilities within the City of Houston.
(c) Internal Service Funds - are used to account for the financing of goods or services provided by one department to other
departments of the City on a cost-reimbursement basis.
(d) Fiduciary Fund Types - Trust and Agency Funds are used to account for assets held by the City in a trustee capacity or as an agent for individuals, private organizations, other governmental units and other funds. These include the following: (1) Pension Trust Funds - are used to account for the assets held in trust for the members and beneficiaries of the City’s
three defined benefit pension plans. (2) Agency Funds - are custodial in nature and do not involve measurement of results of operations.
CITY OF HOUSTON, TEXAS NOTES TO THE BASIC FINANCIAL STATEMENTS
June 30, 2009
- 46 -
D. Measurement Focus and Basis of Accounting
The government-wide financial statements display information about the City of Houston as a whole. Government-wide statements exclude both fiduciary funds and fiduciary component units. The statement of net assets and the statement of activities are prepared using the economic resources measurement focus and the accrual basis of accounting. Revenues, expenses, gains, losses, assets, and liabilities resulting from exchange and exchange-like transactions are recognized when the exchange takes place, regardless of the timing of related cash flows. Revenues, expenses, gains, losses, assets and liabilities resulting from non-exchange transactions are recognized in accordance with Statement of Government Accounting Standards No. 33, Accounting and Financial Reporting for Nonexchange Transactions. Program revenues include (1) amounts received from those who purchase, use, or directly benefit from a program, (2) amounts received from parties outside the City of Houston’s citizenry that are restricted to one or more specific programs and (3) earnings on investments that are legally restricted for a specific program. Program revenue is divided into three categories: (1) charges for services, (2) operating grants and contributions and (3) capital grants and contributions. All governmental funds are accounted for using the current financial resources measurement focus. This means that only current assets and current liabilities are generally included on their balance sheets. Their reported fund balances (net current assets) are considered a measure of "available spendable resources." Governmental fund operating statements present increases (revenues and other financing sources) and decreases (expenditures and other financing uses) in net current assets. Accordingly, they are said to present a summary of sources and uses of "available spendable resources" during a period. Non-current portions of certain long-term receivables, primarily property taxes and special assessments, are reported on the balance sheets of governmental funds in spite of their spending measurement focus. Special reporting treatments are used to indicate that they should not be considered "available spendable resources," since they do not represent net current assets. Recognition of governmental fund revenues represented by noncurrent receivables is deferred until they become current receivables. Because of their spending measurement focus, expenditure recognition for governmental fund types is limited to exclude amounts represented by non-current liabilities. Since they do not affect net current assets, such long-term amounts are not recognized as governmental fund type expenditures or fund liabilities. Proprietary funds and pension trust funds of the primary government and blended Component Units are accounted for on a cost of services or "economic resources" measurement focus. This means that all assets and all liabilities (whether current or noncurrent) associated with their activity are included on their balance sheets. In accordance with GASB Statement No. 20, the City has elected to follow all Financial Accounting Standards Board (FASB) pronouncements issued prior to November 30, 1989, unless those pronouncements conflict with or contradict GASB pronouncements. The City has elected not to follow FASB pronouncements issued subsequent to that date. All proprietary funds define operating revenues and expenses consistent with the precepts of Statement of Government Accounting Standards No. 9 paragraphs 16 – 19 and 31: cash receipts from customers, cash receipts from interfund services provided and used with other funds and other operating cash receipts. All other revenue or expenses recognized is non-operating. Basis of accounting refers to when revenues and expenditures or expenses are recognized in the accounts and reported in the financial statements, regardless of the measurement focus applied. All governmental funds use the modified accrual basis of accounting. Under the modified accrual basis of accounting, revenues are recorded when susceptible to accrual; i.e., both measurable and available. Available means collectible within the current period or soon enough thereafter to pay current liabilities. The City considers receivables collected within sixty days after year-end to be available and recognizes them as revenues of the current period. Expenditures are recognized under the modified accrual basis of accounting in the accounting period in which the fund liability is incurred, if measurable. Claims, judgments and compensated absences are recognized when matured. The following types of revenues are susceptible to accrual under the modified accrual basis of accounting: delinquent property taxes (including penalty and interest); services billed to other funds; sales tax; mixed beverage tax; franchise fees; fines and forfeits; ambulance receipts; and investment earnings. Intergovernmental revenue from reimbursable grants and capital projects is recognized when the related expenditure is incurred. All proprietary and pension trust funds use the full accrual basis of accounting. Their revenues are recognized when they are earned, and their expenses and related liabilities, including claims, judgments, and compensated absences, are recognized when they are incurred. When restricted and unrestricted resources are available to cover expenses, unrestricted resources are first applied. Administrative overhead charges are included in direct program expenses.
CITY OF HOUSTON, TEXAS NOTES TO THE BASIC FINANCIAL STATEMENTS
June 30, 2009
- 47 -
E. Assets, Liabilities, and Fund Equity
1. Deposits and Investments The City’s investment policy requires all deposits to be fully collateralized with depository insurance; obligations of the United States of America or its agencies and instrumentalities (excluding those mortgage backed securities prohibited by the Public Funds Investment Act); or in any other manner and amount provided by law for the deposits of the City. At all times, such securities should have a fair value of not less than 102% of the amount of the deposits collateralized thereby, adjusted by the amount of applicable depository insurance. Substantially all cash, except for imprest accounts, is deposited with financial institutions in interest bearing accounts or is invested. The majority of the City's cash and investments are administered using a pooled concept, which combines the monies of various funds for investment purposes. Interest earnings of the pool are apportioned to each fund, unless otherwise required by bond covenants, based on the fund’s relative share of the investment pool. All cash and investments are displayed on the statement of net assets as "Equity in pooled cash and investments" and in accordance with GASB Statement No. 31 Accounting and Financial Reporting for Certain Investments and for External Investment Pools, are carried at fair value. The blended and discretely presented component units separately invest their funds and report investments pursuant to their respective investment policies described in their separately audited financial statements at their fair values. Investments authorized by the City’s investment policy, which is guided by state laws and city ordinances, generally include: obligations of the United States of America or its agencies and instrumentalities; fully-collateralized Certificates of Deposit from City Council-approved public depositories; direct obligations of the State of Texas or its agencies and instrumentalities; other obligations, the principal and interest of which are unconditionally guaranteed or insured by, or backed by the full faith and credit of, the State of Texas or the United States or their respective agencies and instrumentalities; obligations of states, agencies, counties, cities, and other political subdivisions; no-load money market mutual funds registered and regulated by the Securities and Exchange Commission; corporate commercial paper; fully collateralized repurchase agreements; and reverse repurchase agreements within specific terms. Investments are carried at fair value based on quoted market prices.
2. Inventories of Materials and Supplies With the exception of fuel, inventories are carried at the average cost in government-wide, proprietary and governmental funds. Inventories are presented under the consumption method. These inventories include: automobile parts, chemical and medical supplies, uniforms and their accessories, vaccines and office supplies. Fuel is carried at market/replacement cost.
3. Capital Assets
a. Governmental Funds - Property, Plant, Equipment, and Infrastructure Asset valuation is based on historical costs or estimated historical costs, if original costs are not available. Capital assets are not capitalized in the funds used to acquire or construct them. Instead, capital acquisition and construction are reflected as expenditures in governmental funds. Capital Assets, which include land; building and improvements; improvements other than buildings, machinery and equipment; construction in progress; and infrastructure (e.g. storm drainage, streets and bridges), are reported in the applicable governmental and business-type activities columns in the government-wide financial statements. These capital assets include the estimated historical cost of infrastructure acquired prior to fiscal year 1981. Capital assets are defined by the government as assets with an initial cost of more than $5,000 (amount not rounded) and an estimated useful life in excess of four years. Such assets are recorded at historical cost or estimated historical if purchased or constructed. Donated capital assets are recorded at estimated fair market value at the date of donation. The cost of normal maintenance and repairs that do not add to the value of the asset or materially extend assets lives are not capitalized. Major outlays for capital assets and improvements are capitalized as projects are constructed. Interest incurred during the construction phase of capital assets of business-type activities is included as a part of the capitalized value of the assets constructed.
CITY OF HOUSTON, TEXAS NOTES TO THE BASIC FINANCIAL STATEMENTS
June 30, 2009
- 48 -
Buildings and improvements (improvements other than buildings, machinery and equipment and infrastructure) are depreciated using the straight-line method over the following estimated useful lives:
Assets Useful Life Buildings and improvements Range from 20 to 45 years Improvements other than buildings Range from 15 to 30 years Machinery Range from 7 to 15 years Equipment Range from 3 to 20 years Storm drainage 50 years Streets Range from 6 to 50 years Bridges Range from 20 to 50 years
b. Enterprise Funds – Property, Plant and Equipment
Property, plant, and equipment owned by the Enterprise Funds are stated at cost or estimated historical cost if original cost is not available. Construction costs (excluding land and equipment) are added to construction work-in-progress until the assets are substantially complete. At that point, the project is moved to the appropriate asset category and depreciation begins. Depreciation on equipment begins in the year of acquisition. Land and equipment costs are added to the capital asset base in the year of acquisition. Interest costs on funds borrowed to finance the construction of property, plant and equipment of the enterprise funds are capitalized when the costs materially exceed interest earnings on related revenue bond proceeds. For fiscal year 2009, the capitalized interest cost for the Airport System Facilities was $10 million, Combined Utility System Fund was $13.2 million and Convention & Entertainment Facilities Fund was $ -0- million. Depreciation is computed using the straight-line method on the composite asset base over the estimated useful lives as follows:
Assets Years
Airport System Facilities 4-45 Convention & Entertainment Facilities 4-45 Combined Utility System Facilities 5-50
Water rights and conveyance system rights of the Combined Utility System Fund, and Garage rights of the Convention and Entertainment fund are amortized over the life of the related contracts. These rights are reported as capital assets.
4. Bond Discounts and Issuance Costs
Bond premiums, discounts and issuance costs in Enterprise Funds are amortized over the term of the bonds using the effective interest method. Gains or losses on Enterprise Fund refundings are amortized over the term of the lesser of the new bonds or the refunded bonds using the effective interest method.
5. Fund Balance
a. Reserve - Indicates that portion of a fund balance that has been legally segregated (e.g., by bond ordinance) for specific
purposes.
b. Designated Fund Balance - Indicates that portion of a fund balance for which the City has made tentative plans.
c. Undesignated Fund Balance - Indicates that portion of a fund balance that is available for appropriation in future periods. F. Transfers, Revenues, Expenditures and Expenses
1. Interfund Transactions A description of the four basic types of interfund transactions and the related accounting policies are as follows: a. Loans are reported as receivables and payables as appropriate.
b. Charges for services are reported as revenues for the performing fund and expenditures of the requesting fund.
c. Transactions to reimburse a fund for expenditures made by it for the benefit of another fund are recorded as expenditures or
expenses in the reimbursing fund and as a reduction of expenditures or expenses in the fund that is reimbursed.

CITY OF HOUSTON, TEXAS NOTES TO THE BASIC FINANCIAL STATEMENTS
June 30, 2009
- 49 -
d. All other interfund transfers, such as legally authorized transfers from a fund receiving revenue to the fund through which the resources are to be expended, are transfers. Transfers are classified as other financing sources or uses (or transfers for proprietary funds) in the Statement of Revenues, Expenditures (or expenses) and Changes in Fund Balances (or net assets). For reporting at the government-wide statements level, the City of Houston eliminates direct interfund charges for services and the balances created within the same fund categories (i.e. governmental vs. business-type). This process ensures neither business-type nor governmental funds report direct internal revenue/expenditures. Interfund activity and balances resulting from transactions with the fiduciary funds are not eliminated. Instead the fiduciary interfund activity and balances are treated as transactions with an external party. Interfund activity with discretely presented component units are handled in the same manner as fiduciary interfund activity balances. However, the discretely presented balances are reported on a separate line of the Statement of Net Assets. The Internal Service Fund is essentially a clearing account for income, expenses, assets and liabilities of the City’s health benefits and long-term disability programs.
2. Compensated Absences
Full-time civilian employees of the City are eligible for 10 days of vacation leave per year. After four years, employees receive 15 days. The amount of vacation time gradually increases after that, reaching a maximum of 25 days per year after 18 years of service. Employees may accumulate up to 90 days of vacation leave (45 days for employees hired after December 31, 1999). Upon termination or retirement, employees are paid for unused vacation leave based on the average rate of pay during the employee’s highest paid 60 days of employment. Part-time employees (those working less than 30 hours per week) are not eligible for vacation leave benefits. Firefighters accrue 15 to 22 days of vacation annually, based upon years of service. Police officers participate in a paid time off program that combines sick and vacation leave. Officers enter the program upon completion of their probationary period and then accrue 15 to 40 days annually, based upon years of service. The majority of full-time civilian employees and firefighters are covered under the compensatory sick leave plan and receive a leave time allowance of 2.5 hours per payroll period (bi-weekly) up to a maximum of 65 hours per year. Employees who use fewer than 65 hours during the benefit year will receive a match of additional hours equal to the number of hours accrued minus the number of hours used. Once an employee’s balance has reached 1,040 hours, no additional match for unused hours is given. Upon termination, all unused sick leave time allowances in excess of 1,040 hours are payable to the employee at the employee’s rate of pay at the time of termination. An employee who uses less than 16 hours of sick leave in any benefit year receives up to three days of personal leave in the next year. Personal leave may be used in place of vacation leave, but will not accumulate and will not be paid out at termination. The balance of full time civilian employees and firefighters are covered by a sick plan that was closed to employees in 1985. That plan accumulates a cash value for every sick day not used, which is payable upon resignation or retirement. As noted above, classified police officers are covered by a paid time off plan. The City also has adopted policies of compensatory time to comply with the Fair Labor Standards Act as amended in 1985. These policies provide limits to the accumulation of compensatory time and also provide that time not used will be paid in cash. Only classified employees and civilian employees in certain pay grades routinely earn compensatory time. To the extent that the City’s obligation is attributable to employees’ services already rendered and it is probable that the City will compensate the employees for the benefits through paid time off or some other means, vacation and compensatory time benefits are accrued as liabilities (on a government-wide basis) as employees earn the benefits. On a fund financial statement basis for the governmental funds, only matured liabilities and liabilities expected to be liquidated with current assets are accrued. Sick leave benefits are accrued as a liability as employees earn the benefits, but only to the extent that it is probable that the City will compensate the employees through cash payments conditioned on the employees’ termination or retirement. A compensated absence is liquidated in the fund where the employee’s salary was paid at termination, with all compensated absences liquidated in the general fund that are associated with employees’ salaries paid from governmental funds.
G. Estimates
The preparation of financial statements in conformity with generally accepted accounting principles requires management to make estimates and assumptions that affect certain reported amounts and disclosures. Accordingly, actual results could differ from those estimates.
H. Internal Service Funds The Internal Service Funds’ purpose is to measure the full cost of providing health benefits and long- term disability to City employees and dependants for the purpose of fully recovering that cost through fees or charges – employee payroll deductions and expenditures in departmental personnel budgets. Any profit (loss) during a period is credited (charged) back to participating programs. All assets and liabilities are reported in the governmental activities column of the Statement of Net Assets.
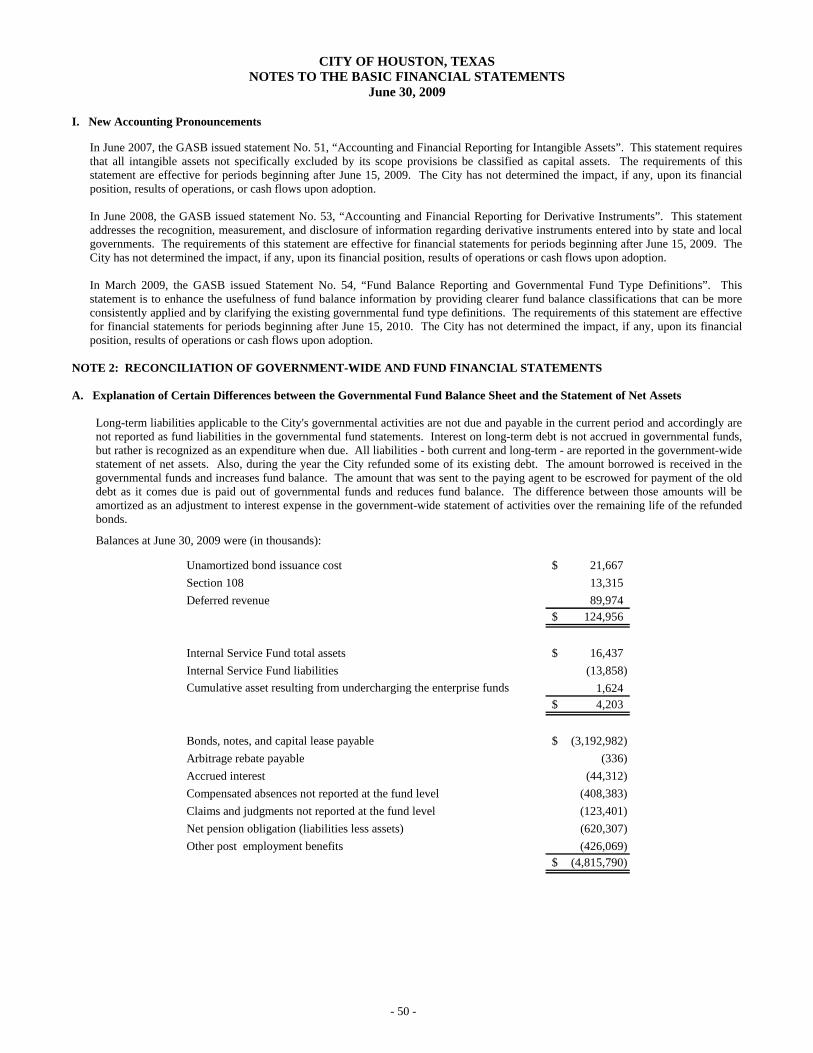
CITY OF HOUSTON, TEXAS NOTES TO THE BASIC FINANCIAL STATEMENTS
June 30, 2009
- 50 -
I. New Accounting Pronouncements
In June 2007, the GASB issued statement No. 51, “Accounting and Financial Reporting for Intangible Assets”. This statement requires that all intangible assets not specifically excluded by its scope provisions be classified as capital assets. The requirements of this statement are effective for periods beginning after June 15, 2009. The City has not determined the impact, if any, upon its financial position, results of operations, or cash flows upon adoption. In June 2008, the GASB issued statement No. 53, “Accounting and Financial Reporting for Derivative Instruments”. This statement addresses the recognition, measurement, and disclosure of information regarding derivative instruments entered into by state and local governments. The requirements of this statement are effective for financial statements for periods beginning after June 15, 2009. The City has not determined the impact, if any, upon its financial position, results of operations or cash flows upon adoption. In March 2009, the GASB issued Statement No. 54, “Fund Balance Reporting and Governmental Fund Type Definitions”. This statement is to enhance the usefulness of fund balance information by providing clearer fund balance classifications that can be more consistently applied and by clarifying the existing governmental fund type definitions. The requirements of this statement are effective for financial statements for periods beginning after June 15, 2010. The City has not determined the impact, if any, upon its financial position, results of operations or cash flows upon adoption.
NOTE 2: RECONCILIATION OF GOVERNMENT-WIDE AND FUND FINANCIAL STATEMENTS
A. Explanation of Certain Differences between the Governmental Fund Balance Sheet and the Statement of Net Assets
Long-term liabilities applicable to the City's governmental activities are not due and payable in the current period and accordingly are not reported as fund liabilities in the governmental fund statements. Interest on long-term debt is not accrued in governmental funds, but rather is recognized as an expenditure when due. All liabilities - both current and long-term - are reported in the government-wide statement of net assets. Also, during the year the City refunded some of its existing debt. The amount borrowed is received in the governmental funds and increases fund balance. The amount that was sent to the paying agent to be escrowed for payment of the old debt as it comes due is paid out of governmental funds and reduces fund balance. The difference between those amounts will be amortized as an adjustment to interest expense in the government-wide statement of activities over the remaining life of the refunded bonds.
Balances at June 30, 2009 were (in thousands):
Unamortized bond issuance cost 21,667$ Section 108 13,315 Deferred revenue 89,974
124,956$
Internal Service Fund total assets 16,437$ Internal Service Fund liabilities (13,858) Cumulative asset resulting from undercharging the enterprise funds 1,624 4,203$
Bonds, notes, and capital lease payable (3,192,982)$ Arbitrage rebate payable (336) Accrued interest (44,312) Compensated absences not reported at the fund level (408,383) Claims and judgments not reported at the fund level (123,401) Net pension obligation (liabilities less assets) (620,307) Other post employment benefits (426,069) (4,815,790)$
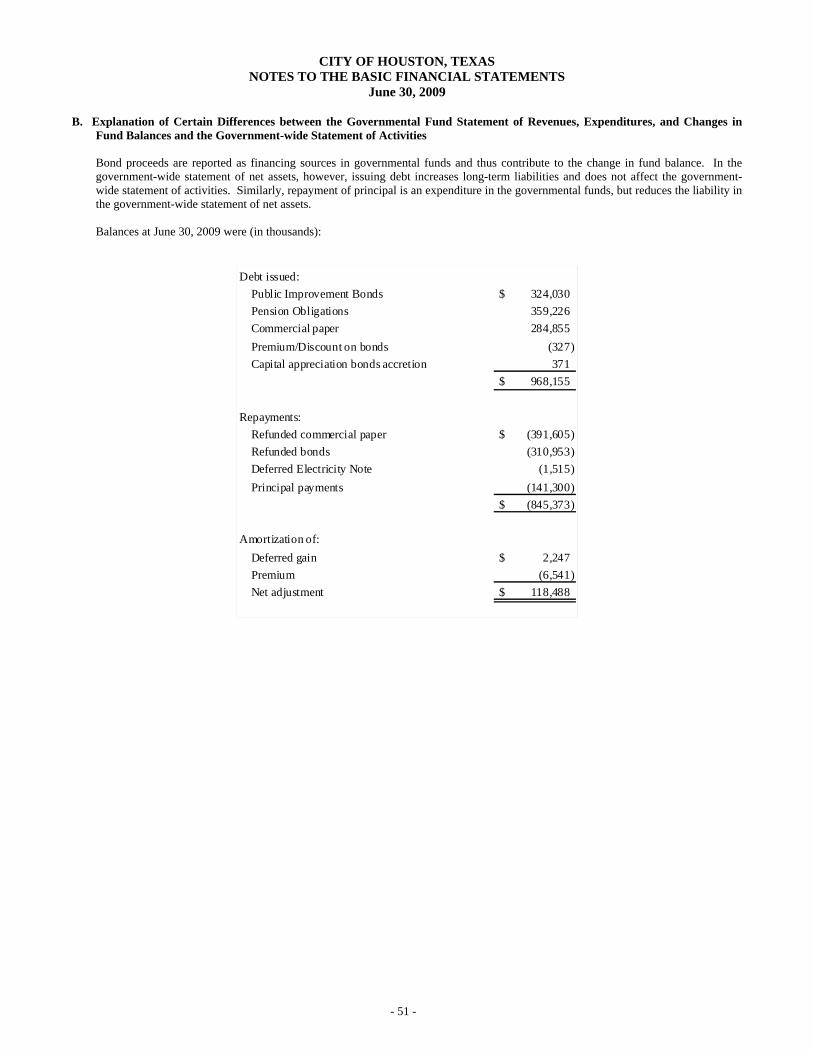
CITY OF HOUSTON, TEXAS NOTES TO THE BASIC FINANCIAL STATEMENTS
June 30, 2009
- 51 -
B. Explanation of Certain Differences between the Governmental Fund Statement of Revenues, Expenditures, and Changes in Fund Balances and the Government-wide Statement of Activities
Bond proceeds are reported as financing sources in governmental funds and thus contribute to the change in fund balance. In the government-wide statement of net assets, however, issuing debt increases long-term liabilities and does not affect the government-wide statement of activities. Similarly, repayment of principal is an expenditure in the governmental funds, but reduces the liability in the government-wide statement of net assets. Balances at June 30, 2009 were (in thousands):
Debt issued:Public Improvement Bonds 324,030$ Pension Obligations 359,226 Commercial paper 284,855 Premium/Discount on bonds (327) Capital appreciation bonds accretion 371
968,155$
Repayments:Refunded commercial paper (391,605)$ Refunded bonds (310,953) Deferred Electricity Note (1,515) Principal payments (141,300)
(845,373)$ Amortization of:
Deferred gain 2,247$ Premium (6,541) Net adjustment 118,488$

CITY OF HOUSTON, TEXAS NOTES TO THE BASIC FINANCIAL STATEMENTS
June 30, 2009
- 52 -
Under the modified accrual basis of accounting used in the governmental funds, expenditures are not recognized for transactions that are not normally paid with expendable available financial resources. In the government-wide statement of activities, however, which is presented on the accrual basis, expenses and liabilities are reported regardless of when financial resources are available. In addition, interest on long-term debt is not recognized under the modified accrual basis of accounting until due, rather than as it accrues. The adjustment is a combination of the following items (in thousands):
Property taxes earned but not available 30,582$ Ambulance fees earned but not available 2,091 Fines and forfeits earned but not available 7,836 Other (primarily assessments) earned but not available 49,465
Total revenue not reported at fund level 89,974$
Property taxes for prior periods (30,362)$ Ambulance fees for prior periods (2,676) Fines and forfeits for prior periods (6,329) Other (primarily assessments) for prior periods (40,179)
Total revenue for prior period transactions (79,546)$
Interest on long-term debt 5,261$ Municipal Employees pension (19,418) Police Officers' pension (51,279) Firefighters' pension 12,154 Claims and judgments 7,256 Debt issuance costs 5,878 Amortization of debt issuance costs (1,341) Compensated absences (11,318) Other liabilities 675 Other post employment benefits (186,447) Decrease in other receivables (1,745) Total differences in accrued expenses (240,324)$
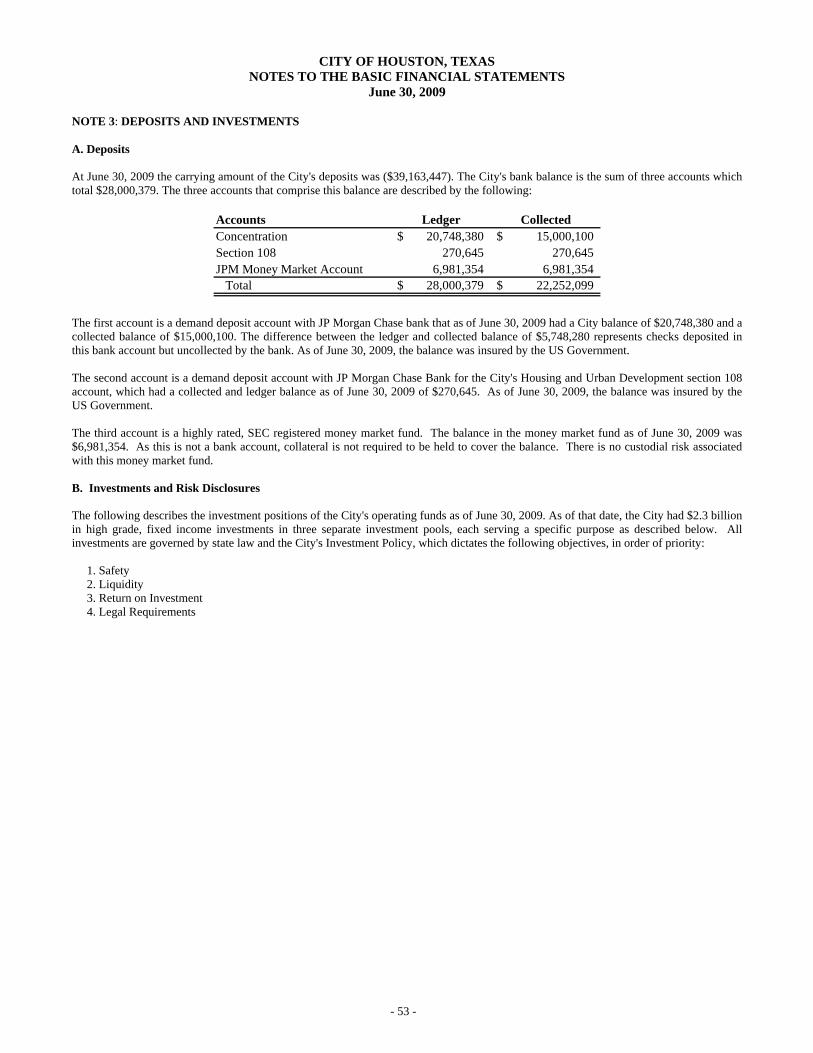
CITY OF HOUSTON, TEXAS NOTES TO THE BASIC FINANCIAL STATEMENTS
June 30, 2009
- 53 -
NOTE 3: DEPOSITS AND INVESTMENTS A. Deposits At June 30, 2009 the carrying amount of the City's deposits was ($39,163,447). The City's bank balance is the sum of three accounts which total $28,000,379. The three accounts that comprise this balance are described by the following:
Accounts Ledger CollectedConcentration 20,748,380$ 15,000,100$ Section 108 270,645 270,645 JPM Money Market Account 6,981,354 6,981,354 Total 28,000,379$ 22,252,099$
The first account is a demand deposit account with JP Morgan Chase bank that as of June 30, 2009 had a City balance of $20,748,380 and a collected balance of $15,000,100. The difference between the ledger and collected balance of $5,748,280 represents checks deposited in this bank account but uncollected by the bank. As of June 30, 2009, the balance was insured by the US Government. The second account is a demand deposit account with JP Morgan Chase Bank for the City's Housing and Urban Development section 108 account, which had a collected and ledger balance as of June 30, 2009 of $270,645. As of June 30, 2009, the balance was insured by the US Government. The third account is a highly rated, SEC registered money market fund. The balance in the money market fund as of June 30, 2009 was $6,981,354. As this is not a bank account, collateral is not required to be held to cover the balance. There is no custodial risk associated with this money market fund. B. Investments and Risk Disclosures The following describes the investment positions of the City's operating funds as of June 30, 2009. As of that date, the City had $2.3 billion in high grade, fixed income investments in three separate investment pools, each serving a specific purpose as described below. All investments are governed by state law and the City's Investment Policy, which dictates the following objectives, in order of priority: 1. Safety 2. Liquidity 3. Return on Investment 4. Legal Requirements

CITY OF HOUSTON, TEXAS NOTES TO THE BASIC FINANCIAL STATEMENTS
June 30, 2009
- 54 -
These funds are managed internally by City personnel. The investments listed below do not include the City's three pension funds, which are described elsewhere in this report. 1. General Investment Pool 9900 (Pool 960) The General Investment Pool consists of all working capital, construction and debt service funds which are not subject to yield restriction under IRS arbitrage regulations. The funds of the City's enterprise systems, as well as the general fund, are commingled in this pool in order to gain operational efficiency. Approximately 99% of the City's total investable funds are contained in this portfolio. City of Houston Credit Quality Market WAM* Investments As of June 30, 2009 Ratings(1)(2) Value ( yrs )
U.S. Treasury Notes n/a $ 300,977,433 0.508 Housing and Urban Development Notes n/a 54,676,137 2.392 Agency Notes (4) AAA 861,812,898 2.118 Agency Notes (3) (4) not rated 373,918,920 0.446 Collateralized Mortgage Obligations (3) (4) not rated 7,684,306 1.054 Mortgaged Backed Securities (3) (4) not rated 281,877,946 3.256 Money Market Funds AAA Short Term 47,805,992 0.003 Certificate of Deposit FDIC insured 982,652 0.216 Commercial Paper Notes (5) A1 Short Term 153,910,220 0.061 Municipal Bonds AAA 74,190,651 0.630 Municipal Bonds SP-1+/MIG1 Short Term 5,086,129 0.002 Municipal Bonds AA Long Term 76,546,277 0.738 Municipal Bonds AA Long Term/A1 Short Term 37,169,582 0.003 Municipal Bonds AA Long Term/A2 Short Term 26,427,489 0.002 Municipal Bonds A Long Term 11,688,173 0.069 Municipal Bonds (6) SG Short Term 5,086,919 0.004
Total Investments $ 2,319,841,724 1.531 * Weighted Average Maturity (WAM) computed using average life of mortgage backed securities and effective maturity of callable securities. (1) Standard and Poor’s (S&P) Rating Services has assigned an AAAf credit quality rating and S1 volatility rating to the City’s General
Investment Pool. The AAAf signifies the highest level of credit protection, and the S1 rating signifies volatility consistent with a portfolio of government securities maturing from one to three years.
(2) All credit ratings shown are either actual S&P ratings, or if an S&P credit rating is not available, the equivalent S&P credit rating is
shown to represent the actual Moody’s or Fitch credit rating. (3) These securities are not individually rated by the rating agencies. However, senior lien debt of the Federal Home Loan Bank, Federal
Home Loan Mortgage Corporation (“Freddie Mac”), and the Federal National Mortgage Corporation (“Fannie Mae”), are rated AAA. (4) These are securities issued by government sponsored enterprises, including the Federal Home Loan Bank, Freddie Mac, Fannie Mae,
and the Federal Agricultural Corporation ("Farmer Mac").

CITY OF HOUSTON, TEXAS NOTES TO THE BASIC FINANCIAL STATEMENTS
June 30, 2009
- 55 -
(5) At June 30, 2009, the City held its own commercial paper notes ("the Notes") in this amount. The Notes were purchased in recognition of IRS Notice 2008-88 which permits issuers to purchase and hold their own debt until December 31, 2009 without causing an extinguishment of such debt for federal income tax purposes. The Notes were purchased as an investment of funds on deposit in City's General Pool, in compliance with the Texas Public Funds Investment Act and the City's current investment policy. Such purchase was not intended to extinguish the debt evidenced by the Notes.
(6) This note was rated MIG-1 at time of purchase and was downgraded to SG in June 2009. It was sold on July 7, 2009. Reverse Repurchase Agreements: Also known as a securities lending program, the purpose is to earn incremental income by borrowing money at favorable interest rates and investing the proceeds of these loans at a positive spread in high grade commercial paper, money market funds or U.S. Agency securities. The City uses U.S. Treasury securities held in the pool as collateral to secure the loans. The City receives 102% of the value of the Treasury. The program is limited to 15% of the City's portfolio value, and the term of the agreements may not exceed 90- days. The term of the investments must exactly match the term of the reverse repurchase agreements. The program is authorized by the Texas Public Funds Investment Act and the City's Investment Policy. The dates of the agreement, collateral securities, and market value of the borrowings under the program are detailed below: City of Houston Reverse Repurchase Market Value Liability on Reverse Agreements as of June 30, 2009 of Collateral Repurchase Description of Collateral & Securities@ Agreements @ Term of Agreement 6/30/2009 6/30/2009
US Treasury 4.625% 11/15/09, 6/18 -7/20/09 $ 25,275,400 $ 26,052,296 US Treasury 3.5% 8/15/09, 6/18 -7/20/09 30,213,270 31,147,959 US Treasury 3.625% 10/31/09, 6/18 - 7/20/09 25,398,450 25,924,745 US Treasury 6.0% 8/15/09, 6/29 - 7/20/09 14,099,526 14,714,286 US Treasury 4.625% 11/15/09, 6/22 -7/22/09 20,080,460 20,841,837 Total Market Value 115,067,106 118,681,123 Accrued Interest 1,555,163 13,373 Total Market Value plus Accrued Interest $ 116,622,269 $ 118,694,496
Investments purchased with the proceeds of the securities lending program are included in the Commercial Paper Notes disclosed above. Risk Disclosures: Interest Rate Risk. In order to ensure the ability of the City to meet obligations and to minimize potential fair value losses arising from rising interest rate environments, the City's investment policy limits this investment portfolio's dollar weighted average maturity to 2.5 years maximum. As of June 30, 2009, this investment portfolio's dollar-weighted average maturity was 1.53 years. Modified duration was 1.42 years. Modified duration can be used as a multiplier to determine the percent change in price of a bond portfolio for every 100 basis point (1%) change in yield. For example, a portfolio with a modified duration of 1.42 years would experience approximately a 1.42% change in market price for every 100 basis point change in yield. Credit Risk –Investments. The US Treasury Notes and Housing and Urban Development Notes are direct obligations of the United States government. The Agency Notes, Collateralized Mortgage Obligations, and Mortgage Backed Securities were issued by government sponsored enterprises but are not direct obligations of the U.S. Government. The money market mutual funds were rated AAA. Long term municipal securities were rated at least A. Municipal securities considered short-term securities were State of Texas general obligations or had the highest short-term credit rating of A1 or MIG-1 at purchase. Under the securities lending program, the City receives 102% of market value for its U.S. Treasury securities at the time the repurchase agreements are signed, and agreements are limited to 90 days by policy and have been less than 35 days by practice. At June 30, 2009 the value of the collateral held by the counterparty was less than the amount owed by the City. Custodial Credit Risk. The custodial credit risk for investments is the risk that in the event of the failure of the counterparty the City will not be able to recover the value of its investment or collateral securities that are in the possession of an outside party. Investment securities are exposed to custodial credit risk if the securities are not registered in the name of the City, and are held by either the counterparty or the counterparty's trust department or agent but not in the City's name. As of June 30, 2009, none of the City's investments in the General Investment Fund 9900 were subject to custodial credit risk. Foreign Currency Risk. Foreign currency risk is the risk that investments will change value due to changes in exchange rates between time of purchase and reporting or sale. The City's general pool investments are all US dollar denominated and not subject to this risk.

CITY OF HOUSTON, TEXAS NOTES TO THE BASIC FINANCIAL STATEMENTS
June 30, 2009
- 56 -
2. Tax Exempt Pool 9901 The Tax Exempt Pool consists of those funds which are subject to yield restrictions and arbitrage regulation under the 1986 Tax Reform Act. All these investments were held in a tax-exempt money market fund. City of Houston Credit Quality Market Investments As of June 30, 2009 Ratings Value WAM Fidelity Tax-Exempt Money Market Mutual Fund SEC 2a-7 fund $ 20,331,794 <90 Days Risk Disclosures: Interest Rate Risk. In order to ensure the ability of the City to meet obligations and to minimize potential fair value losses arising from rising interest rate environments, the City's investment policy limits this pool's dollar-weighted average maturity to 1 year. As of June 30, 2009, all funds were invested in a SEC registered money market fund that kept a weighted average maturity of less than 90 days. Funds were available on same day notice. Credit Risk. The City investment policy limits investments in the Tax-Exempt Pool to high quality, short maturity securities with an average dollar-weighted maturity of less than one year and a minimum rating of A, if the yield is reasonably higher than that of a tax-exempt money market mutual funds. Otherwise, funds in this pool will be invested in one or more tax-exempt money market mutual funds that are SEC registered and regulated under rule 2a-7. Rule 2a-7 requires that the fund have a weighted average maturity of less than 90 days to maturity, that individual securities cannot be more than 397 days to maturity, and that securities must have a rating by nationally recognized rating agencies in one of the two highest short-term rating categories. Custodial Credit Risk. As of June 30, 2009 none of the City's investments in this pool were subject to custodial credit risk. Foreign Currency Risk. The City's investments in this pool are all US dollar denominated and not subject to foreign currency risk. 3. Housing Department Section 108 Pool Fund 9902 The Housing Department Pool was created to comply with rules of the US Department of Housing and Urban Development (“HUD”), which requires that funds provided by HUD must be held in a separate custodial account for HUD's benefit. The primary goal of this fund is to meet the cash flow and investment needs of the City's Housing and Community Development HUD program. City of Houston Credit Quality Market Investments As of June 30, 2009 Ratings Value WAM U.S. Treasury Bills NA $7,559,251 10-Days Risk Disclosures: Interest Rate Risk. In order to ensure the ability of the City to meet obligations and to minimize potential fair value losses arising from rising interest rate environments, the City's investment policy limits this investment portfolio’s dollar-weighted average stated maturity to six months maximum. As of June 30, 2009, this investment portfolio’s dollar-weighted average stated maturity is 10 days. Modified duration was 0.073 years. Credit Risk. The HUD pool consists only of U.S. Treasury Bills with maturities less than 6 months. HUD requires that investment of these funds must be in direct obligations of the United States Government. Custodial Credit Risk. As of June 30, 2009 none of the City's investments in this pool were subject to custodial credit risk. Foreign Currency Risk. The City's investments in this pool are all US dollar denominated and not subject to foreign currency risk. 4. Convention Center and Hotel Reserve Fund 9903 (Pool 979) The Convention Center and Hotel Reserve Fund Pool was closed on November 26, 2008, and its proceeds were reinvested in the General Pool Fund 9900.

CITY OF HOUSTON, TEXAS NOTES TO THE BASIC FINANCIAL STATEMENTS
June 30, 2009
- 57 -
5. Miscellaneous Money Market Accounts The City maintains several separate money market accounts outside the pools as described below: City of Houston Credit Quality Market WAM Investments As of June 30, 2009 Ratings Value ( yrs ) JP Morgan US Government Money Market Fund: Airport System Special Facilities Revenue Bonds Series 1997A Reserve Fund. AAA $ 6,652,912 < 90 days JP Morgan US Treasury Securities Money Market Fund: Balances held for auction bonds debt service. AAA 280,192 < 90 days First American US Treasury Money Market Fund: Balances held for commercial paper debt service. AAA 129,752 < 90 days Total Miscellaneous Money Market Funds $ 7,062,856 Risk Disclosures: Interest Rate Risk. These money market funds maintain an average maturity of less than 90 days and seek to maintain a stable net asset value of $1.00. These funds are redeemable on a same day notice. Credit Risk. These funds hold only US dollar denominated securities that present minimal credit risk. They have the highest credit ratings. Custodial Credit Risk. As of June 30, 2009, none of the City's investments in this pool were subject to custodial credit risk. Foreign Currency Risk. The City's investments in this pool are all US dollar denominated and not subject to foreign currency risk. 6. Houston Foundation The Houston Foundation consists of two trusts. The Hill Trust is reported as an Other Non-Major Special Revenue Fund; its investments are laid out below. The Hill Trust was established by will in the early 1900's as a general purpose charity trust. The trust is administered by an outside trustee. The City's Administration and Regulatory Affairs Department provides administrative support to the foundation and its board. City of Houston Credit Quality Market WAM Investments As of June 30, 2009 Ratings Value ( yrs ) Cash and Equivalents not rated $ 36,828 n/a Fixed Income see below. 1,654,384 4.13 Equities n/a 857,172 n/a Other n/a 12 n/a Total Assets $ 2,548,396 Risk Disclosures: Interest Rate Risk. The cash and fixed income portions of this portfolio are invested in mutual funds, US Agency Securities, and Corporate Bonds. Approximately 7% of the portfolio is allocated to Columbia Strategic Income Fund with average maturity of 9.6 years, 74% is allocated to Corporate Bonds with maturities less than 4 years, and 19% is allocated to U.S. Agency Bonds with maturities less than five years. The weighted average maturity for the fixed income portfolio is approximately 2.73 years, and the weighted average duration is 2.32 years. Credit Risk. The allocation of assets among various asset classes are set by the board. The Standard and Poor's rating for the fixed income portfolio are as followed: 38% is rated Aaa, 32% is rated Aa, 19% is rated A, and 11%, mainly mutual funds, are not rated. The equities portion of this portfolio is invested in common stocks and Columbia’s mutual funds. Custodial Credit Risk. The custodial credit risk for investments is the risk that, in the event of the failure of the counterparty, the City of Houston will not be able to recover the value of its investment or collateral securities that are in the possession of an outside party. Investment securities are exposed to custodial credit risk if the securities are not registered in the name of the City, and are held by either the counterparty or the counterparty's trust department or agent but not in the City's name. As of June 30, 2009 all of the foundation's holdings in the above noted mutual funds, corporate bonds, and common stocks were subject to custodial credit risk. Foreign Currency Risk. Foreign currency risk is the risk that investments will change value due to changes in exchange rates between times of purchase, reporting or sale. The equity investments of the Houston Foundation are subject to this risk to the extent that the corporations held have not fully hedged their foreign currency dealings.

CITY OF HOUSTON, TEXAS NOTES TO THE BASIC FINANCIAL STATEMENTS
June 30, 2009
- 58 -
7. Investments – Houston Area Water Corporation
As of June 30, 2009, the Corporation had the following investments: Weighted Average Investment Maturity Fair value Wells Fargo Stagecoach Overnight Repurchase Agreement 1 day $ 916,281 JP Morgan U.S. Government Money Market Fund 49 days 2,546,140 $ 3,462,421
The above investment is shown as cash equivalent in the statement of net assets. Interest Rate risk: The Corporation does not have a formal investment policy that limits investment maturities as a means of managing its exposure to fair value losses arising from increasing interest rates. Credit Risk: State law limits investments in commercial paper, corporate bonds, and mutual bond funds to the top two ratings issued by nationally recognized statistical rating organizations. The corporation has no investment policy that would further limit its investment choices. Wells Fargo Treasury Plus Money Market Fund and JP Morgan U.S. Government Money Market Fund were rated AAAm by S&P Rating and AAA by Moody's Rating. 8. Investments – Municipal Employees Pension System (the “System”)
Portions of the System’s investments are classified as security investments. A security is a transferable financial instrument that evidences ownership or creditorship. Investments in commingled funds, limited partnerships, real estate trusts, and loans and mortgages are investments that are evidenced by contracts rather than securities. The fair values of the System’s investments at June 30, 2009, are presented by type, as follows:
Short-term investment funds $ 41,292,085 Government securities 46,951,260 Corporate bonds 134,193,755 Capital stocks 435,432,937 Commingled funds 586,691,183 Real assets 204,875,980 Alternative investments 294,803,721 $ 1,744,240,921
The System’s Board, in accordance with the power and authority conferred under the Texas Statutes, employed State Street Bank and Trust Company (Custodian) as custodian of the assets of the System, and in said capacity, the Custodian is a fiduciary of the System’s assets with respect to its discretionary duties including safekeeping the System’s assets. The Custodian has established and maintains a custodial account to hold, or direct its agents to hold, for the account of the System all assets that the Board shall from time to time deposit with the Custodian. All rights, title and interest in and to the System’s assets shall at all times be vested in the System’s Board. In holding all System assets, the Custodian shall act with the same care, skill, prudence and diligence under the prevailing circumstances that a prudent person acting in like capacity and familiar with matters of this type would use in the conduct of an enterprise with a like character and with like aims. Further, the Custodian shall hold, manage and administer the System’s assets for the exclusive purpose of providing the benefits to the members and the qualified survivors of the System. The Board shall manage the investment program of the System in compliance with all applicable Federal and State statutes and regulations concerning the investment of pension assets. The Board has adopted a Statement of Investment Policies and Objectives (Investment Policy) to set forth the factors involved in the management of investment assets for the System and is made part of every investment management agreement.
Custodial credit risk. For an investment, custodial credit is the risk that, in the event of the failure of the counterparty, the System will not be able to recover the value of its investment or collateral securities that are in the possession of an outside party. Investment securities are exposed to custodial credit risk if the securities are uninsured, are not registered in the name of the System, and are held by either the counterparty or the counterparty’s trust department or agent but not in the System’s name. At June 30, 2009, the System’s investments that were not subject to custodial credit risk were the investments in U.S. government securities and corporate bonds as they are registered in the name of the System and held in possession of the Custodian.
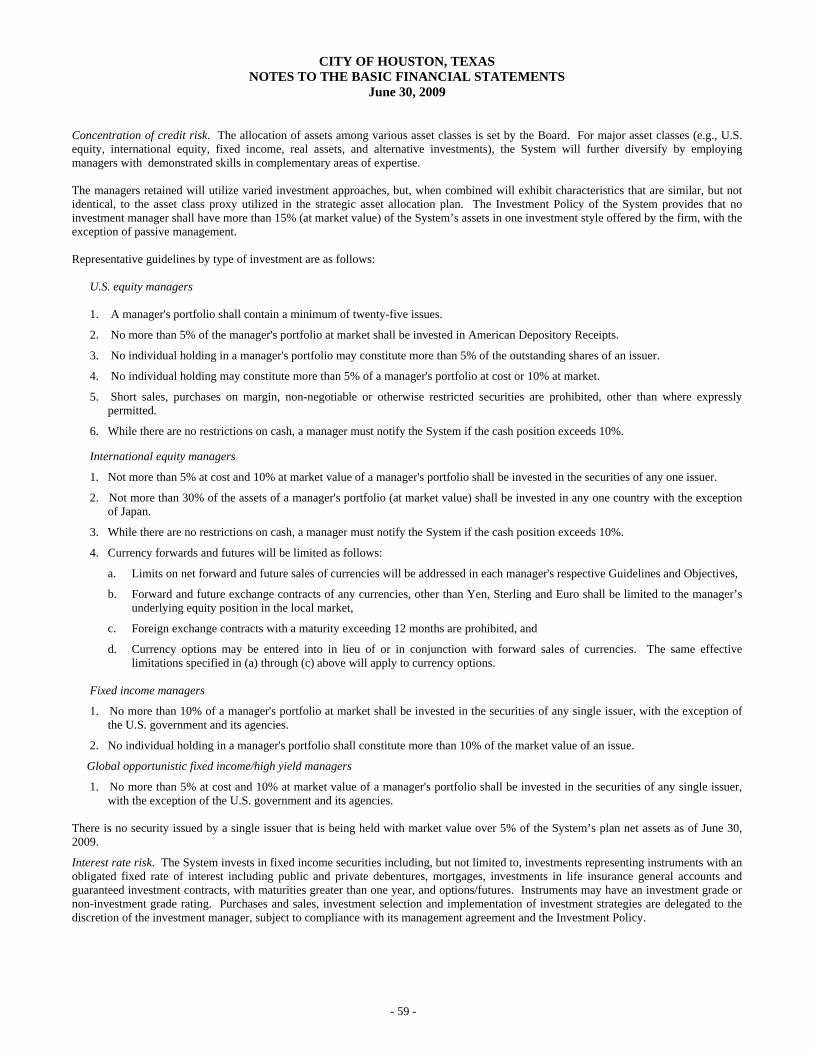
CITY OF HOUSTON, TEXAS NOTES TO THE BASIC FINANCIAL STATEMENTS
June 30, 2009
- 59 -
Concentration of credit risk. The allocation of assets among various asset classes is set by the Board. For major asset classes (e.g., U.S. equity, international equity, fixed income, real assets, and alternative investments), the System will further diversify by employing managers with demonstrated skills in complementary areas of expertise. The managers retained will utilize varied investment approaches, but, when combined will exhibit characteristics that are similar, but not identical, to the asset class proxy utilized in the strategic asset allocation plan. The Investment Policy of the System provides that no investment manager shall have more than 15% (at market value) of the System’s assets in one investment style offered by the firm, with the exception of passive management. Representative guidelines by type of investment are as follows:
U.S. equity managers 1. A manager's portfolio shall contain a minimum of twenty-five issues.
2. No more than 5% of the manager's portfolio at market shall be invested in American Depository Receipts.
3. No individual holding in a manager's portfolio may constitute more than 5% of the outstanding shares of an issuer.
4. No individual holding may constitute more than 5% of a manager's portfolio at cost or 10% at market.
5. Short sales, purchases on margin, non-negotiable or otherwise restricted securities are prohibited, other than where expressly
permitted.
6. While there are no restrictions on cash, a manager must notify the System if the cash position exceeds 10%.
International equity managers
1. Not more than 5% at cost and 10% at market value of a manager's portfolio shall be invested in the securities of any one issuer.
2. Not more than 30% of the assets of a manager's portfolio (at market value) shall be invested in any one country with the exception of Japan.
3. While there are no restrictions on cash, a manager must notify the System if the cash position exceeds 10%.
4. Currency forwards and futures will be limited as follows:
a. Limits on net forward and future sales of currencies will be addressed in each manager's respective Guidelines and Objectives,
b. Forward and future exchange contracts of any currencies, other than Yen, Sterling and Euro shall be limited to the manager’s
underlying equity position in the local market,
c. Foreign exchange contracts with a maturity exceeding 12 months are prohibited, and
d. Currency options may be entered into in lieu of or in conjunction with forward sales of currencies. The same effective limitations specified in (a) through (c) above will apply to currency options.
Fixed income managers
1. No more than 10% of a manager's portfolio at market shall be invested in the securities of any single issuer, with the exception of the U.S. government and its agencies.
2. No individual holding in a manager's portfolio shall constitute more than 10% of the market value of an issue.
Global opportunistic fixed income/high yield managers
1. No more than 5% at cost and 10% at market value of a manager's portfolio shall be invested in the securities of any single issuer, with the exception of the U.S. government and its agencies.
There is no security issued by a single issuer that is being held with market value over 5% of the System’s plan net assets as of June 30, 2009.
Interest rate risk. The System invests in fixed income securities including, but not limited to, investments representing instruments with an obligated fixed rate of interest including public and private debentures, mortgages, investments in life insurance general accounts and guaranteed investment contracts, with maturities greater than one year, and options/futures. Instruments may have an investment grade or non-investment grade rating. Purchases and sales, investment selection and implementation of investment strategies are delegated to the discretion of the investment manager, subject to compliance with its management agreement and the Investment Policy.

CITY OF HOUSTON, TEXAS NOTES TO THE BASIC FINANCIAL STATEMENTS
June 30, 2009
- 60 -
Interest rate risk is the risk that changes in interest rates will adversely affect the fair value of the investment. This risk is managed within the portfolios using the effective duration or option-adjusted methodology. The System’s investment policies require that the portfolio shall maintain a duration within +/- 20% of the Barclays Capital Aggregate Bond index; and maintain a credit quality weighted average of AA-, or equivalent. Duration is a measure of a debt investment’s exposure to fair value changes arising from changes in interest rates. It uses the present value of cash flows, weighted for those cash flows as a percentage of the investment’s full price.
The greater the duration of a bond, or a portfolio of bonds, the greater its price volatility will be in response to a change in interest rates and vice-versa. Duration is the measure of a bond price’s sensitivity to a 100-basis point change in interest rates. The duration of the System’s debt securities are managed by the active managers.
At June 30, 2009, the following table shows the System’s fixed income securities by type, amount and the effective duration rate calculated using the software Wilshire Axiom. Effective Duration Domestic International Fair Value
Collateralized mortgage obligations 4.93 $ 4,760,462 4,760,462 Convertible bonds 3.00 6,875,577 103,813 6,979,390 Corporate bonds 5.06 100,094,842 100,094,842 Corporate bonds 3.75 9,135,610 9,135,610 GNMA/FNMA/FHLMC (Sponsored Agencies) 2.81 26,714,856 26,714,856 Government issues (United States) 6.60 15,421,825 15,421,825 Government issues (International) 10.01 3,291,262 3,291,262 Zero coupon bond 13.66 1,523,317 1,523,317 Misc. receivable (Auto/Credit card) 1.41 10,013,592 10,013,592 Other asset backed 3.09 3,002,219 207,640 3,209,859
5.43 $ 168,406,690 12,738,325 181,145,015
Credit risk. The quality ratings of investments in fixed income securities are set forth in the Investment Policy as follows:
1. All issues purchased must be of investment grade quality Baa (Moody's) or BBB (S&P) unless expressly authorized by the Board,
in which case a minimum B rating shall apply, with a maximum limit of non-investment grade credits of 20% at market.
2. For global opportunistic fixed income/high yield securities, more than 50% of a manager’s portfolio at market shall be invested in non-investment grade fixed income securities, i.e. those with ratings of BA1 (Moody’s), BB+ (Standard & Poor’s), or lower, or unrated bonds, including but not limited to corporate bonds, convertible bonds, and preferred stocks.
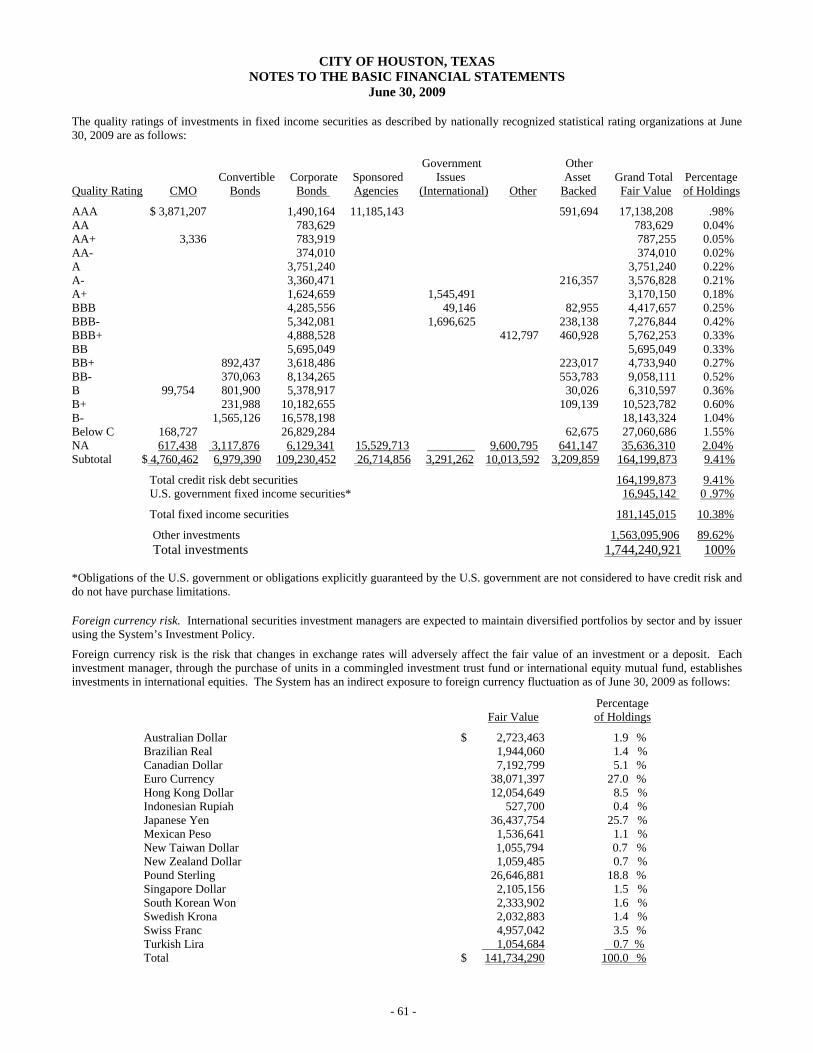
CITY OF HOUSTON, TEXAS NOTES TO THE BASIC FINANCIAL STATEMENTS
June 30, 2009
- 61 -
The quality ratings of investments in fixed income securities as described by nationally recognized statistical rating organizations at June 30, 2009 are as follows:
Government Other Convertible Corporate Sponsored Issues Asset Grand Total Percentage Quality Rating CMO Bonds Bonds Agencies (International) Other Backed Fair Value of Holdings
AAA $ 3,871,207 1,490,164 11,185,143 591,694 17,138,208 .98% AA 783,629 783,629 0.04% AA+ 3,336 783,919 787,255 0.05% AA- 374,010 374,010 0.02% A 3,751,240 3,751,240 0.22% A- 3,360,471 216,357 3,576,828 0.21% A+ 1,624,659 1,545,491 3,170,150 0.18% BBB 4,285,556 49,146 82,955 4,417,657 0.25% BBB- 5,342,081 1,696,625 238,138 7,276,844 0.42% BBB+ 4,888,528 412,797 460,928 5,762,253 0.33% BB 5,695,049 5,695,049 0.33% BB+ 892,437 3,618,486 223,017 4,733,940 0.27% BB- 370,063 8,134,265 553,783 9,058,111 0.52% B 99,754 801,900 5,378,917 30,026 6,310,597 0.36% B+ 231,988 10,182,655 109,139 10,523,782 0.60% B- 1,565,126 16,578,198 18,143,324 1.04% Below C 168,727 26,829,284 62,675 27,060,686 1.55% NA 617,438 3,117,876 6,129,341 15,529,713 9,600,795 641,147 35,636,310 2.04% Subtotal $ 4,760,462 6,979,390 109,230,452 26,714,856 3,291,262 10,013,592 3,209,859 164,199,873 9.41%
Total credit risk debt securities 164,199,873 9.41% U.S. government fixed income securities* 16,945,142 0 .97%
Total fixed income securities 181,145,015 10.38%
Other investments 1,563,095,906 89.62% Total investments 1,744,240,921 100%
*Obligations of the U.S. government or obligations explicitly guaranteed by the U.S. government are not considered to have credit risk and do not have purchase limitations.
Foreign currency risk. International securities investment managers are expected to maintain diversified portfolios by sector and by issuer using the System’s Investment Policy.
Foreign currency risk is the risk that changes in exchange rates will adversely affect the fair value of an investment or a deposit. Each investment manager, through the purchase of units in a commingled investment trust fund or international equity mutual fund, establishes investments in international equities. The System has an indirect exposure to foreign currency fluctuation as of June 30, 2009 as follows:
Percentage Fair Value of Holdings
Australian Dollar $ 2,723,463 1.9 % Brazilian Real 1,944,060 1.4 % Canadian Dollar 7,192,799 5.1 % Euro Currency 38,071,397 27.0 % Hong Kong Dollar 12,054,649 8.5 % Indonesian Rupiah 527,700 0.4 % Japanese Yen 36,437,754 25.7 % Mexican Peso 1,536,641 1.1 % New Taiwan Dollar 1,055,794 0.7 % New Zealand Dollar 1,059,485 0.7 % Pound Sterling 26,646,881 18.8 % Singapore Dollar 2,105,156 1.5 % South Korean Won 2,333,902 1.6 % Swedish Krona 2,032,883 1.4 % Swiss Franc 4,957,042 3.5 % Turkish Lira 1,054,684 0.7 % Total $ 141,734,290 100.0 %
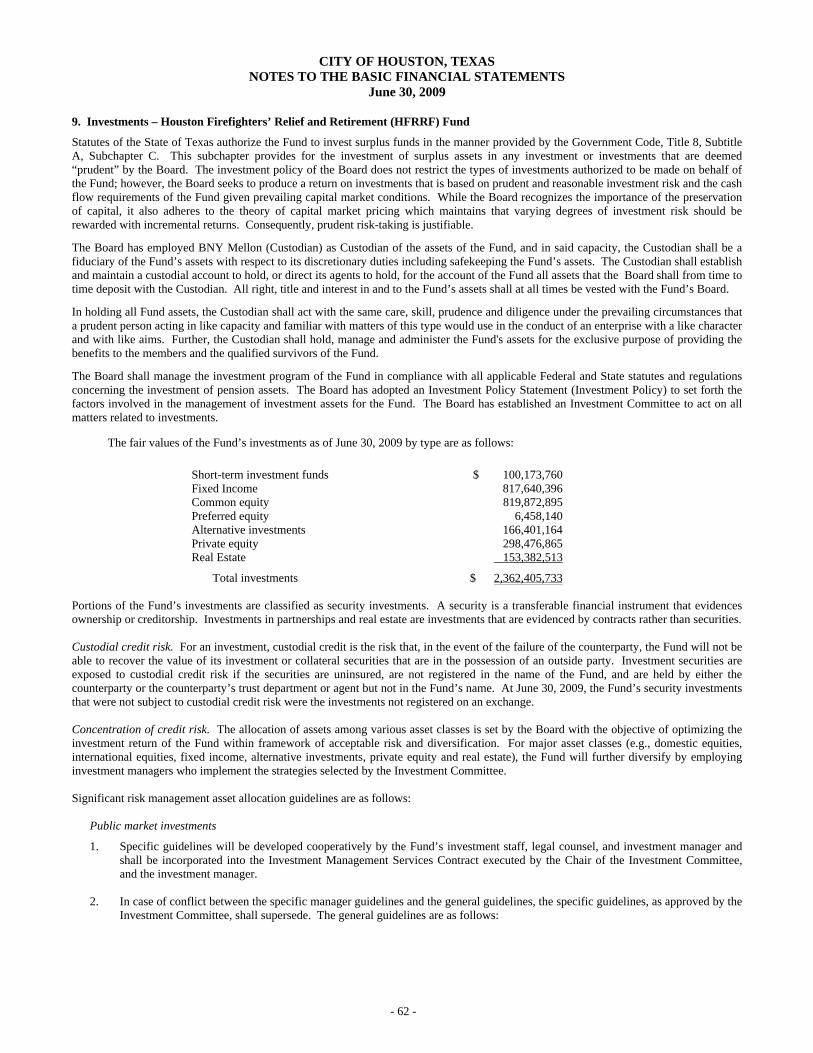
CITY OF HOUSTON, TEXAS NOTES TO THE BASIC FINANCIAL STATEMENTS
June 30, 2009
- 62 -
9. Investments – Houston Firefighters’ Relief and Retirement (HFRRF) Fund
Statutes of the State of Texas authorize the Fund to invest surplus funds in the manner provided by the Government Code, Title 8, Subtitle A, Subchapter C. This subchapter provides for the investment of surplus assets in any investment or investments that are deemed “prudent” by the Board. The investment policy of the Board does not restrict the types of investments authorized to be made on behalf of the Fund; however, the Board seeks to produce a return on investments that is based on prudent and reasonable investment risk and the cash flow requirements of the Fund given prevailing capital market conditions. While the Board recognizes the importance of the preservation of capital, it also adheres to the theory of capital market pricing which maintains that varying degrees of investment risk should be rewarded with incremental returns. Consequently, prudent risk-taking is justifiable.
The Board has employed BNY Mellon (Custodian) as Custodian of the assets of the Fund, and in said capacity, the Custodian shall be a fiduciary of the Fund’s assets with respect to its discretionary duties including safekeeping the Fund’s assets. The Custodian shall establish and maintain a custodial account to hold, or direct its agents to hold, for the account of the Fund all assets that the Board shall from time to time deposit with the Custodian. All right, title and interest in and to the Fund’s assets shall at all times be vested with the Fund’s Board.
In holding all Fund assets, the Custodian shall act with the same care, skill, prudence and diligence under the prevailing circumstances that a prudent person acting in like capacity and familiar with matters of this type would use in the conduct of an enterprise with a like character and with like aims. Further, the Custodian shall hold, manage and administer the Fund's assets for the exclusive purpose of providing the benefits to the members and the qualified survivors of the Fund.
The Board shall manage the investment program of the Fund in compliance with all applicable Federal and State statutes and regulations concerning the investment of pension assets. The Board has adopted an Investment Policy Statement (Investment Policy) to set forth the factors involved in the management of investment assets for the Fund. The Board has established an Investment Committee to act on all matters related to investments.
The fair values of the Fund’s investments as of June 30, 2009 by type are as follows:
Short-term investment funds $ 100,173,760 Fixed Income 817,640,396 Common equity 819,872,895 Preferred equity 6,458,140 Alternative investments 166,401,164 Private equity 298,476,865 Real Estate 153,382,513
Total investments $ 2,362,405,733
Portions of the Fund’s investments are classified as security investments. A security is a transferable financial instrument that evidences ownership or creditorship. Investments in partnerships and real estate are investments that are evidenced by contracts rather than securities.
Custodial credit risk. For an investment, custodial credit is the risk that, in the event of the failure of the counterparty, the Fund will not be able to recover the value of its investment or collateral securities that are in the possession of an outside party. Investment securities are exposed to custodial credit risk if the securities are uninsured, are not registered in the name of the Fund, and are held by either the counterparty or the counterparty’s trust department or agent but not in the Fund’s name. At June 30, 2009, the Fund’s security investments that were not subject to custodial credit risk were the investments not registered on an exchange. Concentration of credit risk. The allocation of assets among various asset classes is set by the Board with the objective of optimizing the investment return of the Fund within framework of acceptable risk and diversification. For major asset classes (e.g., domestic equities, international equities, fixed income, alternative investments, private equity and real estate), the Fund will further diversify by employing investment managers who implement the strategies selected by the Investment Committee.
Significant risk management asset allocation guidelines are as follows:
Public market investments
1. Specific guidelines will be developed cooperatively by the Fund’s investment staff, legal counsel, and investment manager and shall be incorporated into the Investment Management Services Contract executed by the Chair of the Investment Committee, and the investment manager.
2. In case of conflict between the specific manager guidelines and the general guidelines, the specific guidelines, as approved by the Investment Committee, shall supersede. The general guidelines are as follows:

CITY OF HOUSTON, TEXAS NOTES TO THE BASIC FINANCIAL STATEMENTS
June 30, 2009
- 63 -
a. Manager investment philosophy, style, and strategy shall remain consistent and shall not change without the Investment Committee’s approval. The manager shall have discretion to manage the portfolio consistent with the style presented to the Investment Committee at the time of selection and further subject to the restrictions established by the policy herein.
b. The following transactions are prohibited: short sales, selling on margin, put and call options, and the use of derivatives for
speculation unless authorized by the Investment Committee.
c. Transactions that involve a broker acting as a principal, where such broker is also affiliated with the manager who is making the transaction are prohibited, unless specifically approved by the Investment Committee.
d. Transactions shall be executed at competitive costs, or within the parameters established for directed brokerage transactions
by the Investment Committee.
e. Managers shall maintain cash levels consistent with their style as presented to the Investment Committee at the time of selection. Any deviation shall be allowed only after notifying the Chief Investment Officer and should be related to unusual market conditions. The maximum cash level to be held by each manager will be addressed in the Investment Management Agreement or other binding agreement as is appropriate for the investment.
3. The Investment Committee with the assistance from the Fund staff shall monitor each investment manager’s performance and
adherence to style, strategy, and manager specific guidelines. It is the Investment Committee’s discretion to take corrective action by replacing an investment manager if they deem it appropriate at any time.
Alternative and real estate investments
1. The investment specific guidelines for each manager will be incorporated in a Limited Partnership Agreement, Limited Liability Company Agreement, or other binding agreement as is appropriate for the investment. The Chair of the Investment Committee and the manager execute this document.
2. In case of conflict between the specific manager guidelines and the general guidelines, the specific guidelines, as approved by the
Investment Committee, shall supersede. Manager investment philosophy, style, and strategy shall remain consistent and shall not change without the Investment Committee’s approval. The manager shall have discretion to manage the portfolio consistent with the style presented to the Investment Committee at the time of selection and further subject to the restrictions established by the policy herein.
3. The Investment Committee with assistance from the Fund staff shall monitor each Alternative and Real Estate manager’s
performance and adherence to strategy and manager specific guidelines. It is the Investment Committee’s discretion to take corrective action by replacing an investment manager if they deem it feasible and appropriate at any time. Alternative and Real Estate investment manager retention is governed in most cases by Limited Partnership Agreements, Limited Liability Company Agreements, or other binding agreements. In these cases, the Investment Committee with assistance from the Fund staff shall identify available options as allowed by the governing documents and determine the impact and consequences of these options.
As of June 30, 2009, the Fund investment portfolio had no single holdings in excess of 5% of their net assets.
Interest rate risk. The Fund invests in fixed income securities including, but not limited to, investments representing instruments with an obligated fixed rate of interest including public and private debentures, mortgages, investments in life insurance general accounts and guaranteed investment contracts, with maturities greater than one year, and options/futures. Instruments may have an investment grade or non-investment grade rating. Purchases and sales, investment selection and implementation of investment strategies are delegated to the discretion of the investment manager, subject to compliance with its management agreement and the Fund’s Investment Policy.
Interest rate risk is the risk that changes in interest rates will adversely affect the fair value of the investment. Interest rate risk is the greatest risk faced by an investor in the fixed income market. The price of a fixed income security typically moves in the opposite direction of the change in interest rates. The weighted average maturity expresses investment time horizons (when the investment come due and payable) in years, weighted to reflect the dollar size of individual investments within the investment type. The Fund does not have a formal investment policy that limits investment maturities as a means of managing its exposure to potential fair value losses arising from future changes in interest rates, but rather mandates such limits within the Investment Management Services Contract.
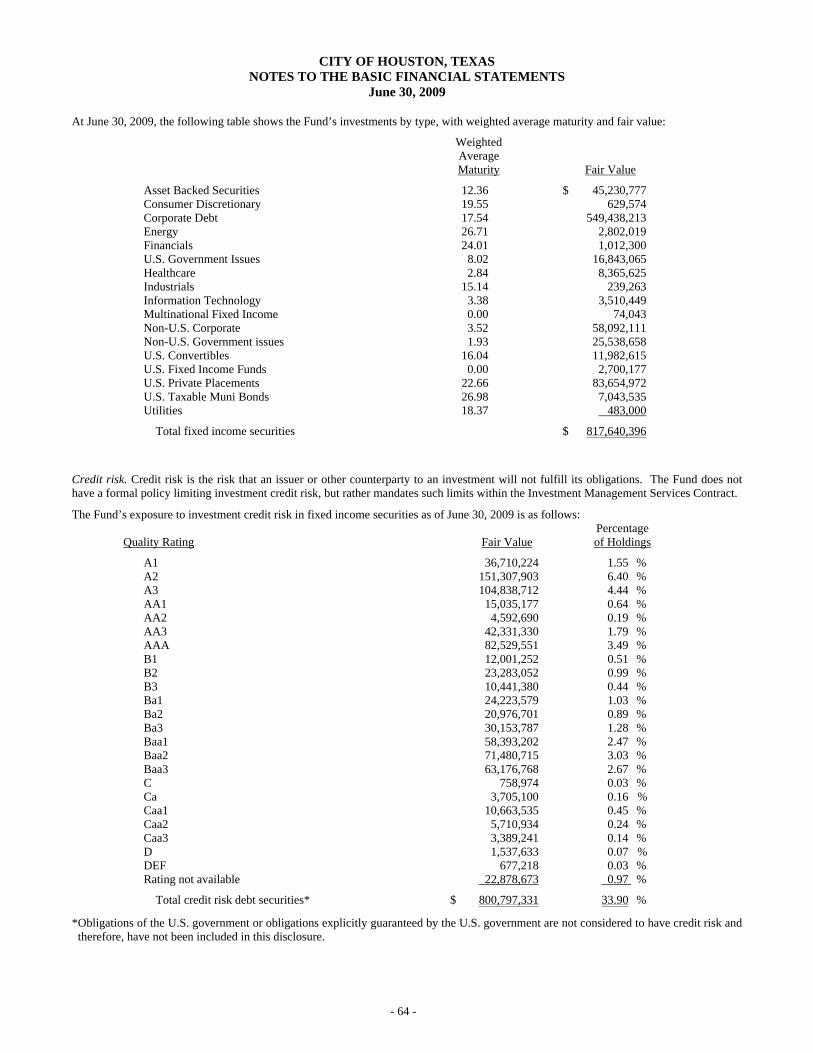
CITY OF HOUSTON, TEXAS NOTES TO THE BASIC FINANCIAL STATEMENTS
June 30, 2009
- 64 -
At June 30, 2009, the following table shows the Fund’s investments by type, with weighted average maturity and fair value: Weighted Average Maturity Fair Value
Asset Backed Securities 12.36 $ 45,230,777 Consumer Discretionary 19.55 629,574 Corporate Debt 17.54 549,438,213 Energy 26.71 2,802,019 Financials 24.01 1,012,300 U.S. Government Issues 8.02 16,843,065 Healthcare 2.84 8,365,625 Industrials 15.14 239,263 Information Technology 3.38 3,510,449 Multinational Fixed Income 0.00 74,043 Non-U.S. Corporate 3.52 58,092,111 Non-U.S. Government issues 1.93 25,538,658 U.S. Convertibles 16.04 11,982,615 U.S. Fixed Income Funds 0.00 2,700,177 U.S. Private Placements 22.66 83,654,972 U.S. Taxable Muni Bonds 26.98 7,043,535 Utilities 18.37 483,000
Total fixed income securities $ 817,640,396
Credit risk. Credit risk is the risk that an issuer or other counterparty to an investment will not fulfill its obligations. The Fund does not have a formal policy limiting investment credit risk, but rather mandates such limits within the Investment Management Services Contract.
The Fund’s exposure to investment credit risk in fixed income securities as of June 30, 2009 is as follows: Percentage Quality Rating Fair Value of Holdings
A1 36,710,224 1.55 % A2 151,307,903 6.40 % A3 104,838,712 4.44 % AA1 15,035,177 0.64 % AA2 4,592,690 0.19 % AA3 42,331,330 1.79 % AAA 82,529,551 3.49 % B1 12,001,252 0.51 % B2 23,283,052 0.99 % B3 10,441,380 0.44 % Ba1 24,223,579 1.03 % Ba2 20,976,701 0.89 % Ba3 30,153,787 1.28 % Baa1 58,393,202 2.47 % Baa2 71,480,715 3.03 % Baa3 63,176,768 2.67 % C 758,974 0.03 % Ca 3,705,100 0.16 % Caa1 10,663,535 0.45 % Caa2 5,710,934 0.24 % Caa3 3,389,241 0.14 % D 1,537,633 0.07 % DEF 677,218 0.03 % Rating not available 22,878,673 0.97 %
Total credit risk debt securities* $ 800,797,331 33.90 %
*Obligations of the U.S. government or obligations explicitly guaranteed by the U.S. government are not considered to have credit risk and therefore, have not been included in this disclosure.

CITY OF HOUSTON, TEXAS NOTES TO THE BASIC FINANCIAL STATEMENTS
June 30, 2009
- 65 -
Foreign currency risk. Foreign currency risk is the risk that changes in exchange rates will adversely affect the fair value of an investment or a deposit. Realized and unrealized gains and losses on investments which result from changes in foreign currency exchange rates have been included in the net depreciation in fair value of investments. The Fund’s policy allows external investment managers to decide what action to take regarding their respective portfolio’s foreign currency exposures subject to compliance with its respective Investment Management Services Contract and the Fund’s Investment Policy Statement.
The Fund’s exposure to foreign currency fluctuation as of June as of June 30, 2009 is as follows: Percentage Fair Value of Holdings
EURO Currency $ 86,511,694 3.66 % British Pound Sterling 74,642,494 3.16 % Japanese Yen 51,955,741 2.20 % Swiss Franc 38,940,768 1.65 % Canadian Dollar 29,237,412 1.24 % Hong Kong Dollar 24,744,027 1.05 % Singapore Dollar 20,303,268 0.86 % Brazil Real 12,615,533 0.53 % Mexican New Peso 10,135,214 0.43 % Norwegian Krone 9,961,550 0.42 % New Zealand Dollar 8,245,446 0.35 % Thailand Baht 7,880,606 0.33 % Indonesian Rupian 7,860,395 0.33 % Australian Dollar 7,858,420 0.33 % South Korean Won 7,489,396 0.32 % New Taiwan Dollar 4,375,645 0.19 % Swedish Krona 3,494,404 0.15 % Danish Krone 3,045,501 0.13 % South African Comm Rand 2,594,098 0.11 % New Turkish Lira 498,087 0.02 % Israeli Shekel 302,407 0.01 % Czech Koruna 21,022 0.00 %
Total securities subject to foreign currency risk $ 412,713,128 17.47 % 10. Investments – Houston Police Officers’ Pension Summary of Significant Accounting Policies Investments. Statutes of the State of Texas authorize the System to invest surplus funds in a manner provided by the Government Code, Title 8, Subtitle A, Subchapter C. These statues stipulate that the governing body of the System is responsible for the management and administration of the funds of the System and shall determine the procedure it finds most efficient and beneficial for the management of the reserve fund of the System. The governing body may directly manage the investments of the System or may choose and contract for professional investment management services. Investments are reported at fair value in accordance with GASB 31, Accounting and Financial Reporting for Certain Investments and for External Investment Pools. Administrative Costs. All administrative costs of the System are paid from the System’s assets. Federal Income Tax. A favorable determination that the System is qualified and exempt from Federal income taxes was received May 26, 2007. The Board believes that the System is designed and continues to operate in compliance with the applicable requirements of the Internal Revenue Code. Use of Estimates. The preparation of the System’s financial statements, in conformity with accounting principles generally accepted in the United States of America, requires management to make significant estimates and assumptions that affect the reported amounts and net plan assets at the date of the financial statements and the actuarial information included in the required supplementary information as of the benefit information date, the changes in the System’s net assets during the reporting period and, when applicable, disclosures of the contingent assets and liabilities at the date of the financial statements. Actual results could differ from those estimates.

CITY OF HOUSTON, TEXAS NOTES TO THE BASIC FINANCIAL STATEMENTS
June 30, 2009
- 66 -
Reclassification – Amounts previously reported as a component of invested securities lending collateral and the corresponding liability for securities lending collateral in the amount of $128,418 thousand for the year ended June 30, 2008, represent the System's securities lending transactions collateralized by letters of credit or by securities that the System does not have the ability to pledge or sell unless the borrower defaults. GASB Statement No. 28, Accounting and Financial Reporting for Securities Lending Transactions (GASB 28), prescribes that these amounts should not be reported as a component of the securities lending related asset and liability in the Statements of Plan Net Assets. Accordingly, amounts reported in the 2008 financial statement have been adjusted to reflect the provisions of GASB 28. This reclassification had no effect on net plan assets held in trust for pension benefits.
The System's investments have been categorized to address deposit and investment risks related to custodial credit risk, credit risk, concentration of credit risk, interest rate risk, and foreign currency risk.
Custodial Credit Risk. Custodial credit risk for deposits is the risk that in the event of a bank failure, the System’s deposits may not be returned to them. The System considers only demand deposits as cash. As of June 30, 2009, the System had a balance of $283 thousand on deposit at a financial institution. The Federal Depository Insurance Corporation (FDIC) covered cash on deposit up to $250 thousand at this financial institution. As of June 30, 2009, $33 thousand of the System’s bank balance of $283 thousand was exposed to custodial credit risk. Prior to June 30, 2009, FDIC coverage was $100 thousand per account at this financial institution. In addition, At June 30, 2009 the System had approximately $964 thousand on deposit with other financial institutions, which is subject to custodial credit risk, as it is not covered by depository insurance and is uncollateralized. Credit Risk. Credit risk is the risk that the counterparty will not fulfill its obligations. As of June 30, 2009, the System’s fixed income assets that are not government guaranteed represented 80.5% of the System’s fixed income portfolio. The below tables summarize the System’s fixed income portfolio exposure levels and credit qualities.
Fixed Income Security TypeMarket Value
($000's)
Weighted Average Credit
QualityCorporate Bonds 202,641$ 17.4% BBInternational Government Bonds 69,438 6% AABank Loans 69,125 5.9% BBMutual Bond Funds 217,746 18.7% Not RatedShort Term Investment Funds 379,182 32.5% Not RatedTotal 938,132$ 80.5%
Percent of Total
Average Credit Quality and Exposure Levels of Non-U.S. Government Guaranteed Securities ($000’s)
Credit Rating Level
Corporate Bonds
Government Bonds Bank Loans
Mutual Bond Funds
Short Term Investment Funds
AAA 1,187$ 21,940$ -$ -$ - AA 5,145 35,290 - - - A 15,807 9,624 - - - BBB 52,665 904 2,089 - - BB 50,806 - 13,932 - - B 55,690 - 22,627 - - CCC 15,409 - 1,780 - - CC 670 - - - - D 769 - 1,755 - - Not Rated 4,493 1,680 26,942 217,746 379,182 Total 202,641$ 69,438$ 69,125$ 217,746$ 379,182$
Ratings Dispersion Detail(000's)

CITY OF HOUSTON, TEXAS NOTES TO THE BASIC FINANCIAL STATEMENTS
June 30, 2009
- 67 -
The System’s investment policy allows Investment managers full discretion in adopting investment strategies to deal with these risks. Unless otherwise provided in the individual investment manager agreement, the average quality rating of each individual fixed income portfolio on a weighted value basis shall be A-rated or higher, and no issue should have a rating below investment grade (Baa or higher). Certain managers, such as high yield managers, may be exempted from these requirements as provided for in their contracts. Credit risk for derivative instruments held by the System results from counterparty risk, essentially that the counterparty will be unable to fulfill its obligations, assumed by the System. Information regarding the System’s credit risk related to derivatives is found under the derivatives disclosures. Policies regarding credit risk pertaining to credit risk associated with the System’s securities lending program are found under the securities lending disclosures. Concentration of Credit Risk. Concentration of credit risk is the risk of loss attributable to the magnitude of the System’s investment in a single issue. The System’s operational guidelines for each specific portfolio limits investments in any one single domestic equity issue to 15% of each portfolio at market value and for any one single international equity issue to 5% of the System’s investments. For fixed income investments, the System’s policy limits, by each specific portfolio, investment in any one single fixed income security to 10% of each portfolio at market value. As of June 30, 2009, the System did not have any investments in any one organization which represented greater than 5% of plan net assets. Interest Rate Risk. Interest rate risk is the risk that changes in interest rates will adversely affect the fair values of the System’s financial instruments. This risk is managed within the portfolio using the modified duration methodology. It is widely used in the management of fixed income portfolios and estimates the sensitivity of a bond’s price to interest rate changes. All of the System’s fixed income portfolios are managed in accordance with guidelines that are specific as to the degree of interest rate risk taken. The reporting of modified duration found in the tables below quantifies the interest rate risk of the System’s fixed income investments. Interest rate risks associated with derivative instruments are found in the derivatives disclosures of these notes.
Security TypeMarket Value
($000's)
Weighted Average Modified Duration
(years)US Treasuries 227,060$ 19.5% 14.9Corporate Bonds 202,641 17.4% 5.8International Government Bonds 69,438 6% 6.2Bank Loans 69,125 5.9% 0.5Mutual Bond Funds 217,746 18.7% 3.0Short Term Investment Funds 379,182 32.5% 0.2Total 1,165,192$ 100.0% 4.9
Modified Duration by Security Type
Percent of Total

CITY OF HOUSTON, TEXAS NOTES TO THE BASIC FINANCIAL STATEMENTS
June 30, 2009
- 68 -
Corporate Bonds
Market Value
($000's)
Contribution Modifed Duration
Less than 1 year to maturity 2,312$ 0.9 0.01 to 10 years maturities 155,296 4.5 3.410 to 20 years maturities 11,402 8.2 0.5Greater than 20 years maturities 33,631 11.5 1.9Total 202,641$ 5.8
International Government Bonds 1 to 10 years maturities 46,868$ 3.2 2.210 to 20 years maturities 10,407 10.9 1.6Greater than 20 years maturities 12,163 13.5 2.4Total 69,438$ 6.2
Bank Loans Less than 1 year to maturity 151$ 0.5 0.01 to 10 years maturities 68,746 0.5 0.5Greater than 20 years maturities 228 0.5 0.0Total 69,125$ 0.5
Modified Duration Analysis by Security Type
Average Modified Duration
Foreign Currency Risk. Foreign currency risk is the risk that changes in exchange rates will adversely impact the fair value of an investment. The books and records of the System are maintained in US dollars. Foreign currencies and non-US dollar denominated investments are translated into US dollars at the bid prices of such currencies against US dollars at each balance sheet date. Realized and unrealized gains and losses on investments which result from changes in foreign currency exchange rates have been included in the net appreciation in fair value of investments. Net realized foreign currency gains and losses resulting from changes in exchange rates include foreign currency gains and losses between trade date and settlement date of investment securities transactions, foreign currency transactions and the difference between the amounts of interest and dividends recorded on the books of the System and the amount actually received. The System’s exposure to foreign currency risk in U.S. dollars as of June 30, 2009, is shown in the table below:
CurrencyShort Term Investments Equities
Fixed Income
Alternative Investments
Options on Foreign
Currencies TotalAustralian dollar (10)$ -$ -$ -$ -$ (10)$ British pound sterling (25) 39,583 5,186 - (5,601) 39,143 Canadian dollar (21) 3,263 888 - (879) 3,251 Danish krone - - 897 - (892) 5 Euro 1,769 93,300 32,552 14,764 (32,009) 110,376 Hong Kong dollar - 2,322 - - - 2,322 Japanese yen 192 64,761 29,501 - (29,266) 65,188 New Zealand dollar - 984 - - - 984 Norwegian krone - 1,539 - - - 1,539 Singapore dollar 1,195 1,195 South Korean won - 1,541 - - - 1,541 Swedish krona 7 6,207 333 - (323) 6,224 Swiss franc 673 9,893 - - - 10,566
2,585$ 224,588$ 69,357$ 14,764$ (68,970)$ 242,324$
Foreign Currency Exposure by Asset Class($000's)

CITY OF HOUSTON, TEXAS NOTES TO THE BASIC FINANCIAL STATEMENTS
June 30, 2009
- 69 -
Securities Lending Program – The Board of Trustees’ policies permit the System to lend securities (domestic and international equities and fixed income) to securities firms on a temporary basis through its custodian bank. The System receives fees for all loans and retains the right to all interest and dividend payments while the securities are on loan. Cash, letters of credit or various government securities having market values equal to or exceeding 102 and 105 percent of the value of the loaned securities for domestic and international securities, respectively, collateralize all security loan agreements. Whenever market value of the securities on loan changes, the borrower must adjust the collateral accordingly. The System's bank pools all collateral received from securities lending transactions and invests any cash collateral. The System holds an undivided share of the collateral provided by the borrowers of the securities. At June 30, 2009 the weighted-average maturity of the collateral pool was 16 days. The relationship between the maturities of the collateral pool and the System's loans has not been determined. Cash collateral invested in the custodian bank collateral pool at June 30, 2009 was $297,146 thousand. The System also has non-cash collateral at June 30, 2009 of $47 thousand consisting of treasury securities and letters of credit. The System cannot sell or pledge the collateral unless the borrower fails to return the securities borrowed. The market value of securities on loan at June 30, 2009 was $290,240 thousand. At June 30, 2009, the System had no credit risk exposure to borrowers because the amounts the System owes the borrowers, $297,192 thousand, exceeds the amounts the borrowers owe the System, $290,240 thousand. Derivatives – The System's investment managers may invest in derivatives if permitted by the guidelines established by the System's Board of Trustees. The System's staff monitors guidelines and compliance. From time to time the System's investment managers will invest in foreign currency contracts, options, swaps, reverse repurchase agreements, index linked bonds, collateralized mortgage obligations and mortgage-backed securities. No derivatives are purchased with borrowed funds. These derivative instruments are subject to the following risks: • Credit Risk – The risk that the counterparty will not fulfill its obligations. The System’s investment managers seek to control this risk
through counterparty credit evaluations and approvals, counterparty credit limits, and exposure monitoring procedures.
• Interest Rate Risk – The risk that changes in interest rates will adversely affect the fair values of the System’s financial instruments or cash flows.
• Basis Risk – The risk that arises when variable interest rates on a derivative and an associated bond or other interest-paying financial
instrument are based on different indexes. • Termination Risk – The risk that a derivative’s unscheduled end will adversely affect an investment manager’s strategy. • Rollover Risk – The risk that a derivative associated with the System’s fixed income investments does not extend to the maturity of those
investments. Foreign currency contracts are used to hedge against the currency risk in the System’s investments in foreign equity and fixed income securities. The other derivatives are used to enhance yields and provide incremental income. Futures on investments are used to take advantage of mis-pricing opportunities. When a position is taken in a futures contract, a margin is posted and the contract is subject to daily mark-to-market adjustments. To liquidate the contract prior to expiration an offsetting position in the same contract must be taken. The average futures balance outstanding, not including foreign currency contracts, during the fiscal year ending June 30, 2009 was $168,016 thousand. Futures outstanding, not including foreign currency contracts at June 30, 2009 was $202,381 thousand. The notional values associated with derivative instruments are generally not recorded on the financial statements; however, the amounts for the exposure (unrealized gains/losses) on these instruments are recorded. The contract or notional amounts of these instruments reflect the extent of the System’s involvement in each class of financial instrument as of June 30, 2009 as follows (in thousands):
Description ContractNotional
Value Exposure Futures on Treasury Bills and Equivalents 7 $ 4,485 $ 12 Commodity Futures 0 - - Equity Futures 3 173,791 (2,674)Fixed Income Futures 9 24,104 339 Long foreign currency contracts 74 71,067 (5)Short foreign currency contracts 74 (71,449) (377)Total $ 201,998 $ (2,705)

CITY OF HOUSTON, TEXAS NOTES TO THE BASIC FINANCIAL STATEMENTS
June 30, 2009
- 70 -
Alternative Investments – As of June 30, 2009 the System was invested in various partnerships, separate accounts and commingled funds across various types of alternative investments as detailed in the following chart ($000's).
Investment TypePrivate Equity Leveraged Buyouts 94,847$ Special Situations 85,010 Venture Capital 61,845 Other Alternatives Hedge Funds 252,895 Real Estate 7,131 Structured Beta 247,660
749,388$
Fair Value ($000's)
NOTE 4: ALLOWANCE FOR DOUBTFUL ACCOUNTS The following were the allowances for doubtful accounts receivable by fund as of June 30, 2009 (000’s):
Fund AmountGeneral Uncollectible general property taxes 53,707$ Ambulance charges 305,158 Fines and forfeits 31,099 Demolition liens 82,005 Others 4,706 Grant revenue 40,065 Airport System 2,428 Convention and Entertainment Facilities Accounts receivable 718 Hotel occupancy tax 373 Combined Utility System 99,232
619,491$
NOTE 5: PROPERTY TAX The City's annual ad valorem property tax is required to be levied by October 1, or as soon thereafter as practicable, on the assessed value listed as of the prior January 1 for all real and certain personal property. Taxes are due on January 31 of the year following the year of the levy. A tax lien attaches to all property on January 1 of each year to secure the payment of all taxes, penalties and interest that is ultimately imposed on the property. The tax rate established by the City Council for the 2008 tax year was $0.63875 per $100 of assessed value with $0.455688 for operations and $0.183062 for debt service. The City Charter limits the property tax rate to $0.50 per $100 of assessed valuation excluding taxes levied for "debt service," as that term is defined in Section 1 of Article III of the City Charter. The Texas Property Tax Code ("Code"), with certain exceptions, exempts intangible personal property, household goods, and family-owned automobiles from taxation. In addition, the Code provides for countywide appraisal districts.

CITY OF HOUSTON, TEXAS NOTES TO THE BASIC FINANCIAL STATEMENTS
June 30, 2009
- 71 -
NOTE 6: CAPITAL ASSETS A. Governmental activities of the Primary Government
A summary of changes in capital assets for the year ended June 30, 2009 follows (in thousands):
Balance BalanceJuly 1, June 30,2008 Additions Retirements Transfers 2009
Primary Government Capital assets not being depreciated:
Land 327,295$ 5,952$ (495)$ 9,088$ 341,840$ Right of way 1,701,758 5,045 (1,722) 9,235 1,714,316 Construction Work in Progress 413,613 329,438 - (293,652) 449,399
Total capital assets not being depreciated 2,442,666 340,435 (2,217) (275,329) 2,505,555 Other capital assets:
Buildings 692,727 34 (10) 58,260 751,011 Improvements and Equipment 703,018 56,834 (26,545) 15,027 748,334 Infrastructure 5,095,619 5,580 (311) 200,738 5,301,626
Total other capital assets 6,491,364 62,448 (26,866) 274,025 6,800,971 Less accumulated depreciation for:
Buildings (209,017) (16,884) 10 (90) (225,981) Improvements and Equipment (462,720) (43,945) 25,186 17 (481,462) Infrastructure (2,202,948) (115,050) 32 304 (2,317,662)
Total accumulated depreciation (2,874,685) (175,879) 25,228 231 (3,025,105) Other capital assets, net 3,616,679 (113,431) (1,638) 274,256 3,775,866
Primary Government capital assets, net 6,059,345$ 227,004$ (3,855)$ (1,073)$ 6,281,421$
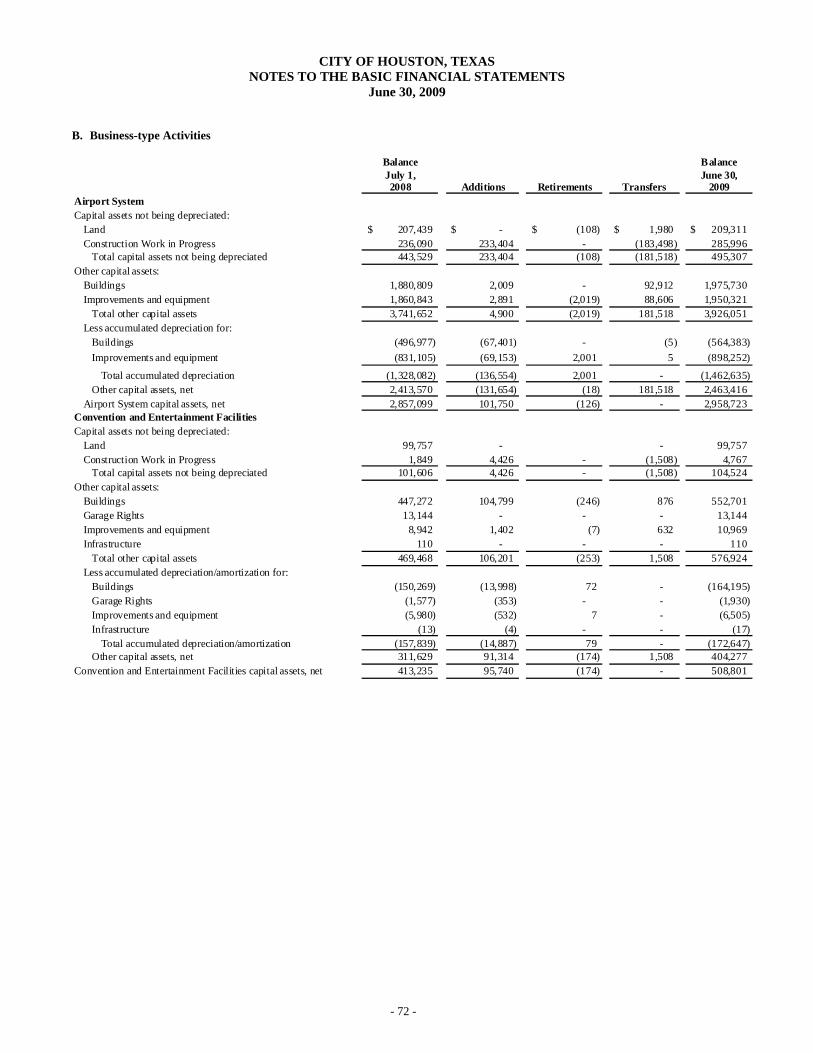
CITY OF HOUSTON, TEXAS NOTES TO THE BASIC FINANCIAL STATEMENTS
June 30, 2009
- 72 -
B. Business-type Activities
Balance BalanceJuly 1, June 30,2008 Additions Retirements Transfers 2009
Airport System Capital assets not being depreciated:
Land 207,439$ -$ (108)$ 1,980$ 209,311$ Construction Work in Progress 236,090 233,404 - (183,498) 285,996
Total capital assets not being depreciated 443,529 233,404 (108) (181,518) 495,307 Other capital assets:
Buildings 1,880,809 2,009 - 92,912 1,975,730 Improvements and equipment 1,860,843 2,891 (2,019) 88,606 1,950,321
Total other capital assets 3,741,652 4,900 (2,019) 181,518 3,926,051 Less accumulated depreciation for:
Buildings (496,977) (67,401) - (5) (564,383) Improvements and equipment (831,105) (69,153) 2,001 5 (898,252)
Total accumulated depreciation (1,328,082) (136,554) 2,001 - (1,462,635) Other capital assets, net 2,413,570 (131,654) (18) 181,518 2,463,416
Airport System capital assets, net 2,857,099 101,750 (126) - 2,958,723 Convention and Entertainment FacilitiesCapital assets not being depreciated:
Land 99,757 - - 99,757 Construction Work in Progress 1,849 4,426 - (1,508) 4,767
Total capital assets not being depreciated 101,606 4,426 - (1,508) 104,524 Other capital assets:
Buildings 447,272 104,799 (246) 876 552,701 Garage Rights 13,144 - - - 13,144 Improvements and equipment 8,942 1,402 (7) 632 10,969 Infrastructure 110 - - - 110
Total other capital assets 469,468 106,201 (253) 1,508 576,924 Less accumulated depreciation/amortization for:
Buildings (150,269) (13,998) 72 - (164,195) Garage Rights (1,577) (353) - - (1,930) Improvements and equipment (5,980) (532) 7 - (6,505) Infrastructure (13) (4) - - (17)
Total accumulated depreciation/amortization (157,839) (14,887) 79 - (172,647) Other capital assets, net 311,629 91,314 (174) 1,508 404,277
Convention and Entertainment Facilities capital assets, net 413,235 95,740 (174) - 508,801
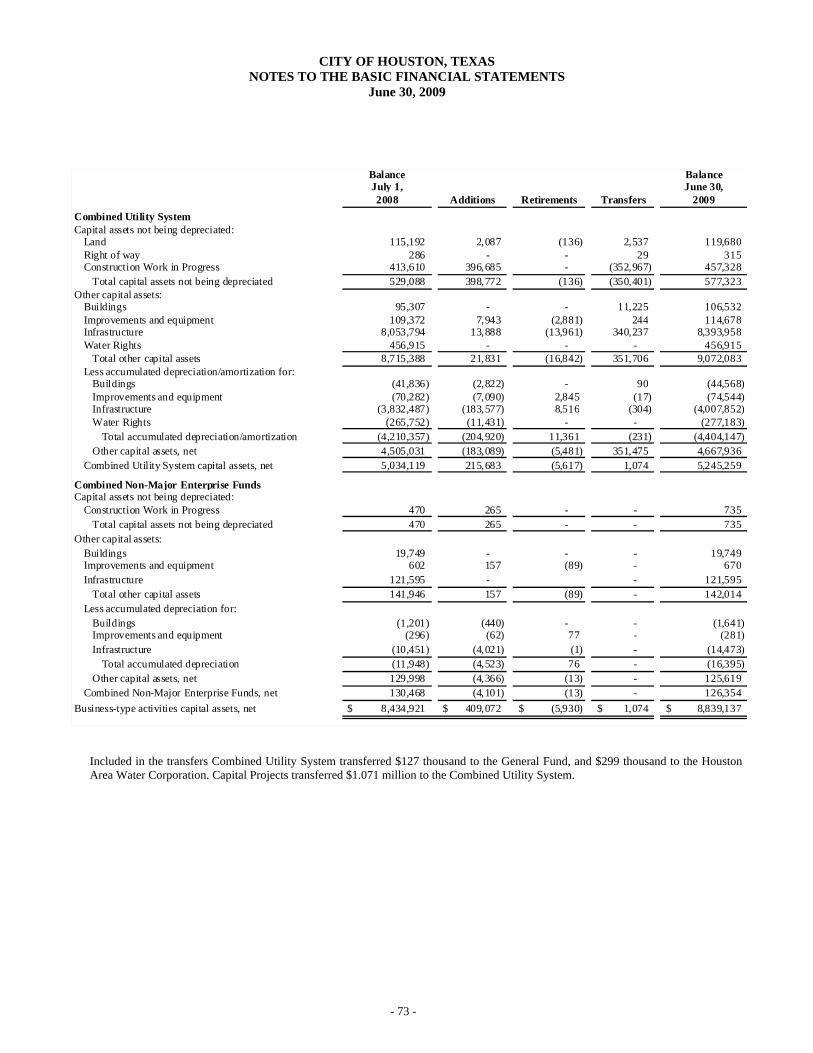
CITY OF HOUSTON, TEXAS NOTES TO THE BASIC FINANCIAL STATEMENTS
June 30, 2009
- 73 -
Balance BalanceJuly 1, June 30,2008 Additions Retirements Transfers 2009
Combined Utility SystemCapital assets not being depreciated:
Land 115,192 2,087 (136) 2,537 119,680 Right of way 286 - - 29 315 Construction Work in Progress 413,610 396,685 - (352,967) 457,328
Total capital assets not being depreciated 529,088 398,772 (136) (350,401) 577,323 Other capital assets:
Buildings 95,307 - - 11,225 106,532 Improvements and equipment 109,372 7,943 (2,881) 244 114,678 Infrastructure 8,053,794 13,888 (13,961) 340,237 8,393,958 Water Rights 456,915 - - - 456,915
Total other capital assets 8,715,388 21,831 (16,842) 351,706 9,072,083 Less accumulated depreciation/amortization for:
Buildings (41,836) (2,822) - 90 (44,568) Improvements and equipment (70,282) (7,090) 2,845 (17) (74,544) Infrastructure (3,832,487) (183,577) 8,516 (304) (4,007,852) Water Rights (265,752) (11,431) - - (277,183)
Total accumulated depreciation/amortization (4,210,357) (204,920) 11,361 (231) (4,404,147) Other capital assets, net 4,505,031 (183,089) (5,481) 351,475 4,667,936
Combined Utility System capital assets, net 5,034,119 215,683 (5,617) 1,074 5,245,259
Combined Non-Major Enterprise FundsCapital assets not being depreciated:
Construction Work in Progress 470 265 - - 735 Total capital assets not being depreciated 470 265 - - 735
Other capital assets:Buildings 19,749 - - - 19,749 Improvements and equipment 602 157 (89) - 670 Infrastructure 121,595 - - 121,595
Total other capital assets 141,946 157 (89) - 142,014 Less accumulated depreciation for:
Buildings (1,201) (440) - - (1,641) Improvements and equipment (296) (62) 77 - (281) Infrastructure (10,451) (4,021) (1) - (14,473)
Total accumulated depreciation (11,948) (4,523) 76 - (16,395) Other capital assets, net 129,998 (4,366) (13) - 125,619
Combined Non-Major Enterprise Funds, net 130,468 (4,101) (13) - 126,354 Business-type activities capital assets, net 8,434,921$ 409,072$ (5,930)$ 1,074$ 8,839,137$
Included in the transfers Combined Utility System transferred $127 thousand to the General Fund, and $299 thousand to the Houston Area Water Corporation. Capital Projects transferred $1.071 million to the Combined Utility System.
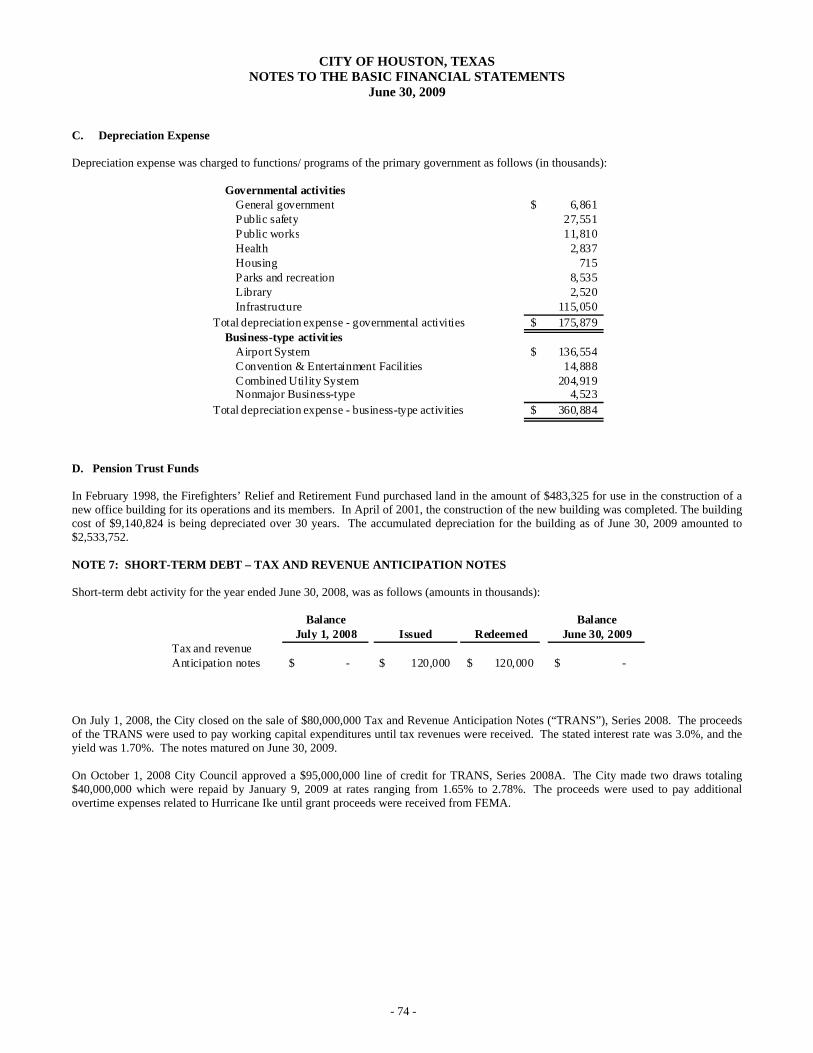
CITY OF HOUSTON, TEXAS NOTES TO THE BASIC FINANCIAL STATEMENTS
June 30, 2009
- 74 -
C. Depreciation Expense Depreciation expense was charged to functions/ programs of the primary government as follows (in thousands):
Governmental activities
General government 6,861$ Public safety 27,551 Public works 11,810 Health 2,837 Housing 715 Parks and recreation 8,535 Library 2,520 Infrastructure 115,050
Total depreciation expense - governmental activities 175,879$ Business-type activit ies
Airport System 136,554$ Convention & Entertainment Facilities 14,888 Combined Utility System 204,919 Nonmajor Business-type 4,523
Total depreciation expense - business-type activities 360,884$
D. Pension Trust Funds In February 1998, the Firefighters’ Relief and Retirement Fund purchased land in the amount of $483,325 for use in the construction of a new office building for its operations and its members. In April of 2001, the construction of the new building was completed. The building cost of $9,140,824 is being depreciated over 30 years. The accumulated depreciation for the building as of June 30, 2009 amounted to $2,533,752. NOTE 7: SHORT-TERM DEBT – TAX AND REVENUE ANTICIPATION NOTES Short-term debt activity for the year ended June 30, 2008, was as follows (amounts in thousands):
Balance BalanceJuly 1, 2008 Issued Redeemed June 30, 2009
Tax and revenueAnticipation notes -$ 120,000$ 120,000$ -$
On July 1, 2008, the City closed on the sale of $80,000,000 Tax and Revenue Anticipation Notes (“TRANS”), Series 2008. The proceeds of the TRANS were used to pay working capital expenditures until tax revenues were received. The stated interest rate was 3.0%, and the yield was 1.70%. The notes matured on June 30, 2009. On October 1, 2008 City Council approved a $95,000,000 line of credit for TRANS, Series 2008A. The City made two draws totaling $40,000,000 which were repaid by January 9, 2009 at rates ranging from 1.65% to 2.78%. The proceeds were used to pay additional overtime expenses related to Hurricane Ike until grant proceeds were received from FEMA.

CITY OF HOUSTON, TEXAS NOTES TO THE BASIC FINANCIAL STATEMENTS
June 30, 2009
- 75 -
NOTE 8: LONG-TERM LIABILITIES A. General Long-Term Liabilities Changes in General Long-Term Liabilities for the year ended June 30, 2009 are summarized as follows (in thousands):
AmountsBalance Retirements/ Balance Due within
July 1, 2008 Additions Transfers June 30, 2009 One YearGovernmental ActivitiesBonds and notes payable
General tax obligation debt 2,982,826$ 968,111$ (841,937)$ 3,109,000$ 240,935$ Accretions, net 2,480 371 (175) 2,676 - HUD Section 108 Loans 15,060 - (1,745) 13,315 3,305 Deferred charges for electricity 1,515 - (1,515) - - Plus premium (discount) on bonds 89,194 (327) (6,541) 82,326 - Less deferred amount on refundings (16,581) - 2,246 (14,335) -
Total bonds and notes payable 3,074,494 968,155 (849,667) 3,192,982 244,240
Other liabilities: Claims and judgments 142,369 6,083 (14,169) 134,283 14,927 Compensated absences 400,313 62,700 (51,703) 411,310 134,581 Arbitrage rebate 242 112 (18) 336 -
Other Post Employment Benefit liability 239,622 234,113 (47,666) 426,069 - Pension liability 561,765 252,658 (194,116) 620,307 -
Total other liabilities 1,344,311 555,666 (307,672) 1,592,305 149,508 Governmental Activities Long-Term Liabilities 4,418,805$ 1,523,821$ (1,157,339)$ 4,785,287$ 393,748$
Discretely Presented Component Units:Notes payable 338,908$ 29,852$ (21,777)$ 346,983$ 41,817$ Revenue bonds 146,085 28,500 (5,899) 168,686 6,475
Discretely Presented ComponentUnits Long-Term Liabilities 484,993$ 58,352$ (27,676)$ 515,669$ 48,292$ (Continued)
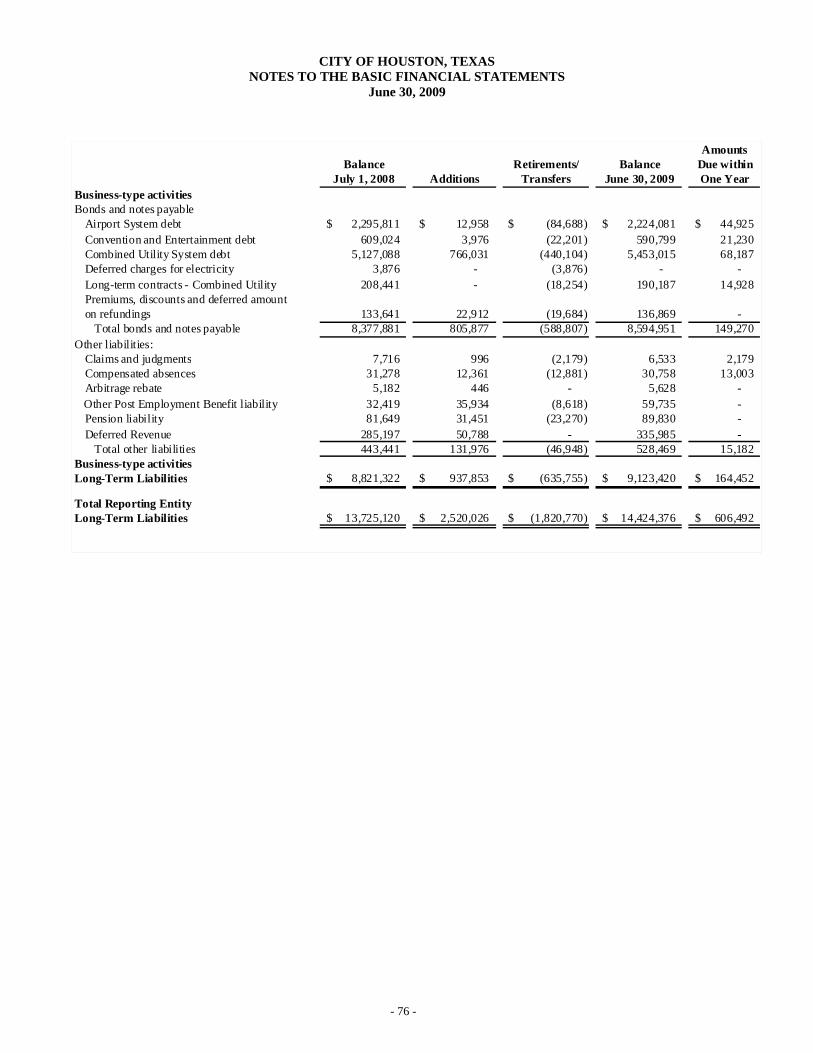
CITY OF HOUSTON, TEXAS NOTES TO THE BASIC FINANCIAL STATEMENTS
June 30, 2009
- 76 -
AmountsBalance Retirements/ Balance Due within
July 1, 2008 Additions Transfers June 30, 2009 One YearBusiness-type activitiesBonds and notes payable
Airport System debt 2,295,811$ 12,958$ (84,688)$ 2,224,081$ 44,925$ Convention and Entertainment debt 609,024 3,976 (22,201) 590,799 21,230 Combined Utility System debt 5,127,088 766,031 (440,104) 5,453,015 68,187 Deferred charges for electricity 3,876 - (3,876) - - Long-term contracts - Combined Utility 208,441 - (18,254) 190,187 14,928 Premiums, discounts and deferred amount on refundings 133,641 22,912 (19,684) 136,869 -
Total bonds and notes payable 8,377,881 805,877 (588,807) 8,594,951 149,270 Other liabilities:
Claims and judgments 7,716 996 (2,179) 6,533 2,179 Compensated absences 31,278 12,361 (12,881) 30,758 13,003 Arbitrage rebate 5,182 446 - 5,628 -
Other Post Employment Benefit liability 32,419 35,934 (8,618) 59,735 - Pension liability 81,649 31,451 (23,270) 89,830 - Deferred Revenue 285,197 50,788 - 335,985 -
Total other liabilities 443,441 131,976 (46,948) 528,469 15,182 Business-type activities Long-Term Liabilities 8,821,322$ 937,853$ (635,755)$ 9,123,420$ 164,452$
Total Reporting EntityLong-Term Liabilities 13,725,120$ 2,520,026$ (1,820,770)$ 14,424,376$ 606,492$

CITY OF HOUSTON, TEXAS NOTES TO THE BASIC FINANCIAL STATEMENTS
June 30, 2009
- 77 -
This Page is left blank intentionally.

CITY OF HOUSTON, TEXAS NOTES TO THE BASIC FINANCIAL STATEMENTS
June 30, 2009
- 78 -
B. Schedule of Changes in Bonds and Long-Term contracts (amounts expressed in thousands):
Face Value FY09Stated Interest Outstanding Issued/Rate Range, % 6/30/2008 Increased
General Tax Obligation Debt General obligation bonds 5.40 -$ -$ Public improvement bonds 3.00 to 5.75 1,798,150 324,030 Pension obligations 5.31 to 6.29 472,205 359,226 Commercial paper 0.78 to 10.00 625,950 284,855 Tax and revenue certificates of obligation 3.00 to 6.00 86,521 - Deferred electricity note 5.26 1,515 -
Total General Tax Obligation Debt 2,984,341$ 968,111$
HUD Section 108 Loans 15,060$ -$
Revenue Bonded Debt Airport System Bonds Senior Lien Revenue Bonds 7.20 to 8.20 -$ -$ Subordinate lien refunding revenue bonds 0.52 to 6.00 2,126,305 - Senior lien commercial paper 1.39 to 10.00 83,000 10,000 Inferior lien contractual obligation 5.38 to 5.50 49,700 - Pension obligations 5.31 to 6.29 36,806 2,958 Deferred electricity note 5.26 1,011 -
2,296,822 12,958 Convention and Entertainment Facilities Senior lien hotel occupancy tax/parking facilities 1.12 to 5.75 561,735 -
Convention Center/Hotel Commercial Paper - Note Payable - Hotel and parking revenue commercial paper 0.79 to 10.00 43,800 Pension obligations 5.31 to 6.29 3,489 3,976 Deferred electricity note 5.26 255 -
609,279 3,976 Combined Utility System Combined Utility System first lien bonds 0.76 to 6.00 4,145,405 537,595 Water and Sewer System junior lien revenue bond 1.25 to 6.90 770,201 - Combined Utility System commercial paper na 156,500 166,275 Pension obligations 5.31 to 6.29 54,982 62,161 Deferred electricity note 5.26 2,610 - 5,129,698 766,031
Long-Term Contracts-Water and Sewer System Coastal Water Authority 3.00 to 7.50 184,645 - Other long term contracts 3.22 to 5.87 23,796
208,441 -
Total Revenue Bonded Debt and Long-TermContracts, Primary Government 8,244,240$ 782,965$
Total Bonds and Long-Term Contracts Payable,Primary Government 11,243,641$ 1,751,076$
1) Adjustments consist of unamortized bond premiums, discounts, deferred (gains) losses from bond refundings and capital appreciation bond accretions.
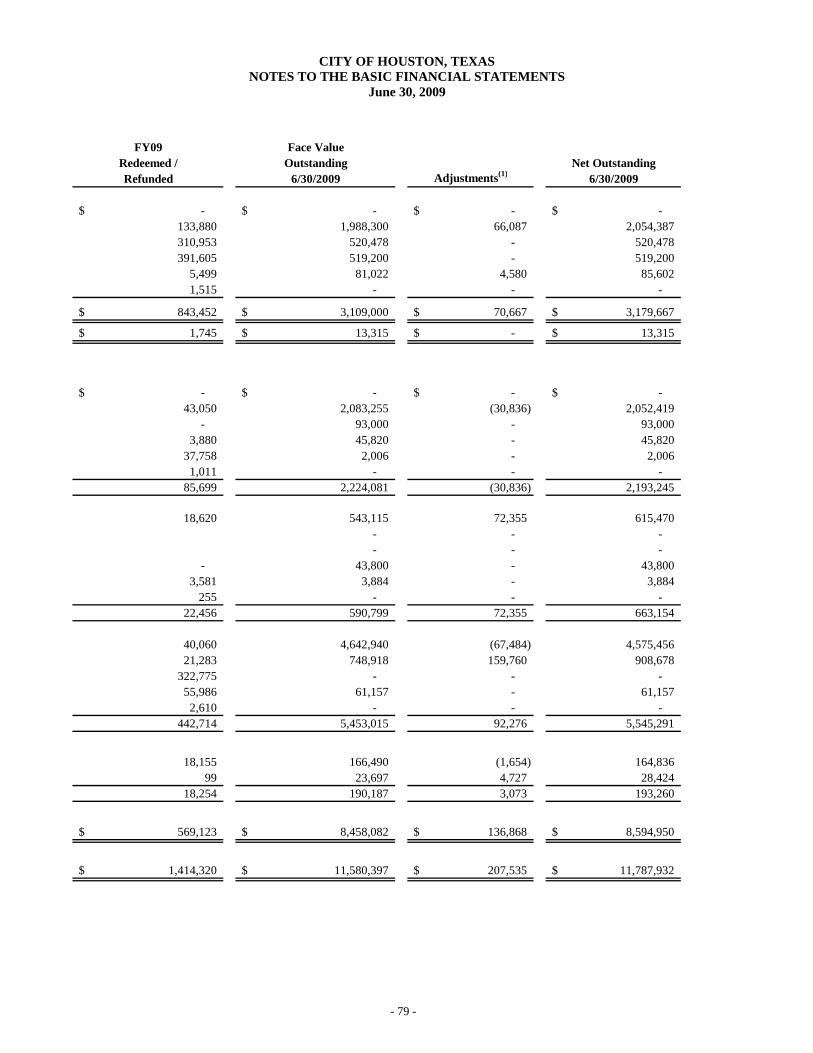
CITY OF HOUSTON, TEXAS NOTES TO THE BASIC FINANCIAL STATEMENTS
June 30, 2009
- 79 -
FY09 Face Value
Redeemed / Outstanding Net OutstandingRefunded 6/30/2009 Adjustments(1) 6/30/2009
-$ -$ -$ -$ 133,880 1,988,300 66,087 2,054,387 310,953 520,478 - 520,478 391,605 519,200 - 519,200
5,499 81,022 4,580 85,602 1,515 - - -
843,452$ 3,109,000$ 70,667$ 3,179,667$
1,745$ 13,315$ -$ 13,315$
-$ -$ -$ -$ 43,050 2,083,255 (30,836) 2,052,419
- 93,000 - 93,000 3,880 45,820 - 45,820
37,758 2,006 - 2,006 1,011 - - -
85,699 2,224,081 (30,836) 2,193,245
18,620 543,115 72,355 615,470 - - - - - -
- 43,800 - 43,800 3,581 3,884 - 3,884
255 - - - 22,456 590,799 72,355 663,154
40,060 4,642,940 (67,484) 4,575,456 21,283 748,918 159,760 908,678
322,775 - - - 55,986 61,157 - 61,157 2,610 - - -
442,714 5,453,015 92,276 5,545,291
18,155 166,490 (1,654) 164,836 99 23,697 4,727 28,424
18,254 190,187 3,073 193,260
569,123$ 8,458,082$ 136,868$ 8,594,950$
1,414,320$ 11,580,397$ 207,535$ 11,787,932$
CITY OF HOUSTON, TEXAS NOTES TO THE BASIC FINANCIAL STATEMENTS
June 30, 2009
- 80 -
C. Terms of Long-Term Debt
1. Public Improvement Bonds
The City has issued Public Improvement Bonds on numerous occasions. The bonds are payable from ad valorem tax revenues. The proceeds are used for street and bridge improvements, traffic signals, municipal buildings, parks, and other capital improvements. Interest is payable semi-annually; principal is payable in various amounts annually through March 1, 2038.
2. Pension Obligation Bonds
The City has issued several series of General Obligation Taxable Pension Bonds. The proceeds were used to reduce the unfunded actuarial accrued liability of the Houston Municipal Employees Pension System and the Houston Police Officers Pension System. Interest is payable semi-annually, and principal is payable in varying amounts through 2037. Although these obligations have an ad valorem tax pledge, a portion of the liabilities is recorded in the enterprise funds because the liabilities are directly related and expected to be paid from those funds based on percentages of payroll.
3. General Obligation Swap Agreements
On February 20, 2004 the City entered into a basis swap referred to as a synthetic reduced variance coupon swap with RFPC, LLC (“RFPC”). Objective. The objective of the swap is for the City to reduce its fixed rate debt service costs through a swap structure that takes on basis risk. Terms. The notional principal value of the swap is $200,000,000, with the underlying bonds being various maturities of PIBS issued between 1998 and 2005. The City pays an amount equal to 5% plus the tax-exempt market standard BMA Index rate divided by .667 minus the taxable six-month US Dollar LIBOR rate minus a constant of 67.5 basis points (adjusted for day count), up to a maximum of 10%. The City receives a fixed rate of 5%. Because the two 5% fixed rates offset one another, the City is effectively making variable payments based on BMA and receiving variable payments based on LIBOR plus a fixed spread. The variable rate is fixed for each budget period. The agreement is effective from March 1, 2004 to March 1, 2025. Starting in fiscal year 2017, the notional value of the swap declines as the principal amount of the associated debt is repaid in varying amounts until the debt is retired in 2023. Payments will be received or made every six months based on the indices for the prior budget period. As of June 30, 2009 the swap created synthetic variable-rate exposure as follows:
TERMS RATE (%) Variable rate payment to counterparty Fixed Rate 5.0000 BMA/0.667 0.6515
-LIBOR (1.7975) -Constant (0.6750) Net payment to counterparty 3.179 Receipt from counterparty Fixed (5.0000) Net interest rate swap payment/(receipt) (1.8210) Fixed rate bond coupon payments 5.1280 Synthetic variable interest rate paid on bonds 3.3070
Fair value. The fair value of the swap was negative $3,357,000 as of June 30, 2009. The value was calculated using the zero coupon method. This method calculates the future net settlement payments required by the swap, assuming that the current forward rates implied by the yield curve correctly anticipate future spot interest rates. These net payments are then discounted using the spot rates implied by the current yield curve for hypothetical zero-coupon bonds due on the date of each future net settlement on the swaps. Credit risk. The City is exposed to credit risk on the swap in the amount of its fair value. RFPC, the swap counterparty, has not been rated by the rating agencies. To mitigate this potential credit risk for an unrated counterparty, the City required that RFPC purchase a surety bond from Ambac Assurance Corporation (“Ambac”), an AAA-rated insurance company at the time of the swap. As of June 30, 2009, Ambac’s ratings had fallen below the contractually-required required level of A. The City unwound the swap on August 27, 2009. See Note 17, SUBSEQUENT EVENTS.

CITY OF HOUSTON, TEXAS NOTES TO THE BASIC FINANCIAL STATEMENTS
June 30, 2009
- 81 -
Interest rate risk. The City has an exposure to interest rate risk because it is paying a variable rate on the swap. However, this risk is mitigated because the payment formula has a BMA-based variable component that is offset by subtracting a LIBOR variable component. Basis risk. The City is exposed to basis risk based on changes in the relationship between the BMA Index and six-month US Dollar LIBOR. The City entered into the swap in anticipation of savings that would be produced based on the historical trading patterns of BMA and LIBOR in different interest rate, tax, and economic environments over the past two decades. If, however, future trading patterns prove to be significantly different than historical ones, the City’s anticipated savings could fail to materialize, and it could be exposed to additional costs. Among the factors that could cause this trading relationship to change would be a major reduction in marginal income tax rates, repeal of the tax-exemption on municipal bond interest, or other changes in federal policy that would reduce the benefit that municipal bonds currently enjoy in comparison to taxable investments. Termination risk. The City may terminate the swap for any reason. The counterparty may terminate the swap if both the City and the City’s insurer fails to perform under the terms of the contract. If the swap has a negative fair value at the time of termination, the City will be liable to the counterparty for that payment. The City’s termination risk is significantly mitigated by a provision in the swap agreement that allows the City to make the termination payment in equal annual installments from time of termination up to termination date of the agreement in 2025.
Swap receipts and associated debt. The City received $2,056,000 during fiscal year 2009. As of June 30, 2009, assuming current interest rates, the City will receive swap payments as reported in Note 8D. Because rates vary, variable rate bond interest payments and net swap receipts or payments will vary. Related debt service payments on the underlying Public Improvement Bonds are included in Note 8D with other City Public Improvement Bonds.
4. General Obligation Commercial Paper
The City currently may issue Commercial Paper Notes (“Notes”) under its $400 million General Obligation Commercial Paper Program Series D, $325 million General Obligation Commercial Paper Program Series E, $139.5 million General Obligation Commercial Paper Program Series F, $276 million General Obligation Commercial Paper Program Series G, $100 million General Obligation Commercial Paper Program Series H-1 and $100 million General Obligation Commercial Paper Program Series H-2. General Obligation Commercial Paper Notes Series A, B and C have been terminated. The Notes may be issued for a period not to exceed 270 days and will bear interest based upon the specified term of the Notes, but not to exceed 10%. Principal on the Notes is payable from ad valorem tax revenue, the issuance of new commercial paper, bond proceeds and other funds provided under credit lines. Interest is payable from ad valorem tax revenue collected by the City. Proceeds from the Notes are used to finance various capital projects and public improvements for authorized City purposes. Upon maturity, the Notes will be remarketed by the commercial paper dealers or extinguished with long-term debt. During fiscal year 2009 the average interest rate for the General Obligation Notes, including dealer and credit fees, was 1.93%. The average year-end rate, including fees, was 1.27%. The Credit Agreements expire on the following dates: Series D on May 25, 2010, Series E on April 29, 2011, Series F on May 25, 2010, Series G on November 15, 2011, Series H-1 on February 12, 2010 and Series H-2 on February 23, 2012.
5. Certificates of Obligation Since 1988, the city has issued Certificates of Obligation each year to provide for the purchase of equipment utilized in general City operations including, without limitation, police vehicles, maintenance vehicles and equipment, computer equipment, and costs associated with demolishing dangerous structures. Each year the City is obligated to levy, assess, and collect ad valorem taxes sufficient to pay principal and interest on the certificates payable semi-annually until maturity. Generally, these certificates are not subject to redemption prior to final maturity, except for the Certificates of Obligation Series 2005D which are subject to optional redemption on or after March 1, 2015.
6. HUD Section 108 Loan
The City has borrowed money from the United States Department of Housing and Urban Development (“HUD”) and loaned it to the Houston Business Development Initiative (“HBDI”) and three hotels in the downtown business district. HBDI in turn makes small business loans to under-served areas of the community. The City has pledged only certain grant revenues and its receipts from the loans to repay HUD.
CITY OF HOUSTON, TEXAS NOTES TO THE BASIC FINANCIAL STATEMENTS
June 30, 2009
- 82 -
7. Airport System Revenue Bonds
These funds are paid solely from a lien on the airport system’s net revenues, which must total 110% of the debt service requirements for Subordinate Lien Bonds for such fiscal year. The bonds have a final maturity in the year 2032. Airport System Subordinate Lien Revenue Bonds, Series 2000P1 and 2001P2, 2002C, 2002D-1, and 2002D-2, have been issued as auction rate securities with current 7-day resets. Series 2005A has been issued as Variable Rate Demand Obligations with a 7-day reset. These bonds may all be converted to other modes including fixed rate bonds. The City has a liquidity facility in place for the Series 2005A bonds with a termination date of July 1, 2010. The maximum interest rate permitted under the ordinance is 10%. The City has purchased municipal debt service reserve fund policies that unconditionally guarantee the payment of principal and interest on all current outstanding airport system subordinate lien issues. The reserve policies terminate upon final maturities on various dates in the future. Each of the draws made against the reserve policy shall bear interest at the Prime Rate plus two percent, not to exceed a maximum interest rate of 12%. The repayment provisions require one-twelfth of the policy costs for each draw to be repaid monthly, beginning the first month following the date of each draw.
8. Airport System Inferior Lien Contract On July 1, 2004 the City and Continental Airlines, Inc. entered into a Sublease Agreement associated with the Special Facilities Lease for the Automated People Mover System and the City’s Airport System Special Facilities Revenue Bonds (Automated People Mover Project) Series 1997A (“1997A Special Facilities Bonds”). The City assumed Continental’s interest in the project upon completion of the expansion of the Automated People Mover System on January 25, 2005. As part of the Sublease, the City agreed to make sublease payments that include amounts equal to the debt service on the 1997A Special Facilities Bonds. The payments are payable from Airport System net revenues on the same priority as inferior lien bonds. Accordingly, the principal amount remaining on the 1997A Special Facilities Bonds, totaling $45,820,000, is recorded as an Inferior Lien Contract.
9. Airport System Commercial Paper Airport System Senior Lien Commercial Paper Notes Series A and B (the “Notes”) have been authorized for $150 million, and Airport System Inferior Lien Commercial Paper Notes Series C have been authorized for $150 million to establish, improve, enlarge, extend and repair the City’s Airport System, acquire land, and pay interest and cost of issuance of the Notes. During fiscal year 2009 the average interest rate for the Airport System Notes, including dealer and credit fees, was 1.92%. The average year-end rate, including fees, was 1.39%. The Series A and B Notes are collateralized by a revolving credit agreement convertible to direct pay letters of credit issued by a bank, and a lien on the net revenues of the Airport System. The Letter of Credit will terminate on January 4, 2011 for Series A and B.
10. Airport System Pledged Revenues
The Fund has pledged airport system revenues, net of operation and maintenance expenses, to pay principal and interest on outstanding Senior Lien Commercial Paper Notes, Subordinate Lien Revenue Bonds, and an Inferior Lien Contract, with outstanding principal amounts of $93,000,000, $2,083,255,000, and $45,820,000, respectively. The Commercial Paper Notes and Revenue Bonds are issued to establish, improve, enlarge, extend and repair the Airport System. The Inferior Lien Sublease Agreement with Continental Airlines pays debt service on the Airport System Special Facilities Bonds (Automated People Mover Project) Series 1997A. Pledged airport system revenues exclude: proceeds of any bonds, replacement proceeds, or any investment income earned by bond proceeds; passenger facility charges; grants or gifts for construction or acquisition; insurance proceeds; revenue from special facilities pledged to Special Facility Bonds; taxes collected for others; and proceeds from the sale of property. Pledged airport system revenues, net of operation and maintenance expense, totaled $177,786,000 in Fiscal Year 2009, covering principal of $49,692,000 and interest of $101,049,000. In addition to pledged airport system revenue, grants and passenger facility charges totaling $51,739,000 were available to cover debt service in Fiscal Year 2009, making the ratio of net pledged revenue to reduced debt service cost 1.80%.
11. Convention and Entertainment Facilities Bonds
These bonds are special limited obligations of the City that are paid from a lien on the pledged receipts of the Hotel Occupancy Tax (HOT), revenues collected from seven City-owned parking facilities, and rebates of certain taxes derived from operation of the Convention Center Hotel and Parking Garage. The pledged HOT receipts are equal to 5.65% of the cost of substantially all hotel room rentals in the City, plus related penalties and interest for delinquent payments. As long as any of the Senior Lien Bonds remain outstanding, the City is required to levy a Hotel Occupancy Tax at a rate not less than 7%. The City currently levies a Hotel Occupancy Tax at the rate of 7%. Final maturity of the bonds is September 1, 2033.
CITY OF HOUSTON, TEXAS NOTES TO THE BASIC FINANCIAL STATEMENTS
June 30, 2009
- 83 -
The City has obtained a debt service reserve insurance policy for the Senior Lien Hotel Occupancy Tax Revenue Bonds. The surety policy provides insurance sufficient to pay maximum annual debt service of the Bonds. The surety policy expires upon final maturity of all outstanding Bonds, September 1, 2033.
The City of Houston Convention Center Revenue Bonds, Series 2001C-1 and 2002C-2, have been issued as 7-day auction rate securities and are subject to conversion at the option of the City and subject to certain restrictions, to bonds that bear interest at rates other than auction rates. The maximum interest rate permitted under the ordinance is 10%.
12. Convention and Entertainment Hotel and Parking Revenue Commercial Paper
Hotel Occupancy Tax and Parking Revenue Commercial Paper Notes Series A have been authorized for $75 million to finance the costs of site acquisition, construction, and improvements for convention center facilities. The notes are issued as subordinate lien debt. The maturity of the Notes may not exceed 270 days and the maximum interest rate may not exceed 10%. Upon maturity, the Notes will be remarketed by the commercial paper dealer or extinguished with long-term debt. The Notes are collateralized by a Letter of Credit that expires on January 16, 2011. During fiscal year 2009 the average interest rate for the Notes, including fees, was 1.11%. The average rate in effect at year-end was 0.79%.
13. Combined Utility System First Lien Revenue Bonds City Council authorized creation of the Combined Utility System (“the System”) on September 3, 2003. The Combined Utility System currently consists of the City’s Water and Sewer System. In the future the City may elect to include other utility systems. Its bonds are special obligations of the City payable from Net Revenues of the System after payments for maintenance and operations and debt service on Water and Sewer Junior Lien bonds. Net Revenues must equal 110% of the First Lien Revenue Bonds debt service.
The Combined Utility System Revenue Refunding Bonds, Series 2004B and 2004C, were initially issued as Auction Rate Securities. All of the 2004B auction rate securities were converted to variable rate demand bonds in April 2008. The Combined Utility System Revenue Refunding bonds 2008A were issued as tax-exempt variable rate demand bonds to refund $249M of the 2004C tax-exempt auction rate securities, and the Combined Utility System Revenue Refunding Bonds 2008D were issued as taxable variable rate bonds to refund $200M of the 2004C taxable auction rate as securities. The remainder of the 2004C auction rate securities were converted to put bonds that mature on May 15, 2011.
14. Combined Utility System Commercial Paper
The Combined Utility System Commercial Paper Notes Program Series A has been authorized for $900 million to finance costs of eligible projects for the City’s combined utility system, including acquisition or construction of improvements and additions or extension for the system, and costs of issuance. The notes are issued as third lien obligations. The maturity of the Notes may not exceed 270 days and the maximum interest rate may not exceed 10%. Principal on the Notes is payable from the issuance of new commercial paper, bond proceeds and other funds provided under the line of credit available through a revolving credit agreement with four banks. The agreement expires on December 15, 2015. Interest on the Notes is payable from net revenues of the System and loans under the credit agreement. During fiscal year 2009 the average interest rate for outstanding Notes, including credit and dealer fees, was 2.13%. There were no commercial paper notes outstanding at June 30, 2009.
15. Combined Utility System Synthetic Fixed Rate Swap Agreements
Combined Utility System synthetic fixed rate swaps. On June 10, 2004 the City entered into three identical pay-fixed, receive-variable rate swap agreements. The City pre-qualified six firms to submit competitive bids on the swap. The bidding took place on June 7, 2004. The three firms selected all matched the lowest fixed rate bid of 3.7784%.
Objective. The objective of the swaps is to hedge against the potential of rising interest rates in conjunction with the City’s Combined Utility System 2004B variable rate interest bonds (“2004B Bonds”) and to achieve a lower fixed rate than the market rate for traditional fixed rate debt at time of issuance of the 2004B Bonds. Terms. The notional amount totals $653,325,000, the principal amount of the associated 2004B Bonds. The City’s swap agreements contain scheduled reductions to outstanding notional amounts that follow anticipated payments of principal of the 2004B Bonds in varying amounts during the years 2028 to 2034. Under the terms of the swaps, the City will pay a fixed rate of 3.7784% (lower than the rate for fixed rate debt at time of issuance) and receive a floating rate equal to 57.6% of One-Month US Dollar LIBOR plus 37 basis points. All agreements were effective June 10, 2004, the date of issuance of the 2004B Bonds. The termination date is May 15, 2034.

CITY OF HOUSTON, TEXAS NOTES TO THE BASIC FINANCIAL STATEMENTS
June 30, 2009
- 84 -
At June 30, 2009, the effective rate on the 2004B Bonds associated with the swap was computed as follows:
TERMS
RATE (%) Received
(Paid) Variable rate payment from counterparties LIBOR x 57.6% 0.1840 + Constant 0.3700 Swap receipt 0.5540 Fixed rate paid to counterparties Fixed (3.7784) Net rate (paid)/received for swap (3.2244) Average variable rate on 2004B bonds, year end (0.4172) Plus dealer and auction fees on 2004B bonds (0.4150) Effective rate of 2004B bonds (4.0566)
In contrast, the fixed rate the City paid on its Combined Utility System Series 2004A fixed rate bonds, which have a comparable maturity, was 5.08%.
Fair value. Because long-term interest rates have changed since inception of the swaps, the swaps had a negative fair value of $99,739,000 on June 30, 2009. This value was calculated using the zero-coupon method. This method calculates the future net settlement payments required by the swap, assuming that the current forward rates implied by the yield curve correctly anticipate future spot interest rates. These net payments are then discounted using the spot rates implied by the current yield curve for hypothetical zero-coupon bonds due on the date of each future net settlement on the swaps.
Credit risk. As of June 30, 2009, the City was not exposed to credit risk because the swaps had a negative fair value. However, should interest rates increase and the fair value of the swap become positive, the City would be exposed to credit risk on the swap in the amount of its fair value. The City’s swap policy generally requires that swap counterparties be rated double-A or better by at least one nationally recognized rating agency at inception. Under the agreements, if a counterparty’s credit rating falls below AA, collateral must be posted in varying amounts depending on the credit rating and fair market value to the City of the swaps. No collateral has been required to date.
COUNTERPARTY
Notional Amount
Fair Value
Counterparty Credit Rating
(Moody’s /S&P /Fitch) Goldman Sachs Capital Markets $ 353,325,000 $ (53,940,000) A1/A/A+ JP Morgan Chase 150,000,000 (22,899,500) Aa3/A+/AA- UBS AG 150,000,000 (22,899,500) Aa2 /A+ /A+
TOTAL $ 653,325,000 $ (99,739,000)
Basis risk. The City is exposed to basis risk on the swaps because the variable payment received is based on an index other than BMA. Should the relationship between LIBOR and BMA move to convergence (because of reductions in tax rates, for example), the expected cost savings may not be realized. The City has issued variable rate demand bonds with an average rate of 0.42% (not including dealer and auction agent fees) as of June 30, 2009, whereas the associated LIBOR-based rate of the swap was 0.55%. For the fiscal year, the average rate paid on the auction rate bonds was 1.75%, and the average rate for the swap receipts was 1.30%.
Termination risk. The City may terminate for any reason. A counterparty may terminate a swap if the City fails to perform under the terms of the contract. The City’s on-going payment obligations under the swap (and, to a limited extent, its termination payment obligations) are insured, and counterparties cannot terminate so long as the insurer does not fail to perform. If a swap should be terminated, the associated variable-rate bonds would no longer carry synthetic fixed interest rates. Also, if at the time of the termination the swap has a negative fair value, the City would be liable to the counterparty for a payment equal to the swap’s fair value.
Remarketing risk. The City faces a risk that the remarketing agent will not be able to sell the auction rate bonds at a competitive rate. At times rates vary as investors shift portfolios in and out of the tax-exempt variable rate sector.
Swap payments and associated debt. As of June 30, 2009, debt service requirements for the swap agreements are reported in Note 8D, assuming current interest rates remain the same. As rates vary, variable rate bond interest payments and net swap payments will vary. Expected debt service payments on the associated Combined Utility System 2004B bonds are included with other Combined Utility System Bonds on Note 8D.
CITY OF HOUSTON, TEXAS NOTES TO THE BASIC FINANCIAL STATEMENTS
June 30, 2009
- 85 -
16. Combined Utility System Forward Interest Rate Swap
Combined Utility System Forward Starting Swap. On November 1, 2005 the City entered into a forward interest rate swap transaction with RBC Dain Rauscher (“RBC”). The transaction was conducted through a competitive bid process. Objective. The objective of the swap is to hedge against the potential of rising interest rates associated with its Combined Utility System Series 2008A Variable Rate Bonds ("the 2008A Bonds") and to achieve a lower fixed rate than the market rate for traditional fixed rate debt. The City's goal is that its variable receipts under these swaps equal the variable payments made on the bonds, leaving the fixed payment on the swap, plus dealer and liquidity fees, as its net interest cost. Terms. Under the terms of the contract, the City will pay a fixed rate of 3.761% on a par value of $249,075,000, and it will receive variable payments based on 70% of one-month LIBOR. The City’s scheduled net swap payments are insured by Ambac Assurance Corporation. Fair value. The swap had a fair value of negative $32,502,000 on June 30, 2009. This value was calculated using the zero-coupon method. This method calculates the future net settlement payments required by the swap, assuming that the current forward rates implied by the yield curve correctly anticipate future spot interest rates. These net payments are then discounted using the spot rates implied by the current yield curve for hypothetical zero-coupon bonds due on the date of each future net settlement on the swaps. Credit risk. As of June 30, 2009, the City was not exposed to credit risk because the fair market value of the swap was negative to the City. As of June 30, 2009, RBC was rated Aaa, AA- and AA by Moody’s, Standard and Poor’s, and Fitch respectively. Under the agreement, if RBC’s credit rating falls below double-A, collateral must be posted in varying amounts depending on the credit rating if the fair value of the swap is positive to the City. No collateral has been required to date.
Basis risk. The City is exposed to basis risk on the swap because the variable payment received is based on an index that is not tax-exempt. Should the relationship between LIBOR and BMA move to convergence (because of reductions in tax rates, for example), the expected cost savings may not be realized. At June 30, 2009 the interest rate in effect for the underlying variable rate bonds was 0.32% while the rate in effect for the swap receipts was 0.22%.
Termination risk. The City may terminate for any reason. RBC may terminate a swap if the City fails to perform under the terms of the contract. The City’s on-going payment obligations under the swap (and, to a limited extent, its termination payment obligations) are insured, and RBC cannot terminate so long as the insurer does not fail to perform. If a swap should be terminated, the associated variable-rate bonds would no longer carry synthetic fixed interest rates. Also, if at the time of the termination the swap has a negative fair value, the City would be liable to the counterparty for a payment equal to the swap’s fair value.
Swap payments and associated debt. As of June 30, 2009, debt service requirements for the swap agreements are reported in Note 8D as if the swap was in effect, assuming current interest rates remain the same. As rates vary, variable rate bond interest payments and net swap payments will vary. Expected debt service payments on the associated Combined Utility System 2008A bonds are included with other Combined Utility System Bonds on Note 8D.
17. Combined Utility System Constant Maturity Swap
Combined Utility System Constant Maturity Swap. In November 2006 the City executed a constant maturity swap with Goldman Sachs Capital Markets, Inc. (“Goldman”) on a forward basis. The swap was priced competitively. The City canceled the swap on September 16, 2008 and received a payment of $7,000,000.
18. Water and Sewer System Junior Lien Revenue Bonds
These bonds are paid solely from a lien on the net water and sewer system revenues, which must total 110% of the current debt service requirements on the junior lien bonds. As part of the restructuring to the new Combined Utility System, the City refunded a substantial portion of the outstanding junior lien bonds on June 10, 2004 and reissued bonds as Combined Utility System bonds. Debt service payments on remaining Water and Sewer Junior Lien Revenue Bonds (“Junior Lien Bonds”) will be made after payment of operating expenses and prior to any debt service payments on the Combined Utility System bonds. The final maturity date for the remaining junior lien bonds is December 1, 2028. No additional Junior Lien Bonds may be issued.
CITY OF HOUSTON, TEXAS NOTES TO THE BASIC FINANCIAL STATEMENTS
June 30, 2009
- 86 -
19. Coastal Water Authority (“CWA”)
The contract payable relating to CWA represents the outstanding principal balance of $84,990,000 at June 30, 2009 of City of Houston Water Conveyance System Contract Certificates of Participation, Series 1993, representing contract payments owed by the City to pay debt service on bonds issued by CWA, plus $81,500,000 of CWA Revenue Refunding Bonds, Series 1999 and Series 2004, issued by CWA, a governmental agency of the State of Texas, to finance the construction of a water conveyance system. Pursuant to a series of exchange agreements with CWA, the City issued the Certificates and endorsed the bonds and is unconditionally obligated to pay from the gross operating revenues of the City’s water and sewer system all debt service payments on these Certificates and Bonds, as well as amounts necessary to restore deficiencies in funds required to be accumulated under the CWA bond resolutions. The bonds mature on December 15, 2034.
20. Other Contracts Payments on the following contracts will be made only after the Water Sewer System has funded all maintenance and operation costs and debt service payments for the water and sewer system, including required reserves. On June 20, 1967 the City, TRA, and Chambers-Liberty Counties Navigation District contracted with the United States of America to have the U.S. Army Corps of Engineers build a salinity control barrier and recreation facilities at Wallisville Lake. Because of legal actions, construction was blocked for a long period, and the project was not completed until April 2003. The City’s share of the project cost was $10,580,707, which will be paid to the U.S. government over 50 years at 3.222% interest with final payment due January 1, 2053. In April 2000 the City, Brazos River Authority (“BRA”), and the Texas Water Development Board (“TWDB”) entered into an agreement to develop the Allen’s Creek water supply reservoir in Fort Bend County as a regional water supply. TWDB paid $14,000,000, or 50% of funding, to provide for construction of the project, and the City agreed to purchase TWDB’s share. Interest payments on the lease-purchase began in 2005 at an average rate of 5.85%. Interest costs over the first eight years will be partially deferred to later years. Principal payments will begin in 2022, and the final principal payment will be made in 2036.

CITY OF HOUSTON, TEXAS NOTES TO THE BASIC FINANCIAL STATEMENTS
June 30, 2009
- 87 -
D. Schedule for Debt Service Requirements to Maturity (in thousands):
1. General Long-Term Tax Obligation Debt (adjusted for Capital Appreciation and Deferred Interest Bonds reclassification of principal & interest) (in thousands):
General ObligationBonds Swap Agreements Bonds
Year Ending Swap PaymentJune 30 Principal Interest Swap (Receipt) Principal Interest
2010 133,785$ 100,698$ (2,406)$ -$ 31,255$ 2011 131,765 93,972 - - 31,255 2012 130,640 87,249 - - 31,254 2013 125,665 80,732 - - 31,254 2014 118,275 74,332 - 5,375 31,254
2015-2019 633,735 274,884 - 33,085 150,700 2020-2024 463,985 130,303 - 83,195 135,424 2025-2029 179,065 40,920 - 131,851 103,338 2030-2034 42,200 14,127 - 165,855 50,813 2035-2039 29,185 3,015 - 101,117 10,009
Total 1,988,300$ 900,232$ (2,406)$ 520,478$ 606,556$
Public Improvement Pension Obligation
General Obligation Tax and RevenueCommercial Paper Certificates of Obligation
Year EndingJune 30 Principal Interest Principal Interest
2010 100,000$ 6,058$ 7,150$ 4,208$ 2011 192,100 3,520 6,252 5,932 2012 227,100 755 6,250 3,269 2013 - - 11,095 2,984 2014 - - 2,890 2,458
2015-2019 - - 16,585 10,181 2020-2024 - - 18,990 5,739 2025-2029 - - 11,810 1,200 2030-2034 - - - - 2035-2039 - - - -
Total 519,200$ 10,333$ 81,022$ 35,971$
Total Future RequirementsYear Ending Swaps Total Future
June 30 Principal Interest (Receipts) Requirements2009 240,935$ 142,219$ (2,406)$ 380,748$ 2010 330,117 134,679 - 464,796 2011 363,990 122,527 - 486,517 2012 136,760 114,970 - 251,730 2013 126,540 108,044 - 234,584
2014-2018 683,405 435,765 - 1,119,170 2019-2023 566,170 271,466 - 837,636 2024-2028 322,726 145,458 - 468,184 2029-2033 208,055 64,940 - 272,995 2034-2038 130,302 13,024 - 143,326
Total 3,109,000$ 1,553,092$ (2,406)$ 4,659,686$
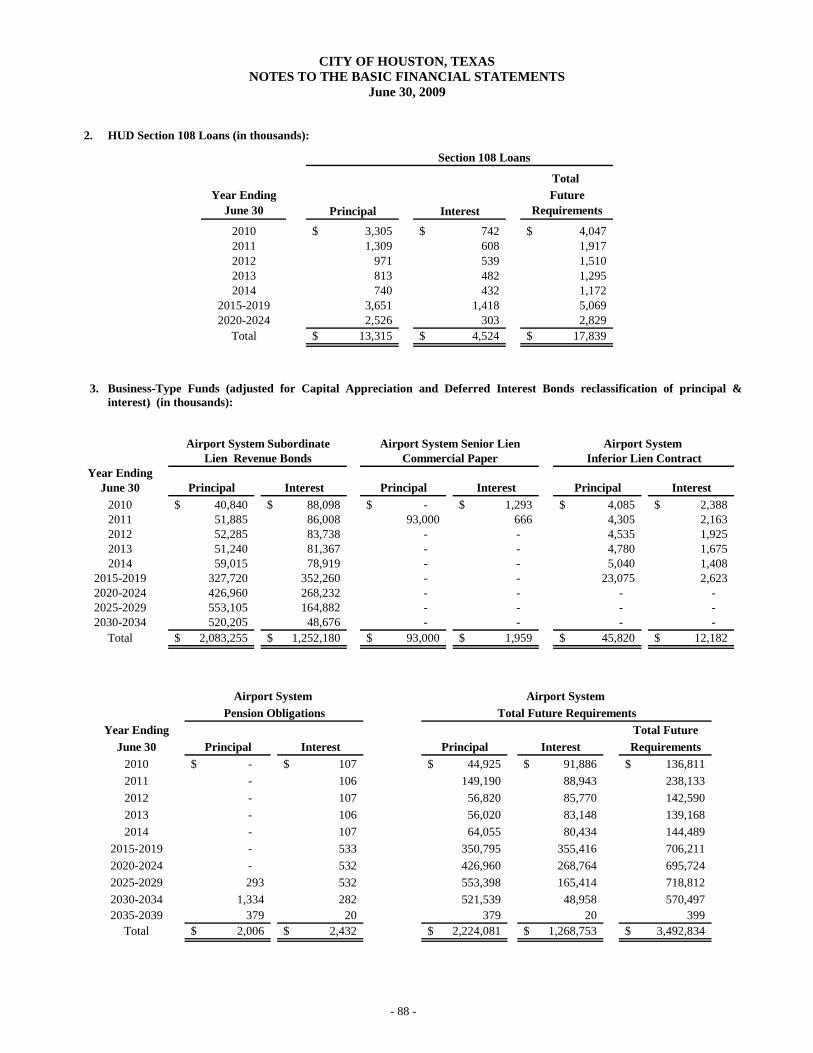
CITY OF HOUSTON, TEXAS NOTES TO THE BASIC FINANCIAL STATEMENTS
June 30, 2009
- 88 -
2. HUD Section 108 Loans (in thousands):
Total Year Ending
June 30 Principal InterestFuture
Requirements
2010 3,305$ 742$ 4,047$ 2011 1,309 608 1,917 2012 971 539 1,510 2013 813 482 1,295 2014 740 432 1,172
2015-2019 3,651 1,418 5,069 2020-2024 2,526 303 2,829
Total 13,315$ 4,524$ 17,839$
Section 108 Loans
3. Business-Type Funds (adjusted for Capital Appreciation and Deferred Interest Bonds reclassification of principal & interest) (in thousands):
Airport System Subordinate Airport System Senior Lien Airport System Lien Revenue Bonds Commercial Paper Inferior Lien Contract
Year EndingJune 30 Principal Interest Principal Interest Principal Interest
2010 40,840$ 88,098$ -$ 1,293$ 4,085$ 2,388$ 2011 51,885 86,008 93,000 666 4,305 2,163 2012 52,285 83,738 - - 4,535 1,925 2013 51,240 81,367 - - 4,780 1,675 2014 59,015 78,919 - - 5,040 1,408
2015-2019 327,720 352,260 - - 23,075 2,623 2020-2024 426,960 268,232 - - - - 2025-2029 553,105 164,882 - - - - 2030-2034 520,205 48,676 - - - -
Total 2,083,255$ 1,252,180$ 93,000$ 1,959$ 45,820$ 12,182$
Airport System Pension Obligations
Year EndingJune 30 Principal Interest
2010 -$ 107$ 2011 - 106 2012 - 107 2013 - 106 2014 - 107
2015-2019 - 533 2020-2024 - 532 2025-2029 293 532 2030-2034 1,334 282 2035-2039 379 20
Total 2,006$ 2,432$
Total FuturePrincipal Interest Requirements
44,925$ 91,886$ 136,811$ 149,190 88,943 238,133
56,820 85,770 142,590 56,020 83,148 139,168 64,055 80,434 144,489
350,795 355,416 706,211 426,960 268,764 695,724 553,398 165,414 718,812 521,539 48,958 570,497
379 20 399 2,224,081$ 1,268,753$ 3,492,834$
Airport System Total Future Requirements
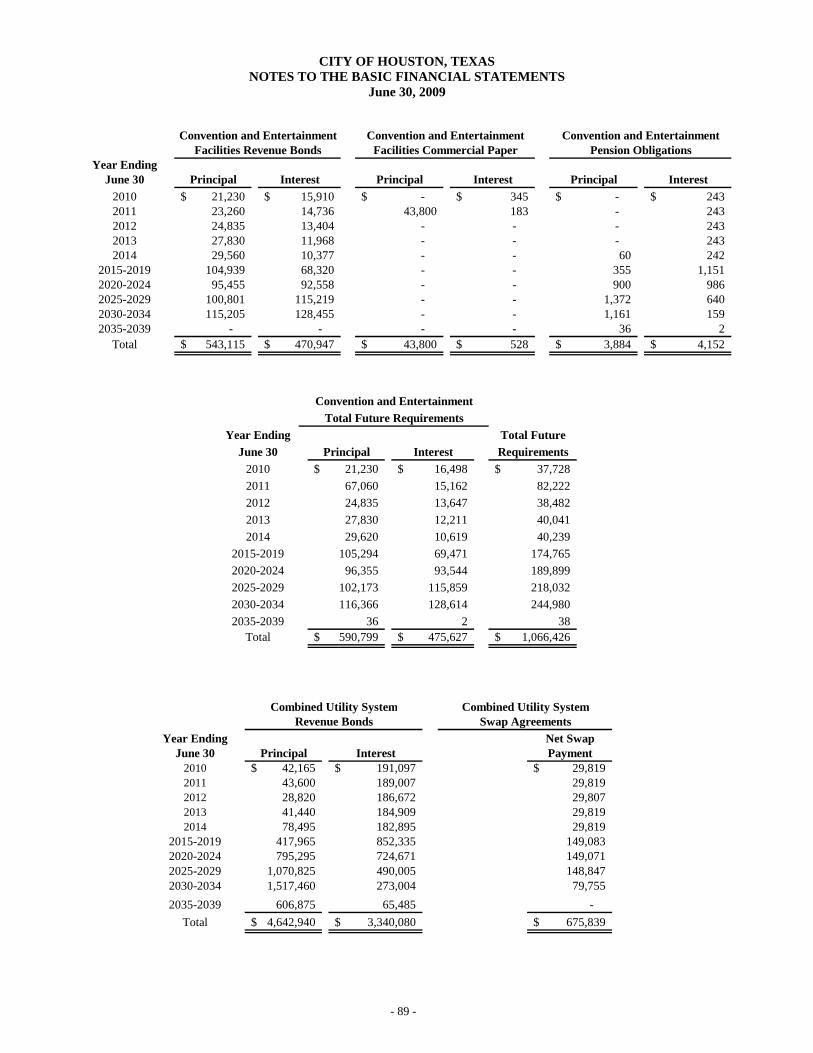
CITY OF HOUSTON, TEXAS NOTES TO THE BASIC FINANCIAL STATEMENTS
June 30, 2009
- 89 -
Convention and Entertainment Convention and Entertainment Convention and Entertainment
Facilities Revenue Bonds Facilities Commercial Paper Pension ObligationsYear Ending
June 30 Principal Interest Principal Interest Principal Interest2010 21,230$ 15,910$ -$ 345$ -$ 243$ 2011 23,260 14,736 43,800 183 - 243 2012 24,835 13,404 - - - 243 2013 27,830 11,968 - - - 243 2014 29,560 10,377 - - 60 242
2015-2019 104,939 68,320 - - 355 1,151 2020-2024 95,455 92,558 - - 900 986 2025-2029 100,801 115,219 - - 1,372 640 2030-2034 115,205 128,455 - - 1,161 159 2035-2039 - - - - 36 2
Total 543,115$ 470,947$ 43,800$ 528$ 3,884$ 4,152$
Year Ending Total Future
June 30 Principal Interest Requirements2010 21,230$ 16,498$ 37,728$ 2011 67,060 15,162 82,222 2012 24,835 13,647 38,482 2013 27,830 12,211 40,041 2014 29,620 10,619 40,239
2015-2019 105,294 69,471 174,765 2020-2024 96,355 93,544 189,899 2025-2029 102,173 115,859 218,032 2030-2034 116,366 128,614 244,980 2035-2039 36 2 38
Total 590,799$ 475,627$ 1,066,426$
Total Future RequirementsConvention and Entertainment
Combined Utility System Combined Utility System Revenue Bonds Swap Agreements
Year Ending Net SwapJune 30 Principal Interest Payment
2010 42,165$ 191,097$ 29,819$ 2011 43,600 189,007 29,819 2012 28,820 186,672 29,807 2013 41,440 184,909 29,819 2014 78,495 182,895 29,819
2015-2019 417,965 852,335 149,083 2020-2024 795,295 724,671 149,071 2025-2029 1,070,825 490,005 148,847 2030-2034 1,517,460 273,004 79,755 2035-2039 606,875 65,485 -
Total 4,642,940$ 3,340,080$ 675,839$
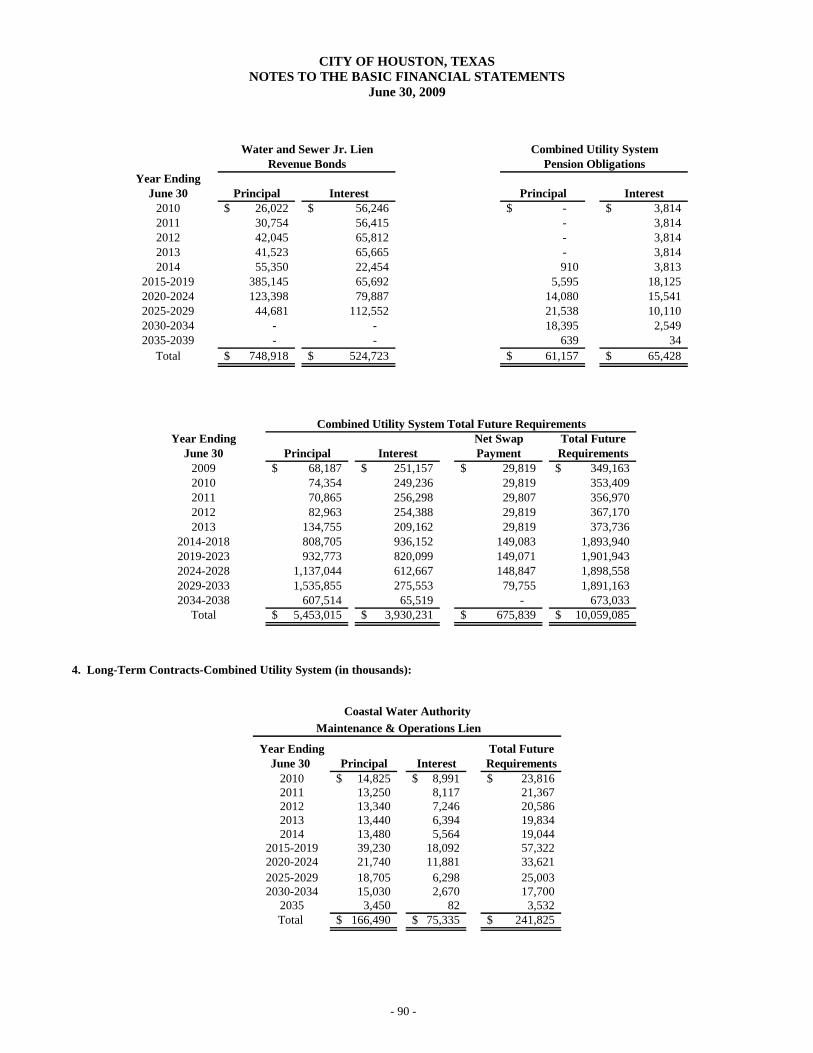
CITY OF HOUSTON, TEXAS NOTES TO THE BASIC FINANCIAL STATEMENTS
June 30, 2009
- 90 -
Year Ending
June 30 Principal Interest Principal Interest2010 26,022$ 56,246$ -$ 3,814$ 2011 30,754 56,415 - 3,814 2012 42,045 65,812 - 3,814 2013 41,523 65,665 - 3,814 2014 55,350 22,454 910 3,813
2015-2019 385,145 65,692 5,595 18,125 2020-2024 123,398 79,887 14,080 15,541 2025-2029 44,681 112,552 21,538 10,110 2030-2034 - - 18,395 2,549 2035-2039 - - 639 34
Total 748,918$ 524,723$ 61,157$ 65,428$
Water and Sewer Jr. Lien Combined Utility SystemRevenue Bonds Pension Obligations
Year Ending Net Swap Total FutureJune 30 Principal Interest Payment Requirements
2009 68,187$ 251,157$ 29,819$ 349,163$ 2010 74,354 249,236 29,819 353,409 2011 70,865 256,298 29,807 356,970 2012 82,963 254,388 29,819 367,170 2013 134,755 209,162 29,819 373,736
2014-2018 808,705 936,152 149,083 1,893,940 2019-2023 932,773 820,099 149,071 1,901,943 2024-2028 1,137,044 612,667 148,847 1,898,558 2029-2033 1,535,855 275,553 79,755 1,891,163 2034-2038 607,514 65,519 - 673,033
Total 5,453,015$ 3,930,231$ 675,839$ 10,059,085$
Combined Utility System Total Future Requirements
4. Long-Term Contracts-Combined Utility System (in thousands):
Maintenance & Operations Lien
Year Ending Total FutureJune 30 Principal Interest Requirements
2010 14,825$ 8,991$ 23,816$ 2011 13,250 8,117 21,367 2012 13,340 7,246 20,586 2013 13,440 6,394 19,834 2014 13,480 5,564 19,044
2015-2019 39,230 18,092 57,322 2020-2024 21,740 11,881 33,621 2025-2029 18,705 6,298 25,003 2030-2034 15,030 2,670 17,700
2035 3,450 82 3,532 Total 166,490$ 75,335$ 241,825$
Coastal Water Authority
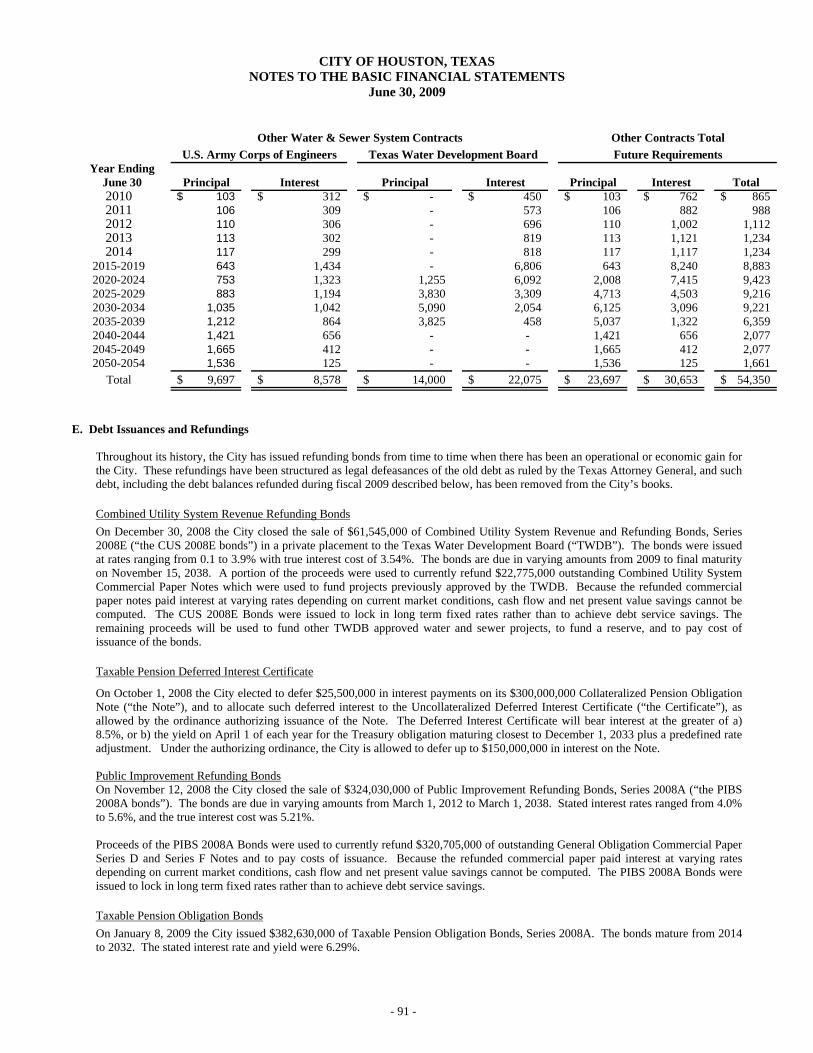
CITY OF HOUSTON, TEXAS NOTES TO THE BASIC FINANCIAL STATEMENTS
June 30, 2009
- 91 -
Principal Interest Principal Interest Principal Interest Total2010 103$ 312$ -$ 450$ 103$ 762$ 865$ 2011 106 309 - 573 106 882 988 2012 110 306 - 696 110 1,002 1,112 2013 113 302 - 819 113 1,121 1,234 2014 117 299 - 818 117 1,117 1,234
2015-2019 643 1,434 - 6,806 643 8,240 8,883 2020-2024 753 1,323 1,255 6,092 2,008 7,415 9,423 2025-2029 883 1,194 3,830 3,309 4,713 4,503 9,216 2030-2034 1,035 1,042 5,090 2,054 6,125 3,096 9,221 2035-2039 1,212 864 3,825 458 5,037 1,322 6,359 2040-2044 1,421 656 - - 1,421 656 2,077 2045-2049 1,665 412 - - 1,665 412 2,077 2050-2054 1,536 125 - - 1,536 125 1,661
Total 9,697$ 8,578$ 14,000$ 22,075$ 23,697$ 30,653$ 54,350$
Year EndingJune 30
Other Water & Sewer System Contracts Other Contracts Total U.S. Army Corps of Engineers Texas Water Development Board Future Requirements
E. Debt Issuances and Refundings Throughout its history, the City has issued refunding bonds from time to time when there has been an operational or economic gain for the City. These refundings have been structured as legal defeasances of the old debt as ruled by the Texas Attorney General, and such debt, including the debt balances refunded during fiscal 2009 described below, has been removed from the City’s books.
Combined Utility System Revenue Refunding Bonds On December 30, 2008 the City closed the sale of $61,545,000 of Combined Utility System Revenue and Refunding Bonds, Series 2008E (“the CUS 2008E bonds”) in a private placement to the Texas Water Development Board (“TWDB”). The bonds were issued at rates ranging from 0.1 to 3.9% with true interest cost of 3.54%. The bonds are due in varying amounts from 2009 to final maturity on November 15, 2038. A portion of the proceeds were used to currently refund $22,775,000 outstanding Combined Utility System Commercial Paper Notes which were used to fund projects previously approved by the TWDB. Because the refunded commercial paper notes paid interest at varying rates depending on current market conditions, cash flow and net present value savings cannot be computed. The CUS 2008E Bonds were issued to lock in long term fixed rates rather than to achieve debt service savings. The remaining proceeds will be used to fund other TWDB approved water and sewer projects, to fund a reserve, and to pay cost of issuance of the bonds.
Taxable Pension Deferred Interest Certificate
On October 1, 2008 the City elected to defer $25,500,000 in interest payments on its $300,000,000 Collateralized Pension Obligation Note (“the Note”), and to allocate such deferred interest to the Uncollateralized Deferred Interest Certificate (“the Certificate”), as allowed by the ordinance authorizing issuance of the Note. The Deferred Interest Certificate will bear interest at the greater of a) 8.5%, or b) the yield on April 1 of each year for the Treasury obligation maturing closest to December 1, 2033 plus a predefined rate adjustment. Under the authorizing ordinance, the City is allowed to defer up to $150,000,000 in interest on the Note. Public Improvement Refunding Bonds On November 12, 2008 the City closed the sale of $324,030,000 of Public Improvement Refunding Bonds, Series 2008A (“the PIBS 2008A bonds”). The bonds are due in varying amounts from March 1, 2012 to March 1, 2038. Stated interest rates ranged from 4.0% to 5.6%, and the true interest cost was 5.21%. Proceeds of the PIBS 2008A Bonds were used to currently refund $320,705,000 of outstanding General Obligation Commercial Paper Series D and Series F Notes and to pay costs of issuance. Because the refunded commercial paper paid interest at varying rates depending on current market conditions, cash flow and net present value savings cannot be computed. The PIBS 2008A Bonds were issued to lock in long term fixed rates rather than to achieve debt service savings.
Taxable Pension Obligation Bonds On January 8, 2009 the City issued $382,630,000 of Taxable Pension Obligation Bonds, Series 2008A. The bonds mature from 2014 to 2032. The stated interest rate and yield were 6.29%.

CITY OF HOUSTON, TEXAS NOTES TO THE BASIC FINANCIAL STATEMENTS
June 30, 2009
- 92 -
Proceeds were used to refund the $335,468,000 Collateralized Pension Note and related Deferred Interest Certificates to the Houston Municipal Employees Pension System (“HMEPS”), to refund the $35,050,000 2008 Taxable Pension Obligation Note, and to pay costs of issuance. At this time the Houston Airport System also made a cash contribution of $38,623,000 to HMEPS to retire their share of the Note and Certificates. The transaction resulted in a reduction in future cash payments of $260,073,000, and the net present value savings of the transaction was $72,690,000 or 26%. On January 8, 2009 the City issued $20,190,000 of Taxable Pension Obligation Bonds Series 2008B. These bonds mature from 2014 to 2032. The stated interest rate and yield were 6.29%. Proceeds were used to fund part of the unfunded actuarial accrued liability of the Houston Police Officers Pension System and to pay costs of issuance.
Combined Utility System Revenue Refunding Bonds On April 9, 2009 the City closed the sale on $476,050,000 of Combined Utility System Revenue Refunding Bonds, Series 2009 (“the CUS 2009 bonds”). The bonds mature in varying amounts from 2014 to 2038. Interest rates ranged from 3.25% to 6.0% with a true interest cost of 5.60%. Proceeds were used to currently refund $300,000,000 of Combined Utility System Commercial Paper Notes, to currently refund $23,660,000 of Combined Utility System Variable Rate Demand Bonds Series 2008D-2, to fund construction projects, to fund a debt service fund, and to pay costs of issuance. Because the refunded commercial paper and variable rate demand bonds paid interest at varying rates depending on current market conditions, cash flow and net present value savings cannot be computed. The CUS 2009A Bonds were issued to lock in long term fixed rates rather than to achieve debt service savings.
F. Bond Compliance Requirements The revenue bond ordinances require that during the period in which the bonds are outstanding the City must create and maintain certain accounts or funds to receive the proceeds from the sale of the revenue bonds and to account for the revenues (as defined), which are pledged for payment of the bonds. The assets can be used only in accordance with the terms of the bond ordinance and for the specific purpose(s) designated therein. The city is generally required to make a monthly transfer to debt service funds equal to one-sixth of the next interest payment and one-twelfth of the next principal payment. Certain bond ordinances have additional requirements for the establishment of rates and the accumulation of principal and interest repayment amounts from surplus operating funds. Generally, the bonds may be redeemed prior to their maturities in accordance with the bond ordinances and at various premiums equal to or less than 2%. During fiscal year 2009 the City has complied with the requirements of all revenue bond ordinances and related bond restrictions.
G. Voter Authorized Obligations On November 4, 2001, voters of the City authorized the issuance of $776,000,000 of Public Improvement Bonds. Since June 2002 City Council has authorized issuance of the entire amount as General Obligation Commercial Paper Series D, G, H-1 and H-2. On November 7, 2006, voters of the City authorized the issuance of $625,000,000 in additional Public Improvement Bonds. City Council has authorized issuance of $223,550,000 as General Obligation Commercial Paper Series D, G, H-1, and H-2. In addition, the City is authorized by the City Charter to issue $100,000 annually in general improvement bonds without voter approval.
H. Legal Debt Margin
At June 30, 2009, the City’s legal debt limit was 10% of assessed property valuation totaling $192,967,520,000. The City’s legal debt margin was $16,187,752,000.
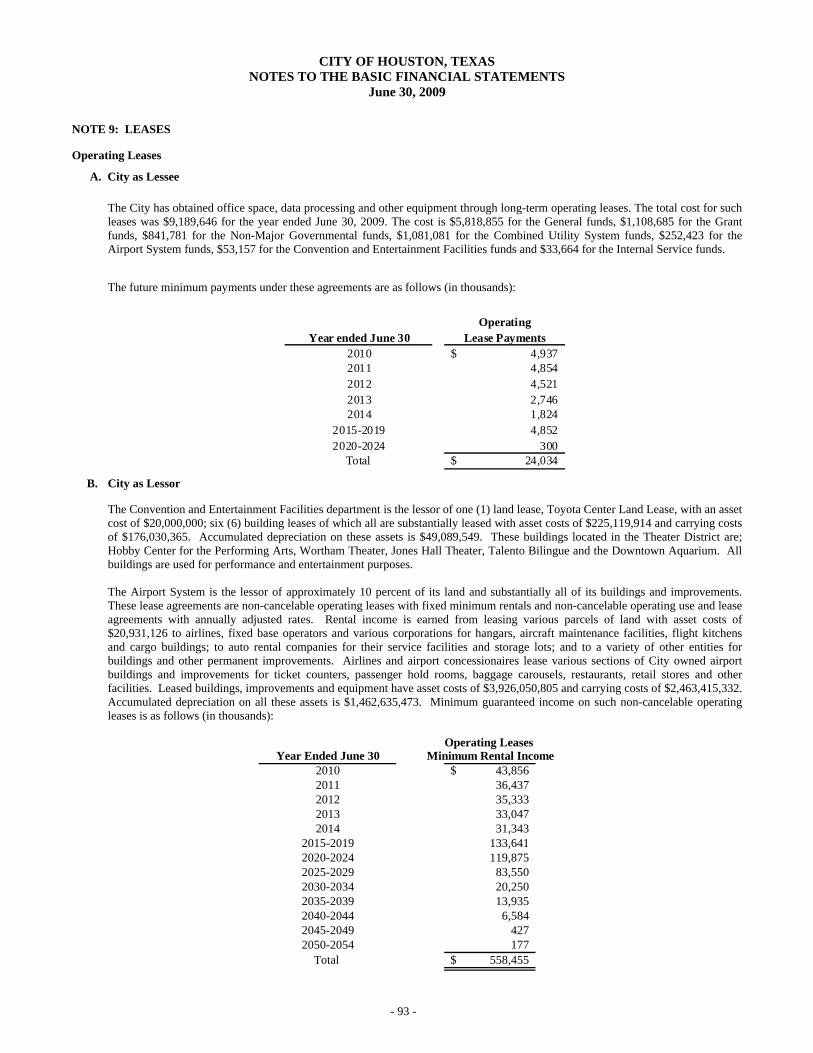
CITY OF HOUSTON, TEXAS NOTES TO THE BASIC FINANCIAL STATEMENTS
June 30, 2009
- 93 -
NOTE 9: LEASES Operating Leases
A. City as Lessee
The City has obtained office space, data processing and other equipment through long-term operating leases. The total cost for such leases was $9,189,646 for the year ended June 30, 2009. The cost is $5,818,855 for the General funds, $1,108,685 for the Grant funds, $841,781 for the Non-Major Governmental funds, $1,081,081 for the Combined Utility System funds, $252,423 for the Airport System funds, $53,157 for the Convention and Entertainment Facilities funds and $33,664 for the Internal Service funds. The future minimum payments under these agreements are as follows (in thousands):
OperatingYear ended June 30 Lease Payments
2010 4,937$ 2011 4,854 2012 4,521 2013 2,746 2014 1,824
2015-2019 4,852 2020-2024 300
Total 24,034$
B. City as Lessor The Convention and Entertainment Facilities department is the lessor of one (1) land lease, Toyota Center Land Lease, with an asset cost of $20,000,000; six (6) building leases of which all are substantially leased with asset costs of $225,119,914 and carrying costs of $176,030,365. Accumulated depreciation on these assets is $49,089,549. These buildings located in the Theater District are; Hobby Center for the Performing Arts, Wortham Theater, Jones Hall Theater, Talento Bilingue and the Downtown Aquarium. All buildings are used for performance and entertainment purposes. The Airport System is the lessor of approximately 10 percent of its land and substantially all of its buildings and improvements. These lease agreements are non-cancelable operating leases with fixed minimum rentals and non-cancelable operating use and lease agreements with annually adjusted rates. Rental income is earned from leasing various parcels of land with asset costs of $20,931,126 to airlines, fixed base operators and various corporations for hangars, aircraft maintenance facilities, flight kitchens and cargo buildings; to auto rental companies for their service facilities and storage lots; and to a variety of other entities for buildings and other permanent improvements. Airlines and airport concessionaires lease various sections of City owned airport buildings and improvements for ticket counters, passenger hold rooms, baggage carousels, restaurants, retail stores and other facilities. Leased buildings, improvements and equipment have asset costs of $3,926,050,805 and carrying costs of $2,463,415,332. Accumulated depreciation on all these assets is $1,462,635,473. Minimum guaranteed income on such non-cancelable operating leases is as follows (in thousands):
Operating Leases
Year Ended June 30 Minimum Rental Income2010 43,856$ 2011 36,437 2012 35,333 2013 33,047 2014 31,343
2015-2019 133,641 2020-2024 119,875 2025-2029 83,550 2030-2034 20,250 2035-2039 13,935 2040-2044 6,584 2045-2049 427 2050-2054 177
Total 558,455$
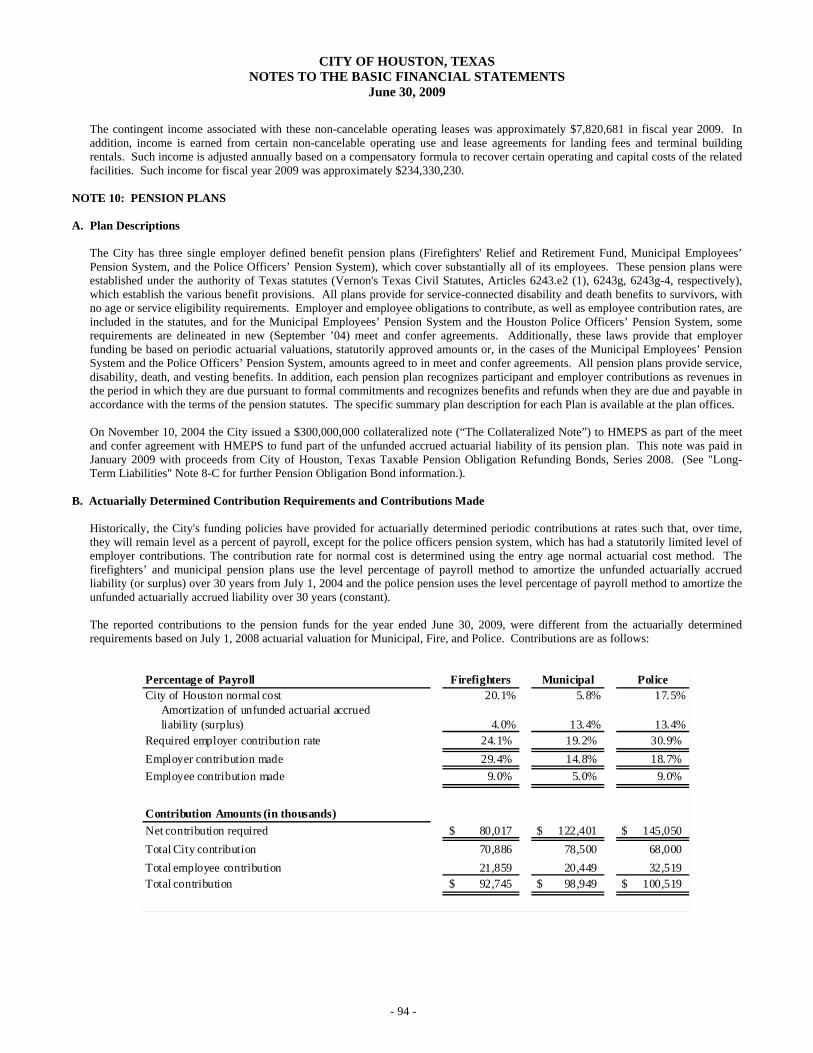
CITY OF HOUSTON, TEXAS NOTES TO THE BASIC FINANCIAL STATEMENTS
June 30, 2009
- 94 -
The contingent income associated with these non-cancelable operating leases was approximately $7,820,681 in fiscal year 2009. In addition, income is earned from certain non-cancelable operating use and lease agreements for landing fees and terminal building rentals. Such income is adjusted annually based on a compensatory formula to recover certain operating and capital costs of the related facilities. Such income for fiscal year 2009 was approximately $234,330,230.
NOTE 10: PENSION PLANS A. Plan Descriptions
The City has three single employer defined benefit pension plans (Firefighters' Relief and Retirement Fund, Municipal Employees’ Pension System, and the Police Officers’ Pension System), which cover substantially all of its employees. These pension plans were established under the authority of Texas statutes (Vernon's Texas Civil Statutes, Articles 6243.e2 (1), 6243g, 6243g-4, respectively), which establish the various benefit provisions. All plans provide for service-connected disability and death benefits to survivors, with no age or service eligibility requirements. Employer and employee obligations to contribute, as well as employee contribution rates, are included in the statutes, and for the Municipal Employees’ Pension System and the Houston Police Officers’ Pension System, some requirements are delineated in new (September ’04) meet and confer agreements. Additionally, these laws provide that employer funding be based on periodic actuarial valuations, statutorily approved amounts or, in the cases of the Municipal Employees’ Pension System and the Police Officers’ Pension System, amounts agreed to in meet and confer agreements. All pension plans provide service, disability, death, and vesting benefits. In addition, each pension plan recognizes participant and employer contributions as revenues in the period in which they are due pursuant to formal commitments and recognizes benefits and refunds when they are due and payable in accordance with the terms of the pension statutes. The specific summary plan description for each Plan is available at the plan offices. On November 10, 2004 the City issued a $300,000,000 collateralized note (“The Collateralized Note”) to HMEPS as part of the meet and confer agreement with HMEPS to fund part of the unfunded accrued actuarial liability of its pension plan. This note was paid in January 2009 with proceeds from City of Houston, Texas Taxable Pension Obligation Refunding Bonds, Series 2008. (See "Long-Term Liabilities" Note 8-C for further Pension Obligation Bond information.).
B. Actuarially Determined Contribution Requirements and Contributions Made
Historically, the City's funding policies have provided for actuarially determined periodic contributions at rates such that, over time, they will remain level as a percent of payroll, except for the police officers pension system, which has had a statutorily limited level of employer contributions. The contribution rate for normal cost is determined using the entry age normal actuarial cost method. The firefighters’ and municipal pension plans use the level percentage of payroll method to amortize the unfunded actuarially accrued liability (or surplus) over 30 years from July 1, 2004 and the police pension uses the level percentage of payroll method to amortize the unfunded actuarially accrued liability over 30 years (constant). The reported contributions to the pension funds for the year ended June 30, 2009, were different from the actuarially determined requirements based on July 1, 2008 actuarial valuation for Municipal, Fire, and Police. Contributions are as follows:
Percentage of Payroll Firefighters Municipal PoliceCity of Houston normal cost 20.1% 5.8% 17.5% Amortization of unfunded actuarial accrued liability (surplus) 4.0% 13.4% 13.4%Required employer contribution rate 24.1% 19.2% 30.9% Employer contribution made 29.4% 14.8% 18.7% Employee contribution made 9.0% 5.0% 9.0%
Contribution Amounts (in thousands)Net contribution required 80,017$ 122,401$ 145,050$ Total City contribution 70,886 78,500 68,000 Total employee contribution 21,859 20,449 32,519 Total contribution 92,745$ 98,949$ 100,519$

CITY OF HOUSTON, TEXAS NOTES TO THE BASIC FINANCIAL STATEMENTS
June 30, 2009
- 95 -
C. Annual Pension Cost and Net Pension (Obligation) Asset The annual pension cost associated with the City’s three pension funds for the current year is as follows (in thousands):
Houston HoustonHouston Municipal Police
Firefighters' Employees' Officers'Pension Pension Pension
Annual required contribution 58,158$ 101,952$ 112,531$ Interest on net pension obligation 3,349 24,264 27,078 Adjustment to annual required contribution (2,775) (20,117) (20,330)
Annual pension cost 58,732 106,099 119,279 Contribution made 70,886 78,500 68,000
Change in net pension obligation 12,154 (27,599) (51,279) Net pension obligation beginning (39,384) (285,463) (318,567) Net pension obligation end of year (27,229)$ (313,062)$ (369,846)$
D. Schedule of Funding Progress (in millions)
Houston HoustonHouston Municipal Police
Firefighters' Employees' Officers'Pension Pension Pension
Actuarial Valuation Date July 1, 2008 July 1, 2008 July 1, 2008Actuarial Value of Plan Assets (a) $2,945.1 $2,310.4 $3,337.6Actuarial Accrued Liability (AAL) Entry Age (b) $3,080.5 $3,296.4 $4,079.0Unfunded AAL (Surplus UAAL) (b - a) $135.4 $986.0 $741.4Funded Ratio (a/b) 96% 70% 82%Projected Annual Covered Payroll (c) $239.2 $483.8 $351.5UAAL as Percentage of Covered Payroll ((b - a)/c) 57% 204% 211%
E. Houston Firefighters’ Pension System
Schedule of Employer Contributions (in millions)
Year Ended June 30
Annual Pension
Cost
Percentage Contributed
Net Pension Asset (Obligation)
Annual Required
Contribution as a %
of Base Pay
2007 $74.7 70.8% ($26.7) 33.5% 2008 $66.7 80.9% ($39.4) 29.4% 2009 $58.7 120.7% ($27.2) 24.1%

CITY OF HOUSTON, TEXAS NOTES TO THE BASIC FINANCIAL STATEMENTS
June 30, 2009
- 96 -
The information presented in the required supplementary schedules was determined as part of the actuarial valuations at the dates indicated. Additional information as to the actuarial valuation used for purposes of the financial statements is as follows:
Valuation date July 1, 2008
Actuarial cost method Entry age Normal Cost
Amortization method Level percent of payroll over an open period of 30 years
Remaining amortization period Rolling 30 year
Asset valuation method 5 year smoothed market
Actuarial assumptions: Investment rate of return
8.5%, net of expenses
Inflation rate 3.0%
Payroll growth rate 3.0%
Annual increase attributable to seniority/merit
3.0% to 7%
Cost of living adjustment 3% annually F. Houston Municipal Pension System Information
Schedule of Employer Contributions (in millions)
Year Ended June 30
Annual Pension
Cost
Percentage Contributed
Net Pension Obligation
Annual Required
Contribution as a %
of Base Pay
2007 $111.4 64.6% $263.7 24.1% 2008 $96.7 77.5% $285.5 19.5% 2009 $106.1 74.0% $313.1 19.2%
The information presented in the required supplementary schedules was determined as part of the actuarial valuations at the dates indicated. Additional information as to the actuarial valuation used for purposes of the financial statements is as follows:
Valuation date July 1, 2008
Actuarial cost method Entry Age Normal cost
Amortization method Level percentage of payroll over an open period of 30 years
Remaining amortization period Rolling 30 year period
Asset valuation method 5 year smoothed market
Actuarial assumptions: investment rate of return
8.5%, net of expenses
Payroll growth factor 3.0%
Projected individual salary increases Graded rates based on years of service
General inflation rate 3.0%
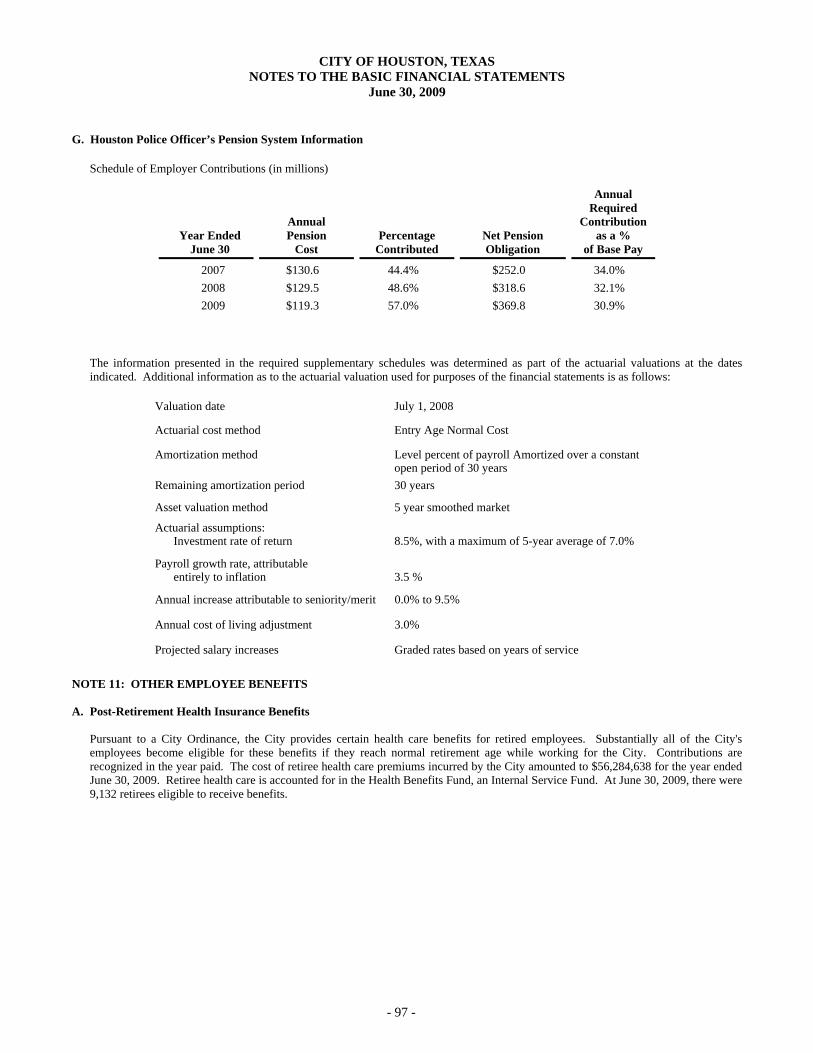
CITY OF HOUSTON, TEXAS NOTES TO THE BASIC FINANCIAL STATEMENTS
June 30, 2009
- 97 -
G. Houston Police Officer’s Pension System Information
Schedule of Employer Contributions (in millions)
Year Ended June 30
Annual Pension
Cost
Percentage Contributed
Net Pension Obligation
Annual Required
Contribution as a %
of Base Pay
2007 $130.6 44.4% $252.0 34.0% 2008 $129.5 48.6% $318.6 32.1% 2009 $119.3 57.0% $369.8 30.9%
The information presented in the required supplementary schedules was determined as part of the actuarial valuations at the dates indicated. Additional information as to the actuarial valuation used for purposes of the financial statements is as follows:
Valuation date July 1, 2008
Actuarial cost method Entry Age Normal Cost
Amortization method Level percent of payroll Amortized over a constant open period of 30 years
Remaining amortization period 30 years
Asset valuation method 5 year smoothed market
Actuarial assumptions: Investment rate of return
8.5%, with a maximum of 5-year average of 7.0%
Payroll growth rate, attributable entirely to inflation
3.5 %
Annual increase attributable to seniority/merit 0.0% to 9.5%
Annual cost of living adjustment 3.0%
Projected salary increases Graded rates based on years of service
NOTE 11: OTHER EMPLOYEE BENEFITS A. Post-Retirement Health Insurance Benefits
Pursuant to a City Ordinance, the City provides certain health care benefits for retired employees. Substantially all of the City's employees become eligible for these benefits if they reach normal retirement age while working for the City. Contributions are recognized in the year paid. The cost of retiree health care premiums incurred by the City amounted to $56,284,638 for the year ended June 30, 2009. Retiree health care is accounted for in the Health Benefits Fund, an Internal Service Fund. At June 30, 2009, there were 9,132 retirees eligible to receive benefits.
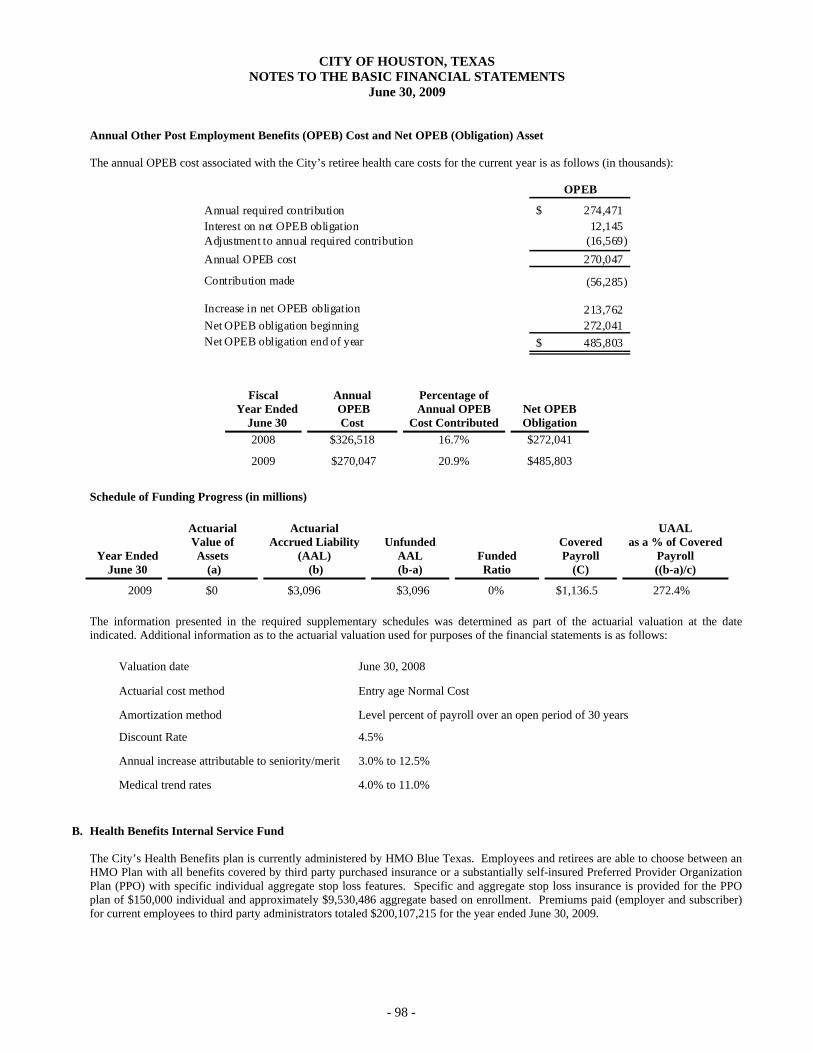
CITY OF HOUSTON, TEXAS NOTES TO THE BASIC FINANCIAL STATEMENTS
June 30, 2009
- 98 -
Annual Other Post Employment Benefits (OPEB) Cost and Net OPEB (Obligation) Asset The annual OPEB cost associated with the City’s retiree health care costs for the current year is as follows (in thousands):
OPEB
Annual required contribution 274,471$ Interest on net OPEB obligation 12,145 Adjustment to annual required contribution (16,569) Annual OPEB cost 270,047
Contribution made (56,285)
Increase in net OPEB obligation 213,762 Net OPEB obligation beginning 272,041 Net OPEB obligation end of year 485,803$
Fiscal
Year Ended June 30
Annual OPEB
Cost
Percentage of Annual OPEB
Cost Contributed
Net OPEB Obligation
2008 $326,518 16.7% $272,041
2009
$270,047
20.9%
$485,803 Schedule of Funding Progress (in millions)
Year Ended June 30
Actuarial Value of Assets
(a)
Actuarial Accrued Liability
(AAL) (b)
Unfunded
AAL (b-a)
Funded Ratio
Covered Payroll
(C)
UAAL as a % of Covered
Payroll ((b-a)/c)
2009 $0 $3,096 $3,096 0% $1,136.5 272.4%
The information presented in the required supplementary schedules was determined as part of the actuarial valuation at the date indicated. Additional information as to the actuarial valuation used for purposes of the financial statements is as follows:
Valuation date June 30, 2008
Actuarial cost method Entry age Normal Cost
Amortization method Level percent of payroll over an open period of 30 years
Discount Rate 4.5%
Annual increase attributable to seniority/merit 3.0% to 12.5%
Medical trend rates 4.0% to 11.0%
B. Health Benefits Internal Service Fund
The City’s Health Benefits plan is currently administered by HMO Blue Texas. Employees and retirees are able to choose between an HMO Plan with all benefits covered by third party purchased insurance or a substantially self-insured Preferred Provider Organization Plan (PPO) with specific individual aggregate stop loss features. Specific and aggregate stop loss insurance is provided for the PPO plan of $150,000 individual and approximately $9,530,486 aggregate based on enrollment. Premiums paid (employer and subscriber) for current employees to third party administrators totaled $200,107,215 for the year ended June 30, 2009.
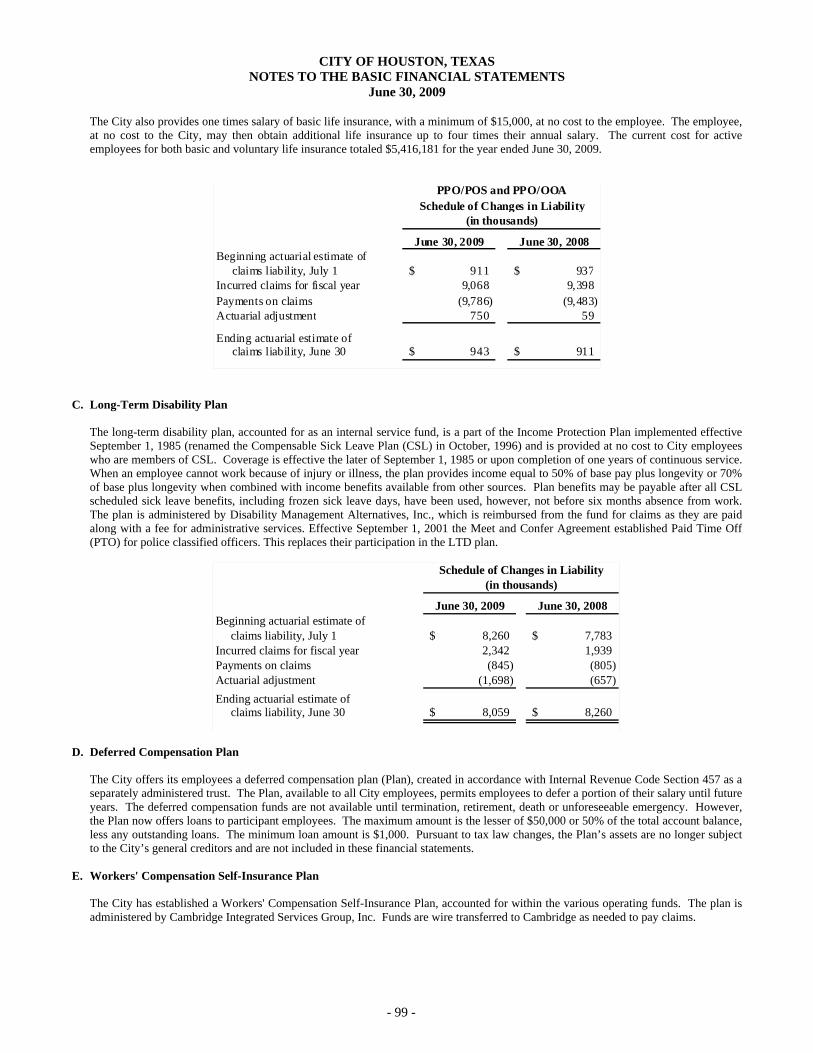
CITY OF HOUSTON, TEXAS NOTES TO THE BASIC FINANCIAL STATEMENTS
June 30, 2009
- 99 -
The City also provides one times salary of basic life insurance, with a minimum of $15,000, at no cost to the employee. The employee, at no cost to the City, may then obtain additional life insurance up to four times their annual salary. The current cost for active employees for both basic and voluntary life insurance totaled $5,416,181 for the year ended June 30, 2009.
PPO/POS and PPO/OOASchedule of Changes in Liability
(in thousands)
June 30, 2009 June 30, 2008Beginning actuarial estimate of claims liability, July 1 911$ 937$ Incurred claims for fiscal year 9,068 9,398 Payments on claims (9,786) (9,483) Actuarial adjustment 750 59
Ending actuarial estimate of claims liability, June 30 943$ 911$
C. Long-Term Disability Plan
The long-term disability plan, accounted for as an internal service fund, is a part of the Income Protection Plan implemented effective September 1, 1985 (renamed the Compensable Sick Leave Plan (CSL) in October, 1996) and is provided at no cost to City employees who are members of CSL. Coverage is effective the later of September 1, 1985 or upon completion of one years of continuous service. When an employee cannot work because of injury or illness, the plan provides income equal to 50% of base pay plus longevity or 70% of base plus longevity when combined with income benefits available from other sources. Plan benefits may be payable after all CSL scheduled sick leave benefits, including frozen sick leave days, have been used, however, not before six months absence from work. The plan is administered by Disability Management Alternatives, Inc., which is reimbursed from the fund for claims as they are paid along with a fee for administrative services. Effective September 1, 2001 the Meet and Confer Agreement established Paid Time Off (PTO) for police classified officers. This replaces their participation in the LTD plan.
Schedule of Changes in Liability(in thousands)
June 30, 2009 June 30, 2008Beginning actuarial estimate of claims liability, July 1 8,260$ 7,783$ Incurred claims for fiscal year 2,342 1,939 Payments on claims (845) (805) Actuarial adjustment (1,698) (657) Ending actuarial estimate of claims liability, June 30 8,059$ 8,260$
D. Deferred Compensation Plan
The City offers its employees a deferred compensation plan (Plan), created in accordance with Internal Revenue Code Section 457 as a separately administered trust. The Plan, available to all City employees, permits employees to defer a portion of their salary until future years. The deferred compensation funds are not available until termination, retirement, death or unforeseeable emergency. However, the Plan now offers loans to participant employees. The maximum amount is the lesser of $50,000 or 50% of the total account balance, less any outstanding loans. The minimum loan amount is $1,000. Pursuant to tax law changes, the Plan’s assets are no longer subject to the City’s general creditors and are not included in these financial statements.
E. Workers' Compensation Self-Insurance Plan
The City has established a Workers' Compensation Self-Insurance Plan, accounted for within the various operating funds. The plan is administered by Cambridge Integrated Services Group, Inc. Funds are wire transferred to Cambridge as needed to pay claims.

CITY OF HOUSTON, TEXAS NOTES TO THE BASIC FINANCIAL STATEMENTS
June 30, 2009
- 100 -
At June 30, 2009 the City has an accumulated liability in the amount of $77 million covering estimates for approved but unpaid claims and incurred but not reported claims (calculated on an actuarial basis) recorded in the Statement of Net Assets and Enterprise Funds. The amount of liability is based on an actuarial study.
Schedule of Changes in Liability(in thousands)
June 30, 2009 June 30, 2008Beginning actuarial estimate of claims liability, July 1 77,986$ 77,724$ Incurred claims for fiscal year 13,128 15,366 Payments on claims (13,504) (15,094) Actuarial adjustment (892) (10) Ending actuarial estimate of claims liability, June 30 76,718$ 77,986$
NOTE 12: INTERFUND TRANSACTIONS A. Transfers
Transfers during the year ended June 30, 2009, were as follows (in thousands):
Transferred to:Nonmajor Combined Convention & Houston Total
General Governmental Debt Capital Utility Entertainment Area Water TransfersTransferred from: Fund Funds Service Projects System Facilities Corporation OutGeneral Fund -$ 18,890$ 262,089$ 1$ -$ 1,295$ -$ 282,275$ Grants Fund 401 1,000 - 4,900 - - - 6,301 Nonmajor Funds 15,998 - 6,831 - - 3,340 - 26,169 Capital Projects 11,430 2,300 62,668 - 1,072 - - 77,470 Convention and Entertainment 500 - - - - - 500 Combined Utility System 127 39,129 28,419 - - - 9,449 77,124 Parking Management 6,683 553 - - 7,236 Internal Service Fund 1,000 1,000 Total transfers in 36,139$ 61,872$ 360,007$ 4,901$ 1,072$ 4,635$ 9,449$ 478,075$
Transfers are used to (1) move receipts restricted to debt service from the funds collecting the receipts to the debt service fund and (2) use unrestricted revenues collected in the general fund to finance various programs accounted for in other funds in accordance with budgetary authorizations, (3) use unrestricted revenues in the Combined Utility fund and special revenue fund to finance general fund programs. The Combined Utility System, an enterprise fund, transferred capital assets valued at $127 thousand to the General Fund. The Capital Projects Fund transferred capital assets of $1.072 million to the Combined Utility System. The General Fund and the Capital Projects Fund are governmental funds and capital asset transfers are not reported at the fund level.
B. Transfers to Component Units Transfers to the Houston Arts Alliance from the Convention and Entertainment Facilities during the year ended June 30, 2009 totaled $12,580,704.
C. Interfund Charges
The General Fund charges the Airport System, Convention and Entertainment Facilities, Combined Utility System, Capital Project, Sign Administration, Auto Dealer's and Cable Television Funds for services provided by the General Fund on behalf of these funds. Such charges totaled $61,080,000 for the year ended June 30, 2009, and are recorded as revenue in the General Fund and as expense, expenditure or capital assets in the funds assessed.
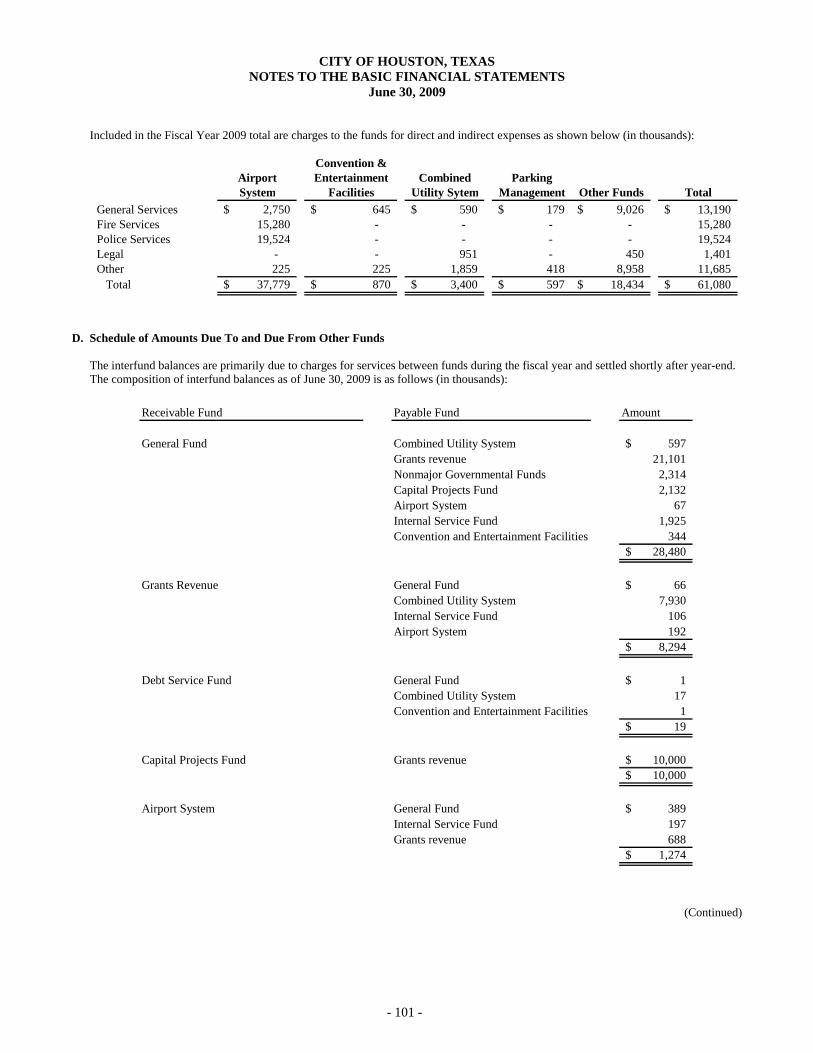
CITY OF HOUSTON, TEXAS NOTES TO THE BASIC FINANCIAL STATEMENTS
June 30, 2009
- 101 -
Included in the Fiscal Year 2009 total are charges to the funds for direct and indirect expenses as shown below (in thousands):
Convention &Airport Entertainment Combined ParkingSystem Facilities Utility Sytem Management Other Funds Total
General Services 2,750$ 645$ 590$ 179$ 9,026$ 13,190$ Fire Services 15,280 - - - - 15,280 Police Services 19,524 - - - - 19,524 Legal - - 951 - 450 1,401 Other 225 225 1,859 418 8,958 11,685 Total 37,779$ 870$ 3,400$ 597$ 18,434$ 61,080$
D. Schedule of Amounts Due To and Due From Other Funds The interfund balances are primarily due to charges for services between funds during the fiscal year and settled shortly after year-end. The composition of interfund balances as of June 30, 2009 is as follows (in thousands):
Receivable Fund Payable Fund Amount
General Fund Combined Utility System 597$ Grants revenue 21,101 Nonmajor Governmental Funds 2,314 Capital Projects Fund 2,132 Airport System 67 Internal Service Fund 1,925Convention and Entertainment Facilities 344
28,480$
Grants Revenue General Fund 66$ Combined Utility System 7,930 Internal Service Fund 106 Airport System 192
8,294$
Debt Service Fund General Fund 1$ Combined Utility System 17 Convention and Entertainment Facilities 1
19$
Capital Projects Fund Grants revenue 10,000$ 10,000$
Airport System General Fund 389$ Internal Service Fund 197 Grants revenue 688
1,274$
(Continued)

CITY OF HOUSTON, TEXAS NOTES TO THE BASIC FINANCIAL STATEMENTS
June 30, 2009
- 102 -
Convention and Entertainment Facilities General Fund 143$ Airport System 7 Nonmajor Governmental funds 9 Grants revenue 10 Internal Service Fund 16 Combined Utility System 17
202$
Combined Utility System HAWC 99,679$ Grants revenue 9,623 Nonmajor Governmental Funds 3 Internal Service Fund 353 General Fund 390 Airport System 70 110,118$
Nonmajor Enterprise - HAWC Combined Utility System 1,025 1,025$
Nonmajor Governmental Funds General Fund 642$
Combined Utility System 2 Internal Service Fund 122 Nonmajor Public Works 6
772$
Internal Service Fund - Health Benefits General Fund 2$ Internal Service Fund - Long term disability 4
6$
Nonmajor Enterprise - Parking Management General Fund 4$ Internal Service Fund 5
9$
NOTE 13: COMMITMENTS AND CONTINGENCIES A. Litigation and Claims
The City is a defendant in various lawsuits and is aware of pending claims arising in the ordinary course of its municipal and enterprise activities, certain of which seek substantial damages. That litigation includes lawsuits and claims alleging that the City caused personal injuries and wrongful deaths; class actions and other lawsuits and claims alleging discriminatory hiring and promotional practices and certain civil rights violations arising under the Federal Voting Rights Act; various claims from contractors for additional amounts under construction contracts; and claims involving property tax assessments and various other liability claims. Alleged damages in the lawsuits are approximately $207.9 million. The status of such litigation ranges from an early discovery stage to various levels of appeal of judgments both for and against the City. The amount of damages is limited in certain cases under the Texas Tort Claims Act and is subject to appeal. The City intends to defend itself vigorously against the suits. There is other threatened litigation for which an amount cannot be determined. The City typically utilizes the General Fund to liquidate claims and judgments. In the Statement of Net Assets, the City has recognized a liability of $53.2 million for potential litigation losses arising from various lawsuits. In 2004, Houston voters approved two ballot propositions limiting City revenue growth. Proposition 1 generally limits annual growth in property tax revenues to the lesser of the actual revenues in the preceding fiscal year, plus 4.5 percent, or the revenues received in the previous fiscal year, plus the cumulative combined rates of inflation and the City’s population growth. With the exception of grant monies, revenue received from other governmental entities and interfund transfers, Proposition 2 caps growth in all City revenues, including the General Fund, Special Revenue Funds and Enterprise Funds (“combined revenues”). Proposition 2 would require a 60 percent vote at a regular election before the City could increase combined revenues over the combined revenues for the preceding fiscal year as adjusted for rates of change in the consumer price index and population growth. Any combined revenues collected by the City in excess of the Proposition 2 restriction would be placed in a taxpayer relief fund. Although both propositions received a majority of votes in the 2004 election, it is the City’s position that only Proposition 1 is effective because it received a higher number of favorable votes.
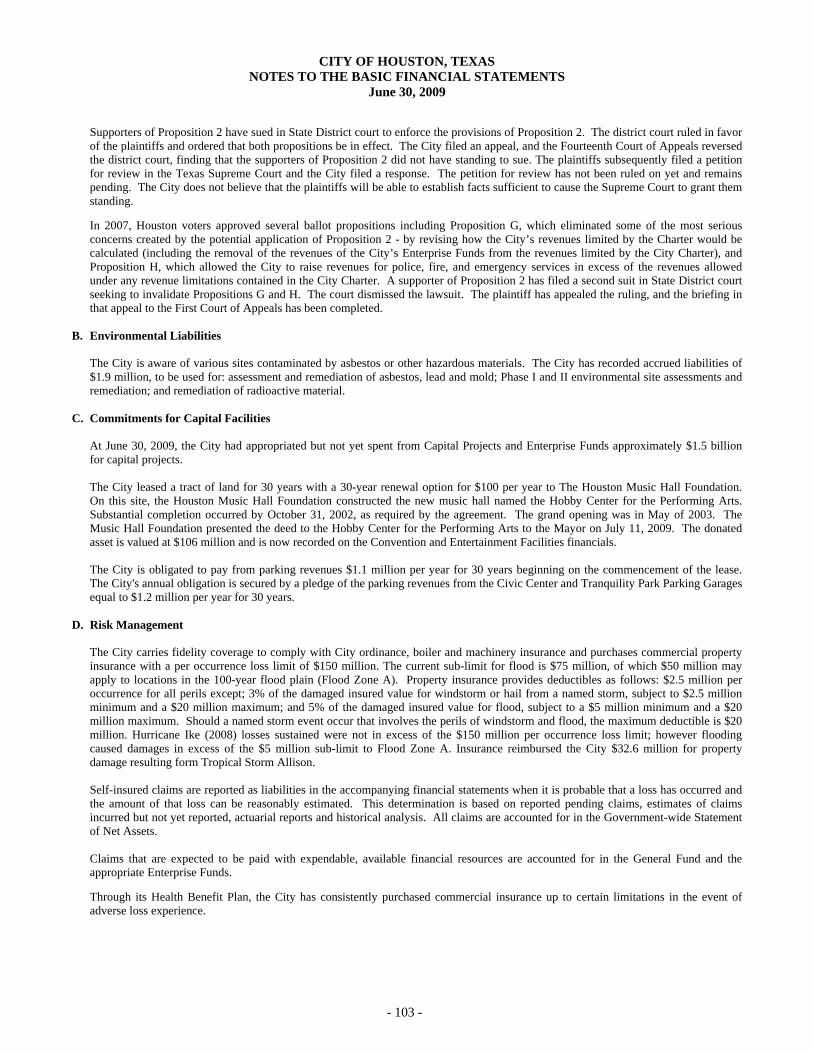
CITY OF HOUSTON, TEXAS NOTES TO THE BASIC FINANCIAL STATEMENTS
June 30, 2009
- 103 -
Supporters of Proposition 2 have sued in State District court to enforce the provisions of Proposition 2. The district court ruled in favor of the plaintiffs and ordered that both propositions be in effect. The City filed an appeal, and the Fourteenth Court of Appeals reversed the district court, finding that the supporters of Proposition 2 did not have standing to sue. The plaintiffs subsequently filed a petition for review in the Texas Supreme Court and the City filed a response. The petition for review has not been ruled on yet and remains pending. The City does not believe that the plaintiffs will be able to establish facts sufficient to cause the Supreme Court to grant them standing. In 2007, Houston voters approved several ballot propositions including Proposition G, which eliminated some of the most serious concerns created by the potential application of Proposition 2 - by revising how the City’s revenues limited by the Charter would be calculated (including the removal of the revenues of the City’s Enterprise Funds from the revenues limited by the City Charter), and Proposition H, which allowed the City to raise revenues for police, fire, and emergency services in excess of the revenues allowed under any revenue limitations contained in the City Charter. A supporter of Proposition 2 has filed a second suit in State District court seeking to invalidate Propositions G and H. The court dismissed the lawsuit. The plaintiff has appealed the ruling, and the briefing in that appeal to the First Court of Appeals has been completed.
B. Environmental Liabilities
The City is aware of various sites contaminated by asbestos or other hazardous materials. The City has recorded accrued liabilities of $1.9 million, to be used for: assessment and remediation of asbestos, lead and mold; Phase I and II environmental site assessments and remediation; and remediation of radioactive material.
C. Commitments for Capital Facilities
At June 30, 2009, the City had appropriated but not yet spent from Capital Projects and Enterprise Funds approximately $1.5 billion for capital projects.
The City leased a tract of land for 30 years with a 30-year renewal option for $100 per year to The Houston Music Hall Foundation.
On this site, the Houston Music Hall Foundation constructed the new music hall named the Hobby Center for the Performing Arts. Substantial completion occurred by October 31, 2002, as required by the agreement. The grand opening was in May of 2003. The Music Hall Foundation presented the deed to the Hobby Center for the Performing Arts to the Mayor on July 11, 2009. The donated asset is valued at $106 million and is now recorded on the Convention and Entertainment Facilities financials. The City is obligated to pay from parking revenues $1.1 million per year for 30 years beginning on the commencement of the lease. The City's annual obligation is secured by a pledge of the parking revenues from the Civic Center and Tranquility Park Parking Garages equal to $1.2 million per year for 30 years.
D. Risk Management The City carries fidelity coverage to comply with City ordinance, boiler and machinery insurance and purchases commercial property insurance with a per occurrence loss limit of $150 million. The current sub-limit for flood is $75 million, of which $50 million may apply to locations in the 100-year flood plain (Flood Zone A). Property insurance provides deductibles as follows: $2.5 million per occurrence for all perils except; 3% of the damaged insured value for windstorm or hail from a named storm, subject to $2.5 million minimum and a $20 million maximum; and 5% of the damaged insured value for flood, subject to a $5 million minimum and a $20 million maximum. Should a named storm event occur that involves the perils of windstorm and flood, the maximum deductible is $20 million. Hurricane Ike (2008) losses sustained were not in excess of the $150 million per occurrence loss limit; however flooding caused damages in excess of the $5 million sub-limit to Flood Zone A. Insurance reimbursed the City $32.6 million for property damage resulting form Tropical Storm Allison. Self-insured claims are reported as liabilities in the accompanying financial statements when it is probable that a loss has occurred and the amount of that loss can be reasonably estimated. This determination is based on reported pending claims, estimates of claims incurred but not yet reported, actuarial reports and historical analysis. All claims are accounted for in the Government-wide Statement of Net Assets. Claims that are expected to be paid with expendable, available financial resources are accounted for in the General Fund and the appropriate Enterprise Funds. Through its Health Benefit Plan, the City has consistently purchased commercial insurance up to certain limitations in the event of adverse loss experience.

CITY OF HOUSTON, TEXAS NOTES TO THE BASIC FINANCIAL STATEMENTS
June 30, 2009
- 104 -
For unemployment claims, the City pays claims as they are settled. Unemployment claim activity is as follows:
Unemployment Claim ActivityJune 30, 2009 June 30, 2008
Unpaid claims, beginning of fiscal year $117,602 $123,964Incurred claims (including IBNRs) 613,348 583,298 Claim payments (534,939) (589,660) Unpaid claims, end of fiscal year $196,011 $117,602
E. Electricity Futures Contracts
Objective of the futures contracts. The City’s electric supply agreement provides that the City will purchase electricity at prices based on market prices of natural gas at time of delivery. Therefore the City is exposed to significant price fluctuations in its electricity purchases. The agreement also allows the City to lock in fixed natural gas prices for future periods. To hedge the risk of increases and to be able to accurately budget future purchases, the City has entered into contracts to lock in fixed rates for the natural gas price component of future electricity purchases.
Terms: At June 30, 2009 the City had ten outstanding agreements to cover natural gas purchases for August 2009 through June 2013. As of June 30, 2009 the aggregate notional amount of the agreements was 3,167.5 contracts or 31,675,000 million British thermal units (MMBtu’s) of natural gas. Locked-in prices ranged from $6.75 to $9.90 per MMBtu.
Fair value: As of June 30, 2009, because natural gas futures prices had generally declined from the time of the agreements, the contracts had a total negative net fair value of $36.9 million.
Credit risk: As of June 30, 2009 the City is exposed to credit risk on the contracts for a total fair positive value of $1.6 million. Other contracts do not involve credit risk because the fair market value is negative to the City. The City’s electrical provider is the Texas General Land Office (“GLO”), an agency of the State of Texas, which is rated AA1 by Moody’s, AA+ by Standard and Poor’s, and AA+ by Fitch.
Termination risk: GLO can terminate the electrical supply agreement (and related price agreements) only if the City defaults on its obligations. The City can unwind the price agreements at its discretion, paying or receiving market value credit at the time of the unwind.
F. Purchase Commitments - Renewable Energy Credits and Fixed Power Price Transactions
Objective of the Renewable Energy Credit Agreements: To diversify energy sources, to manage its utility costs, and as part of its commitment to protect the environment, the City has entered into contracts for fixed power price transactions and renewable energy credits ("REC’s"). REC’s are Renewable Energy Credits produced in Texas and obtained from any type of renewable resource qualified under Texas Rules, including solar, landfill gas, wind and other renewable resources.
Terms: At June 30, 2009 the City had five outstanding fixed power price transactions and REC’s contracts with GLO to receive 1,752,000 RECs or 1.7 billion kilowatt-hours of renewable energy from 2009 through 2013. This represents about 32% of the City's anticipated electrical use. Each contract was for 10 MW of power at prices ranging from $69 per MWhr to $91 per MWhr.
Credit Risk: As of June 30, 2009 the City is exposed to credit risk on the contracts as to delivery. The City's electrical provider is the Texas General Land Office ("FLO"), an agency of the State of Texas, which is rated AA1 by Moody's, AA+ by Standard and Poor's, and AA+ by Fitch.
Termination risk: GLO can terminate the electrical supply agreement (and related price agreements) only if the City defaults on its obligations. The City can unwind the price agreements at its discretion, paying or receiving market value credit at time of the unwind.
G. Purchase Commitment - Luce Bayou Inter-Basin Transfer Project
On January 29, 2009 City Council approved a contract establishing the terms for cooperation between the Coastal Water Authority (“CWA”) and Houston for the planning, design, property acquisition, permitting, construction and financing of the Luce Bayou Inter-Basin Transfer Project, a canal and pipeline to move 400 millions gallons of surface water per day from the Trinity River Basin to Lake Houston. As part of the agreement, CWA agreed to finance preliminary project costs from funds on hand plus proceeds of a $28,000,000 Water Infrastructure Loan (“WIF”) from the Texas Water Development Board, and the City pledged to make debt service payments on the WIF beginning in 2019 through 2028. Pledged revenues for the loan are Net Revenues held in the General Purpose Fund of the Combined Utility System. Interest rates range from 2.13% to 2.88%. No interest will be charged until 2019. After the loan is repaid and all other obligations of the contract are fulfilled, upon request of the City CWA will assign to the City all of CWA’s rights, titles and interest in the project property.
CITY OF HOUSTON, TEXAS NOTES TO THE BASIC FINANCIAL STATEMENTS
June 30, 2009
- 105 -
H. Federal and State Amounts received or receivable from grantor agencies are subject to audit and adjustment by grantor agencies, principally the federal and state governments. Any disallowed claims, including amounts already collected, could be a liability of the City.
NOTE 14: RELATED ORGANIZATION TRANSACTIONS
A. Metropolitan Transit Authority (“Metro”)
The City and Metro have an interlocal agreement covering shared costs of street maintenance/construction and traffic control during the fiscal year ended June 30, 2009. The City received $68.631 million from Metro under this contract in the fiscal year ended June 30, 2009. The breakout was $40.326 million to Capital Projects, $25 million to General Fund, and $3.305 million to Special Revenues. None of these payments were for the prior contract year. In addition, the City paid Metro $1.357 million for transportation services.
B. Trinity River Authority (“TRA”)
As described in Note 8C, the City and TRA have a long-term contract under which the City is obligated to pay debt service for certain bonds as well as certain maintenance and operating expenses for a TRA dam and reservoir. During the fiscal year ended June 30, 2009 the City paid $0 for debt service and $2.1 million for maintenance and operating expenses under the terms of the contract.
C. Coastal Water Authority (“CWA”)
The City has a long-term contract with Coastal Water Authority (CWA) for the water conveyance. During the fiscal year ended June 30, 2009, the City paid CWA $28.1 million for debt service and $20.4 million for maintenance and operating expenses.
D. Houston Convention Center Hotel Corporation Upon formation of the Houston Convention Center Hotel Corporation (HCCHC), the City entered into various agreements with HCCHC, as part of the agreements, the City agreed to loan HCCHC $310 million of the convention & entertainment facility bonds, primarily for construction of the Hilton Americas Hotel. Repayment terms of the loan (including interest rates) coincide with the City’s scheduled debt service payments
In accordance with the Interlocal Agreement and the hotel management agreement, after meeting certain other funding and reserve requirements, the City can require the distribution of a preferred return from available cash flow (as defined) equal to the preferred return amount (approximately $1 million for 2003, $20 million for 2004, and $25 million per year thereafter) minus the debt service for the applicable year. In May 2009, a preferred return payment of $1.6 million was made to the City.
E. Component Units As described in note 16, the City has a number of component units, most of which have fiscal years ended June 30, 2009. Three component units; Houston Convention Center Hotel Corporation (HCCHC), Houston Housing Financing Corporation (HHFC) and Miller Theatre Advisory Board, Inc (MTAB) have fiscal years ended December 31, 2008. Subsequent to December 31, 2008, the City received interest payments of $4,658 thousand from HCCHC, none from HHFC and none from MTAB. These payments are necessary to reconcile to the City’s due from component units as of June 30, 2009. The following governmental discretely presented component units had restatements for their most recent audited financial statements: (a) City Park Redevelopment Authority, (b) Houston Parks Board, Inc.
NOTE 15: CONDUIT DEBT OBLIGATIONS
To provide for the airport facilities, the City has issued eight series of Special Facility Revenue Bonds. These bonds are limited special obligations of the City, payable solely from and secured by a pledge of revenue to be received from agreements between the City and various third parties. The bonds do not constitute a debt or pledge of the faith and credit of the City and accordingly have not been reported in the accompanying financial statements, except for the City of Houston Special Facility Revenue Bonds (Automated People Mover System), Series 1997A, which are reported as an Inferior Lien Obligation because the City has contracted with Continental Airlines to operate certain facilities and pay related debt service. See Note 8D. At June 30, 2009, the aggregate value of Special Facility Revenue Bonds outstanding was $629 million, which includes $45.8 million of City of Houston Special Facility Revenue Bonds (Automated People Mover System), Series 1997A.

CITY OF HOUSTON, TEXAS NOTES TO THE BASIC FINANCIAL STATEMENTS
June 30, 2009
- 106 -
NOTE 16: MAJOR DISCRETELY PRESENTED COMPONENT UNITS The following discretely presented component units represent major component units. For reporting purposes, the City considers a
component unit to be major if assets, liabilities, revenues or expenses exceed 10% of that component unit’s class and exceed 5% of all component units combined.
During fiscal year 2009, the City added one new discretely presented governmental component unit (Houston Parks Board LGC, Inc.)
which resulted in the addition of $4,531 thousand of ending net assets. During the same year the City dissolved the Sharpstown Economic Development Authority which resulted in the reduction of $184 thousand ending net assets. In addition, three discretely presented component units (Gulfgate Redevelopment Authority, Houston Parks Board Inc. and City Park Redevelopment Authority) restated their financial statements which had an additive affect to beginning net assets of $3,738 thousand. In prior years, Houston Downtown Park Corporation presented each of its two funds, one governmental and one proprietary in the respective tables. This year both of those funds will be presented in the governmental table for simplicity. The proprietary table will show a restatement of $199 thousand while the governmental fund will show an offsetting restatement for ($199) thousand.
Fourth Ward Redevelopment
Authority
Greater Houston Convention &
Visitor's Bureau
HoustonArts
Alliance
Cash, receivable and other current assets 13,841$ 8,813$ 6,914$ Noncurrent assets - - - Capital assets, net of accumulated depreciation 637 199 77
Total assets 14,478 9,012 6,991
Current liabilities 583 1,941 3,362 Long-term liabilities - - -
Total liabilities 583 1,941 3,362 Net assetsInvested in capital assets, net of related debt 13,177 - 2,248
Restricted - - - Unrestricted (deficit) 718 7,071 1,381
Total net assets (deficit) 13,895$ 7,071$ 3,629$
Net Assets
(in thousands)June 30, 2009
Major Component Units - Discretely Presented Governmental
(Continued)

CITY OF HOUSTON, TEXAS NOTES TO THE BASIC FINANCIAL STATEMENTS
June 30, 2009
- 107 -
Houston Downtown Park
Corporation
Main Street Market Sq
Redevelopment Authority
Midtown Redevelopment
Authority
Upper Kirby Redevelopment
Authority
Uptown Development
Authority
Nonmajor Component
Units 2009
83$ 22,378$ 53,960$ 3,465$ 22,674$ 121,677$ 253,805$ - - 1,714 169 453 22,995 25,331
79,145 - 8,370 12,102 8,891 26,144 135,565 79,228 22,378 64,044 15,736 32,018 170,816 414,701
2,479 1,059 5,150 2,629 38,873 22,176 78,252 19,704 26,920 49,405 2,250 32,729 74,835 205,843 22,183 27,979 54,555 4,879 71,602 97,011 284,095
57,251 - 5,694 12,102 8,892 12,696 112,060 - 3,963 36,102 - 6,301 58,062 104,428
(206) (9,564) (32,307) (1,245) (54,777) 3,047 (85,882) 57,045$ (5,601)$ 9,489$ 10,857$ (39,584)$ 73,805$ 130,606$

CITY OF HOUSTON, TEXAS NOTES TO THE BASIC FINANCIAL STATEMENTS
June 30, 2009
- 108 -
FourthOperating Ward
Charges for Grants and RedevelopmentComponent Units Expenses Services Contributions Authority
Fourth Ward Redevelopment Authority 6,894$ -$ -$ (6,894)$ Greater Houston Convention & Visitors Bureau 18,385 1,076 18,651 - Houston Arts Alliance (frmly Cultural Arts Cou..) 14,619 - 13,197 - Houston Downtown Park Corporation 1,772 1,036 10 - Main Street Market Square Redevelopment Auth 12,287 - - - Midtown Redevelopment Authority 12,167 - 569 - Upper Kirby Redevelopment Authority 17,596 - 7,026 - Uptown Development Authority 28,686 - - - Nonmajor Component Units 43,574 2,741 23,857 -
Total component units 155,980$ 4,853$ 63,310$ (6,894)$
General Revenues:Taxes
Property taxes levied for general purposes 1,594 Intergovermental - grants - Unrestricted investment earnings 90 Other 14,553 Loss on sales of assets - Transfers -
Total general revenues, special items and transfers 16,237 Change in net assets 9,343
Net assets beginning 4,552 New component unit & restatement - Net assets ending 13,895$
(in thousands)
Change in Net Assets Major Component Units - Discretely Presented Governmental
For the Year Ended June 30, 2009
(Continued)

CITY OF HOUSTON, TEXAS NOTES TO THE BASIC FINANCIAL STATEMENTS
June 30, 2009
- 109 -
Net (Expense) Revenue and Change In Net Assets
Greater Main St Upper Houston Houston Houston Market Sq Midtown Kirby Uptown Non-Major Total
Convention & Arts Downtown Park Redevelopment Redevelopment Redevelopment Development Component ComponentVisit. Bureau Alliance Corporation Authority Authority Authority Authority Units Units
-$ -$ -$ -$ -$ -$ -$ -$ (6,894)$ 1,342 - - - - - - - 1,342
- (1,422) - - - - - - (1,422) - - (726) - - - - - (726) - - - (12,287) - - - - (12,287) - - - - (11,598) - - - (11,598) - - - - - (10,570) - - (10,570) - - - - - - (28,686) - (28,686) - - - - - - - (16,976) (16,976)
1,342$ (1,422)$ (726)$ (12,287)$ (11,598)$ (10,570)$ (28,686)$ (16,976)$ (87,817)$
- - - 8,591 13,899 5,151 19,152 33,684 82,071 205 - - 219 499 287 468 (1,427) 341 - 1,925 - - 1,128 15 - 1,087 18,708 - - - - - - - (2) (2) - - - - - - - (7,128) (7,128)
205 1,925 - 8,810 15,526 5,453 19,620 26,214 93,990 1,547 503 (726) (3,477) 3,928 (5,117) (9,066) 9,238 6,173 5,524 3,126 57,572 (2,124) 5,561 (5,433) 15,974 35,744 120,496
- - 199 - - - - 3,738 3,937 7,071$ 3,629$ 57,045$ (5,601)$ 9,489$ (10,550)$ 6,908$ 48,720$ 130,606$

CITY OF HOUSTON, TEXAS NOTES TO THE BASIC FINANCIAL STATEMENTS
June 30, 2009
- 110 -
Houston Convention
Center Hotel Corp.
Houston Housing Finance Corp.
Houston Zoo Inc. Total
Cash, receivable and other current assets 67,283$ 24,433$ 46,688$ 138,404$ Noncurrent assets 2,196 14,597 - 16,793 Capital assets, net of accumulated depreciation 227,137 3,054 30,033 260,224
Total assets 296,616 42,084 76,721 415,421 Current liabilities 24,841 146 2,933 27,920 Long-term liabilities 285,697 70 - 285,767
Total liabilities 310,538 216 2,933 313,687 Net assets
Invested in capital assets, net of related debt (39,401) - - (39,401) Restricted 43,843 32 42,805 86,680 Unrestricted (deficit) (18,364) 41,836 30,983 54,455
Total net assets (deficit) (13,922)$ 41,868$ 73,788$ 101,734$
Net Assets
June 30, 2009(in thousands)
Major Component Units - Discretely Presented Business-type

CITY OF HOUSTON, TEXAS NOTES TO THE BASIC FINANCIAL STATEMENTS
June 30, 2009
- 111 -
This page is left blank intentionally.
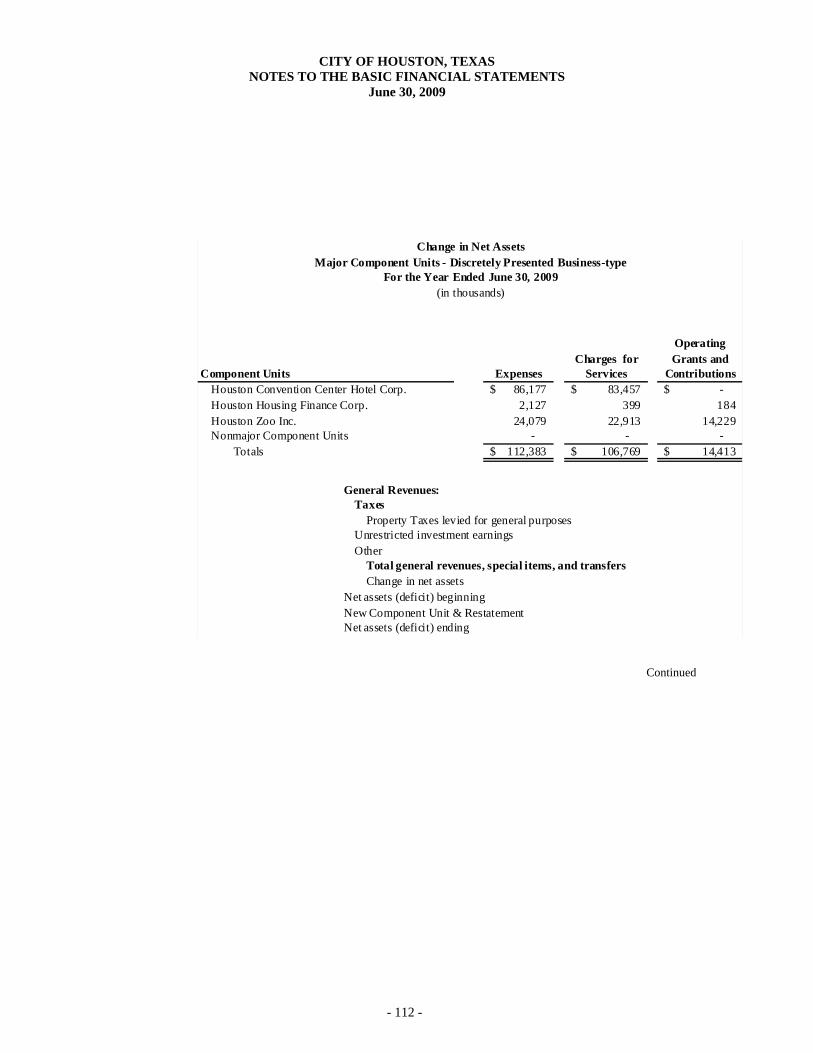
CITY OF HOUSTON, TEXAS NOTES TO THE BASIC FINANCIAL STATEMENTS
June 30, 2009
- 112 -
OperatingCharges for Grants and
Component Units Expenses Services ContributionsHouston Convention Center Hotel Corp. 86,177$ 83,457$ -$ Houston Housing Finance Corp. 2,127 399 184 Houston Zoo Inc. 24,079 22,913 14,229 Nonmajor Component Units - - -
Totals 112,383$ 106,769$ 14,413$
General Revenues:Taxes
Property Taxes levied for general purposesUnrestricted investment earningsOther
Total general revenues, special items, and transfersChange in net assets
Net assets (deficit) beginningNew Component Unit & RestatementNet assets (deficit) ending
Change in Net AssetsMajor Component Units - Discretely Presented Business-type
For the Year Ended June 30, 2009(in thousands)
Continued
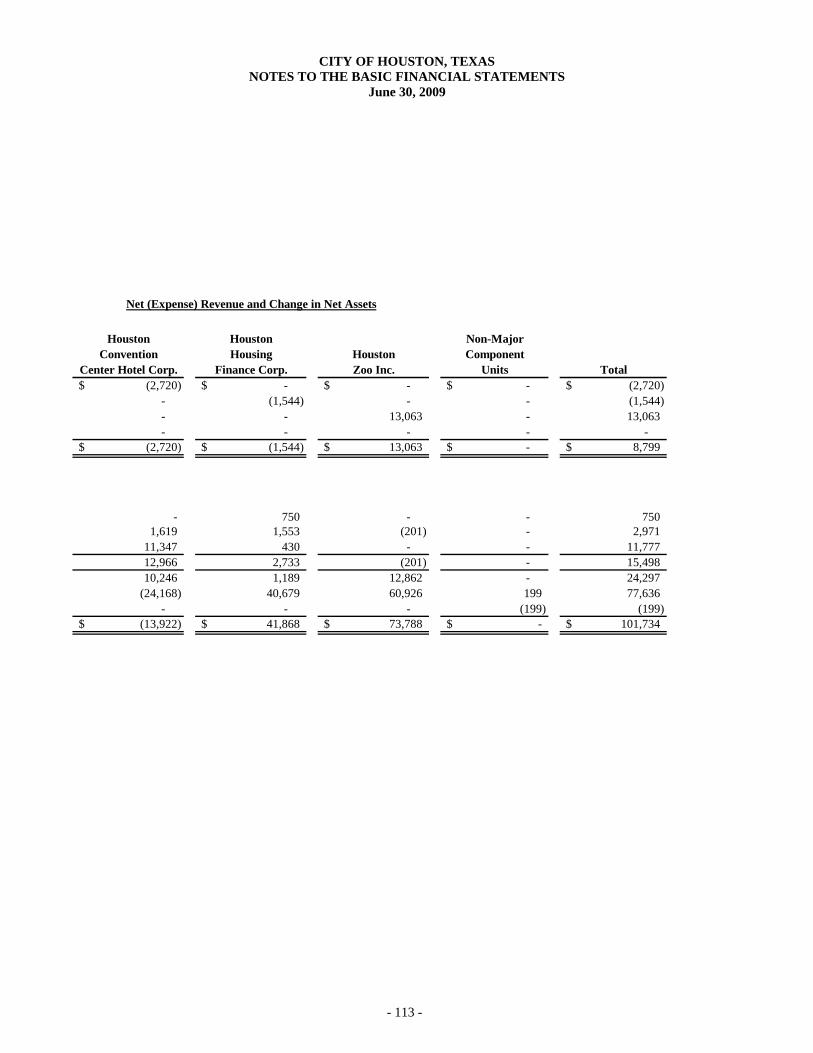
CITY OF HOUSTON, TEXAS NOTES TO THE BASIC FINANCIAL STATEMENTS
June 30, 2009
- 113 -
Net (Expense) Revenue and Change in Net Assets
Houston Houston Non-MajorConvention Housing Houston Component
Center Hotel Corp. Finance Corp. Zoo Inc. Units Total(2,720)$ -$ -$ -$ (2,720)$
- (1,544) - - (1,544) - - 13,063 - 13,063 - - - - -
(2,720)$ (1,544)$ 13,063$ -$ 8,799$
- 750 - - 750 1,619 1,553 (201) - 2,971
11,347 430 - - 11,777 12,966 2,733 (201) - 15,498 10,246 1,189 12,862 - 24,297
(24,168) 40,679 60,926 199 77,636 - - - (199) (199)
(13,922)$ 41,868$ 73,788$ -$ 101,734$
CITY OF HOUSTON, TEXAS NOTES TO THE BASIC FINANCIAL STATEMENTS
June 30, 2009
- 114 -
Note 17: Subsequent Events
A. Tax and Revenue Anticipation Notes
On July 1, 2009, the City closed the sale of $150,000,000 Tax and Revenue Anticipation Notes (“TRANS”), Series 2009. The proceeds of the TRANS will be used to pay working capital expenditures until tax revenues are received in early 2010. Stated interest rates were 2.0 to 2.5%, and the average yield was 0.4%. The notes will mature on June 30, 2010.
B. Airport System Senior Lien Revenue and Refunding Bonds On August 20, 2009 the City issued $449,660,000 of Airport System Senior Lien Revenue and Refunding Bonds, Series 2009A (“the Airport Bonds”) at rates ranging from 5.0 to 5.5%. The true interest cost was 5.42%. The bonds mature in varying amounts from 2015 to 2039. Proceeds were set aside to fund new construction, to fund a debt service reserve fund and capitalized interest fund, to pay costs of issuance, and to currently refund $87,000,000 of Senior Lien Commercial Paper Series A AMT. The Airport Bonds were issued to replace the variable rate commercial paper and lock in long term fixed rates rather than to achieve debt service savings. Cash flow and net present value savings cannot be computed because the refunded commercial paper paid interest at varying rates depending on current market conditions. The Series 2009A Bonds are the first series to be issued at the Senior Lien level. The Series 2009A Bonds are not subject to the alternative minimum tax (AMT) as they are issued under the AMT Holiday provision of the American Recovery and Reinvestment Act.
C. Public Improvement Refunding Bonds On September 15, 2009 the City issued $430,850,000 in Public Improvement Refunding Bonds, Series 2009A and $76,830,000 in Taxable Public Improvement Refunding Bonds, Series 2009B (“the PIBS 2009 Bonds”) at rates ranging from 2% to 6.238%. The bonds mature in varying amounts from 2010 through 2039. The true interest cost was 4.0%. Proceeds were used to refund $488,400,000 of General Obligation Commercial Paper Series E1, G, H1 and H2 (“the Commercial Paper Notes”); to refund $47,479,000 of Public Improvement Refunding Bonds, Series 1999A, 2001A and 2002, and Tax and Revenue Certificates of Obligation, Series 2000A (“the Refunded Bonds and Certificates”); and to pay costs of issuance. The cash savings for the Refunded Bonds and Certificates was $7,000, and the net present value savings was $1,742,000 or 3.7%. Because the refunded Commercial Paper Notes paid interest at varying rates depending on current market conditions, cash flow and net present value savings cannot be computed. The goal of this part of the transaction was to lock in long term fixed rates rather than to achieve debt service savings.
D. General Obligation Swap Termination
On August 25, 2009 the City terminated its $200,000,000 general obligation basis swap because Ambac Assurance Corporation, guarantor for the counterparty, had been downgraded below standards acceptable in the contract. The City received a termination payment of $2,404,000 which covered accrued contract payments of $3,557,000 due through 2010 offset by a negative fair market value of $1,153,000 at time of termination.
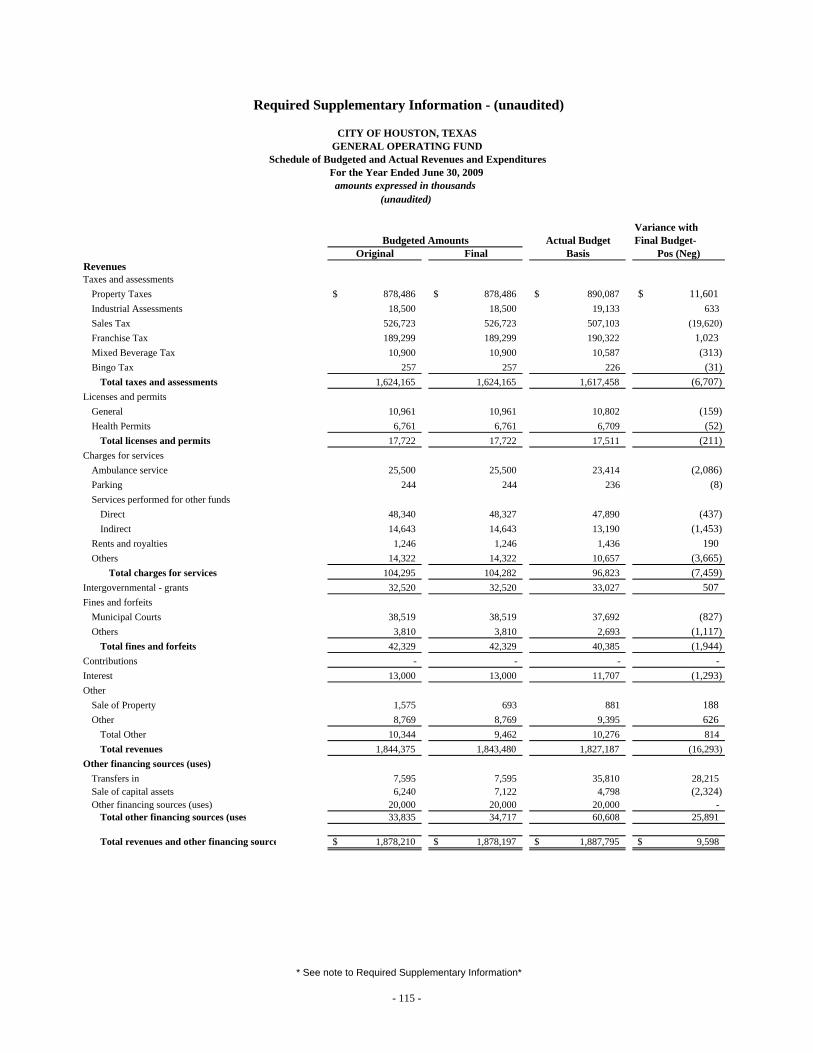
Variance withActual Budget Final Budget-
Original Final Basis Pos (Neg)RevenuesTaxes and assessments
Property Taxes 878,486$ 878,486$ 890,087$ 11,601$ Industrial Assessments 18,500 18,500 19,133 633 Sales Tax 526,723 526,723 507,103 (19,620) Franchise Tax 189,299 189,299 190,322 1,023 Mixed Beverage Tax 10,900 10,900 10,587 (313) Bingo Tax 257 257 226 (31)
Total taxes and assessments 1,624,165 1,624,165 1,617,458 (6,707) Licenses and permits
General 10,961 10,961 10,802 (159) Health Permits 6,761 6,761 6,709 (52)
Total licenses and permits 17,722 17,722 17,511 (211) Charges for services
Ambulance service 25,500 25,500 23,414 (2,086) Parking 244 244 236 (8) Services performed for other funds
Direct 48,340 48,327 47,890 (437) Indirect 14,643 14,643 13,190 (1,453)
Rents and royalties 1,246 1,246 1,436 190 Others 14,322 14,322 10,657 (3,665)
Total charges for services 104,295 104,282 96,823 (7,459) Intergovernmental - grants 32,520 32,520 33,027 507 Fines and forfeits
Municipal Courts 38,519 38,519 37,692 (827) Others 3,810 3,810 2,693 (1,117)
Total fines and forfeits 42,329 42,329 40,385 (1,944) Contributions - - - - Interest 13,000 13,000 11,707 (1,293) Other
Sale of Property 1,575 693 881 188 Other 8,769 8,769 9,395 626
Total Other 10,344 9,462 10,276 814 Total revenues 1,844,375 1,843,480 1,827,187 (16,293)
Other financing sources (uses)Transfers in 7,595 7,595 35,810 28,215 Sale of capital assets 6,240 7,122 4,798 (2,324) Other financing sources (uses) 20,000 20,000 20,000 -
Total other financing sources (uses 33,835 34,717 60,608 25,891
Total revenues and other financing source 1,878,210$ 1,878,197$ 1,887,795$ 9,598$
For the Year Ended June 30, 2009amounts expressed in thousands
Budgeted Amounts
Required Supplementary Information - (unaudited)
CITY OF HOUSTON, TEXASGENERAL OPERATING FUND
Schedule of Budgeted and Actual Revenues and Expenditures
(unaudited)
* See note to Required Supplementary Information*
- 115 -
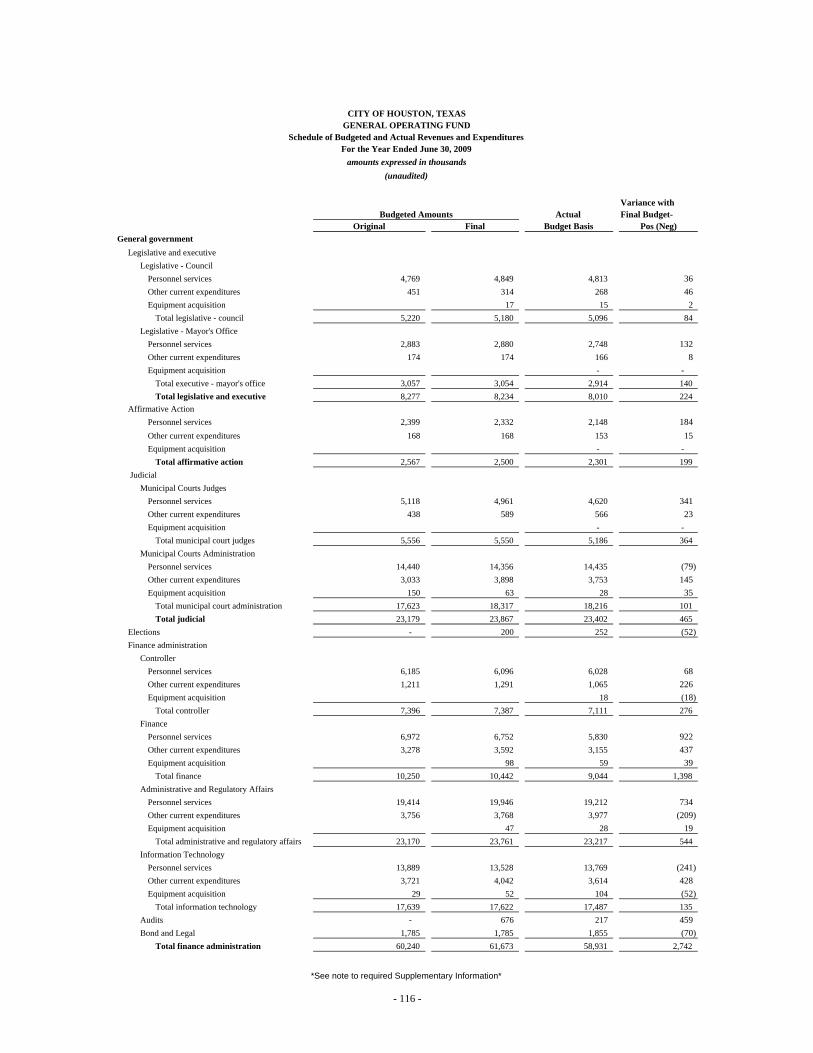
Variance withActual Final Budget-
Original Final Budget Basis Pos (Neg)
CITY OF HOUSTON, TEXASGENERAL OPERATING FUND
Schedule of Budgeted and Actual Revenues and Expenditures
(unaudited)
Budgeted Amounts
For the Year Ended June 30, 2009amounts expressed in thousands
General government Legislative and executive
Legislative - CouncilPersonnel services 4,769 4,849 4,813 36 Other current expenditures 451 314 268 46 Equipment acquisition 17 15 2
Total legislative - council 5,220 5,180 5,096 84 Legislative - Mayor's Office
Personnel services 2,883 2,880 2,748 132 Other current expenditures 174 174 166 8 Equipment acquisition - -
Total executive - mayor's office 3,057 3,054 2,914 140 Total legislative and executive 8,277 8,234 8,010 224
Affirmative ActionPersonnel services 2,399 2,332 2,148 184 Other current expenditures 168 168 153 15 Equipment acquisition - -
Total affirmative action 2,567 2,500 2,301 199 Judicial
Municipal Courts JudgesPersonnel services 5,118 4,961 4,620 341 Other current expenditures 438 589 566 23 Equipment acquisition - -
Total municipal court judges 5,556 5,550 5,186 364 Municipal Courts Administration
Personnel services 14,440 14,356 14,435 (79) Other current expenditures 3,033 3,898 3,753 145 Equipment acquisition 150 63 28 35
Total municipal court administration 17,623 18,317 18,216 101 Total judicial 23,179 23,867 23,402 465
Elections - 200 252 (52) Finance administration
ControllerPersonnel services 6,185 6,096 6,028 68 Other current expenditures 1,211 1,291 1,065 226 Equipment acquisition 18 (18)
Total controller 7,396 7,387 7,111 276 Finance
Personnel services 6,972 6,752 5,830 922 Other current expenditures 3,278 3,592 3,155 437 Equipment acquisition 98 59 39
Total finance 10,250 10,442 9,044 1,398 Administrative and Regulatory Affairs
Personnel services 19,414 19,946 19,212 734 Other current expenditures 3,756 3,768 3,977 (209) Equipment acquisition 47 28 19
Total administrative and regulatory affairs 23,170 23,761 23,217 544 Information Technology
Personnel services 13,889 13,528 13,769 (241) Other current expenditures 3,721 4,042 3,614 428 Equipment acquisition 29 52 104 (52)
Total information technology 17,639 17,622 17,487 135 Audits - 676 217 459 Bond and Legal 1,785 1,785 1,855 (70)
Total finance administration 60,240 61,673 58,931 2,742
*See note to required Supplementary Information*
- 116 -
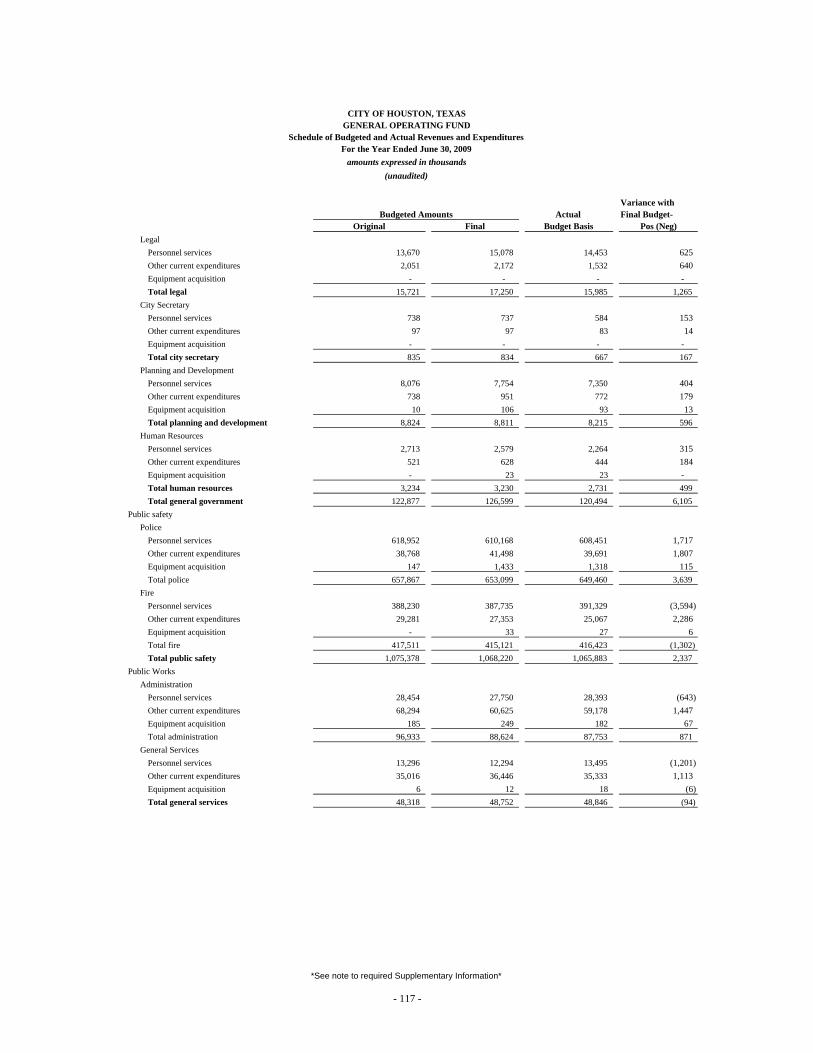
Variance withActual Final Budget-
Original Final Budget Basis Pos (Neg)
CITY OF HOUSTON, TEXASGENERAL OPERATING FUND
Schedule of Budgeted and Actual Revenues and Expenditures
(unaudited)
Budgeted Amounts
For the Year Ended June 30, 2009amounts expressed in thousands
LegalPersonnel services 13,670 15,078 14,453 625 Other current expenditures 2,051 2,172 1,532 640 Equipment acquisition - - - - Total legal 15,721 17,250 15,985 1,265
City SecretaryPersonnel services 738 737 584 153 Other current expenditures 97 97 83 14 Equipment acquisition - - - - Total city secretary 835 834 667 167
Planning and DevelopmentPersonnel services 8,076 7,754 7,350 404 Other current expenditures 738 951 772 179 Equipment acquisition 10 106 93 13 Total planning and development 8,824 8,811 8,215 596
Human ResourcesPersonnel services 2,713 2,579 2,264 315 Other current expenditures 521 628 444 184 Equipment acquisition - 23 23 - Total human resources 3,234 3,230 2,731 499 Total general government 122,877 126,599 120,494 6,105
Public safetyPolice
Personnel services 618,952 610,168 608,451 1,717 Other current expenditures 38,768 41,498 39,691 1,807 Equipment acquisition 147 1,433 1,318 115 Total police 657,867 653,099 649,460 3,639
FirePersonnel services 388,230 387,735 391,329 (3,594) Other current expenditures 29,281 27,353 25,067 2,286 Equipment acquisition - 33 27 6 Total fire 417,511 415,121 416,423 (1,302) Total public safety 1,075,378 1,068,220 1,065,883 2,337
Public WorksAdministration
Personnel services 28,454 27,750 28,393 (643) Other current expenditures 68,294 60,625 59,178 1,447 Equipment acquisition 185 249 182 67 Total administration 96,933 88,624 87,753 871
General ServicesPersonnel services 13,296 12,294 13,495 (1,201) Other current expenditures 35,016 36,446 35,333 1,113 Equipment acquisition 6 12 18 (6) Total general services 48,318 48,752 48,846 (94)
*See note to required Supplementary Information*
- 117 -
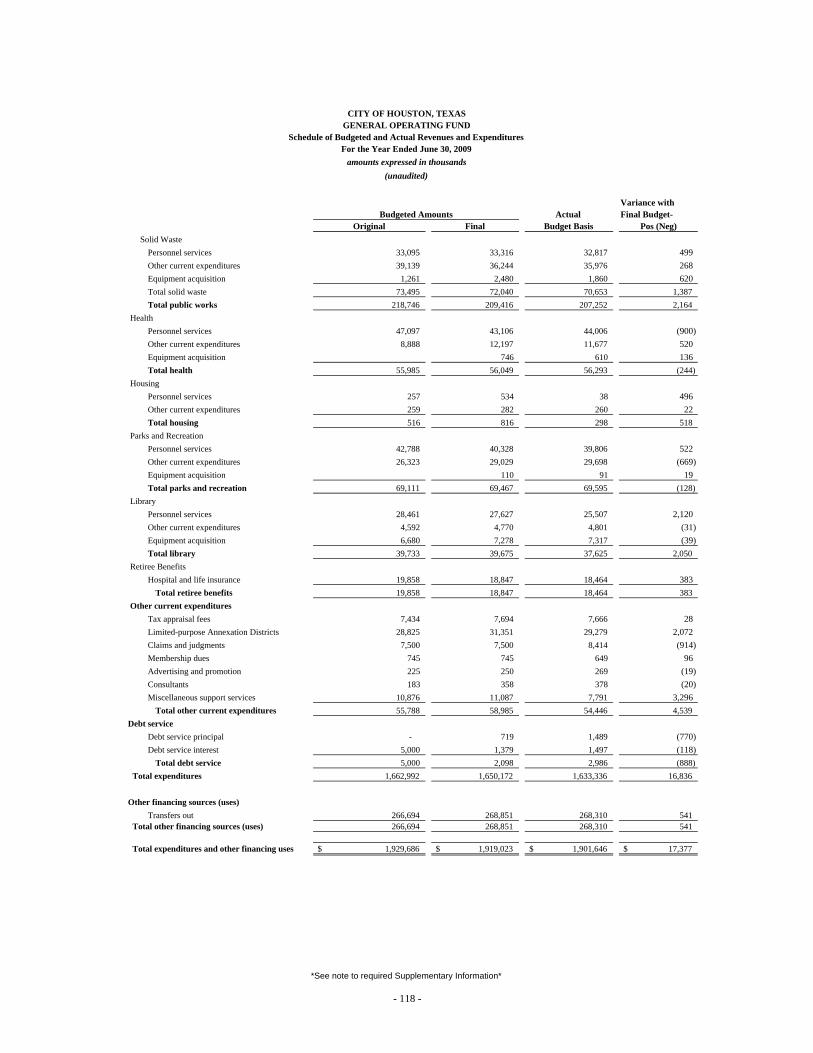
Variance withActual Final Budget-
Original Final Budget Basis Pos (Neg)
CITY OF HOUSTON, TEXASGENERAL OPERATING FUND
Schedule of Budgeted and Actual Revenues and Expenditures
(unaudited)
Budgeted Amounts
For the Year Ended June 30, 2009amounts expressed in thousands
Solid WastePersonnel services 33,095 33,316 32,817 499 Other current expenditures 39,139 36,244 35,976 268 Equipment acquisition 1,261 2,480 1,860 620 Total solid waste 73,495 72,040 70,653 1,387 Total public works 218,746 209,416 207,252 2,164
HealthPersonnel services 47,097 43,106 44,006 (900) Other current expenditures 8,888 12,197 11,677 520 Equipment acquisition 746 610 136 Total health 55,985 56,049 56,293 (244)
Housing Personnel services 257 534 38 496 Other current expenditures 259 282 260 22 Total housing 516 816 298 518
Parks and RecreationPersonnel services 42,788 40,328 39,806 522 Other current expenditures 26,323 29,029 29,698 (669) Equipment acquisition 110 91 19 Total parks and recreation 69,111 69,467 69,595 (128)
LibraryPersonnel services 28,461 27,627 25,507 2,120 Other current expenditures 4,592 4,770 4,801 (31) Equipment acquisition 6,680 7,278 7,317 (39) Total library 39,733 39,675 37,625 2,050
Retiree BenefitsHospital and life insurance 19,858 18,847 18,464 383
Total retiree benefits 19,858 18,847 18,464 383 Other current expenditures
Tax appraisal fees 7,434 7,694 7,666 28 Limited-purpose Annexation Districts 28,825 31,351 29,279 2,072 Claims and judgments 7,500 7,500 8,414 (914) Membership dues 745 745 649 96 Advertising and promotion 225 250 269 (19) Consultants 183 358 378 (20) Miscellaneous support services 10,876 11,087 7,791 3,296
Total other current expenditures 55,788 58,985 54,446 4,539 Debt service
Debt service principal - 719 1,489 (770) Debt service interest 5,000 1,379 1,497 (118)
Total debt service 5,000 2,098 2,986 (888) Total expenditures 1,662,992 1,650,172 1,633,336 16,836
Other financing sources (uses)Transfers out 266,694 268,851 268,310 541
Total other financing sources (uses) 266,694 268,851 268,310 541
Total expenditures and other financing uses 1,929,686$ 1,919,023$ 1,901,646$ 17,377$
*See note to required Supplementary Information*
- 118 -
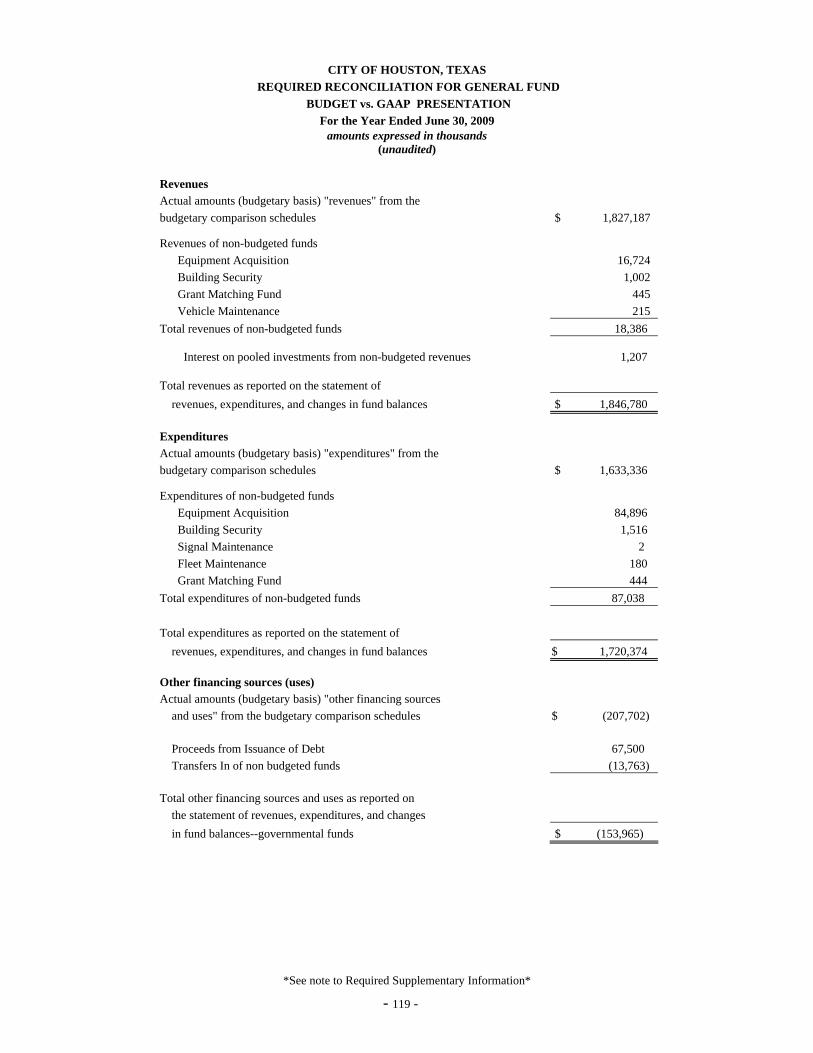
*See note to Required Supplementary Information*
- 119 -
CITY OF HOUSTON, TEXAS REQUIRED RECONCILIATION FOR GENERAL FUND
BUDGET vs. GAAP PRESENTATION For the Year Ended June 30, 2009
amounts expressed in thousands (unaudited)
Revenues Actual amounts (budgetary basis) "revenues" from the budgetary comparison schedules $ 1,827,187
Revenues of non-budgeted funds Equipment Acquisition 16,724 Building Security 1,002 Grant Matching Fund 445 Vehicle Maintenance 215 Total revenues of non-budgeted funds 18,386
Interest on pooled investments from non-budgeted revenues 1,207
Total revenues as reported on the statement of revenues, expenditures, and changes in fund balances $ 1,846,780
Expenditures Actual amounts (budgetary basis) "expenditures" from the budgetary comparison schedules $ 1,633,336
Expenditures of non-budgeted funds Equipment Acquisition 84,896 Building Security 1,516 Signal Maintenance 2 Fleet Maintenance 180 Grant Matching Fund 444 Total expenditures of non-budgeted funds 87,038 Total expenditures as reported on the statement of revenues, expenditures, and changes in fund balances $ 1,720,374 Other financing sources (uses) Actual amounts (budgetary basis) "other financing sources and uses" from the budgetary comparison schedules $ (207,702)
Proceeds from Issuance of Debt 67,500 Transfers In of non budgeted funds (13,763) Total other financing sources and uses as reported on the statement of revenues, expenditures, and changes in fund balances--governmental funds $ (153,965)
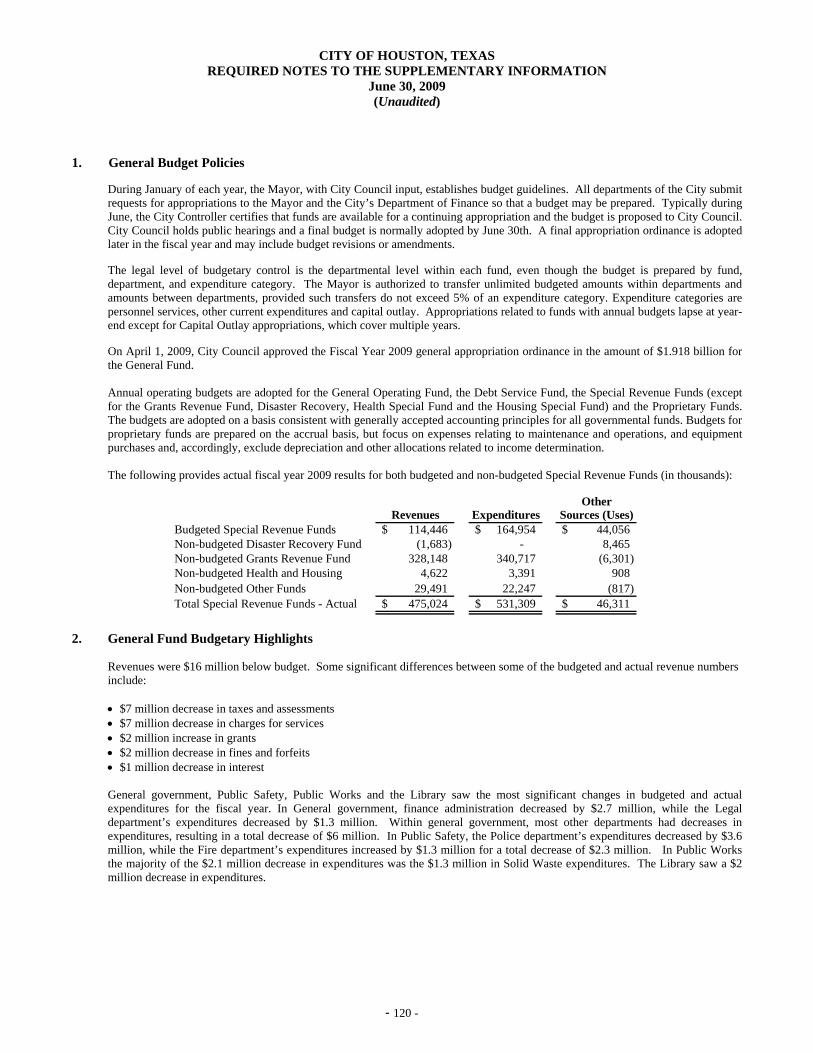
CITY OF HOUSTON, TEXAS REQUIRED NOTES TO THE SUPPLEMENTARY INFORMATION
June 30, 2009 (Unaudited)
- 120 -
1. General Budget Policies
During January of each year, the Mayor, with City Council input, establishes budget guidelines. All departments of the City submit requests for appropriations to the Mayor and the City’s Department of Finance so that a budget may be prepared. Typically during June, the City Controller certifies that funds are available for a continuing appropriation and the budget is proposed to City Council. City Council holds public hearings and a final budget is normally adopted by June 30th. A final appropriation ordinance is adopted later in the fiscal year and may include budget revisions or amendments. The legal level of budgetary control is the departmental level within each fund, even though the budget is prepared by fund, department, and expenditure category. The Mayor is authorized to transfer unlimited budgeted amounts within departments and amounts between departments, provided such transfers do not exceed 5% of an expenditure category. Expenditure categories are personnel services, other current expenditures and capital outlay. Appropriations related to funds with annual budgets lapse at year-end except for Capital Outlay appropriations, which cover multiple years. On April 1, 2009, City Council approved the Fiscal Year 2009 general appropriation ordinance in the amount of $1.918 billion for the General Fund. Annual operating budgets are adopted for the General Operating Fund, the Debt Service Fund, the Special Revenue Funds (except for the Grants Revenue Fund, Disaster Recovery, Health Special Fund and the Housing Special Fund) and the Proprietary Funds. The budgets are adopted on a basis consistent with generally accepted accounting principles for all governmental funds. Budgets for proprietary funds are prepared on the accrual basis, but focus on expenses relating to maintenance and operations, and equipment purchases and, accordingly, exclude depreciation and other allocations related to income determination. The following provides actual fiscal year 2009 results for both budgeted and non-budgeted Special Revenue Funds (in thousands):
Other
Revenues Expenditures Sources (Uses)Budgeted Special Revenue Funds 114,446$ 164,954$ 44,056$ Non-budgeted Disaster Recovery Fund (1,683) - 8,465 Non-budgeted Grants Revenue Fund 328,148 340,717 (6,301) Non-budgeted Health and Housing 4,622 3,391 908 Non-budgeted Other Funds 29,491 22,247 (817) Total Special Revenue Funds - Actual 475,024$ 531,309$ 46,311$
2. General Fund Budgetary Highlights
Revenues were $16 million below budget. Some significant differences between some of the budgeted and actual revenue numbers include: • $7 million decrease in taxes and assessments • $7 million decrease in charges for services • $2 million increase in grants • $2 million decrease in fines and forfeits • $1 million decrease in interest General government, Public Safety, Public Works and the Library saw the most significant changes in budgeted and actual expenditures for the fiscal year. In General government, finance administration decreased by $2.7 million, while the Legal department’s expenditures decreased by $1.3 million. Within general government, most other departments had decreases in expenditures, resulting in a total decrease of $6 million. In Public Safety, the Police department’s expenditures decreased by $3.6 million, while the Fire department’s expenditures increased by $1.3 million for a total decrease of $2.3 million. In Public Works the majority of the $2.1 million decrease in expenditures was the $1.3 million in Solid Waste expenditures. The Library saw a $2 million decrease in expenditures.
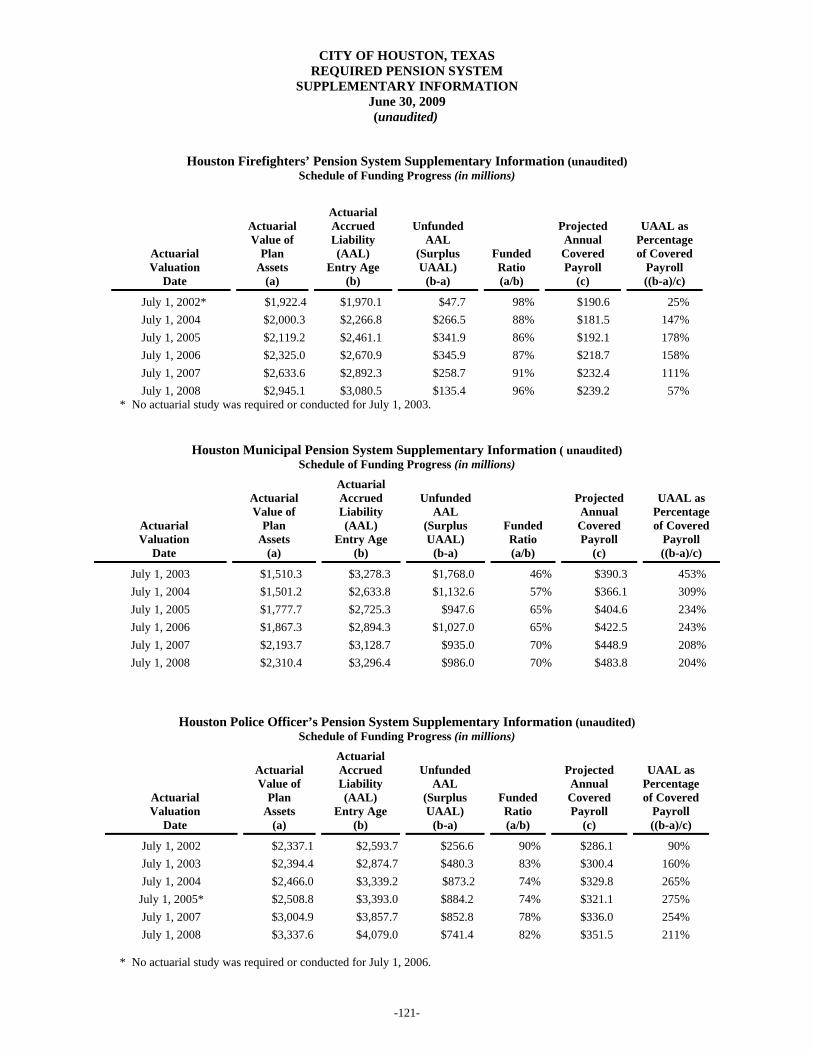
CITY OF HOUSTON, TEXAS REQUIRED PENSION SYSTEM
SUPPLEMENTARY INFORMATION June 30, 2009
(unaudited)
-121-
Houston Firefighters’ Pension System Supplementary Information (unaudited) Schedule of Funding Progress (in millions)
Actuarial Valuation
Date
Actuarial Value of
Plan Assets
(a)
Actuarial Accrued Liability (AAL)
Entry Age (b)
Unfunded
AAL (Surplus UAAL)
(b-a)
FundedRatio (a/b)
Projected Annual Covered Payroll
(c)
UAAL as
Percentage of Covered
Payroll ((b-a)/c)
July 1, 2002* $1,922.4 $1,970.1 $47.7 98% $190.6 25% July 1, 2004 $2,000.3 $2,266.8 $266.5 88% $181.5 147% July 1, 2005 $2,119.2 $2,461.1 $341.9 86% $192.1 178% July 1, 2006 $2,325.0 $2,670.9 $345.9 87% $218.7 158% July 1, 2007 $2,633.6 $2,892.3 $258.7 91% $232.4 111% July 1, 2008 $2,945.1 $3,080.5 $135.4 96% $239.2 57%
* No actuarial study was required or conducted for July 1, 2003.
Houston Municipal Pension System Supplementary Information ( unaudited)
Schedule of Funding Progress (in millions)
Actuarial Valuation
Date
Actuarial Value of
Plan Assets
(a)
Actuarial Accrued Liability (AAL)
Entry Age (b)
Unfunded
AAL (Surplus UAAL)
(b-a)
Funded Ratio (a/b)
Projected Annual Covered Payroll
(c)
UAAL as
Percentage of Covered
Payroll ((b-a)/c)
July 1, 2003 $1,510.3 $3,278.3 $1,768.0 46% $390.3 453% July 1, 2004 $1,501.2 $2,633.8 $1,132.6 57% $366.1 309% July 1, 2005 $1,777.7 $2,725.3 $947.6 65% $404.6 234% July 1, 2006 $1,867.3 $2,894.3 $1,027.0 65% $422.5 243% July 1, 2007 $2,193.7 $3,128.7 $935.0 70% $448.9 208% July 1, 2008 $2,310.4 $3,296.4 $986.0 70% $483.8 204%
Houston Police Officer’s Pension System Supplementary Information (unaudited) Schedule of Funding Progress (in millions)
Actuarial Valuation
Date
Actuarial Value of
Plan Assets
(a)
Actuarial Accrued Liability (AAL)
Entry Age (b)
Unfunded
AAL (Surplus UAAL)
(b-a)
FundedRatio (a/b)
Projected Annual Covered Payroll
(c)
UAAL as
Percentage of Covered
Payroll ((b-a)/c)
July 1, 2002 $2,337.1 $2,593.7 $256.6 90% $286.1 90% July 1, 2003 $2,394.4 $2,874.7 $480.3 83% $300.4 160% July 1, 2004 $2,466.0 $3,339.2 $873.2 74% $329.8 265% July 1, 2005* $2,508.8 $3,393.0 $884.2 74% $321.1 275% July 1, 2007 $3,004.9 $3,857.7 $852.8 78% $336.0 254% July 1, 2008 $3,337.6 $4,079.0 $741.4 82% $351.5 211%
* No actuarial study was required or conducted for July 1, 2006.
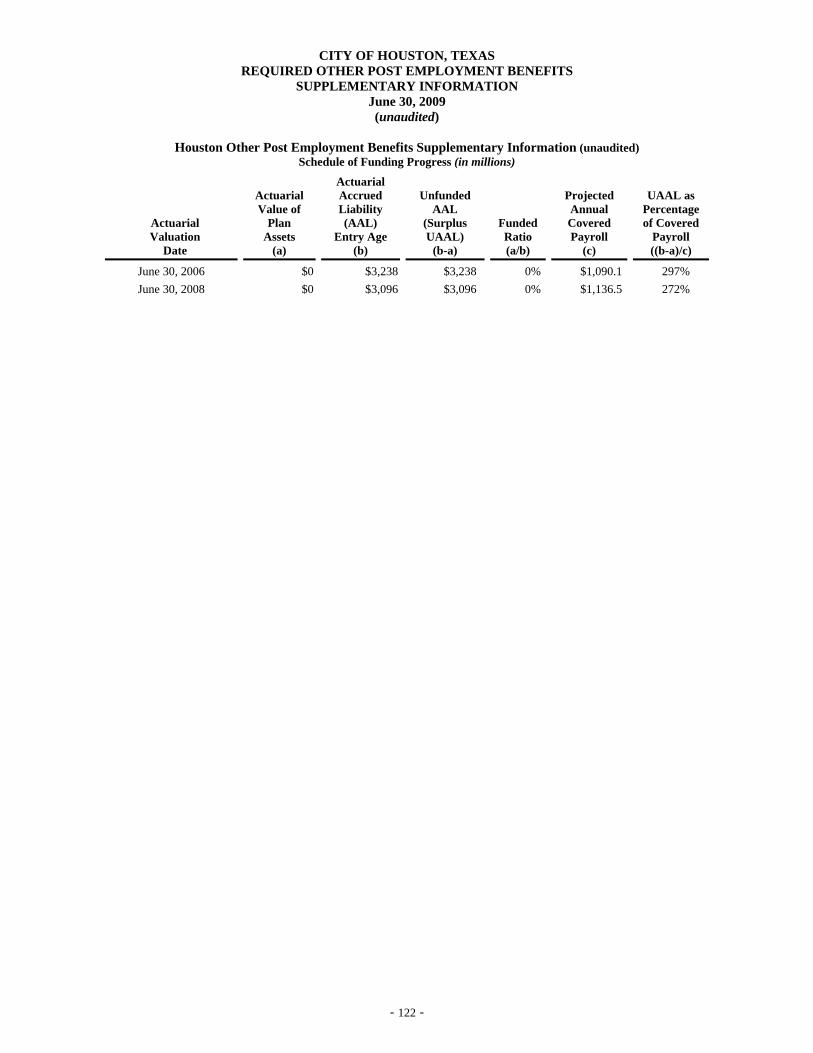
CITY OF HOUSTON, TEXAS REQUIRED OTHER POST EMPLOYMENT BENEFITS
SUPPLEMENTARY INFORMATION June 30, 2009 (unaudited)
- 122 -
Houston Other Post Employment Benefits Supplementary Information (unaudited)
Schedule of Funding Progress (in millions)
Actuarial Valuation
Date
Actuarial Value of
Plan Assets
(a)
Actuarial Accrued Liability (AAL)
Entry Age (b)
Unfunded
AAL (Surplus UAAL)
(b-a)
FundedRatio (a/b)
Projected Annual Covered Payroll
(c)
UAAL as
Percentage of Covered
Payroll ((b-a)/c)
June 30, 2006 $0 $3,238 $3,238 0% $1,090.1 297% June 30, 2008 $0 $3,096 $3,096 0% $1,136.5 272%

GOVE
RNM
ENTA
L FU
NDS

- 123 -
Governmental Funds General Fund - The General Fund is used to account for sources and uses of financial resources applicable to the general government operation of the City. All general operating revenues and expenditures that are not restricted and, therefore, accounted for in another fund, are recorded in the General Fund.
Debt Service Fund - The Debt Service Fund is used to account for the payment of interest and principal on all general long-term debt other than debt issued for and serviced by Enterprise Funds.
Capital Projects Fund - The Capital Projects Fund accounts for all resources used for the acquisition and/or construction of capital facilities by the City, except those financed by Enterprise Funds.
Grants Fund - The Grants Fund is used to account for grant resources received from various local, state and national agencies and organizations. The use of these resources is restricted to a particular function of the city by the grantor.
Nonmajor Funds - Nonmajor Funds did not meet the established criteria for major fund status. They are used to account for the proceeds of specific revenue sources (other than capital projects) that are restricted to expenditures for special purposes. All Nonmajor Funds have been presented; however only certain sub-funds have legally adopted budgets. Nonmajor funds are:
• Public Safety Special Fund o Budgeted: Asset Forfeiture, Auto Dealers, Police Special Services and Houston
Emergency Center, Municipal Courts Technology Fee and Child Safety o Not budgeted: Helmets for Bicycle Safety
• Public Works Special Fund o Budgeted: Building Inspection, Sign Administration, and Stormwater o Not budgeted: Sign Abatement and Street Maintenance and Traffic Control
• Health and Housing Special Fund o Not budgeted: Health Special, Housing Special, Homeless Families Program and
Housing Replacement Insurance, Housing Non-Grant Venture and HJTPC Self Insurance
• Parks & Recreation Special Fund o Budgeted: Parks Special o Not budgeted: MacGregor Parks Endowment
• Other Special Revenue Fund o Budgeted: Cable Television, Houston Transtar and Supplemental Environmental
Project o Not budgeted: Disaster Recovery, Compaq Center, MNC Memorial City Way,
W.A.T.E.R., Special City Deposit, John Battaglia Trust, Inc. Fund, AAA Contingency, Houston Foundation and March of Dimes
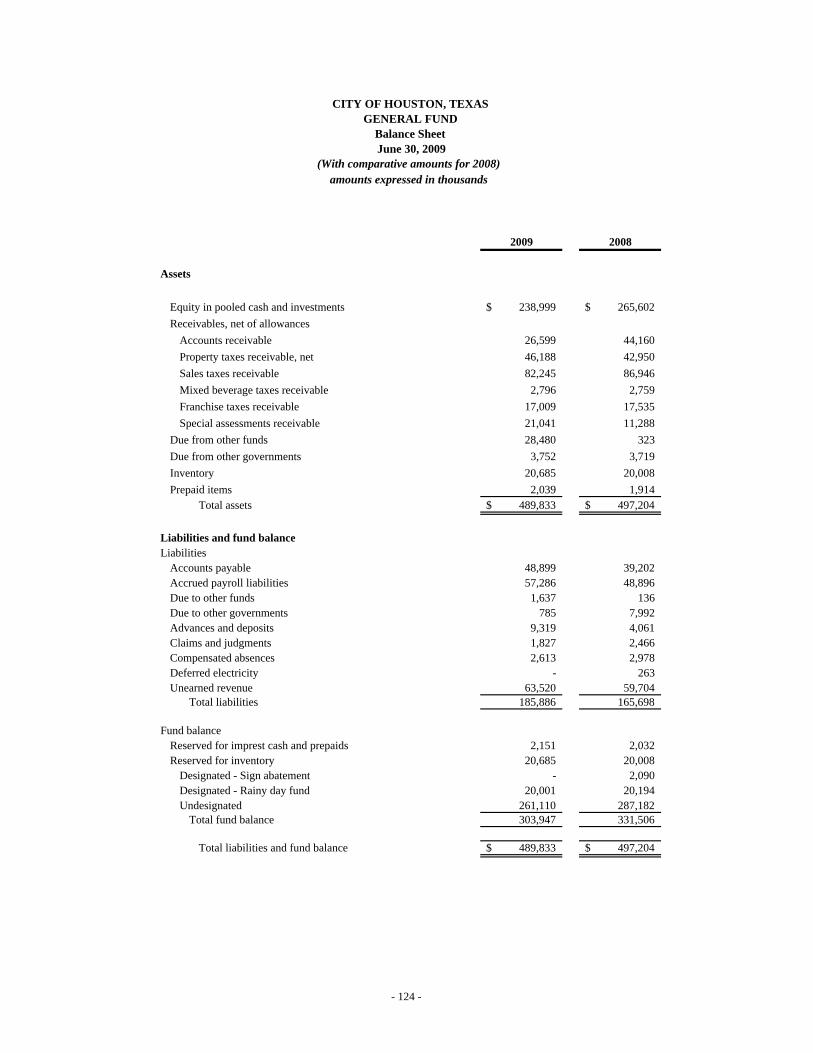
2009 2008
Assets
Equity in pooled cash and investments 238,999$ 265,602$ Receivables, net of allowances
Accounts receivable 26,599 44,160 Property taxes receivable, net 46,188 42,950 Sales taxes receivable 82,245 86,946 Mixed beverage taxes receivable 2,796 2,759 Franchise taxes receivable 17,009 17,535 Special assessments receivable 21,041 11,288
Due from other funds 28,480 323 Due from other governments 3,752 3,719 Inventory 20,685 20,008 Prepaid items 2,039 1,914
Total assets 489,833$ 497,204$
Liabilities and fund balanceLiabilities
Accounts payable 48,899 39,202 Accrued payroll liabilities 57,286 48,896 Due to other funds 1,637 136 Due to other governments 785 7,992 Advances and deposits 9,319 4,061 Claims and judgments 1,827 2,466 Compensated absences 2,613 2,978 Deferred electricity - 263 Unearned revenue 63,520 59,704
Total liabilities 185,886 165,698
Fund balanceReserved for imprest cash and prepaids 2,151 2,032 Reserved for inventory 20,685 20,008
Designated - Sign abatement - 2,090 Designated - Rainy day fund 20,001 20,194 Undesignated 261,110 287,182
Total fund balance 303,947 331,506
Total liabilities and fund balance 489,833$ 497,204$
(With comparative amounts for 2008)
CITY OF HOUSTON, TEXASGENERAL FUND
June 30, 2009Balance Sheet
amounts expressed in thousands
- 124 -
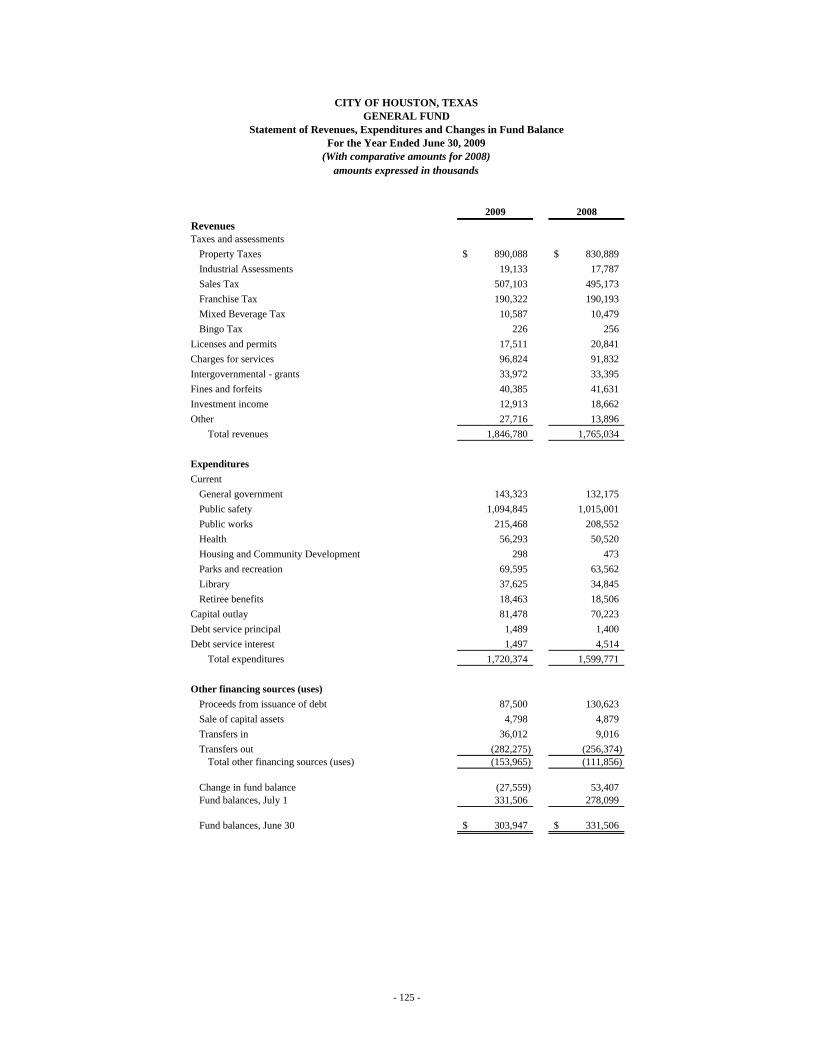
2009 2008RevenuesTaxes and assessments
Property Taxes 890,088$ 830,889$ Industrial Assessments 19,133 17,787 Sales Tax 507,103 495,173 Franchise Tax 190,322 190,193 Mixed Beverage Tax 10,587 10,479 Bingo Tax 226 256
Licenses and permits 17,511 20,841 Charges for services 96,824 91,832 Intergovernmental - grants 33,972 33,395 Fines and forfeits 40,385 41,631 Investment income 12,913 18,662 Other 27,716 13,896
Total revenues 1,846,780 1,765,034
ExpendituresCurrent
General government 143,323 132,175 Public safety 1,094,845 1,015,001 Public works 215,468 208,552 Health 56,293 50,520 Housing and Community Development 298 473 Parks and recreation 69,595 63,562 Library 37,625 34,845 Retiree benefits 18,463 18,506
Capital outlay 81,478 70,223 Debt service principal 1,489 1,400 Debt service interest 1,497 4,514
Total expenditures 1,720,374 1,599,771
Other financing sources (uses)Proceeds from issuance of debt 87,500 130,623 Sale of capital assets 4,798 4,879 Transfers in 36,012 9,016 Transfers out (282,275) (256,374)
Total other financing sources (uses) (153,965) (111,856)
Change in fund balance (27,559) 53,407 Fund balances, July 1 331,506 278,099
Fund balances, June 30 303,947$ 331,506$
CITY OF HOUSTON, TEXASGENERAL FUND
For the Year Ended June 30, 2009(With comparative amounts for 2008)
Statement of Revenues, Expenditures and Changes in Fund Balance
amounts expressed in thousands
- 125 -

2009 2008Assets
Equity in pooled cash and investments 161,903$ 131,891$ Due from component units 5,310 5,779 Due from other funds 19 -
Total assets 167,232$ 137,670$
Liabilities and fund balanceLiabilities
Accounts payable 508$ 414$ Unearned revenue 5,310 5,779
Total liabilities 5,818 6,193
Fund balanceReserved for debt service 161,414 131,477
Total fund balance 161,414 131,477
Total liabilities and fund balance 167,232$ 137,670$
amounts expressed in thousands(With comparative amounts for 2008)
CITY OF HOUSTON, TEXASDEBT SERVICE FUND
June 30, 2009Balance Sheet
- 126 -
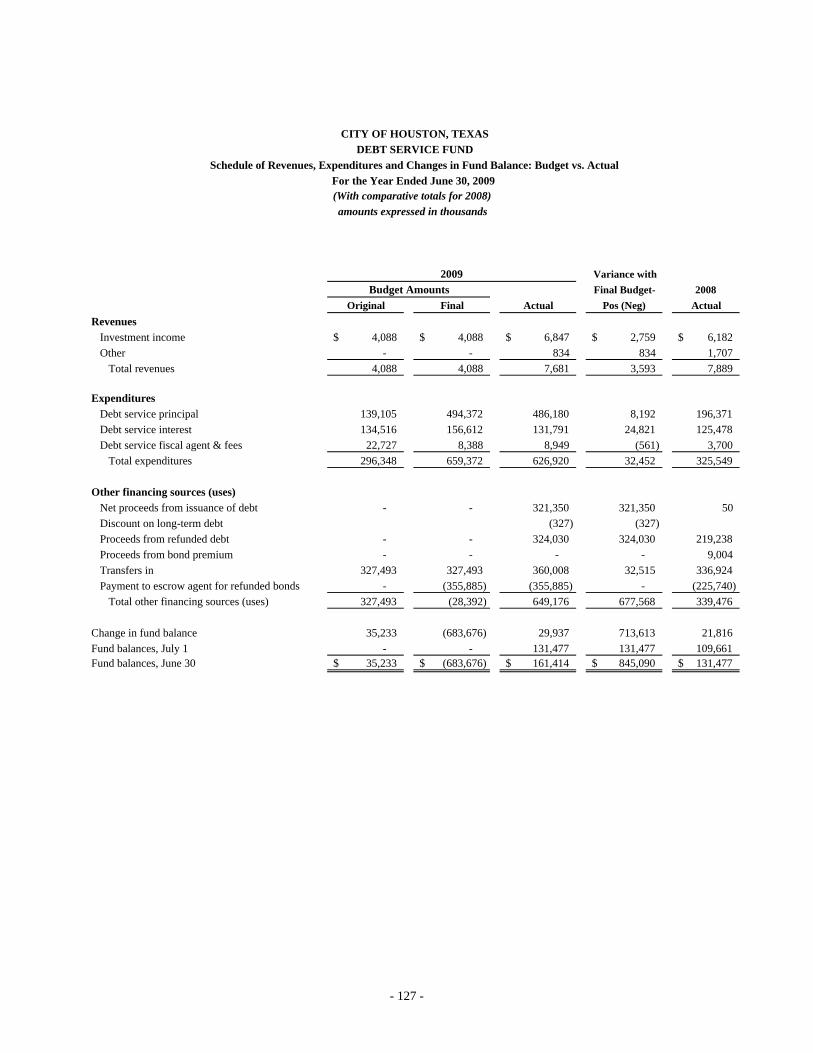
Variance withFinal Budget- 2008
Original Final Actual Pos (Neg) ActualRevenues
Investment income 4,088$ 4,088$ 6,847$ 2,759$ 6,182$ Other - - 834 834 1,707
Total revenues 4,088 4,088 7,681 3,593 7,889
ExpendituresDebt service principal 139,105 494,372 486,180 8,192 196,371 Debt service interest 134,516 156,612 131,791 24,821 125,478 Debt service fiscal agent & fees 22,727 8,388 8,949 (561) 3,700
Total expenditures 296,348 659,372 626,920 32,452 325,549
Other financing sources (uses)Net proceeds from issuance of debt - - 321,350 321,350 50 Discount on long-term debt (327) (327) Proceeds from refunded debt - - 324,030 324,030 219,238 Proceeds from bond premium - - - - 9,004 Transfers in 327,493 327,493 360,008 32,515 336,924 Payment to escrow agent for refunded bonds - (355,885) (355,885) - (225,740)
Total other financing sources (uses) 327,493 (28,392) 649,176 677,568 339,476
Change in fund balance 35,233 (683,676) 29,937 713,613 21,816 Fund balances, July 1 - - 131,477 131,477 109,661 Fund balances, June 30 35,233$ (683,676)$ 161,414$ 845,090$ 131,477$
Budget Amounts
DEBT SERVICE FUNDCITY OF HOUSTON, TEXAS
For the Year Ended June 30, 2009(With comparative totals for 2008)
Schedule of Revenues, Expenditures and Changes in Fund Balance: Budget vs. Actual
amounts expressed in thousands
2009
- 127 -
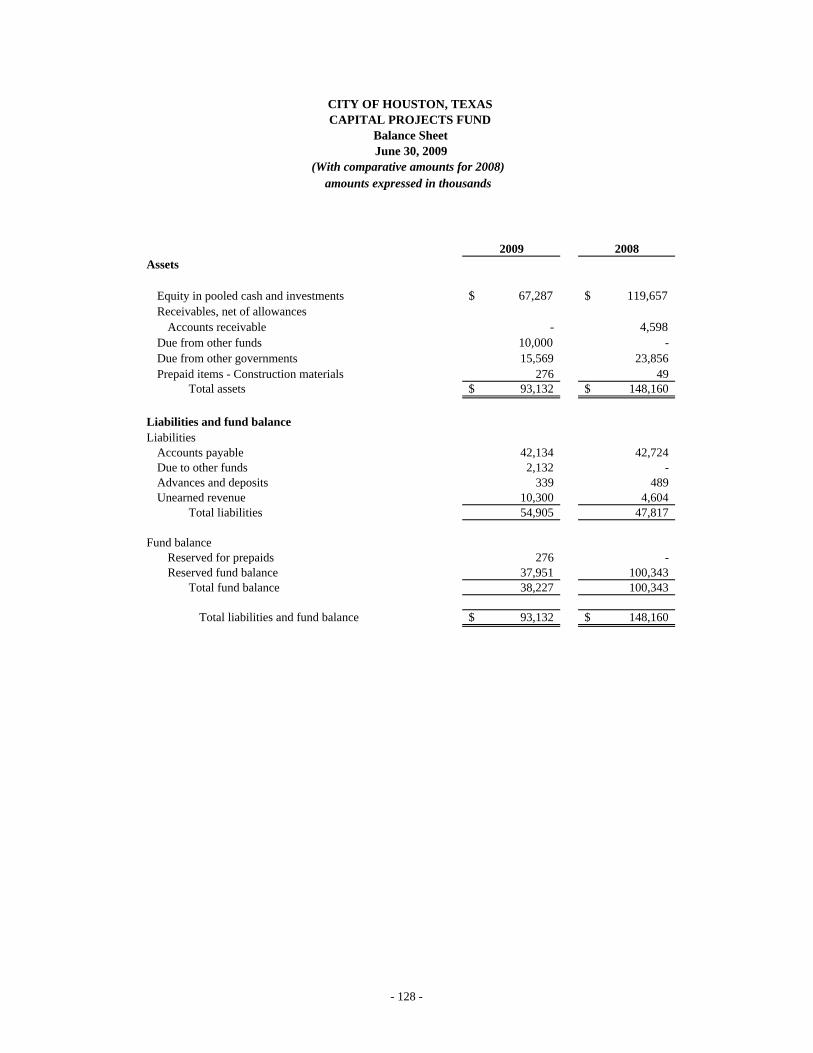
2009 2008Assets
Equity in pooled cash and investments 67,287$ 119,657$ Receivables, net of allowances
Accounts receivable - 4,598 Due from other funds 10,000 - Due from other governments 15,569 23,856 Prepaid items - Construction materials 276 49
Total assets 93,132$ 148,160$
Liabilities and fund balanceLiabilities
Accounts payable 42,134 42,724 Due to other funds 2,132 - Advances and deposits 339 489 Unearned revenue 10,300 4,604
Total liabilities 54,905 47,817
Fund balanceReserved for prepaids 276 - Reserved fund balance 37,951 100,343
Total fund balance 38,227 100,343
Total liabilities and fund balance 93,132$ 148,160$
amounts expressed in thousands(With comparative amounts for 2008)
CITY OF HOUSTON, TEXASCAPITAL PROJECTS FUND
June 30, 2009Balance Sheet
- 128 -

2009 2008Revenues
Intergovernmental - grants 44,560$ 70,562$ Investment income 2,990 5,044 Other 7,319 7,444
Total revenues 54,869 83,050
ExpendituresCurrent
Capital outlay 262,843 262,432 Total expenditures 262,843 262,432
Other financing sources (uses)Proceeds from issuance of debt 217,355 256,378 Sale of capital assets - 3,276 Transfers in 4,901 439 Transfers out (76,398) (62,264)
Total other financing sources (uses) 145,858 197,829
Change in fund balance (62,116) 18,447 Fund balances, July 1 100,343 81,896
Fund balances, June 30 38,227$ 100,343$
amounts expressed in thousands
CITY OF HOUSTON, TEXASCAPITAL PROJECTS FUND
For the Year Ended June 30, 2009(With comparative totals for 2008)
Statement of Revenues, Expenditures and Changes in Fund Balance
- 129 -
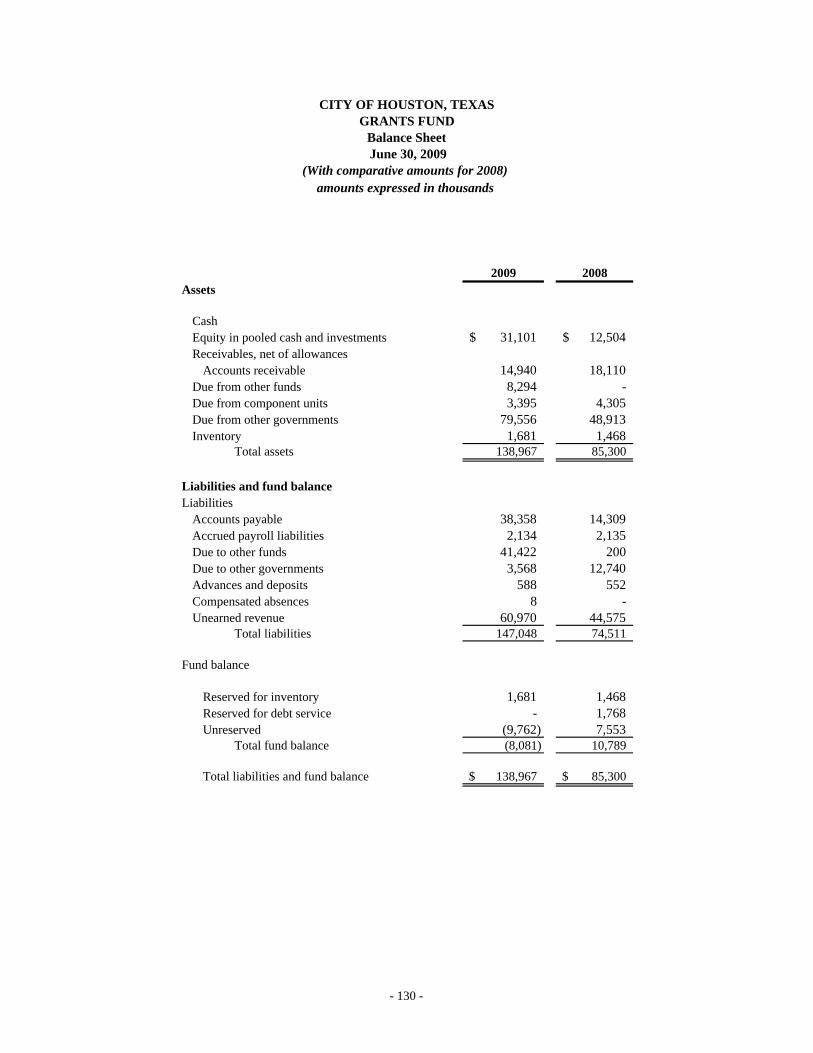
2009 2008Assets
CashEquity in pooled cash and investments 31,101$ 12,504$ Receivables, net of allowances
Accounts receivable 14,940 18,110 Due from other funds 8,294 - Due from component units 3,395 4,305 Due from other governments 79,556 48,913 Inventory 1,681 1,468
Total assets 138,967 85,300
Liabilities and fund balanceLiabilities
Accounts payable 38,358 14,309 Accrued payroll liabilities 2,134 2,135 Due to other funds 41,422 200 Due to other governments 3,568 12,740 Advances and deposits 588 552 Compensated absences 8 - Unearned revenue 60,970 44,575
Total liabilities 147,048 74,511
Fund balance
Reserved for inventory 1,681 1,468 Reserved for debt service - 1,768 Unreserved (9,762) 7,553
Total fund balance (8,081) 10,789
Total liabilities and fund balance 138,967$ 85,300$
amounts expressed in thousands(With comparative amounts for 2008)
CITY OF HOUSTON, TEXASGRANTS FUND
Balance Sheet June 30, 2009
- 130 -

2009 2008Revenues
Intergovernmental - grants 326,128$ 181,446$ Contributions 737 - Investment income 1,283 788
Total revenues 328,148 182,234
ExpendituresCurrent
General government 12,515 846 Public safety 63,026 38,647 Public works 116,724 236 Health 64,588 57,066 Housing and Community Development 78,295 76,951 Parks and recreation 3,946 6,470 Library 1,623 1,710 Total expenditures 340,717 181,926
Other financing sources (uses)Sale of capital assets - 417 Transfers out (6,301) (561)
Total other financing sources (uses) (6,301) (144)
Change in fund balance (18,870) 164 Fund balances, July 1 10,789 10,625
Fund balances, June 30 (8,081)$ 10,789$
(With comparative amounts for 2008)amounts expressed in thousands
CITY OF HOUSTON, TEXASGRANTS FUND
Statement of Revenues, Expenditures and Changes in Fund BalanceFor the Year Ended June 30, 2009
- 131 -

Public PublicSafety WorksSpecial SpecialFund Fund
AssetsEquity in pooled cash and investments 26,715$ 35,693$ Receivables, net of allowances
Accounts receivable 13,938 90 Due from other funds 385 366 Due from other governments 2,801 600 Inventory - 7
Total assets 43,839$ 36,756$
Liabilities and fund balanceLiabilities
Accounts payable 3,559$ 1,334$ Accrued payroll liabilities 1,189 2,152 Due to other funds 1,932 101 Due to other governments 4,125 - Advances and deposits 891 802 Deferred electricity - Compensated absences 2 14 Other liabilities - - Unearned revenue 9,633 600
Total liabilities 21,331 5,003
Fund balance
Reserved for inventory 7 Undesignated 22,508 31,746
Total fund balance 22,508 31,753
Total liabilities and fund balance 43,839$ 36,756$
(Continued)
amounts expressed in thousands
Nonmajor Funds
(With comparative totals for 2008)
CITY OF HOUSTON, TEXASNONMAJOR GOVERNMENTAL FUNDS
Combining Balance Sheet June 30, 2009
- 132 -

Health & Parks & OtherHousing Recreation SpecialSpecial Special RevenueFund Fund Fund 2009 2008
6,971$ 5,266$ 50,024$ 124,669$ 128,474$
- 447 1,246 15,721 12,657 2 15 4 772 - - - 219 3,620 3,768 - 5 - 12 18
6,973$ 5,733$ 51,493$ 144,794$ 144,917$
729$ 574$ 2,235$ 8,431$ 6,098$ 49 168 63 3,621 3,309
5 - 294 2,332 - - 13 1,944 6,082 4,120 - 51 155 1,899 2,303
- - 4 - - - 16 12 - - 103 103 113 - 147 464 10,844 9,458
783 953 5,258 33,328 25,417
- 5 - 12 18 6,190 4,775 46,235 111,454 119,482
6,190 4,780 46,235 111,466 119,500
6,973$ 5,733$ 51,493$ 144,794$ 144,917$
Nonmajor Funds
- 133 -
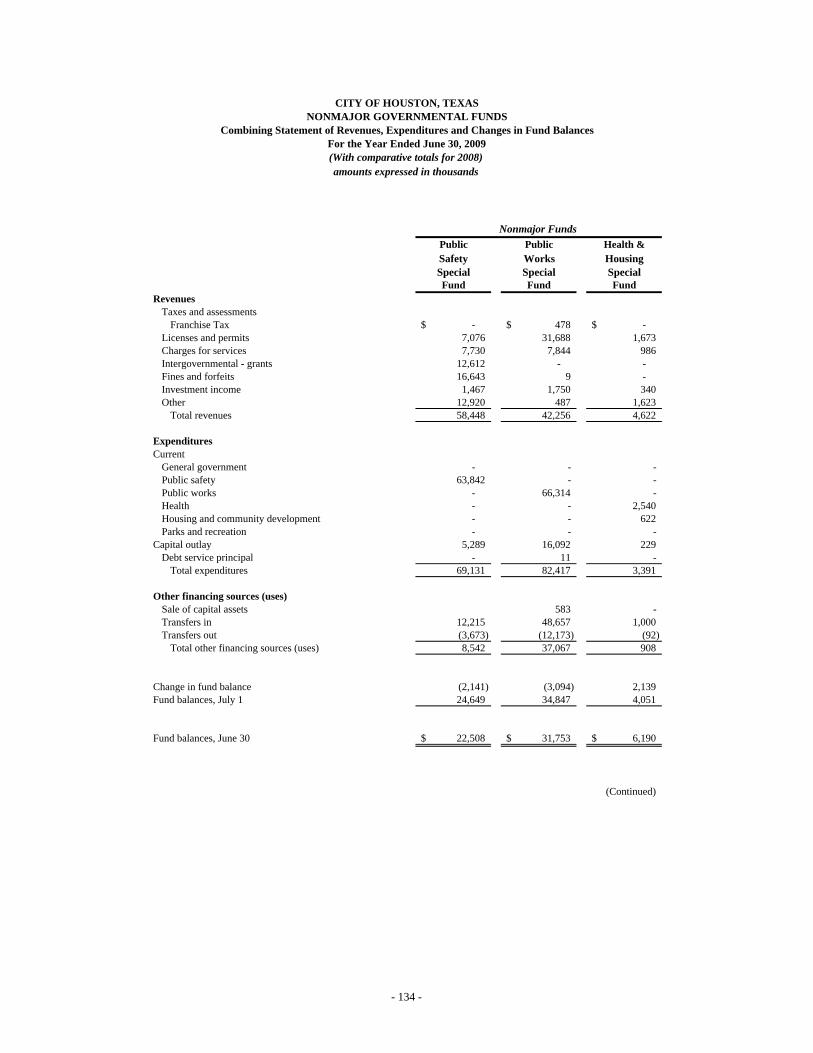
Public Public Health &Safety Works HousingSpecial Special SpecialFund Fund Fund
RevenuesTaxes and assessments
Franchise Tax -$ 478$ -$ Licenses and permits 7,076 31,688 1,673 Charges for services 7,730 7,844 986 Intergovernmental - grants 12,612 - - Fines and forfeits 16,643 9 - Investment income 1,467 1,750 340 Other 12,920 487 1,623
Total revenues 58,448 42,256 4,622
ExpendituresCurrent
General government - - - Public safety 63,842 - - Public works - 66,314 - Health - - 2,540 Housing and community development - - 622 Parks and recreation - - -
Capital outlay 5,289 16,092 229 Debt service principal - 11 -
Total expenditures 69,131 82,417 3,391
Other financing sources (uses)Sale of capital assets 583 - Transfers in 12,215 48,657 1,000 Transfers out (3,673) (12,173) (92)
Total other financing sources (uses) 8,542 37,067 908
Change in fund balance (2,141) (3,094) 2,139 Fund balances, July 1 24,649 34,847 4,051
Fund balances, June 30 22,508$ 31,753$ 6,190$
(Continued)
(With comparative totals for 2008)amounts expressed in thousands
Nonmajor Funds
CITY OF HOUSTON, TEXASNONMAJOR GOVERNMENTAL FUNDS
Combining Statement of Revenues, Expenditures and Changes in Fund BalancesFor the Year Ended June 30, 2009
- 134 -

Parks & OtherRecreation Special
Special RevenueFund Fund 2009 2008
-$ -$ 478$ 325$ 178 - 40,615 41,291
7,383 651 24,594 20,722 - 18,443 31,055 15,314 - - 16,652 15,370 238 2,259 6,054 5,840 257 11,558 26,845 32,488
8,056 32,911 146,293 131,350
- 22,226 22,226 11,316 - - 63,842 53,874 - - 66,314 72,645 - - 2,540 1,244 - - 622 278
6,897 - 6,897 7,322 359 6,182 28,151 -
- 10 21 19 7,256 28,418 190,613 146,698
583 185 - - 61,872 50,281
(1) (10,230) (26,169) (9,674) (1) (10,230) 36,286 40,792
799 (5,737) (8,034) 25,444 3,981 51,972 119,500 94,056
4,780$ 46,235$ 111,466$ 119,500$
Nonmajor Funds
- 135 -

Variance withFinal Budget- 2008
Original Final Actual Pos (Neg) ActualRevenues
Confiscations 6,320$ 6,320$ 6,465$ 145$ 5,420$ Investment income 210 210 251 41 346 Other - - - - 356
Total revenues 6,530 6,530 6,716 186 6,122
ExpendituresCurrentPublic safety 7,103 6,744 6,398 346 6,562 Capital outlay 400 759 428 331 -
Total expenditures 7,503 7,503 6,826 677 6,562
Other financing sources (uses)Transfers out (1,297) (1,297) (1,297) - (1,297)
Total other financing sources (uses) (1,297) (1,297) (1,297) - (1,297)
Change in fund balance (2,270) (2,270) (1,407) 863 (1,737) Fund balances, July 1 4,158 4,158 4,158 - 5,895
Fund balances, June 30 1,888$ 1,888$ 2,751$ 863$ 4,158$
Budget Amounts2009
CITY OF HOUSTON, TEXASASSET FORFEITURE FUND
Schedule of Revenues, Expenditures and Changes in Fund Balances - Budget and ActualFor the Year Ended June 30, 2009(With comparative totals for 2008)amounts expressed in thousands
- 136 -
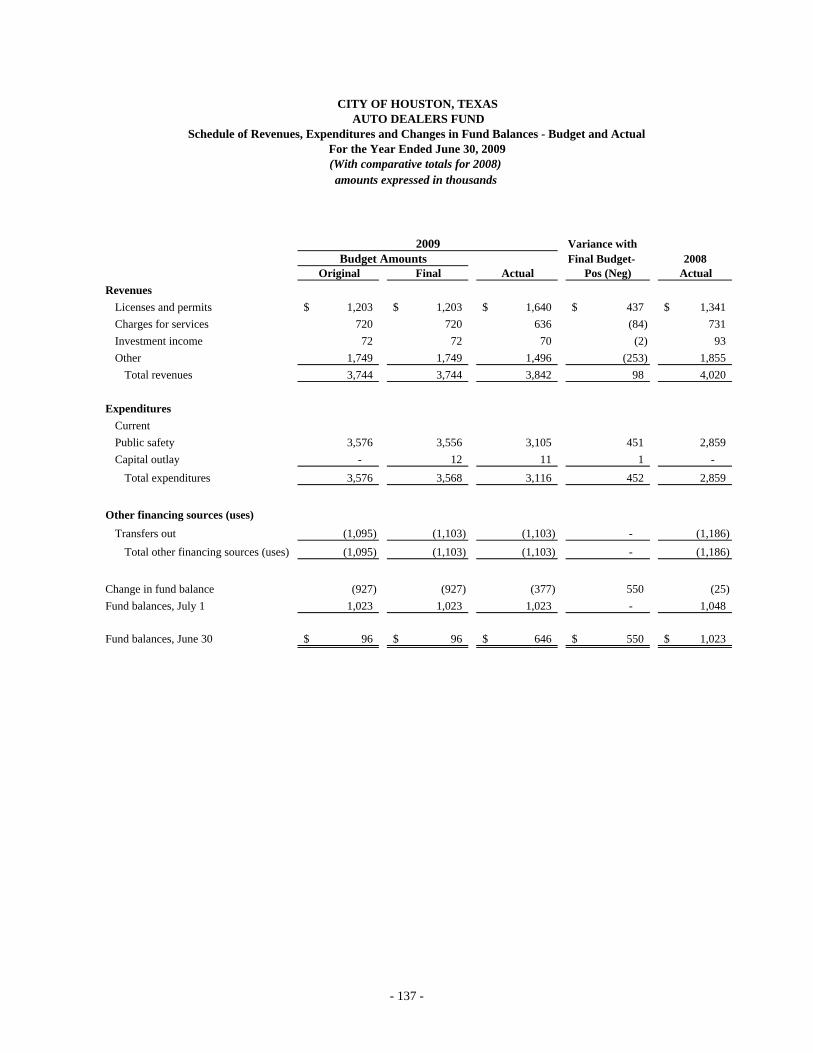
Variance withFinal Budget- 2008
Original Final Actual Pos (Neg) ActualRevenues
Licenses and permits 1,203$ 1,203$ 1,640$ 437$ 1,341$ Charges for services 720 720 636 (84) 731 Investment income 72 72 70 (2) 93 Other 1,749 1,749 1,496 (253) 1,855
Total revenues 3,744 3,744 3,842 98 4,020
ExpendituresCurrentPublic safety 3,576 3,556 3,105 451 2,859 Capital outlay - 12 11 1 -
Total expenditures 3,576 3,568 3,116 452 2,859
Other financing sources (uses)Transfers out (1,095) (1,103) (1,103) - (1,186)
Total other financing sources (uses) (1,095) (1,103) (1,103) - (1,186)
Change in fund balance (927) (927) (377) 550 (25) Fund balances, July 1 1,023 1,023 1,023 - 1,048
Fund balances, June 30 96$ 96$ 646$ 550$ 1,023$
Budget Amounts2009
CITY OF HOUSTON, TEXASAUTO DEALERS FUND
Schedule of Revenues, Expenditures and Changes in Fund Balances - Budget and ActualFor the Year Ended June 30, 2009(With comparative totals for 2008)amounts expressed in thousands
- 137 -

Variance withFinal Budget- 2008
Original Final Actual Pos (Neg) ActualRevenues
Taxes and assessmentsFranchise Tax 304$ 304$ 478$ 174$ 325$
Licenses and permits 38,495 38,495 29,998 (8,497) 35,905 Charges for services 6,070 6,070 6,317 247 8,069 Investment income 744 744 898 154 970 Other 335 335 302 (33) 333
Total revenues 45,948 45,948 37,993 (7,955) 45,602
ExpendituresCurrentPublic works 42,365 42,888 31,158 11,730 35,003 Capital outlay 3,515 8,621 13,687 (5,066) - Debt service principal 63 63 11 52 10
Total expenditures 45,943 51,572 44,856 6,716 35,013
Other financing sources (uses)Transfers in - - 5,778 5,778 - Transfers out (1,053) (6,202) (5,505) (697) (968)
Total other financing sources (uses) (1,053) (6,202) 273 5,081 (968)
Change in fund balance (1,048) (11,826) (6,590) 5,236 9,621 Fund balances, July 1 20,391 20,391 20,391 - 10,770
Fund balances, June 30 19,343$ 8,565$ 13,801$ 5,236$ 20,391$
Budget Amounts2009
CITY OF HOUSTON, TEXASBUILDING INSPECTION FUND
Schedule of Revenues, Expenditures and Changes in Fund Balances - Budget and ActualFor the Year Ended June 30, 2009(With comparative totals for 2008)amounts expressed in thousands
- 138 -

Variance withFinal Budget- 2008
Original Final Actual Pos (Neg) ActualRevenues
Investment income 13$ 13$ 35$ 22$ 41$ Other 2,609 2,609 2,972 363 1,785
Total revenues 2,622 2,622 3,007 385 1,826
ExpendituresCurrentGeneral government 2,422 2,664 2,559 105 1,584 Capital outlay 102 175 163 12 -
Total expenditures 2,524 2,839 2,722 117 1,584
Change in fund balance 98 (217) 285 502 242 Fund balances, July 1 606 606 606 - 364
Fund balances, June 30 704$ 389$ 891$ 502$ 606$
Budget Amounts2009
CITY OF HOUSTON, TEXASCABLE TELEVISION FUND
Schedule of Revenues, Expenditures and Changes in Fund Balances - Budget and ActualFor the Year Ended June 30, 2009(With comparative totals for 2008)amounts expressed in thousands
- 139 -
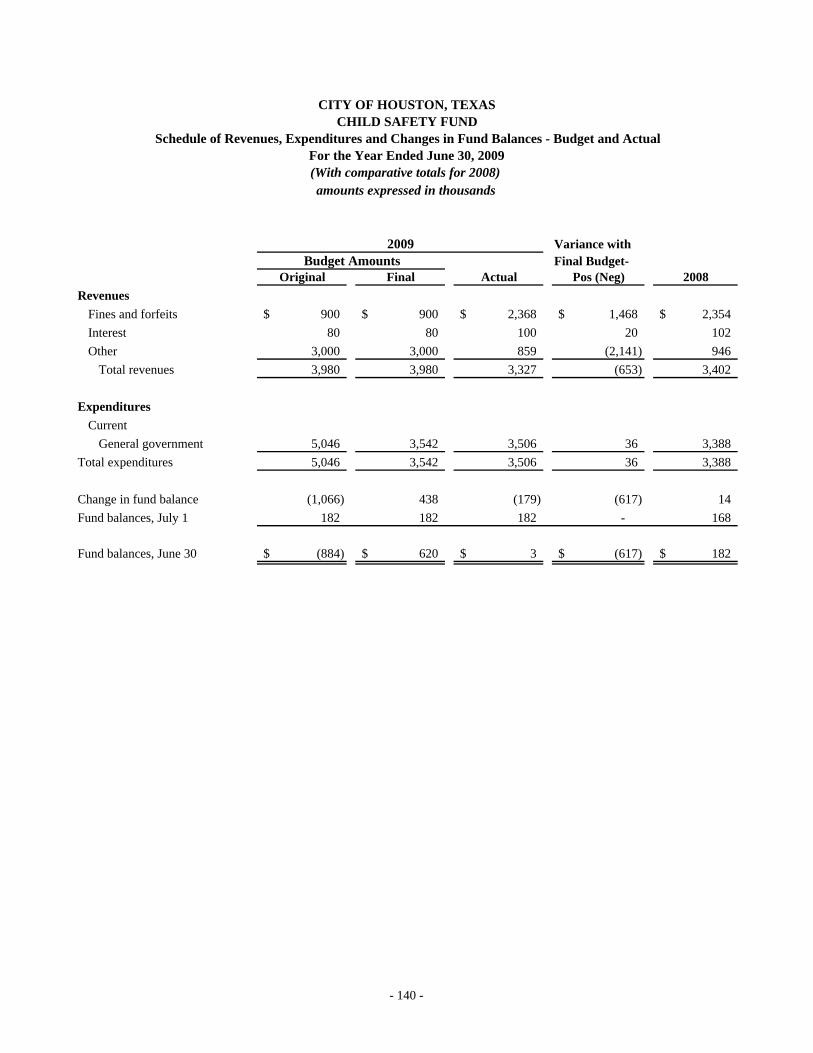
Variance withFinal Budget-
Original Final Actual Pos (Neg) 2008Revenues
Fines and forfeits 900$ 900$ 2,368$ 1,468$ 2,354$ Interest 80 80 100 20 102 Other 3,000 3,000 859 (2,141) 946
Total revenues 3,980 3,980 3,327 (653) 3,402
ExpendituresCurrent
General government 5,046 3,542 3,506 36 3,388 Total expenditures 5,046 3,542 3,506 36 3,388
Change in fund balance (1,066) 438 (179) (617) 14 Fund balances, July 1 182 182 182 - 168
Fund balances, June 30 (884)$ 620$ 3$ (617)$ 182$
Budget Amounts2009
CITY OF HOUSTON, TEXASCHILD SAFETY FUND
Schedule of Revenues, Expenditures and Changes in Fund Balances - Budget and ActualFor the Year Ended June 30, 2009(With comparative totals for 2008)amounts expressed in thousands
- 140 -
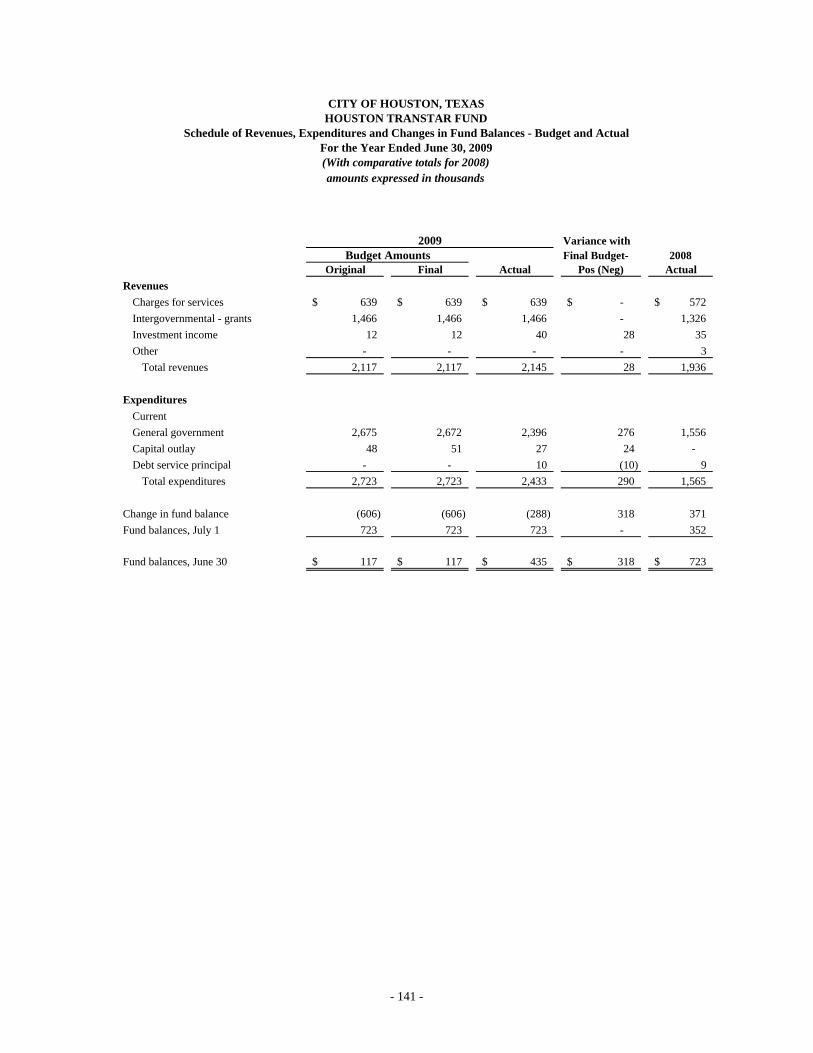
Variance withFinal Budget- 2008
Original Final Actual Pos (Neg) ActualRevenues
Charges for services 639$ 639$ 639$ -$ 572$ Intergovernmental - grants 1,466 1,466 1,466 - 1,326 Investment income 12 12 40 28 35 Other - - - - 3
Total revenues 2,117 2,117 2,145 28 1,936
ExpendituresCurrentGeneral government 2,675 2,672 2,396 276 1,556 Capital outlay 48 51 27 24 - Debt service principal - - 10 (10) 9
Total expenditures 2,723 2,723 2,433 290 1,565
Change in fund balance (606) (606) (288) 318 371 Fund balances, July 1 723 723 723 - 352
Fund balances, June 30 117$ 117$ 435$ 318$ 723$
Budget Amounts2009
(With comparative totals for 2008)amounts expressed in thousands
CITY OF HOUSTON, TEXASHOUSTON TRANSTAR FUND
Schedule of Revenues, Expenditures and Changes in Fund Balances - Budget and ActualFor the Year Ended June 30, 2009
- 141 -
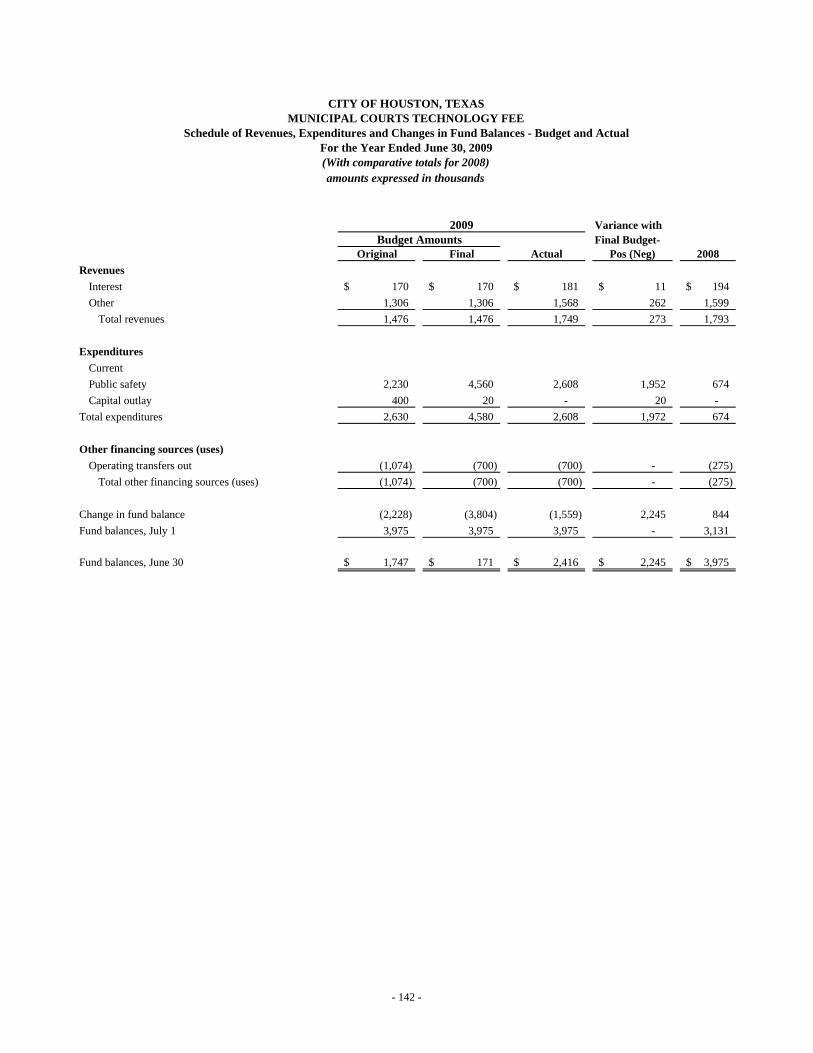
Variance withFinal Budget-
Original Final Actual Pos (Neg) 2008Revenues
Interest 170$ 170$ 181$ 11$ 194$ Other 1,306 1,306 1,568 262 1,599
Total revenues 1,476 1,476 1,749 273 1,793
ExpendituresCurrentPublic safety 2,230 4,560 2,608 1,952 674 Capital outlay 400 20 - 20 -
Total expenditures 2,630 4,580 2,608 1,972 674
Other financing sources (uses)Operating transfers out (1,074) (700) (700) - (275)
Total other financing sources (uses) (1,074) (700) (700) - (275)
Change in fund balance (2,228) (3,804) (1,559) 2,245 844 Fund balances, July 1 3,975 3,975 3,975 - 3,131
Fund balances, June 30 1,747$ 171$ 2,416$ 2,245$ 3,975$
MUNICIPAL COURTS TECHNOLOGY FEECITY OF HOUSTON, TEXAS
Budget Amounts2009
amounts expressed in thousands(With comparative totals for 2008)For the Year Ended June 30, 2009
Schedule of Revenues, Expenditures and Changes in Fund Balances - Budget and Actual
- 142 -
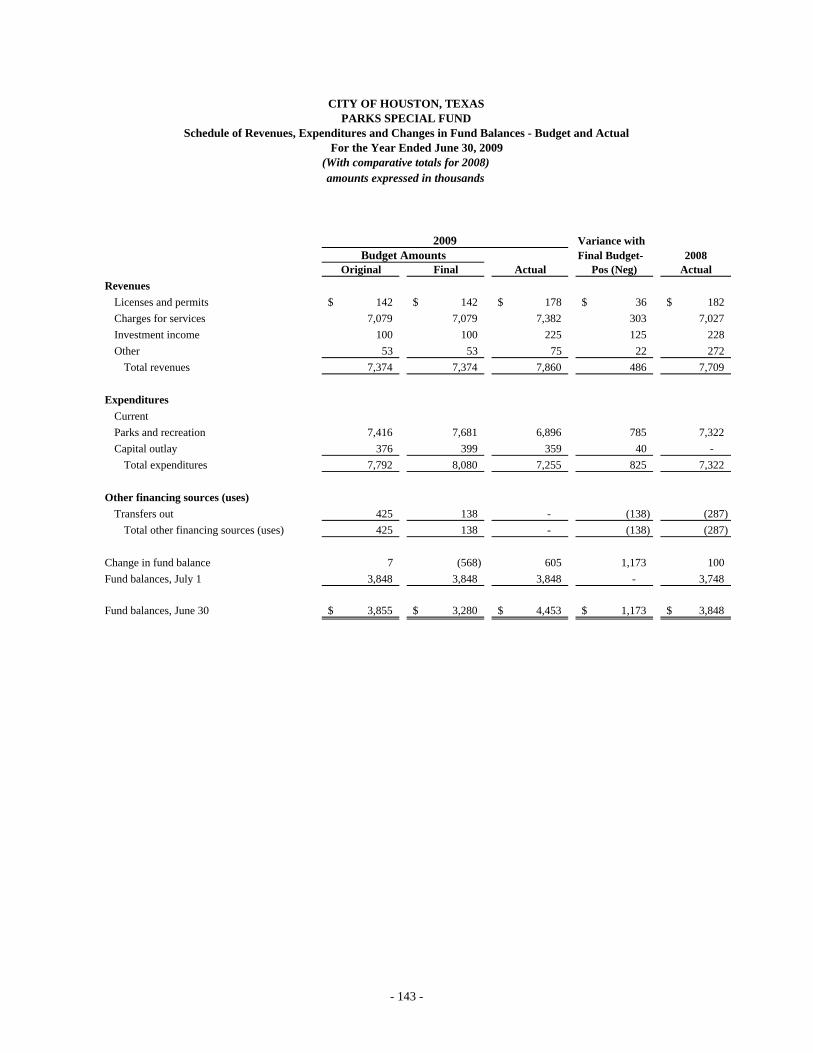
Variance withFinal Budget- 2008
Original Final Actual Pos (Neg) ActualRevenues
Licenses and permits 142$ 142$ 178$ 36$ 182$ Charges for services 7,079 7,079 7,382 303 7,027 Investment income 100 100 225 125 228 Other 53 53 75 22 272
Total revenues 7,374 7,374 7,860 486 7,709
ExpendituresCurrentParks and recreation 7,416 7,681 6,896 785 7,322 Capital outlay 376 399 359 40 -
Total expenditures 7,792 8,080 7,255 825 7,322
Other financing sources (uses)Transfers out 425 138 - (138) (287)
Total other financing sources (uses) 425 138 - (138) (287)
Change in fund balance 7 (568) 605 1,173 100 Fund balances, July 1 3,848 3,848 3,848 - 3,748
Fund balances, June 30 3,855$ 3,280$ 4,453$ 1,173$ 3,848$
Schedule of Revenues, Expenditures and Changes in Fund Balances - Budget and ActualPARKS SPECIAL FUND
CITY OF HOUSTON, TEXAS
Budget Amounts2009
For the Year Ended June 30, 2009(With comparative totals for 2008)amounts expressed in thousands
- 143 -

Variance withFinal Budget- 2008
Original Final Actual Pos (Neg) ActualRevenues
Charges for services 8,173$ 8,173$ 12,532$ 4,359$ 17,331$ Intergovernmental - grants 3,240 3,240 3,233 (7) 4,579 Investment income 200 200 481 281 607 Other 2,409 2,409 2,569 160 1,759
Total revenues 14,022 14,022 18,815 4,793 24,276
ExpendituresCurrentPublic safety 17,771 17,278 15,463 1,815 20,761 Capital outlay 3,021 3,514 3,862 (348) -
Total expenditures 20,792 20,792 19,325 1,467 20,761
Other financing sources (uses)Transfers in 1,156 1,156 943 (213) 1,496 Transfers out (2,950) (5,649) (5,912) (263) -
Total other financing sources (uses) (1,794) (4,493) (4,969) (476) 1,496
Change in fund balance (8,564) (11,263) (5,479) 5,784 5,011 Fund balances, July 1 14,770 14,770 14,770 - 9,759
Fund balances, June 30 6,206$ 3,507$ 9,291$ 5,784$ 14,770$
Budget Amounts2009
CITY OF HOUSTON, TEXASPOLICE SPECIAL SERVICES FUND
Schedule of Revenues, Expenditures and Changes in Fund Balances - Budget and ActualFor the Year Ended June 30, 2009(With comparative totals for 2008)amounts expressed in thousands
- 144 -

Variance withFinal Budget- 2008
Original Final Actual Pos (Neg) ActualRevenues
Licenses and permits 2,947$ 2,947$ 3,216$ 269$ 2,967$ Investment income 104 104 135 31 124 Other 2 2 4 2 3
Total revenues 3,053 3,053 3,355 302 3,094
ExpendituresCurrentPublic works 3,538 3,511 2,837 674 2,752 Capital outlay 43 70 43 27 -
Total expenditures 3,581 3,581 2,880 701 2,752
Other financing sources (uses)Sale of capital assets - - - - 2
Total other financing sources (uses) - - - - 2
Change in fund balance (528) (528) 475 1,003 344 Fund balances, July 1 2,071 2,071 2,071 - 1,727
Fund balances, June 30 1,543$ 1,543$ 2,546$ 1,003$ 2,071$
Budget Amounts2009
CITY OF HOUSTON, TEXASSIGN ADMINISTRATION FUND
Schedule of Revenues, Expenditures and Changes in Fund Balances - Budget and ActualFor the Year Ended June 30, 2009(With comparative totals for 2008)amounts expressed in thousands
- 145 -

Variance withFinal Budget- 2008
Original Final Actual Pos (Neg) ActualRevenues
Investment income 200$ 200$ 261$ 61$ 251$ Other 70 70 59 (11) 78
Total revenues 270 270 320 50 329
ExpendituresCurrentPublic works 34,446 33,725 30,375 3,350 32,709 Capital outlay 1,707 2,360 1,870 490 -
Total expenditures 36,153 36,085 32,245 3,840 32,709
Other financing sources (uses)Transfers in 41,737 41,737 41,429 (308) 36,540 Transfers out (7,566) (7,634) (6,668) 966 (4,641)
Total other financing sources (uses) 34,171 34,103 34,761 658 31,899
Change in fund balance (1,712) (1,712) 2,836 4,548 (481) Fund balances, July 1 2,871 2,871 2,871 - 3,352
Fund balances, June 30 1,159$ 1,159$ 5,707$ 4,548$ 2,871$
Budget Amounts2009
CITY OF HOUSTON, TEXASSTORMWATER FUND
Schedule of Revenues, Expenditures and Changes in Fund Balances - Budget and ActualFor the Year Ended June 30, 2009(With comparative totals for 2008)amounts expressed in thousands
- 146 -
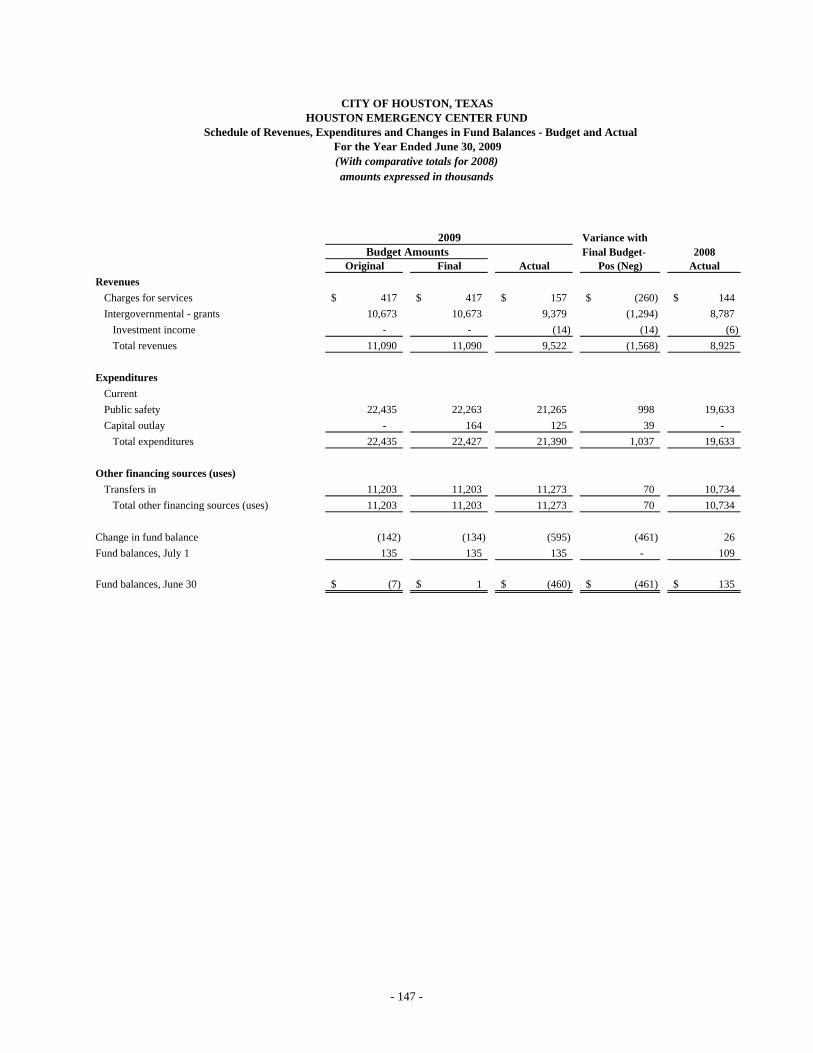
Variance withFinal Budget- 2008
Original Final Actual Pos (Neg) ActualRevenues
Charges for services 417$ 417$ 157$ (260)$ 144$ Intergovernmental - grants 10,673 10,673 9,379 (1,294) 8,787
Investment income - - (14) (14) (6) Total revenues 11,090 11,090 9,522 (1,568) 8,925
ExpendituresCurrentPublic safety 22,435 22,263 21,265 998 19,633 Capital outlay - 164 125 39 -
Total expenditures 22,435 22,427 21,390 1,037 19,633
Other financing sources (uses)Transfers in 11,203 11,203 11,273 70 10,734
Total other financing sources (uses) 11,203 11,203 11,273 70 10,734
Change in fund balance (142) (134) (595) (461) 26 Fund balances, July 1 135 135 135 - 109
Fund balances, June 30 (7)$ 1$ (460)$ (461)$ 135$
Budget Amounts2009
CITY OF HOUSTON, TEXASHOUSTON EMERGENCY CENTER FUND
Schedule of Revenues, Expenditures and Changes in Fund Balances - Budget and ActualFor the Year Ended June 30, 2009(With comparative totals for 2008)amounts expressed in thousands
- 147 -

Variance withFinal Budget- 2008
Original Final Actual Pos (Neg) ActualRevenues
Investment income 20$ 20$ 20$ -$ 30$ Other 30 30 46 16 30
Total revenues 50 50 66 16 60
ExpendituresCurrentGeneral government 88 31 21 10 202Capital outlay 190 247 49 198 -
Total expenditures 278 278 70 208 202
Change in fund balance (228) (228) (4) 224 (142) Fund balances, July 1 421 421 421 - 563
Fund balances, June 30 193$ 193$ 417$ 224$ 421$
(With comparative totals for 2008)amounts expressed in thousands
2009Budget Amounts
CITY OF HOUSTON, TEXASSUPPLEMENTAL ENVIRONMENTAL PROJECT FUND
Schedule of Revenues, Expenditures and Changes in Fund Balances - Budget and ActualFor the Year Ended June 30, 2009
- 148 -

ENTE
RPRI
SE F
UNDS
- 149 -
Enterprise Funds
Enterprise funds are established to account for City operations that are financed and operated in a manner similar to private business enterprises where the cost of providing goods or services to the general public is financed primarily through user charges.
Airport System — This fund is used to account for the operations of the City’s Airport System. The system is comprised of George Bush Intercontinental Airport, William P. Hobby Airport and Ellington Airport.
Convention and Entertainment Facilities — This fund is used to account for the operation of the City’s four major entertainment centers and two City-owned parking garages. These centers include the following: Jesse H. Jones Hall; Bayou Place; Gus S. Wortham Center; George R. Brown Convention Center and the Tranquility Park and Theater District parking garages.
Combined Utility System — This fund is used to account for the production and transmission of water and the treatment of wastewater for City residents and businesses as well as for other governmental entities located in the Houston area.
Nonmajor Enterprise Funds – The Houston Area Water Corporation fund did not meet the established criteria for major fund status. The Houston Area Water Corporation was organized to provide water to the City of Houston for resale to customers located wholly or partially in Area Three of the Harris-Galveston Coastal Subsidence District. Parking Management is a new fund created to manage parking facilities within the City of Houston.
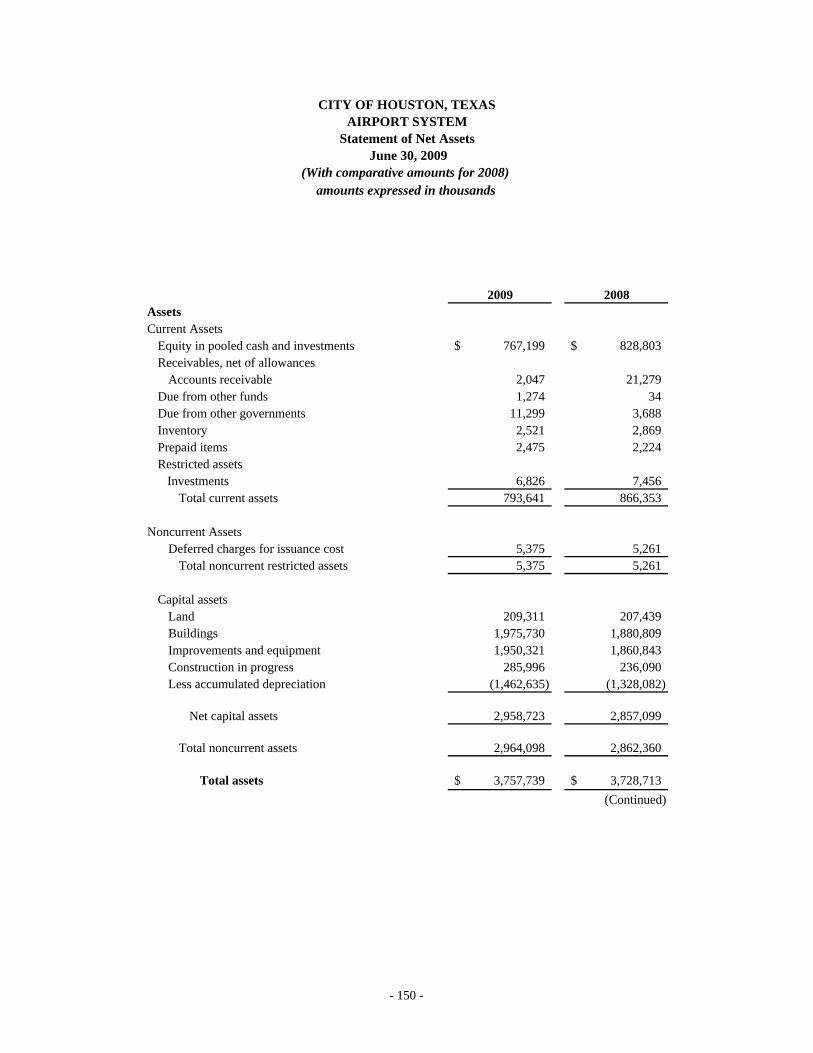
2009 2008AssetsCurrent Assets
Equity in pooled cash and investments 767,199$ 828,803$ Receivables, net of allowances
Accounts receivable 2,047 21,279 Due from other funds 1,274 34 Due from other governments 11,299 3,688 Inventory 2,521 2,869 Prepaid items 2,475 2,224 Restricted assets Investments 6,826 7,456
Total current assets 793,641 866,353
Noncurrent AssetsDeferred charges for issuance cost 5,375 5,261
Total noncurrent restricted assets 5,375 5,261
Capital assetsLand 209,311 207,439 Buildings 1,975,730 1,880,809 Improvements and equipment 1,950,321 1,860,843 Construction in progress 285,996 236,090 Less accumulated depreciation (1,462,635) (1,328,082)
Net capital assets 2,958,723 2,857,099
Total noncurrent assets 2,964,098 2,862,360
Total assets 3,757,739$ 3,728,713$ (Continued)
amounts expressed in thousands
Statement of Net Assets
CITY OF HOUSTON, TEXASAIRPORT SYSTEM
June 30, 2009(With comparative amounts for 2008)
- 150 -
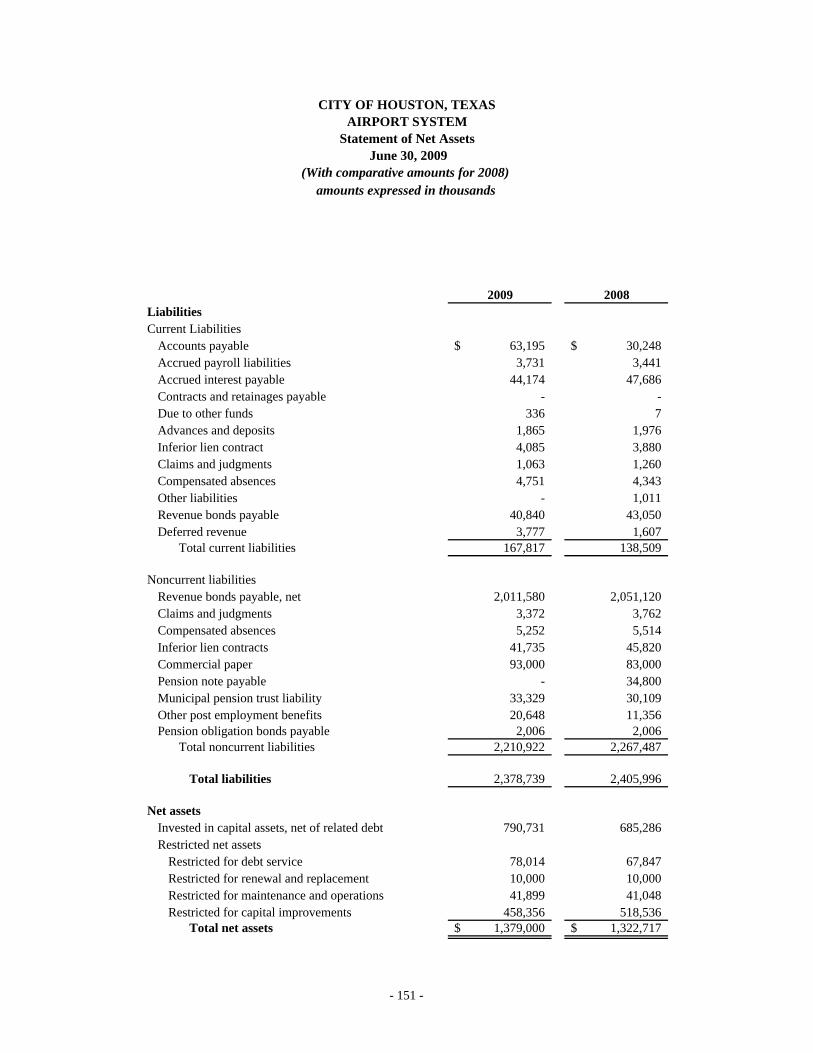
2009 2008
amounts expressed in thousands
Statement of Net Assets
CITY OF HOUSTON, TEXASAIRPORT SYSTEM
June 30, 2009(With comparative amounts for 2008)
LiabilitiesCurrent Liabilities
Accounts payable 63,195$ 30,248$ Accrued payroll liabilities 3,731 3,441 Accrued interest payable 44,174 47,686 Contracts and retainages payable - - Due to other funds 336 7 Advances and deposits 1,865 1,976 Inferior lien contract 4,085 3,880 Claims and judgments 1,063 1,260 Compensated absences 4,751 4,343 Other liabilities - 1,011 Revenue bonds payable 40,840 43,050 Deferred revenue 3,777 1,607
Total current liabilities 167,817 138,509
Noncurrent liabilitiesRevenue bonds payable, net 2,011,580 2,051,120 Claims and judgments 3,372 3,762 Compensated absences 5,252 5,514 Inferior lien contracts 41,735 45,820 Commercial paper 93,000 83,000 Pension note payable - 34,800 Municipal pension trust liability 33,329 30,109 Other post employment benefits 20,648 11,356 Pension obligation bonds payable 2,006 2,006
Total noncurrent liabilities 2,210,922 2,267,487
Total liabilities 2,378,739 2,405,996
Net assetsInvested in capital assets, net of related debt 790,731 685,286 Restricted net assets
Restricted for debt service 78,014 67,847 Restricted for renewal and replacement 10,000 10,000 Restricted for maintenance and operations 41,899 41,048 Restricted for capital improvements 458,356 518,536
Total net assets 1,379,000$ 1,322,717$
- 151 -
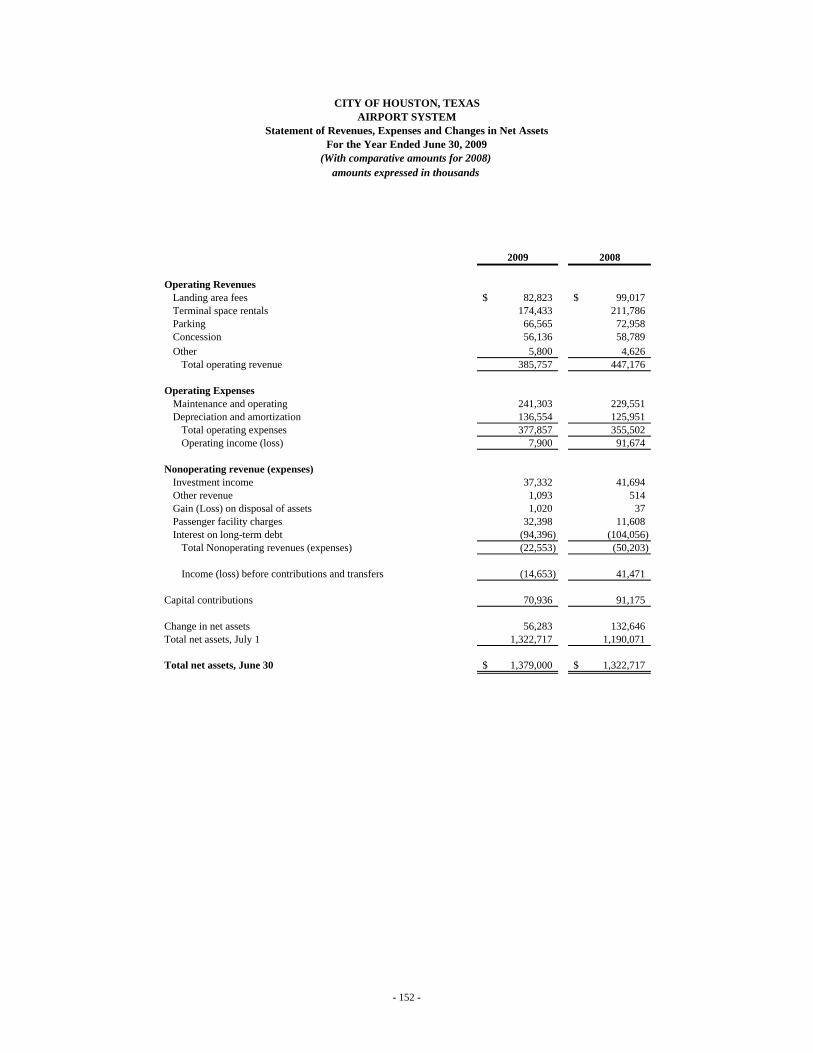
2009 2008
Operating RevenuesLanding area fees 82,823$ 99,017$ Terminal space rentals 174,433 211,786 Parking 66,565 72,958 Concession 56,136 58,789 Other 5,800 4,626
Total operating revenue 385,757 447,176
Operating ExpensesMaintenance and operating 241,303 229,551 Depreciation and amortization 136,554 125,951
Total operating expenses 377,857 355,502 Operating income (loss) 7,900 91,674
Nonoperating revenue (expenses)Investment income 37,332 41,694 Other revenue 1,093 514 Gain (Loss) on disposal of assets 1,020 37 Passenger facility charges 32,398 11,608 Interest on long-term debt (94,396) (104,056)
Total Nonoperating revenues (expenses) (22,553) (50,203)
Income (loss) before contributions and transfers (14,653) 41,471
Capital contributions 70,936 91,175
Change in net assets 56,283 132,646 Total net assets, July 1 1,322,717 1,190,071
Total net assets, June 30 1,379,000$ 1,322,717$
amounts expressed in thousands
CITY OF HOUSTON, TEXASAIRPORT SYSTEM
For the Year Ended June 30, 2009(With comparative amounts for 2008)
Statement of Revenues, Expenses and Changes in Net Assets
- 152 -
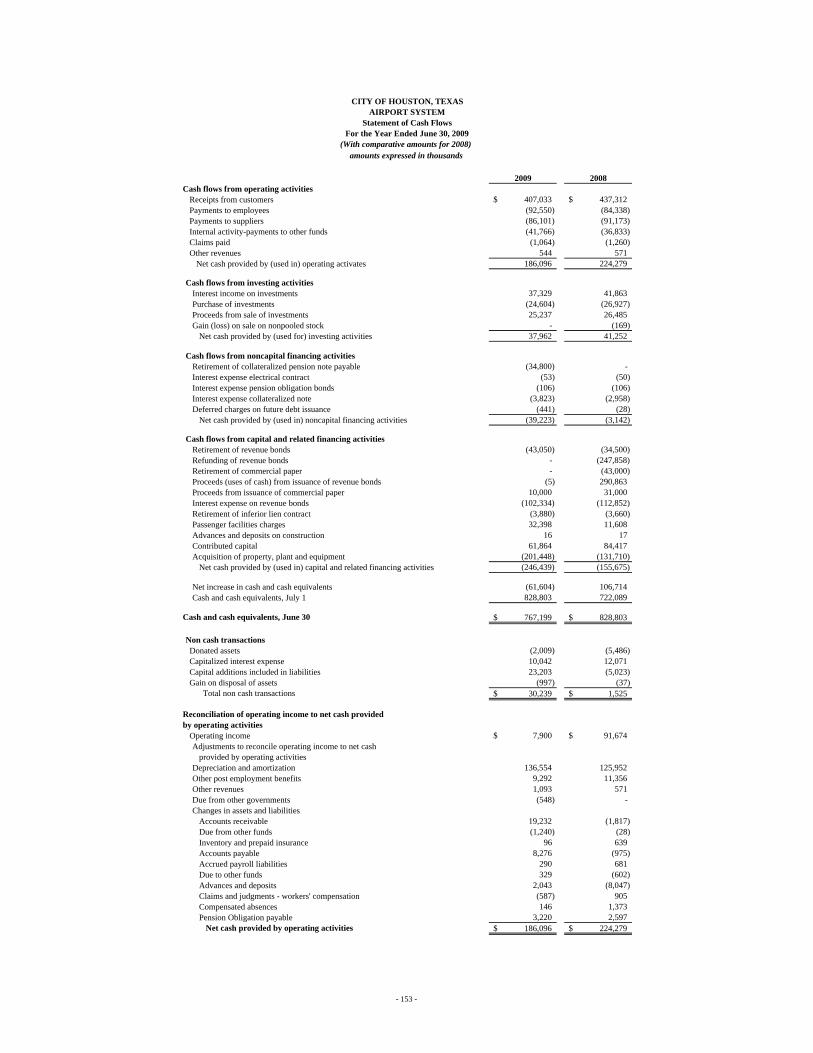
2009 2008Cash flows from operating activities
Receipts from customers 407,033$ 437,312$ Payments to employees (92,550) (84,338) Payments to suppliers (86,101) (91,173) Internal activity-payments to other funds (41,766) (36,833) Claims paid (1,064) (1,260) Other revenues 544 571
Net cash provided by (used in) operating activates 186,096 224,279
Cash flows from investing activitiesInterest income on investments 37,329 41,863 Purchase of investments (24,604) (26,927) Proceeds from sale of investments 25,237 26,485 Gain (loss) on sale on nonpooled stock - (169)
Net cash provided by (used for) investing activities 37,962 41,252
Cash flows from noncapital financing activitiesRetirement of collateralized pension note payable (34,800) - Interest expense electrical contract (53) (50) Interest expense pension obligation bonds (106) (106) Interest expense collateralized note (3,823) (2,958) Deferred charges on future debt issuance (441) (28)
Net cash provided by (used in) noncapital financing activities (39,223) (3,142)
Cash flows from capital and related financing activitiesRetirement of revenue bonds (43,050) (34,500) Refunding of revenue bonds - (247,858) Retirement of commercial paper - (43,000) Proceeds (uses of cash) from issuance of revenue bonds (5) 290,863 Proceeds from issuance of commercial paper 10,000 31,000 Interest expense on revenue bonds (102,334) (112,852) Retirement of inferior lien contract (3,880) (3,660) Passenger facilities charges 32,398 11,608 Advances and deposits on construction 16 17 Contributed capital 61,864 84,417 Acquisition of property, plant and equipment (201,448) (131,710)
Net cash provided by (used in) capital and related financing activities (246,439) (155,675)
Net increase in cash and cash equivalents (61,604) 106,714 Cash and cash equivalents, July 1 828,803 722,089
Cash and cash equivalents, June 30 767,199$ 828,803$
Non cash transactionsDonated assets (2,009) (5,486) Capitalized interest expense 10,042 12,071 Capital additions included in liabilities 23,203 (5,023) Gain on disposal of assets (997) (37)
Total non cash transactions 30,239$ 1,525$
Reconciliation of operating income to net cash providedby operating activities
Operating income 7,900$ 91,674$ Adjustments to reconcile operating income to net cash
provided by operating activitiesDepreciation and amortization 136,554 125,952 Other post employment benefits 9,292 11,356 Other revenues 1,093 571 Due from other governments (548) - Changes in assets and liabilities
Accounts receivable 19,232 (1,817) Due from other funds (1,240) (28) Inventory and prepaid insurance 96 639 Accounts payable 8,276 (975) Accrued payroll liabilities 290 681 Due to other funds 329 (602) Advances and deposits 2,043 (8,047) Claims and judgments - workers' compensation (587) 905 Compensated absences 146 1,373 Pension Obligation payable 3,220 2,597
Net cash provided by operating activities 186,096$ 224,279$
amounts expressed in thousands(With comparative amounts for 2008)
CITY OF HOUSTON, TEXASAIRPORT SYSTEM
Statement of Cash FlowsFor the Year Ended June 30, 2009
- 153 -

2009 2008AssetsCurrent Assets
Equity in pooled cash and investments 100,469$ 90,873$ Receivables, net of allowances
Accounts receivable 1,151 2,003 Hotel occupancy tax receivable 14,713 18,627
Due from component units 13,431 13,033 Due from other funds 202 102 Due from other governments 590 826 Prepaid items 785 708 Restricted assets Investments 21,774 21,774
Total current assets 153,115 147,946
Noncurrent AssetsDue from component units 288,758 299,350 Deferred charges for issuance cost 3,186 3,439
Total noncurrent restricted assets 291,944 302,789
Capital assetsLand 99,757 99,757 Buildings 552,701 447,272 Improvements and equipment 10,969 8,942 Infrastructure 110 110 Construction in progress 4,767 1,849 Garage Rights 13,144 13,144 Less accumulated depreciation and amortization (172,647) (157,839)
Net capital assets 508,801 413,235
Total noncurrent assets 800,745 716,024
Total assets 953,860$ 863,970$ (Continued)
CITY OF HOUSTON, TEXASCONVENTION & ENTERTAINMENT
June 30, 2009(With comparative amounts for 2008)
amounts expressed in thousands
Statement of Net Assets
- 154 -

2009 2008
CITY OF HOUSTON, TEXASCONVENTION & ENTERTAINMENT
June 30, 2009(With comparative amounts for 2008)
amounts expressed in thousands
Statement of Net Assets
LiabilitiesCurrent Liabilities
Accounts payable 5,440$ 6,669$ Accrued payroll liabilities 396 380 Accrued interest payable 5,080 5,622 Due to other funds 345 - Due to component units 24,437 23,847 Due to other governments 55 108 Advances and deposits 895 1,052 Compensated absences 589 489 Deferred electricity note - 255 Revenue bonds payable 21,230 18,620 Deferred revenue 396 396
Total current liabilities 58,863 57,438
Noncurrent liabilitiesRevenue bonds payable 594,240 605,938 Claims and judgments - 160 Compensated absences 614 718 Commercial paper 43,800 43,800 Arbitrage rebate 361 340 Pension note payable - 3,300 Municipal pension trust liability 3,510 3,156 Other post employment benefits 1,638 918 Deferred revenue 9,005 9,696 Pension obligation bonds payable 3,884 189
Total noncurrent liabilities 657,052 668,215
Total liabilities 715,915 725,653
Net AssetsInvested in capital assets, net of related debt 161,540 63,806 Restricted net assets
Restricted for debt service 16,694 16,152 Restricted for maintenance and operations 16,665 18,502 Restricted for capital improvements - 6,865
Unrestricted 43,046 32,992
Total net assets 237,945$ 138,317$
- 155 -
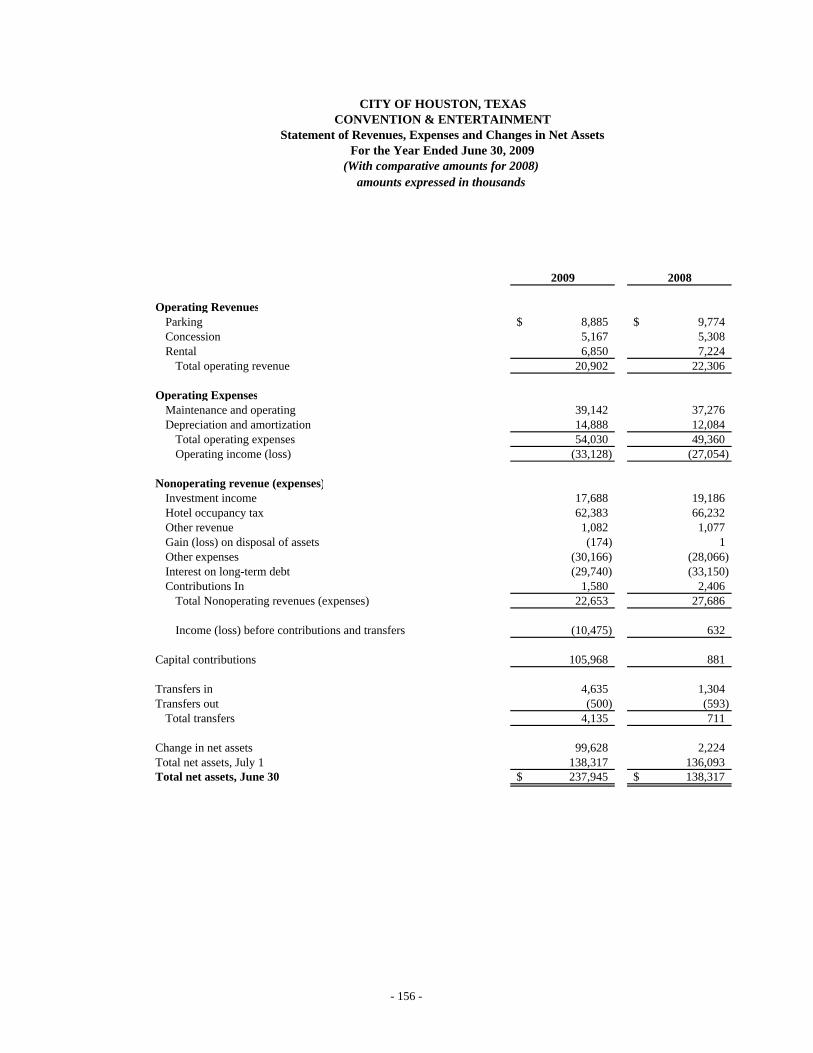
2009 2008
Operating RevenuesParking 8,885$ 9,774$ Concession 5,167 5,308 Rental 6,850 7,224
Total operating revenue 20,902 22,306
Operating ExpensesMaintenance and operating 39,142 37,276 Depreciation and amortization 14,888 12,084
Total operating expenses 54,030 49,360 Operating income (loss) (33,128) (27,054)
Nonoperating revenue (expenses)Investment income 17,688 19,186 Hotel occupancy tax 62,383 66,232 Other revenue 1,082 1,077 Gain (loss) on disposal of assets (174) 1 Other expenses (30,166) (28,066) Interest on long-term debt (29,740) (33,150) Contributions In 1,580 2,406
Total Nonoperating revenues (expenses) 22,653 27,686
Income (loss) before contributions and transfers (10,475) 632
Capital contributions 105,968 881
Transfers in 4,635 1,304 Transfers out (500) (593)
Total transfers 4,135 711
Change in net assets 99,628 2,224 Total net assets, July 1 138,317 136,093 Total net assets, June 30 237,945$ 138,317$
amounts expressed in thousands
CITY OF HOUSTON, TEXASCONVENTION & ENTERTAINMENT
For the Year Ended June 30, 2009(With comparative amounts for 2008)
Statement of Revenues, Expenses and Changes in Net Assets
- 156 -
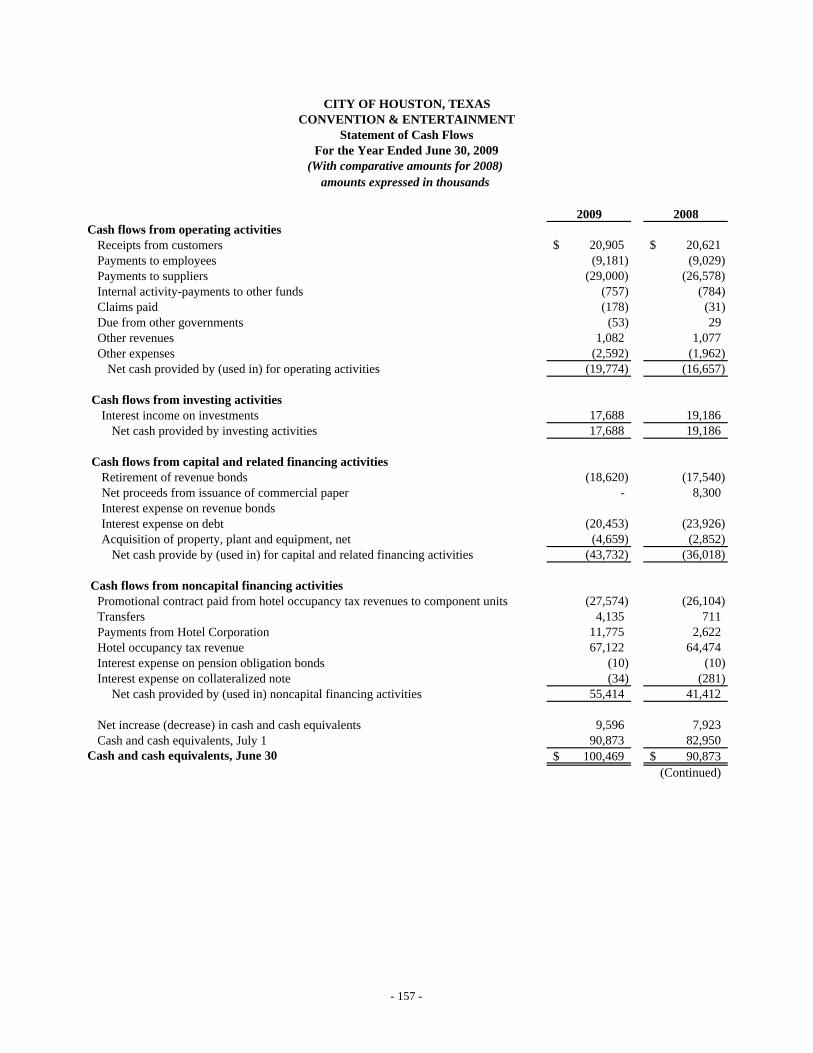
2009 2008Cash flows from operating activities
Receipts from customers 20,905$ 20,621$ Payments to employees (9,181) (9,029) Payments to suppliers (29,000) (26,578) Internal activity-payments to other funds (757) (784) Claims paid (178) (31) Due from other governments (53) 29 Other revenues 1,082 1,077 Other expenses (2,592) (1,962)
Net cash provided by (used in) for operating activities (19,774) (16,657)
Cash flows from investing activitiesInterest income on investments 17,688 19,186
Net cash provided by investing activities 17,688 19,186
Cash flows from capital and related financing activitiesRetirement of revenue bonds (18,620) (17,540) Net proceeds from issuance of commercial paper - 8,300 Interest expense on revenue bondsInterest expense on debt (20,453) (23,926) Acquisition of property, plant and equipment, net (4,659) (2,852)
Net cash provide by (used in) for capital and related financing activities (43,732) (36,018)
Cash flows from noncapital financing activitiesPromotional contract paid from hotel occupancy tax revenues to component units (27,574) (26,104) Transfers 4,135 711 Payments from Hotel Corporation 11,775 2,622 Hotel occupancy tax revenue 67,122 64,474 Interest expense on pension obligation bonds (10) (10) Interest expense on collateralized note (34) (281)
Net cash provided by (used in) noncapital financing activities 55,414 41,412
Net increase (decrease) in cash and cash equivalents 9,596 7,923 Cash and cash equivalents, July 1 90,873 82,950
Cash and cash equivalents, June 30 100,469$ 90,873$ (Continued)
amounts expressed in thousands(With comparative amounts for 2008)
CITY OF HOUSTON, TEXASCONVENTION & ENTERTAINMENT
Statement of Cash FlowsFor the Year Ended June 30, 2009
- 157 -
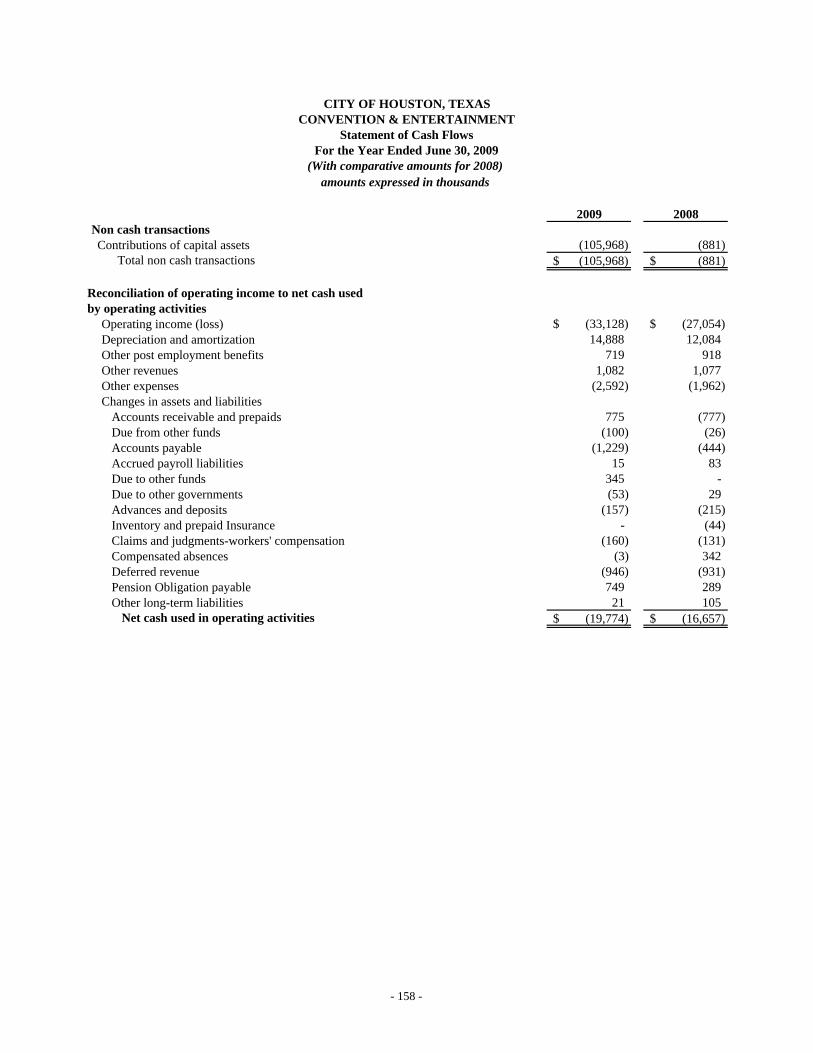
2009 2008
amounts expressed in thousands(With comparative amounts for 2008)
CITY OF HOUSTON, TEXASCONVENTION & ENTERTAINMENT
Statement of Cash FlowsFor the Year Ended June 30, 2009
Non cash transactionsContributions of capital assets (105,968) (881)
Total non cash transactions (105,968)$ (881)$
Reconciliation of operating income to net cash usedby operating activities
Operating income (loss) (33,128)$ (27,054)$ Depreciation and amortization 14,888 12,084 Other post employment benefits 719 918 Other revenues 1,082 1,077 Other expenses (2,592) (1,962) Changes in assets and liabilities
Accounts receivable and prepaids 775 (777) Due from other funds (100) (26) Accounts payable (1,229) (444) Accrued payroll liabilities 15 83 Due to other funds 345 - Due to other governments (53) 29 Advances and deposits (157) (215) Inventory and prepaid Insurance - (44) Claims and judgments-workers' compensation (160) (131) Compensated absences (3) 342 Deferred revenue (946) (931) Pension Obligation payable 749 289 Other long-term liabilities 21 105
Net cash used in operating activities (19,774)$ (16,657)$
- 158 -
CITY OF HOUSTON, TEXAS
This page is left blank intentionally
- 159-

2009 2008AssetsCurrent assets
Equity in pooled cash and investments 640,694$ 635,593$ Receivables, net of allowances
Accounts receivable 95,914 96,728 Special assessments receivable 93 93
Due from other funds 13,259 1,544 Due from other governments 8,619 4,866 Inventory 6,867 6,168 Prepaid items 4,009 3,727
Total current assets 769,455 748,719
Noncurrent AssetsDue from other Funds 96,859 96,859 Amounts held by other governments 10,146 10,058 Deferred charges for issuance cost 61,270 56,737
Total noncurrent restricted assets 168,275 163,654
Capital assetsLand 119,995 115,478 Buildings 106,532 95,307 Improvements and equipment 114,678 109,372 Plants, lines and rights 8,393,958 8,053,794 Construction in progress 457,327 413,610 Water rights 456,915 456,915 Less accumulated depreciation and amortization (4,404,147) (4,210,358)
Net capital assets 5,245,258 5,034,118
Total noncurrent assets 5,413,533 5,197,772
Total assets 6,182,988$ 5,946,491$
(Continued)
amounts expressed in thousands
Statement of Net Assets
CITY OF HOUSTON, TEXASCOMBINED UTILITY SYSTEM
June 30, 2009(With comparative amounts for 2008)
- 160 -
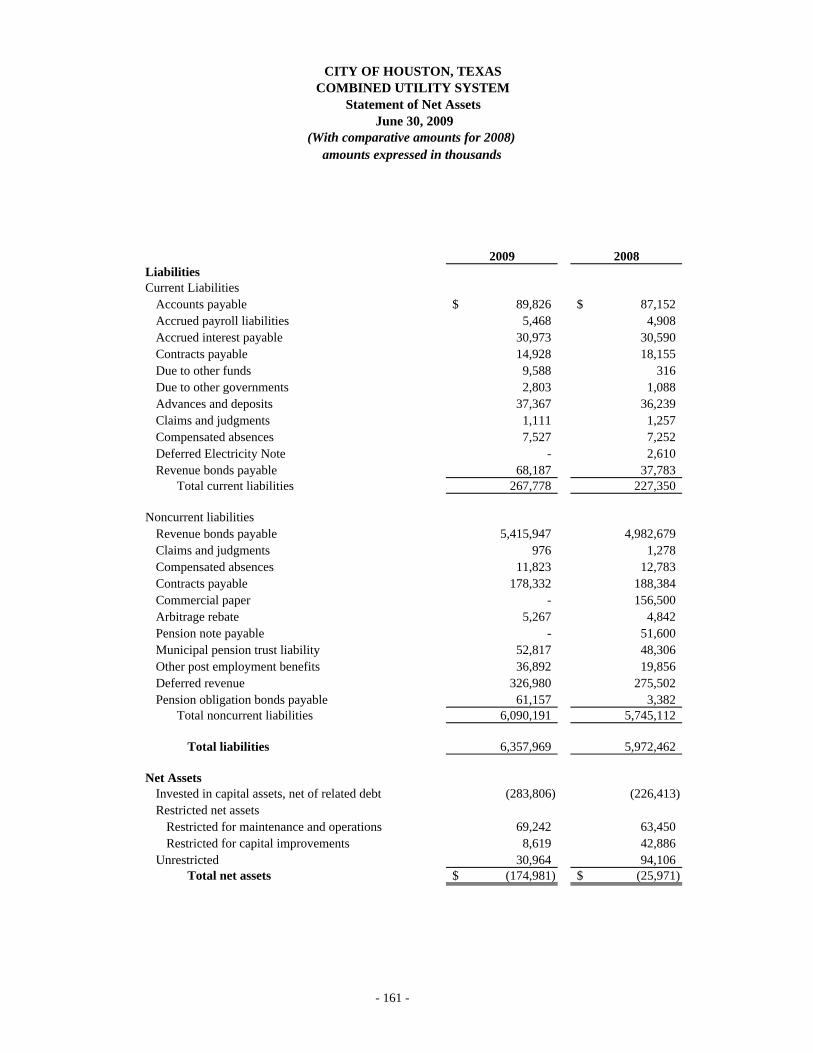
2009 2008
amounts expressed in thousands
Statement of Net Assets
CITY OF HOUSTON, TEXASCOMBINED UTILITY SYSTEM
June 30, 2009(With comparative amounts for 2008)
LiabilitiesCurrent Liabilities
Accounts payable 89,826$ 87,152$ Accrued payroll liabilities 5,468 4,908 Accrued interest payable 30,973 30,590 Contracts payable 14,928 18,155 Due to other funds 9,588 316 Due to other governments 2,803 1,088 Advances and deposits 37,367 36,239 Claims and judgments 1,111 1,257 Compensated absences 7,527 7,252 Deferred Electricity Note - 2,610 Revenue bonds payable 68,187 37,783
Total current liabilities 267,778 227,350
Noncurrent liabilitiesRevenue bonds payable 5,415,947 4,982,679 Claims and judgments 976 1,278 Compensated absences 11,823 12,783 Contracts payable 178,332 188,384 Commercial paper - 156,500 Arbitrage rebate 5,267 4,842 Pension note payable - 51,600 Municipal pension trust liability 52,817 48,306 Other post employment benefits 36,892 19,856 Deferred revenue 326,980 275,502 Pension obligation bonds payable 61,157 3,382
Total noncurrent liabilities 6,090,191 5,745,112
Total liabilities 6,357,969 5,972,462
Net AssetsInvested in capital assets, net of related debt (283,806) (226,413) Restricted net assets
Restricted for maintenance and operations 69,242 63,450 Restricted for capital improvements 8,619 42,886
Unrestricted 30,964 94,106 Total net assets (174,981)$ (25,971)$
- 161 -

2009 2008
Operating Revenues Water/Sewer Billing 687,238$ 648,269$
Total operating revenue 687,238 648,269
Operating Expenses Maintenance and operating 371,771 346,665 Depreciation and amortization 204,919 220,190
Total operating expenses 576,690 566,855 Operating income (loss) 110,548 81,414
Nonoperating revenue (expenses)Investment income 33,436 35,435 Other revenue 29,880 31,517 Loss on disposal of assets (5,432) (12,009) Interest on long-term debt (260,396) (267,504) Contributions in 2,969 2,343
Total Nonoperating revenues (expenses) (199,543) (210,218)
Income (loss) before contributions and transfers (88,995) (128,804)
Capital contributions 17,109 42,862
Transfers in - 1,020 Transfers out (77,124) (71,167) Total transfers (77,124) (70,147)
Change in net assets (149,010) (156,089) Total net assets, July 1 (25,971) 130,118
Total net assets, June 30 (174,981)$ (25,971)$
amounts expressed in thousands
CITY OF HOUSTON, TEXASCOMBINED UTILITY SYSTEM
For the Year Ended June 30, 2009(With comparative amounts for 2008)
Statement of Revenues, Expenses and Changes in Net Assets
- 162 -
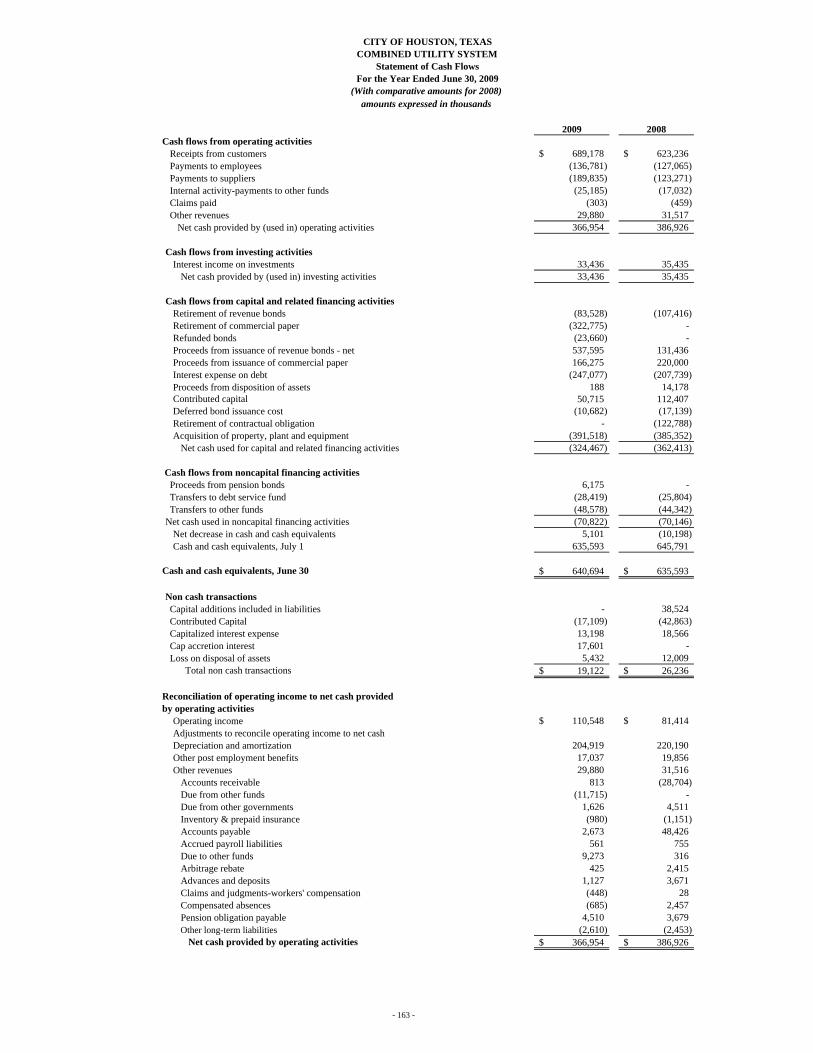
2009 2008Cash flows from operating activities
Receipts from customers 689,178$ 623,236$ Payments to employees (136,781) (127,065) Payments to suppliers (189,835) (123,271) Internal activity-payments to other funds (25,185) (17,032) Claims paid (303) (459) Other revenues 29,880 31,517
Net cash provided by (used in) operating activities 366,954 386,926
Cash flows from investing activitiesInterest income on investments 33,436 35,435
Net cash provided by (used in) investing activities 33,436 35,435
Cash flows from capital and related financing activitiesRetirement of revenue bonds (83,528) (107,416) Retirement of commercial paper (322,775) - Refunded bonds (23,660) - Proceeds from issuance of revenue bonds - net 537,595 131,436 Proceeds from issuance of commercial paper 166,275 220,000 Interest expense on debt (247,077) (207,739) Proceeds from disposition of assets 188 14,178 Contributed capital 50,715 112,407 Deferred bond issuance cost (10,682) (17,139) Retirement of contractual obligation - (122,788) Acquisition of property, plant and equipment (391,518) (385,352)
Net cash used for capital and related financing activities (324,467) (362,413)
Cash flows from noncapital financing activitiesProceeds from pension bonds 6,175 - Transfers to debt service fund (28,419) (25,804) Transfers to other funds (48,578) (44,342)
Net cash used in noncapital financing activities (70,822) (70,146) Net decrease in cash and cash equivalents 5,101 (10,198) Cash and cash equivalents, July 1 635,593 645,791
Cash and cash equivalents, June 30 640,694$ 635,593$
Non cash transactionsCapital additions included in liabilities - 38,524 Contributed Capital (17,109) (42,863) Capitalized interest expense 13,198 18,566 Cap accretion interest 17,601 - Loss on disposal of assets 5,432 12,009
Total non cash transactions 19,122$ 26,236$
Reconciliation of operating income to net cash providedby operating activities
Operating income 110,548$ 81,414$ Adjustments to reconcile operating income to net cashDepreciation and amortization 204,919 220,190 Other post employment benefits 17,037 19,856 Other revenues 29,880 31,516
Accounts receivable 813 (28,704) Due from other funds (11,715) - Due from other governments 1,626 4,511 Inventory & prepaid insurance (980) (1,151) Accounts payable 2,673 48,426 Accrued payroll liabilities 561 755 Due to other funds 9,273 316 Arbitrage rebate 425 2,415 Advances and deposits 1,127 3,671 Claims and judgments-workers' compensation (448) 28 Compensated absences (685) 2,457 Pension obligation payable 4,510 3,679 Other long-term liabilities (2,610) (2,453)
Net cash provided by operating activities 366,954$ 386,926$
amounts expressed in thousands(With comparative amounts for 2008)
CITY OF HOUSTON, TEXASCOMBINED UTILITY SYSTEM
Statement of Cash FlowsFor the Year Ended June 30, 2009
- 163 -
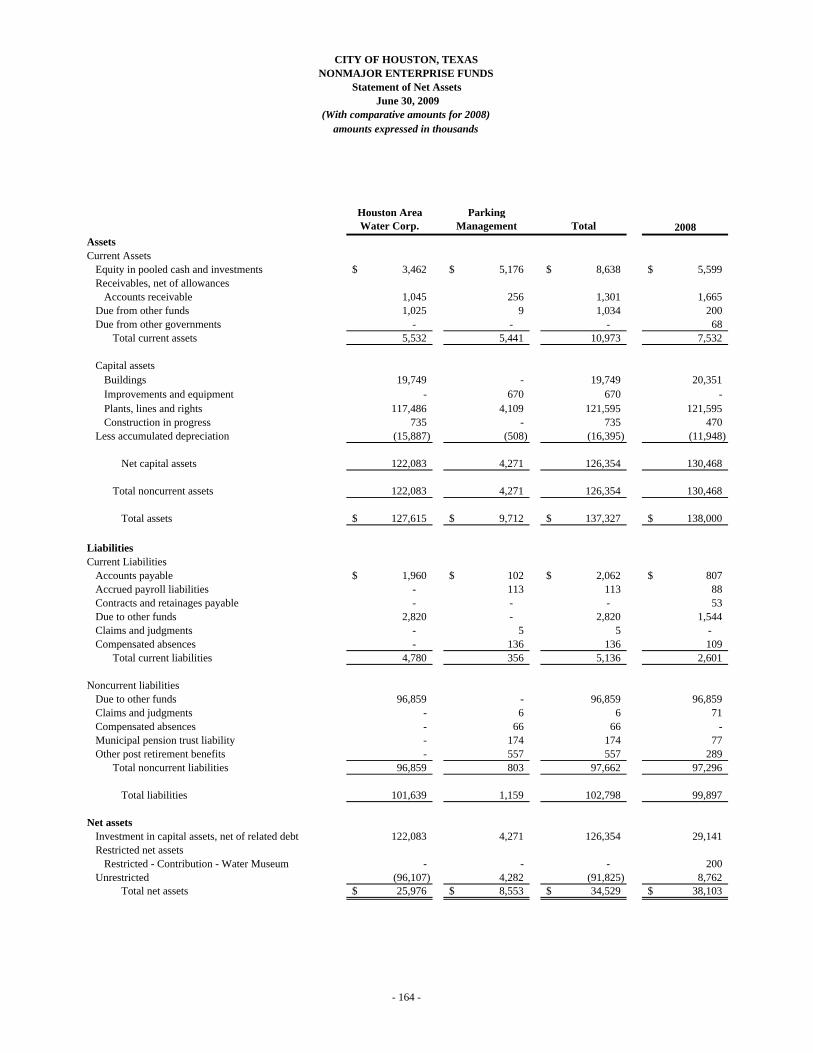
Houston Area Water Corp.
Parking Management Total 2008
AssetsCurrent Assets
Equity in pooled cash and investments 3,462$ 5,176$ 8,638$ 5,599$ Receivables, net of allowances
Accounts receivable 1,045 256 1,301 1,665 Due from other funds 1,025 9 1,034 200 Due from other governments - - - 68
Total current assets 5,532 5,441 10,973 7,532
Capital assetsBuildings 19,749 - 19,749 20,351 Improvements and equipment - 670 670 - Plants, lines and rights 117,486 4,109 121,595 121,595 Construction in progress 735 - 735 470
Less accumulated depreciation (15,887) (508) (16,395) (11,948)
Net capital assets 122,083 4,271 126,354 130,468
Total noncurrent assets 122,083 4,271 126,354 130,468
Total assets 127,615$ 9,712$ 137,327$ 138,000$
LiabilitiesCurrent Liabilities
Accounts payable 1,960$ 102$ 2,062$ 807$ Accrued payroll liabilities - 113 113 88 Contracts and retainages payable - - - 53 Due to other funds 2,820 - 2,820 1,544 Claims and judgments - 5 5 - Compensated absences - 136 136 109
Total current liabilities 4,780 356 5,136 2,601
Noncurrent liabilitiesDue to other funds 96,859 - 96,859 96,859 Claims and judgments - 6 6 71 Compensated absences - 66 66 - Municipal pension trust liability - 174 174 77 Other post retirement benefits - 557 557 289
Total noncurrent liabilities 96,859 803 97,662 97,296
Total liabilities 101,639 1,159 102,798 99,897
Net assetsInvestment in capital assets, net of related debt 122,083 4,271 126,354 29,141 Restricted net assets
Restricted - Contribution - Water Museum - - - 200 Unrestricted (96,107) 4,282 (91,825) 8,762
Total net assets 25,976$ 8,553$ 34,529$ 38,103$
(With comparative amounts for 2008)amounts expressed in thousands
CITY OF HOUSTON, TEXASNONMAJOR ENTERPRISE FUNDS
Statement of Net Assets June 30, 2009
- 164 -

Houston Area Water Corp.
Parking Management Total 2008
Operating RevenuesParking -$ 13,250$ 13,250$ 13,045$
Total operating revenue - 13,250 13,250 13,045
Operating ExpensesAdministrative costs - 4,499 4,499 3,727 Maintenance and operating 9,169 119 9,288 8,778 Depreciation and amortization 4,235 288 4,523 4,679
Total operating expenses 13,404 4,906 18,310 17,184 Operating income (loss) (13,404) 8,344 (5,060) (4,139)
Nonoperating revenue (expenses)Investment income 14 267 281 177 Other revenue - 443 443 457 Loss on disposal of assets - (13) (13) - Other expenses (1,463) - (1,463) - Interest on long-term debt - - - (301) Contributions in 25 - 25 478
Total Nonoperating revenues (expenses) (1,424) 697 (727) 811
Income (loss) before contributions and transfers (14,828) 9,041 (5,787) (3,328)
Capital contributions - - - 4,295
Transfers in 9,449 - 9,449 8,823 Transfers out - (7,236) (7,236) (7,174)
Total transfers 9,449 (7,236) 2,213 1,649
Change in net assets (5,379) 1,805 (3,574) 2,616 Total net assets (deficit), July 1 31,355 6,748 38,103 35,487
Total net assets, June 30 25,976$ 8,553$ 34,529$ 38,103$
(With comparative amounts for 2008)amounts expressed in thousands
CITY OF HOUSTON, TEXASNONMAJOR ENTERPRISE FUNDS
Statement of Revenues, Expenses and Changes in Net AssetsFor the Year Ended June 30, 2009
- 165 -
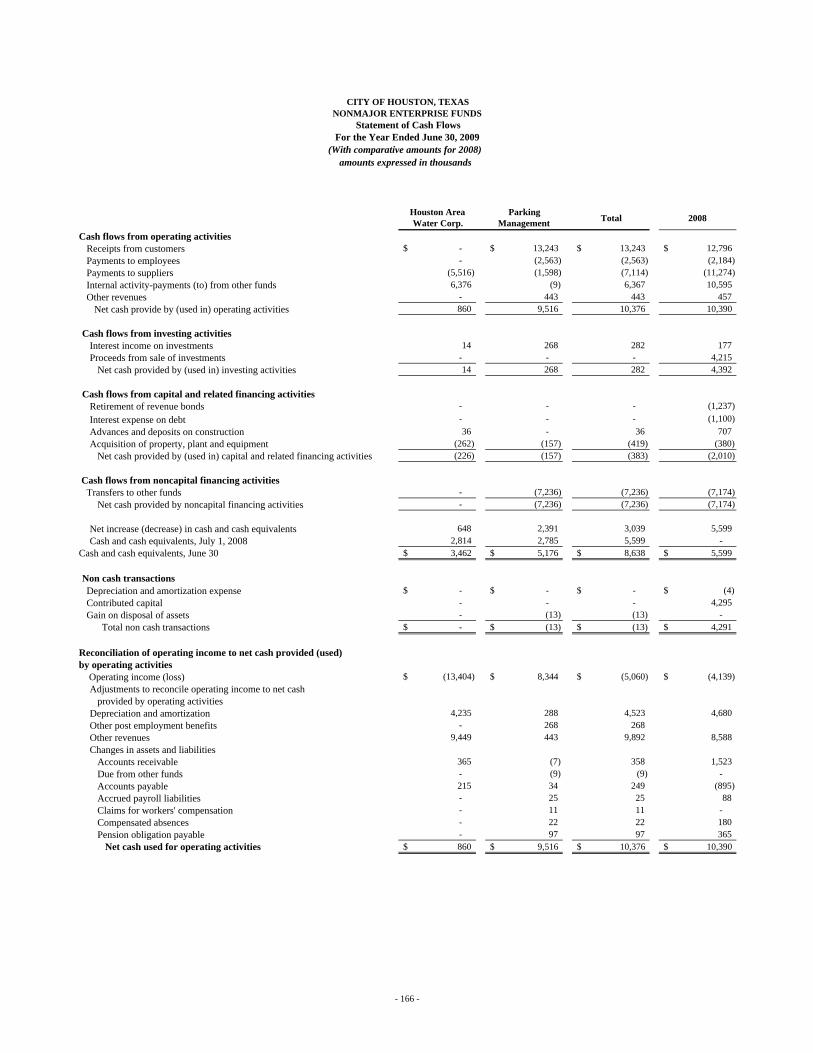
Houston Area Water Corp.
Parking Management Total 2008
Cash flows from operating activitiesReceipts from customers -$ 13,243$ 13,243$ 12,796$ Payments to employees - (2,563) (2,563) (2,184) Payments to suppliers (5,516) (1,598) (7,114) (11,274) Internal activity-payments (to) from other funds 6,376 (9) 6,367 10,595 Other revenues - 443 443 457
Net cash provide by (used in) operating activities 860 9,516 10,376 10,390
Cash flows from investing activitiesInterest income on investments 14 268 282 177 Proceeds from sale of investments - - - 4,215
Net cash provided by (used in) investing activities 14 268 282 4,392
Cash flows from capital and related financing activitiesRetirement of revenue bonds - - - (1,237) Interest expense on debt - - - (1,100) Advances and deposits on construction 36 - 36 707 Acquisition of property, plant and equipment (262) (157) (419) (380)
Net cash provided by (used in) capital and related financing activities (226) (157) (383) (2,010)
Cash flows from noncapital financing activitiesTransfers to other funds - (7,236) (7,236) (7,174)
Net cash provided by noncapital financing activities - (7,236) (7,236) (7,174)
Net increase (decrease) in cash and cash equivalents 648 2,391 3,039 5,599 Cash and cash equivalents, July 1, 2008 2,814 2,785 5,599 -
Cash and cash equivalents, June 30 3,462$ 5,176$ 8,638$ 5,599$
Non cash transactionsDepreciation and amortization expense -$ -$ -$ (4)$ Contributed capital - - - 4,295 Gain on disposal of assets - (13) (13) -
Total non cash transactions -$ (13)$ (13)$ 4,291$
Reconciliation of operating income to net cash provided (used)by operating activities
Operating income (loss) (13,404)$ 8,344$ (5,060)$ (4,139)$ Adjustments to reconcile operating income to net cash
provided by operating activitiesDepreciation and amortization 4,235 288 4,523 4,680 Other post employment benefits - 268 268 Other revenues 9,449 443 9,892 8,588 Changes in assets and liabilities
Accounts receivable 365 (7) 358 1,523 Due from other funds - (9) (9) - Accounts payable 215 34 249 (895) Accrued payroll liabilities - 25 25 88 Claims for workers' compensation - 11 11 - Compensated absences - 22 22 180 Pension obligation payable - 97 97 365
Net cash used for operating activities 860$ 9,516$ 10,376$ 10,390$
(With comparative amounts for 2008)amounts expressed in thousands
CITY OF HOUSTON, TEXASNONMAJOR ENTERPRISE FUNDS
Statement of Cash FlowsFor the Year Ended June 30, 2009
- 166 -

INTE
RNAL
SER
VICE
FUN
DS
- 167 -
Internal Service Funds
Internal service funds are used to account for the financing of goods or services provided by one city department to other city departments on a cost reimbursement basis. Health Benefits — This fund is used to account for the costs incurred to provide City employees’ health care and life insurance benefits. Long-Term Disability — This fund is used to account for the costs incurred to provide City employees’ long-term disability coverage.

Health BenefitsLong-term Disability 2009 2008
Assets
Equity in pooled cash and investments 4,035$ 11,331$ 15,366$ 17,789$ Receivables, net of allowances
Accounts receivable 1 - 1 1
Due from other funds 6 - 6 -
Due from other governments 1,061 - 1,061 -
Prepaid items 3 - 3 -
Total current assets 5,106 11,331 16,437 17,790
Capital assets
Buildings, improvements and equipment 6 - 6 -
Construction in progress 348 - 348 334
Total capital assets 354 - 354 334
Net capital assets 354 - 354 334
Total noncurrent assets 354 - 354 334
Total Assets 5,460 11,331 16,791 18,124
Liabilities
Current Liabilities
Accounts Payable 191 26 217 183
Accrued payroll liabilities 120 - 120 103
Due to other funds 1,123 1,605 2,728 -
Claims and judgments 995 2,055 3,050 2,816 Compensated absences 150 - 150 216
Unearned revenue 1,449 - 1,449 1,260
Total current liabilities 4,028 3,686 7,714 4,578
Noncurrent liabilities
Claims and judgments - 6,004 6,004 6,430
Compensated absences 140 - 140 42
Total noncurrent liabilities 140 6,004 6,144 6,472
Total liabilities 4,168 9,690 13,858 11,050
Net Assets
Investment in capital assets, net of related debt 354 - 354 334
Unrestricted 938 1,641 2,579 6,740
Total net assets 1,292$ 1,641$ 2,933$ 7,074$
amounts expressed in thousands
Combining Statement of Net Assets
CITY OF HOUSTON, TEXAS
INTERNAL SERVICE FUNDS
June 30, 2009
(With comparative totals for 2008)
- 168 -

Health BenefitsLong-term Disability 2009 2008
Operating RevenuesHealth benefit premiums 288,874$ -$ 288,874$ 266,475$
Total operating revenues 288,874 - 288,874 266,475
Operating ExpensesAdministrative costs 3,445 12 3,457 3,027 Claims Costs 288,491 775 289,266 265,254 Maintenance and operating - 243 243 -
Total operating expenses 291,936 1,030 292,966 268,281 Operating income (loss) (3,062) (1,030) (4,092) (1,806)
Nonoperating revenues (expenses)Investment income 391 560 951 1,282
Total Nonoperating revenues (expenses) 391 560 951 1,282
Income (loss) before contributions and transfers (2,671) (470) (3,141) (524)
Transfers out - (1,000) (1,000) - Total transfers - (1,000) (1,000) -
Change in net assets (2,671) (1,470) (4,141) (524) Total net assets (deficit), July 1 3,963 3,111 7,074 7,598
Total net assets, June 30 1,292$ 1,641$ 2,933$ 7,074$
amounts expressed in thousands
Combining Statement of Revenues, Expenses, and Changes in Net Assets
CITY OF HOUSTON, TEXASINTERNAL SERVICE FUNDS
For the Year Ended June 30, 2009(With comparative totals for 2008)
- 169 -
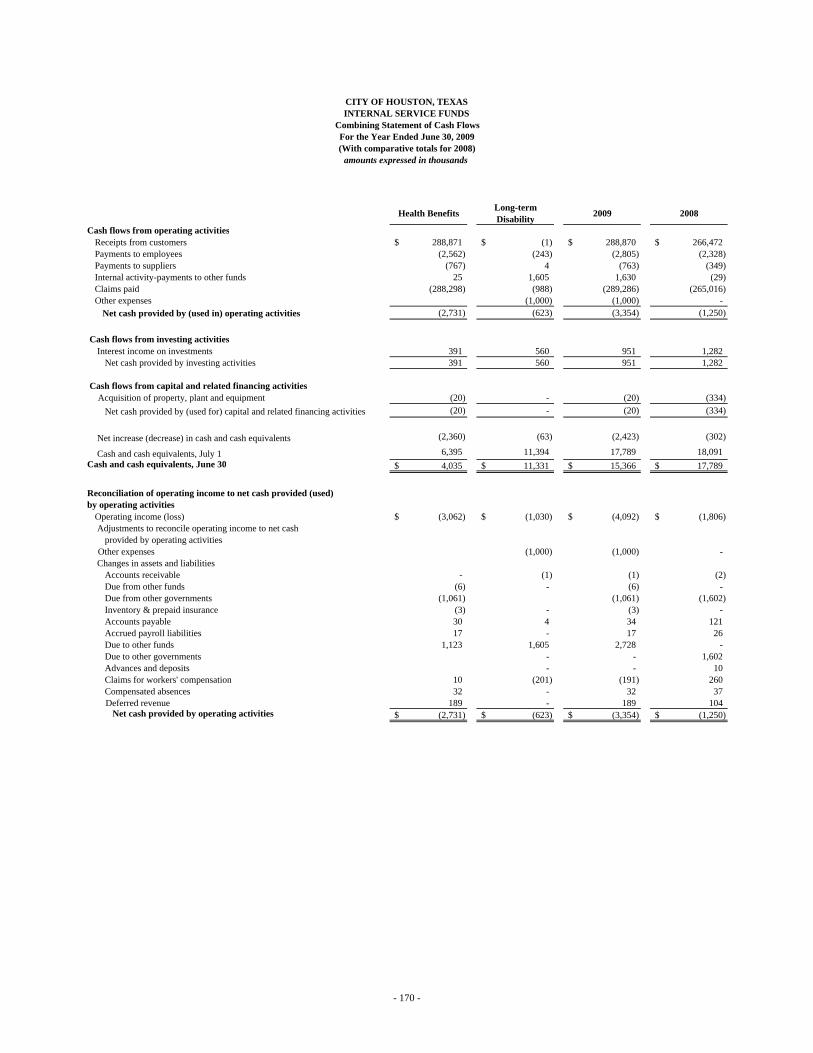
Health Benefits Long-term Disability 2009 2008
Cash flows from operating activitiesReceipts from customers 288,871$ (1)$ 288,870$ 266,472$ Payments to employees (2,562) (243) (2,805) (2,328) Payments to suppliers (767) 4 (763) (349) Internal activity-payments to other funds 25 1,605 1,630 (29) Claims paid (288,298) (988) (289,286) (265,016) Other expenses (1,000) (1,000) -
Net cash provided by (used in) operating activities (2,731) (623) (3,354) (1,250)
Cash flows from investing activities Interest income on investments 391 560 951 1,282
Net cash provided by investing activities 391 560 951 1,282
Cash flows from capital and related financing activities Acquisition of property, plant and equipment (20) - (20) (334)
Net cash provided by (used for) capital and related financing activities (20) - (20) (334)
Net increase (decrease) in cash and cash equivalents (2,360) (63) (2,423) (302)
Cash and cash equivalents, July 1 6,395 11,394 17,789 18,091 Cash and cash equivalents, June 30 4,035$ 11,331$ 15,366$ 17,789$
Reconciliation of operating income to net cash provided (used)by operating activities
Operating income (loss) (3,062)$ (1,030)$ (4,092)$ (1,806)$ Adjustments to reconcile operating income to net cash
provided by operating activities Other expenses (1,000) (1,000) -
Changes in assets and liabilities Accounts receivable - (1) (1) (2) Due from other funds (6) - (6) - Due from other governments (1,061) (1,061) (1,602) Inventory & prepaid insurance (3) - (3) - Accounts payable 30 4 34 121 Accrued payroll liabilities 17 - 17 26 Due to other funds 1,123 1,605 2,728 - Due to other governments - - 1,602 Advances and deposits - - 10 Claims for workers' compensation 10 (201) (191) 260 Compensated absences 32 - 32 37 Deferred revenue 189 - 189 104
Net cash provided by operating activities (2,731)$ (623)$ (3,354)$ (1,250)$
amounts expressed in thousands(With comparative totals for 2008)
CITY OF HOUSTON, TEXASINTERNAL SERVICE FUNDS
Combining Statement of Cash FlowsFor the Year Ended June 30, 2009
- 170 -

FIDU
CIAR
Y FU
NDS
- 171 -
Fiduciary Funds (Trust and Agency Funds)
Trust and Agency Funds are used to account for assets held by a government unit as trustee, or agent, for individuals, private organizations, other governmental units, and/or other funds.
Pension trust funds are used to account for the operation of the employee pension retirement programs. The funds include: Houston Firefighters’ Relief and Retirement, Houston Municipal Employees’, and Police Officers’ funds.
Agency funds are custodial in nature, and assets equal liabilities with no measure of the results of operations or financial position. Agency funds include: Payroll Revolving, City Deposits, and Tax Clearing Funds.
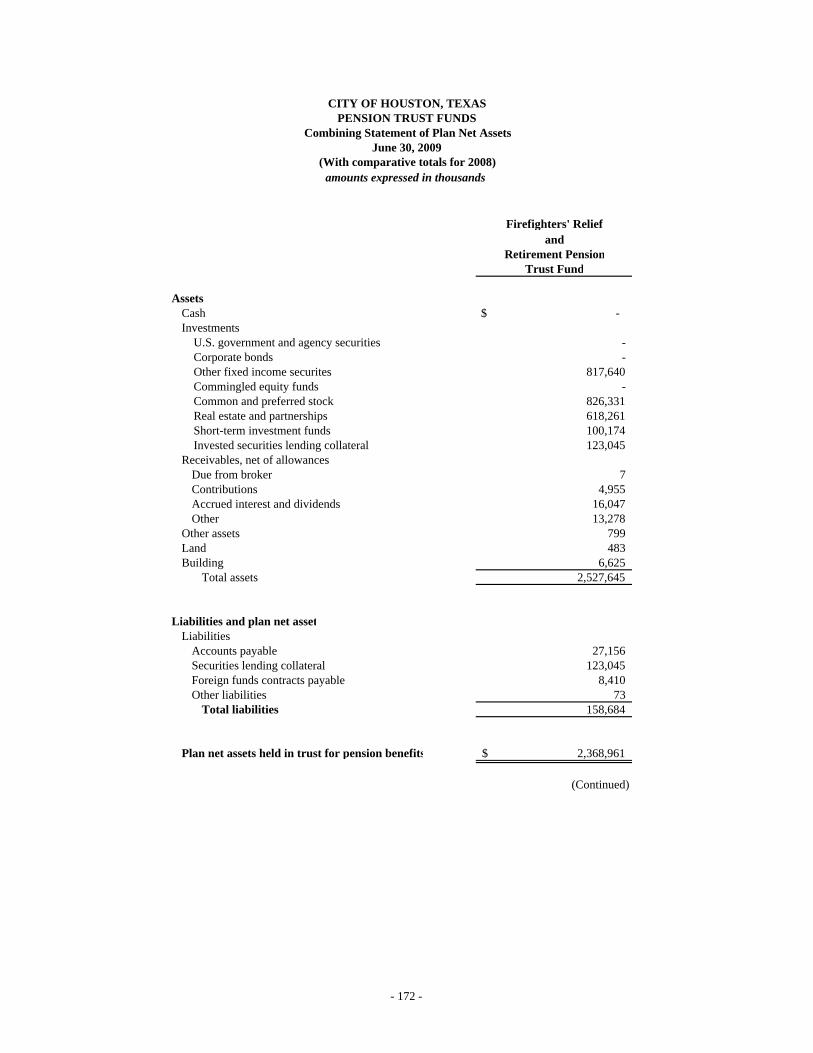
Firefighters' Reliefand
Retirement PensionTrust Fund
AssetsCash $ - Investments U.S. government and agency securities - Corporate bonds - Other fixed income securites 817,640 Commingled equity funds - Common and preferred stock 826,331 Real estate and partnerships 618,261 Short-term investment funds 100,174 Invested securities lending collateral 123,045 Receivables, net of allowances
Due from broker 7 Contributions 4,955 Accrued interest and dividends 16,047 Other 13,278
Other assets 799 Land 483 Building 6,625
Total assets 2,527,645
Liabilities and plan net assetLiabilities
Accounts payable 27,156 Securities lending collateral 123,045 Foreign funds contracts payable 8,410 Other liabilities 73
Total liabilities 158,684
Plan net assets held in trust for pension benefits 2,368,961$
(Continued)
CITY OF HOUSTON, TEXASPENSION TRUST FUNDS
Combining Statement of Plan Net AssetsJune 30, 2009
(With comparative totals for 2008)amounts expressed in thousands
- 172 -
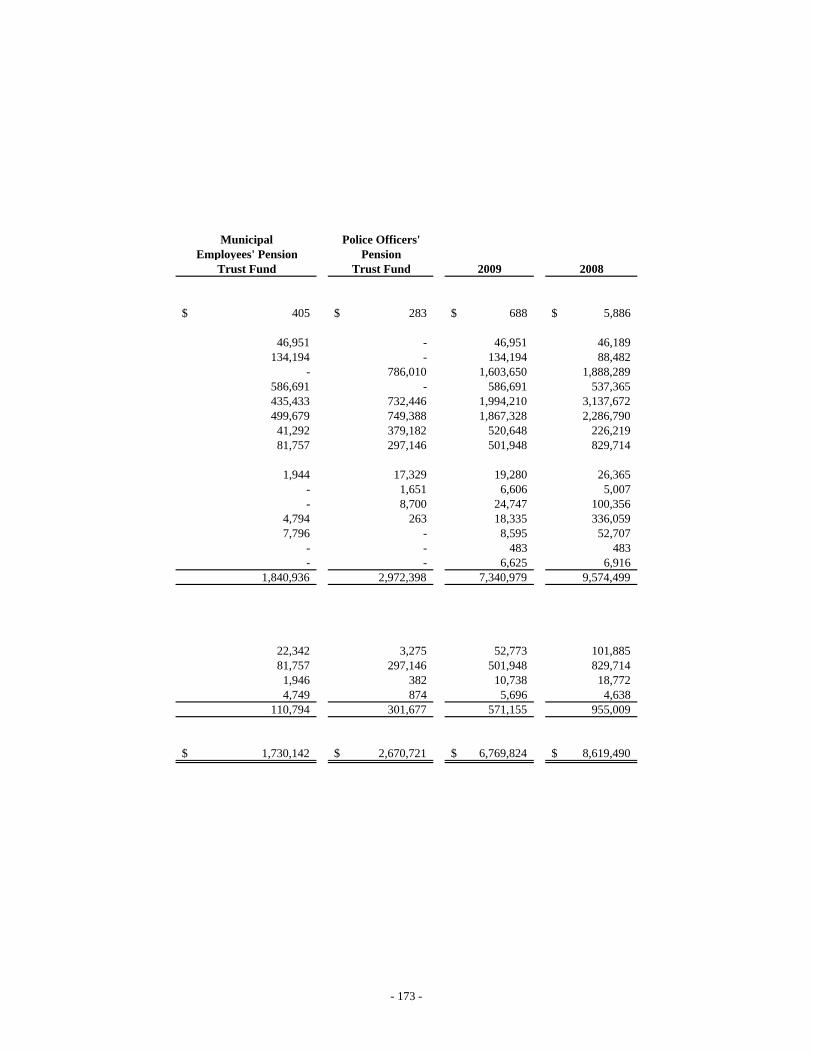
Municipal Police Officers'Employees' Pension Pension
Trust Fund Trust Fund 2009 2008
405$ 283$ 688$ 5,886$
46,951 - 46,951 46,189 134,194 - 134,194 88,482
- 786,010 1,603,650 1,888,289 586,691 - 586,691 537,365 435,433 732,446 1,994,210 3,137,672 499,679 749,388 1,867,328 2,286,790
41,292 379,182 520,648 226,219 81,757 297,146 501,948 829,714
1,944 17,329 19,280 26,365 - 1,651 6,606 5,007 - 8,700 24,747 100,356
4,794 263 18,335 336,059 7,796 - 8,595 52,707
- - 483 483 - - 6,625 6,916
1,840,936 2,972,398 7,340,979 9,574,499
22,342 3,275 52,773 101,885 81,757 297,146 501,948 829,714
1,946 382 10,738 18,772 4,749 874 5,696 4,638
110,794 301,677 571,155 955,009
1,730,142$ 2,670,721$ 6,769,824$ 8,619,490$
- 173 -
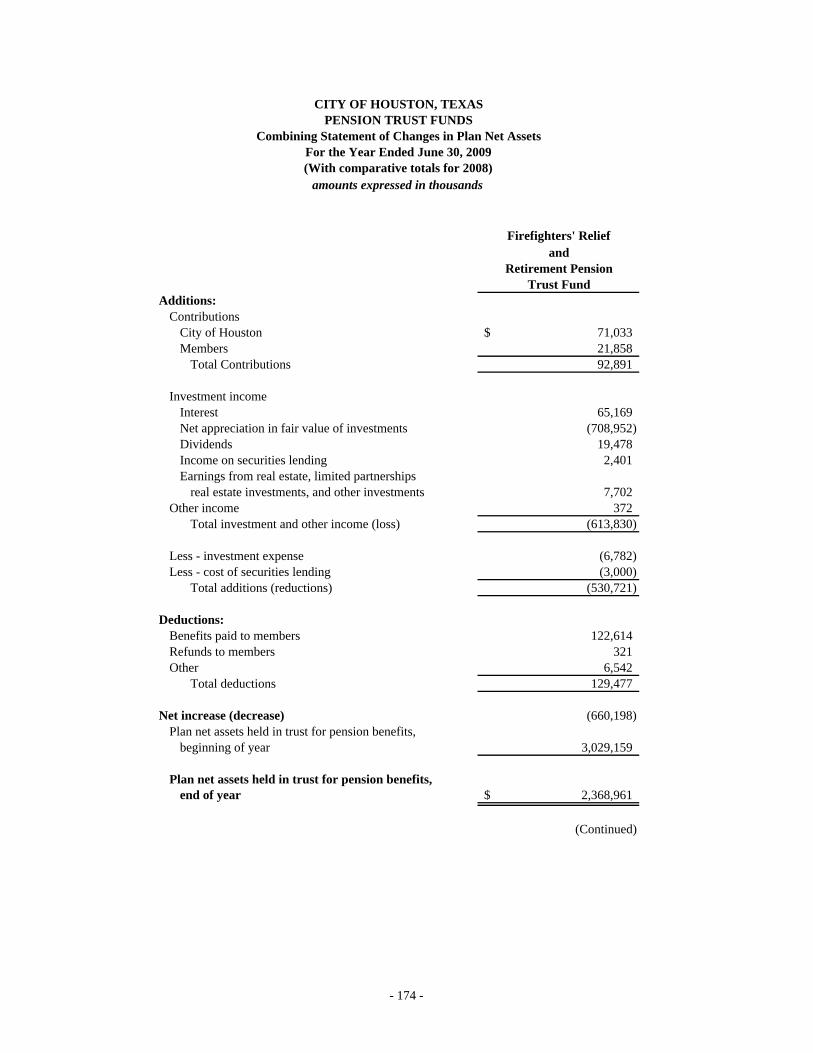
Firefighters' Reliefand
Retirement PensionTrust Fund
CITY OF HOUSTON, TEXASPENSION TRUST FUNDS
Combining Statement of Changes in Plan Net AssetsFor the Year Ended June 30, 2009(With comparative totals for 2008)
amounts expressed in thousands
Additions:Contributions
City of Houston 71,033$ Members 21,858
Total Contributions 92,891
Investment incomeInterest 65,169 Net appreciation in fair value of investments (708,952) Dividends 19,478 Income on securities lending 2,401 Earnings from real estate, limited partnerships
real estate investments, and other investments 7,702 Other income 372
Total investment and other income (loss) (613,830)
Less - investment expense (6,782) Less - cost of securities lending (3,000)
Total additions (reductions) (530,721)
Deductions:Benefits paid to members 122,614 Refunds to members 321 Other 6,542
Total deductions 129,477
Net increase (decrease) (660,198) Plan net assets held in trust for pension benefits,
beginning of year 3,029,159
Plan net assets held in trust for pension benefits,end of year 2,368,961$
(Continued)
- 174 -
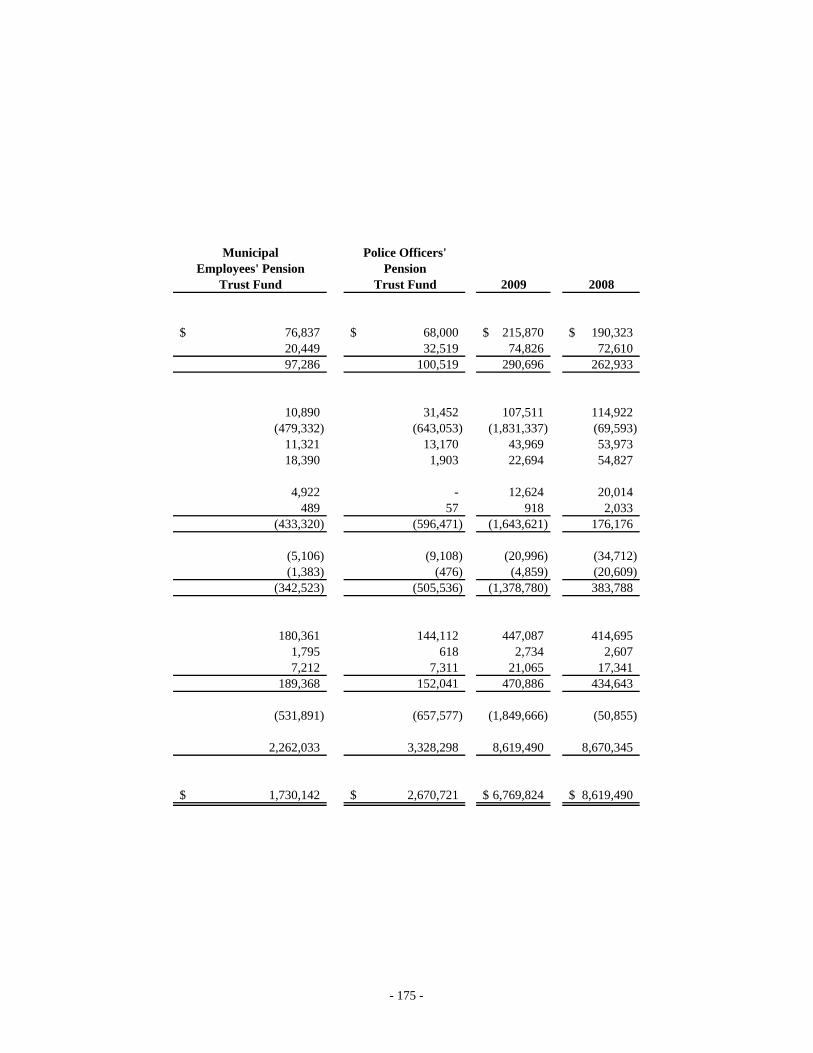
Municipal Police Officers'Employees' Pension Pension
Trust Fund Trust Fund 2009 2008
76,837$ 68,000$ 215,870$ 190,323$ 20,449 32,519 74,826 72,610 97,286 100,519 290,696 262,933
10,890 31,452 107,511 114,922 (479,332) (643,053) (1,831,337) (69,593)
11,321 13,170 43,969 53,973 18,390 1,903 22,694 54,827
4,922 - 12,624 20,014 489 57 918 2,033
(433,320) (596,471) (1,643,621) 176,176
(5,106) (9,108) (20,996) (34,712) (1,383) (476) (4,859) (20,609)
(342,523) (505,536) (1,378,780) 383,788
180,361 144,112 447,087 414,695 1,795 618 2,734 2,607 7,212 7,311 21,065 17,341
189,368 152,041 470,886 434,643
(531,891) (657,577) (1,849,666) (50,855)
2,262,033 3,328,298 8,619,490 8,670,345
1,730,142$ 2,670,721$ 6,769,824$ 8,619,490$
- 175 -
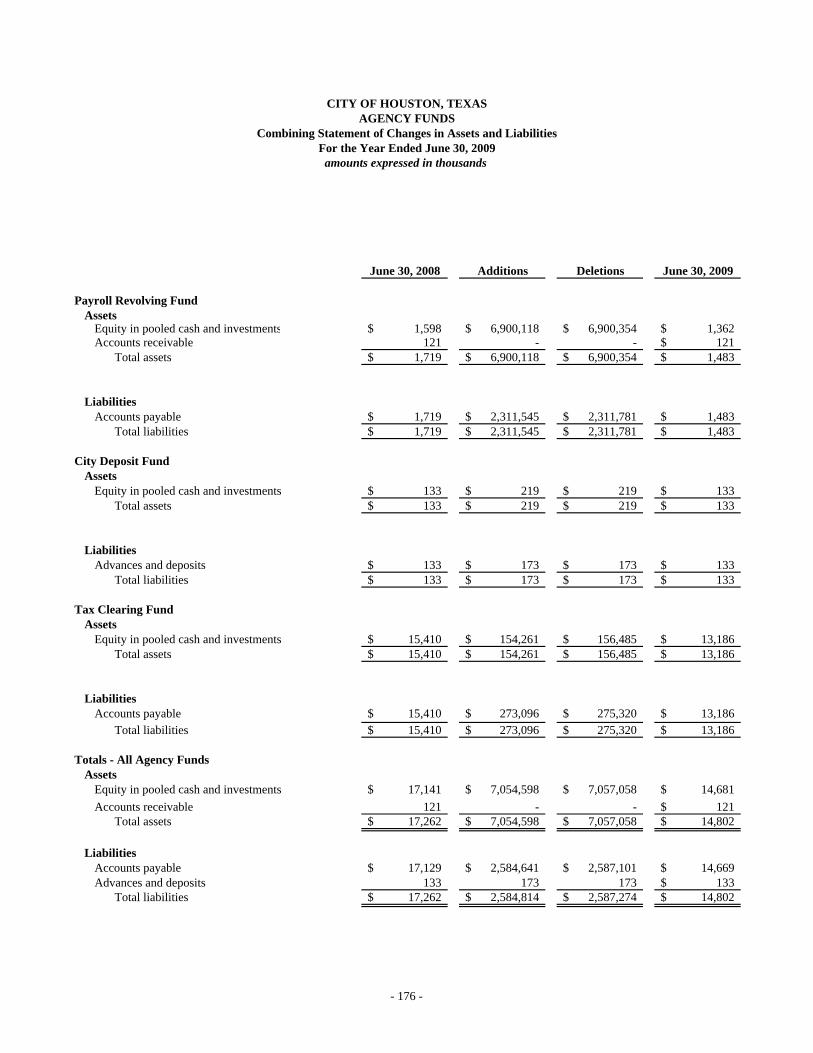
June 30, 2008 Additions Deletions June 30, 2009
Payroll Revolving FundAssets
Equity in pooled cash and investments 1,598$ 6,900,118$ 6,900,354$ 1,362$ Accounts receivable 121 - - 121$
Total assets 1,719$ 6,900,118$ 6,900,354$ 1,483$
LiabilitiesAccounts payable 1,719$ 2,311,545$ 2,311,781$ 1,483$
Total liabilities 1,719$ 2,311,545$ 2,311,781$ 1,483$
City Deposit FundAssets
Equity in pooled cash and investments 133$ 219$ 219$ 133$ Total assets 133$ 219$ 219$ 133$
LiabilitiesAdvances and deposits 133$ 173$ 173$ 133$
Total liabilities 133$ 173$ 173$ 133$
Tax Clearing FundAssets
Equity in pooled cash and investments 15,410$ 154,261$ 156,485$ 13,186$ Total assets 15,410$ 154,261$ 156,485$ 13,186$
LiabilitiesAccounts payable 15,410$ 273,096$ 275,320$ 13,186$
Total liabilities 15,410$ 273,096$ 275,320$ 13,186$
Totals - All Agency FundsAssets
Equity in pooled cash and investments 17,141$ 7,054,598$ 7,057,058$ 14,681$ Accounts receivable 121 - - 121$
Total assets 17,262$ 7,054,598$ 7,057,058$ 14,802$
LiabilitiesAccounts payable 17,129$ 2,584,641$ 2,587,101$ 14,669$ Advances and deposits 133 173 173 133$
Total liabilities 17,262$ 2,584,814$ 2,587,274$ 14,802$
CITY OF HOUSTON, TEXASAGENCY FUNDS
For the Year Ended June 30, 2009amounts expressed in thousands
Combining Statement of Changes in Assets and Liabilities
- 176 -

COM
PONE
NT U
NITS
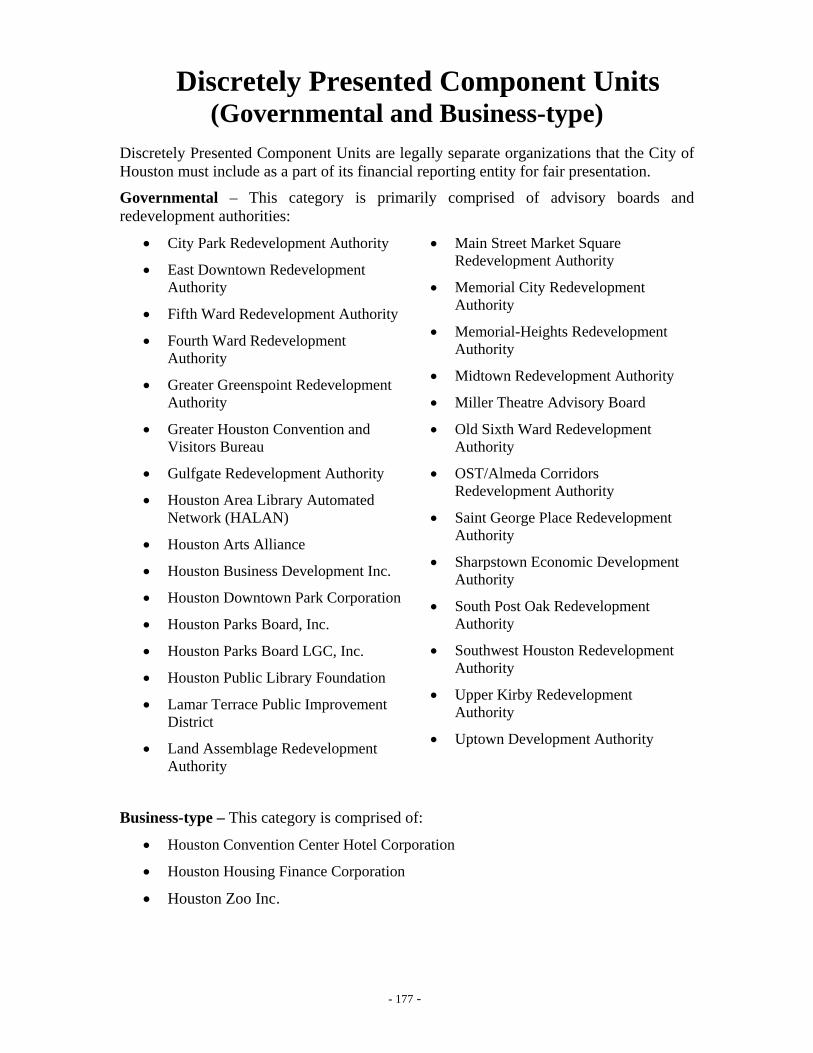
- 177 -
Discretely Presented Component Units (Governmental and Business-type)
Discretely Presented Component Units are legally separate organizations that the City of Houston must include as a part of its financial reporting entity for fair presentation.
Governmental – This category is primarily comprised of advisory boards and redevelopment authorities:
• City Park Redevelopment Authority
• East Downtown Redevelopment Authority
• Fifth Ward Redevelopment Authority
• Fourth Ward Redevelopment Authority
• Greater Greenspoint Redevelopment Authority
• Greater Houston Convention and Visitors Bureau
• Gulfgate Redevelopment Authority
• Houston Area Library Automated Network (HALAN)
• Houston Arts Alliance
• Houston Business Development Inc.
• Houston Downtown Park Corporation
• Houston Parks Board, Inc.
• Houston Parks Board LGC, Inc.
• Houston Public Library Foundation
• Lamar Terrace Public Improvement District
• Land Assemblage Redevelopment Authority
• Main Street Market Square Redevelopment Authority
• Memorial City Redevelopment Authority
• Memorial-Heights Redevelopment Authority
• Midtown Redevelopment Authority
• Miller Theatre Advisory Board
• Old Sixth Ward Redevelopment Authority
• OST/Almeda Corridors Redevelopment Authority
• Saint George Place Redevelopment Authority
• Sharpstown Economic Development Authority
• South Post Oak Redevelopment Authority
• Southwest Houston Redevelopment Authority
• Upper Kirby Redevelopment Authority
• Uptown Development Authority
Business-type – This category is comprised of:
• Houston Convention Center Hotel Corporation
• Houston Housing Finance Corporation
• Houston Zoo Inc.
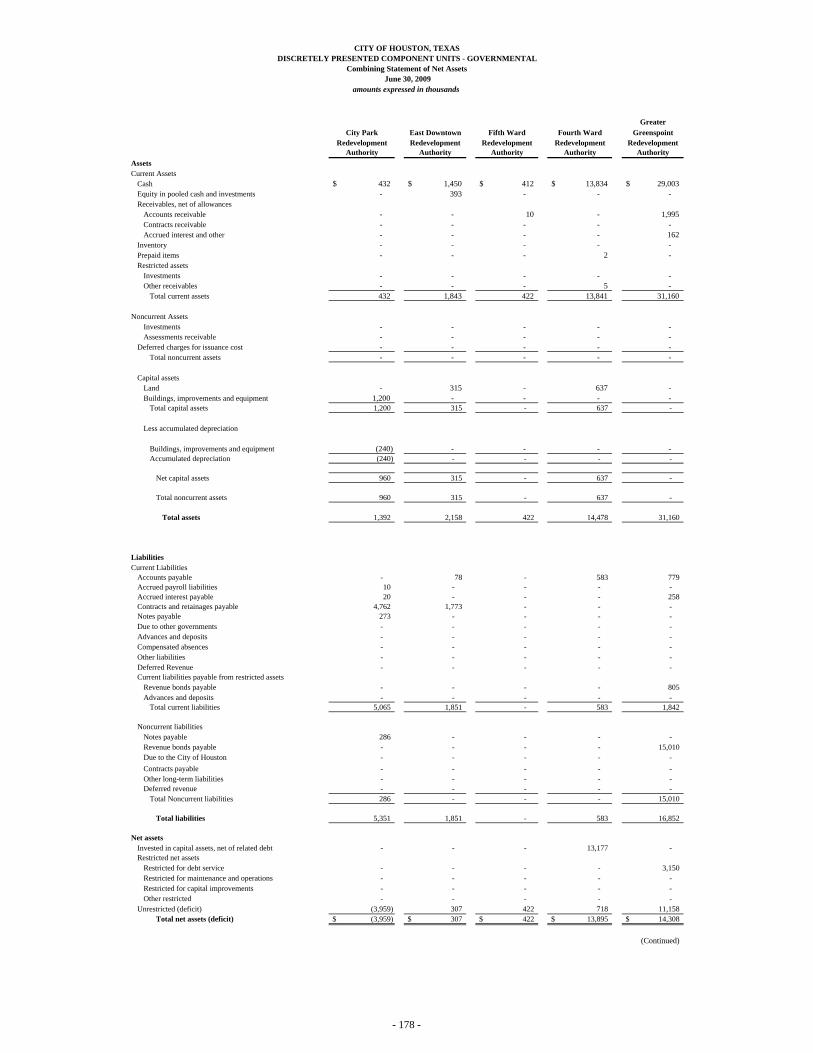
GreaterCity Park East Downtown Fifth Ward Fourth Ward Greenspoint
Redevelopment Redevelopment Redevelopment Redevelopment RedevelopmentAuthority Authority Authority Authority Authority
AssetsCurrent Assets
Cash 432$ 1,450$ 412$ 13,834$ 29,003$ Equity in pooled cash and investments - 393 - - - Receivables, net of allowances
Accounts receivable - - 10 - 1,995 Contracts receivable - - - - - Accrued interest and other - - - - 162
Inventory - - - - - Prepaid items - - - 2 - Restricted assets
Investments - - - - - Other receivables - - - 5 -
Total current assets 432 1,843 422 13,841 31,160
Noncurrent AssetsInvestments - - - - - Assessments receivable - - - - -
Deferred charges for issuance cost - - - - - Total noncurrent assets - - - - -
Capital assetsLand - 315 - 637 - Buildings, improvements and equipment 1,200 - - - -
Total capital assets 1,200 315 - 637 -
Less accumulated depreciation
Buildings, improvements and equipment (240) - - - - Accumulated depreciation (240) - - - -
Net capital assets 960 315 - 637 -
Total noncurrent assets 960 315 - 637 -
Total assets 1,392 2,158 422 14,478 31,160
LiabilitiesCurrent Liabilities
Accounts payable - 78 - 583 779 Accrued payroll liabilities 10 - - - - Accrued interest payable 20 - - - 258 Contracts and retainages payable 4,762 1,773 - - - Notes payable 273 - - - - Due to other governments - - - - - Advances and deposits - - - - - Compensated absences - - - - - Other liabilities - - - - - Deferred Revenue - - - - - Current liabilities payable from restricted assets
Revenue bonds payable - - - - 805 Advances and deposits - - - - -
Total current liabilities 5,065 1,851 - 583 1,842
Noncurrent liabilitiesNotes payable 286 - - - - Revenue bonds payable - - - - 15,010 Due to the City of Houston - - - - - Contracts payable - - - - - Other long-term liabilities - - - - - Deferred revenue - - - - -
Total Noncurrent liabilities 286 - - - 15,010
Total liabilities 5,351 1,851 - 583 16,852
Net assetsInvested in capital assets, net of related debt - - - 13,177 - Restricted net assets
Restricted for debt service - - - - 3,150 Restricted for maintenance and operations - - - - - Restricted for capital improvements - - - - - Other restricted - - - - -
Unrestricted (deficit) (3,959) 307 422 718 11,158 Total net assets (deficit) (3,959)$ 307$ 422$ 13,895$ 14,308$
(Continued)
CITY OF HOUSTON, TEXASDISCRETELY PRESENTED COMPONENT UNITS - GOVERNMENTAL
Combining Statement of Net Assets June 30, 2009
amounts expressed in thousands
- 178 -
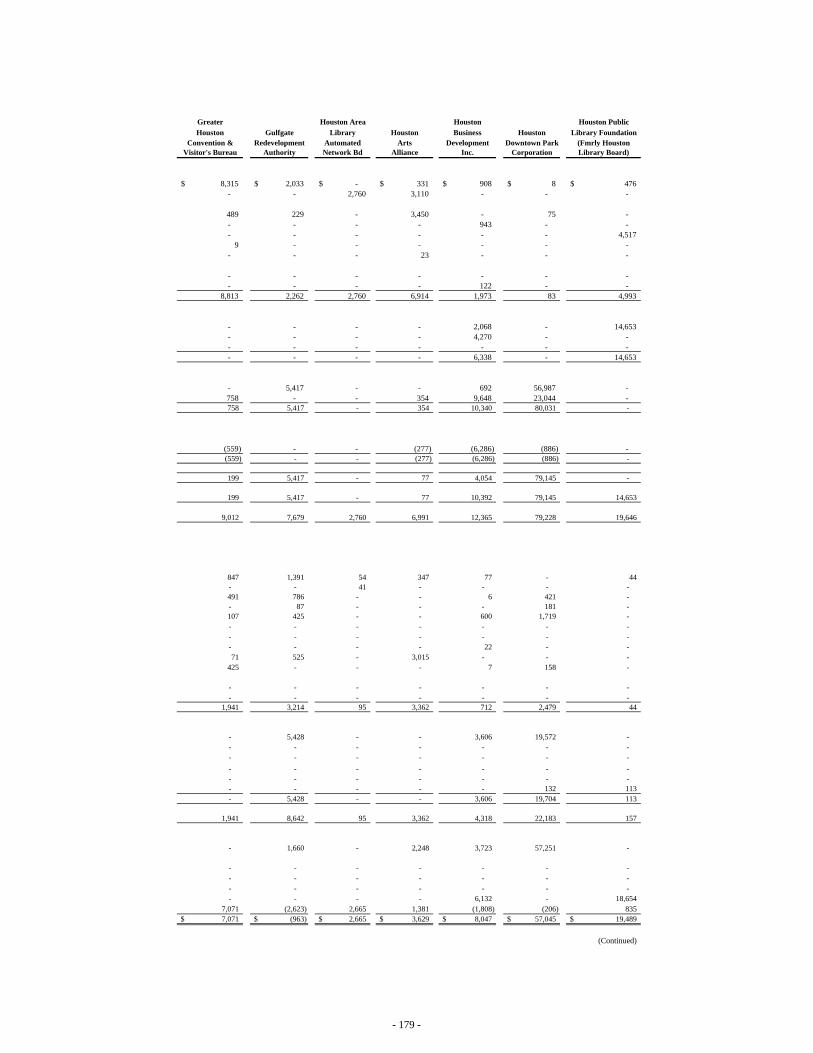
Greater Houston Area Houston Houston PublicHouston Gulfgate Library Houston Business Houston Library Foundation
Convention & Redevelopment Automated Arts Development Downtown Park (Fmrly HoustonVisitor's Bureau Authority Network Bd Alliance Inc. Corporation Library Board)
8,315$ 2,033$ -$ 331$ 908$ 8$ 476$ - - 2,760 3,110 - - -
489 229 - 3,450 - 75 - - - - - 943 - - - - - - - - 4,517
9 - - - - - - - - - 23 - - -
- - - - - - - - - - - 122 - -
8,813 2,262 2,760 6,914 1,973 83 4,993
- - - - 2,068 - 14,653 - - - - 4,270 - - - - - - - - - - - - - 6,338 - 14,653
- 5,417 - - 692 56,987 - 758 - - 354 9,648 23,044 - 758 5,417 - 354 10,340 80,031 -
(559) - - (277) (6,286) (886) - (559) - - (277) (6,286) (886) -
199 5,417 - 77 4,054 79,145 -
199 5,417 - 77 10,392 79,145 14,653
9,012 7,679 2,760 6,991 12,365 79,228 19,646
847 1,391 54 347 77 - 44 - - 41 - - - - 491 786 - - 6 421 - - 87 - - - 181 - 107 425 - - 600 1,719 - - - - - - - - - - - - - - - - - - - 22 - - 71 525 - 3,015 - - -
425 - - - 7 158 -
- - - - - - - - - - - - - -
1,941 3,214 95 3,362 712 2,479 44
- 5,428 - - 3,606 19,572 - - - - - - - - - - - - - - - - - - - - - - - - - - - - - - - - - - 132 113 - 5,428 - - 3,606 19,704 113
1,941 8,642 95 3,362 4,318 22,183 157
- 1,660 - 2,248 3,723 57,251 -
- - - - - - - - - - - - - - - - - - - - - - - - - 6,132 - 18,654
7,071 (2,623) 2,665 1,381 (1,808) (206) 835 7,071$ (963)$ 2,665$ 3,629$ 8,047$ 57,045$ 19,489$
(Continued)
- 179 -
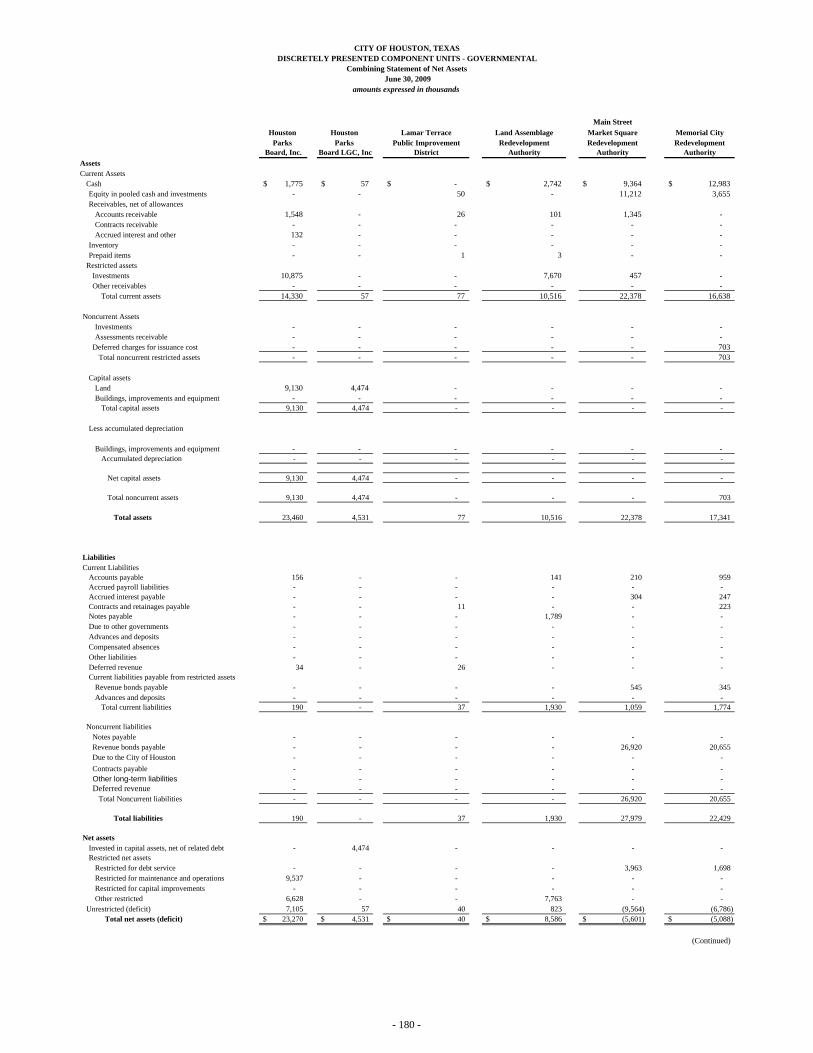
Main StreetHouston Houston Lamar Terrace Land Assemblage Market Square Memorial City
Parks Parks Public Improvement Redevelopment Redevelopment RedevelopmentBoard, Inc. Board LGC, Inc District Authority Authority Authority
AssetsCurrent Assets
Cash 1,775$ 57$ -$ 2,742$ 9,364$ 12,983$ Equity in pooled cash and investments - - 50 - 11,212 3,655 Receivables, net of allowances
Accounts receivable 1,548 - 26 101 1,345 - Contracts receivable - - - - - - Accrued interest and other 132 - - - - -
Inventory - - - - - - Prepaid items - - 1 3 - -
Restricted assetsInvestments 10,875 - - 7,670 457 - Other receivables - - - - - -
Total current assets 14,330 57 77 10,516 22,378 16,638
Noncurrent AssetsInvestments - - - - - - Assessments receivable - - - - - -
Deferred charges for issuance cost - - - - - 703 Total noncurrent restricted assets - - - - - 703
Capital assetsLand 9,130 4,474 - - - - Buildings, improvements and equipment - - - - - -
Total capital assets 9,130 4,474 - - - -
Less accumulated depreciation
Buildings, improvements and equipment - - - - - - Accumulated depreciation - - - - - -
Net capital assets 9,130 4,474 - - - -
Total noncurrent assets 9,130 4,474 - - - 703
Total assets 23,460 4,531 77 10,516 22,378 17,341
LiabilitiesCurrent Liabilities
Accounts payable 156 - - 141 210 959 Accrued payroll liabilities - - - - - - Accrued interest payable - - - - 304 247 Contracts and retainages payable - - 11 - - 223 Notes payable - - - 1,789 - - Due to other governments - - - - - - Advances and deposits - - - - - - Compensated absences - - - - - - Other liabilities - - - - - - Deferred revenue 34 - 26 - - - Current liabilities payable from restricted assets
Revenue bonds payable - - - - 545 345 Advances and deposits - - - - - -
Total current liabilities 190 - 37 1,930 1,059 1,774
Noncurrent liabilitiesNotes payable - - - - - - Revenue bonds payable - - - - 26,920 20,655 Due to the City of Houston - - - - - - Contracts payable - - - - - - Other long-term liabilities - - - - - - Deferred revenue - - - - - -
Total Noncurrent liabilities - - - - 26,920 20,655
Total liabilities 190 - 37 1,930 27,979 22,429
Net assetsInvested in capital assets, net of related debt - 4,474 - - - - Restricted net assets
Restricted for debt service - - - - 3,963 1,698 Restricted for maintenance and operations 9,537 - - - - - Restricted for capital improvements - - - - - - Other restricted 6,628 - - 7,763 - -
Unrestricted (deficit) 7,105 57 40 823 (9,564) (6,786) Total net assets (deficit) 23,270$ 4,531$ 40$ 8,586$ (5,601)$ (5,088)$
(Continued)
DISCRETELY PRESENTED COMPONENT UNITS - GOVERNMENTALCombining Statement of Net Assets
CITY OF HOUSTON, TEXAS
June 30, 2009amounts expressed in thousands
- 180 -

Memorial- Old Sixth OST/Almeda SharpstownHeights Midtown Miller Theatre Ward Corridors Saint George Place Economic
Redevelopment Redevelopment Advisory Redevelpoment Redevelopment Redevelopment DevelopmentAuthority Authority Board, Inc. Authority Authority Authority Authority
3,354 59$ 1,114$ 905$ 8$ 1,342$ -$ - 27,504 - - 13,895 229 -
- 6,890 1,250 111 - 233 - - - - - - - - - - - - 991 - - - 19,507 - - 1,104 - - - - - - - - -
- - - - - - - - - 20 - - - -
3,354 53,960 2,384 1,016 15,998 1,804 -
- - - - - - - - - - - - - - - 1,714 - - 428 204 - - 1,714 - - 428 204 -
- 3,692 - - 1,725 - - - 6,240 - - 27 - - - 9,932 - - 1,752 - -
- (1,562) - - (18) - - - (1,562) - - (18) - -
- 8,370 - - 1,734 - -
- 10,084 - - 2,162 204 -
3,354 64,044 2,384 1,016 18,160 2,008 -
763 1,376 10 19 915 48 - - - 2 - - - - - 1,296 - 16 - 35 - - - 236 - - - - - - - 101 - - - - - - - - - - 192 - - - - - - - - - - - - - - 308 - - - - - - - - - - 233 -
- 2,170 - - 375 110 - - - - - - - - 955 5,150 248 136 1,290 426 -
- - - 468 - - - - 49,405 - - 5,850 1,900 - - - - - - 5,310 - - - - - - - - - - - - 728 - - - - - - - - - - 49,405 - 468 6,578 7,210 -
955 54,555 248 604 7,868 7,636 -
- 5,694 - - 2,838 - -
- 9,678 - - 1,348 189 - - - - - - - - - 7,119 - - - - - - 19,305 1,723 - - 87 -
2,399 (32,307) 413 412 6,106 (5,904) - 2,399$ 9,489$ 2,136$ 412$ 10,292$ (5,628)$ -$
(Continued) (Continued)
- 181 -
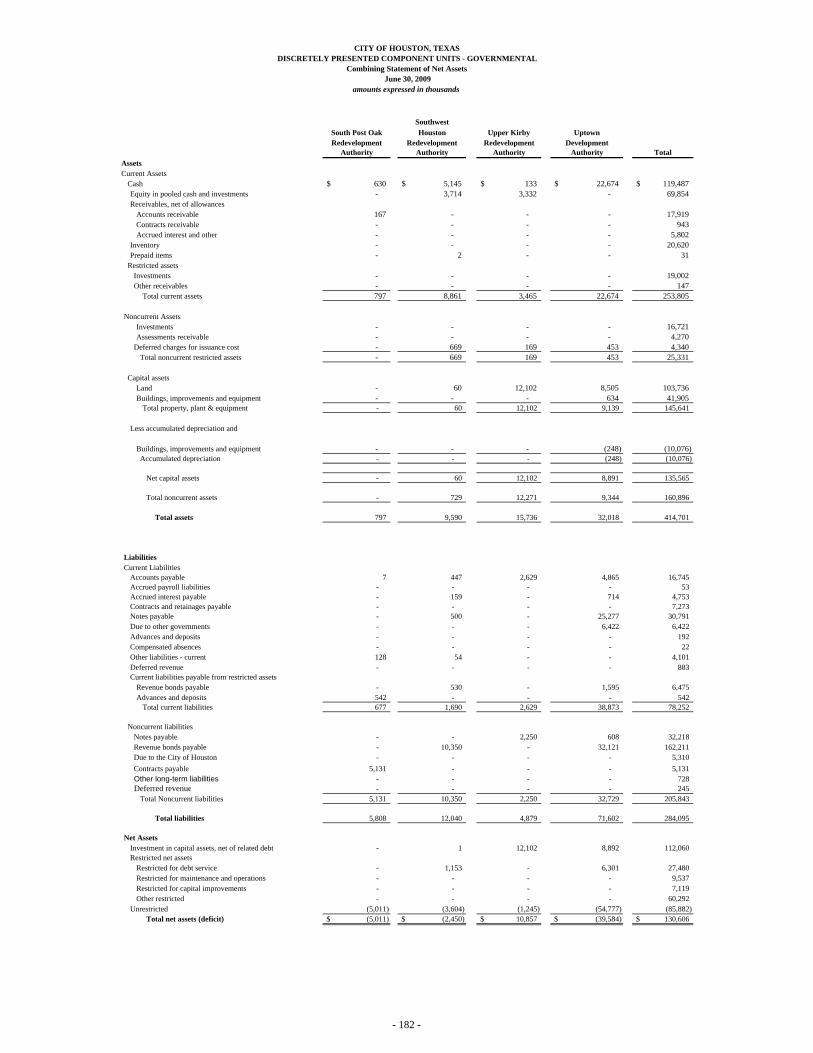
SouthwestSouth Post Oak Houston Upper Kirby UptownRedevelopment Redevelopment Redevelopment Development
Authority Authority Authority Authority TotalAssetsCurrent Assets
Cash 630$ 5,145$ 133$ 22,674$ 119,487$ Equity in pooled cash and investments - 3,714 3,332 - 69,854 Receivables, net of allowances
Accounts receivable 167 - - - 17,919 Contracts receivable - - - - 943 Accrued interest and other - - - - 5,802
Inventory - - - - 20,620 Prepaid items - 2 - - 31
Restricted assetsInvestments - - - - 19,002 Other receivables - - - - 147
Total current assets 797 8,861 3,465 22,674 253,805
Noncurrent AssetsInvestments - - - - 16,721 Assessments receivable - - - - 4,270
Deferred charges for issuance cost - 669 169 453 4,340 Total noncurrent restricted assets - 669 169 453 25,331
Capital assetsLand - 60 12,102 8,505 103,736 Buildings, improvements and equipment - - - 634 41,905
Total property, plant & equipment - 60 12,102 9,139 145,641
Less accumulated depreciation and
Buildings, improvements and equipment - - - (248) (10,076) Accumulated depreciation - - - (248) (10,076)
Net capital assets - 60 12,102 8,891 135,565
Total noncurrent assets - 729 12,271 9,344 160,896
Total assets 797 9,590 15,736 32,018 414,701
LiabilitiesCurrent Liabilities
Accounts payable 7 447 2,629 4,865 16,745 Accrued payroll liabilities - - - - 53 Accrued interest payable - 159 - 714 4,753 Contracts and retainages payable - - - - 7,273 Notes payable - 500 - 25,277 30,791 Due to other governments - - - 6,422 6,422 Advances and deposits - - - - 192 Compensated absences - - - - 22 Other liabilities - current 128 54 - - 4,101 Deferred revenue - - - - 883 Current liabilities payable from restricted assets
Revenue bonds payable - 530 - 1,595 6,475 Advances and deposits 542 - - - 542
Total current liabilities 677 1,690 2,629 38,873 78,252
Noncurrent liabilitiesNotes payable - - 2,250 608 32,218 Revenue bonds payable - 10,350 - 32,121 162,211 Due to the City of Houston - - - - 5,310 Contracts payable 5,131 - - - 5,131 Other long-term liabilities - - - - 728 Deferred revenue - - - - 245
Total Noncurrent liabilities 5,131 10,350 2,250 32,729 205,843
Total liabilities 5,808 12,040 4,879 71,602 284,095
Net AssetsInvestment in capital assets, net of related debt - 1 12,102 8,892 112,060 Restricted net assets
Restricted for debt service - 1,153 - 6,301 27,480 Restricted for maintenance and operations - - - - 9,537 Restricted for capital improvements - - - - 7,119 Other restricted - - - - 60,292
Unrestricted (5,011) (3,604) (1,245) (54,777) (85,882) Total net assets (deficit) (5,011)$ (2,450)$ 10,857$ (39,584)$ 130,606$
CITY OF HOUSTON, TEXASDISCRETELY PRESENTED COMPONENT UNITS - GOVERNMENTAL
Combining Statement of Net Assets June 30, 2009
amounts expressed in thousands
- 182 -
CITY OF HOUSTON, TEXAS
This page is left blank intentionally
- 183 -
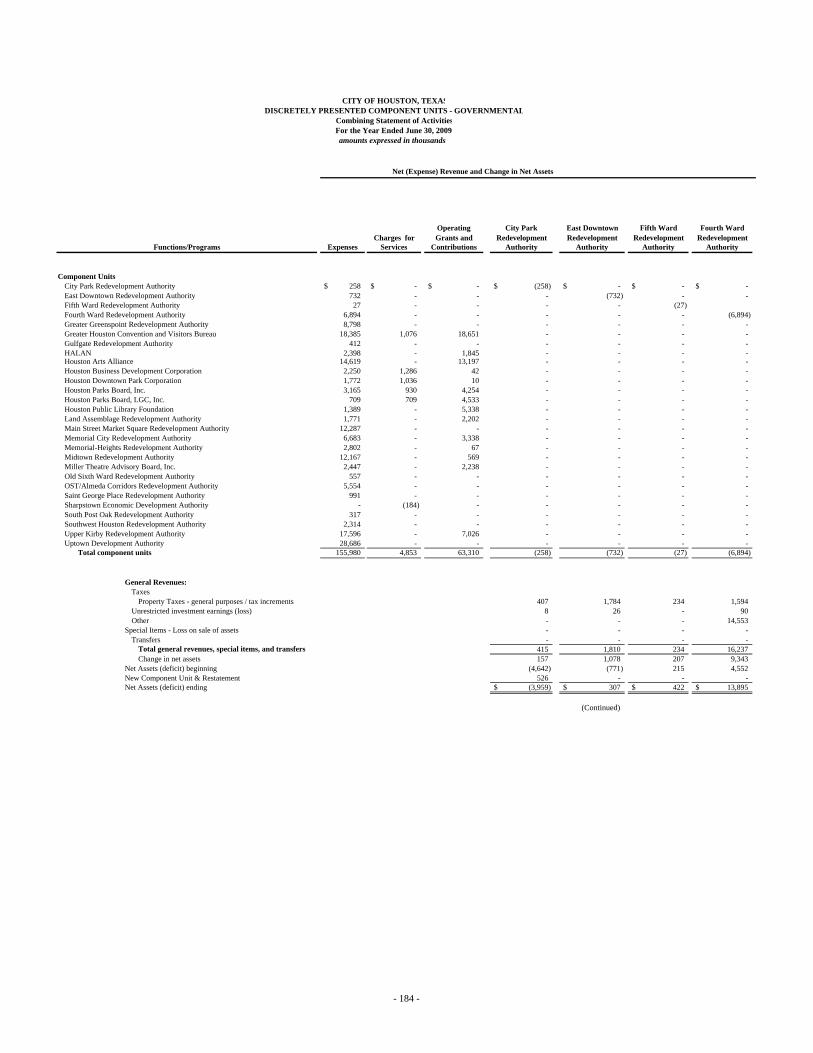
CITY OF HOUSTON, TEXASDISCRETELY PRESENTED COMPONENT UNITS - GOVERNMENTAL
Combining Statement of ActivitiesFor the Year Ended June 30, 2009amounts expressed in thousands
Operating City Park East Downtown Fifth Ward Fourth WardCharges for Grants and Redevelopment Redevelopment Redevelopment Redevelopment
Functions/Programs Expenses Services Contributions Authority Authority Authority Authority
Component UnitsCity Park Redevelopment Authority 258$ -$ -$ (258)$ -$ -$ -$ East Downtown Redevelopment Authority 732 - - - (732) - - Fifth Ward Redevelopment Authority 27 - - - - (27) Fourth Ward Redevelopment Authority 6,894 - - - - - (6,894) Greater Greenspoint Redevelopment Authority 8,798 - - - - - - Greater Houston Convention and Visitors Bureau 18,385 1,076 18,651 - - - - Gulfgate Redevelopment Authority 412 - - - - - - HALAN 2,398 - 1,845 - - - - Houston Arts Alliance 14,619 - 13,197 - - - - Houston Business Development Corporation 2,250 1,286 42 - - - - Houston Downtown Park Corporation 1,772 1,036 10 - - - - Houston Parks Board, Inc. 3,165 930 4,254 - - - - Houston Parks Board, LGC, Inc. 709 709 4,533 - - - - Houston Public Library Foundation 1,389 - 5,338 - - - - Land Assemblage Redevelopment Authority 1,771 - 2,202 - - - - Main Street Market Square Redevelopment Authority 12,287 - - - - - - Memorial City Redevelopment Authority 6,683 - 3,338 - - - - Memorial-Heights Redevelopment Authority 2,802 - 67 - - - - Midtown Redevelopment Authority 12,167 - 569 - - - - Miller Theatre Advisory Board, Inc. 2,447 - 2,238 - - - - Old Sixth Ward Redevelopment Authority 557 - - - - - - OST/Almeda Corridors Redevelopment Authority 5,554 - - - - - - Saint George Place Redevelopment Authority 991 - - - - - - Sharpstown Economic Development Authority - (184) - - - - - South Post Oak Redevelopment Authority 317 - - - - - - Southwest Houston Redevelopment Authority 2,314 - - - - - - Upper Kirby Redevelopment Authority 17,596 - 7,026 - - - - Uptown Development Authority 28,686 - - - - - -
Total component units 155,980 4,853 63,310 (258) (732) (27) (6,894)
General Revenues:Taxes
Property Taxes - general purposes / tax increments 407 1,784 234 1,594 Unrestricted investment earnings (loss) 8 26 - 90 Other - - - 14,553
Special Items - Loss on sale of assets - - - - Transfers - - - -
Total general revenues, special items, and transfers 415 1,810 234 16,237 Change in net assets 157 1,078 207 9,343
Net Assets (deficit) beginning (4,642) (771) 215 4,552 New Component Unit & Restatement 526 - - - Net Assets (deficit) ending (3,959)$ 307$ 422$ 13,895$
(Continued)
Net (Expense) Revenue and Change in Net Assets
- 184 -

Greater Greater HoustonGreenspoint Houston Gulfgate Houston Business Houston
Redevelopment Convention & Redevelopment Arts Development Downtown Park Authority Visitor's Bureau Authority HALAN Alliance Inc. Corporation
-$ -$ -$ -$ -$ -$ -$ - - - - - - - - - - - - - - - - - - - - -
(8,798) - - - - - - - 1,342 - - - - - - - (412) - - - - - - - (553) - - - - - - - (1,422) - - - - - - - (922) - - - - - - - (726) - - - - - - - - - - - - - - - - - - - - - - - - - - - - - - - - - - - - - - - - - - - - - - - - - - - - - - - - - - - - - - - - - - - - - - - - - - - - - - - - - - - - - - - - - - - - - - - - - - - - - - - - - - - - - - - - - - - - - - -
(8,798) 1,342 (412) (553) (1,422) (922) (726)
11,212 - 988 - - - - 168 205 - 141 - 371 -
- - 29 2 1,925 266 - - - - - - - - - - - - - - -
11,380 205 1,017 143 1,925 637 - 2,582 1,547 605 (410) 503 (285) (726)
11,726 5,524 (1,666) 3,075 3,126 8,332 57,572 - - 98 - - - 199
14,308$ 7,071$ (963)$ 2,665$ 3,629$ 8,047$ 57,045$
(Continued)
Net (Expense) Revenue and Change in Net Assets
- 185 -
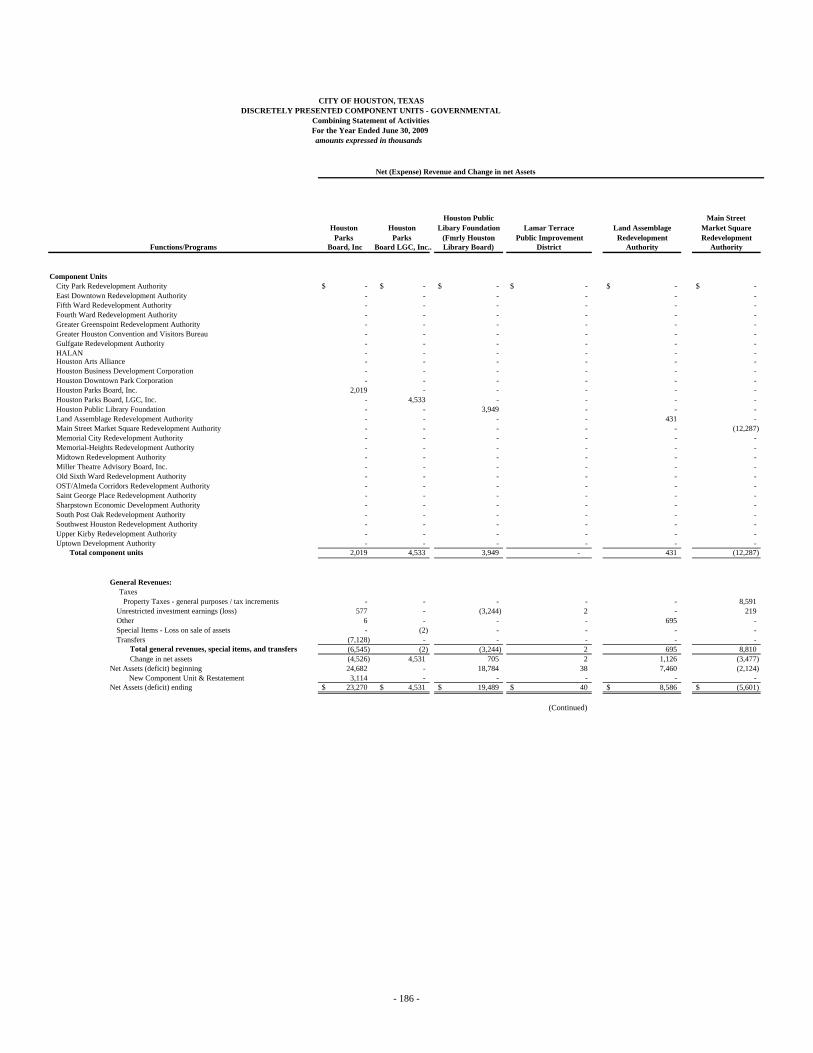
Houston Public Main StreetHouston Houston Libary Foundation Lamar Terrace Land Assemblage Market Square
Parks Parks (Fmrly Houston Public Improvement Redevelopment RedevelopmentFunctions/Programs Board, Inc Board LGC, Inc.. Library Board) District Authority Authority
Component UnitsCity Park Redevelopment Authority -$ -$ -$ -$ -$ -$ East Downtown Redevelopment Authority - - - - - - Fifth Ward Redevelopment Authority - - - - - - Fourth Ward Redevelopment Authority - - - - - - Greater Greenspoint Redevelopment Authority - - - - - - Greater Houston Convention and Visitors Bureau - - - - - - Gulfgate Redevelopment Authority - - - - - - HALAN - - - - - - Houston Arts Alliance - - - - - - Houston Business Development Corporation - - - - - - Houston Downtown Park Corporation - - - - - - Houston Parks Board, Inc. 2,019 - - - - - Houston Parks Board, LGC, Inc. - 4,533 - - - - Houston Public Library Foundation - - 3,949 - - - Land Assemblage Redevelopment Authority - - - - 431 - Main Street Market Square Redevelopment Authority - - - - - (12,287) Memorial City Redevelopment Authority - - - - - - Memorial-Heights Redevelopment Authority - - - - - - Midtown Redevelopment Authority - - - - - - Miller Theatre Advisory Board, Inc. - - - - - - Old Sixth Ward Redevelopment Authority - - - - - - OST/Almeda Corridors Redevelopment Authority - - - - - - Saint George Place Redevelopment Authority - - - - - - Sharpstown Economic Development Authority - - - - - - South Post Oak Redevelopment Authority - - - - - - Southwest Houston Redevelopment Authority - - - - - - Upper Kirby Redevelopment Authority - - - - - - Uptown Development Authority - - - - - -
Total component units 2,019 4,533 3,949 - 431 (12,287)
General Revenues:Taxes
Property Taxes - general purposes / tax increments - - - - - 8,591 Unrestricted investment earnings (loss) 577 - (3,244) 2 - 219 Other 6 - - - 695 - Special Items - Loss on sale of assets - (2) - - - - Transfers (7,128) - - - - -
Total general revenues, special items, and transfers (6,545) (2) (3,244) 2 695 8,810 Change in net assets (4,526) 4,531 705 2 1,126 (3,477)
Net Assets (deficit) beginning 24,682 - 18,784 38 7,460 (2,124) New Component Unit & Restatement 3,114 - - - - - Net Assets (deficit) ending 23,270$ 4,531$ 19,489$ 40$ 8,586$ (5,601)$
(Continued)
CITY OF HOUSTON, TEXAS
Combining Statement of ActivitiesDISCRETELY PRESENTED COMPONENT UNITS - GOVERNMENTAL
Net (Expense) Revenue and Change in net Assets
amounts expressed in thousandsFor the Year Ended June 30, 2009
- 186 -
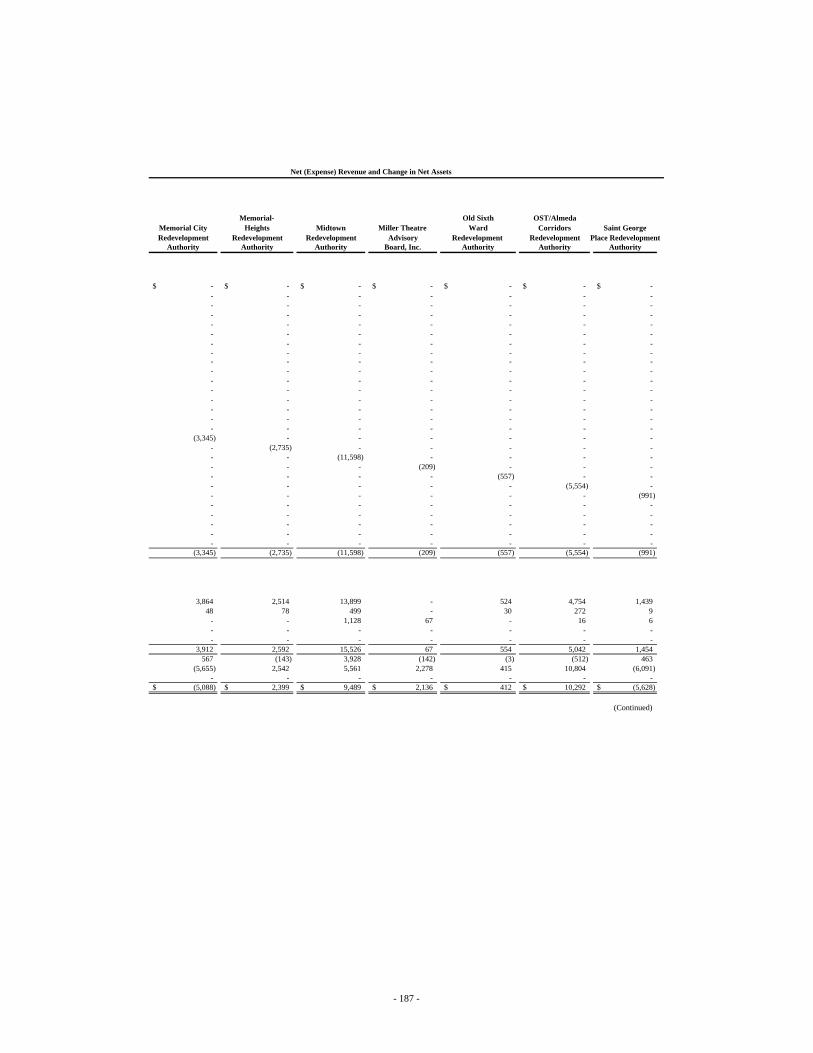
Memorial- Old Sixth OST/AlmedaMemorial City Heights Midtown Miller Theatre Ward Corridors Saint GeorgeRedevelopment Redevelopment Redevelopment Advisory Redevelopment Redevelopment Place Redevelopment
Authority Authority Authority Board, Inc. Authority Authority Authority
-$ -$ -$ -$ -$ -$ -$ - - - - - - - - - - - - - - - - - - - - - - - - - - - - - - - - - - - - - - - - - - - - - - - - - - - - - - - - - - - - - - - - - - - - - - - - - - - - - - - - - - - - - - - - - - - - - - - - - - - - - - - - -
(3,345) - - - - - - - (2,735) - - - - - - - (11,598) - - - - - - - (209) - - - - - - - (557) - - - - - - - (5,554) - - - - - - - (991) - - - - - - - - - - - - - - - - - - - - - - - - - - - - - - - - - - -
(3,345) (2,735) (11,598) (209) (557) (5,554) (991)
3,864 2,514 13,899 - 524 4,754 1,439 48 78 499 - 30 272 9
- - 1,128 67 - 16 6 - - - - - - - - - - - - - -
3,912 2,592 15,526 67 554 5,042 1,454 567 (143) 3,928 (142) (3) (512) 463
(5,655) 2,542 5,561 2,278 415 10,804 (6,091) - - - - - - -
(5,088)$ 2,399$ 9,489$ 2,136$ 412$ 10,292$ (5,628)$
(Continued)
Net (Expense) Revenue and Change in Net Assets
- 187 -
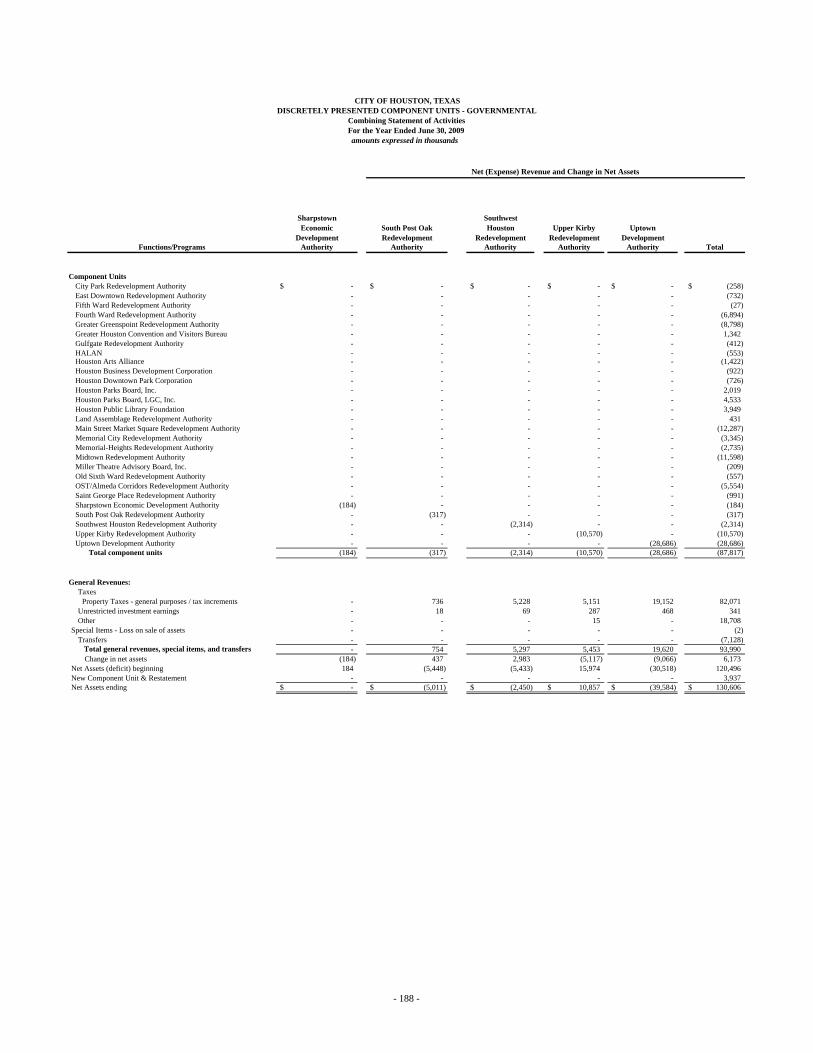
Sharpstown SouthwestEconomic South Post Oak Houston Upper Kirby Uptown
Development Redevelopment Redevelopment Redevelopment DevelopmentFunctions/Programs Authority Authority Authority Authority Authority Total
Component UnitsCity Park Redevelopment Authority -$ -$ -$ -$ -$ (258)$ East Downtown Redevelopment Authority - - - - - (732) Fifth Ward Redevelopment Authority - - - - - (27) Fourth Ward Redevelopment Authority - - - - - (6,894) Greater Greenspoint Redevelopment Authority - - - - - (8,798) Greater Houston Convention and Visitors Bureau - - - - - 1,342 Gulfgate Redevelopment Authority - - - - - (412) HALAN - - - - - (553) Houston Arts Alliance - - - - - (1,422) Houston Business Development Corporation - - - - - (922) Houston Downtown Park Corporation - - - - - (726) Houston Parks Board, Inc. - - - - - 2,019 Houston Parks Board, LGC, Inc. - - - - - 4,533 Houston Public Library Foundation - - - - - 3,949 Land Assemblage Redevelopment Authority - - - - - 431 Main Street Market Square Redevelopment Authority - - - - - (12,287) Memorial City Redevelopment Authority - - - - - (3,345) Memorial-Heights Redevelopment Authority - - - - - (2,735) Midtown Redevelopment Authority - - - - - (11,598) Miller Theatre Advisory Board, Inc. - - - - - (209) Old Sixth Ward Redevelopment Authority - - - - - (557) OST/Almeda Corridors Redevelopment Authority - - - - - (5,554) Saint George Place Redevelopment Authority - - - - - (991) Sharpstown Economic Development Authority (184) - - - - (184) South Post Oak Redevelopment Authority - (317) - - - (317) Southwest Houston Redevelopment Authority - - (2,314) - - (2,314) Upper Kirby Redevelopment Authority - - - (10,570) - (10,570) Uptown Development Authority - - - - (28,686) (28,686)
Total component units (184) (317) (2,314) (10,570) (28,686) (87,817)
General Revenues:Taxes
Property Taxes - general purposes / tax increments - 736 5,228 5,151 19,152 82,071 Unrestricted investment earnings - 18 69 287 468 341 Other - - - 15 - 18,708
Special Items - Loss on sale of assets - - - - - (2) Transfers - - - - - (7,128)
Total general revenues, special items, and transfers - 754 5,297 5,453 19,620 93,990 Change in net assets (184) 437 2,983 (5,117) (9,066) 6,173
Net Assets (deficit) beginning 184 (5,448) (5,433) 15,974 (30,518) 120,496 New Component Unit & Restatement - - - - - 3,937 Net Assets ending -$ (5,011)$ (2,450)$ 10,857$ (39,584)$ 130,606$
CITY OF HOUSTON, TEXASDISCRETELY PRESENTED COMPONENT UNITS - GOVERNMENTAL
Combining Statement of Activities
Net (Expense) Revenue and Change in Net Assets
amounts expressed in thousandsFor the Year Ended June 30, 2009
- 188 -
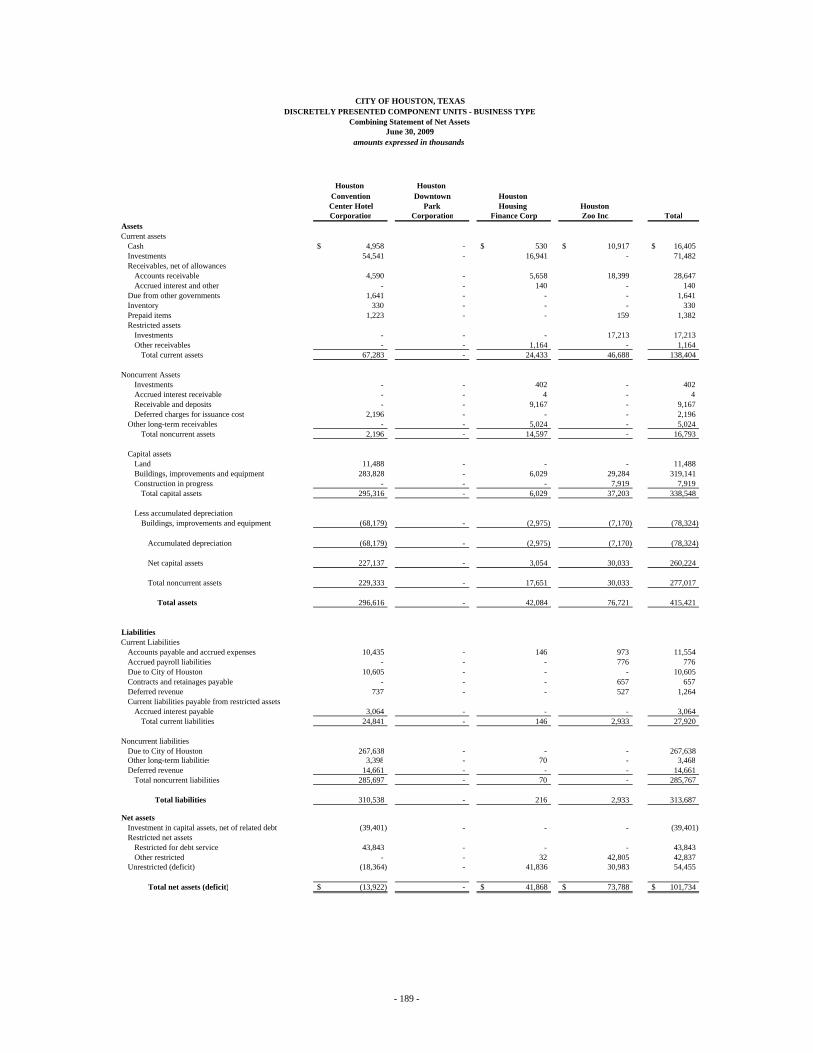
Houston Houston
Convention Downtown Houston Center Hotel Park Housing Houston Corporation Corporation Finance Corp Zoo Inc. Total
AssetsCurrent assets
Cash 4,958$ - 530$ 10,917$ 16,405$ Investments 54,541 - 16,941 - 71,482 Receivables, net of allowances
Accounts receivable 4,590 - 5,658 18,399 28,647 Accrued interest and other - - 140 - 140
Due from other governments 1,641 - - - 1,641 Inventory 330 - - - 330 Prepaid items 1,223 - - 159 1,382 Restricted assets
Investments - - - 17,213 17,213 Other receivables - - 1,164 - 1,164
Total current assets 67,283 - 24,433 46,688 138,404
Noncurrent AssetsInvestments - - 402 - 402 Accrued interest receivable - - 4 - 4 Receivable and deposits - - 9,167 - 9,167 Deferred charges for issuance cost 2,196 - - - 2,196
Other long-term receivables - - 5,024 - 5,024 Total noncurrent assets 2,196 - 14,597 - 16,793
Capital assetsLand 11,488 - - - 11,488 Buildings, improvements and equipment 283,828 - 6,029 29,284 319,141 Construction in progress - - - 7,919 7,919
Total capital assets 295,316 - 6,029 37,203 338,548
Less accumulated depreciationBuildings, improvements and equipment (68,179) - (2,975) (7,170) (78,324)
Accumulated depreciation (68,179) - (2,975) (7,170) (78,324)
Net capital assets 227,137 - 3,054 30,033 260,224
Total noncurrent assets 229,333 - 17,651 30,033 277,017
Total assets 296,616 - 42,084 76,721 415,421
LiabilitiesCurrent Liabilities
Accounts payable and accrued expenses 10,435 - 146 973 11,554 Accrued payroll liabilities - - - 776 776 Due to City of Houston 10,605 - - - 10,605 Contracts and retainages payable - - - 657 657 Deferred revenue 737 - - 527 1,264 Current liabilities payable from restricted assets
Accrued interest payable 3,064 - - - 3,064 Total current liabilities 24,841 - 146 2,933 27,920
Noncurrent liabilitiesDue to City of Houston 267,638 - - - 267,638 Other long-term liabilities 3,398 - 70 - 3,468 Deferred revenue 14,661 - - - 14,661
Total noncurrent liabilities 285,697 - 70 - 285,767
Total liabilities 310,538 - 216 2,933 313,687
Net assetsInvestment in capital assets, net of related debt (39,401) - - - (39,401) Restricted net assets
Restricted for debt service 43,843 - - - 43,843 Other restricted - - 32 42,805 42,837
Unrestricted (deficit) (18,364) - 41,836 30,983 54,455
Total net assets (deficit) (13,922)$ - 41,868$ 73,788$ 101,734$
DISCRETELY PRESENTED COMPONENT UNITS - BUSINESS TYPECombining Statement of Net Assets
June 30, 2009amounts expressed in thousands
CITY OF HOUSTON, TEXAS
- 189 -
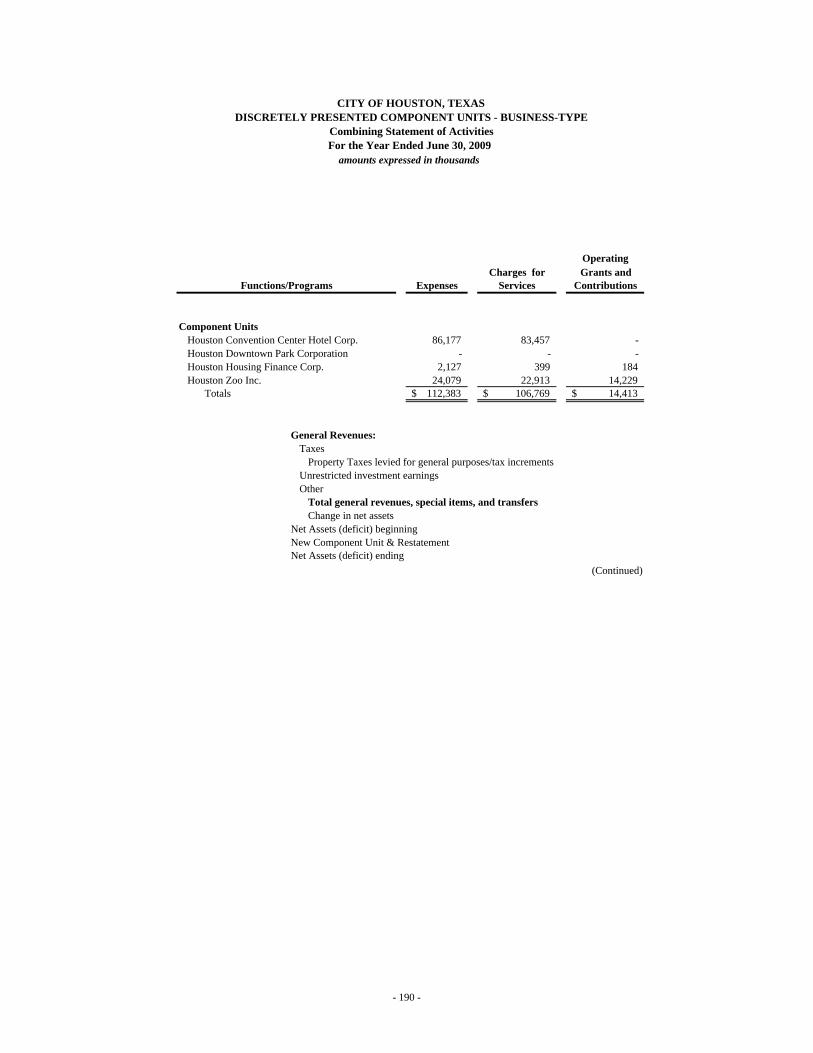
OperatingCharges for Grants and
Functions/Programs Expenses Services Contributions
Component UnitsHouston Convention Center Hotel Corp. 86,177 83,457 - Houston Downtown Park Corporation - - - Houston Housing Finance Corp. 2,127 399 184 Houston Zoo Inc. 24,079 22,913 14,229
Totals 112,383$ 106,769$ 14,413$
General Revenues:Taxes
Property Taxes levied for general purposes/tax incrementsUnrestricted investment earningsOther
Total general revenues, special items, and transfersChange in net assets
Net Assets (deficit) beginning New Component Unit & RestatementNet Assets (deficit) ending
(Continued)
CITY OF HOUSTON, TEXASDISCRETELY PRESENTED COMPONENT UNITS - BUSINESS-TYPE
Combining Statement of ActivitiesFor the Year Ended June 30, 2009
amounts expressed in thousands
- 190 -
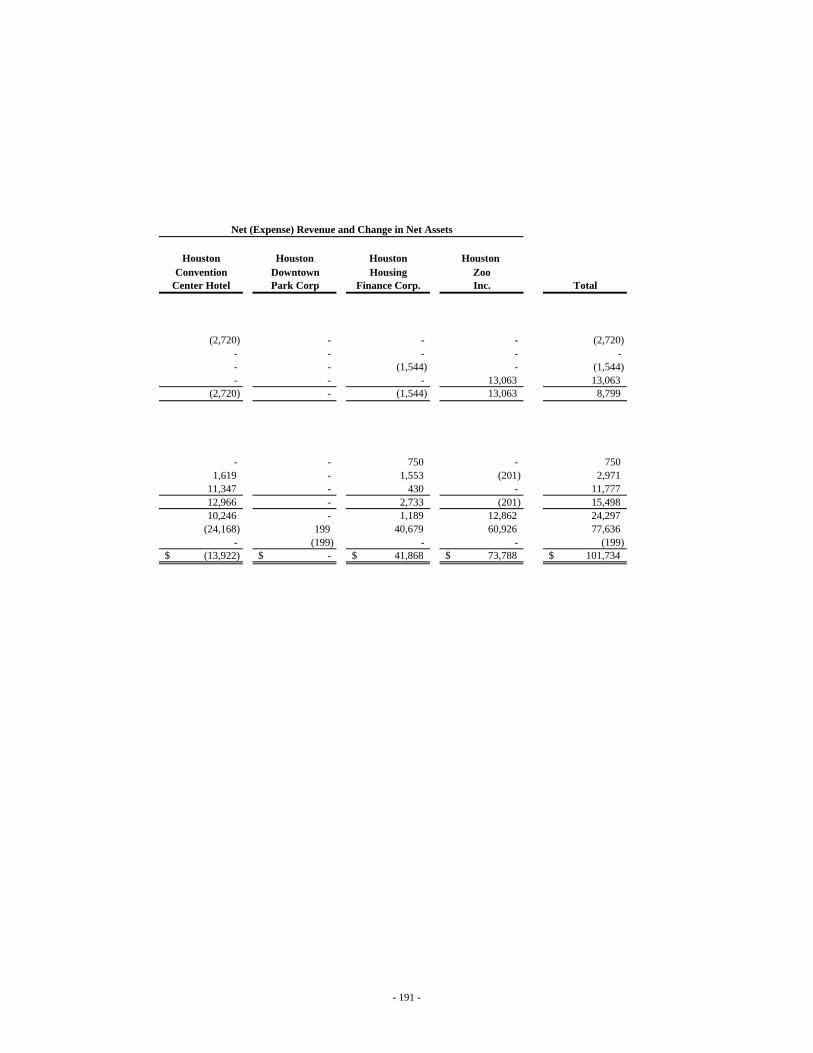
Houston Houston Houston Houston Convention Downtown Housing Zoo
Center Hotel Park Corp Finance Corp. Inc. Total
(2,720) - - - (2,720) - - - - - - - (1,544) - (1,544) - - - 13,063 13,063
(2,720) - (1,544) 13,063 8,799
- - 750 - 750 1,619 - 1,553 (201) 2,971
11,347 - 430 - 11,777 12,966 - 2,733 (201) 15,498 10,246 - 1,189 12,862 24,297
(24,168) 199 40,679 60,926 77,636 - (199) - - (199)
(13,922)$ -$ 41,868$ 73,788$ 101,734$
Net (Expense) Revenue and Change in Net Assets
- 191 -

Houston Houston
Convention Downtown Houston Total Center Hotel Park Housing Houston ComponentCorporation Corporation Finance Corp. Zoo Inc. Units
Cash flows from operating activitiesReceipts from customers 86,330$ - 2,508$ 4,010$ 92,848$ Payments to employees (17,836) - - (68) (17,904) Payments to suppliers (39,245) - - (564) (39,809) Other revenues (expenses) - - (1,650) (318) (1,968)
Net cash provided by operating activates 29,249 - 858 3,060 33,167
Cash flows from investing activitiesAdvances on long-term receivables - - (8,808) - (8,808) Interest income on investments 1,619 - 2,564 - 4,183 Purchase of investments (47,756) - (77,005) (1,065) (125,826) Proceeds from sale of investments 35,428 - 82,173 841 118,442 Change in cash restricted for capital acquisition - - - (5,025) (5,025)
Net cash provided by investing activities (10,709) - (1,076) (5,249) (17,034)
Cash flows from capital and related financing activitiesContributed capital - - - 7,270 7,270 Acquisition of property, plant and equipment (1,704) - - (3,352) (5,056) Interest expense (14,144) - - (14,144) Receipt of tax rebates 9,041 - - - 9,041 Payments to the City of Houston (11,083) - - - (11,083)
Net cash provided by (used for) capital and related financing activities (17,890) - - 3,918 (13,972)
Cash flows from noncapital financing activitiesOther revenues - - - 153 153 Excess funds from Bond Series - - 1,661 - 1,661 Payments on notes payable - - (1,915) - (1,915)
Net cash provided by noncapital financing activities - - (254) 153 (101) Net increase (decrease) in cash and cash equivalents 650 - (472) 1,882 2,060 Cash and cash equivalents, July 1 4,307 - 1,002 9,035 14,344
Cash and cash equivalents, June 30 4,957$ -$ 530$ 10,917$ 16,404$
Non cash transactionsTotal non cash transactions -$ -$ -$ -$ -$
Reconciliation of operating income to net cash provided (used) by operating activities
Operating income (Loss) 15,158$ - 1,336$ 12,862$ 29,356 Adjustments to reconcile operating income to net cash
provided by operating activitiesDepreciation and amortization 13,041 - (275) 1,852 14,618 Other revenues 1,116 - (75) 541 1,582 Other expenses - - - (12,209) (12,209) Changes in assets and liabilities:
Accounts receivable (932) - 4 (60) (988) Inventory (18) - - - (18) Other assets (213) - 38 134 (41) Accounts payable and accrued expenses 694 - (170) (128) 396 Accrued payroll liabilities 740 - - 68 808
Other long-term liabilities (337) - - - (337) Net cash provided by (used for) operating activities 29,249$ - 858$ 3,060$ 33,167$
amounts expressed in thousands
CITY OF HOUSTON, TEXASDISCRETELY PRESENTED COMPONENT UNITS - BUSINESS TYPE
Statement of Cash FlowsFor the Year Ended June 30, 2009
-192 -

STAT
ISTI
CAL
SECT
ION
- 193 -
Statistical Section (Unaudited)
This part of the City’s Statistical comprehensive annual financial report presents detailed information as a context for understanding what the information in the financial statements, note disclosures, and required supplementary information says about the City’s overall financial health.
Content Page Financial Trends 194
These schedules contain trend information to help the reader understand how the City’s financial performance and well-being have changed over time.
Revenue Capacity 206
These schedules contain information to help the reader assess the City’s most significant local revenue source, the property tax.
Debt Capacity 212
These schedules present information to help the reader assess the affordability of the City’s current levels of outstanding debt and the City’s ability to issue additional debt in the future.
Demographic and Economic Information 221 These schedules offer demographic and economic indicators to help the reader understand the environment within which the City’s financial activities take place.
Operating Information 228 These schedules contain service and infrastructure data to help the reader understand how the information in the City’s financial report relates to the services the City provides and the activities it performs.
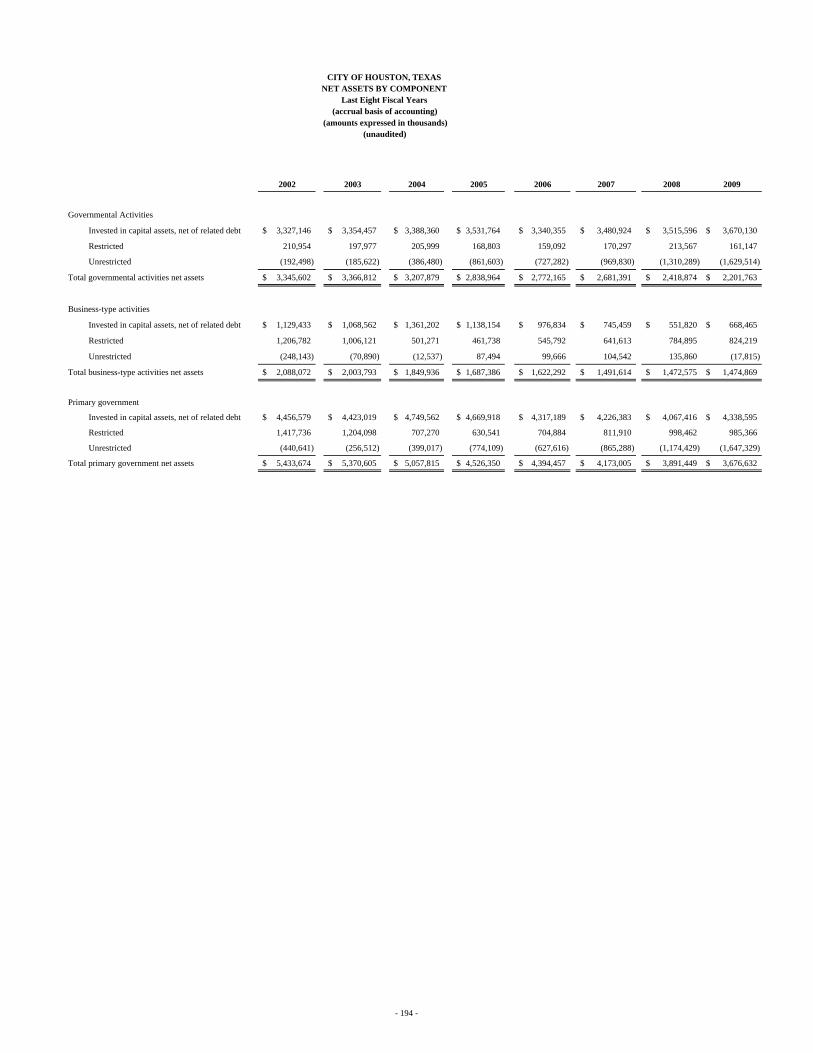
2002 2003 2004 2005 2006 2007 2008 2009
Governmental Activities
Invested in capital assets, net of related debt 3,327,146$ 3,354,457$ 3,388,360$ 3,531,764$ 3,340,355$ 3,480,924$ 3,515,596$ 3,670,130$
Restricted 210,954 197,977 205,999 168,803 159,092 170,297 213,567 161,147
Unrestricted (192,498) (185,622) (386,480) (861,603) (727,282) (969,830) (1,310,289) (1,629,514)
Total governmental activities net assets 3,345,602$ 3,366,812$ 3,207,879$ 2,838,964$ 2,772,165$ 2,681,391$ 2,418,874$ 2,201,763$
Business-type activities
Invested in capital assets, net of related debt 1,129,433$ 1,068,562$ 1,361,202$ 1,138,154$ 976,834$ 745,459$ 551,820$ 668,465$
Restricted 1,206,782 1,006,121 501,271 461,738 545,792 641,613 784,895 824,219
Unrestricted (248,143) (70,890) (12,537) 87,494 99,666 104,542 135,860 (17,815)
Total business-type activities net assets 2,088,072$ 2,003,793$ 1,849,936$ 1,687,386$ 1,622,292$ 1,491,614$ 1,472,575$ 1,474,869$
Primary government
Invested in capital assets, net of related debt 4,456,579$ 4,423,019$ 4,749,562$ 4,669,918$ 4,317,189$ 4,226,383$ 4,067,416$ 4,338,595$
Restricted 1,417,736 1,204,098 707,270 630,541 704,884 811,910 998,462 985,366
Unrestricted (440,641) (256,512) (399,017) (774,109) (627,616) (865,288) (1,174,429) (1,647,329)
Total primary government net assets 5,433,674$ 5,370,605$ 5,057,815$ 4,526,350$ 4,394,457$ 4,173,005$ 3,891,449$ 3,676,632$
CITY OF HOUSTON, TEXASNET ASSETS BY COMPONENT
Last Eight Fiscal Years(accrual basis of accounting)
(amounts expressed in thousands)(unaudited)
- 194 -

CITY OF HOUSTON, TEXAS
This page is left blank intentionally
- 195 -

2002 2003 2004 2005 2006 2007 2008 2009
Expenses Governmental activities:
General government 225,950$ 150,374$ 234,176$ 143,477$ 130,807$ 130,026$ 193,928$ 219,584$ Public safety 616,324 818,129 902,527 1,127,663 1,102,253 1,230,266 1,400,837 1,460,992 Public works 293,757 238,323 251,423 282,767 266,723 275,165 317,749 417,953 Health 107,783 99,617 105,247 124,267 102,716 101,865 129,197 136,766 Housing and community development 57,482 48,393 62,956 78,867 318,450 80,171 59,182 62,793 Parks and recreation 91,034 84,446 63,156 83,945 72,309 85,274 102,758 97,398 Library 40,723 38,282 38,481 49,084 37,242 39,180 49,687 48,015 Retiree benefits 17,787 21,440 26,581 28,997 - - - - Interest in long-term debt 94,511 98,042 95,779 116,180 136,563 135,134 126,349 129,324 Depreciation and amortization 108,998 119,475 85,711 96,355 125,517 111,918 110,174 115,050
Total governmental activities expenses 1,654,349 1,716,521 1,866,037 2,131,602 2,292,580 2,188,999 2,489,861 2,687,875 Business-type activities :
Airport System 227,248 265,987 315,929 406,908 431,392 442,757 459,521 472,253 Convention & Entertainment Facilities 83,141 76,760 91,588 133,622 99,271 105,846 110,576 114,110 Combined Utility System 636,824 649,247 681,201 762,209 752,122 818,831 846,368 842,518 Houston Area Water Corporation 17 153 160 169 17,428 20,568 17,485 14,867 Parking Management - - - - - - - 4,919
Total business-type activities expenses 947,230 992,147 1,088,878 1,302,908 1,300,213 1,388,002 1,433,950 1,448,667 Total primary government expenses 2,601,579$ 2,708,668$ 2,954,915$ 3,434,510$ 3,592,793$ 3,577,001$ 3,923,811$ 4,136,542$ Program Revenues Governmental activities:
Charges for services:General government 31,931 14,957 18,047 25,074 52,083 34,839 11,104 22,601Public safety 117,234 122,864 137,886 139,814 103,719 110,222 131,221 136,450Public works 19,282 40,413 42,695 43,652 49,797 53,856 53,375 46,404Health 11,625 13,263 13,026 13,624 12,574 13,563 17,093 16,836Parks and recreation 7,174 5,176 6,122 6,009 6,687 6,930 4,683 7,578Library 1,416 1,211 1,329 1,187 1,010 675 1,035 1,056
Operating grants and contributions 148,432 137,590 143,864 162,310 467,956 246,737 232,203 393,157Capital grants and contributions 27,051 6,123 46,337 37,591 69,438 101,099 76,497 45,354
Total governmental activities program revenues 364,145 341,597 409,306 429,261 763,264 567,921 527,211 669,436Business-type activities:
Charges for services:Airport System 227,455 240,767 270,413 353,641 393,861 416,138 447,176 386,777Convention & Entertainment Facilities 15,521 17,010 17,145 19,175 19,599 20,554 22,306 20,902Combined Utility System 543,396 539,317 531,208 598,874 642,662 615,465 648,269 687,238Houston Area Water Corporation - - - - - - 13,045 13,250 Parking Management - - - - - - - -
Operating grants and contributions - - 22,516 4,297 4,020 2,740 4,749 4,574Capital grants and contributions 65,579 48,339 42,000 106,484 109,728 61,717 132,728 192,815
Total business-type activities program revenues 851,951 845,433 883,282 1,082,471 1,169,870 1,116,614 1,268,273 1,305,556Total primary government program revenues 1,216,096$ 1,187,030$ 1,292,588$ 1,511,732$ 1,933,134$ 1,684,535$ 1,795,484$ 1,974,992$ Net (expense)/revenue Governmental activities (1,290,204)$ (1,374,924)$ (1,456,731)$ (1,702,341)$ (1,529,316)$ (1,621,078)$ (1,962,650)$ (2,018,439)$ Business-type activities (95,279) (146,714) (205,596) (220,437) (130,343) (271,388) (165,677) (143,111) Total primary government net expense (1,385,483)$ (1,521,638)$ (1,662,327)$ (1,922,778)$ (1,659,659)$ (1,892,466)$ (2,128,327)$ (2,161,550)$
(Continued)
(unaudited)
CITY OF HOUSTON, TEXASCHANGES IN NET ASSETS
Last Eigth Fiscal Years(accrual basis of accounting)
(amounts expressed in thousands)
- 196 -
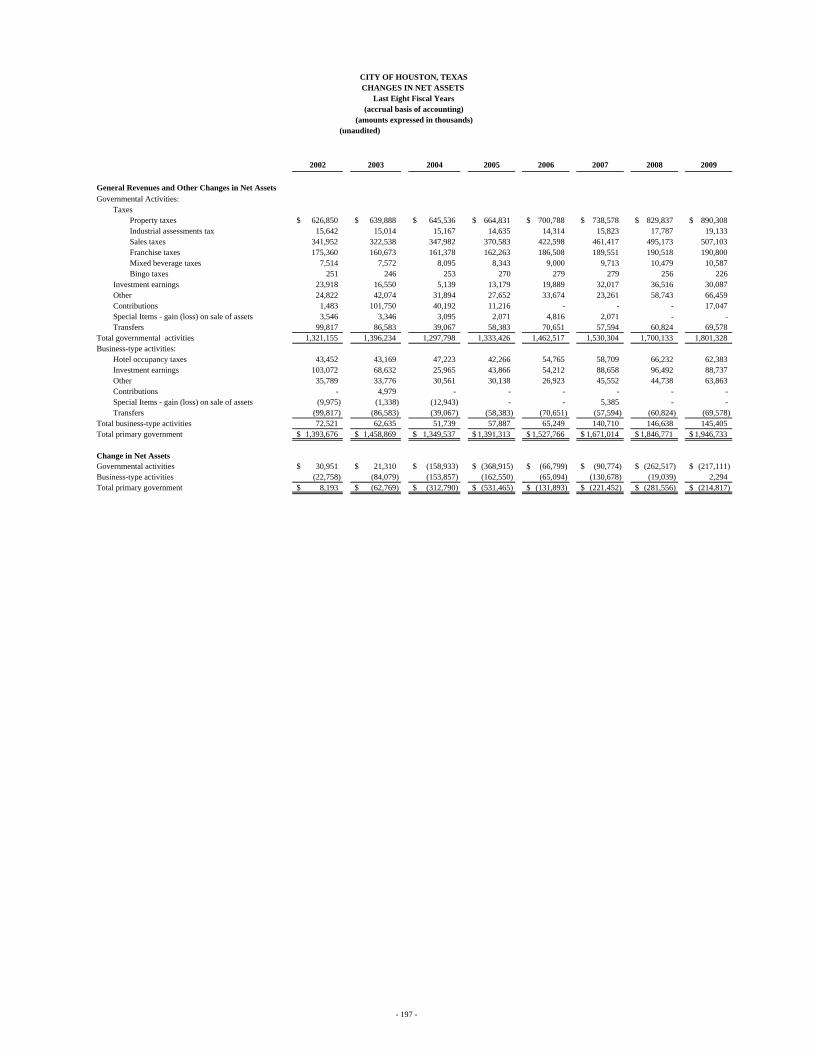
2002 2003 2004 2005 2006 2007 2008 2009
General Revenues and Other Changes in Net Assets Governmental Activities:
TaxesProperty taxes 626,850$ 639,888$ 645,536$ 664,831$ 700,788$ 738,578$ 829,837$ 890,308$ Industrial assessments tax 15,642 15,014 15,167 14,635 14,314 15,823 17,787 19,133Sales taxes 341,952 322,538 347,982 370,583 422,598 461,417 495,173 507,103Franchise taxes 175,360 160,673 161,378 162,263 186,508 189,551 190,518 190,800Mixed beverage taxes 7,514 7,572 8,095 8,343 9,000 9,713 10,479 10,587Bingo taxes 251 246 253 270 279 279 256 226
Investment earnings 23,918 16,550 5,139 13,179 19,889 32,017 36,516 30,087Other 24,822 42,074 31,894 27,652 33,674 23,261 58,743 66,459Contributions 1,483 101,750 40,192 11,216 - - - 17,047 Special Items - gain (loss) on sale of assets 3,546 3,346 3,095 2,071 4,816 2,071 - - Transfers 99,817 86,583 39,067 58,383 70,651 57,594 60,824 69,578
Total governmental activities 1,321,155 1,396,234 1,297,798 1,333,426 1,462,517 1,530,304 1,700,133 1,801,328Business-type activities:
Hotel occupancy taxes 43,452 43,169 47,223 42,266 54,765 58,709 66,232 62,383Investment earnings 103,072 68,632 25,965 43,866 54,212 88,658 96,492 88,737Other 35,789 33,776 30,561 30,138 26,923 45,552 44,738 63,863Contributions - 4,979 - - - - - - Special Items - gain (loss) on sale of assets (9,975) (1,338) (12,943) - - 5,385 - - Transfers (99,817) (86,583) (39,067) (58,383) (70,651) (57,594) (60,824) (69,578)
Total business-type activities 72,521 62,635 51,739 57,887 65,249 140,710 146,638 145,405Total primary government 1,393,676$ 1,458,869$ 1,349,537$ 1,391,313$ 1,527,766$ 1,671,014$ 1,846,771$ 1,946,733$
Change in Net Assets Governmental activities 30,951$ 21,310$ (158,933)$ (368,915)$ (66,799)$ (90,774)$ (262,517)$ (217,111)$ Business-type activities (22,758) (84,079) (153,857) (162,550) (65,094) (130,678) (19,039) 2,294Total primary government 8,193$ (62,769)$ (312,790)$ (531,465)$ (131,893)$ (221,452)$ (281,556)$ (214,817)$
(amounts expressed in thousands)(unaudited)
CITY OF HOUSTON, TEXASCHANGES IN NET ASSETS
Last Eight Fiscal Years(accrual basis of accounting)
- 197 -

2000 2001 2002 2003
General fund
Reserved 12,956$ 9,518$ 30,756$ 30,935$
Unreserved 70,668 81,482 85,282 105,101
Total general fund 83,624$ 91,000$ 116,038$ 136,036$
All other governmental funds
Reserved 92,177$ 93,246$ 122,480$ 169,660$
Unreserved , reported in:
Special revenue funds 33,519 28,981 48,428 63,997
Capital projects funds 57,369 56,417 62,864 -
Grant funds - - - -
Total all other governmental funds 183,065$ 178,644$ 233,772$ 233,657$
(amounts expressed in thousands)
CITY OF HOUSTON, TEXASFUND BALANCES, GOVERNMENTAL FUNDS
Last Ten Fiscal Years(modified accrual basis of accounting)
(unaudited)
- 198 -
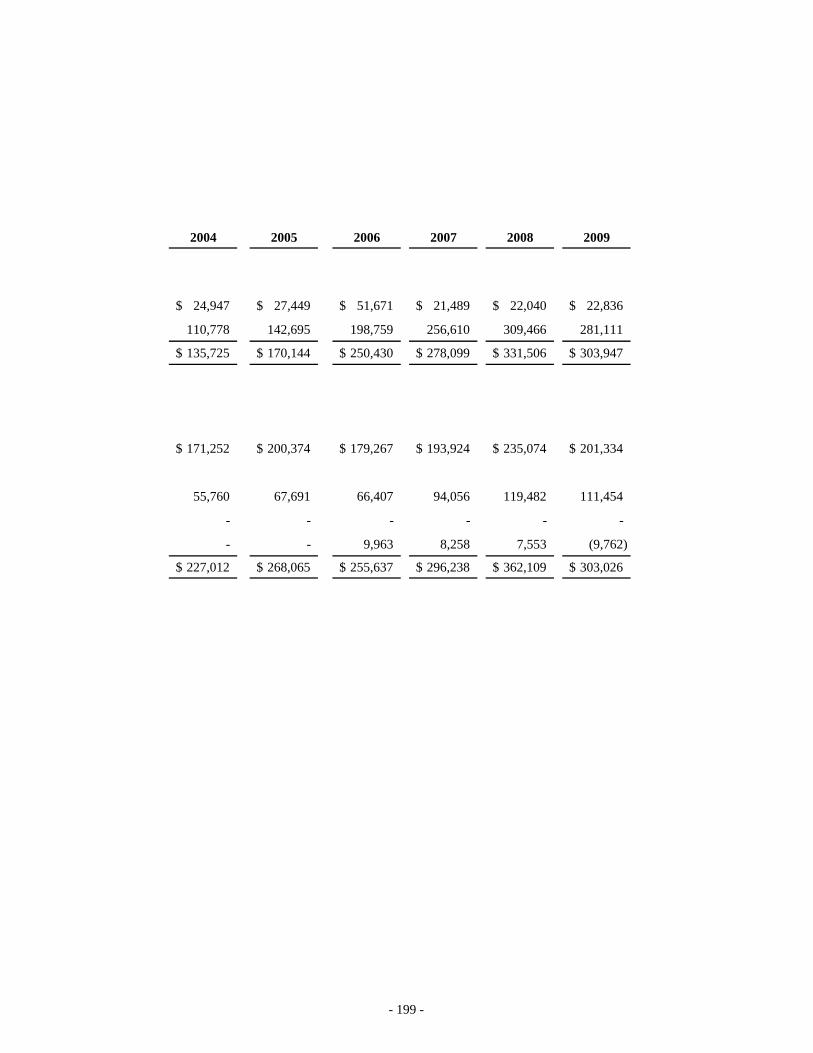
2004 2005 2006 2007 2008 2009
24,947$ 27,449$ 51,671$ 21,489$ 22,040$ 22,836$
110,778 142,695 198,759 256,610 309,466 281,111
135,725$ 170,144$ 250,430$ 278,099$ 331,506$ 303,947$
171,252$ 200,374$ 179,267$ 193,924$ 235,074$ 201,334$
55,760 67,691 66,407 94,056 119,482 111,454
- - - - - -
- - 9,963 8,258 7,553 (9,762)
227,012$ 268,065$ 255,637$ 296,238$ 362,109$ 303,026$
- 199 -

AmountBudgeted Resources (in thousands)
Revenues:Ad Valorem Taxes (current and delinquent) 909,715$ Sales and Use Tax 507,300Franchise Fees 186,278Municipal Courts Fines and Forfeits 35,497Miscellaneous 204,991
Total Current Revenues 1,843,781 Beginning Fund Balance as of July 1, 2009 (a) 247,584 Pension Bond Proceeds 20,000
Sale of Capital Assets 3,450 Transfers from Other Funds 16,074
Total Budgeted Resources 2,130,889$
Budgeted ExpendituresAdministrative Services and Public Finance 92,787$ Public Safety 1,142,601 Development and Maintenance Services 216,446 Human and Cultural Services 167,122 General Government 75,020 Transfers to Debt Service Fund 240,020 Transfer out -
Total Budgeted Expenditures 1,933,996 Designated "Sign Abatement" Amount - Designated "Rainy Day" Amount 20,194 Budgeted Ending Fund Balance as of June 30, 2010 176,699
Total Budgeted Expenditures and Reserves 2,130,889$
(a) This amount represents an estimate of the beginning fund balance which was used in preparing the FiscalYear 2010 Budget.
CITY OF HOUSTONGENERAL FUND BUDGET FOR FISCAL YEAR 2010
(unaudited)(amounts expressed in thousands)
- 200 -
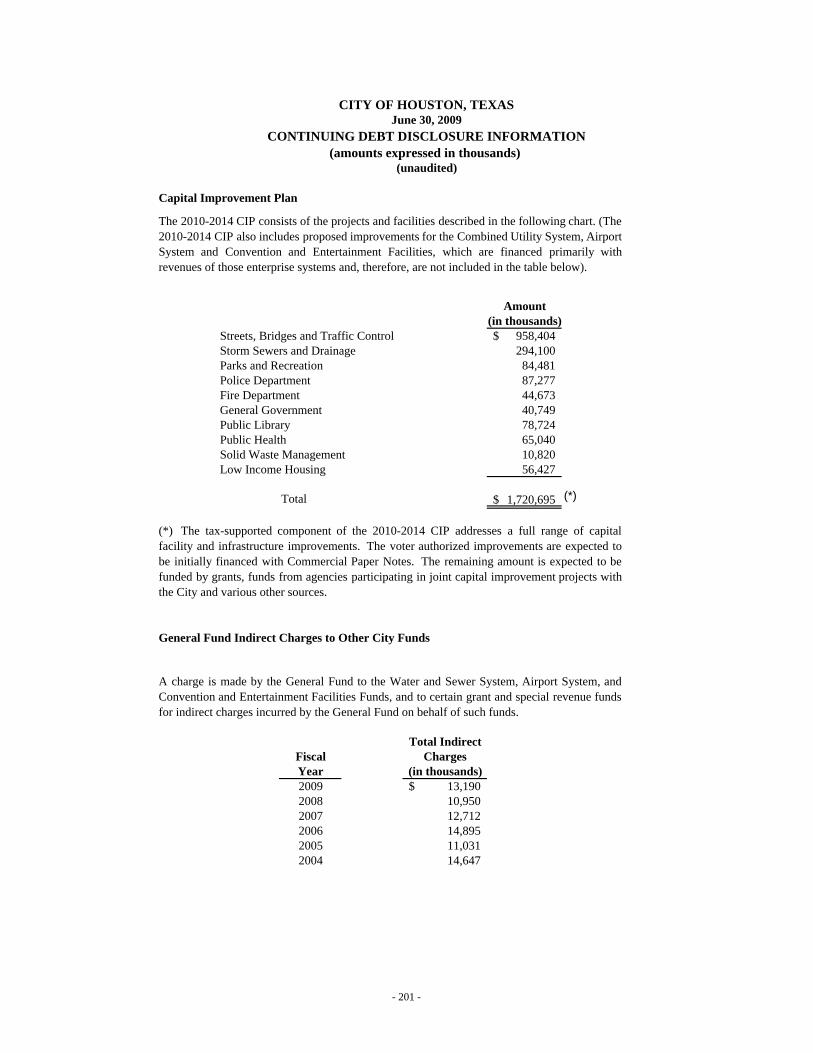
Capital Improvement Plan
Amount(in thousands)
Streets, Bridges and Traffic Control 958,404$ Storm Sewers and Drainage 294,100 Parks and Recreation 84,481 Police Department 87,277 Fire Department 44,673 General Government 40,749 Public Library 78,724 Public Health 65,040 Solid Waste Management 10,820 Low Income Housing 56,427
Total 1,720,695$
General Fund Indirect Charges to Other City Funds
Total IndirectFiscal ChargesYear (in thousands)2009 13,190$ 2008 10,950 2007 12,712 2006 14,895 2005 11,031 2004 14,647
The 2010-2014 CIP consists of the projects and facilities described in the following chart. (The2010-2014 CIP also includes proposed improvements for the Combined Utility System, AirportSystem and Convention and Entertainment Facilities, which are financed primarily withrevenues of those enterprise systems and, therefore, are not included in the table below).
A charge is made by the General Fund to the Water and Sewer System, Airport System, andConvention and Entertainment Facilities Funds, and to certain grant and special revenue fundsfor indirect charges incurred by the General Fund on behalf of such funds.
(*) The tax-supported component of the 2010-2014 CIP addresses a full range of capitalfacility and infrastructure improvements. The voter authorized improvements are expected tobe initially financed with Commercial Paper Notes. The remaining amount is expected to befunded by grants, funds from agencies participating in joint capital improvement projects withthe City and various other sources.
CITY OF HOUSTON, TEXASJune 30, 2009
(unaudited)
CONTINUING DEBT DISCLOSURE INFORMATION(amounts expressed in thousands)
(*)
- 201 -
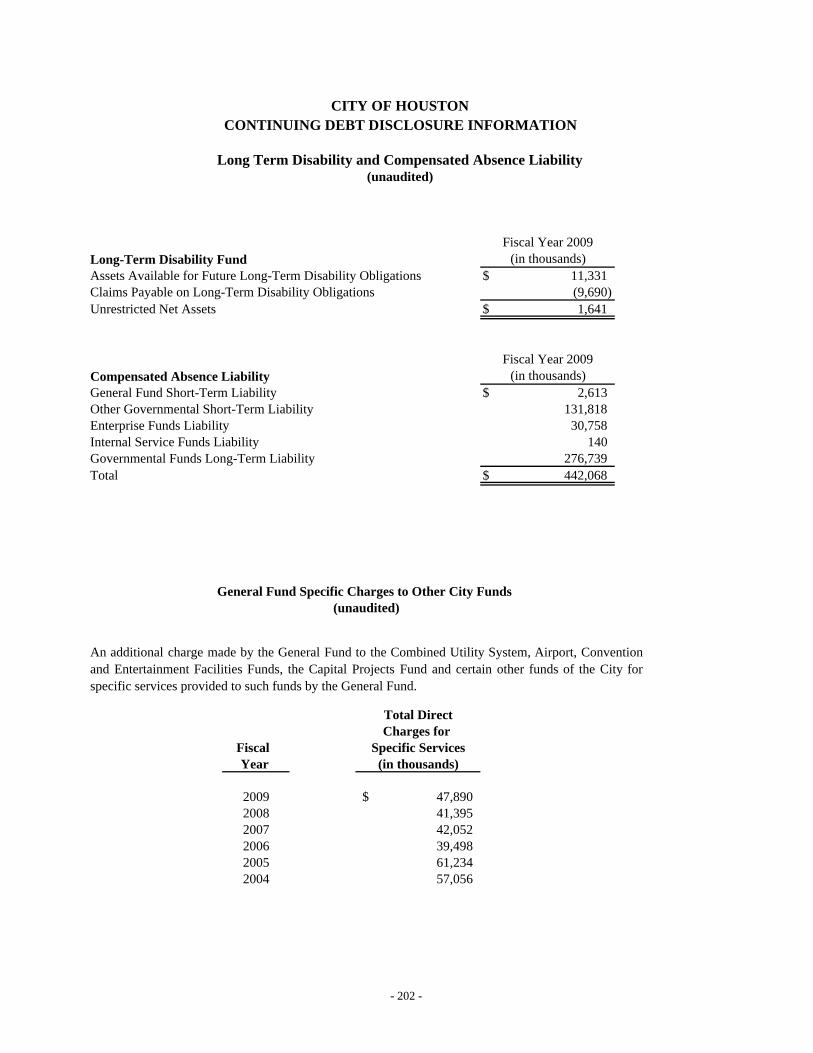
Long-Term Disability Fund Assets Available for Future Long-Term Disability Obligations $ 11,331Claims Payable on Long-Term Disability Obligations (9,690)Unrestricted Net Assets $ 1,641
Compensated Absence LiabilityGeneral Fund Short-Term Liability $ 2,613Other Governmental Short-Term Liability 131,818Enterprise Funds Liability 30,758Internal Service Funds Liability 140Governmental Funds Long-Term Liability 276,739Total $ 442,068
Total DirectCharges for
Fiscal Specific ServicesYear (in thousands)
2009 47,890$ 2008 41,3952007 42,0522006 39,4982005 61,2342004 57,056
An additional charge made by the General Fund to the Combined Utility System, Airport, Conventionand Entertainment Facilities Funds, the Capital Projects Fund and certain other funds of the City forspecific services provided to such funds by the General Fund.
General Fund Specific Charges to Other City Funds
Fiscal Year 2009(in thousands)
Fiscal Year 2009
(unaudited)
(in thousands)
CITY OF HOUSTONCONTINUING DEBT DISCLOSURE INFORMATION
Long Term Disability and Compensated Absence Liability(unaudited)
- 202 -

CITY OF HOUSTON, TEXAS
This page is left blank intentionally
- 203 -

2000 2001 2002 2003
Revenues Taxes 1,028,344$ 1,102,177$ 1,163,820$ 1,142,071$ Licenses and permits 30,621 31,606 33,102 35,046Intergovernmental 153,804 175,769 160,718 154,598 Charges for services 126,130 128,164 148,520 151,397 Fines 43,977 43,035 37,587 44,620 Investment earnings 17,118 29,547 21,450 16,550 Contributions 2,484 2,092 3,562 864 Other 22,736 36,872 30,305 46,030 Total revenues 1,425,214 1,549,262 1,599,064 1,591,176
Expenditures General Government 101,135 98,800 202,202 182,753 Public safety 672,737 684,644 752,281 840,490Public Works 219,300 221,757 328,448 362,453Health 56,547 55,857 104,777 96,633Housing and Community Development - - 57,521 60,400Parks and recreation 61,778 62,742 78,451 81,008Library 35,758 36,240 40,036 42,473Retiree benefits 9,597 11,675 17,787 21,440Other Current Expenditures 35,089 100,772 - - Capital Outlay 188,429 209,068 47,005 24,637Intergovernmental - grants 111,158 137,767 - - Debt Service
Principal 104,710 114,425 110,060 120,754Interest 91,847 93,928 87,830 87,438Fiscal agent and fees 2,099 3,713 5,252 4,098Advanced refunding escrow - - - -
Total expenditures 1,690,184 1,831,388 1,831,650 1,924,577
Excess of revenues over (under) expenditures (264,970) (282,126) (232,586) (333,401)
Other financing sources (uses)Transfers in 230,087 322,008 278,045 306,231Transfers out (172,776) (192,427) (178,228) (219,648)Proceeds from issuance of debt 176,012 366,709 173,494 209,931Proceeds from refunded debt - - 437,243 285,801Payment to escrow agent - (209,594) (433,192) (283,410)Sale of land - - - - Bond premium (discount) - - - - Other financing sources (uses) - - (119) - Proceeds from capital lease - - - 54,379 Total other financing 233,323 286,696 277,243 353,284
sources (uses)
Net change in fund balances (31,647)$ 4,570$ 44,657$ 19,883$
Debt service as a percentage of noncapital expenditures 13.2% 13.1% 13.4% 13.6%
CITY OF HOUSTON, TEXASCHANGES IN FUND BALANCES OF GOVERNMENTAL FUNDS
Last Ten Fiscal Years(modified accrual basis of accounting)
(amounts expressed in thousands)(unaudited)
- 204 -
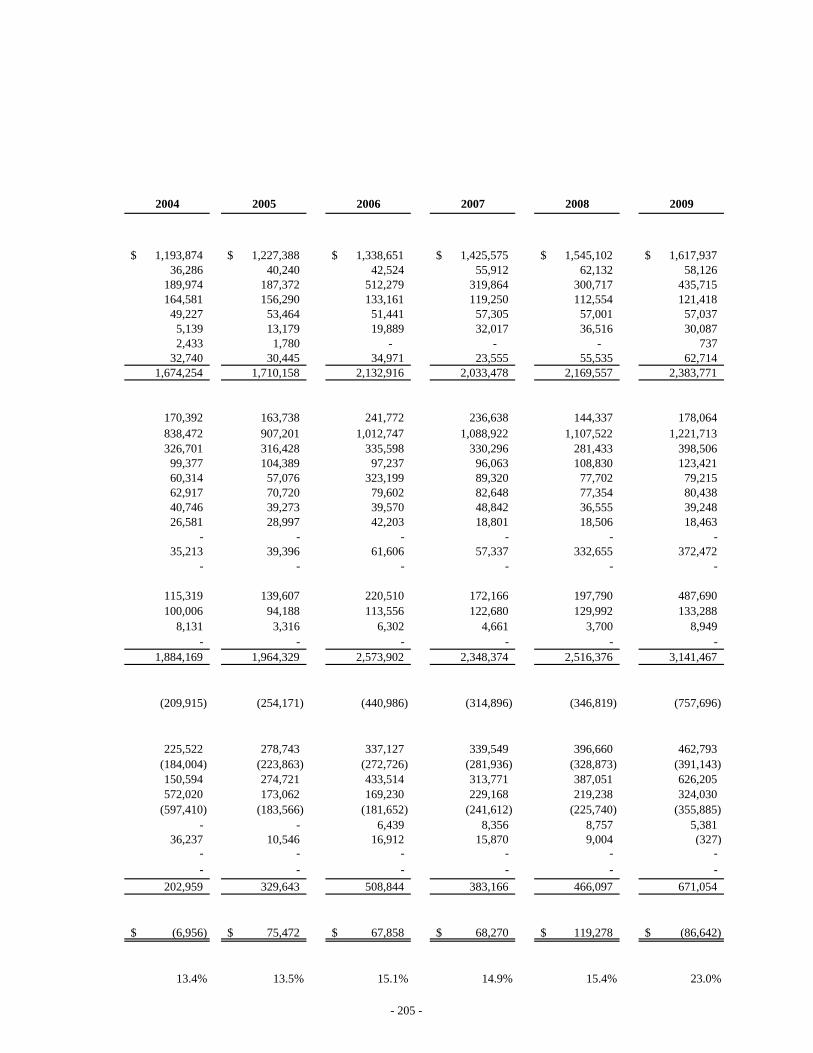
2004 2005 2006 2007 2008 2009
1,193,874$ 1,227,388$ 1,338,651$ 1,425,575$ 1,545,102$ 1,617,937$ 36,286 40,240 42,524 55,912 62,132 58,126
189,974 187,372 512,279 319,864 300,717 435,715 164,581 156,290 133,161 119,250 112,554 121,418
49,227 53,464 51,441 57,305 57,001 57,037 5,139 13,179 19,889 32,017 36,516 30,087 2,433 1,780 - - - 737
32,740 30,445 34,971 23,555 55,535 62,714 1,674,254 1,710,158 2,132,916 2,033,478 2,169,557 2,383,771
170,392 163,738 241,772 236,638 144,337 178,064 838,472 907,201 1,012,747 1,088,922 1,107,522 1,221,713326,701 316,428 335,598 330,296 281,433 398,506
99,377 104,389 97,237 96,063 108,830 123,42160,314 57,076 323,199 89,320 77,702 79,21562,917 70,720 79,602 82,648 77,354 80,43840,746 39,273 39,570 48,842 36,555 39,24826,581 28,997 42,203 18,801 18,506 18,463
- - - - - - 35,213 39,396 61,606 57,337 332,655 372,472
- - - - - -
115,319 139,607 220,510 172,166 197,790 487,690100,006 94,188 113,556 122,680 129,992 133,288
8,131 3,316 6,302 4,661 3,700 8,949- - - - - -
1,884,169 1,964,329 2,573,902 2,348,374 2,516,376 3,141,467
(209,915) (254,171) (440,986) (314,896) (346,819) (757,696)
225,522 278,743 337,127 339,549 396,660 462,793(184,004) (223,863) (272,726) (281,936) (328,873) (391,143)150,594 274,721 433,514 313,771 387,051 626,205572,020 173,062 169,230 229,168 219,238 324,030
(597,410) (183,566) (181,652) (241,612) (225,740) (355,885)- - 6,439 8,356 8,757 5,381
36,237 10,546 16,912 15,870 9,004 (327) - - - - - - - - - - - -
202,959 329,643 508,844 383,166 466,097 671,054
(6,956)$ 75,472$ 67,858$ 68,270$ 119,278$ (86,642)$
13.4% 13.5% 15.1% 14.9% 15.4% 23.0%
- 205 -

Mixed TotalFiscal Property Sales Franchise Industrial Beverage Bingo TaxYear Tax Tax Tax Assessments Tax Tax Collections2002 626,850$ 341,952$ 175,360$ 15,642$ 7,514$ 251$ 1,167,569$ 2003 639,888$ 322,538$ 160,673$ 15,014$ 7,572$ 246$ 1,145,931$ 2004 645,536$ 347,982$ 161,378$ 15,167$ 8,095$ 253$ 1,178,411$ 2005 664,831$ 370,583$ 162,263$ 14,635$ 8,343$ 270$ 1,220,925$ 2006 700,788$ 422,598$ 186,508$ 14,314$ 9,000$ 279$ 1,333,487$ 2007 738,578$ 461,417$ 189,551$ 15,823$ 9,713$ 279$ 1,415,361$ 2008 829,837$ 495,173$ 190,518$ 17,787$ 10,479$ 256$ 1,544,050$ 2009 890,308$ 507,103$ 190,800$ 19,133$ 10,587$ 226$ 1,618,157$
CITY OF HOUSTON, TEXASTAX REVENUE BY SOURCE - GOVERNMENTAL FUNDS
(unaudited)
Last Eight Fiscal Years
(amounts expressed in thousands)(accrual basis of accounting)
- 206 -
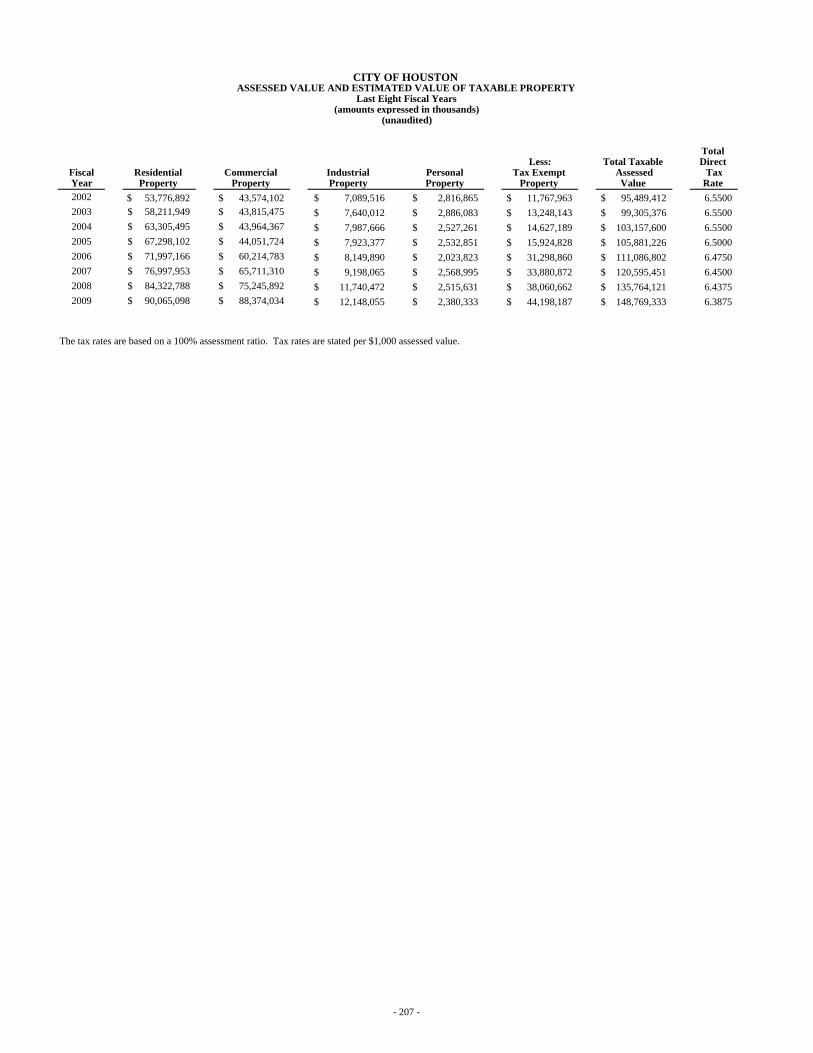
Total Less: Total Taxable Direct
Fiscal Residential Commercial Industrial Personal Tax Exempt Assessed TaxYear Property Property Property Property Property Value Rate 2002 53,776,892$ 43,574,102$ 7,089,516$ 2,816,865$ 11,767,963$ 95,489,412$ 6.55002003 58,211,949$ 43,815,475$ 7,640,012$ 2,886,083$ 13,248,143$ 99,305,376$ 6.55002004 63,305,495$ 43,964,367$ 7,987,666$ 2,527,261$ 14,627,189$ 103,157,600$ 6.55002005 67,298,102$ 44,051,724$ 7,923,377$ 2,532,851$ 15,924,828$ 105,881,226$ 6.50002006 71,997,166$ 60,214,783$ 8,149,890$ 2,023,823$ 31,298,860$ 111,086,802$ 6.47502007 76,997,953$ 65,711,310$ 9,198,065$ 2,568,995$ 33,880,872$ 120,595,451$ 6.45002008 84,322,788$ 75,245,892$ 11,740,472$ 2,515,631$ 38,060,662$ 135,764,121$ 6.43752009 90,065,098$ 88,374,034$ 12,148,055$ 2,380,333$ 44,198,187$ 148,769,333$ 6.3875
The tax rates are based on a 100% assessment ratio. Tax rates are stated per $1,000 assessed value.
CITY OF HOUSTON ASSESSED VALUE AND ESTIMATED VALUE OF TAXABLE PROPERTY
Last Eight Fiscal Years(amounts expressed in thousands)
(unaudited)
- 207 -
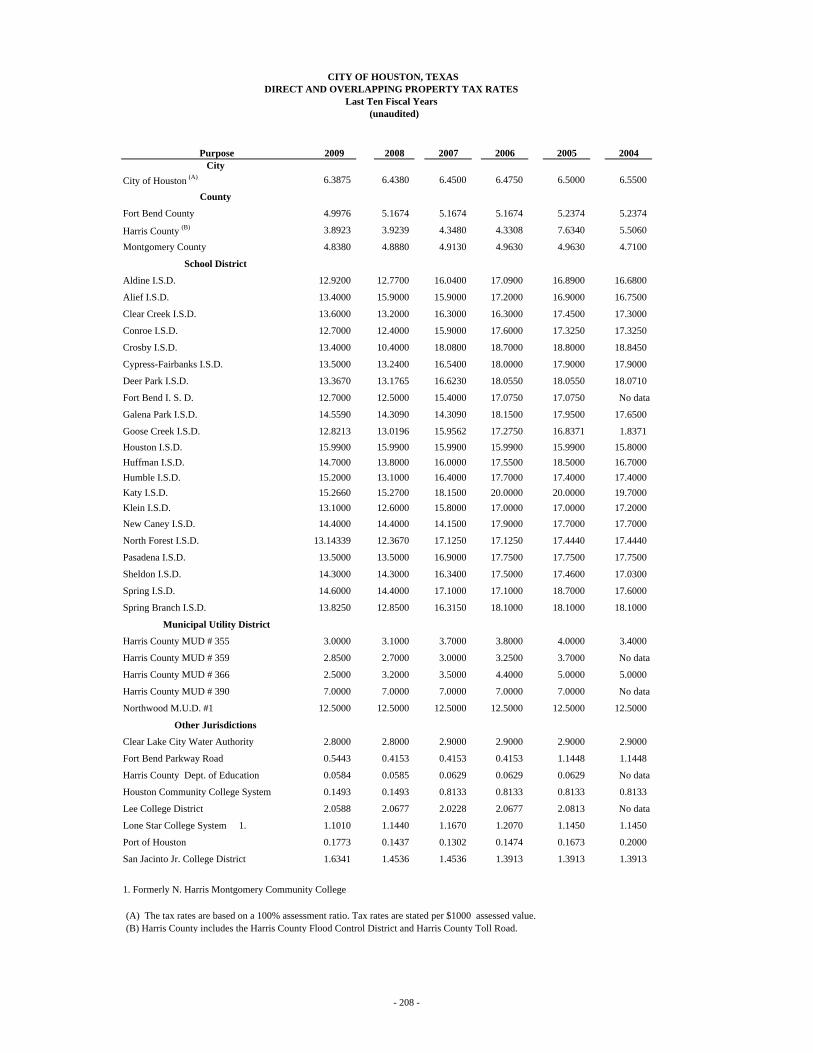
Purpose 2009 2008 2007 2006 2005 2004City
City of Houston (A) 6.3875 6.4380 6.4500 6.4750 6.5000 6.5500
County
Fort Bend County 4.9976 5.1674 5.1674 5.1674 5.2374 5.2374
Harris County (B) 3.8923 3.9239 4.3480 4.3308 7.6340 5.5060
Montgomery County 4.8380 4.8880 4.9130 4.9630 4.9630 4.7100
School District
Aldine I.S.D. 12.9200 12.7700 16.0400 17.0900 16.8900 16.6800
Alief I.S.D. 13.4000 15.9000 15.9000 17.2000 16.9000 16.7500
Clear Creek I.S.D. 13.6000 13.2000 16.3000 16.3000 17.4500 17.3000
Conroe I.S.D. 12.7000 12.4000 15.9000 17.6000 17.3250 17.3250
Crosby I.S.D. 13.4000 10.4000 18.0800 18.7000 18.8000 18.8450
Cypress-Fairbanks I.S.D. 13.5000 13.2400 16.5400 18.0000 17.9000 17.9000
Deer Park I.S.D. 13.3670 13.1765 16.6230 18.0550 18.0550 18.0710
Fort Bend I. S. D. 12.7000 12.5000 15.4000 17.0750 17.0750 No data
Galena Park I.S.D. 14.5590 14.3090 14.3090 18.1500 17.9500 17.6500
Goose Creek I.S.D. 12.8213 13.0196 15.9562 17.2750 16.8371 1.8371Houston I.S.D. 15.9900 15.9900 15.9900 15.9900 15.9900 15.8000Huffman I.S.D. 14.7000 13.8000 16.0000 17.5500 18.5000 16.7000Humble I.S.D. 15.2000 13.1000 16.4000 17.7000 17.4000 17.4000Katy I.S.D. 15.2660 15.2700 18.1500 20.0000 20.0000 19.7000Klein I.S.D. 13.1000 12.6000 15.8000 17.0000 17.0000 17.2000New Caney I.S.D. 14.4000 14.4000 14.1500 17.9000 17.7000 17.7000
North Forest I.S.D. 13.14339 12.3670 17.1250 17.1250 17.4440 17.4440
Pasadena I.S.D. 13.5000 13.5000 16.9000 17.7500 17.7500 17.7500
Sheldon I.S.D. 14.3000 14.3000 16.3400 17.5000 17.4600 17.0300
Spring I.S.D. 14.6000 14.4000 17.1000 17.1000 18.7000 17.6000
Spring Branch I.S.D. 13.8250 12.8500 16.3150 18.1000 18.1000 18.1000
Municipal Utility District
Harris County MUD # 355 3.0000 3.1000 3.7000 3.8000 4.0000 3.4000
Harris County MUD # 359 2.8500 2.7000 3.0000 3.2500 3.7000 No data
Harris County MUD # 366 2.5000 3.2000 3.5000 4.4000 5.0000 5.0000
Harris County MUD # 390 7.0000 7.0000 7.0000 7.0000 7.0000 No data
Northwood M.U.D. #1 12.5000 12.5000 12.5000 12.5000 12.5000 12.5000
Other Jurisdictions
Clear Lake City Water Authority 2.8000 2.8000 2.9000 2.9000 2.9000 2.9000
Fort Bend Parkway Road 0.5443 0.4153 0.4153 0.4153 1.1448 1.1448
Harris County Dept. of Education 0.0584 0.0585 0.0629 0.0629 0.0629 No data
Houston Community College System 0.1493 0.1493 0.8133 0.8133 0.8133 0.8133
Lee College District 2.0588 2.0677 2.0228 2.0677 2.0813 No data
Lone Star College System 1. 1.1010 1.1440 1.1670 1.2070 1.1450 1.1450
Port of Houston 0.1773 0.1437 0.1302 0.1474 0.1673 0.2000
San Jacinto Jr. College District 1.6341 1.4536 1.4536 1.3913 1.3913 1.3913
1. Formerly N. Harris Montgomery Community College
CITY OF HOUSTON, TEXAS DIRECT AND OVERLAPPING PROPERTY TAX RATES
Last Ten Fiscal Years (unaudited)
(A) The tax rates are based on a 100% assessment ratio. Tax rates are stated per $1000 assessed value.(B) Harris County includes the Harris County Flood Control District and Harris County Toll Road.
- 208 -
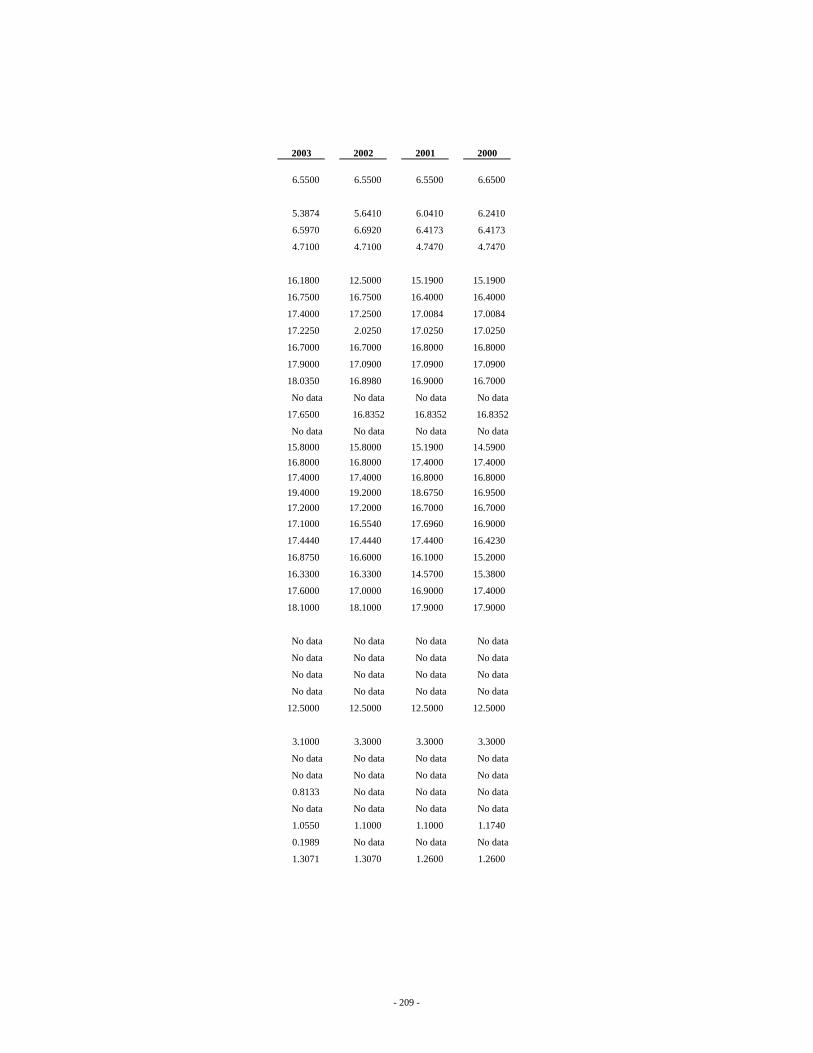
2003 2002 2001 2000
6.5500 6.5500 6.5500 6.6500
5.3874 5.6410 6.0410 6.2410
6.5970 6.6920 6.4173 6.4173
4.7100 4.7100 4.7470 4.7470
16.1800 12.5000 15.1900 15.1900
16.7500 16.7500 16.4000 16.4000
17.4000 17.2500 17.0084 17.0084
17.2250 2.0250 17.0250 17.0250
16.7000 16.7000 16.8000 16.8000
17.9000 17.0900 17.0900 17.0900
18.0350 16.8980 16.9000 16.7000
No data No data No data No data
17.6500 16.8352 16.8352 16.8352
No data No data No data No data15.8000 15.8000 15.1900 14.590016.8000 16.8000 17.4000 17.400017.4000 17.4000 16.8000 16.800019.4000 19.2000 18.6750 16.950017.2000 17.2000 16.7000 16.700017.1000 16.5540 17.6960 16.9000
17.4440 17.4440 17.4400 16.4230
16.8750 16.6000 16.1000 15.2000
16.3300 16.3300 14.5700 15.3800
17.6000 17.0000 16.9000 17.4000
18.1000 18.1000 17.9000 17.9000
No data No data No data No data
No data No data No data No data
No data No data No data No data
No data No data No data No data
12.5000 12.5000 12.5000 12.5000
3.1000 3.3000 3.3000 3.3000
No data No data No data No data
No data No data No data No data
0.8133 No data No data No data
No data No data No data No data
1.0550 1.1000 1.1000 1.1740
0.1989 No data No data No data
1.3071 1.3070 1.2600 1.2600
- 209 -
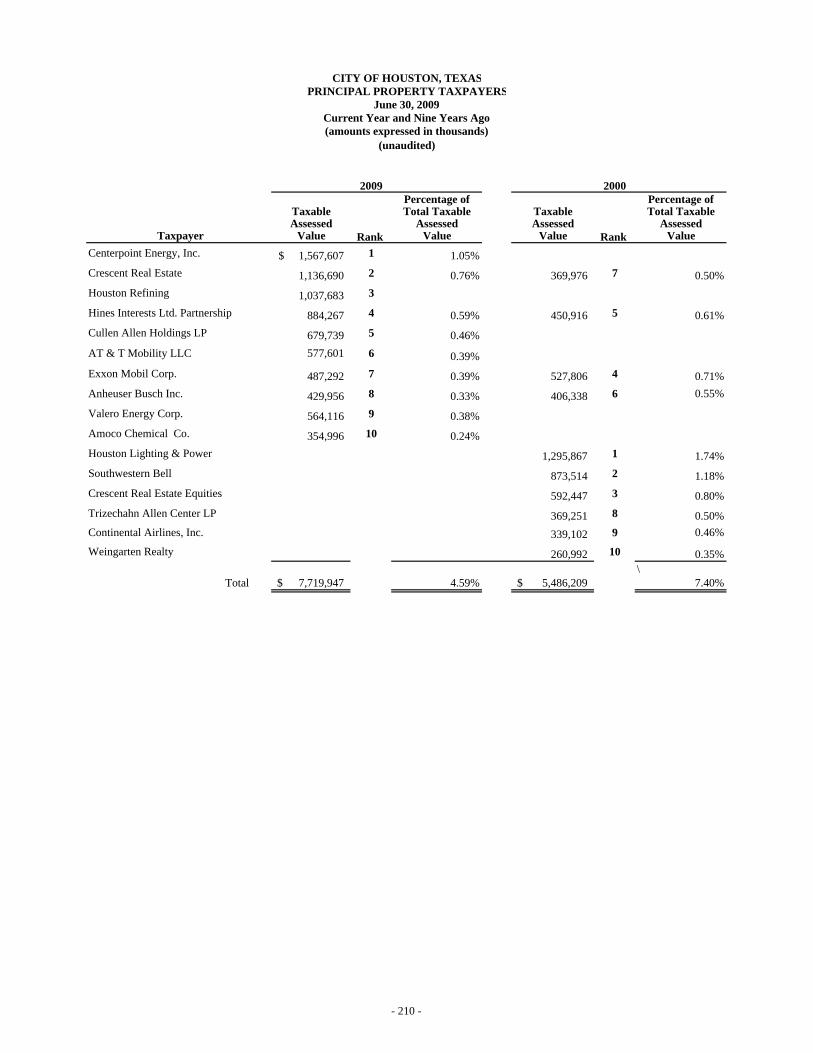
2009 2000Percentage of Percentage of
Taxable Total Taxable Taxable Total TaxableAssessed Assessed Assessed Assessed
Taxpayer Value Rank Value Value Rank ValueCenterpoint Energy, Inc. 1,567,607$ 1 1.05%Crescent Real Estate 1,136,690 2 0.76% 369,976 7 0.50%Houston Refining 1,037,683 3
Hines Interests Ltd. Partnership 884,267 4 0.59% 450,916 5 0.61%Cullen Allen Holdings LP 679,739 5 0.46%AT & T Mobility LLC 577,601 6 0.39%Exxon Mobil Corp. 487,292 7 0.39% 527,806 4 0.71%Anheuser Busch Inc. 429,956 8 0.33% 406,338 6 0.55%
Valero Energy Corp. 564,116 9 0.38%Amoco Chemical Co. 354,996 10 0.24%Houston Lighting & Power 1,295,867 1 1.74%Southwestern Bell 873,514 2 1.18%Crescent Real Estate Equities 592,447 3 0.80%Trizechahn Allen Center LP 369,251 8 0.50%Continental Airlines, Inc. 339,102 9 0.46%
Weingarten Realty 260,992 10 0.35%\
Total 7,719,947$ 4.59% 5,486,209$ 7.40%
CITY OF HOUSTON, TEXAS
(amounts expressed in thousands)(unaudited)
PRINCIPAL PROPERTY TAXPAYERSJune 30, 2009
Current Year and Nine Years Ago
- 210 -
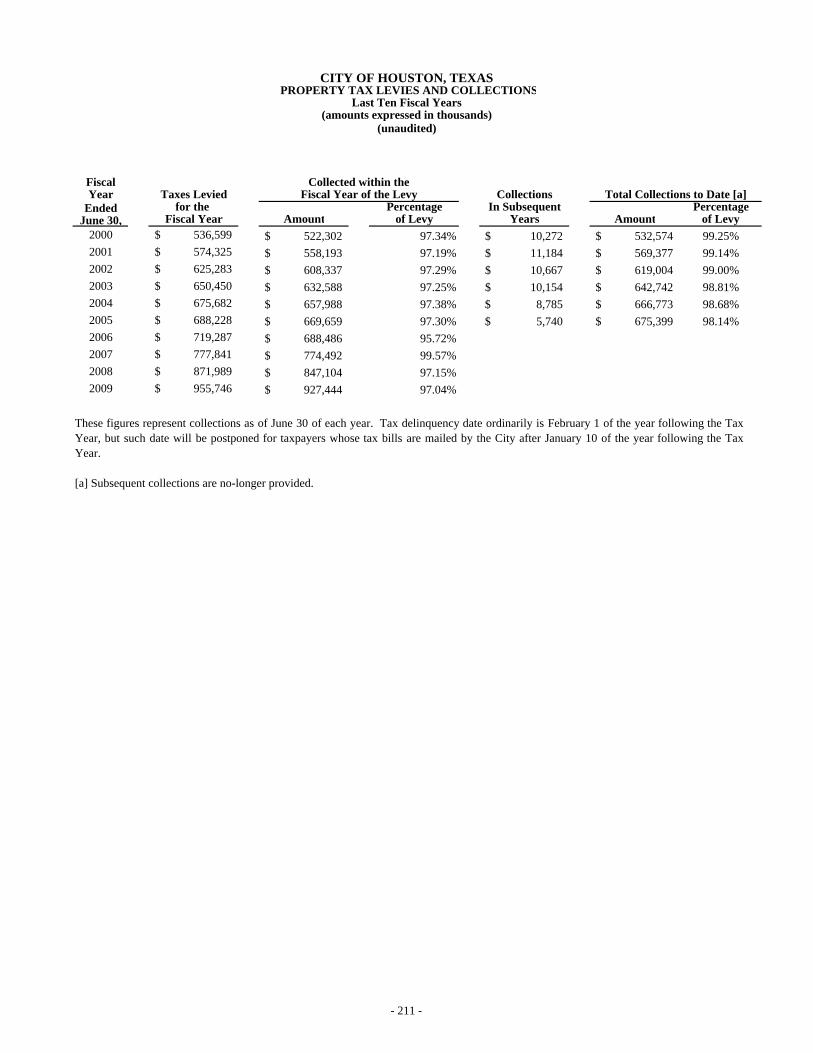
FiscalYear Taxes Levied Collections
Ended for the Percentage In Subsequent PercentageJune 30, Fiscal Year Amount of Levy Years Amount of Levy
2000 536,599$ 522,302$ 97.34% 10,272$ 532,574$ 99.25%2001 574,325$ 558,193$ 97.19% 11,184$ 569,377$ 99.14%2002 625,283$ 608,337$ 97.29% 10,667$ 619,004$ 99.00%2003 650,450$ 632,588$ 97.25% 10,154$ 642,742$ 98.81%2004 675,682$ 657,988$ 97.38% 8,785$ 666,773$ 98.68%2005 688,228$ 669,659$ 97.30% 5,740$ 675,399$ 98.14%2006 719,287$ 688,486$ 95.72%2007 777,841$ 774,492$ 99.57%2008 871,989$ 847,104$ 97.15%2009 955,746$ 927,444$ 97.04%
CITY OF HOUSTON, TEXAS PROPERTY TAX LEVIES AND COLLECTIONS
Collected within theFiscal Year of the Levy Total Collections to Date [a]
Last Ten Fiscal Years(amounts expressed in thousands)
(unaudited)
These figures represent collections as of June 30 of each year. Tax delinquency date ordinarily is February 1 of the year following the TaxYear, but such date will be postponed for taxpayers whose tax bills are mailed by the City after January 10 of the year following the TaxYear.
[a] Subsequent collections are no-longer provided.
- 211 -

Tax Bond Debt Service Fund for Fiscal Year 2010(a)
AmountBudgeted Resources (in thousands)
Beginning Fund Balance Estimate as of July 1, 2009 125,188$ Interest Earnings on Debt Reserves and Bond Funds 9,682 Transfers in from:
General Fund 242,600 Combined Utility System Operating Fund 35,535 Other sources 15,040
Third Party Reimbursements 30,000 Total Budgeted Resources 458,045$
Budgeted ExpendituresDebt Service Requirements
Tax Bonds 293,154$ Commercial Paper Paid from Third Party Reimbursements 30,000
Miscellaneous - Total Budgeted Expenditures 323,154
Budgeted Ending Fund Balance as of June 30, 2010 134,891 Total Budgeted Expenditures and Reserves 458,045$
(a)
AmountBudgeted Resources (in thousands)
Beginning Fund Balance Estimate as of July 1, 2009 945$ Interest Earnings on Debt Reserves and Bond FundsTransfers from General Fund 12,000 Other Sources
Total Budgeted Resources 12,945$
Budgeted ExpendituresDebt Service Requirements 12,765$
Total Budgeted Expenditures 12,765
Budgeted Ending Fund Balance as of June 30, 2010 180 Total Budgeted Expenditures and Reserves 12,945$
CITY OF HOUSTONTAX SUPPORTED DEBT SERVICE FUNDS
Tax Certificates Debt Service Fund for Fiscal Year 2010
This fund includes the debt service for the City's Tax Bonds, Pension Obligations, andCommercial Paper Notes.
(unaudited)(amounts expressed in thousands)
- 212 -

General Combined Utility Houston Convention & Total Percentage Fiscal Obligation Capital Other System Airport System Entertainment Long-Term Primary of Personal Per Year Bonds Leases Borrowings Revenue Bonds Revenue Bonds Revenue Bonds Contracts Government Income Capita (a)2002 1,934,505$ -$ 15,260$ 3,812,173$ 1,479,475$ 637,221$ 259,599$ 8,138,233$ 19.72% 4,165$ 2003 2,025,330$ 53,372$ 25,810$ 4,108,847$ 2,167,722$ 665,846$ 261,791$ 9,308,718$ 22.56% 4,699$ 2004 2,071,560$ 52,344$ 24,865$ 4,038,164$ 2,170,394$ 666,679$ 243,877$ 9,267,883$ 21.79% 4,612$ 2005 2,415,988$ 51,253$ 23,395$ 4,451,525$ 2,279,443$ 671,094$ 266,799$ 10,159,497$ 23.22% 5,038$ 2006 2,694,363$ -$ 21,880$ 4,695,148$ 2,260,462$ 665,402$ 248,368$ 10,585,623$ 22.14% 5,099$ 2007 2,851,948$ -$ 20,200$ 5,022,310$ 2,266,018$ 672,091$ 231,710$ 11,064,277$ Not Available 5,159$ 2008 3,057,921$ -$ 15,060$ 5,227,465$ 2,263,676$ 671,848$ 211,016$ 11,446,986$ Not Available 5,338$ 2009 3,179,667$ -$ 13,315$ 5,545,291$ 2,193,246$ 663,154$ 221,260$ 11,815,933$ Not Available 5,270$
Note: Details regarding the City's outstanding debt can be found in the notes to the financial statements.(a) See the Schedule of Demographic and Economic Statistics on page 221 for personal income and population data.
CITY OF HOUSTON RATIOS OF OUTSTANDING DEBT BY TYPE
Last Eight Fiscal Years
Governmental Activities Business-type Activities
(amounts expressed in thousands)(unaudited)
- 213 -

Percentage of Estimated
General Less: Amounts Actual Taxable Fiscal Obligation Available in Debt Value (1) of Per
Year Bonds Service Fund Total Property Capita (2)
2002 1,934,505$ 102,176$ 1,832,329$ 1.92% 938$
2003 2,025,330$ 99,534$ 1,925,796$ 1.94% 972$
2004 2,071,560$ 91,774$ 1,979,786$ 1.92% 985$
2005 2,415,988$ 106,864$ 2,309,124$ 2.18% 1,145$
2006 2,694,363$ 110,824$ 2,583,539$ 2.33% 1,244$
2007 2,851,948$ 109,661$ 2,742,287$ 2.27% 1,279$
2008 3,057,921$ 131,477$ 2,926,444$ 2.16% 1,325$
2009 3,179,667$ 161,414$ 3,018,253$ 2.03% 1,346$
Note: Details regarding the City's outstanding debt can be found in the notes to the financial statements.1. See the schedule of Assessed Value and Estimated Actual Value of Taxable Property on page 207 for property value data.2. Population data can be found in the Schedule of Demographic and Economic Statistics on page 221.
CITY OF HOUSTON, TEXASRATIOS OF GENERAL BONDED DEBT OUTSTANDING
Last Eight Fiscal Years(amounts expressed in thousands, except per capita amount)
(unaudited)
- 214 -

% of Debt City ofNet Direct Debt Applicable to Houston
Amount As of Houston Share of Debt
City City of Houston - direct 3,018,253$ 06/30/09 100.00% 3,018,253
County Fort Bend County 285,418 06/30/09 2.48% 7,078Harris County (including Toll Road Bonds) 2,389,649 06/30/09 52.81% 1,261,974Harris County Flood Control 492,282 06/30/09 52.81% 259,974Montgomery County 238,359 06/30/09 1.18% 2,813
School District Aldine I.S.D. 361,581 06/30/09 48.54% 175,511Alief I.S.D. 246,620 08/31/08 77.19% 190,366Clear Creek I.S.D. 670,301 06/30/09 47.32% 317,186Conroe I.S.D. 759,433 08/31/08 4.60% 34,934Crosby I.S.D. 66,077 03/24/09 0.23% 152Cypress-Fairbanks I.S.D. 1,505,173 06/30/09 11.25% 169,332Deer Park I.S.D. 177,166 08/31/08 0.12% 212Fort Bend I.S.D. 825,896 06/30/08 1.89% 15,609Galena Park I.S.D. 238,115 08/31/08 13.49% 32,122Goose Creek I.S.D. 335,174 06/30/09 0.00% 0Houston I.S.D. 1,917,470 06/30/08 90.95% 1,743,939Huffman I.S.D. 56,106 06/30/09 26.02% 14,599Humble I.S.D. 538,703 06/30/09 43.25% 232,989Katy I.S.D. 922,087 08/31/08 19.16% 176,672Klein I.S.D. 220,997 06/30/09 1.26% 2,784New Caney I.S.D. 164,924 06/30/09 18.28% 30,148North Forest I.S.D. 64,718 08/31/08 93.89% 60,764Pasadena I.S.D. 444,826 08/31/08 41.35% 183,935Sheldon I.S.D. 146,440 06/30/09 0.44% 644Spring I.S.D. 662,583 06/30/09 1.67% 11,065Spring Branch I.S.D. 505,620 06/30/09 70.46% 356,260
Municipal Utility District Harris County MUD 355 11,317 03/05/09 99.08% 11,213Harris County MUD 359 7,985 06/30/09 100.00% 7,985Harris County MUD 366 1,150 03/19/09 89.27% 1,026Harris County MUD 390 13,258 04/02/09 100.00% 13,258Northwood Municipal Utility District #1 2,240 10/07/09 100.00% 2,240
Other Jurisdictions Clear Lake City Water Authority 55,623 06/30/09 68.69% 38,207Fort Bend Parkway Road 69 06/30/09 12.57% 9Harris County Dept. of Education 27,925 06/30/09 52.81% 14,747Houston Community College System 192,190 08/31/09 90.86% 174,624Lee College District 15,884 06/30/09 0.00% 0Lone Star College System 1 150,372 08/31/08 11.64% 17,503Port of Houston Authority 531,962 06/30/09 52.81% 280,929San Jacinto Jr. College 120,560 06/30/09 15.44% 18,614Total overlapping debt 15,366,253 5,861,417
Total direct and overlapping debt 18,384,506$ 8,879,670
1. Formerly N. Harris–Montgomery Community College Dis.Note:
The net direct debt amounts above, except for that which relates to the City of Houston, were provided by the individualgovernment entities. The percentage of debt applicable to Houston was provided by the Municipal Advisory Council of Texas.Net Direct Debt is equal to the outstanding principal amount less sinking fund balances
June 30, 2009
CITY OF HOUSTON, TEXASCOMPUTATION OF DIRECT AND OVERLAPPING DEBT
(amounts expressed in thousands)(unaudited)
- 215 -

Current Net Collections Prior Years' Total
Current Year Prior to End of Delinquent Total Collections Fiscal General Debt Tax Levy (b) Fiscal Year (c) (d) Collections(d) Collection (c)(d) Percentage Year Purposes Service Total (in thousands) (in thousands) (in thousands) (in thousands) of Net Levy
2006 0.46359 0.18391 0.64750 719,287 688,486 31,718 720,204 100.1 2007 0.45927 0.18573 0.64500 777,841 751,882 36,007 787,889 101.3 2008 0.46198 0.18178 0.64375 874,230 845,817 34,772 880,589 100.7 2009 0.45460 0.18415 0.63875 961,059 926,956 32,395 959,351 99.8 2010 (e) 0.45728 0.18147 (f) 0.63875 (e) 959,857 926,262 30,000 956,262 99.6
(a)
(b)
2(c)
(d)
2(e)
2(f)
AD VALOREM TAX OBLIGATION PERCENTAGES
Tax Year
Fiscal Year
Tax-Supported Debt at
December 31 (in thousands)
Tax-Supported Debt as a
Percentage of Tax Roll(g)
Tax-Supported Per Capita Debt(b)
Debt Service Requirement Payable from
Taxes(c)(d)
(in thousands)
Tax Levy for Debt Service (in
thousands)(e)
2004 2005 2,432,724 105,881,225 2.30% 1,181 233,354 188,000 2005 2006 2,644,366 111,225,839 2.38% 1,274 248,105 195,000 2006 2007 2,833,037 120,595,451 2.35% 1,306 262,523 209,000 2007 2008 3,016,248 135,764,121 2.22% 1,365 279,277 229,600 2008 2009 3,174,023 150,554,363 2.11% 1,416 254,513 251,700
(a)
(b)
2(c)
(d)
(e) Sources of funds for the general obligation debt service requirement include the tax levy and transfers from Enterprise and Special Revenue Funds.
Per capita figures are based on population estimates according to the U.S. Census Bureau and updated as finals figures are published.These amounts have not been reduced by the combined ending fund balances in the General Debt Service Fund, which were as follows for the Fiscal Years indicated: Fiscal Year 2005 - $106,864,000, Fiscal Year 2006 - 110,824,000, Fiscal Year 2007 - $107,014,000, Fiscal Year 2008 - $131,477,000, Fiscal Year 2009-$160,770,000.These amounts include principal and interest payments for Tax Obligations, except that only interest is included for Commercial Paper Notes at an assumed rate appropriate for each Fiscal Year.
With the exception of Tax Year 2008, the tax roll represents the total appraised value of property, after subtracting all exemptions, and reflects all adjustments madeby the Appraisal Districts as of June 30 of each Fiscal Year. The Tax Year 2008 amount represents the Appraisal Districts’ preliminary certified taxable valuationsbased on tax rolls available as of April 17, 2009, and have been adjusted to reflect the Appraisal Districts’ estimated hearing loss of $102,097,297. As of April 17,2009, the total assessed value for Tax Year 2009 (including exempt property values) was approximately $195.1 billion, which is the appraised value used todetermine the statutory limitation of approximately $19.5 billion relating to total bond indebtedness.
AD VALOREM TAX LEVIES AND COLLECTIONS
These amounts do not include revenues from various types of Industrial District Contracts entered into by the City with industrial property owners outside of theCity’s corporate limits. Such Industrial District Contracts have a term of fifteen years and allow property owners to make payments to the City in lieu of paying advalorem taxes. Includes all ad valorem tax receipts received by the City, although such receipts include tax increment revenues ("Tax Increments") deposited into separate funds forits tax increment reinvestment zones ("Zones"). In Fiscal Year 2008, the City transferred approximately $50.6 million of Tax Increments into these Funds as requiredby State law representing an increase of approximately $11.7 million over the previous Fiscal Year. Notwithstanding, the City expects such zones to budgetapproximately $3.4 million of Tax Increments to be paid to the City in Fiscal Year 2009 for municipal service costs attributable to development in such zones.Additionally, such zones also help to finance various capital/public improvements. By virtue of contracts among the City, the tax increment reinvestment zones andthe local government corporations that manage the zones, the Tax Increments are transferred to the respective local government corporations and are available for useon authorized projects in the zones and to be pledged to obligations issued by the local government corporations on behalf of the zones. Bonds and other obligationsissued by the local government corporations are not debt of the City.
Tax Rate(a)
The Texas Constitution limits the maximum ad valorem tax rate to $2.50 (per $100 of assessed valuation) for home rule cities such as the City.
The figures represent net adjusted levies including the late certification and correction rolls from the Appraisal District for the current Tax Years through June 30 ofeach Fiscal Year.
(amounts expressed in thousands)(unaudited)
Pursuant to Ordinance 2008-796 the City created the Drainage Supplemental Debt Service Fund to receive annually from ad valorem taxes a certain sum to support drainage capital improvement projects. Beginning in Fiscal Year 2009, that amount is equal to $0.009385 per $100 ad valorem tax valuation. In Fiscal Year 2010 that amount is projected to equal $0.003 per $100 ad valorem tax valuation.
City of Houston, Texas
The City's Fiscal Year 2010 Budget includes a tax rate of $0.63875 (per $100 assessed valuation) for Tax Year 2009 (Fiscal Year 2010). The City Charter provides that, in preparing the City's budget, provision shall first be made for the payment of debt service on the City's outstanding bond indebtedness, with the remaining revenues to be apportioned among the City's respective departments.
Tax Roll(a)
(in thousands)
- 216 -

CITY OF HOUSTON, TEXAS
This page is left blank intentionally
- 217 -
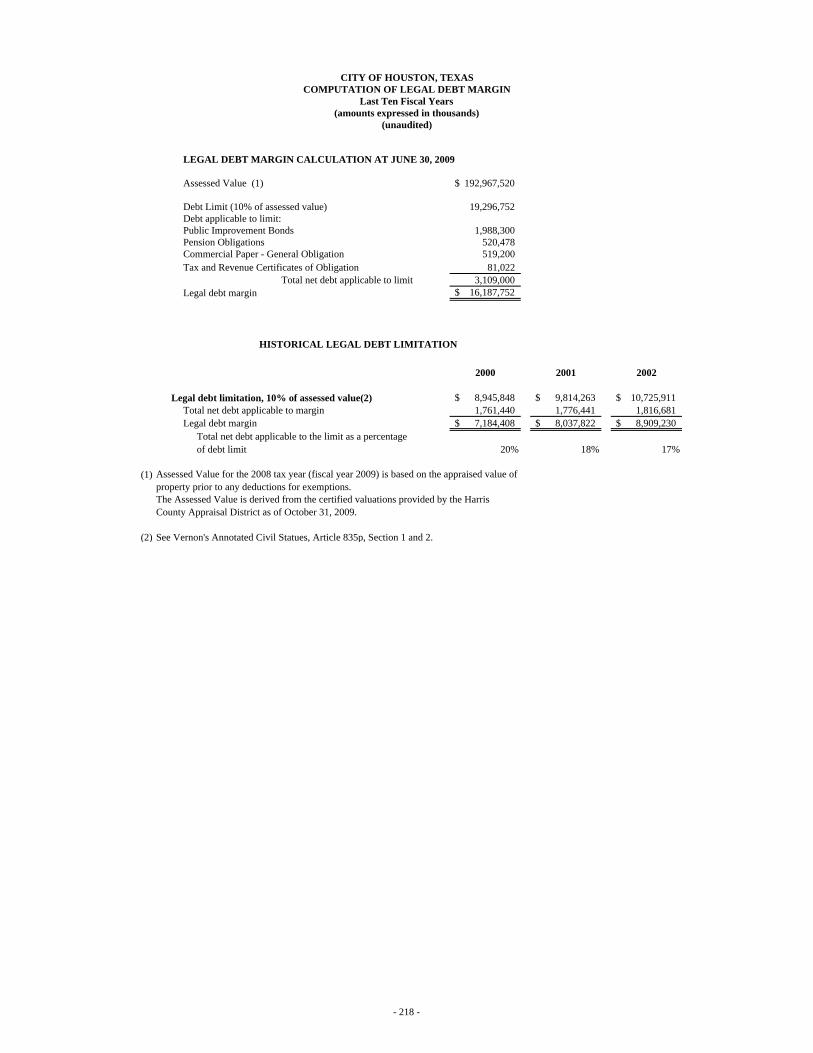
LEGAL DEBT MARGIN CALCULATION AT JUNE 30, 2009
Assessed Value (1) 192,967,520$
Debt Limit (10% of assessed value) 19,296,752Debt applicable to limit: Public Improvement Bonds 1,988,300Pension Obligations 520,478Commercial Paper - General Obligation 519,200Tax and Revenue Certificates of Obligation 81,022
Total net debt applicable to limit 3,109,000Legal debt margin 16,187,752$
HISTORICAL LEGAL DEBT LIMITATION
2000 2001 2002
Legal debt limitation, 10% of assessed value(2) 8,945,848$ 9,814,263$ 10,725,911$ Total net debt applicable to margin 1,761,440 1,776,441 1,816,681 Legal debt margin 7,184,408$ 8,037,822$ 8,909,230$
Total net debt applicable to the limit as a percentageof debt limit 20% 18% 17%
(1)
(2) See Vernon's Annotated Civil Statues, Article 835p, Section 1 and 2.
(unaudited)
Assessed Value for the 2008 tax year (fiscal year 2009) is based on the appraised value of property prior to any deductions for exemptions. The Assessed Value is derived from the certified valuations provided by the Harris County Appraisal District as of October 31, 2009.
CITY OF HOUSTON, TEXASCOMPUTATION OF LEGAL DEBT MARGIN
Last Ten Fiscal Years(amounts expressed in thousands)
- 218 -
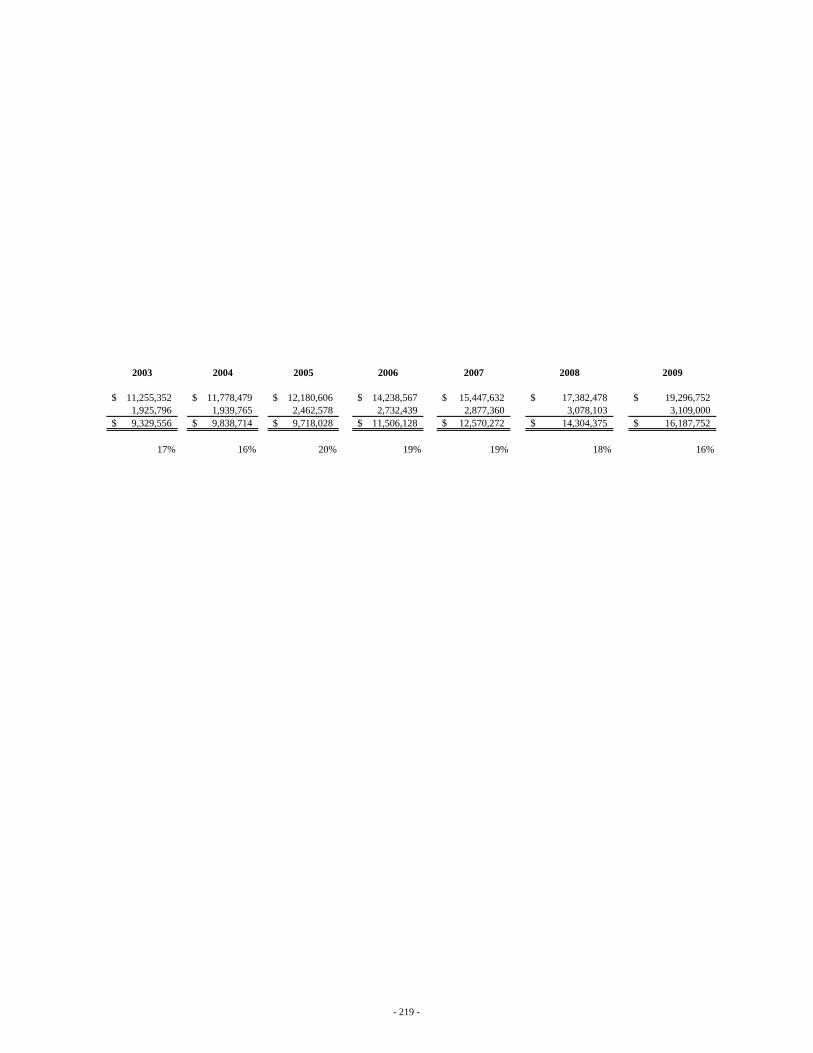
2003 2004 2005 2006 2007 2008 2009
11,255,352$ 11,778,479$ 12,180,606$ 14,238,567$ 15,447,632$ 17,382,478$ 19,296,752$ 1,925,796 1,939,765 2,462,578 2,732,439 2,877,360 3,078,103 3,109,000 9,329,556$ 9,838,714$ 9,718,028$ 11,506,128$ 12,570,272$ 14,304,375$ 16,187,752$
17% 16% 20% 19% 19% 18% 16%
- 219 -
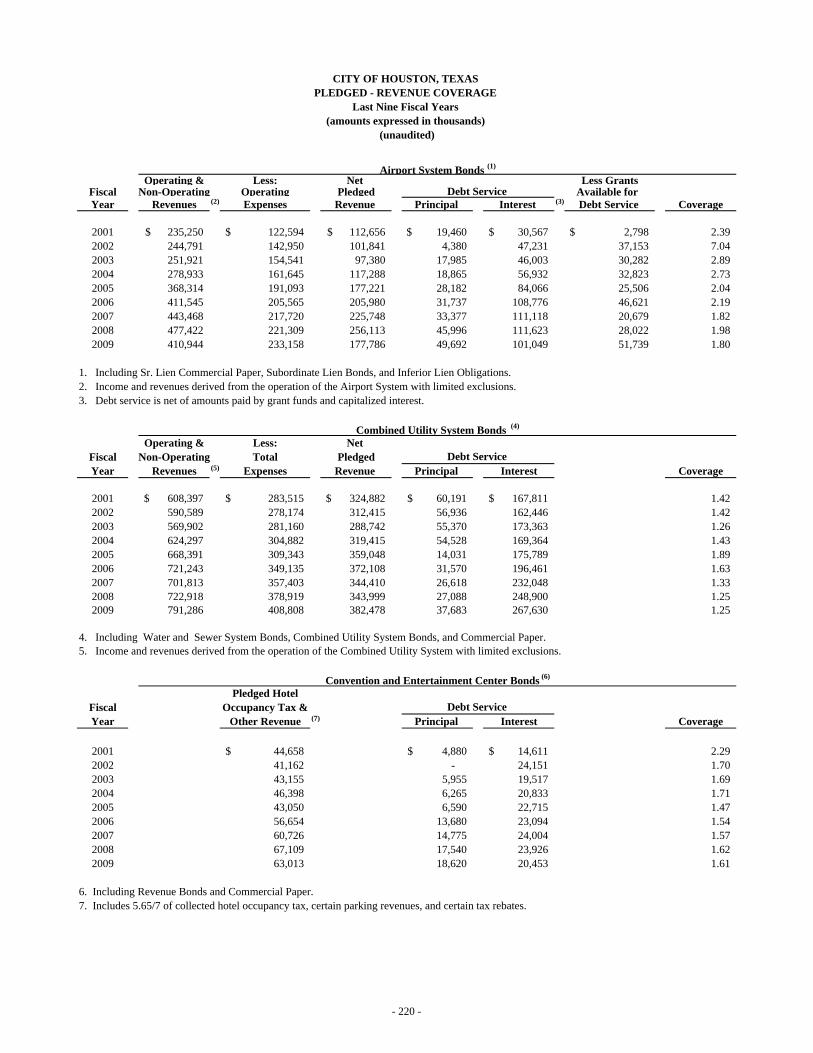
Airport System Bonds (1)
Operating & Less: Net Less GrantsFiscal Non-Operating Operating Pledged Available for Year Revenues (2) Expenses Revenue Principal Interest (3) Debt Service Coverage
2001 235,250$ 122,594$ 112,656$ 19,460$ 30,567$ 2,798$ 2.39 2002 244,791 142,950 101,841 4,380 47,231 37,153 7.04 2003 251,921 154,541 97,380 17,985 46,003 30,282 2.89 2004 278,933 161,645 117,288 18,865 56,932 32,823 2.73 2005 368,314 191,093 177,221 28,182 84,066 25,506 2.04 2006 411,545 205,565 205,980 31,737 108,776 46,621 2.19 2007 443,468 217,720 225,748 33,377 111,118 20,679 1.82 2008 477,422 221,309 256,113 45,996 111,623 28,022 1.98 2009 410,944 233,158 177,786 49,692 101,049 51,739 1.80
1. Including Sr. Lien Commercial Paper, Subordinate Lien Bonds, and Inferior Lien Obligations.2. Income and revenues derived from the operation of the Airport System with limited exclusions.3. Debt service is net of amounts paid by grant funds and capitalized interest.
Combined Utility System Bonds (4)
Operating & Less: Net Fiscal Non-Operating Total PledgedYear Revenues (5) Expenses Revenue Principal Interest Coverage
2001 608,397$ 283,515$ 324,882$ 60,191$ 167,811$ 1.42 2002 590,589 278,174 312,415 56,936 162,446 1.42 2003 569,902 281,160 288,742 55,370 173,363 1.26 2004 624,297 304,882 319,415 54,528 169,364 1.43 2005 668,391 309,343 359,048 14,031 175,789 1.89 2006 721,243 349,135 372,108 31,570 196,461 1.63 2007 701,813 357,403 344,410 26,618 232,048 1.33 2008 722,918 378,919 343,999 27,088 248,900 1.25 2009 791,286 408,808 382,478 37,683 267,630 1.25
4. Including Water and Sewer System Bonds, Combined Utility System Bonds, and Commercial Paper.5. Income and revenues derived from the operation of the Combined Utility System with limited exclusions.
Convention and Entertainment Center Bonds (6)
Pledged HotelFiscal Occupancy Tax &Year Other Revenue (7) Principal Interest Coverage
2001 44,658$ 4,880$ 14,611$ 2.29 2002 41,162 - 24,151 1.70 2003 43,155 5,955 19,517 1.69 2004 46,398 6,265 20,833 1.71 2005 43,050 6,590 22,715 1.47 2006 56,654 13,680 23,094 1.54 2007 60,726 14,775 24,004 1.57 2008 67,109 17,540 23,926 1.62 2009 63,013 18,620 20,453 1.61
6. Including Revenue Bonds and Commercial Paper.7. Includes 5.65/7 of collected hotel occupancy tax, certain parking revenues, and certain tax rebates.
Debt Service
Debt Service
Debt Service
(unaudited)
CITY OF HOUSTON, TEXAS PLEDGED - REVENUE COVERAGE
Last Nine Fiscal Years (amounts expressed in thousands)
- 220 -
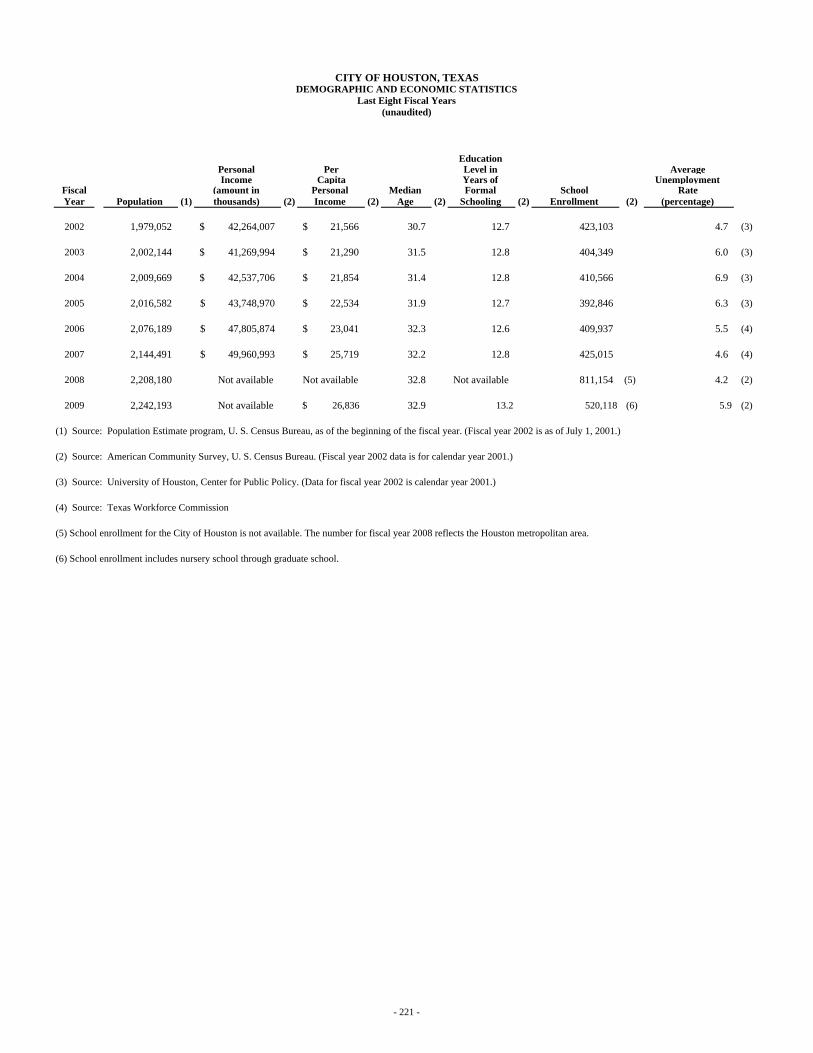
Education Personal Per Level in Average Income Capita Years of Unemployment
Fiscal (amount in Personal Median Formal School Rate Year Population (1) thousands) (2) Income (2) Age (2) Schooling (2) Enrollment (2) (percentage)
2002 1,979,052 42,264,007$ 21,566$ 30.7 12.7 423,103 4.7 (3)
2003 2,002,144 41,269,994$ 21,290$ 31.5 12.8 404,349 6.0 (3)
2004 2,009,669 42,537,706$ 21,854$ 31.4 12.8 410,566 6.9 (3)
2005 2,016,582 43,748,970$ 22,534$ 31.9 12.7 392,846 6.3 (3)
2006 2,076,189 47,805,874$ 23,041$ 32.3 12.6 409,937 5.5 (4)
2007 2,144,491 49,960,993$ 25,719$ 32.2 12.8 425,015 4.6 (4)
2008 2,208,180 Not available Not available 32.8 Not available 811,154 (5) 4.2 (2)
2009 2,242,193 Not available 26,836$ 32.9 13.2 520,118 (6) 5.9 (2)
(1) Source: Population Estimate program, U. S. Census Bureau, as of the beginning of the fiscal year. (Fiscal year 2002 is as of July 1, 2001.)
(2) Source: American Community Survey, U. S. Census Bureau. (Fiscal year 2002 data is for calendar year 2001.)
(3) Source: University of Houston, Center for Public Policy. (Data for fiscal year 2002 is calendar year 2001.)
(4) Source: Texas Workforce Commission
(5) School enrollment for the City of Houston is not available. The number for fiscal year 2008 reflects the Houston metropolitan area.
(6) School enrollment includes nursery school through graduate school.
CITY OF HOUSTON, TEXASDEMOGRAPHIC AND ECONOMIC STATISTICS
Last Eight Fiscal Years(unaudited)
- 221 -
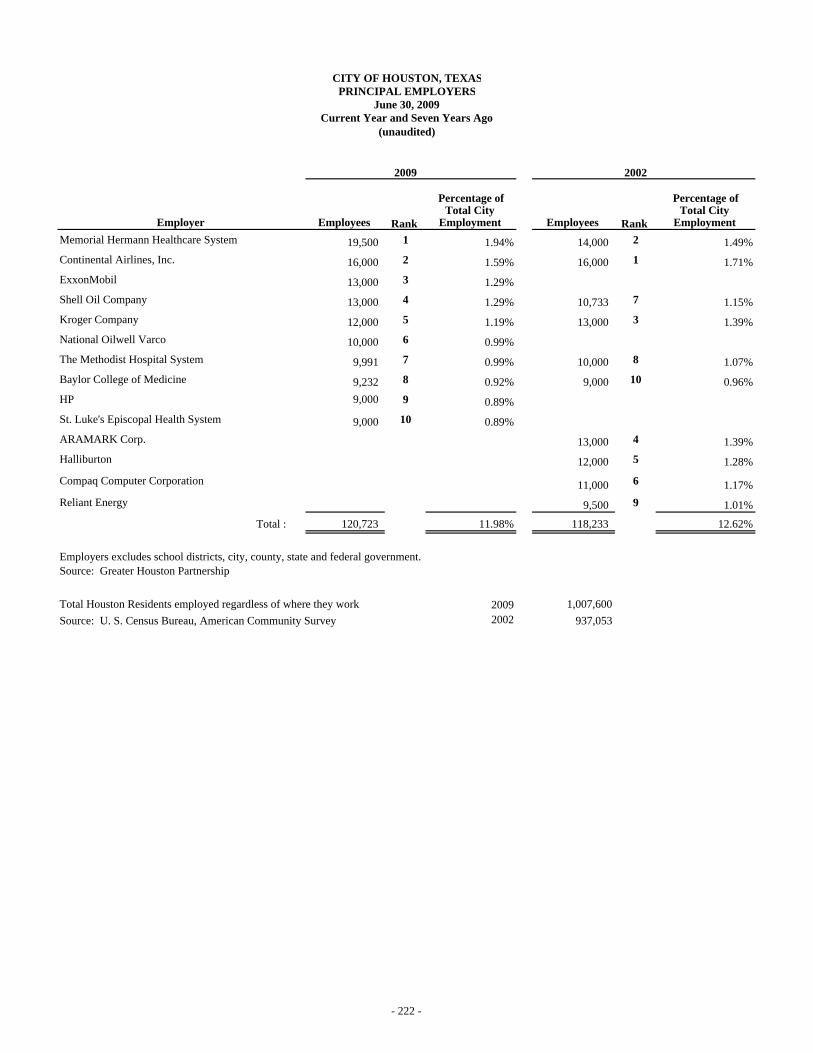
2009 2002
Percentage of Percentage ofTotal City Total City
Employer Employees Rank Employment Employees Rank Employment Memorial Hermann Healthcare System 19,500 1 1.94% 14,000 2 1.49%Continental Airlines, Inc. 16,000 2 1.59% 16,000 1 1.71%ExxonMobil 13,000 3 1.29%Shell Oil Company 13,000 4 1.29% 10,733 7 1.15%Kroger Company 12,000 5 1.19% 13,000 3 1.39%National Oilwell Varco 10,000 6 0.99%The Methodist Hospital System 9,991 7 0.99% 10,000 8 1.07%Baylor College of Medicine 9,232 8 0.92% 9,000 10 0.96%HP 9,000 9 0.89%St. Luke's Episcopal Health System 9,000 10 0.89%ARAMARK Corp. 13,000 4 1.39%Halliburton 12,000 5 1.28%
Compaq Computer Corporation 11,000 6 1.17%Reliant Energy 9,500 9 1.01%
Total : 120,723 11.98% 118,233 12.62%
Employers excludes school districts, city, county, state and federal government. Source: Greater Houston Partnership
Total Houston Residents employed regardless of where they work. 2009 1,007,600Source: U. S. Census Bureau, American Community Survey 2002 937,053
(unaudited)
CITY OF HOUSTON, TEXASPRINCIPAL EMPLOYERS
June 30, 2009Current Year and Seven Years Ago
- 222 -

CITY OF HOUSTON, TEXAS
This page is left blank intentionally
- 223 -

1999 2000
Civilian Labor Force(A) 2,185 2,387
Employed 2,089 2,284
Unemployed 97 103
Percent unemployed 4.40% 4.32%
Nonfarm Payroll Employment(B) 1,864 2,255
Manufacturing 206 232
Mining 63 62
Contract construction 154 172
Transp/Pub Utils/Communications 151 192
Trade 476 487
Finance/Insurance/Real Estate 117 86
Services & Miscellaneous 633 870
Government 272 309
(A)
(B)
Employment
CITY OF HOUSTON, TEXASEMPLOYMENT STATISTICS
June 30, 2009(unaudited)
Includes the non-agricultural wage and salary jobs estimated toexist in Houston PMSA without reference to place of residence ofworkers.
Includes resident wage and salary workers, self-employed, unpaidfamily workers and domestics in private households, agriculturalworkers, and workers involved in labor-management disputes.
The following table indicates the Houston PMSA estimated annual averagelabor force for the years 1999 through 2008 according to the TexasEmployment Commission:
Houston PMSA Labor Force Estimates(Employees in thousands)
- 224 -
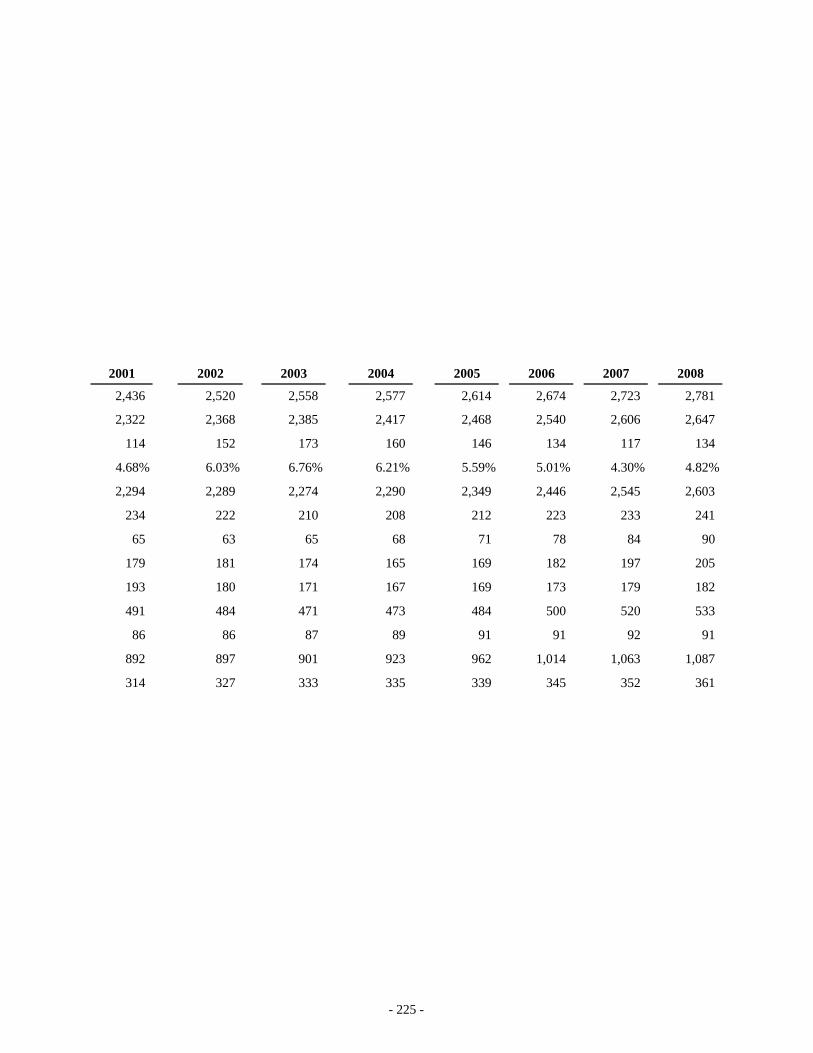
2001 2002 2003 2004 2005 2006 2007 2008
2,436 2,520 2,558 2,577 2,614 2,674 2,723 2,781
2,322 2,368 2,385 2,417 2,468 2,540 2,606 2,647
114 152 173 160 146 134 117 134
4.68% 6.03% 6.76% 6.21% 5.59% 5.01% 4.30% 4.82%
2,294 2,289 2,274 2,290 2,349 2,446 2,545 2,603
234 222 210 208 212 223 233 241
65 63 65 68 71 78 84 90
179 181 174 165 169 182 197 205
193 180 171 167 169 173 179 182
491 484 471 473 484 500 520 533
86 86 87 89 91 91 92 91
892 897 901 923 962 1,014 1,063 1,087
314 327 333 335 339 345 352 361
- 225 -

2002 2003 2004 2005 2006 2007 2008 2009Restated Restated
Fund/Department
GENERAL FUND
Public Safety Fire/Civilian 318.4 344.8 316.2 320.3 288.7 287.0 270.2 270.5Fire/Classified 3,729.7 3,717.0 3,647.7 3,716.0 4,123.5 4,070.3 3,997.5 4,058.3Fire/Cadets 162.5 268.2 392.8 181.5 38.5 103.0 113.5 95.7Municipal Courts - Administration 388.5 380.1 354.7 347.1 343.7 290.9 262.2 284.8Municipal Courts - Justice 45.2 46.8 45.3 41.6 45.3 47.6 49.4 50.6Police/Civilian 1,780.3 1,509.9 1,425.5 1,115.6 1,173.1 1,237.8 1,289.5 1,572.3Police/Classified 5,588.0 5,432.5 5,362.3 5,118.3 5,125.3 5,287.3 5,382.7 5,703.2Police/Cadets 87.3 74.0 36.2 26.7 81.8 130.9 176.8 221.6Total Public Safety 12,099.9 11,773.3 11,580.7 10,867.1 11,219.9 11,454.8 11,541.8 12,257.0
Development & Maintenance Services General Services 313.1 311.7 289.4 181.2 211.3 228.2 237.8 242.1Planning & Development 233.7 217.6 105.0 104.3 99.6 96.6 97.1 105.1Public Works & Engineering 1,032.6 860.4 567.5 841.3 539.9 548.4 556.7 568.3Solid Waste Management 617.1 581.2 545.9 576.9 576.4 546.6 655.0 667.2Total Development & Maintenance 2,196.5 1,970.9 1,507.8 1,703.7 1,427.2 1,419.8 1,546.6 1,582.7
Human & Cultural Services Convention & Entertainment Facilities - - - - 63.0 54.8 0.4 3.5Health & Human Services 898.0 834.7 776.6 767.1 797.9 725.8 684.5 741.3Housing & Community Development - - - - - - 1.3 2.3Library 604.8 520.3 531.2 443.0 473.1 484.5 497.3 530.5Parks & Recreation 1,094.8 993.0 768.2 741.0 772.8 814.1 815.8 869.4Total Human & Cultural Services 2,597.6 2,348.0 2,076.0 1,951.1 2,106.8 2,079.2 1,999.3 2,147.0
Administrative Services Administration & Regulatory Affairs - - - - - - 264.1 292.0City Secretary 15.8 13.7 13.8 12.1 12.1 11.6 11.1 11.5Controller's Office 84.3 80.0 76.3 74.9 70.7 73.7 74.7 76.3Council Office 78.9 74.0 68.2 61.5 71.3 68.1 71.4 73.3Finance & Administration 332.6 320.6 304.4 313.5 303.8 310.0 - - Finance Department - - - - - - 54.9 68.9Human Resources 52.9 45.9 43.0 38.6 38.2 37.9 39.1 39.3Information Technology 133.7 130.6 147.4 143.5 127.2 129.0 140.3 154.9Legal 163.6 158.7 153.4 146.4 144.0 152.8 158.7 168.1Mayor's Affirmative Action 30.5 29.6 24.7 27.2 25.7 25.8 32.4 34.1Mayor's Office 25.0 24.2 21.9 20.2 48.8 43.5 39.6 37.1Total Administrative Services 917.3 877.3 853.1 837.9 841.8 852.4 886.3 955.5
Total General Fund 17,811.3 16,969.5 16,017.6 15,359.8 15,595.7 15,806.2 15,974.0 16,942.2
Full-time Equivalent Employees as of June 30
CITY OF HOUSTON, TEXASLast Eight Years
CITY OF HOUSTON EMPLOYMENT INFORMATION(unaudited)
- 226 -
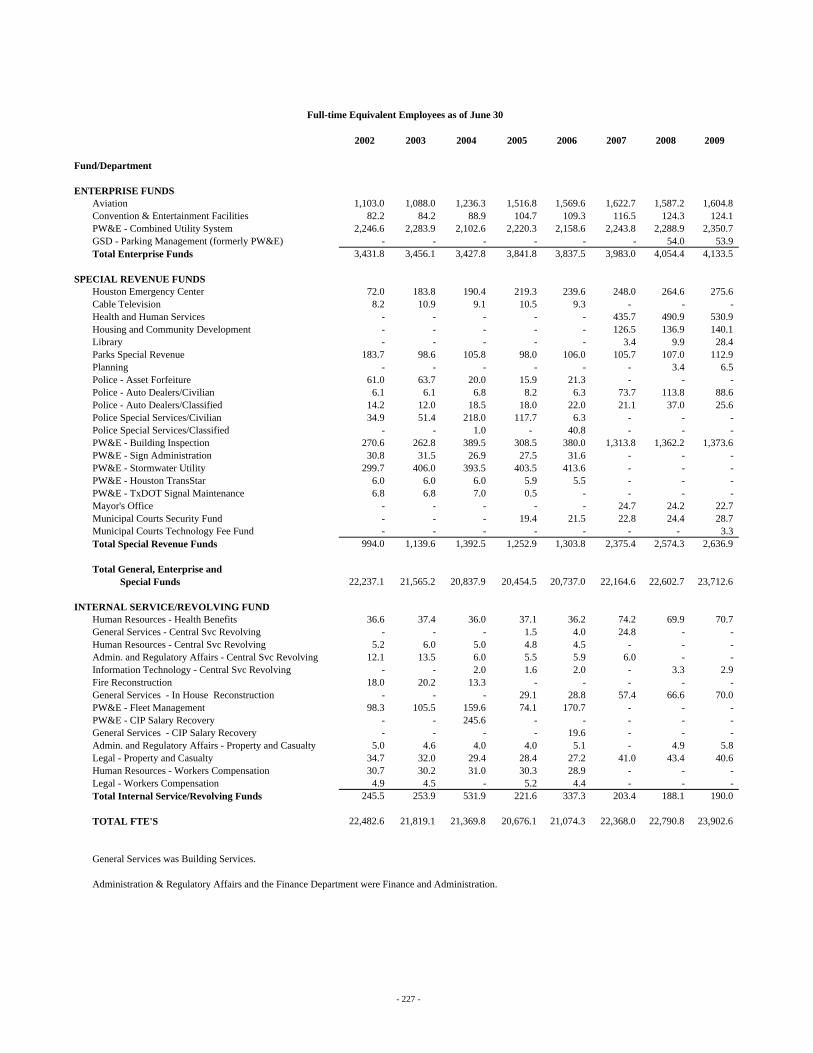
2002 2003 2004 2005 2006 2007 2008 2009
Fund/Department
ENTERPRISE FUNDS Aviation 1,103.0 1,088.0 1,236.3 1,516.8 1,569.6 1,622.7 1,587.2 1,604.8Convention & Entertainment Facilities 82.2 84.2 88.9 104.7 109.3 116.5 124.3 124.1PW&E - Combined Utility System 2,246.6 2,283.9 2,102.6 2,220.3 2,158.6 2,243.8 2,288.9 2,350.7GSD - Parking Management (formerly PW&E) - - - - - - 54.0 53.9Total Enterprise Funds 3,431.8 3,456.1 3,427.8 3,841.8 3,837.5 3,983.0 4,054.4 4,133.5
SPECIAL REVENUE FUNDS Houston Emergency Center 72.0 183.8 190.4 219.3 239.6 248.0 264.6 275.6Cable Television 8.2 10.9 9.1 10.5 9.3 - - - Health and Human Services - - - - - 435.7 490.9 530.9Housing and Community Development - - - - - 126.5 136.9 140.1Library - - - - - 3.4 9.9 28.4Parks Special Revenue 183.7 98.6 105.8 98.0 106.0 105.7 107.0 112.9Planning - - - - - - 3.4 6.5Police - Asset Forfeiture 61.0 63.7 20.0 15.9 21.3 - - - Police - Auto Dealers/Civilian 6.1 6.1 6.8 8.2 6.3 73.7 113.8 88.6Police - Auto Dealers/Classified 14.2 12.0 18.5 18.0 22.0 21.1 37.0 25.6Police Special Services/Civilian 34.9 51.4 218.0 117.7 6.3 - - - Police Special Services/Classified - - 1.0 - 40.8 - - - PW&E - Building Inspection 270.6 262.8 389.5 308.5 380.0 1,313.8 1,362.2 1,373.6PW&E - Sign Administration 30.8 31.5 26.9 27.5 31.6 - - - PW&E - Stormwater Utility 299.7 406.0 393.5 403.5 413.6 - - - PW&E - Houston TransStar 6.0 6.0 6.0 5.9 5.5 - - - PW&E - TxDOT Signal Maintenance 6.8 6.8 7.0 0.5 - - - - Mayor's Office - - - - - 24.7 24.2 22.7 Municipal Courts Security Fund - - - 19.4 21.5 22.8 24.4 28.7Municipal Courts Technology Fee Fund - - - - - - - 3.3Total Special Revenue Funds 994.0 1,139.6 1,392.5 1,252.9 1,303.8 2,375.4 2,574.3 2,636.9
Total General, Enterprise and Special Funds 22,237.1 21,565.2 20,837.9 20,454.5 20,737.0 22,164.6 22,602.7 23,712.6
INTERNAL SERVICE/REVOLVING FUND Human Resources - Health Benefits 36.6 37.4 36.0 37.1 36.2 74.2 69.9 70.7General Services - Central Svc Revolving - - - 1.5 4.0 24.8 - - Human Resources - Central Svc Revolving 5.2 6.0 5.0 4.8 4.5 - - - Admin. and Regulatory Affairs - Central Svc Revolving 12.1 13.5 6.0 5.5 5.9 6.0 - - Information Technology - Central Svc Revolving - - 2.0 1.6 2.0 - 3.3 2.9Fire Reconstruction 18.0 20.2 13.3 - - - - - General Services - In House Reconstruction - - - 29.1 28.8 57.4 66.6 70.0PW&E - Fleet Management 98.3 105.5 159.6 74.1 170.7 - - - PW&E - CIP Salary Recovery - - 245.6 - - - - - General Services - CIP Salary Recovery - - - - 19.6 - - - Admin. and Regulatory Affairs - Property and Casualty 5.0 4.6 4.0 4.0 5.1 - 4.9 5.8Legal - Property and Casualty 34.7 32.0 29.4 28.4 27.2 41.0 43.4 40.6Human Resources - Workers Compensation 30.7 30.2 31.0 30.3 28.9 - - - Legal - Workers Compensation 4.9 4.5 - 5.2 4.4 - - - Total Internal Service/Revolving Funds 245.5 253.9 531.9 221.6 337.3 203.4 188.1 190.0
TOTAL FTE'S 22,482.6 21,819.1 21,369.8 20,676.1 21,074.3 22,368.0 22,790.8 23,902.6
General Services was Building Services.
Administration & Regulatory Affairs and the Finance Department were Finance and Administration.
Full-time Equivalent Employees as of June 30
- 227 -
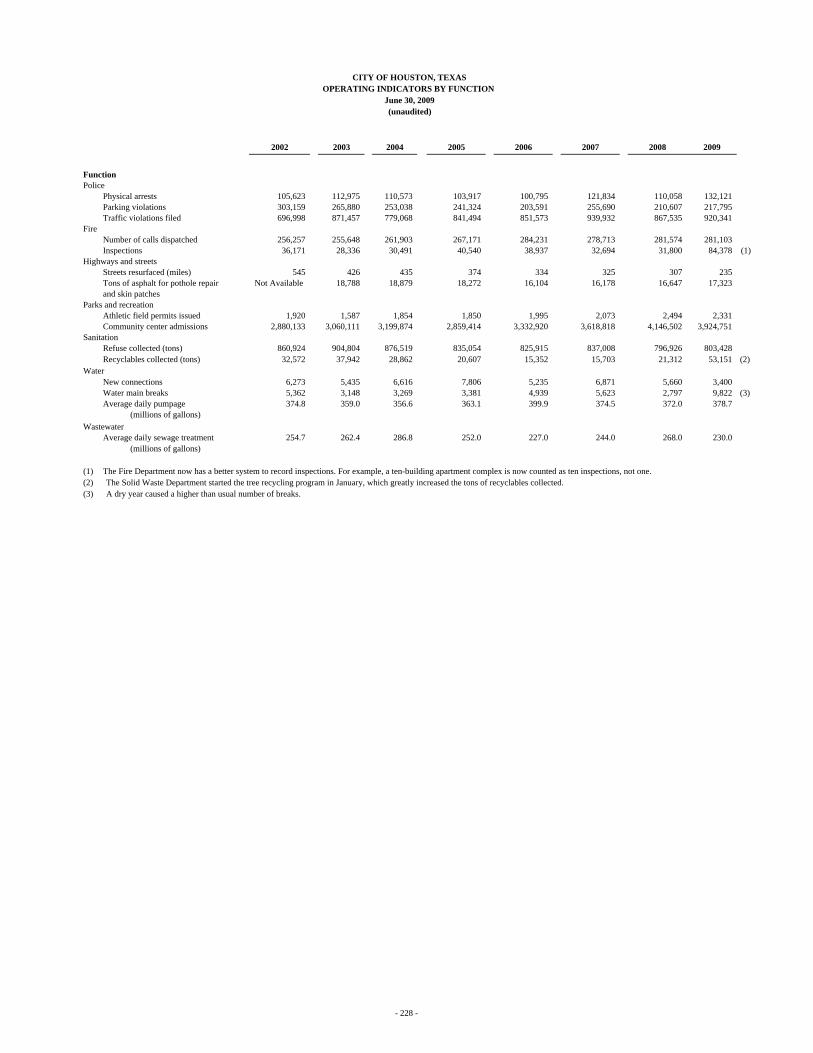
2002 2003 2004 2005 2006 2007 2008 2009
Function Police
Physical arrests 105,623 112,975 110,573 103,917 100,795 121,834 110,058 132,121 Parking violations 303,159 265,880 253,038 241,324 203,591 255,690 210,607 217,795 Traffic violations filed 696,998 871,457 779,068 841,494 851,573 939,932 867,535 920,341
Fire Number of calls dispatched 256,257 255,648 261,903 267,171 284,231 278,713 281,574 281,103Inspections 36,171 28,336 30,491 40,540 38,937 32,694 31,800 84,378 (1)
Highways and streetsStreets resurfaced (miles) 545 426 435 374 334 325 307 235 Tons of asphalt for pothole repair Not Available 18,788 18,879 18,272 16,104 16,178 16,647 17,323 and skin patches
Parks and recreation Athletic field permits issued 1,920 1,587 1,854 1,850 1,995 2,073 2,494 2,331 Community center admissions 2,880,133 3,060,111 3,199,874 2,859,414 3,332,920 3,618,818 4,146,502 3,924,751
Sanitation Refuse collected (tons) 860,924 904,804 876,519 835,054 825,915 837,008 796,926 803,428
Recyclables collected (tons) 32,572 37,942 28,862 20,607 15,352 15,703 21,312 53,151 (2)Water
New connections 6,273 5,435 6,616 7,806 5,235 6,871 5,660 3,400Water main breaks 5,362 3,148 3,269 3,381 4,939 5,623 2,797 9,822 (3)Average daily pumpage 374.8 359.0 356.6 363.1 399.9 374.5 372.0 378.7
(millions of gallons)Wastewater
Average daily sewage treatment 254.7 262.4 286.8 252.0 227.0 244.0 268.0 230.0(millions of gallons)
(1) The Fire Department now has a better system to record inspections. For example, a ten-building apartment complex is now counted as ten inspections, not one.(2) The Solid Waste Department started the tree recycling program in January, which greatly increased the tons of recyclables collected. (3) A dry year caused a higher than usual number of breaks.
CITY OF HOUSTON, TEXASOPERATING INDICATORS BY FUNCTION
June 30, 2009(unaudited)
- 228 -
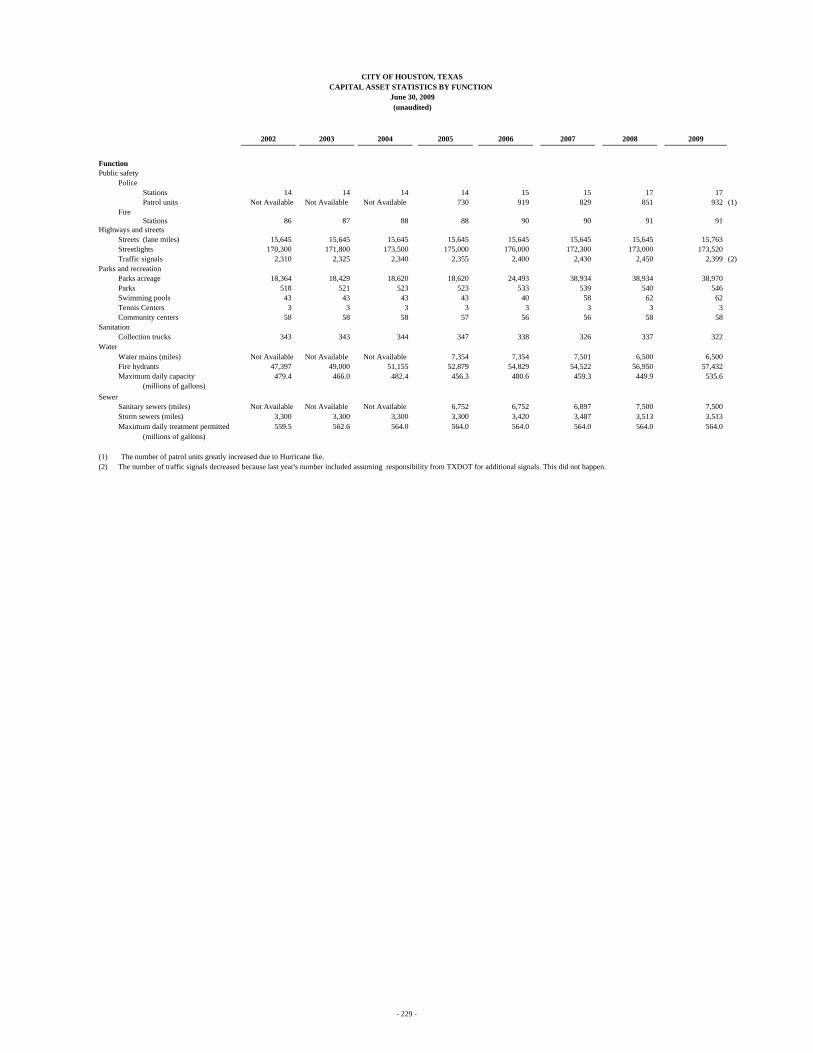
2002 2003 2004 2005 2006 2007 2008 2009
Function Public safety
Police Stations 14 14 14 14 15 15 17 17 Patrol units Not Available Not Available Not Available 730 919 829 851 932 (1)
Fire Stations 86 87 88 88 90 90 91 91
Highways and streetsStreets (lane miles) 15,645 15,645 15,645 15,645 15,645 15,645 15,645 15,763Streetlights 170,300 171,800 173,500 175,000 176,000 172,300 173,000 173,520Traffic signals 2,310 2,325 2,340 2,355 2,400 2,430 2,450 2,399 (2)
Parks and recreation Parks acreage 18,364 18,429 18,620 18,620 24,493 38,934 38,934 38,970Parks 518 521 523 523 533 539 540 546Swimming pools 43 43 43 43 40 58 62 62Tennis Centers 3 3 3 3 3 3 3 3Community centers 58 58 58 57 56 56 58 58
Sanitation Collection trucks 343 343 344 347 338 326 337 322
WaterWater mains (miles) Not Available Not Available Not Available 7,354 7,354 7,501 6,500 6,500Fire hydrants 47,397 49,000 51,155 52,879 54,829 54,522 56,950 57,432Maximum daily capacity 479.4 466.0 482.4 456.3 480.6 459.3 449.9 535.6
(millions of gallons)Sewer
Sanitary sewers (miles) Not Available Not Available Not Available 6,752 6,752 6,897 7,500 7,500Storm sewers (miles) 3,300 3,300 3,300 3,300 3,420 3,487 3,513 3,513Maximum daily treatment permitted 559.5 562.6 564.0 564.0 564.0 564.0 564.0 564.0
(millions of gallons)
(1) The number of patrol units greatly increased due to Hurricane Ike. (2) The number of traffic signals decreased because last year's number included assuming responsibility from TXDOT for additional signals. This did not happen.
CITY OF HOUSTON, TEXASCAPITAL ASSET STATISTICS BY FUNCTION
June 30, 2009(unaudited)
- 229 -
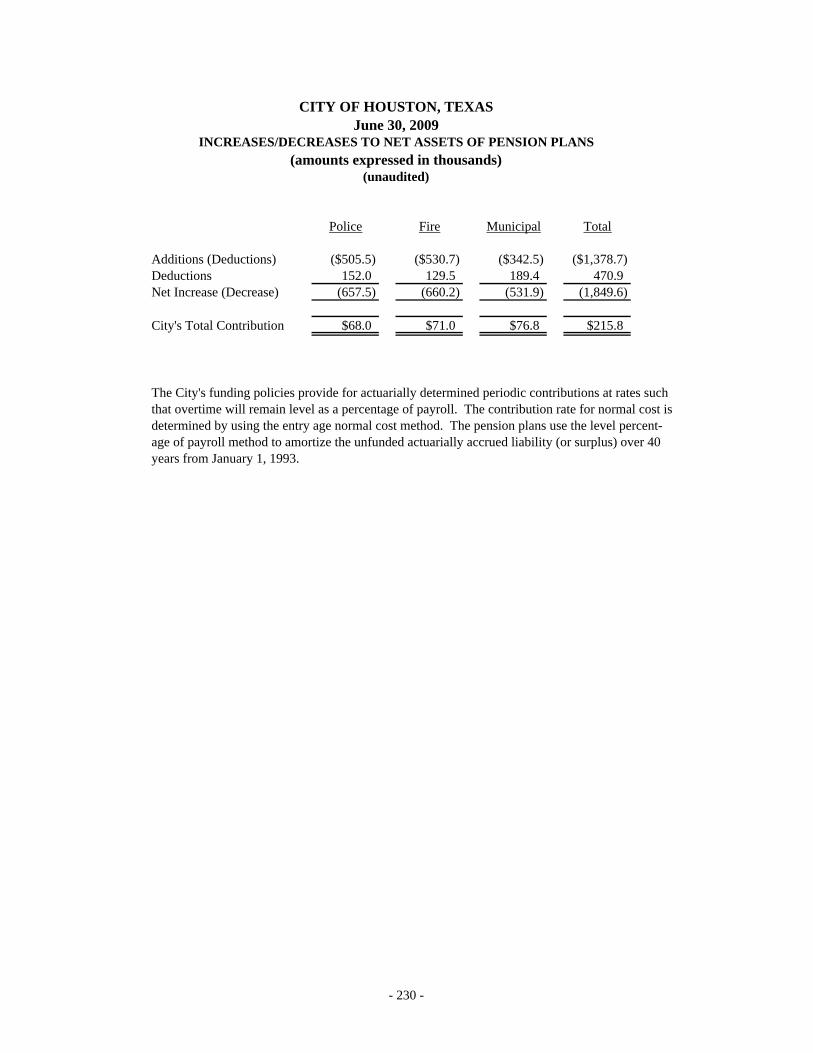
Police Fire Municipal Total
Additions (Deductions) ($505.5) ($530.7) ($342.5) ($1,378.7)Deductions 152.0 129.5 189.4 470.9Net Increase (Decrease) (657.5) (660.2) (531.9) (1,849.6)
City's Total Contribution $68.0 $71.0 $76.8 $215.8
The City's funding policies provide for actuarially determined periodic contributions at rates such that overtime will remain level as a percentage of payroll. The contribution rate for normal cost is determined by using the entry age normal cost method. The pension plans use the level percent-age of payroll method to amortize the unfunded actuarially accrued liability (or surplus) over 40years from January 1, 1993.
(unaudited)
CITY OF HOUSTON, TEXASJune 30, 2009
INCREASES/DECREASES TO NET ASSETS OF PENSION PLANS(amounts expressed in thousands)
- 230 -
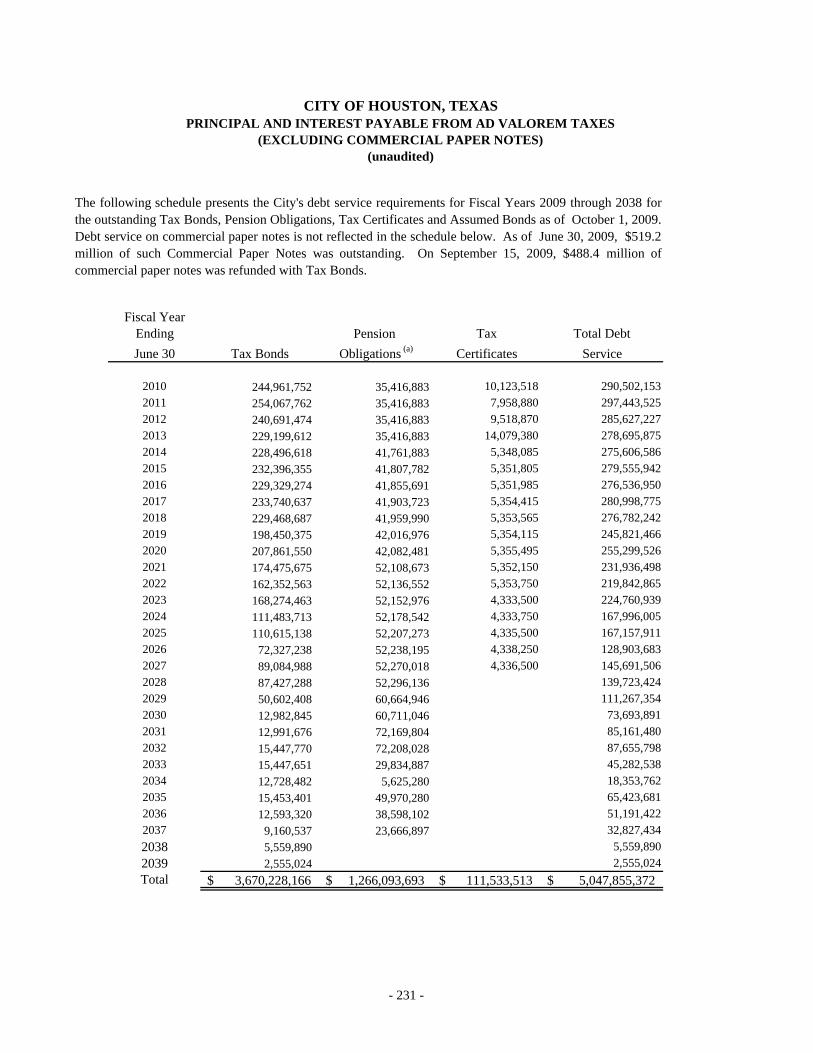
Fiscal YearEnding Pension Tax Total DebtJune 30 Tax Bonds Obligations (a) Certificates Service
2010 244,961,752 35,416,883 10,123,518 290,502,153 2011 254,067,762 35,416,883 7,958,880 297,443,525 2012 240,691,474 35,416,883 9,518,870 285,627,227 2013 229,199,612 35,416,883 14,079,380 278,695,875 2014 228,496,618 41,761,883 5,348,085 275,606,586 2015 232,396,355 41,807,782 5,351,805 279,555,942 2016 229,329,274 41,855,691 5,351,985 276,536,950 2017 233,740,637 41,903,723 5,354,415 280,998,775 2018 229,468,687 41,959,990 5,353,565 276,782,242 2019 198,450,375 42,016,976 5,354,115 245,821,466 2020 207,861,550 42,082,481 5,355,495 255,299,526 2021 174,475,675 52,108,673 5,352,150 231,936,498 2022 162,352,563 52,136,552 5,353,750 219,842,865 2023 168,274,463 52,152,976 4,333,500 224,760,939 2024 111,483,713 52,178,542 4,333,750 167,996,005 2025 110,615,138 52,207,273 4,335,500 167,157,911 2026 72,327,238 52,238,195 4,338,250 128,903,683 2027 89,084,988 52,270,018 4,336,500 145,691,506 2028 87,427,288 52,296,136 139,723,424 2029 50,602,408 60,664,946 111,267,354 2030 12,982,845 60,711,046 73,693,891 2031 12,991,676 72,169,804 85,161,480 2032 15,447,770 72,208,028 87,655,798 2033 15,447,651 29,834,887 45,282,538 2034 12,728,482 5,625,280 18,353,762 2035 15,453,401 49,970,280 65,423,681 2036 12,593,320 38,598,102 51,191,422 2037 9,160,537 23,666,897 32,827,434 2038 5,559,890 5,559,890 2039 2,555,024 2,555,024 Total 3,670,228,166$ 1,266,093,693$ 111,533,513$ 5,047,855,372$
The following schedule presents the City's debt service requirements for Fiscal Years 2009 through 2038 forthe outstanding Tax Bonds, Pension Obligations, Tax Certificates and Assumed Bonds as of October 1, 2009.Debt service on commercial paper notes is not reflected in the schedule below. As of June 30, 2009, $519.2million of such Commercial Paper Notes was outstanding. On September 15, 2009, $488.4 million ofcommercial paper notes was refunded with Tax Bonds.
CITY OF HOUSTON, TEXASPRINCIPAL AND INTEREST PAYABLE FROM AD VALOREM TAXES
(EXCLUDING COMMERCIAL PAPER NOTES)(unaudited)
- 231 -

June 30, 2009VOTER-AUTHORIZED OBLIGATIONS
(Unaudited)
The following schedule sets forth the categories of bond authorization approved by the voters in elections held inNovember of 2001 (the "2001 Election") and November of 2006 (the "2006 Election"), the amount of each suchauthorization approved by City Council for issuance as Commercial Paper Notes, the amount of commercial paper. issued as of year-end, and the amount of commercial paper approved but unissued.
November 2001 ElectionApproved by City Commercial Paper
Council for Issuance Commercial Notes ApprovedVoter as Commercial Paper by City Council
Purposes Authorized Paper Notes Issued (a) but Unissued
Streets, Bridges, Traffic Control and Storm Sewers and Drainage 474,000$ 474,000$ 352,725$ 121,275$ Parks and Recreation 80,000 80,000 79,900 100Police and Fire Departments 82,000 82,000 75,740 6,260Permanent and General Improvements (b) 80,000 80,000 64,510 15,490Public Libraries 40,000 40,000 30,100 9,900Low Income Housing 20,000 20,000 5,620 14,380 Total 776,000$ 776,000$ 608,595$ 167,405$
November 2006 ElectionApproved by City Commercial Paper
Council for Issuance Commercial Notes ApprovedVoter as Commercial Paper by City Council
Purposes Authorized Paper Notes Issued (a) but Unissued
Streets, Bridges, Traffic Control and Storm Sewers and Drainage 320,000$ 79,550$ 16,420$ 63,130$ Parks and Recreation 55,000 23,100 - 23,100Public Safety 135,000 60,450 3,000 57,450Permanent and General Improvements (b) 60,000 27,400 3,500 23,900 Public Libraries 37,000 25,675 3,000 22,675Low Income Housing 18,000 7,375 - 7,375 Total 625,000$ 223,550$ 25,920$ 197,630$
Combined Total (2001 and2006 Elections) 1,401,000$ 999,550$ 634,515$ 365,035$
(a) As of June 30, 2009(b) Includes Public Health and Solid Waste Management.
CITY OF HOUSTON, TEXAS
- 232 -
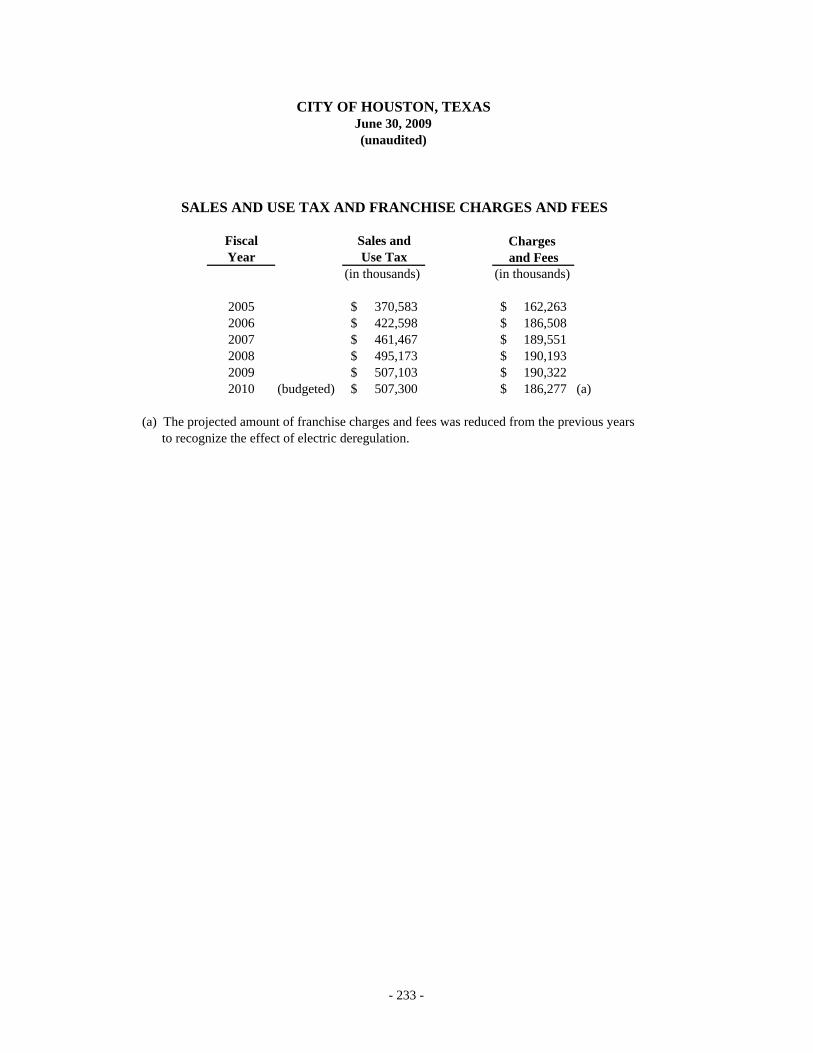
Fiscal Sales and Charges Year Use Tax and Fees
(in thousands) (in thousands)
2005 370,583$ 162,263$ 2006 422,598$ 186,508$ 2007 461,467$ 189,551$ 2008 495,173$ 190,193$ 2009 507,103$ 190,322$ 2010 (budgeted) 507,300$ 186,277$ (a)
(a) The projected amount of franchise charges and fees was reduced from the previous years to recognize the effect of electric deregulation.
SALES AND USE TAX AND FRANCHISE CHARGES AND FEES
CITY OF HOUSTON, TEXASJune 30, 2009(unaudited)
- 233 -
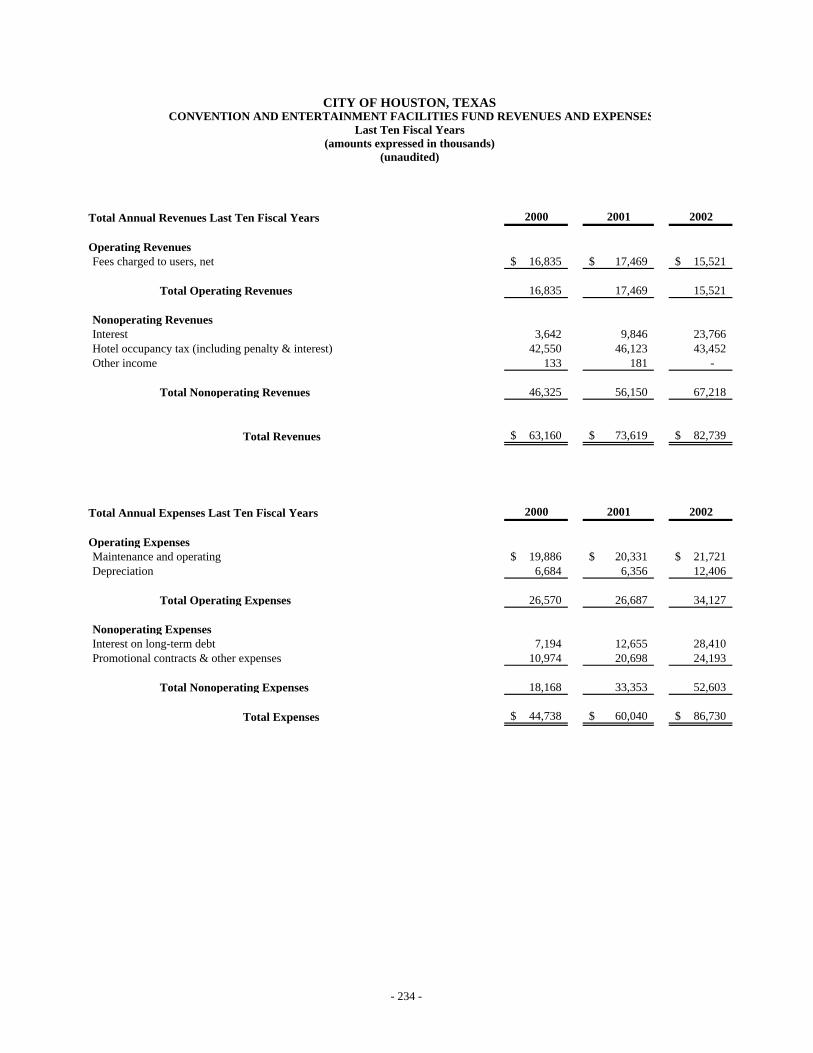
Total Annual Revenues Last Ten Fiscal Years 2000 2001 2002
Operating RevenuesFees charged to users, net 16,835$ 17,469$ 15,521$
Total Operating Revenues 16,835 17,469 15,521
Nonoperating RevenuesInterest 3,642 9,846 23,766 Hotel occupancy tax (including penalty & interest) 42,550 46,123 43,452 Other income 133 181 -
Total Nonoperating Revenues 46,325 56,150 67,218
Total Revenues 63,160$ 73,619$ 82,739$
Total Annual Expenses Last Ten Fiscal Years 2000 2001 2002
Operating ExpensesMaintenance and operating 19,886$ 20,331$ 21,721$ Depreciation 6,684 6,356 12,406
Total Operating Expenses 26,570 26,687 34,127
Nonoperating ExpensesInterest on long-term debt 7,194 12,655 28,410 Promotional contracts & other expenses 10,974 20,698 24,193
Total Nonoperating Expenses 18,168 33,353 52,603
Total Expenses 44,738$ 60,040$ 86,730$
(unaudited)
CITY OF HOUSTON, TEXASCONVENTION AND ENTERTAINMENT FACILITIES FUND REVENUES AND EXPENSES
Last Ten Fiscal Years(amounts expressed in thousands)
- 234 -

2003 2004 2005 2006 2007 2008 2009
17,010$ 17,145$ 19,175$ 19,599$ 20,554$ 22,306$ 20,902$
17,010 17,145 19,175 19,599 20,554 22,306 20,902
14,311 13,109 15,926 16,729 18,704 19,186 17,688 43,169 47,223 42,266 54,765 58,709 66,232 62,383
713 - 7,279 4,190 13,215 5,669 113,265
58,193 60,332 65,471 75,684 90,628 91,087 193,336
75,203$ 77,477$ 84,646$ 95,283$ 111,182$ 113,393$ 214,238$
2003 2004 2005 2006 2007 2008 2009
24,830$ 28,791$ 32,797$ 33,437$ 35,342$ 37,276$ 39,142$ 13,274 14,077 10,372 10,984 11,925 12,084 14,888
38,104 42,868 43,169 44,421 47,267 49,360 54,030
19,347 25,413 29,468 30,970 32,859 33,150 29,740 19,305 23,307 61,694 23,880 21,119 28,659 30,840
38,652 48,720 91,162 54,850 53,978 61,809 60,580
76,756$ 91,588$ 134,331$ 99,271$ 101,245$ 111,169$ 114,610$
- 235 -

PledgedFiscal Pledged Parking TaxYear HOT (a) % Change Revenues (b) % Change Rebates % Change Total (c)
2000 34,344 0.2% 6,935 22.8% -- -- 41,279
2001 37,228 8.4% 7,430 7.1% -- -- 44,658
2002 35,072 -5.8% 6,090 -18.0% -- -- 41,162
2003 34,844 -0.7% 8,311 36.5% -- -- 43,155
2004 38,115 9.4% 7,039 -15.3% 1,244 -- 46,398
2005 34,115 -10.5% 6,473 -8.0% 2,462 97.9% 43,050
2006 44,204 29.6% 6,619 2.3% 5,831 136.8% 56,654
2007 47,387 7.2% 6,681 0.9% 6,658 14.2% 60,726
2008 53,459 12.8% 7,233 8.3% 6,417 -3.6% 67,109
2009 49,694 -7.0% 6,610 -8.6% 6,709 4.6% 63,013
(a ) The Pledged Hotel Occupancy Tax (HOT) revenues are revenues (including penalties, interest and delinquencies, if any)collected due to an occupancy tax of 5.65% applied to the cost of substantially all hotel room rentals in the City other thanthe Hilton Americas Hotel during the first ten years of its operation. The total HOT imposed by the City is 7%.
(b ) The Pledged Parking Revenue shown has been reduced by $1.2 million each year, due to the prior pledge of revenues under the Music Hall Agreement.
(c ) The Tax Rebates consist of rebates of hotel occupancy taxes, sales taxes, and mixed beverage taxes derived from the Hilton Americas Hotel and parking garage during the first ten years of operation.
(d) Amounts shown do not include investment earnings on pledged revenues, which are also pledged.
MixedFiscal HOT Tax Sales Tax Beverage Total Tax Year 15% 8.25% (1) Tax 3% Rebate
2004 1,081$ 111$ 52$ 1,244$ 2005 2,188 190 84 2,4622006 5,553 197 81 5,8312007 6,232 296 130 6,6582008 6,082 233 102 6,4172009 6,306 295 108 6,709
(1) Includes taxes on food, telephone and other sales
(amounts expressed in thousands) Historical Tax Rebates
CITY OF HOUSTON, TEXASCONVENTION AND ENTERTAINMENT FACILITIES STATISTICS
Last Ten Fiscal Years
HISTORICAL PLEDGED REVENUES(amounts expressed in thousands)
(unaudited)
- 236 -

Gross HotelOccupancy Tax
Fiscal Occupancy Average Tax RevenuesYear % Rate (1) Daily Rate (1) % Rate (in thousands)
2000 65.6% 90.02 7% 42,550
2001 68.9% 90.50 7% 46,123
2002 63.2% 90.79 7% 43,452
2003 60.4% 85.89 7% 43,169
2004 61.9% 88.61 7% 47,223
2005 69.5% 89.57 7% 44,414
2006 68.9% 102.21 7% 60,319
2007 66.7% 119.31 7% 63,372
2008 69.0% 128.83 7% 72,314
2009 65.7% 125.24 7% 68,688
(1) Source: Greater Houston Partnership.
CITY OF HOUSTON, TEXAS
Schedule of Hotel Occupancy Tax and Occupancy Rates
(unaudited)Last Ten Fiscal Years
CONVENTION AND ENTERTAINMENT FACILITIES STATISTICS
- 237 -

Schedule of Hotel Occupancy Tax Collections
Gross Hotel OccupancyThe Twelve Largest Taxpayers Tax Collections
Hilton Americas-Houston 2,685,110$
Hyatt Regency Hotel 1,781,507
JW Marriott Galleria 1,513,555
Four Seasons Hotel Houston Center 1,428,797
Westin Galleria 1,240,782
Hilton Houston Post Oak 1,237,762
Houston Marriott Briarpark 1,166,825
Marriott Hotel 1,161,002
Hilton Houston Greenspoint 1,110,399
Houstonian Hotel 1,044,354
Inter Continental Houston 990,827
Marriott Medical 963,745
Total 16,324,665$
Top Ten Clients (Excluding Hotel Occupancy Tax Revenues)
Hobby Center for the Performing Arts 105,968,487$
Republic Parking Systems 8,885,201
FEMA 3,340,471
Aramark 3,046,264
Houston Convention Center Hotel Corporation 1,580,587
Smart City 1,504,404
AVW 679,803
Miller Outdoor Theatre Advisory Board 520,971
Houston Symphony Society 414,318
Houston Grand Opera 334,137
Total 126,274,643$
CITY OF HOUSTON, TEXASCONVENTION AND ENTERTAINMENT FACILITIES STATISTICS
For Fiscal Year 2009(unaudited)
- 238 -
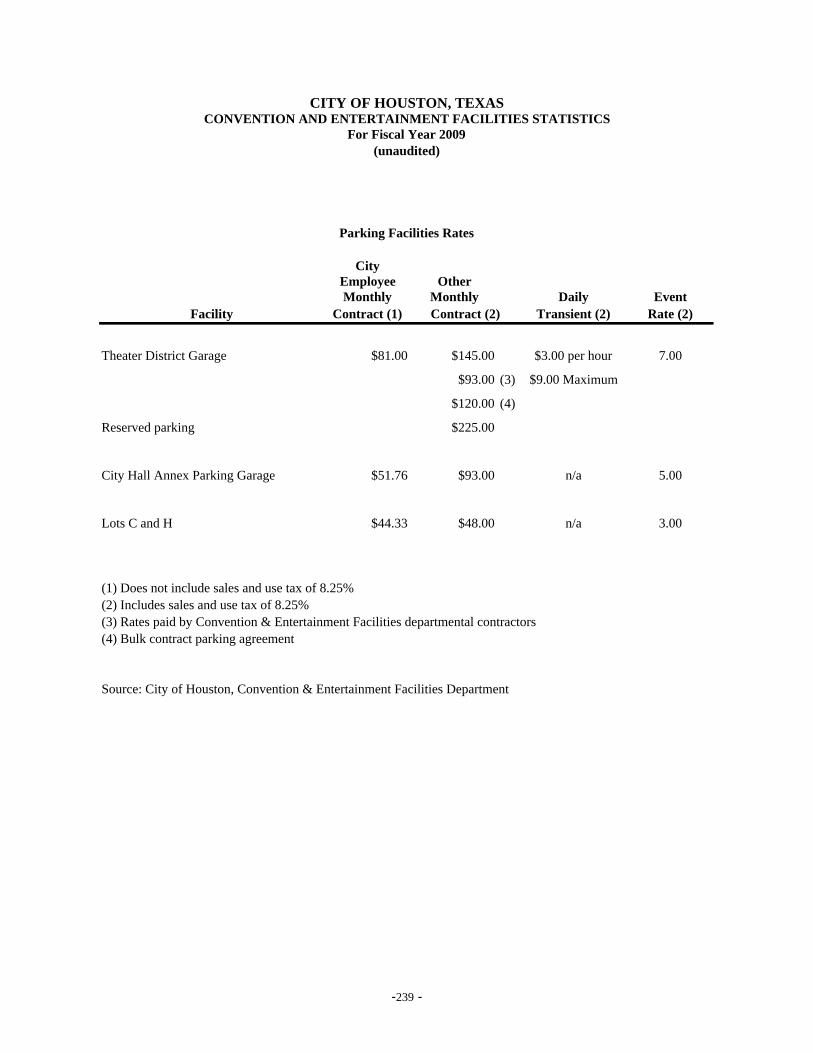
Parking Facilities Rates
CityEmployee OtherMonthly Monthly Daily Event
Facility Contract (1) Contract (2) Transient (2) Rate (2)
Theater District Garage $81.00 $145.00 $3.00 per hour 7.00
$93.00 (3) $9.00 Maximum
$120.00 (4)
Reserved parking $225.00
City Hall Annex Parking Garage $51.76 $93.00 n/a 5.00
Lots C and H $44.33 $48.00 n/a 3.00
(1) Does not include sales and use tax of 8.25%(2) Includes sales and use tax of 8.25%(3) Rates paid by Convention & Entertainment Facilities departmental contractors(4) Bulk contract parking agreement
Source: City of Houston, Convention & Entertainment Facilities Department
CITY OF HOUSTON, TEXASCONVENTION AND ENTERTAINMENT FACILITIES STATISTICS
For Fiscal Year 2009(unaudited)
-239 -
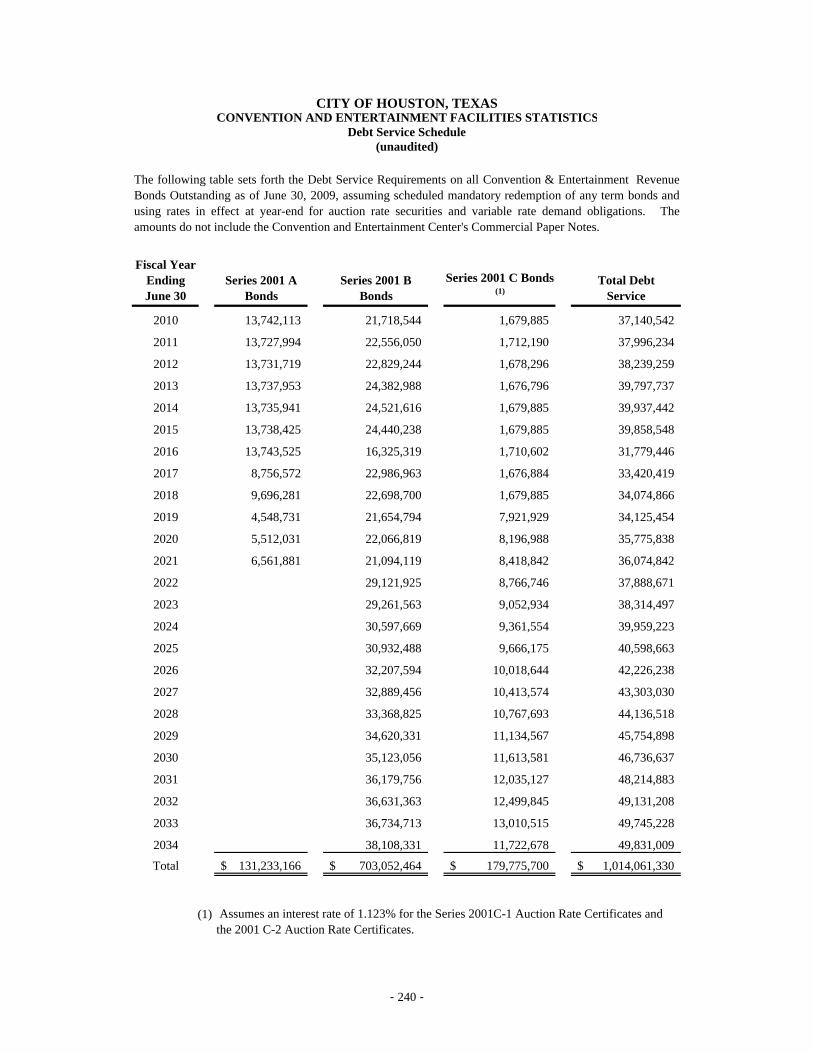
Fiscal YearEndingJune 30
Series 2001 A Bonds
Series 2001 B Bonds
Series 2001 C Bonds (1)
Total DebtService
2010 13,742,113 21,718,544 1,679,885 37,140,542
2011 13,727,994 22,556,050 1,712,190 37,996,234
2012 13,731,719 22,829,244 1,678,296 38,239,259
2013 13,737,953 24,382,988 1,676,796 39,797,737
2014 13,735,941 24,521,616 1,679,885 39,937,442
2015 13,738,425 24,440,238 1,679,885 39,858,548
2016 13,743,525 16,325,319 1,710,602 31,779,446
2017 8,756,572 22,986,963 1,676,884 33,420,419
2018 9,696,281 22,698,700 1,679,885 34,074,866
2019 4,548,731 21,654,794 7,921,929 34,125,454
2020 5,512,031 22,066,819 8,196,988 35,775,838
2021 6,561,881 21,094,119 8,418,842 36,074,842
2022 29,121,925 8,766,746 37,888,671
2023 29,261,563 9,052,934 38,314,497
2024 30,597,669 9,361,554 39,959,223
2025 30,932,488 9,666,175 40,598,663
2026 32,207,594 10,018,644 42,226,238
2027 32,889,456 10,413,574 43,303,030
2028 33,368,825 10,767,693 44,136,518
2029 34,620,331 11,134,567 45,754,898
2030 35,123,056 11,613,581 46,736,637
2031 36,179,756 12,035,127 48,214,883
2032 36,631,363 12,499,845 49,131,208
2033 36,734,713 13,010,515 49,745,228
2034 38,108,331 11,722,678 49,831,009
Total 131,233,166$ 703,052,464$ 179,775,700$ 1,014,061,330$
(1)
CITY OF HOUSTON, TEXASCONVENTION AND ENTERTAINMENT FACILITIES STATISTICS
Debt Service Schedule
Assumes an interest rate of 1.123% for the Series 2001C-1 Auction Rate Certificates and the 2001 C-2 Auction Rate Certificates.
(unaudited)
The following table sets forth the Debt Service Requirements on all Convention & Entertainment RevenueBonds Outstanding as of June 30, 2009, assuming scheduled mandatory redemption of any term bonds andusing rates in effect at year-end for auction rate securities and variable rate demand obligations. Theamounts do not include the Convention and Entertainment Center's Commercial Paper Notes.
- 240 -

Budgeted Resources
Operating RevenuesFacility Rentals 6,510$ Parking 10,058 Food and Beverage Concessions 4,013 Contract Cleaning 398
Total Operating Revenues 20,979
Operating ExpensesPersonnel 10,271 Supplies 676 Services 28,801
Total Operating Expenses 39,748 Operating Income (Loss) (18,769)
Nonoperating Revenues (Expenses)Hotel Occupancy Tax
Current 58,000 Delinquent 750
Advertising Services (13,340) Promotion Contracts (11,194) Contracts/Sponsorships (2,300)
Net Hotel Occupancy Tax 31,916 Investment Income (Loss) 1,100 Capital Outlay - Non-Capital Outlay (79) Other Interest (1,380) Other 2,840
Total nonoperating Rev (Exp) 34,397 Income (Loss) Before Operating Transfers 15,628
TransfersTransfers to Interest 6,646 Transfers to Principal 11,617 Interfund Transfers 4,126 Miller Outdoor Theater Transfer (1,170) Transfers to Special (100) Contingency/Reserve -
Total Transfers 21,119 Net Income (Loss) Operating Fund (5,491)$
(unaudited)
Convention & Entertainment Budget for Fiscal Year 2010 (amounts expressed in thousands)
CITY OF HOUSTON, TEXASCONVENTION AND ENTERTAINMENT FACILITIES STATISTICS
For Fiscal Year 2009
- 241 -

Total Annual Revenues Last Ten Fiscal Years 2000 2001 2002 2003 2004
Operating RevenuesWater sales 281,757$ 271,553$ 271,098$ 267,125$ 265,272$ Waste water system user charges 275,782 268,492 265,091 264,159 257,225 Penalties 3,493 4,440 4,214 4,036 4,150 Other services and charges 3,006 2,807 2,993 3,997 4,561
Total Operating Revenues 564,038 547,292 543,396 539,317 531,208
Nonoperating RevenuesInterest 32,019 56,914 33,703 24,043 6,889 Other income 20,641 22,511 32,368 26,894 26,179
Total Nonoperating Revenues 52,660 79,425 66,071 50,937 33,068
Total Revenues 616,698$ 626,717$ 609,467$ 590,254$ 564,276$
Total Annual Expenses Last Ten Fiscal Years 2000 2001 2002 2003 2004
Operating ExpensesMaintenance and operating 225,258$ 248,603$ 245,943$ 250,226$ 266,718$ Depreciation and Amortization 212,846 256,959 228,147 233,401 209,608 Bad debt expense 1,000 - - - -
Total Operating Expenses 439,104 505,562 474,090 483,627 476,326
Nonoperating ExpensesInterest on long-term debt 164,650 172,749 164,482 165,509 204,875 Other expenses 4,057 3,315 9,708 722 12,402
Total Nonoperating Expenses 168,707 176,064 174,190 166,231 217,277
Total Expenses 607,811$ 681,626$ 648,280$ 649,858$ 693,603$
(unaudited)
CITY OF HOUSTON, TEXASCOMBINED UTILITY SYSTEM FUND REVENUES AND EXPENSES
Last Ten Fiscal Years(amounts expressed in thousands)
- 242 -
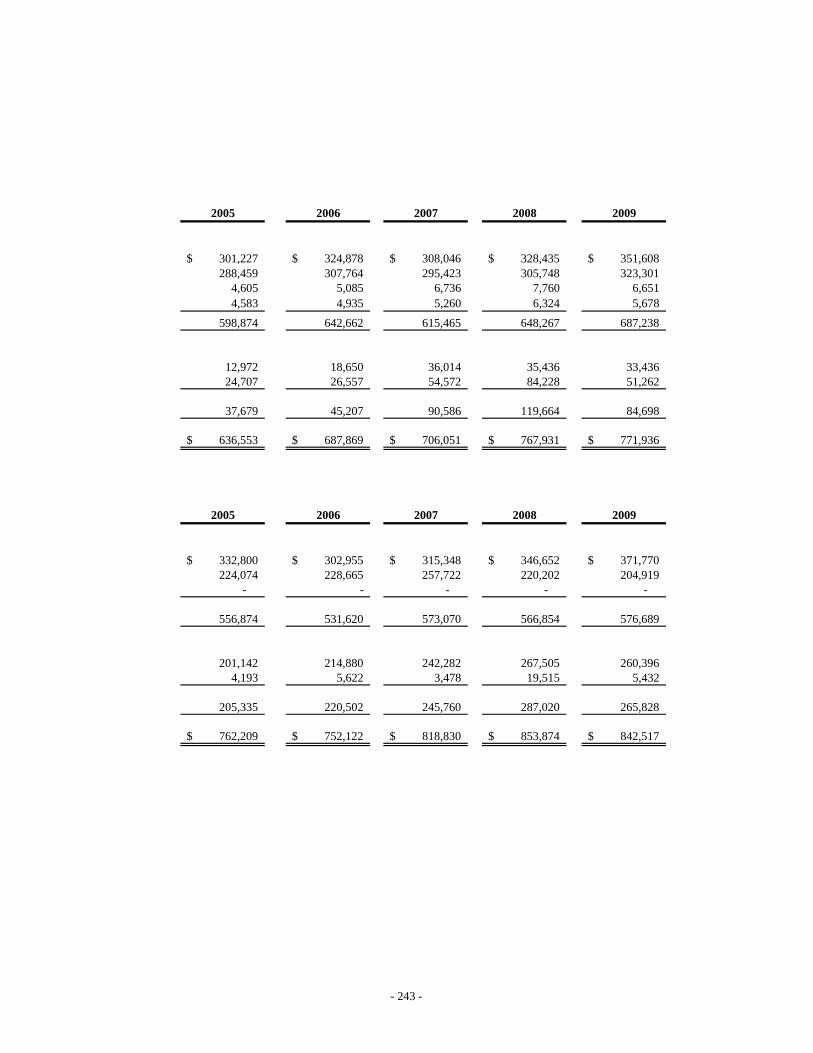
2005 2006 2007 2008 2009
301,227$ 324,878$ 308,046$ 328,435$ 351,608$ 288,459 307,764 295,423 305,748 323,301
4,605 5,085 6,736 7,760 6,6514,583 4,935 5,260 6,324 5,678
598,874 642,662 615,465 648,267 687,238
12,972 18,650 36,014 35,436 33,43624,707 26,557 54,572 84,228 51,262
37,679 45,207 90,586 119,664 84,698
636,553$ 687,869$ 706,051$ 767,931$ 771,936$
2005 2006 2007 2008 2009
332,800$ 302,955$ 315,348$ 346,652$ 371,770$ 224,074 228,665 257,722 220,202 204,919
- - - - -
556,874 531,620 573,070 566,854 576,689
201,142 214,880 242,282 267,505 260,3964,193 5,622 3,478 19,515 5,432
205,335 220,502 245,760 287,020 265,828
762,209$ 752,122$ 818,830$ 853,874$ 842,517$
- 243 -

Fiscal Year Fiscal Year2009 2008
OPERATING REVENUESSales of water, net 351,608$ 328,435$ Sewer system user charges, net 323,301 305,748 Penalties, other services and charges 12,329 14,084 Total Operating Revenues: 687,238 648,267
NON-OPERATING REVENUESInvestment Earnings under Previous Ordinance 16,234 27,417 Investment Earnings under Master Ordinance 6,500 8,019
Non-Operating Revenues: Contributions from Water Authorities 52,815 7,212 Other Non-Operating revenues 28,671 18,625 Total non-operating revenues 104,220 61,273
TOTAL GROSS REVENUES: 791,458 709,540
EXPENSESContract Revenue Bonds Payments (1)
Houston Area Water Corporation debt service - 8 Coastal Water Authority Debt Service 28,103 31,815 Trinity River Authority Debt Service - 444 Total Contract Revenue Bonds Payments 28,103 32,267 Maintenance and Operating Expenses 351,355 347,358
Total Expenses 379,458 379,625
RESTRICTED RECEIPTS UNDER MASTER ORDINANCE 10,001 20,398
NET REVENUES UNDER MASTER ORDINANCE 422,001$ 350,313$
BOND DEBT SERVICE:Previously Issued Bonds 73,624 62,023 First Lien Bonds 217,112 209,327 Total Debt Service 290,736$ 271,350$
BOND DEBT SERVICE COVERAGE:Junior Lien Bond Coverage under Previous Ordinance (2) 5.51 x 5.19 xFirst Lien Bond Coverage under Master Ordinance (3) 1.60 x 1.38 x
TOTAL COVERAGE (4) 1.45 x 1.29 x
(1) These are "Required Payments Under Previous Ordinance."
CITY OF HOUSTON, TEXAS
(2) Coverage of debt service on Previous Ordinance Bonds by Net Revenues as calculated under Previous Ordinance, whichdoes not include as revenues Investment Earnings under Master Ordinance and Restricted Revenues.(3) Coverage of Debt Service on First Lien Bonds by Net Revenues, less debt service on Junior Lien Bonds under PreviousOrdinance. (4) Coverage of total Debt Service on Junior Lien Bonds under Previous Ordinance and First Lien Bonds under MasterOrdinance by Net Revenues.
(unaudited)(amounts expressed in thousands)
COMBINED UTILITY SYSTEM REVENUE BOND COVERAGE
- 244 -
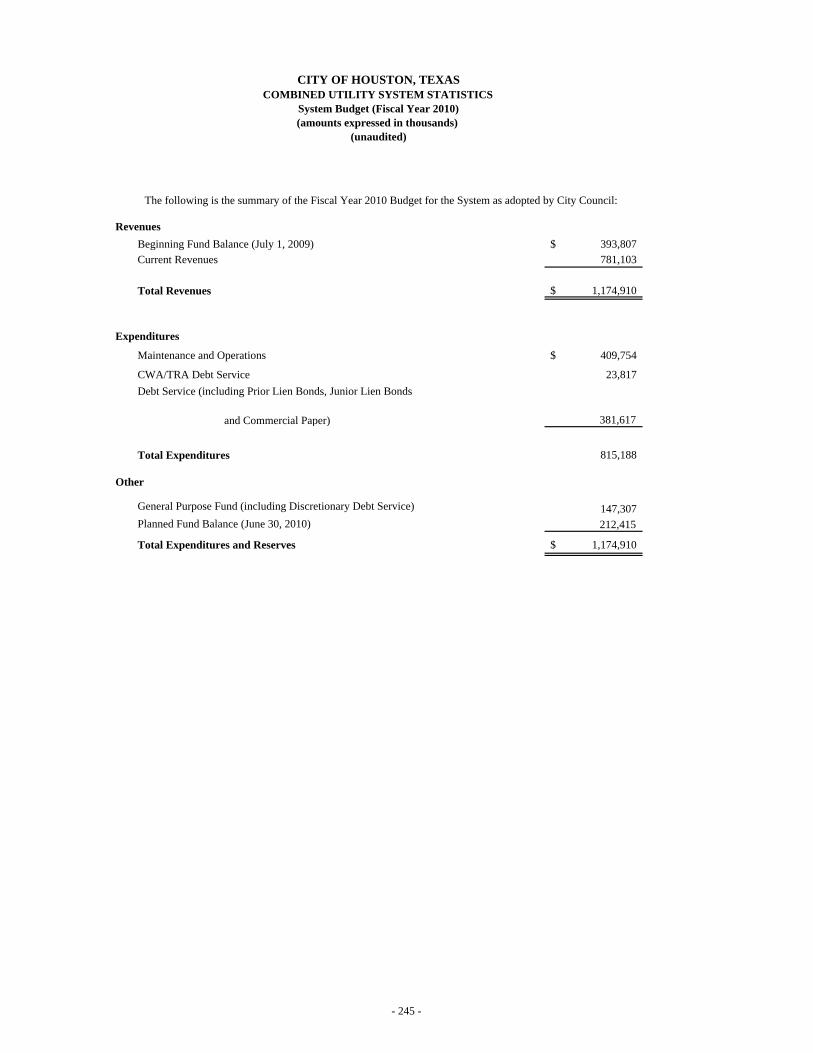
RevenuesBeginning Fund Balance (July 1, 2009) 393,807$ Current Revenues 781,103
Total Revenues 1,174,910$
Expenditures
Maintenance and Operations 409,754$
CWA/TRA Debt Service 23,817 Debt Service (including Prior Lien Bonds, Junior Lien Bonds
and Commercial Paper) 381,617
Total Expenditures 815,188
Other
General Purpose Fund (including Discretionary Debt Service) 147,307 Planned Fund Balance (June 30, 2010) 212,415
Total Expenditures and Reserves 1,174,910$
CITY OF HOUSTON, TEXASCOMBINED UTILITY SYSTEM STATISTICS
(unaudited)
The following is the summary of the Fiscal Year 2010 Budget for the System as adopted by City Council:
System Budget (Fiscal Year 2010)(amounts expressed in thousands)
- 245 -

Maximum Annual Debt Service Requirements on Previous Ordinance Bonds (2019) (1) 139,219,336
Maximum Annual Debt Service Requirements on First Lien Bonds (2032) (1) (2) 375,595,414
Combined Maximum Annual Principal and Interest Requirements on Previous Ordinance 376,348,469
Bonds and First Lien Bonds (2019)Net Revenues under Previous Ordinance for Fiscal Year ended June 30, 2009(3) 405,500,000
Net Revenues under Master Ordinance for Fiscal Year ended June 30, 2009 (4) 422,001,000 Funds Available from General Purpose Fund at June 30, 2009 235,720,000 Total Funds available for Debt Service Coverage 657,721,000
Coverage of Maximum Annual Debt Service Requirements on Previous Ordinance Bonds 2.91 Coverage of Maximum Annual Debt Service Requirements on First Lien Bonds 1.75 Coverage of Maximum Annual Debt Service Requirements on Previous Ordinance Bonds and First Lien Bon 1.75
(1) Expense of the System.
(2)
(3)
(4)
(5)
COMBINED UTILITY SYSTEM STATISTICSCITY OF HOUSTON, TEXAS
Does not include debt service on CWA Bonds, which are payable from Gross Revenues as a Maintenance and Operating
(unaudited)
The following calculation shows coverage by Net Revenues of Maximum Annual Debt Service on the Previous Ordinance and First Lien Bonds.
Series 2004B debt service is adjusted to take into account expected payments under the Series 2004B Qualified Hedge Agreements. The Series2008A variable rate bond debt service is calculated at the fixed payor swap rate of 3.761%. Debt service on the Series 2008D Bonds iscalculated based on an assumed taxable rate with a maturity on the applicable tax-exempt conversion date. After the applicable Tax-ExemptConversion Date, debt service is calculated using a long term tax-exempt rate to maturity.
Excludes Investment Earnings under Master Ordinance and Restricted Receipts under Master Ordinance.
Coverage under Master Ordinance for combined debt service on Previous Ordinance Bonds and First Lien Bonds.
Net Revenues as calculated under the Master Ordinance, which includes as revenues restricted receipts and earnings under the Master Ordinance.
The City has created reinvestment zones and public improvement districts in which infrastructureimprovements, including water and wastewater facilities, will be financed by the respective district or zonethrough bonds supported by assessments within the districts and by a tax increment fund into which will bedeposited the amount of ad valorem taxes collected in the reinvestment zones in excess of the amountcalculated on the basis of the property tax appraisals in effect at the time of creation of the particularreinvestment zone. Under State law, the City can create a public improvement district both within thecorporate limits of the City and within its extraterritorial jurisdiction.
THE SYSTEM - Annexation Program - In - City Districts
The City of Houston Wastewater Operations System receives and processes wastewater generated by residential, commercial, and industrial customers throughout the service area. The service area coversapproximately 625 square miles within the City of Houston and serves a population of about 2.2 millionpeople. The Wastewater System consist of over 7,000 miles sanitary sewer lines, 39 wastewater treatmentplants, over 400 lift/pumping stations and a centralized laboratory. The general condition of the collectionlines varies depending on age, location and type of construction. The average daily wastewater flow throughthe Wastewater Treatment Facilities for Fiscal Year 2009 was 256 mgd. The permitted treatment capacity ofthe wastewater treatment facilities, as reflected by State permits, is 563.1 mgd.
THE SYSTEM - Sewer Facilities General
- 246 -
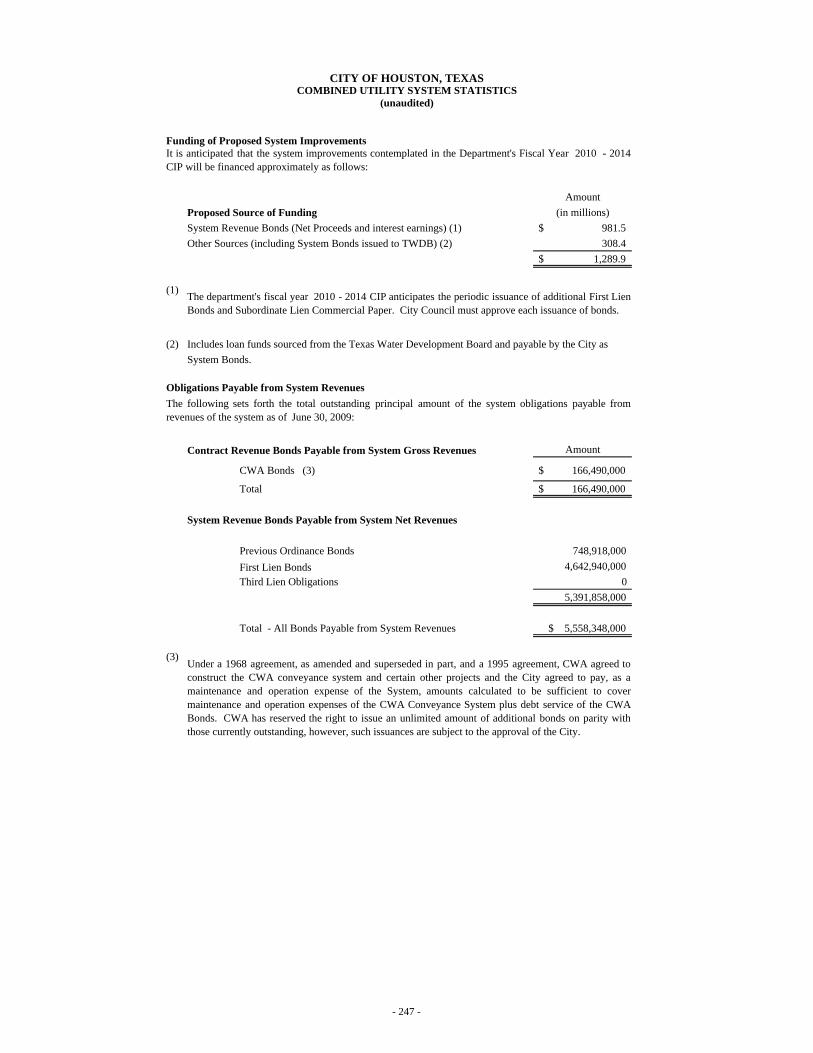
Funding of Proposed System Improvements
AmountProposed Source of Funding (in millions)System Revenue Bonds (Net Proceeds and interest earnings) (1) 981.5$ Other Sources (including System Bonds issued to TWDB) (2) 308.4
1,289.9$
(1)
(2) Includes loan funds sourced from the Texas Water Development Board and payable by the City as System Bonds.
Obligations Payable from System Revenues
Contract Revenue Bonds Payable from System Gross Revenues Amount
CWA Bonds (3) 166,490,000$
Total 166,490,000$
System Revenue Bonds Payable from System Net Revenues
Previous Ordinance Bonds 748,918,000 First Lien Bonds 4,642,940,000 Third Lien Obligations 0
5,391,858,000
Total - All Bonds Payable from System Revenues $ 5,558,348,000
(3)Under a 1968 agreement, as amended and superseded in part, and a 1995 agreement, CWA agreed toconstruct the CWA conveyance system and certain other projects and the City agreed to pay, as amaintenance and operation expense of the System, amounts calculated to be sufficient to covermaintenance and operation expenses of the CWA Conveyance System plus debt service of the CWABonds. CWA has reserved the right to issue an unlimited amount of additional bonds on parity withthose currently outstanding, however, such issuances are subject to the approval of the City.
CITY OF HOUSTON, TEXASCOMBINED UTILITY SYSTEM STATISTICS
It is anticipated that the system improvements contemplated in the Department's Fiscal Year 2010 - 2014 CIP will be financed approximately as follows:
The department's fiscal year 2010 - 2014 CIP anticipates the periodic issuance of additional First LienBonds and Subordinate Lien Commercial Paper. City Council must approve each issuance of bonds.
The following sets forth the total outstanding principal amount of the system obligations payable fromrevenues of the system as of June 30, 2009:
(unaudited)
- 247 -
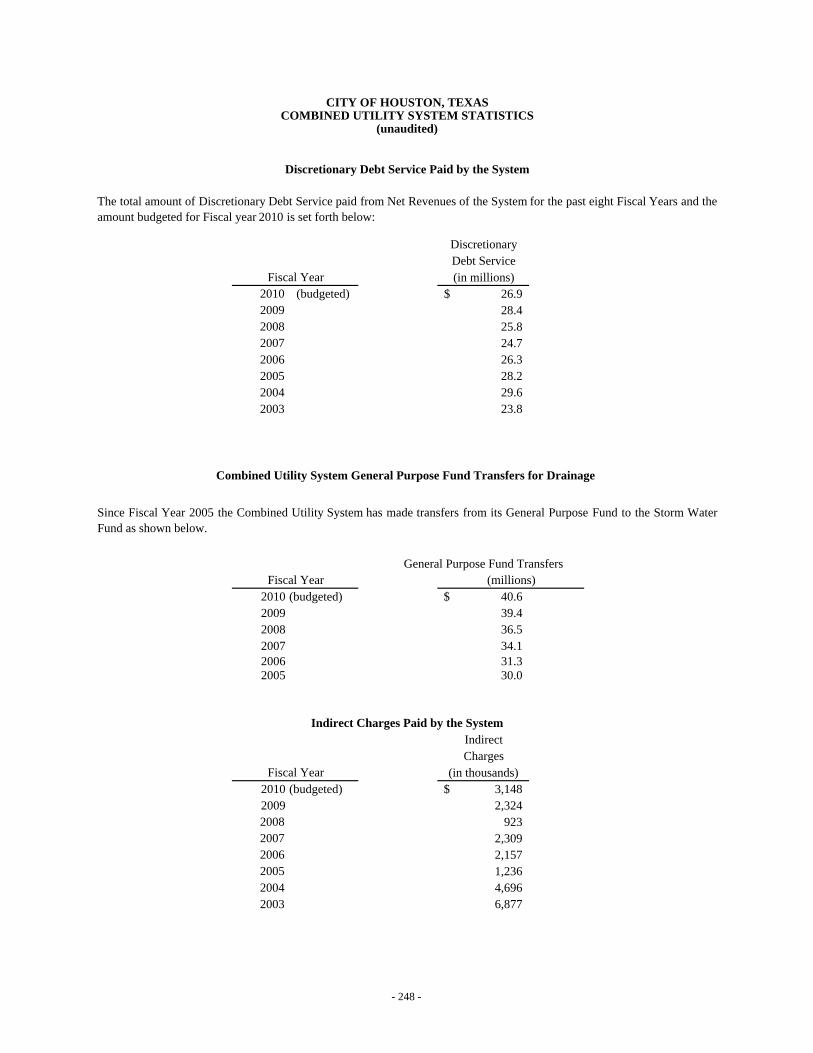
DiscretionaryDebt Service(in millions)
2010 (budgeted) 26.9$ 2009 28.42008 25.82007 24.7 2006 26.32005 28.2 2004 29.6 2003 23.8
Combined Utility System General Purpose Fund Transfers for Drainage
General Purpose Fund Transfers
2010 (budgeted) 40.6$ 2009 39.4 2008 36.5 2007 34.1 2006 31.3 2005 30.0
IndirectCharges
Fiscal Year (in thousands)2010 (budgeted) 3,148$ 2009 2,324 2008 923 2007 2,309 2006 2,1572005 1,236 2004 4,696 2003 6,877
Indirect Charges Paid by the System
Discretionary Debt Service Paid by the System
Since Fiscal Year 2005 the Combined Utility System has made transfers from its General Purpose Fund to the Storm WaterFund as shown below.
Fiscal Year (millions)
The total amount of Discretionary Debt Service paid from Net Revenues of the System for the past eight Fiscal Years and theamount budgeted for Fiscal year 2010 is set forth below:
Fiscal Year
CITY OF HOUSTON, TEXASCOMBINED UTILITY SYSTEM STATISTICS
(unaudited)
- 248 -
CITY OF HOUSTON, TEXAS
This page is left blank intentionally
- 249 -

Fiscal Years 2000 2001 2002 2003 2004
Consumption (in Thousand Gallons)
RESIDENTIAL 30,627,183 29,298,341 28,910,785 28,366,790 27,190,878
MULTI-FAMILY 27,819,799 27,960,411 26,947,985 26,524,889 26,099,414
COMMERCIAL 23,620,493 23,658,719 23,244,380 22,489,563 22,419,672
GOVERNMENT 4,960,288 4,732,531 4,528,732 4,343,339 4,450,481
SEWER ONLY 1,264,859 1,284,586 1,335,488 1,327,138 1,352,960
OTHER ACCTS 4,349,133 4,133,562 4,319,402 4,187,717 4,410,859
TOTAL 92,641,755 91,068,150 89,286,772 87,239,436 85,924,264
Revenue Amount $525,457,257 $518,964,748 $504,300,381 $493,637,833 $482,693,814
Average Rate / Water & Sewer $5.67 $5.70 $5.65 $5.66 $5.62
(unaudited)
CITY OF HOUSTON, TEXASCOMBINED UTILITY SYSTEM STATISTICS
TREATED WATER/RAW WATER & SEWER ONLY(NOT INCLUDING WHOLESALE NOR RAW WATER)
- 250 -
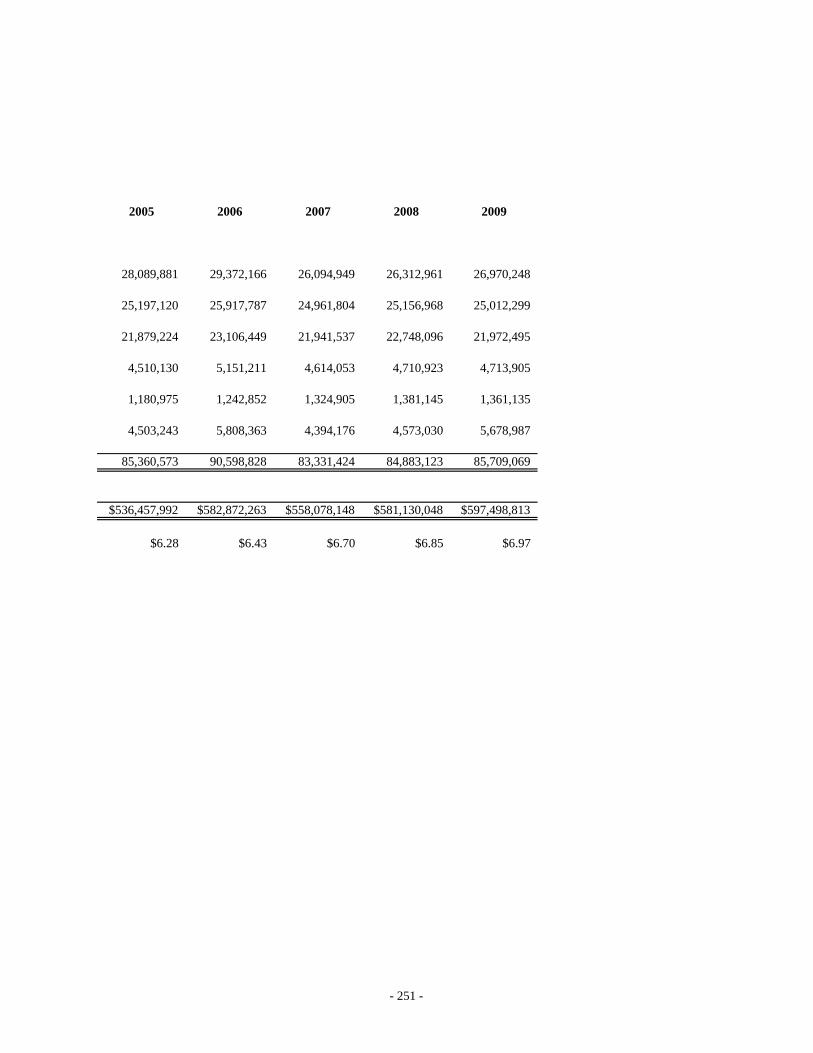
2005 2006 2007 2008 2009
28,089,881 29,372,166 26,094,949 26,312,961 26,970,248
25,197,120 25,917,787 24,961,804 25,156,968 25,012,299
21,879,224 23,106,449 21,941,537 22,748,096 21,972,495
4,510,130 5,151,211 4,614,053 4,710,923 4,713,905
1,180,975 1,242,852 1,324,905 1,381,145 1,361,135
4,503,243 5,808,363 4,394,176 4,573,030 5,678,987
85,360,573 90,598,828 83,331,424 84,883,123 85,709,069
$536,457,992 $582,872,263 $558,078,148 $581,130,048 $597,498,813
$6.28 $6.43 $6.70 $6.85 $6.97
- 251 -

CITY OF HOUSTON, TEXAS
This page is left blank intentionally
- 252 -

CustomerGross
Charges1. Anheuser - Busch, Inc. 5,460,054$ 2. City of Houston 4,204,718 3. Harris County 3,285,049 4. Houston Independent School District 2,611,389 5. Maximus Coffee Group 2,608,120 6. University of Houston 1,833,864 7. Hermann Hospital 1,549,951 8. Methodist Hospital 1,006,291 9. M D Adnerson 940,834
10. Gerald D Hines 855,981 24,356,251$
In recent years, the water and sewer rates have been adjusted on the average as follows:
Average Percent RateDate of Change Water SewerJuly 1988 8.5% 7.6%August 1989 6.0% 7.5%July 1990 5.5% 7.5%February 1992 2.0% 6.0%March 1993 2.5% 4.0%June 2004 9.2% 10.1%April 2005 3.5% 3.5%April 2006 3.6% 3.6%April 2007 2.8% 2.8%April 2008 1.8% 1.8%April 2009 5.1% 5.1%
Water and Sewer Rate Adjustments
CITY OF HOUSTON, TEXASCOMBINED UTILITY SYSTEM STATISTICS
Largest Sewer Customers
The following schedule presents information concerning the ten largest customers of the Sewer Facilities for the twelve monthperiod ended June 30, 2009. The total charges to such customers represent approximately 3.4% of the System Gross Revenuesand 7.8% of Sewer Facilities' gross charges during such period.
(unaudited)
- 253 -
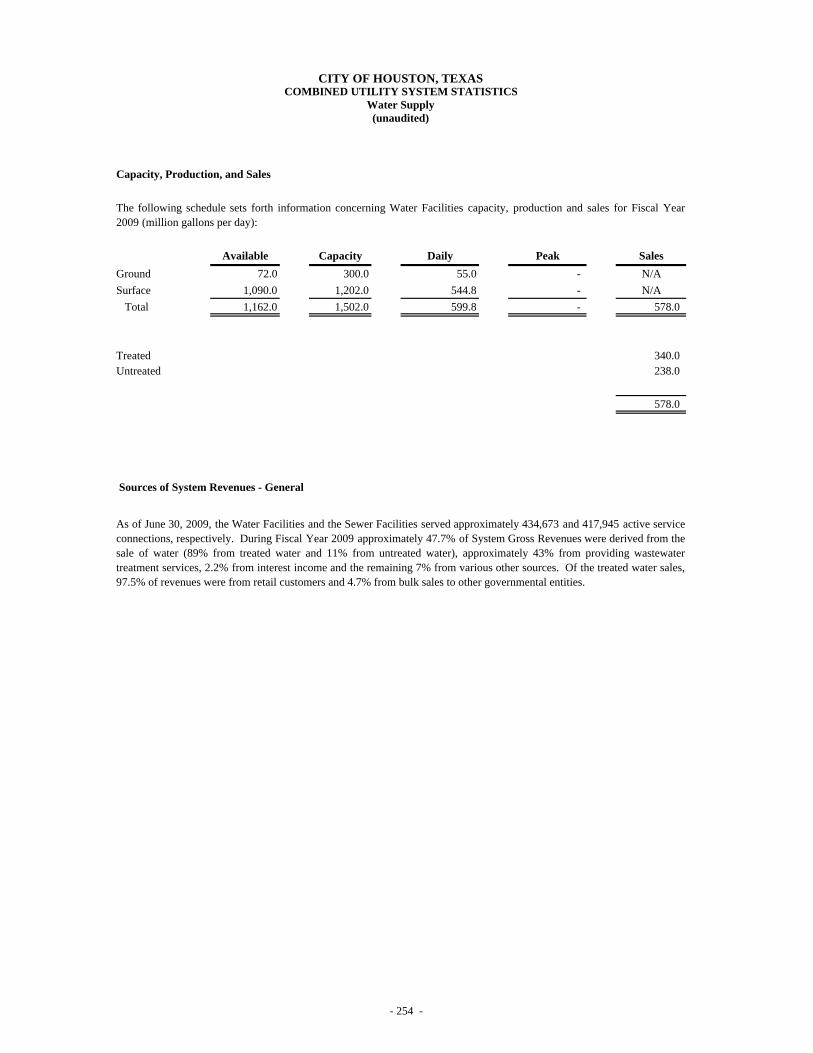
Capacity, Production, and Sales
Available Capacity Daily Peak SalesGround 72.0 300.0 55.0 - N/ASurface 1,090.0 1,202.0 544.8 - N/A Total 1,162.0 1,502.0 599.8 - 578.0
Treated 340.0 Untreated 238.0
578.0
Sources of System Revenues - General
COMBINED UTILITY SYSTEM STATISTICSWater Supply
The following schedule sets forth information concerning Water Facilities capacity, production and sales for Fiscal Year2009 (million gallons per day):
As of June 30, 2009, the Water Facilities and the Sewer Facilities served approximately 434,673 and 417,945 active serviceconnections, respectively. During Fiscal Year 2009 approximately 47.7% of System Gross Revenues were derived from thesale of water (89% from treated water and 11% from untreated water), approximately 43% from providing wastewatertreatment services, 2.2% from interest income and the remaining 7% from various other sources. Of the treated water sales,97.5% of revenues were from retail customers and 4.7% from bulk sales to other governmental entities.
(unaudited)
CITY OF HOUSTON, TEXAS
- 254 -

Largest Treated Water Customers
Customers Charges
1. North Channel Water Authority 5,094,793$ 2. City of Pasadena 4,565,629 3. Anheuser Busch, Inc 3,061,682 4. Harris County 2,686,206 5. City of Pearland 2,575,735 6. Clear Lake City 2,250,316 7. Houston Independent School District 2,111,562 8. West Harris Co. Regional Water Authority. 1,601,712 9. City of Houston 1,585,738
10. Gulf Coast Water Authority (Galveston)* 1,547,591 27,080,964$
Largest Untreated Water Customers
Customers Charges
1. Houston Area Water Corporation 5,772,297$ 2. Equistar Chemicals 4,839,186 3. Shell Oil 3,483,982 4. Battleground Water Company 2,790,496 5. Air Liquide America Corp. 2,500,425 6. Chevron Phillips Chemical Co, 2,182,679 7. Houston Refining, LP (Lyondell -Citgo) 2,072,773 8. Baytown Area Water Authority 1,902,250 9. Hoescht Celanese 1,199,264
10. Occidental Chemical Corporation 1,173,951 27,917,303$
The following schedule presents information concerning the ten largest treated water customers of the System for the twelvemonth period ended June 30, 2009. The total charges to such customers during such period represent approximately 3.7% ofthe System Gross Revenues and 7.8% of total water sales revenues for such period.
The following schedule presents information concerning the ten largest untreated water customers of the System for a twelvemonth period ended June 30, 2009. The total of the contract payments by these ten customers during such period representsapproximately 3.85% of the System Gross Revenues and 8.1% of total water sales revenues for such period.
(unaudited)
CITY OF HOUSTON, TEXASCOMBINED UTILITY SYSTEM STATISTICS
Water Supply
- 255 -

The following schedule sets forth the principal and interest requirements on all outstanding bonds payable from revenueof the System for each of the City's fiscal years ending June 30, based on footnoted assumptions. The followingschedule also does not include Discretionary Debt Service Payments or interest on Commercial Paper Notes issued aThird Lien Obligations under the Master Ordinance.
Fiscal YearEndingJune 30
Previous OrdinanceBonds
First Lien Bonds (2)
Total PayableFrom
System NetRevenues
Total DebtService (1) (2)
2010 23,817,045 82,267,989 262,661,421 344,929,410 368,746,455
2011 21,368,014 87,168,868 259,399,239 346,568,107 367,936,121
2012 20,587,020 107,856,772 243,503,626 351,360,398 371,947,418
2013 19,835,276 107,188,212 256,450,876 363,639,088 383,474,364
2014 19,044,520 77,804,468 292,953,951 370,758,419 389,802,939
2015 18,246,663 89,521,320 284,730,943 374,252,263 392,498,926
2016 18,033,409 89,184,040 286,984,501 376,168,541 394,201,950
2017 7,555,646 80,800,280 295,295,884 376,096,164 383,651,810
2018 6,750,045 52,112,098 323,978,415 376,090,513 382,840,558
2019 6,741,133 139,219,336 237,129,133 376,348,469 383,089,602
2020 6,737,859 56,297,338 320,050,165 376,347,503 383,085,362
2021 6,755,185 43,100,950 333,227,454 376,328,404 383,083,589
2022 6,718,061 36,151,869 340,023,774 376,175,643 382,893,704
2023 6,711,187 33,247,860 342,913,619 376,161,479 382,872,666
2024 6,703,313 34,487,039 341,546,444 376,033,483 382,736,796
2025 6,693,939 33,357,575 342,731,693 376,089,268 382,783,207
2026 7,662,440 18,155,000 357,630,923 375,785,923 383,448,363
2027 3,550,050 30,815,000 343,814,071 374,629,071 378,179,121
2028 3,550,050 30,810,000 344,031,956 374,841,956 378,392,006
2029 3,547,925 44,095,000 330,236,355 374,331,355 377,879,280
2030 3,547,844 374,731,202 374,731,202 378,279,046
2031 3,544,844 374,699,328 374,699,328 378,244,172
2032 3,540,550 375,595,414 375,595,414 379,135,964
2033 3,534,725 374,791,629 374,791,629 378,326,354
2034 3,532,013 375,304,414 375,304,414 378,836,427
2035 3,531,938 183,621,127 183,621,127 187,153,065
2036 183,626,534 183,626,534 183,626,534
2037 160,869,536 160,869,536 160,869,536
2038 74,986,269 74,986,269 74,986,269
2039 69,256,706 69,256,706 69,256,706
Total 241,840,694$ 1,273,641,014$ 8,686,776,602$ 9,960,417,616$ 10,202,258,310
(1) Includes CWA Bonds.(2) Debt service for the 2008D bonds is calculated using current market fixed rates and based on an assumed taxable rate with a maturity on the applicable tax-exempt conversion date. After the applicable Tax-Exempt Conversion Date, debt service is calculated using a long term tax-exempt rate to maturity. Debt sevice for the Series 2004B bonds and Series 2008A bonds is calculated at the respective fixed payor swap rates of 3.778% and 3.761%.
COMBINED UTILITY SYSTEM STATISTICSDebt Service Schedule
Total PayableFrom
System GrossRevenues(1)
(unaudited)
Payable From System Net Revenues
- 256 -
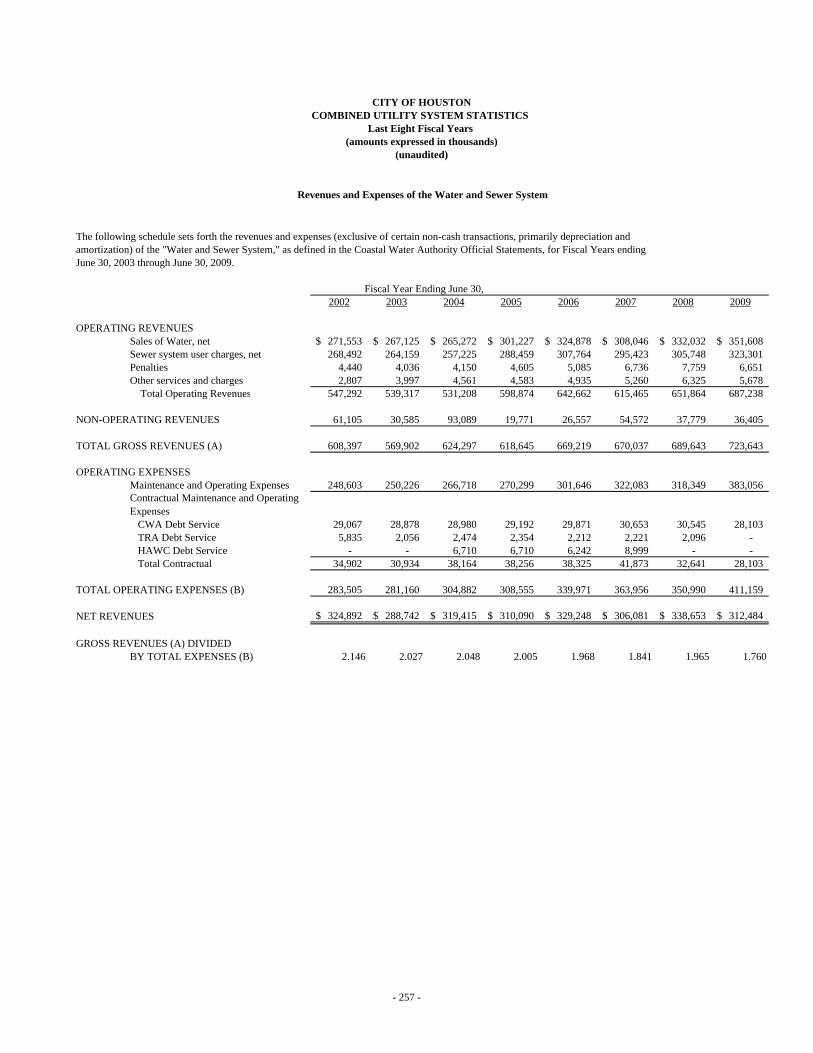
The following schedule sets forth the revenues and expenses (exclusive of certain non-cash transactions, primarily depreciation and amortization) of the "Water and Sewer System," as defined in the Coastal Water Authority Official Statements, for Fiscal Years ending June 30, 2003 through June 30, 2009.
Fiscal Year Ending June 30, 2002 2003 2004 2005 2006 2007 2008 2009
OPERATING REVENUESSales of Water, net 271,553$ 267,125$ 265,272$ 301,227$ 324,878$ 308,046$ 332,032$ 351,608$ Sewer system user charges, net 268,492 264,159 257,225 288,459 307,764 295,423 305,748 323,301 Penalties 4,440 4,036 4,150 4,605 5,085 6,736 7,759 6,651 Other services and charges 2,807 3,997 4,561 4,583 4,935 5,260 6,325 5,678 Total Operating Revenues 547,292 539,317 531,208 598,874 642,662 615,465 651,864 687,238
NON-OPERATING REVENUES 61,105 30,585 93,089 19,771 26,557 54,572 37,779 36,405
TOTAL GROSS REVENUES (A) 608,397 569,902 624,297 618,645 669,219 670,037 689,643 723,643
OPERATING EXPENSESMaintenance and Operating Expenses 248,603 250,226 266,718 270,299 301,646 322,083 318,349 383,056 Contractual Maintenance and Operating Expenses CWA Debt Service 29,067 28,878 28,980 29,192 29,871 30,653 30,545 28,103 TRA Debt Service 5,835 2,056 2,474 2,354 2,212 2,221 2,096 - HAWC Debt Service - - 6,710 6,710 6,242 8,999 - - Total Contractual 34,902 30,934 38,164 38,256 38,325 41,873 32,641 28,103
TOTAL OPERATING EXPENSES (B) 283,505 281,160 304,882 308,555 339,971 363,956 350,990 411,159
NET REVENUES 324,892$ 288,742$ 319,415$ 310,090$ 329,248$ 306,081$ 338,653$ 312,484$
GROSS REVENUES (A) DIVIDEDBY TOTAL EXPENSES (B) 2.146 2.027 2.048 2.005 1.968 1.841 1.965 1.760
(amounts expressed in thousands)(unaudited)
Revenues and Expenses of the Water and Sewer System
CITY OF HOUSTONCOMBINED UTILITY SYSTEM STATISTICS
Last Eight Fiscal Years
- 257 -

Total Annual Revenues Last Ten Fiscal Years 2000 2001 2002 2003 2004
Operating RevenuesLanding area fees 40,930$ 48,298$ 50,826$ 51,162$ 57,011$ Building and ground area fees 72,988 74,168 84,752 91,801 115,777 Parking, concession and other revenues 95,217 99,708 91,877 97,804 97,625
Total Operating Revenues 209,135 222,174 227,455 240,767 270,413
Nonoperating RevenuesInterest income 25,027 66,846 37,629 30,278 5,967 Passenger facility charges - - - - - Other nonoperating revenues 188 828 942 681 203
Total Nonoperating Revenues 25,215 67,674 38,571 30,959 6,170
Total Revenues 234,350$ 289,848$ 266,026$ 271,726$ 276,583$
Total Annual Expenses Last Ten Fiscal Years 2000 2001 2002 2003 2004
Operating ExpensesMaintenance and operating 113,442$ 122,594$ 142,950$ 154,541$ 168,923$ Depreciation 46,390 52,410 60,088 59,987 88,371
Total Operating Expenses 159,832 175,004 203,038 214,528 257,294
Nonoperating ExpensesInterest expense and others 44,354 65,387 44,165 46,538 54,853
Total Nonoperating Expenses 44,354 65,387 44,165 46,538 54,853
Total Expenses 204,186$ 240,391$ 247,203$ 261,066$ 312,147$
(unaudited)
CITY OF HOUSTON, TEXASAIRPORT SYSTEM FUND REVENUES AND EXPENSES
Last Ten Fiscal Years(amounts expressed in thousands)
- 258 -
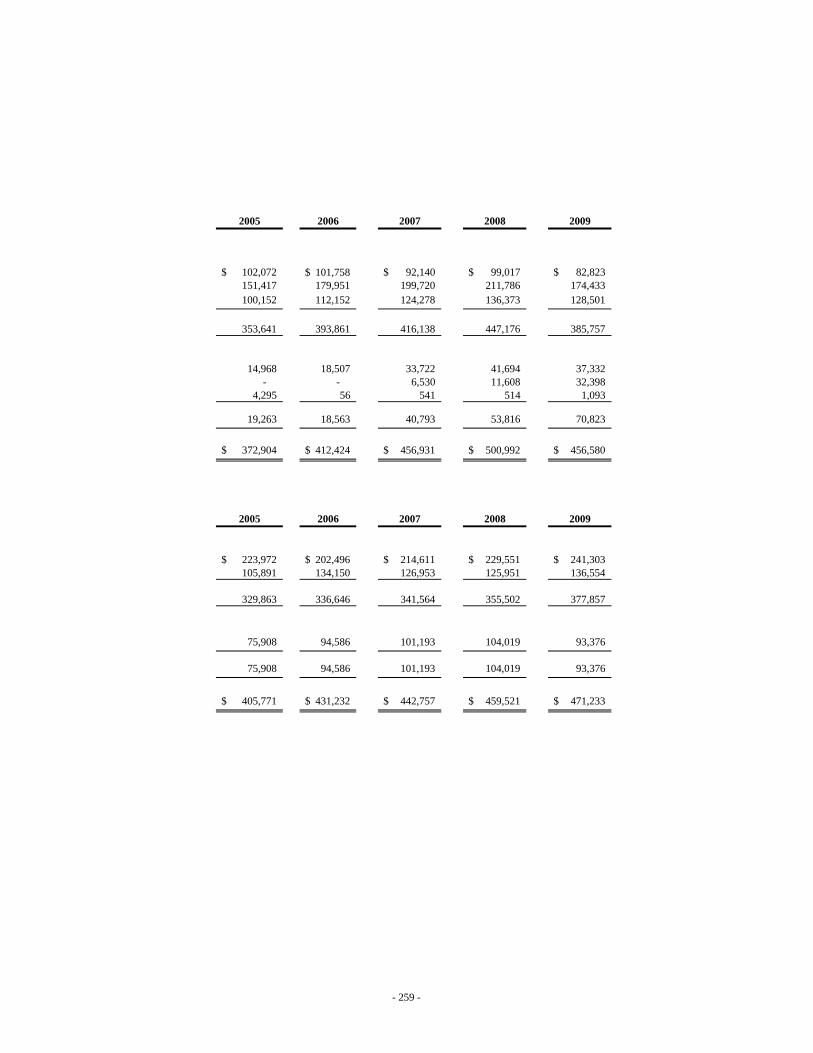
2005 2006 2007 2008 2009
102,072$ 101,758$ 92,140$ 99,017$ 82,823$ 151,417 179,951 199,720 211,786 174,433 100,152 112,152 124,278 136,373 128,501
353,641 393,861 416,138 447,176 385,757
14,968 18,507 33,722 41,694 37,332 - - 6,530 11,608 32,398
4,295 56 541 514 1,093
19,263 18,563 40,793 53,816 70,823
372,904$ 412,424$ 456,931$ 500,992$ 456,580$
2005 2006 2007 2008 2009
223,972$ 202,496$ 214,611$ 229,551$ 241,303$ 105,891 134,150 126,953 125,951 136,554
329,863 336,646 341,564 355,502 377,857
75,908 94,586 101,193 104,019 93,376
75,908 94,586 101,193 104,019 93,376
405,771$ 431,232$ 442,757$ 459,521$ 471,233$
- 259 -

AIRPORT SYSTEM STATISTICS
Domestic PassengersIntercontinental Hobby Ellington Airport
Enplanements Enplanements EnplanementsFiscal & Percentage & Percentage & PercentageYear Deplanements Change Deplanements Change Deplanements Change
(in thousands) (in thousands) (in thousands)
2000 28,892 5.9% 9,053 2.9% 89 -11.0%
2001 30,105 4.2% 9,038 -0.2% 64 -28.1%
2002 28,168 -6.4% 8,192 -9.4% 68 6.3%
2003 27,931 -0.8% 7,796 -4.8% 81 19.1%
2004 29,473 5.5% 8,089 3.8% 80 -1.2%
2005 31,609 7.2% 8,247 2.0% 14 -82.5%
2006 34,103 7.9% 8,423 2.1% - -100.0%
2007 35,260 3.4% 8,642 2.6% - -
2008 35,201 -0.2% 9,097 5.3% - -
2009 31,995 -9.1% 8,286 -8.9% - -
Passenger Statistics(unaudited)
CITY OF HOUSTON, TEXAS
- 260 -
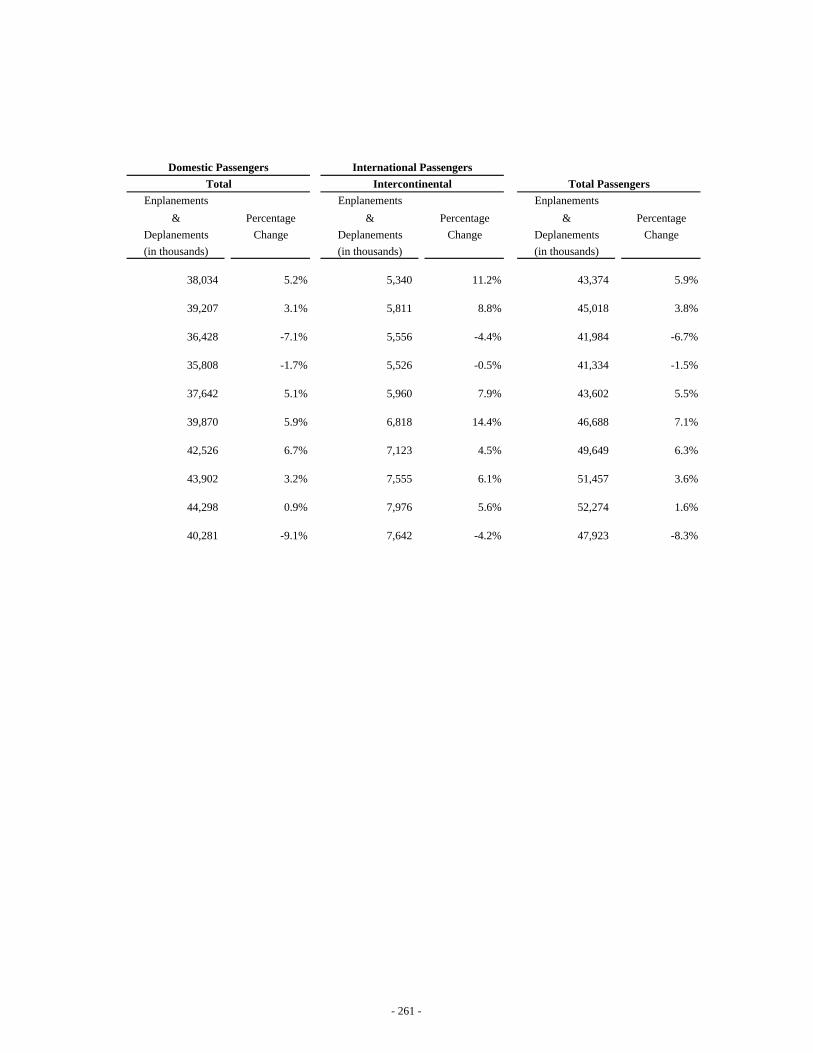
Domestic Passengers International PassengersTotal Intercontinental Total Passengers
Enplanements Enplanements Enplanements& Percentage & Percentage & Percentage
Deplanements Change Deplanements Change Deplanements Change(in thousands) (in thousands) (in thousands)
38,034 5.2% 5,340 11.2% 43,374 5.9%
39,207 3.1% 5,811 8.8% 45,018 3.8%
36,428 -7.1% 5,556 -4.4% 41,984 -6.7%
35,808 -1.7% 5,526 -0.5% 41,334 -1.5%
37,642 5.1% 5,960 7.9% 43,602 5.5%
39,870 5.9% 6,818 14.4% 46,688 7.1%
42,526 6.7% 7,123 4.5% 49,649 6.3%
43,902 3.2% 7,555 6.1% 51,457 3.6%
44,298 0.9% 7,976 5.6% 52,274 1.6%
40,281 -9.1% 7,642 -4.2% 47,923 -8.3%
- 261 -
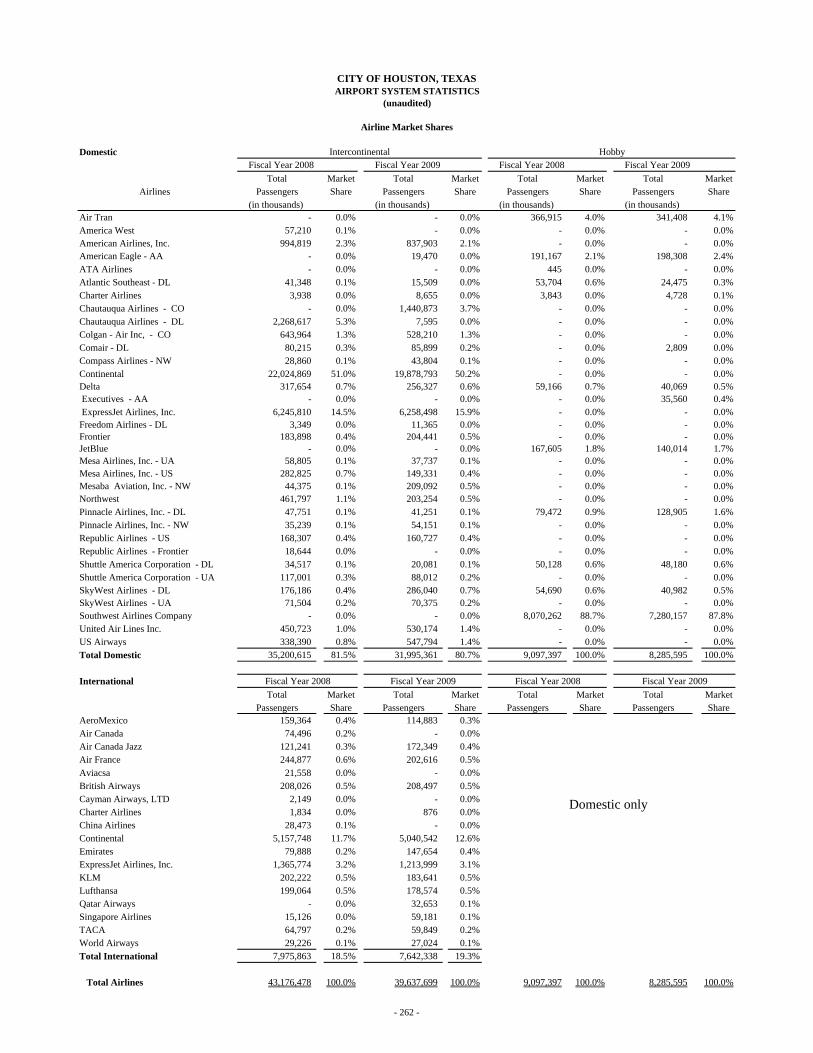
Domestic Intercontinental Hobby Fiscal Year 2008 Fiscal Year 2009 Fiscal Year 2008 Fiscal Year 2009
Total Market Total Market Total Market Total MarketAirlines Passengers Share Passengers Share Passengers Share Passengers Share
(in thousands) (in thousands) (in thousands) (in thousands) Air Tran - 0.0% - 0.0% 366,915 4.0% 341,408 4.1%America West 57,210 0.1% - 0.0% - 0.0% - 0.0%American Airlines, Inc. 994,819 2.3% 837,903 2.1% - 0.0% - 0.0%American Eagle - AA - 0.0% 19,470 0.0% 191,167 2.1% 198,308 2.4%ATA Airlines - 0.0% - 0.0% 445 0.0% - 0.0%Atlantic Southeast - DL 41,348 0.1% 15,509 0.0% 53,704 0.6% 24,475 0.3%Charter Airlines 3,938 0.0% 8,655 0.0% 3,843 0.0% 4,728 0.1%Chautauqua Airlines - CO - 0.0% 1,440,873 3.7% - 0.0% - 0.0%Chautauqua Airlines - DL 2,268,617 5.3% 7,595 0.0% - 0.0% - 0.0%Colgan - Air Inc, - CO 643,964 1.3% 528,210 1.3% - 0.0% - 0.0%Comair - DL 80,215 0.3% 85,899 0.2% - 0.0% 2,809 0.0%Compass Airlines - NW 28,860 0.1% 43,804 0.1% - 0.0% - 0.0%Continental 22,024,869 51.0% 19,878,793 50.2% - 0.0% - 0.0%Delta 317,654 0.7% 256,327 0.6% 59,166 0.7% 40,069 0.5% Executives - AA - 0.0% - 0.0% - 0.0% 35,560 0.4% ExpressJet Airlines, Inc. 6,245,810 14.5% 6,258,498 15.9% - 0.0% - 0.0%Freedom Airlines - DL 3,349 0.0% 11,365 0.0% - 0.0% - 0.0%Frontier 183,898 0.4% 204,441 0.5% - 0.0% - 0.0%JetBlue - 0.0% - 0.0% 167,605 1.8% 140,014 1.7%Mesa Airlines, Inc. - UA 58,805 0.1% 37,737 0.1% - 0.0% - 0.0%Mesa Airlines, Inc. - US 282,825 0.7% 149,331 0.4% - 0.0% - 0.0%Mesaba Aviation, Inc. - NW 44,375 0.1% 209,092 0.5% - 0.0% - 0.0%Northwest 461,797 1.1% 203,254 0.5% - 0.0% - 0.0%Pinnacle Airlines, Inc. - DL 47,751 0.1% 41,251 0.1% 79,472 0.9% 128,905 1.6%Pinnacle Airlines, Inc. - NW 35,239 0.1% 54,151 0.1% - 0.0% - 0.0%Republic Airlines - US 168,307 0.4% 160,727 0.4% - 0.0% - 0.0%Republic Airlines - Frontier 18,644 0.0% - 0.0% - 0.0% - 0.0%Shuttle America Corporation - DL 34,517 0.1% 20,081 0.1% 50,128 0.6% 48,180 0.6%Shuttle America Corporation - UA 117,001 0.3% 88,012 0.2% - 0.0% - 0.0%SkyWest Airlines - DL 176,186 0.4% 286,040 0.7% 54,690 0.6% 40,982 0.5%SkyWest Airlines - UA 71,504 0.2% 70,375 0.2% - 0.0% - 0.0%Southwest Airlines Company - 0.0% - 0.0% 8,070,262 88.7% 7,280,157 87.8%United Air Lines Inc. 450,723 1.0% 530,174 1.4% - 0.0% - 0.0%US Airways 338,390 0.8% 547,794 1.4% - 0.0% - 0.0%Total Domestic 35,200,615 81.5% 31,995,361 80.7% 9,097,397 100.0% 8,285,595 100.0%
International Fiscal Year 2008 Fiscal Year 2009 Fiscal Year 2008 Fiscal Year 2009Total Market Total Market Total Market Total Market
Passengers Share Passengers Share Passengers Share Passengers ShareAeroMexico 159,364 0.4% 114,883 0.3%Air Canada 74,496 0.2% - 0.0%Air Canada Jazz 121,241 0.3% 172,349 0.4%Air France 244,877 0.6% 202,616 0.5%Aviacsa 21,558 0.0% - 0.0%British Airways 208,026 0.5% 208,497 0.5%Cayman Airways, LTD 2,149 0.0% - 0.0%Charter Airlines 1,834 0.0% 876 0.0%China Airlines 28,473 0.1% - 0.0%Continental 5,157,748 11.7% 5,040,542 12.6%Emirates 79,888 0.2% 147,654 0.4%ExpressJet Airlines, Inc. 1,365,774 3.2% 1,213,999 3.1%KLM 202,222 0.5% 183,641 0.5%Lufthansa 199,064 0.5% 178,574 0.5%Qatar Airways - 0.0% 32,653 0.1%Singapore Airlines 15,126 0.0% 59,181 0.1%TACA 64,797 0.2% 59,849 0.2%World Airways 29,226 0.1% 27,024 0.1%Total International 7,975,863 18.5% 7,642,338 19.3%
Total Airlines 43,176,478 100.0% 39,637,699 100.0% 9,097,397 100.0% 8,285,595 100.0%
(unaudited)
CITY OF HOUSTON, TEXASAIRPORT SYSTEM STATISTICS
Airline Market Shares
Domestic only
- 262 -
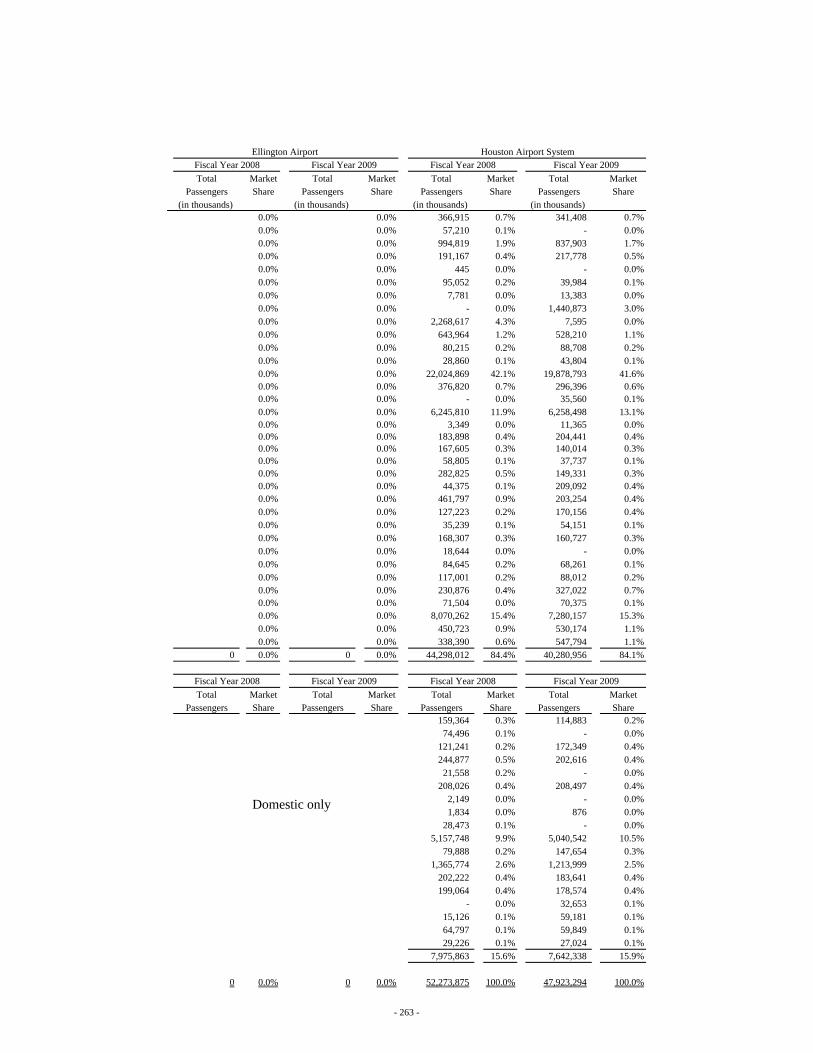
Ellington Airport Houston Airport SystemFiscal Year 2008 Fiscal Year 2009 Fiscal Year 2008 Fiscal Year 2009Total Market Total Market Total Market Total Market
Passengers Share Passengers Share Passengers Share Passengers Share(in thousands) (in thousands) (in thousands) (in thousands)
0.0% 0.0% 366,915 0.7% 341,408 0.7%0.0% 0.0% 57,210 0.1% - 0.0%0.0% 0.0% 994,819 1.9% 837,903 1.7%0.0% 0.0% 191,167 0.4% 217,778 0.5%0.0% 0.0% 445 0.0% - 0.0%0.0% 0.0% 95,052 0.2% 39,984 0.1%0.0% 0.0% 7,781 0.0% 13,383 0.0%0.0% 0.0% - 0.0% 1,440,873 3.0%0.0% 0.0% 2,268,617 4.3% 7,595 0.0%0.0% 0.0% 643,964 1.2% 528,210 1.1%0.0% 0.0% 80,215 0.2% 88,708 0.2%0.0% 0.0% 28,860 0.1% 43,804 0.1%0.0% 0.0% 22,024,869 42.1% 19,878,793 41.6%0.0% 0.0% 376,820 0.7% 296,396 0.6%0.0% 0.0% - 0.0% 35,560 0.1%0.0% 0.0% 6,245,810 11.9% 6,258,498 13.1%0.0% 0.0% 3,349 0.0% 11,365 0.0%0.0% 0.0% 183,898 0.4% 204,441 0.4%0.0% 0.0% 167,605 0.3% 140,014 0.3%0.0% 0.0% 58,805 0.1% 37,737 0.1%0.0% 0.0% 282,825 0.5% 149,331 0.3%0.0% 0.0% 44,375 0.1% 209,092 0.4%0.0% 0.0% 461,797 0.9% 203,254 0.4%0.0% 0.0% 127,223 0.2% 170,156 0.4%0.0% 0.0% 35,239 0.1% 54,151 0.1%0.0% 0.0% 168,307 0.3% 160,727 0.3%0.0% 0.0% 18,644 0.0% - 0.0%0.0% 0.0% 84,645 0.2% 68,261 0.1%0.0% 0.0% 117,001 0.2% 88,012 0.2%0.0% 0.0% 230,876 0.4% 327,022 0.7%0.0% 0.0% 71,504 0.0% 70,375 0.1%0.0% 0.0% 8,070,262 15.4% 7,280,157 15.3%0.0% 0.0% 450,723 0.9% 530,174 1.1%0.0% 0.0% 338,390 0.6% 547,794 1.1%
0 0.0% 0 0.0% 44,298,012 84.4% 40,280,956 84.1%
Fiscal Year 2008 Fiscal Year 2009 Fiscal Year 2008 Fiscal Year 2009Total Market Total Market Total Market Total Market
Passengers Share Passengers Share Passengers Share Passengers Share159,364 0.3% 114,883 0.2%
74,496 0.1% - 0.0%121,241 0.2% 172,349 0.4%244,877 0.5% 202,616 0.4%
21,558 0.2% - 0.0%208,026 0.4% 208,497 0.4%
2,149 0.0% - 0.0%1,834 0.0% 876 0.0%
28,473 0.1% - 0.0%5,157,748 9.9% 5,040,542 10.5%
79,888 0.2% 147,654 0.3%1,365,774 2.6% 1,213,999 2.5%
202,222 0.4% 183,641 0.4%199,064 0.4% 178,574 0.4%
- 0.0% 32,653 0.1%15,126 0.1% 59,181 0.1%64,797 0.1% 59,849 0.1%29,226 0.1% 27,024 0.1%
7,975,863 15.6% 7,642,338 15.9%
0 0.0% 0 0.0% 52,273,875 100.0% 47,923,294 100.0%
Domestic only
- 263 -

2000 2001 2002 2003 2004Operating Revenues Landing Area Fees: Landing Fees 39,116$ 46,735$ 49,424$ 49,211$ 53,906$ Carrier Incentive Pr - - - - - Aviation Fuel 1,259 895 838 910 1,112 Aircraft Parking 555 668 564 1,041 1,993 Subtotal 40,930 48,298 50,826 51,162 57,011
Building and Ground Area Revenues: Building Space - - - - - Terminal Space 62,738 63,172 73,116 79,547 101,040 Cargo Building 2,077 1,923 1,863 1,638 982 Other Rental 2,036 2,078 2,262 2,192 3,065 Hangar Rental 1,251 1,605 1,902 2,499 2,499 Ground Rental 4,886 5,388 5,607 5,923 8,189 Concourse Security - 2 2 2 2 Subtotal 72,988 74,168 84,752 91,801 115,777
Parking, Concession and other Revenues: Terminal Concessions 25,262 23,721 22,444 25,355 22,563 Auto Parking 46,662 51,285 46,955 50,103 51,437 Auto Rental 18,326 18,787 16,886 15,978 16,800 Ground Transportation 2,549 4,535 3,274 3,834 3,737 Special Events - - - - - Vending Machine - - - - - Other Operating Income 2,418 1,380 2,318 2,534 3,088 Subtotal 95,217 99,708 91,877 97,804 97,625
Total Operating Revenues 209,135$ 222,174$ 227,455$ 240,767$ 270,413$
Nonoperating Revenues Interest on Investments 9,677 12,396 12,816 10,650 8,406 Other 99 680 4,520 504 114 Subtotal 9,776 13,076 17,336 11,154 8,520
Total Gross Revenues 218,911$ 235,250$ 244,791$ 251,921$ 278,933$
Operation and Maintenance Expenses Personnel and Other Current Expenses 113,042$ 122,542$ 142,877$ 153,173$ 161,204$ Bad Debt Expense 400 52 73 1,368 441
Total Operating and Maintenance Expenses 113,442$ 122,594$ 142,950$ 154,541$ 161,645$
Net Revenue 105,469$ 112,656$ 101,841$ 97,380$ 117,288$
Total Debt Service 38,455$ 50,027$ 51,611$ 63,988$ 75,797$ Less: grant revenue available for debt service - (2,798) (37,153) (30,282) (32,823)
Debt Service Requirement (per Bond Ordinance) 38,455$ 47,229$ 14,458$ 33,706$ 42,974$
Coverage of debt Service x 2.74 x 2.39 x 7.04 x 2.89 x 2.73
For the year ended June 30, 2009(amounts expressed in thousands)
(unaudited)
CITY OF HOUSTON, TEXASAIRPORT SYSTEM STATISTICS
Selected Financial InformationOperating Fund Only
- 264 -

2005 2006 2007 2008 2009
99,197$ 98,385$ 88,933$ 95,730$ 81,596$ - - - - (1,177)
1,400 1,559 1,540 1,522 1,3131,475 1,814 1,667 1,765 1,091
102,072 101,758 92,140 99,017 82,823
- 3,741 5,037 5,054 5,017136,074 162,491 182,113 193,375 155,396
893 1,553 2,011 2,469 2,3743,354 60 - - - 2,077 2,349 3,394 3,473 4,0519,018 9,757 7,165 7,415 7,595
1 - - - - 151,417 179,951 199,720 211,786 174,433
19,823 21,030 26,953 29,435 27,00355,444 62,377 65,453 72,958 66,56518,065 21,438 22,950 24,529 24,3893,954 3,999 4,617 4,806 4,724
- 20 21 19 20- 20 - - -
2,866 3,268 4,284 4,626 5,800100,152 112,152 124,278 136,373 128,501
353,641$ 393,861$ 416,138$ 447,176$ 385,757$
10,498 17,742 26,847 30,064 23,6644,175 (58) 483 182 1,522
14,673 17,684 27,330 30,246 25,186
368,314$ 411,545$ 443,468$ 477,422$ 410,943$
191,093$ 205,565$ 217,720$ 221,309$ 233,158$ - - - - -
191,093$ 205,565$ 217,720$ 221,309$ 233,158$
177,221$ 205,980$ 225,748$ 256,113$ 177,785$
112,248$ 140,513$ 144,495$ 157,619$ 150,741$ (25,506) (46,621) (20,679) (28,022) (51,739)
86,742$ 93,892$ 123,816$ 129,597$ 99,002$
x 2.04 x 2.19 x 1.82 x 1.98 x 1.80
- 265 -

AIRPORT SYSTEM STATISTICSTotal Aircraft Operations and Aircraft Landing Weight
Aircraft Operations Aircraft Landed Weight(in thousands) (in million pounds)
Fiscal Increase Percentage Increase PercentageYear Total (Decrease) Change Total (Decrease) Change
2000 827 31 3.89% 31,495 1,376 4.57%
2001 823 (4) -0.48% 32,083 588 1.87%
2002 790 (33) -4.01% 30,496 (1,587) -4.95%
2003 811 21 2.66% 30,802 306 1.00%
2004 856 45 5.55% 31,444 642 2.08%
2005 887 31 3.62% 32,543 1,099 3.50%
2006 933 46 5.19% 32,808 265 0.81%
2007 983 50 5.36% 33,930 1,122 3.42%
2008 974 (9) -0.92% 34,097 167 0.49%
2009 892 (82) -8.42% 31,907 (2,190) -6.42%
(unaudited)
CITY OF HOUSTON, TEXAS
- 266 -
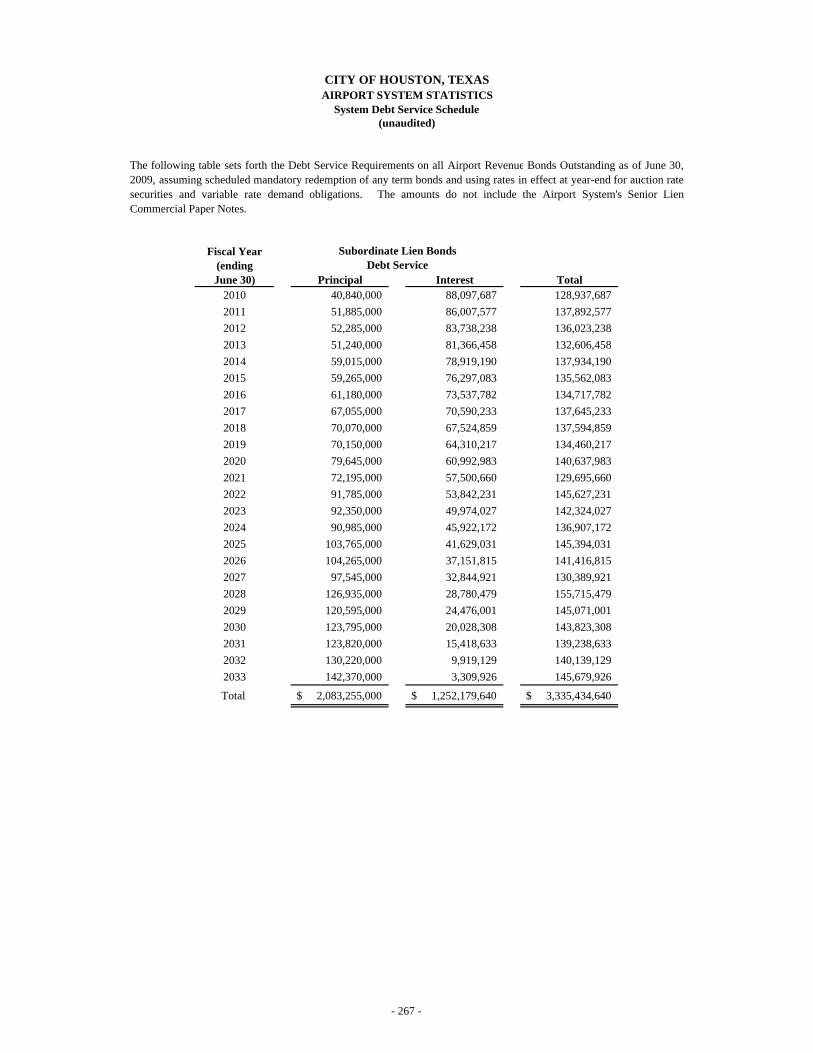
AIRPORT SYSTEM STATISTICSSystem Debt Service Schedule
Fiscal Year(endingJune 30) Principal Interest Total
2010 40,840,000 88,097,687 128,937,6872011 51,885,000 86,007,577 137,892,5772012 52,285,000 83,738,238 136,023,2382013 51,240,000 81,366,458 132,606,4582014 59,015,000 78,919,190 137,934,1902015 59,265,000 76,297,083 135,562,0832016 61,180,000 73,537,782 134,717,7822017 67,055,000 70,590,233 137,645,2332018 70,070,000 67,524,859 137,594,8592019 70,150,000 64,310,217 134,460,2172020 79,645,000 60,992,983 140,637,9832021 72,195,000 57,500,660 129,695,6602022 91,785,000 53,842,231 145,627,2312023 92,350,000 49,974,027 142,324,0272024 90,985,000 45,922,172 136,907,1722025 103,765,000 41,629,031 145,394,0312026 104,265,000 37,151,815 141,416,8152027 97,545,000 32,844,921 130,389,9212028 126,935,000 28,780,479 155,715,4792029 120,595,000 24,476,001 145,071,0012030 123,795,000 20,028,308 143,823,3082031 123,820,000 15,418,633 139,238,6332032 130,220,000 9,919,129 140,139,1292033 142,370,000 3,309,926 145,679,926
Total 2,083,255,000$ 1,252,179,640$ 3,335,434,640$
CITY OF HOUSTON, TEXAS
(unaudited)
Debt ServiceSubordinate Lien Bonds
The following table sets forth the Debt Service Requirements on all Airport Revenue Bonds Outstanding as of June 30,2009, assuming scheduled mandatory redemption of any term bonds and using rates in effect at year-end for auction ratesecurities and variable rate demand obligations. The amounts do not include the Airport System's Senior LienCommercial Paper Notes.
- 267 -

AIRPORT SYSTEM STATISTICSSummary of Certain Fees and Charges
Bush Intercontinental Hobby
Fiscal Year Fiscal Year Fiscal Year Fiscal Year2008 2009 2008 2009
Landing Rates (1) $2.928 $2.948 $2.255 $2.186
Terminal Space Rentals (2) $27.52 - $112.85 $27.06 - $73.04 $86.07 - $91.45 $94.18 - $94.36
Apron (2) $2.443 - $2.889 $2.265 - $2.865 $2.288 $2.202
Parking Rates (maximum per day) Economy $6.00 $6.00 $6.00 $6.00 Structured $15.00 $15.00 $15.00 $15.00 Sure Park $15.00 $15.00 -- --
(1) Per 1,000 pounds for landing weight(2) Range per square foot
(unaudited)
CITY OF HOUSTON, TEXAS
- 268 -
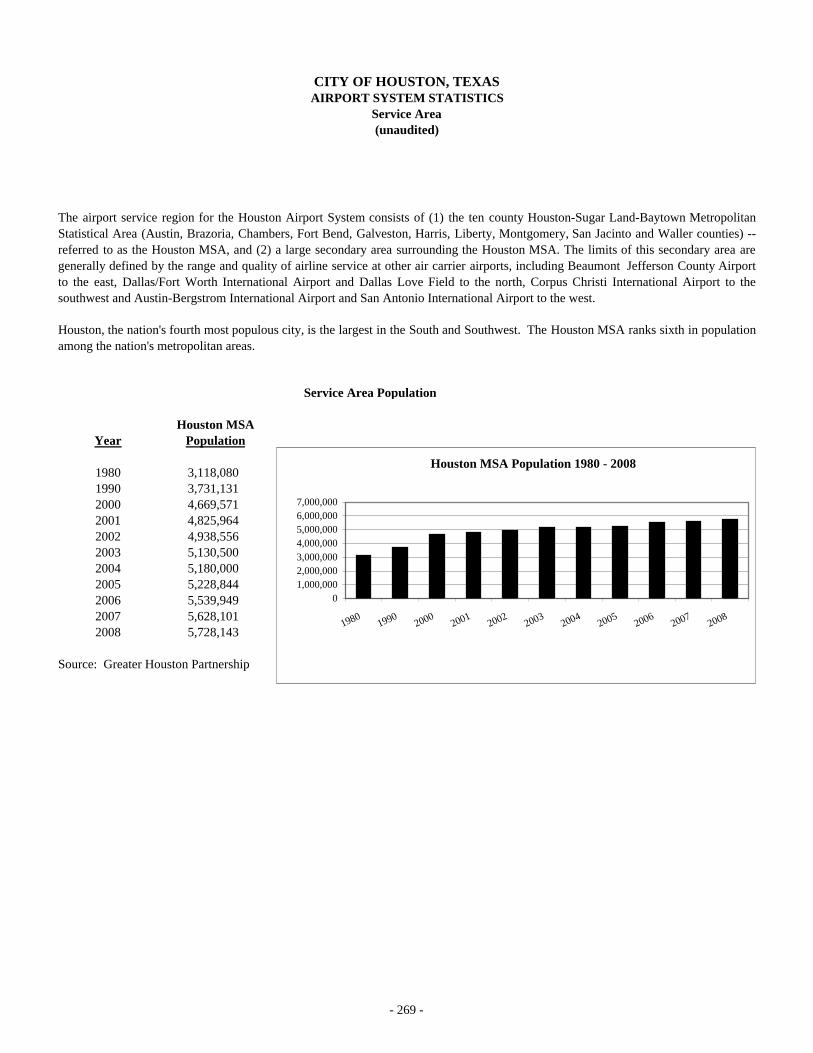
AIRPORT SYSTEM STATISTICSService Area
Service Area Population
Houston MSAYear Population
1980 3,118,0801990 3,731,1312000 4,669,5712001 4,825,9642002 4,938,5562003 5,130,5002004 5,180,0002005 5,228,8442006 5,539,9492007 5,628,1012008 5,728,143
Source: Greater Houston Partnership
The airport service region for the Houston Airport System consists of (1) the ten county Houston-Sugar Land-Baytown MetropolitanStatistical Area (Austin, Brazoria, Chambers, Fort Bend, Galveston, Harris, Liberty, Montgomery, San Jacinto and Waller counties) --referred to as the Houston MSA, and (2) a large secondary area surrounding the Houston MSA. The limits of this secondary area aregenerally defined by the range and quality of airline service at other air carrier airports, including Beaumont Jefferson County Airportto the east, Dallas/Fort Worth International Airport and Dallas Love Field to the north, Corpus Christi International Airport to thesouthwest and Austin-Bergstrom International Airport and San Antonio International Airport to the west.
Houston, the nation's fourth most populous city, is the largest in the South and Southwest. The Houston MSA ranks sixth in populationamong the nation's metropolitan areas.
(unaudited)
CITY OF HOUSTON, TEXAS
Houston MSA Population 1980 - 2008
01,000,0002,000,0003,000,0004,000,0005,000,0006,000,0007,000,000
1980 1990 2000 2001 2002 2003 2004 2005 2006 2007 2008
- 269 -
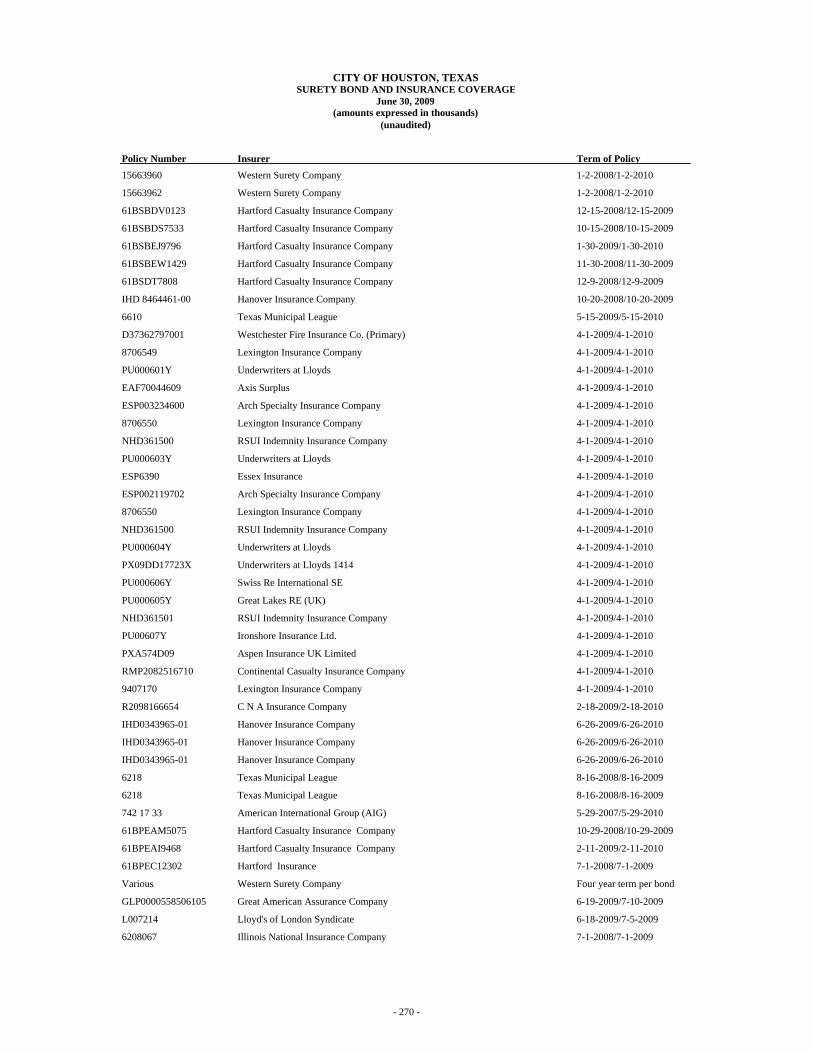
Policy Number Insurer Term of Policy 15663960 Western Surety Company 1-2-2008/1-2-2010
15663962 Western Surety Company 1-2-2008/1-2-2010
61BSBDV0123 Hartford Casualty Insurance Company 12-15-2008/12-15-2009
61BSBDS7533 Hartford Casualty Insurance Company 10-15-2008/10-15-2009
61BSBEJ9796 Hartford Casualty Insurance Company 1-30-2009/1-30-2010
61BSBEW1429 Hartford Casualty Insurance Company 11-30-2008/11-30-2009
61BSDT7808 Hartford Casualty Insurance Company 12-9-2008/12-9-2009
IHD 8464461-00 Hanover Insurance Company 10-20-2008/10-20-2009
6610 Texas Municipal League 5-15-2009/5-15-2010
D37362797001 Westchester Fire Insurance Co. (Primary) 4-1-2009/4-1-2010
8706549 Lexington Insurance Company 4-1-2009/4-1-2010
PU000601Y Underwriters at Lloyds 4-1-2009/4-1-2010
EAF70044609 Axis Surplus 4-1-2009/4-1-2010
ESP003234600 Arch Specialty Insurance Company 4-1-2009/4-1-2010
8706550 Lexington Insurance Company 4-1-2009/4-1-2010
NHD361500 RSUI Indemnity Insurance Company 4-1-2009/4-1-2010
PU000603Y Underwriters at Lloyds 4-1-2009/4-1-2010
ESP6390 Essex Insurance 4-1-2009/4-1-2010
ESP002119702 Arch Specialty Insurance Company 4-1-2009/4-1-2010
8706550 Lexington Insurance Company 4-1-2009/4-1-2010
NHD361500 RSUI Indemnity Insurance Company 4-1-2009/4-1-2010
PU000604Y Underwriters at Lloyds 4-1-2009/4-1-2010
PX09DD17723X Underwriters at Lloyds 1414 4-1-2009/4-1-2010
PU000606Y Swiss Re International SE 4-1-2009/4-1-2010
PU000605Y Great Lakes RE (UK) 4-1-2009/4-1-2010
NHD361501 RSUI Indemnity Insurance Company 4-1-2009/4-1-2010
PU00607Y Ironshore Insurance Ltd. 4-1-2009/4-1-2010
PXA574D09 Aspen Insurance UK Limited 4-1-2009/4-1-2010
RMP2082516710 Continental Casualty Insurance Company 4-1-2009/4-1-2010
9407170 Lexington Insurance Company 4-1-2009/4-1-2010
R2098166654 C N A Insurance Company 2-18-2009/2-18-2010
IHD0343965-01 Hanover Insurance Company 6-26-2009/6-26-2010
IHD0343965-01 Hanover Insurance Company 6-26-2009/6-26-2010
IHD0343965-01 Hanover Insurance Company 6-26-2009/6-26-2010
6218 Texas Municipal League 8-16-2008/8-16-2009
6218 Texas Municipal League 8-16-2008/8-16-2009
742 17 33 American International Group (AIG) 5-29-2007/5-29-2010
61BPEAM5075 Hartford Casualty Insurance Company 10-29-2008/10-29-2009
61BPEAI9468 Hartford Casualty Insurance Company 2-11-2009/2-11-2010
61BPEC12302 Hartford Insurance 7-1-2008/7-1-2009
Various Western Surety Company Four year term per bond
GLP0000558506105 Great American Assurance Company 6-19-2009/7-10-2009
L007214 Lloyd's of London Syndicate 6-18-2009/7-5-2009
6208067 Illinois National Insurance Company 7-1-2008/7-1-2009
(unaudited)
CITY OF HOUSTON, TEXASSURETY BOND AND INSURANCE COVERAGE
June 30, 2009(amounts expressed in thousands)
- 270 -

Amount of Coverage
Property at Risk Type of Coverage (in thousands)Mayor Public Official Bond 50$
City Controller Public Official Bond 50$
City Treasurer Public Official Bond 25$
Deputy Controller Public Official Bond 25$
Municipal Courts Public Official Bond 25$
Tax Collector Public Official Bond 25$
HMEPS (Pension) Treasurer Public Official Bond 250$
Houston Area Library Automated Network (HALAN) Electronic Equipment 1,355$
City of Houston Automobile Catastrophe 1,554$
City of Houston Property Insurance * 5,000$
City of Houston Property Insurance * 20,000$
City of Houston Property Insurance * 8,250$
City of Houston Property Insurance * 6,335$
City of Houston Property Insurance * 2,500$
City of Houston Property Insurance * 6,665$
City of Houston Property Insurance * 1,250$
City of Houston Property Insurance * 24,170$
City of Houston Property Insurance * 5,000$
City of Houston Property Insurance * 5,000$
City of Houston Property Insurance * 13,330$
City of Houston Property Insurance * 2,500$
City of Houston Property Insurance * 8,500$
City of Houston Property Insurance * 5,000$
City of Houston Property Insurance * 7,500$
City of Houston Property Insurance * 5,000$
City of Houston Property Insurance * 5,000$
City of Houston Property Insurance * 10,000$
City of Houston Property Insurance * 5,000$
City of Houston Property Insurance * 4,000$
City of Houston Terrorism Insurance 100,000$
City of Houston Boiler & Machinery 100,000$
City of Houston Library - Business, Electronic Equip. 1,228$
City of Houston Library - Valuable Papers 4,047$
City of Houston Library - Fine Art 4,936$
Houston Housing Finance Corporation, Urban Dwellings Broad Form Property Insurance 158$
Houston Housing Finance Corporation, Urban Dwellings Commercial General Liability 5,000$
City of Houston Public Employee Dishonesty/Crime 2,000$
Parks Board Public Employee Dishonesty 10$
Library Board Public Employee Dishonesty 10$
Houston Read Commission Employee Dishonesty 375$
Various City of Houston Notaries Notary Public Bonds 3$
City of Houston Special Event Commercial General Liability 1,000$
City of Houston Adverse Weather Event Cancellation 887$
Houston Area Water Corporation (HAWC) Directors and Officers Liability 10,000$
* The property insurance is provided by insurance carriers that underwrite varying pro-rata shares of coverage that total
to the policy loss limit.
- 271 -
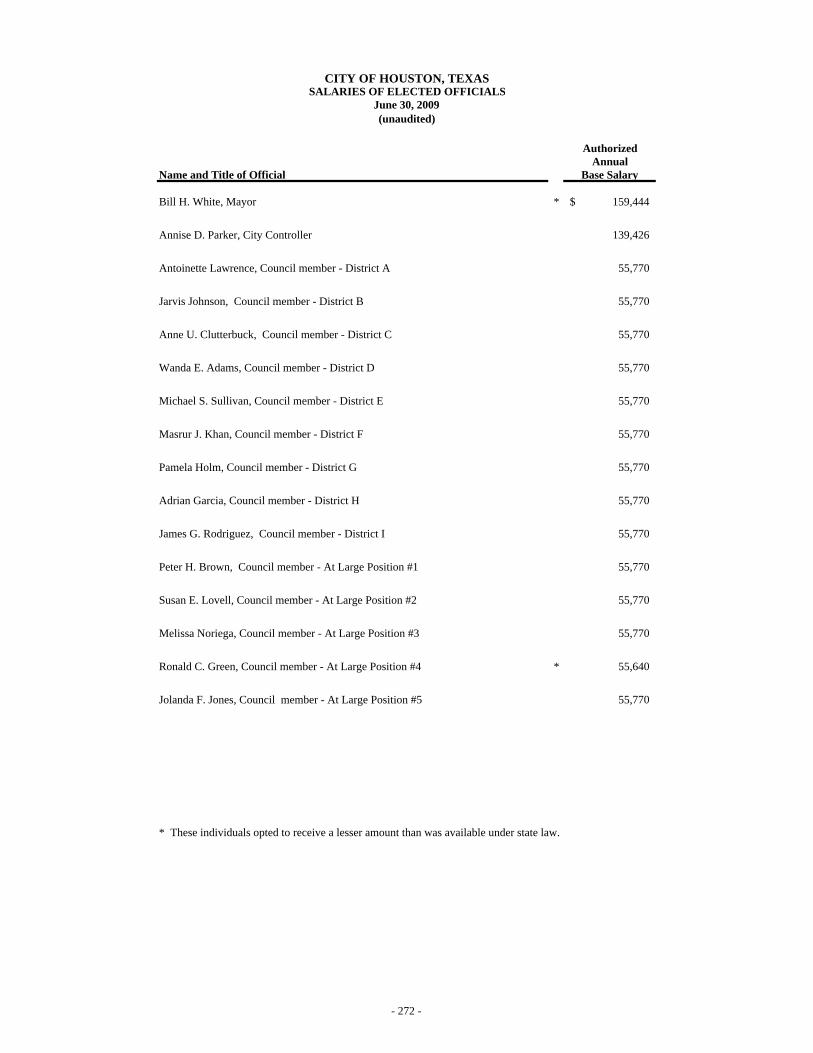
AuthorizedAnnual
Name and Title of Official Base Salary
Bill H. White, Mayor * 159,444$
Annise D. Parker, City Controller 139,426
Antoinette Lawrence, Council member - District A 55,770
Jarvis Johnson, Council member - District B 55,770
Anne U. Clutterbuck, Council member - District C 55,770
Wanda E. Adams, Council member - District D 55,770
Michael S. Sullivan, Council member - District E 55,770
Masrur J. Khan, Council member - District F 55,770
Pamela Holm, Council member - District G 55,770
Adrian Garcia, Council member - District H 55,770
James G. Rodriguez, Council member - District I 55,770
Peter H. Brown, Council member - At Large Position #1 55,770
Susan E. Lovell, Council member - At Large Position #2 55,770
Melissa Noriega, Council member - At Large Position #3 55,770
Ronald C. Green, Council member - At Large Position #4 * 55,640
Jolanda F. Jones, Council member - At Large Position #5 55,770
* These individuals opted to receive a lesser amount than was available under state law.
(unaudited)
CITY OF HOUSTON, TEXASSALARIES OF ELECTED OFFICIALS
June 30, 2009
- 272 -
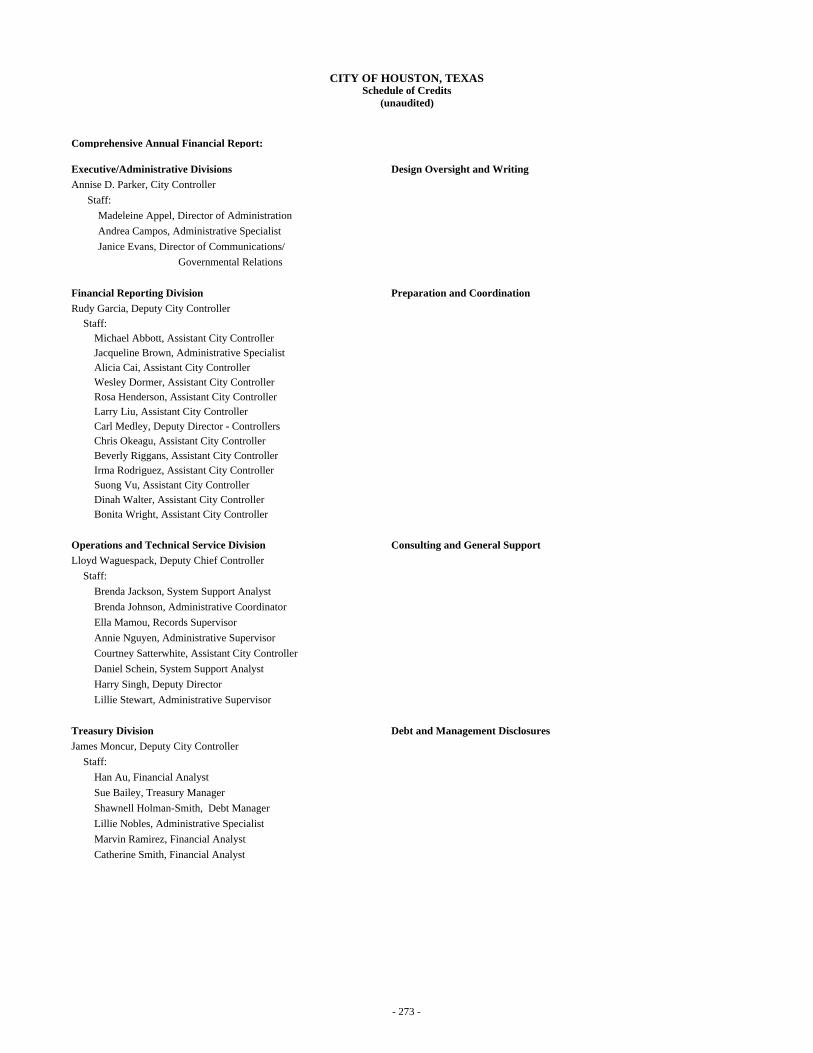
Comprehensive Annual Financial Report:
Executive/Administrative Divisions Design Oversight and Writing Annise D. Parker, City Controller Staff: Madeleine Appel, Director of Administration Andrea Campos, Administrative Specialist Janice Evans, Director of Communications/ Governmental Relations
Financial Reporting Division Preparation and CoordinationRudy Garcia, Deputy City Controller
Staff:Michael Abbott, Assistant City Controller Jacqueline Brown, Administrative Specialist Alicia Cai, Assistant City ControllerWesley Dormer, Assistant City ControllerRosa Henderson, Assistant City ControllerLarry Liu, Assistant City Controller Carl Medley, Deputy Director - Controllers Chris Okeagu, Assistant City ControllerBeverly Riggans, Assistant City ControllerIrma Rodriguez, Assistant City ControllerSuong Vu, Assistant City ControllerDinah Walter, Assistant City ControllerBonita Wright, Assistant City Controller
Operations and Technical Service Division Consulting and General SupportLloyd Waguespack, Deputy Chief Controller
Staff:Brenda Jackson, System Support Analyst Brenda Johnson, Administrative Coordinator Ella Mamou, Records Supervisor Annie Nguyen, Administrative Supervisor Courtney Satterwhite, Assistant City Controller Daniel Schein, System Support Analyst Harry Singh, Deputy Director Lillie Stewart, Administrative Supervisor
Treasury Division Debt and Management Disclosures James Moncur, Deputy City Controller
Staff:Han Au, Financial Analyst Sue Bailey, Treasury ManagerShawnell Holman-Smith, Debt ManagerLillie Nobles, Administrative SpecialistMarvin Ramirez, Financial Analyst Catherine Smith, Financial Analyst
CITY OF HOUSTON, TEXASSchedule of Credits
(unaudited)
- 273 -
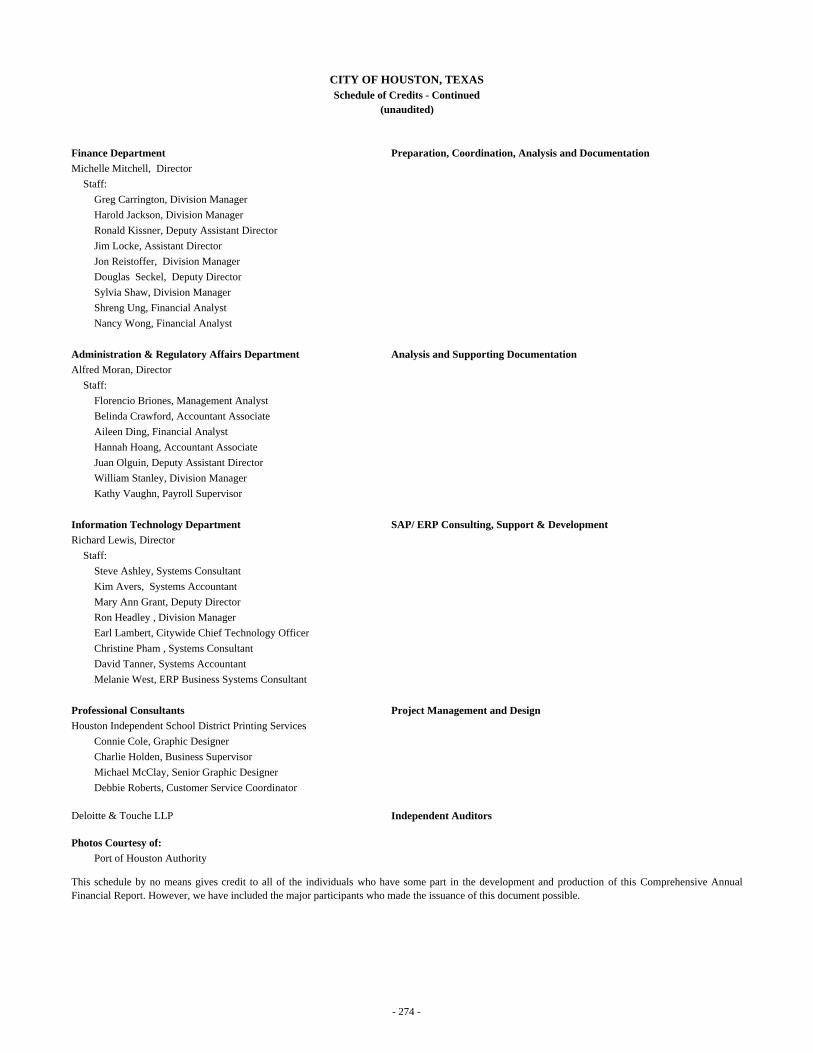
Finance Department Preparation, Coordination, Analysis and Documentation Michelle Mitchell, Director
Staff:Greg Carrington, Division ManagerHarold Jackson, Division ManagerRonald Kissner, Deputy Assistant Director Jim Locke, Assistant Director Jon Reistoffer, Division ManagerDouglas Seckel, Deputy Director Sylvia Shaw, Division ManagerShreng Ung, Financial Analyst Nancy Wong, Financial Analyst
Administration & Regulatory Affairs Department Analysis and Supporting Documentation Alfred Moran, Director
Staff:Florencio Briones, Management Analyst Belinda Crawford, Accountant Associate Aileen Ding, Financial Analyst Hannah Hoang, Accountant Associate Juan Olguin, Deputy Assistant Director William Stanley, Division Manager Kathy Vaughn, Payroll Supervisor
Information Technology Department SAP/ ERP Consulting, Support & Development Richard Lewis, Director
Staff:Steve Ashley, Systems Consultant Kim Avers, Systems Accountant Mary Ann Grant, Deputy Director Ron Headley , Division Manager Earl Lambert, Citywide Chief Technology Officer Christine Pham , Systems Consultant David Tanner, Systems Accountant Melanie West, ERP Business Systems Consultant
Professional Consultants Project Management and Design Houston Independent School District Printing Services
Connie Cole, Graphic Designer Charlie Holden, Business Supervisor Michael McClay, Senior Graphic Designer Debbie Roberts, Customer Service Coordinator
Deloitte & Touche LLP Independent Auditors
Photos Courtesy of:Port of Houston Authority
This schedule by no means gives credit to all of the individuals who have some part in the development and production of this Comprehensive AnnualFinancial Report. However, we have included the major participants who made the issuance of this document possible.
CITY OF HOUSTON, TEXASSchedule of Credits - Continued
(unaudited)
- 274 -
